
 Submit a Paper
 Propose a Special lssue
 Open Access
ARTICLE

Performance Assessment and Configuration Analysis in the Study of SCADA System (Supervisory Control and Data Acquisition)
1 Department of Mathematics, Kalasalingam Academy of Research and Education, Krishnankoil, 626126, India
2 Department of Mathematics, Velammal Institute of Technology, Chennai, 601204, India
3 Department of Electronics and Communication Engineering, Anna University, Madurai, 625019, India
* Corresponding Author: S. Maragathasundari. Email:
Intelligent Automation & Soft Computing 2023, 37(2), 1399-1419. https://doi.org/10.32604/iasc.2023.038506
Received 15 December 2022; Accepted 28 February 2023; Issue published 21 June 2023
 View Full Text
 Download PDF
Abstract
Queuing models are used to assess the functionality and aesthetics of SCADA systems for supervisory control and data collection. Here, the main emphasis is on how the queuing theory can be used in the system’s design and analysis. The analysis’s findings indicate that by using queuing models, cost-performance ratios close to the ideal might be attained. This article discusses a novel methodology for evaluating the service-oriented survivability of SCADA systems. In order to evaluate the state of service performance and the system’s overall resilience, the framework applies queuing theory to an analytical model. As a result, the SCADA process is translated using the MX/G/1 queuing model, and the queueing theory is used to evaluate this design’s strategy. The supplemental variable technique solves the queuing problem that comes with the subsequent results. The queue size, server idle time, utilization, and probabilistic generating factors of the distinct operating strategies are estimated. Notable examples were examined via numerical analysis using mathematical software. Because it is used frequently and uses a statistical demarcation method, this tactic is completely acceptable. The graphical representation of this perspective offers a thorough analysis of the alleged limits.Keywords
1.1 Hydropower Plant SCADA System
The hardware and software components of a supervisory control and data acquisition (SCADA) system are used to track and manage plant, network, and process equipment locally or remotely. It gathers and processes real-time data from these operations, interacts directly with the process machinery via a human-machine interface (HMI), keeps local copies of critical motivating values and events, and then sends that data via concentrators for aggregate and usage analysis centrally. A few applications for SCADA systems include power and water, oil and gas pipelines, food and beverage plants, structured cabling, data centres, and manufacturing facilities.
For compact digital computers in industrial operations, supervisory control and data acquisition (SCADA) is used. The development of computer technology and its versatility over the past few years have significantly decreased the size and cost of computers while simultaneously boosting their performance. Due to the extensive range of current applications, SCADA system designers must make various design decisions.
Industrial control systems, often known as computer systems that regulate and monitor industrial processes, are called SCADA (supervisory control and data acquisition). In long-distance communications networks, a SCADA central controller manages field stations with thorough supervision that includes signal monitoring and status evaluation. SCADA systems based on PCs are connected with PLC-type plant controllers for plant information and control data collection. Several small hydroelectric facilities may be developed, managed, and automated using the method due to its economic viability. Based on information obtained from distant stations, remote station control devices, also known as external devices, can be provided with automated or manual supervisory directives. For evaluating computer system efficiency, various methods have been employed, including assessment, stipulation linear projection, simulation, and analytical queuing models. A SCADA system, however, is geographically spread and intrinsically nonlinear. Implementing simulation and marking requires a lot of time and money. Most operations must contend with a strict timeline and tight resources throughout development and deployment. Analytical queuing models have gained popularity over simulation and benchmarking in the last three to four years. The models capture the most important aspects of the current system, the analysis’s assumptions are frequently expressed in recognizable answers, and the solutions to the equations in the configurations are frequently discovered in highly efficient software.
To improve real-time flow measurement and monitoring in irrigation supply and drainage operations, a current SCADA system ought to be installed. The manager can respond successfully and quickly to changing conditions because of SCADA. The SCADA system is viewed as a workable answer to this issue in this article. By controlling, monitoring, and issuing an appropriate warning for any unfavorable conditions, like raising the water level above the average level or stopping any device, etc., this system makes it feasible to manage water resources. The most common automation technology for water and renewable energy applications worldwide is supervisory control and data acquisition, or SCADA. No matter how local or far, it is ideal for all kinds of clean power and water installations. Over view of the Hydropower plant SCADA system is given in Fig. 1.

Figure 1: Hydropower plant SCADA system
The process carried out in the hydropower plant SCADA system is elaborated below in terms of queuing parameters, viz., customers, servers, services, mandatory vacation (maintenance work), feedback services, and setup time stage
(a) Customers: Impulse-based and Reaction-based-Impulse-based turbines include Pelton and cross-flow turbines. Reaction-based turbines include three subtypes: France’s turbine, propeller turbine (bulb turbine, Streamflow turbine, Kaplan turbine types), and kinetic turbine. This process is clearly given below in Fig. 2.

Figure 2: Impulse and reaction based on hydropower
(b) Services: 1. Excitation; 2. Monitoring and Diagnosis; 3. Control and instrumentation.
1.2 Excitation–Releasing Power
Whether the generator is stationary or undergoing transient events, the terminal voltage of a sequential generator must always be constant. There are layered regulators accessible to regulate power factors and active power output. Limiter mechanisms ensure that the synchronous machine never operates outside of its permitted working range. It is also possible to enable various stabiliser features to improve grid and device stability. Independent hardware also safeguards the excitation system from internal and external flaws. The system can use several communication protocols to interact with both old and new plant process control systems. Meanwhile, touch panels serve as the excitation system’s human-machine interface. Excitation mechanisms can be static and coupled to the rotor windings directly, or they can be brushless exciters. This fundamental design decision is influenced by grid operational requirements, dependability, availability, performance, and economic considerations. The excitation mechanism of a synchronous generator allows the energy produced by an engine (turbine) to be utilised to power the electrical grid. Modular controller process is explained in Fig. 3.

Figure 3: Modular controller in power factors on hydropower
All of a hydropower plant’s components, such as the turbine, main shaft, bearings, generator, and auxiliaries, are subject to wear and tear even when it is operating normally. Advanced diagnostic and monitoring systems need to be vigilant for environmental changes, evaluate patterns, and send out notifications when specific alarm or reaction thresholds are reached. They should encourage the quick diagnosis of the underlying causes of any aberration, such as abnormal ageing, before any real harm is done. These analytical and diagnostic results can then aid in the decision-making of technical specialists, asset owners, and plant operators. The results, for instance, might be applied to damage prediction and improve inspection advice and preventative maintenance scheduling. The early detection of damaged components, a reduction in unplanned outages, and speedier repair times are major objectives of today’s operational processes. Every excursion results in the permanent sampling and saving of data, which reduces the need for storage while maintaining the accessibility of all relevant data for “life.” With this unique feature’s user-friendly graphical representations, users can access data over prolonged periods of time. Our in-house-built monitoring and diagnosis system frequently incorporates the experiences of ANDRITZ Hydro as well as those of our clients and other international electric generating utilities. The hardware and software solution are constructed using state-of-the-art system concepts and can accommodate future capabilities.
It can be utilised as a local web application at the turbine controller, gate controller, or unit control boards, depending on a specific purpose, and control centre systems are used to visualise processes. However, by simply enhancing its capabilities, the same system may satisfy all demands from a power plant operator. The necessary tools for supervising, watching, and regulating industrial activities are provided by modern SCADA systems. Due to its adaptability, it may be used at all automation levels, from small central control rooms to turbine controllers and unit controls. The principles of ergonomic management and visualisation are improved to provide a quick and accurate process overview.
1.5 Setup Time Stage-Data Acquisition
Work on pre-processing is required for the feedback service. Data acquisition (set-up time-stage work) has to be done as pre-processing work to synchronise turbines (feedback service).
Usually, a SCADA system gathers and analyses data from tens of thousands of RTUs and PLCs located at numerous facilities across a wide geographic area. Numerous suppliers often sell these devices, frequently using a variety of communication methods. As a result, a SCADA system should interface with all standard communication protocols to connect to any brand of PLC, RTU, or IED in the field. It will provide complete process, device, and electrical integration. Electrical integration is crucial in hydroelectric and solar applications because it gives users visibility into and control over the entire plant or network without the expense or inefficiencies of setting up and maintaining a distinct electrical control system. Regardless of the control technology, the SCADA system must provide the data in a single consistent and comfortable operator interface. Consequently, the SCADA system will enable complete management system knowledge from a single, easily operated workstation. A polling engine should be part of the SCADA system to check the online system of the field devices regularly and send the data to a SCADA server. As opposed to platforms that need several servers, it should ideally be able to scan numerous devices from a central computer, reducing the expense and difficulty of scanning substantial solar fields, wind farms, or water networks.
1.6 Feedback Service: Synchronization
Switching that is perfectly synchronized: For hydropower automation systems, synchronising units with power grids is one of the most difficult challenges. The fundamental requirement is to cut off the circuit at precisely the right time in order to maintain the unit’s lifespan. A particularly challenging technical problem is parallelizing power networks using generators. These days, this process is automated using cutting-edge, technically advanced electronic gear. During synchronization, everything must function flawlessly. Only dependable, thoroughly tested hardware with enhanced backup features can meet the demands for measurement data and evaluation in time for protection control.
Electrical protection: electrical protection systems must stop any damage to the electrical equipment in the electrical power plant in the case of an overload or any other kind of failure. A protection system must be based on flexible and adaptive technology in order to provide safe solutions that are both technically and financially feasible. Descriptive structure of the Electrical protection system is given in Fig. 4.

Figure 4: Electrical protection system

Figure 5: Queuing model of the hydropower system
Preassembled equipment and regular operating procedures are employed to maintain high standards of safety throughout the entire operation. Proven numeric algorithms are employed and modified to satisfy necessary demands in power generation as they arise based on extensive experience with one’s own digital protection relays. Numerous tasks required for modern techniques, like huge thermal blocks, include generator protection. The digital platform offers complete generator and transformer safety choices. The architecture of the protection functions is flexible and modular. The integrated project tools support the protection engineer throughout the whole engineering and testing process. It offers features including a software test matrix, test inputs for the security mechanisms, and easy interface testing.
The following section provides a mathematical definition of the aforementioned SCADA queuing system as a queuing description (problem). The problem is resolved using the queuing additional variables technique, and its related performance metrics are obtained.
The performance measurements of the SCADA system process are thoroughly studied in Section 4 using numerical analysis and it is picturized in Figs. 6–11.

Figure 6: The graphical portrayal of arrival Rate

Figure 7: The consequence of compulsory vacation

Figure 8: The effect of feedback service

Figure 9: Graphical representation for the effect of arrival rate

Figure 10: Graphical representation for the effect of compulsory vacation

Figure 11: Graphical representation for the effect of feedback service
Python, MATLAB, and the R Tool are used to programme the study. This section provides comprehensive information on the simulation analysis of the SCADA process.
2 Mathematical Framework of the Model (SCADA System–A Queuing Approach)
2.1 Description of the Model in the Diagram
The diagrammatic representation of the queuing system of the SCADA system is explained in the Fig. 5.
2.2 Description of the Above Queuing Structure
The queue structure that the system specifies belongs to a non-Markovian model. Customer arrivals follow a Poisson process, but service times follow a generic distribution. A single server provides one-on-one service to each client. Customers log into the service. One is required to take a vacation after that service is over. All maintenance tasks that lessen or eliminate interruptions will be done during this vacation. The first stage of the service level will restart after that vacation level is finished. In this system, a feedback service is introduced. Customers can wait in line once more to give feedback if they were dissatisfied with the service they received before exiting the system. If the server notices any consumers waiting in line after the main service is finished.
One of the first industrial uses for compact digital computers was Supervisory Control and Data Acquisition, or SCADA. Due to the adaptability and growth of computer technology, computers have grown smaller and cheaper while also performing better over the past few years. Due to the wide range of current usage, there are many SCADA system design alternatives and issues to consider. A SCADA system is, however, geologically distributed and intrinsically nonlinear. It costs a lot of time and money to implement benchmarking and compute. Due to strict schedules and little resources, the development and deployment of the majority of industrial systems is difficult. Due to their prominence in the last three to four years, queueing algorithms have been used for testing and replication. An article on queuing systems. In this article, the design of a SCADA system is examined using a queuing model. The mathematical study of queues is known as queuing theorySupervisory Control and Data Acquisition, or SCADA, was one of the earliest applications for small digital computers in manufacturing. Over the past few years, computers’ size and cost have substantially decreased while also performing better because of the versatility and advancement of computer technology. Because current usage is so diverse, there are numerous design options and questions for SCADA systems.
However, a queueing model is created in order to forecast line lengths and wait times. Queueing theory is often viewed as a topic of operations research since the conclusions are commonly applied when making business decisions regarding the resources needed to provide a service. The queueing theory originated with research and models created by Agner Krarup Erlang to explain the Copenhagen Telephone Exchange Firm, a Danish business. Since then, the ideas have been applied to a number of industries, including project management, telecommunication, traffic engineering, and industrial engineering, which have been utilised to construct factories, stores, offices, and hospitals. Applying queueing theory to hydrologic modelling has resulted in the creation of a novel method. A situation where clients are lining up to get services is known as a “queueing situation.” In this instance, water is the client, and the service time is the amount of time it takes for the water to travel over and through the land. The queueing attitude recognises the manufacturing issue and offers key thoughts in order to minimise manufacturing process disturbances.
The capacity, efficiency, and measurement update cycle of SCADA systems that use the token passing bus protocol as a mac protocol in the medium access control layer are all presented [1]. The utility of the suggested PPFSCADA system is demonstrated by a number of studies employing simulated SCADA, intrusion detection, and network traffic data sets [2]. A model was developed using a simulation language with the goal of forecasting runoff hydrographs from storms that impact small, homogeneous watersheds [3]. A typical SCADA system’s operation and practical uses are in-depth documented [4]. Hydraulic-electric interference studies and dual-control model-based multi-turbine hydropower system optimization was carried out [5]. An in-depth investigation was made into a case study on migrating a SCADA system to IaaS clouds [6]. The non-Markovian model with optional types of service with extended vacations, reneging procedures, and service disruptions followed by phases of repair was explored in great detail [7]. Candidate identification, evaluation, assessment, and prioritizing are only a few of the operations that make up the robotic process automation (RPA) process. Other steps include design, calibration, and evaluation [8]. In the procedure for incorporating aramid fibers into composite materials, the queueing method plays a prominent role in the analysis process [9]. The idea of queuing approach is described in detail in mobile Ad hoc networks [10]. The simulation model assumes a distributed denial of service (DDoS) attack on the SCADA system, and some security measures have been suggested [11]. The frequency-domain finite difference method is adapted in the current study for simulating the proposed model [12]. The development of the Internet of Things (IoT) has made it possible to connect many monitoring devices to the internet, which will be especially useful for automating water delivery and leak detection [13]. A thorough discussion of a mathematical model for recurring consumers that takes the shape of an orbit, instant and delayed feedback, N servers, and a queuing system was found in [14]. At the level of the pump house, the supervisory control and data acquisition system (SCADA) has relatively little impact, indicating that the distribution side is being monitored less. Moving these SCADA systems to an Infrastructure as a Service (IaaS) cloud provides more reasonably priced deployments, system redundancy, and improved uptime [15]. For the specified queuing model, the time-dependent probability generating function in terms of their Laplace transforms, and the accompanying steady state findings are determined [16]. An extensive investigation and full discussion of the analysis on a feedback queuing model with the probability of a client visiting one of the three servers no more than twice were undertaken [17]. In order for the hydropower plants to run properly and efficiently, new and summative assessments were set up [18]. The analysis focused on elements that have an impact on energy generation estimations, operating strategies, and performance evaluations [19]. The queuing model was properly illustrated using the thermos pack procedure from mechanical engineering [20].
2.3 Notations, Assumption and Governing Equations of the Frame Work
Clients enter the framework in varying-sized groups and follow a Poisson distribution with an arrival rate

2.4 Formation of Governing Equation Using the Birth and Death Process
The procedure moves from state i to state i + 1 when a birth occurs. Similarly, the process changes from stage i to state i − 1 when death occurs. It is widely assumed that birth and death have no relationship. According to the system’s state i, the birth rate
The Birth-and-Death process can be broadly described as follows: after entering state i, the process holds (sojourns) in the specified state for an arbitrary amount of time, exponentially distributed with parameter (λ i + µ i ). The process enters i + 1 with probability λ i /(λ i + µ i ) or i −1 with probability µ i /(λ i + µ i ) while leaving i. The procedure sojourns in the state in question according to the exponential distribution with parameter λ i+1 + µ i+1 before choosing the next state, and so on. The number of trips to the same state is ignored because transitions from state i to state i would be undetectable in a continuous time processing.
Input is considered to be birth, and output (exit) is related to death.
Based on the above birth and death process of study, the following governing equations for the defined model are framed.
Governing Equations
Initial and Boundary Conditions
3 Methodological View of Resolving the Queuing Problem
The stable probability of non-Markov queues can be resolved using the supplementary variable technique, a method from queueing theory. The Technique was introduced by David George Kendall and David Cox. Assume that the accumulation’s outcome is distributed using a common probability density function to demonstrate how to use additional variables. Second, the holding size process N (t) cannot be altered since the Markov property is absent. As a result, we introduce X as a randomly generated variable (t). It shows the duration of the customer’s service at time t. By incorporating additional variables in the state description, we show how the two-dimensional random variable (N (t); X (t)) converts into a Markova process. This strategy has advantages over others like matrix factorization and embedded optimization.
By applying the supplementary variable technique to the above-mentioned equations, we derive the probability- generating function of queue size
Hence
4 Performance Measures of the SCADA System
Using probability generating function of the queue size, we derive the performance measures as follows:
4.1 Idle Time and Factor of Utilization
The condition of normalizing
Because of the indeterminant of
L′ Hospital’s rule is applied to calculate the steady-state average queue length.
were,
4.4 Waiting Time Performance Measures
Little’s law is used to compute the average wait time of a customer in line, the system length, and the average wait time of a customer in the framework.
In the next section, the model is well analyzed and justified using numerical illustration approach by the usage of R Tool, MATLAB and Python program.
This article describes a non-Markovian model. Service time is distributed generally. For the purposes of the calculation, we specifically assume that the distribution of service time is exponential. Consider the following metrics:
All the above-indicated notations are already explained in the Table of Notations in Section 2, and the following notations are the first and second moments of the defined parameters.
5.1 Result Analysis using R TOOL and the MATLAB
(i) Effect of arrival rate on the execution measures is given in Table 1 and graphical portrayal in Fig. 6.

Table 1 given below shows that the arrival rate denoted by
(ii) The Outcome of the server’s mandatory vacation on the queue performance measures is tabulated in Table 2 and visualized in graphical form in Fig. 7.

The above Table 2 shows that when the server enters the mandatory vacation period, the idle time rises while the utilisation factor falls. Also, the queue length and customer waiting time are reduced.
(iii) The Consequence of the feedback service is shown in Table 3 and it picturized in Fig. 8.

Below mentioned Table 3 shows that feedback service measures customer experience and improves customer satisfaction. If customers require a feedback service, then the queue length increases and the utilisation factor decreases.
All the above results are as expected. In the next section, the result analysis is processed through Python Programming.
5.2 Analysis Through Python Programming
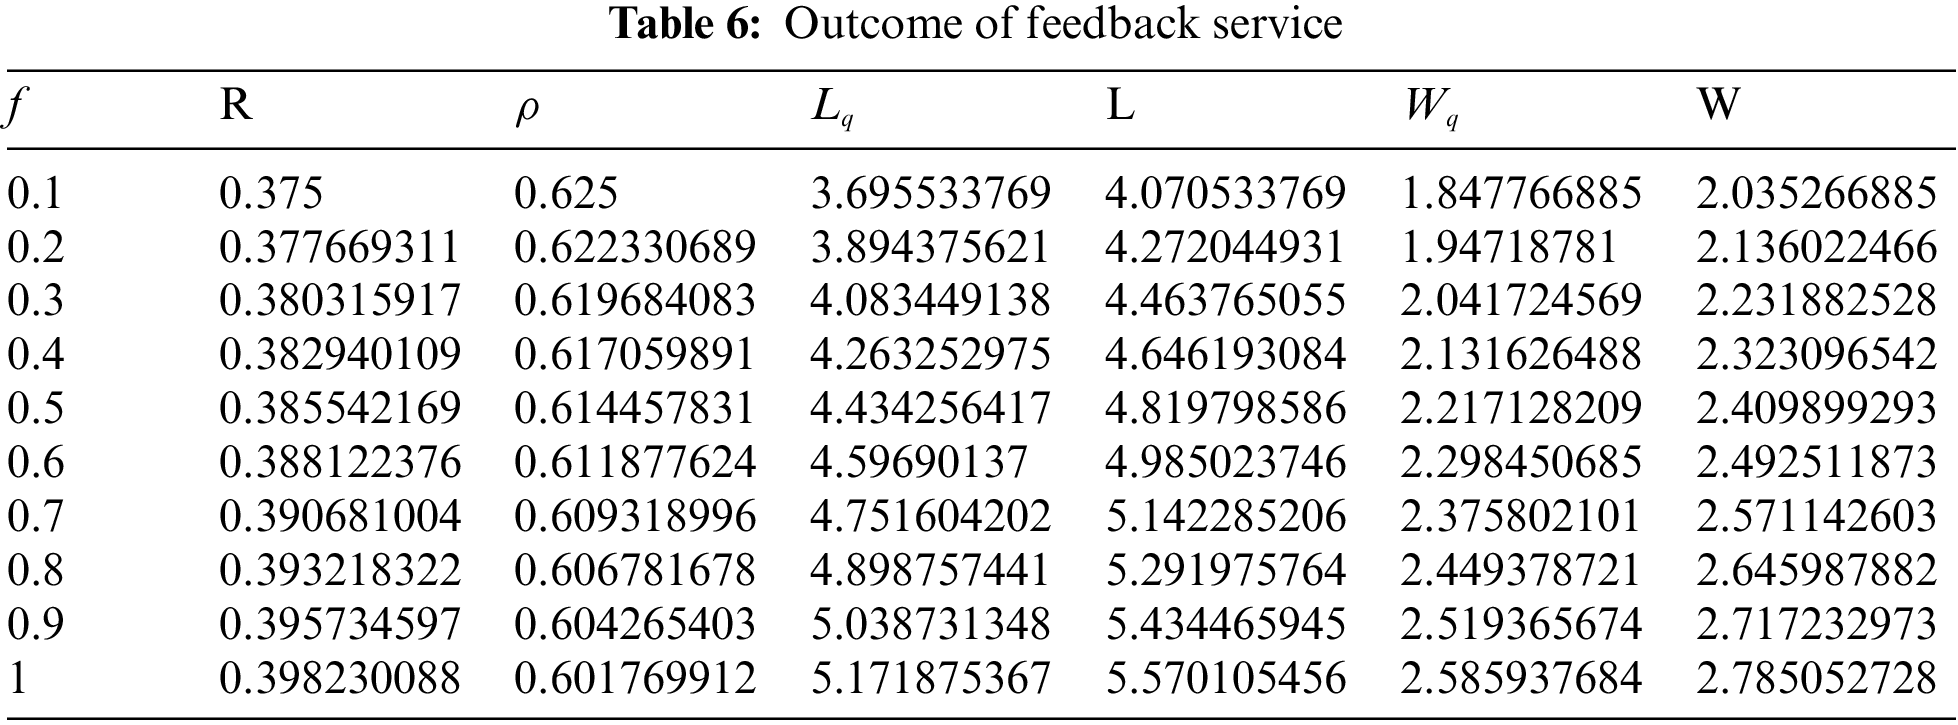
In this section, the analysis of the effect of the various parameters over the queuing system is processed through Python Programming and the results are tabulated in Tables 4–6 and its graphical study is shown in Figs. 9–11 .


(i) Consequence of Arrival rate

(ii) Effect of Compulsory vacation

(iii) Analysis of feedback service on the queuing system

The above-mentioned research shows that all of the elements, such as arrival rate, vacation rate, feedback service, and setup time technique, have a big impact on how well the SCADA system functions. With the aid of the outcomes, system administrators can fully comprehend the operation and take the necessary actions to finish it quickly and effectively.
In the current study, we investigated the SCADA process using a queuing method, which provided good performance measures. The supplemental variable technique overcomes the queuing-type problem with the above structural processes. For various execution strategies, they perform calculations for queue size, server idle time, utilization, and probabilistic generating functions. Numerical analysis was used to evaluate several uncommon examples. According to the above research, each of the elements, including arrival rate, vacation rate, feedback service, and setup time technique, significantly affects how well the SCADA system functions. The results help system managers completely comprehend the procedure and take the steps to finish it swiftly and efficiently. The study is fully finished by using graphic representation techniques, and the idea is further reinforced by a solid mathematical formulation. As a follow-up project, we can create new queuing models to address the queuing challenges brought on by various SCADA system outages at hydroelectric power plants. The model can be further adjusted to address these issues. Many information exchanges and systems employ this model.
Funding Statement: The authors received no specific funding for this study.
Conflicts of Interest: The authors declare they have no conflicts of interest to report regarding the present study.
References
1. H. Afkhami, A. M. Rad and M. A. Afkhami, “Channel capacity, efficiency and update cycle in SCADA systems with token passing bus protocol,” Archives of Applied Science Research, vol. 4, no. 1, pp. 454–460, 2012. [Google Scholar]
2. A. Alharthi, Z. Tari, A. Goscinski and I. Khalil, “PPFSCADA—privacy preserving framework for SCADA data publishing,” International Journal on Future Generation Computer Systems (FGCS), vol. 37, no. 2, pp. 496–511, 2014. [Google Scholar]
3. J. G. Arnold and J. R. Williams, “Hydrologic modelling using a simulation language based on queueing theory,” JAWRA Journal of the American Water Resources Association, vol. 24, no. 4, pp. 861–868, 2007. [Google Scholar]
4. A. Bagri, R. Netto and D. Jhaveri, “Supervisory control and data acquisition,” International Journal of Computer Applications, vol. 102, no. 10, pp. 1–5, 2014. [Google Scholar]
5. C. Duan, Z. Minglu, Z. Changbing, Y. Mengjiao, M. Cheng et al., “Research on hydraulic-electric interference and optimization of multi-turbine hydropower system based on the dual control mode,” The Institution of Engineering and Technology, vol. 13, no. 7, pp. 1096–1104, 2019. [Google Scholar]
6. P. Church, H. Mueller, C. Ryan, S. V. Gogouvitis, A. Goscinski et al., “Migration of a SCADA system to IaaS clouds—a case study,” Journal of Cloud Computing, vol. 6, no. 11, pp. 1–12, 2017. [Google Scholar]
7. S. Maragathasundari and P. Manikandan, “A study on the performance measures of the non-markovian model of optional types of service with extended vacation, reneging process and service interruption followed by phases of repair,” International Journal of Process Management and Benchmarking, vol. 10, no. 4, pp. 520–549, 2020. [Google Scholar]
8. S. Maragathasundari, M. Muthanantham, R. Vanalakshmi and C. Swedheetha, “Queuing analysis in robotic process automation,” in 2022 8th Int. Conf. on Advanced Computing and Communication Systems (ICACCS), Coimbatore, India, pp. 174–181, 2022. https://doi.org/10.1109/ICACCS54159.2022.9785307 [Google Scholar] [CrossRef]
9. S. Maragathasundari, S. Kishore Eswar and R. S. Somasundaram, “A study on phases of service and multi-vacation policy in a non-markovian queuing system,” International Journal of Mathematics in Operational Research, vol. 21, no. 4, pp. 444–465, 2022. [Google Scholar]
10. S. Maragathasundari and K. S. Dhanalakshmi, “Mobile ad hoc networks problem a queueing approach,” International Journal of Communication Networks and Distributed Systems, vol. 21, no. 4, pp. 475–495, 2018. [Google Scholar]
11. J. D. Marković-Petrović and M. D. Stojanović, “Analysis of SCADA system vulnerabilities to DDoS attacks,” in 2013 11th Int. Conf. on Telecommunications in Modern Satellite, Cable and Broadcasting Services (TELSIKS), Nis, Serbia, vol. 2, pp. 591–594, 2013. [Google Scholar]
12. I. Mahariq, S. Beryozkina, H. Mohammed and H. Kurt, “On the eddy current losses in metallic towers,” International Journal of Renewable Energy Development, vol. 9, no. 1, pp. 1–6, 2020. [Google Scholar]
13. L. K. Narayanan and S. Sankaranarayanan, “IoT enabled smart water distribution and underground pipe health monitoring architecture for smart cities,” in Proc. of the Institute of Electrical and Electronics Engineers (IEEE) 5th Int. Conf. for Convergence in Technology, Pune, India, pp. 1–7, 2019. [Google Scholar]
14. A. Nazarov, A. Melikov, E. Pavlova, S. Aliyeva and L. Ponomarenko, “Analyzing an M|M| N queueing system with feedback by the method of asymptotic analysis,” Cybernetics and Systems Analysis, vol. 57, no. 1, pp. 57–65, 2021. [Google Scholar]
15. P. Church, H. Mueller, C. Ryan, S. V. Gogouvitis, A. Goscinski et al., “SCADA systems in the cloud,” In: A. Y. Zomaya, S. Sakr (Eds.Handbook of Big Data Technologies, Cham: Springer, 2017. https://doi.org/10.1007/978-3-319-49340-4_20 [Google Scholar] [CrossRef]
16. S. Shyamala and R. Vijayaraj, “Time dependent solution of two stages m[x]/g/1 queue model server vacation random setup time and balking with bernoulli schedule,” The American Institute of Physics (AIP) Conference Proceedings, vol. 2261, pp. 030005, 2020. https://doi.org/10.1063/5.0017027 [Google Scholar] [CrossRef]
17. S. Kumar and G. Taneja, “A feedback queuing model with chances of revisit of customer at most twice to any of the three servers,” International Journal of Applied Engineering Research, vol. 13, no. 17, pp. 13093–13102, 2018. [Google Scholar]
18. S. H. Vinchurkar and B. K. Samtani, “Performance evaluation of the hydropower plants using various multi-criteria decision-making techniques,” International Journal of Engineering and Advanced Technology (IJEAT), vol. 8, no. 6, pp. 2131–2138, 2019. [Google Scholar]
19. A. A. Sysoev, N. V. Lazareva and A. A. Proskurina, “Modeling complex hydropower systems for research and training,” in 2021 Int. Conf. on Industrial Engineering, Applications and Manufacturing (ICIEAM), Sochi, Russia, pp. 152–157, 2021. https://doi.org/10.1109/ICIEAM51226.2021.9446416 [Google Scholar] [CrossRef]
20. R. Vanalakshmi, S. Maragathasundari and S. Kishore Eswar, “Queuing system behavior in thermo pack process,” Journal of Physics: Conference Series, vol. 1850, no. 12047, pp. 1–13, 2021. [Google Scholar]
Cite This Article
 Copyright © 2023 The Author(s). Published by Tech Science Press.
This work is licensed under a Creative Commons Attribution 4.0 International License , which permits unrestricted use, distribution, and reproduction in any medium, provided the original work is properly cited.
 Downloads
 Citation Tools