
 Submit a Paper
 Propose a Special lssue
 Open Access
ARTICLE

Urban Drainage Network Scheduling Strategy Based on Dynamic Regulation: Optimization Model and Theoretical Research
College of Environmental Science and Engineering, Tongji University, Shanghai, 200092, China
* Corresponding Author: Xiaoming Fei. Email:
Intelligent Automation & Soft Computing 2023, 37(2), 1293-1309. https://doi.org/10.32604/iasc.2023.038607
Received 21 December 2022; Accepted 20 February 2023; Issue published 21 June 2023
 View Full Text
 Download PDF
Abstract
With the acceleration of urbanization in China, the discharge of domestic sewage and industrial wastewater is increasing, and accidents of sewage spilling out and polluting the environment occur from time to time. Problems such as imperfect facilities and backward control methods are common in the urban drainage network systems in China. Efficient drainage not only strengthens infrastructure such as rain and sewage diversion, pollution source monitoring, transportation, drainage and storage but also urgently needs technical means to monitor and optimize production and operation. Aiming at the optimal control of single-stage pumping stations and the coordinated control between two-stage pumping stations, this paper studies the modelling and optimal control of drainage network systems. Based on the Long Short Term Memory (LSTM) water level prediction model of the sewage pumping stations, and then based on the mechanism analysis of drainage pipe network, the factors that may cause the water level change of pumping station are obtained. Grey correlation analysis is carried out on these influencing factors, and the prediction model is established by taking the factors with a high correlation degree as input. The research results show that compared with the traditional prediction model, the LSTM model not only has higher prediction accuracy but also has better inflection point tracking ability.Keywords
At present, with the gradual development of scientific and technological innovation, science and technology drive life, people’s life is becoming more and more intelligent and significantly improved, and the pace of smart city construction is accelerating, which makes the requirements for the intelligentization of urban drainage pipeline system gradually improve, and also poses greater challenges [1]. The number of towering buildings in Chinese cities has significantly increased due to the country’s rapid urbanization and economic development. However, the development of an underground sewer system is typically disregarded. Due to historical factors, a lack of scientific research, and financial constraints, many rapidly expanding cities have largely concentrated on the relatively quick construction of sewage treatment plants, whereas the underground sewerage system that collects and channels the waste to the treatment plant is slow. This would lead to many years of insufficient sewage collection or low sewage concentration. In these cities, where there is a severe lack of funding and a problem with water pollution, heavily invested sewage treatment plants would not be used to their full design capacity. These cities’ numerous outdated combined sewerage systems suffer from issues like ageing, low sewerage capacity, and pollution from overflows during the rainy season. As a result, many cities are gradually phasing out the outdated system and developing an entirely new one. While other cities maintain, modify, and use these systems to maximize return on investment, some cities successfully convert and fully separate these outdated combined sewerage systems. Due to the complexity of influencing factors and the time-varying, nonlinear and sudden characteristics of traffic data, the current research on traffic flow and network flow is of certain reference significance to the research on pipeline flow [2,3]. Like the problems faced by traffic flow, the rapid development of China’s traffic industry makes traffic congestion more serious [4]; In terms of network data, the rapid and vigorous development of computer network data technology has created various practical applications. Computer network data has entered the era of big data, which puts forward higher requirements for network service quality, and various problems are highlighted [5]; Similarly, the urban drainage network is like the vein of the city, hidden in the ground. It is hard to be noticed in ordinary times, but it is the most important thing to determine the development of a smart city. Once there is a vein problem, it will affect the operation of the whole urban system [6]. In reality, there will be some problems in the drainage pipe network, such as siltation blocking the high water level, pipe network damage and leakage, rainfall and sewage overflow, etc. With the continuous advancement of smart city construction in recent years, the long-term underground drainage network has gradually exposed various problems [7,8].
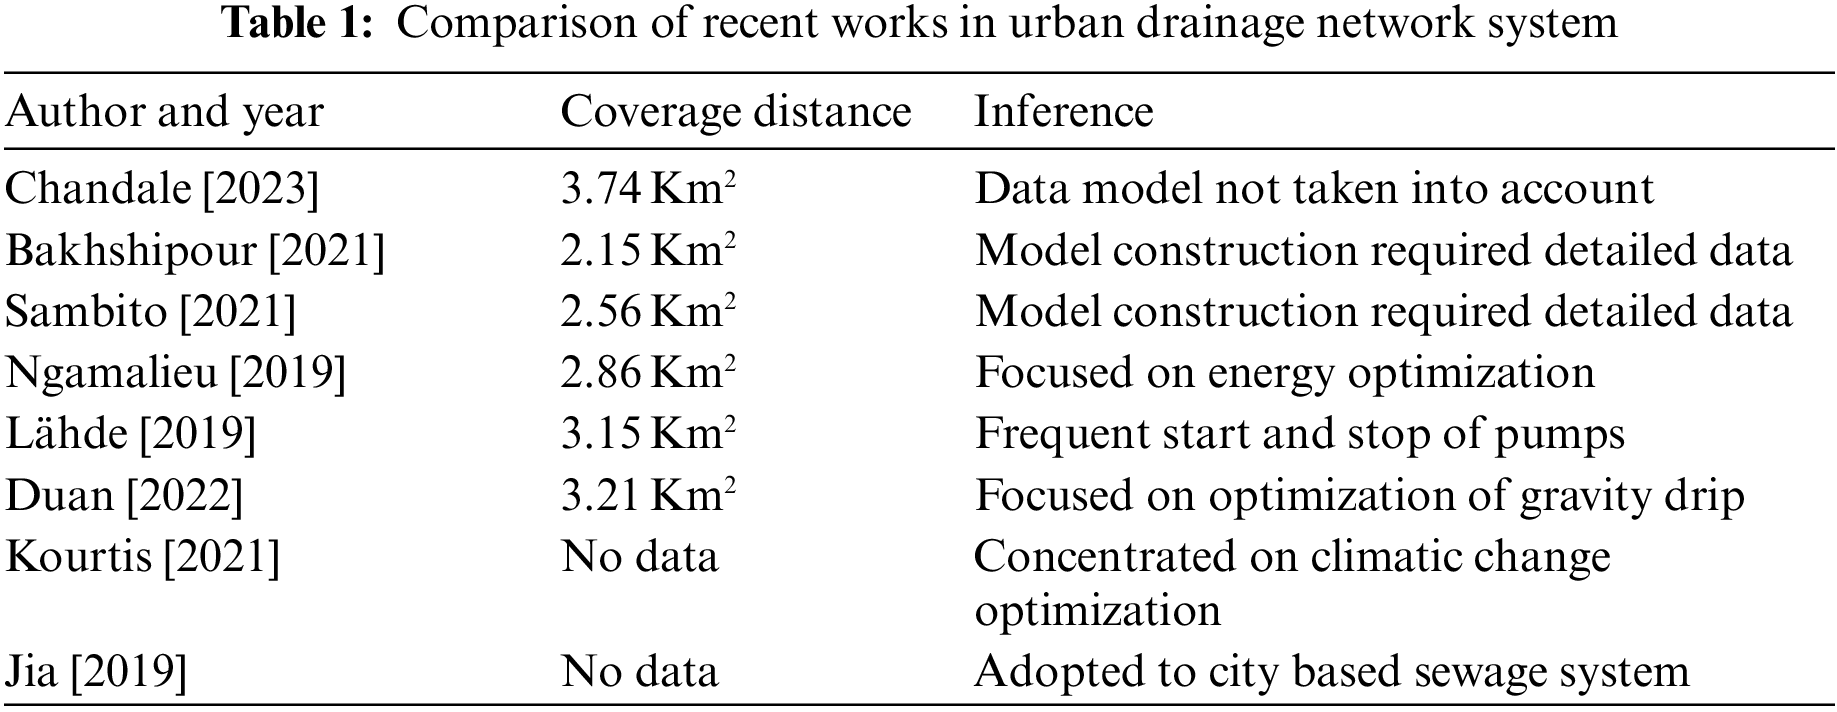
Urban drainage network models can be divided into two categories: data model and mechanism model [9]. The data model does not take into account the complex operation mechanism and system dynamics of the drainage network and is a model formed by training and fitting on the basis of data [10,11]. The mechanism model is based on network informatization. The construction of the model requires detailed basic data such as the topological structure, node elevation, pipe diameter and pipe length of the pipe network. By solving the conservation equation of mass and energy, information of the flow rate and liquid level in the pipe network can be obtained [12]. The basic control unit of the drainage network is the sewage pumping station [13]. Many scholars at home and abroad have conducted in-depth research on the operation control of pumping stations, mainly focusing on the optimization of energy-saving control of a single-stage pumping stations and the coordinated control of multi-stage pumping stations [14]. In the aspect of optimal control of a single-stage pumping stations, Kouetis proposed a practical method of pump control based on the fuzzy Proportional Derivating (PD) model to solve the problem of frequent start and stop of pumps [15]. The simulation results show that this method can greatly reduce the start-stop times of the pump. Jia proposed a variable frequency speed regulation method with fuzzy control [16]. Control error and change rate of control error are used as inputs of fuzzy controller, and pump station flow is used as outputs of the fuzzy controller. The simulation results show that this control method can effectively reduce the risk of sewage overflow [17]. Ferrans put forward a fuzzy control method, which takes the current liquid level, the predicted trend of liquid level and the liquid level difference between adjacent sewage pumping stations as the input of the fuzzy controller, and the booster pump or decompression pump as the output of the fuzzy controller and formulates a fuzzy control strategy. The simulation results show that this method can minimize sewage overflow and effectively reduce energy consumption [18]. Zhang proposed a control strategy based on pump performance [19]. Based on the typical urban drainage system topology, the inlet, outlet and water storage equations of sewage pumping stations are established, and the water output of related pumping stations is dynamically optimized [20]. Ortiz et al. [21] proposed a PD control algorithm with variable parameters. BP and RBF neural networks are used to identify the parameters of the PD controller, and the polling algorithm of the pump group is designed, which makes the pump station run stably and reduces energy consumption. Lee applied fuzzy control to pump station control, and compared with Proportional-Integral-Derivative (PID) controller, it proved that the liquid level under fuzzy control was more stable and the energy consumption was lower [22]. Chen obtained the relationship between flow, lift, power and efficiency through the in-depth study of the law of pump speed and inlet flow [23]. Using these equations, a mixed integer optimization model is established, and the model is solved by taking an actual drainage system as an example. Through optimal control, the power consumption of the pumping station is effectively reduced. With the steady development of the country and society, urban waterlogging is becoming more and more serious, which damages the economic benefits of urban public facilities and threatens the life safety of residents. Therefore, research on solving the urban waterlogging problem has become the focus of society and even the whole world. Because the design and planning of an urban drainage network are not enough to carry storm drainage, engineering measures also have the disadvantages of difficult construction and long construction time. It is the general trend to build an urban drainage system information systems and scientific and reasonable drainage solutions [24]. The comparative analysis is illustrated in Table 1.
The factors affecting the liquid level change in pumping stations are complicated, and most are random and difficult to catch. If these differences are ignored, the complex structure of the prediction model will lead to poor generalization ability. The grey relational analysis method can well express the relationship between the reference sequence and the comparison sequence by calculating the grey relational degree between the two sequences. Therefore, by comparing the grey correlation degree of each influencing factor, the input of the model can be better selected. LSTM not only has the strong nonlinear mapping ability of the neural networks, but also has good long-term and short-term memory, which can better approximate the real state of complex time-delay systems. Therefore, in this paper, the long-term and short-term memory neural network LSTM is combined with grey relational analysis to study the liquid level prediction of the sewage pumping stations in the drainage networks. Optimizing the regulation of rainwater pumping stations and gate valves can reduce the peak flow of river channels and the occurrence of water logging disasters in cities. The objective of the proposed work is as follows.
• To design an optimal urban drainage network with high level of efficiency.
• To incorporate LSTM model in the urban drainage system for high level of prediction accuracy.
The manuscript is organized with the introduction to the LSTM model in Section 2 and mechanism analysis with an example in Sections 3 and 4, respectively. The Section 5 illustrates the optimal design of the urban drainage network and concludes in the Section 6.
The urban drainage network is a complex dynamic system with nonlinearity and uncertainty, and it is generally difficult to establish an analytical mathematical model [25]. Because the neural network has powerful data training ability and nonlinear data training ability, it can better deal with the modelling and control problems of such complex systems [26]. Through consulting the data, it is found that there are two commonly used neural network models, feeds Forward Neural Network (FNN) and Recurring Neural Network (RNN). The network structure of the two networks is shown in Fig. 1. Both FNN and RNN can be applied to the liquid level prediction of pumping stations. When FNN is applied to pump station water level prediction, it is necessary to manually determine the input time of upstream pump station signal and historical water level. However, due to the change of the conditions in the pipeline and the influence of the flow of the side branch pipe, the time lag is different in different situations, so it is necessary to determine different time steps in different situations, which is complicated and the prediction effect is average [27]. Rn layers are connected with each other, and the data input of the hidden layer includes not only the data input of the top input layer but also the output of the hidden layer at the previous moment. The recurrent neural network RNN applies the useful information obtained by the code running record and the user data obtained by the code running record to the output calculation at a later time. Therefore, it is more appropriate to apply RNN to the liquid level prediction of pumping stations.
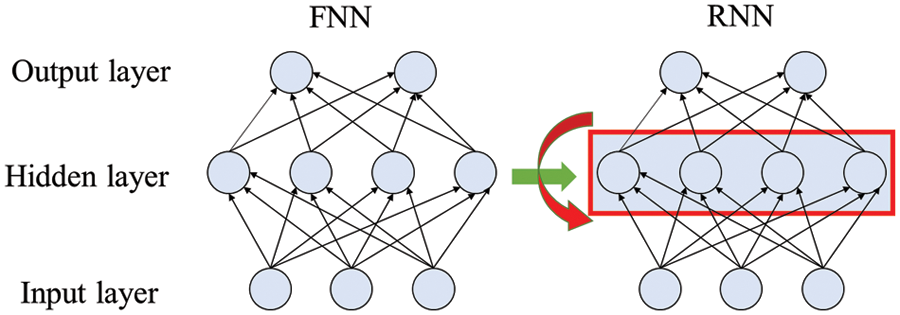
Figure 1: FNN and RNN
For RNN topology, because of its circular structure, gradient instability (explosion or disappearance) may occur during long-term code running training, which makes it difficult for RNN to learn long-distance information. To solve this problem, LSTM models of long-term and short-term memory networks have been developed in the field of machine learning [28]. Its biggest feature is that its storage unit has three logic control gates. LSTM completes long-term data training and memory functions through the input gate, forgetting gate and output gate. Figs. 2 and 3 are the topology diagram and memory cell diagram of LSTM, respectively.
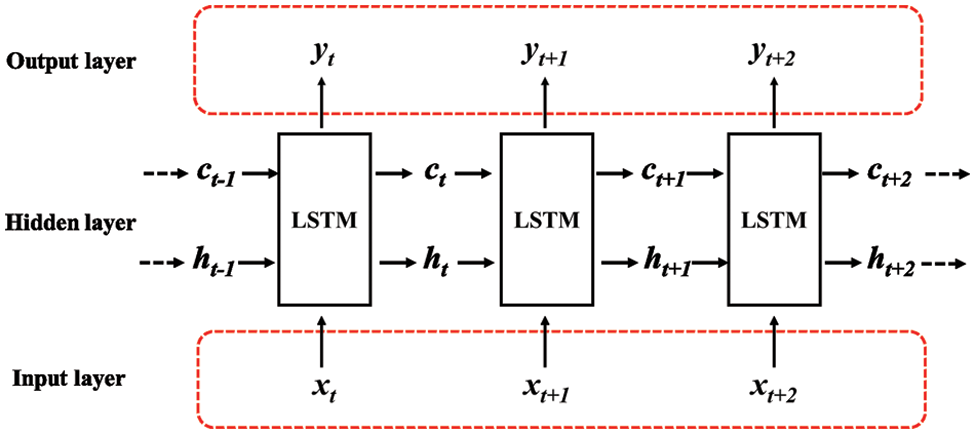
Figure 2: LSTM topology diagram
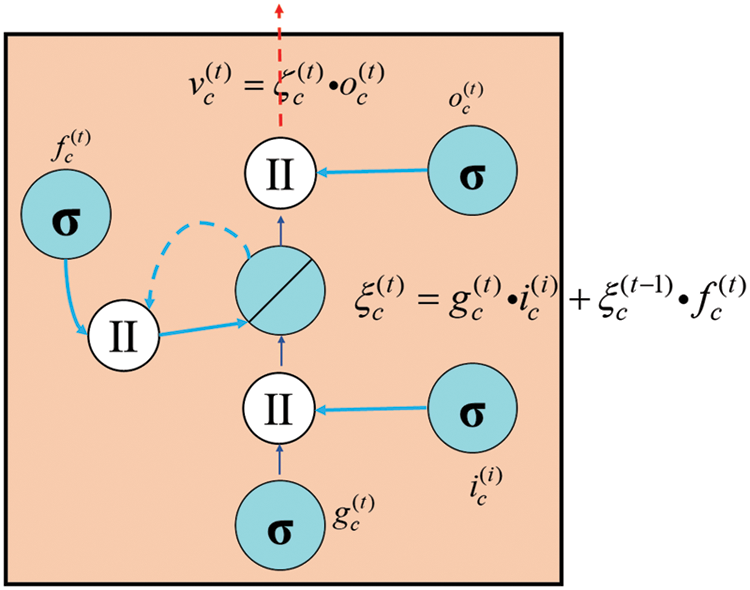
Figure 3: Schematic diagram of memory cell
LSTM can store gradient information in neurons and transmit it in time series through these three control gates, where the storage unit is the storage unit in the hidden layer that stores historical information. The input gate determines how many inputs are saved in the memory unit at the current moment, the forgetting gate determines whether the “memory” of the previous moment can be saved for the current moment, and the output gate controls how much information the memory unit outputs. Therefore, the LSTM model can select and memorize the characteristics of input information through the control gate, so that information can be stored and transmitted in a long time domain.
The specific calculation formula is as follows:
Input: Entry:
Enter the door:
Output Gate:
Update the vector of the cell:
The final output result and the initial state of the next moment:
Whether the input is appropriate directly affects the prediction accuracy of the model. Therefore, this section reasonably selects the input and output of the model by analyzing the inflow and outflow of sewage pumping stations. The output of the model is the water level of the forebay, and the main influencing factors are the inflow of tributaries (tributaries, including domestic sewage, industrial sewage, and part of atmospheric precipitation), the upstream inflow of sewage from the upstream pumping station and the confluence of the pumping station. Aschematic diagram of influencing factors is shown in Fig. 4:
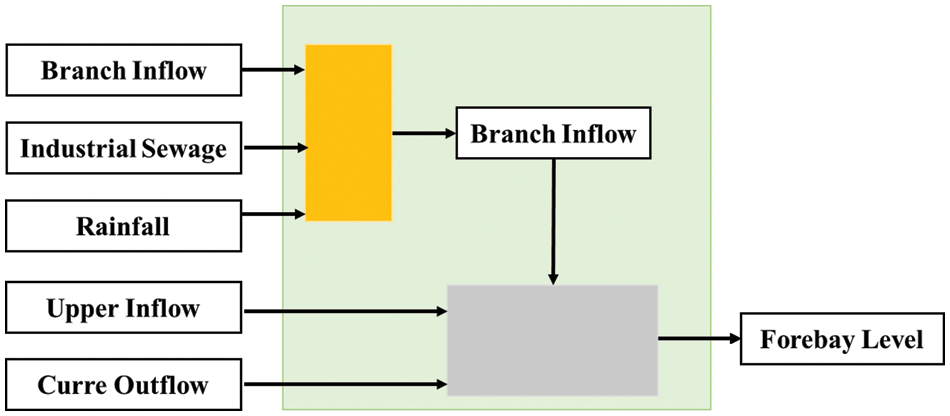
Figure 4: Schematic diagram of influencing factors of forebay liquid level
The Inflow of the forebay of the pumping station is the sum of the sewage lifting amount of the upstream pumping station, The Upper Inflow, and the inflow amount of the branch pipe, which is expressed by the formula:
The variation amount Dif of sewage in the forebay of the pumping station is the Inflow amount inflow and the discharge amount CurreOutflow of the water level pumping station. The difference is represented by the following formula:
Therefore, the water level of the drain pipe at the next moment is related to the current water level, the water output of the drain pipe of the pumping station at the corresponding level, the sewage lifting amount of the upstream pumping station, and the sewage inflow amount of the branch.
The sewage flow from the pumping station at the upper end of the river must flow into the pumping station at the lower end of the river through the drainage pipe network, and its sewage flow has a certain time lag. If it is used as model input, the delay time of its flow through the pipe network should be considered. For terraced pumping stations, there is a general correlation between the opening and closing of upstream pumping stations and the inflow of downstream pumping stations. The upstream pump station starts the pump to increase the discharge, and the upstream pump station forms a flood peak, and the sewage level of the downstream pump station also presents a flood peak accordingly. Therefore, the time delay can be calculated by the time delay calculation formula. Let the start-stop pump sequence of upstream pump station I be x(k) and the liquid level sequence of downstream pump station be y(k), and the Pearson correlation coefficient R between them is:
R belongs to −1 and + 1. If R > 0, the two time-delay variables are positively correlated, that is, the larger the value of one variable, the larger the value of the other variable. If R < 0, the two time-delay variables are negatively correlated, that is, the larger the value of one variable, the smaller the value of the other variable. The greater the absolute value of r, the greater the correlation coefficient and the stronger the correlation. Constantly adjust the relative position of the pump start-stop sequence of the upstream pump station and the liquid level time sequence of the downstream pump station, and calculate the correlation coefficient R, respectively. When the absolute value of R reaches the maximum, T at this time is the delay time for the sewage quantity lifted by the upstream pumping station to reach the downstream pumping station.
3.3 Analysis of Main Factors Affecting Liquid Level in Pumping Station
There are many factors that affect the water level of the pumping station, and these factors are usually difficult to grasp their regularity. Due to the complicated structure and weak generalization ability of the prediction model, it is more difficult to predict the liquid level of the pumping station. According to the “February 8th” law, it can greatly reduce the complexity of the problem by grasping the main influencing factors among the many factors that cause the change of sewage level in pumping stations. Therefore, the grey correlation analysis method can be used to evaluate the correlation degree of many factors in the urban complex drainage network system. By calculating the grey correlation coefficient between pump station liquid level and various influencing factors, the main influencing factors of pump station liquid level can be determined.
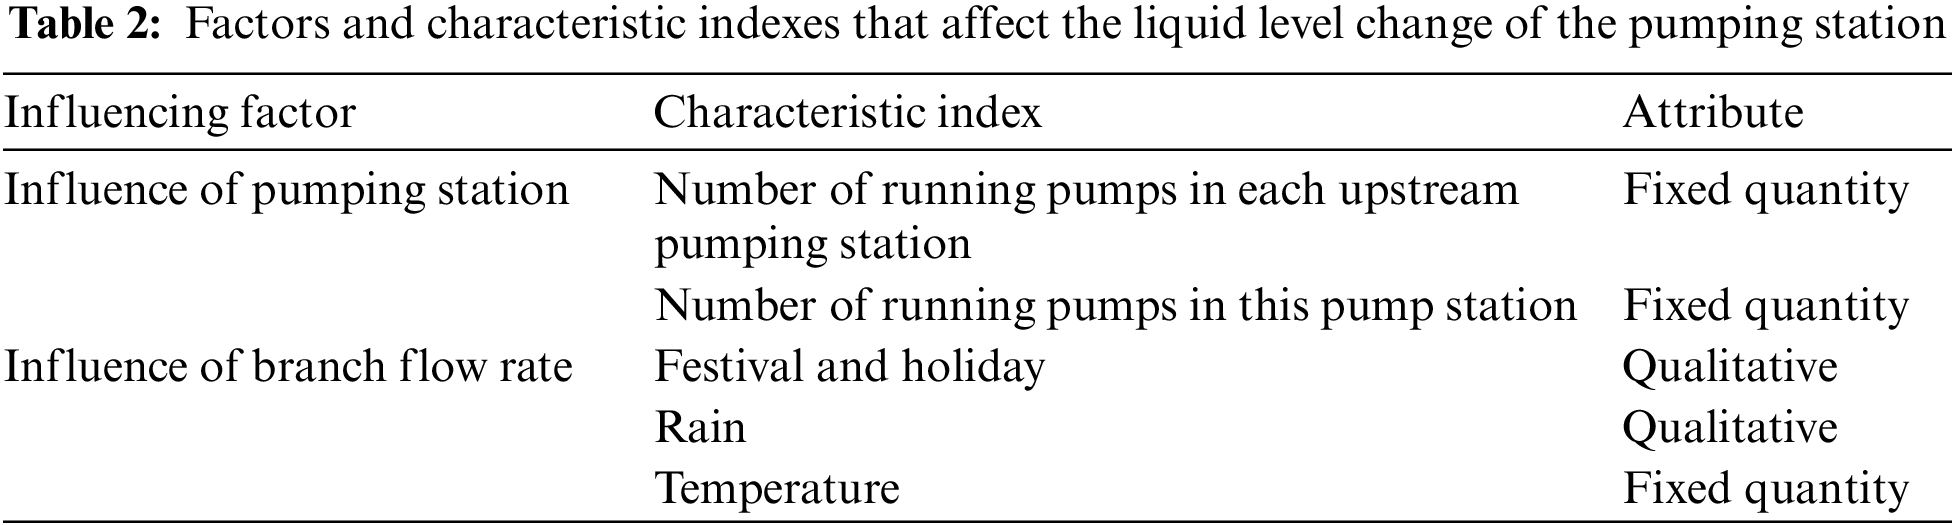
It can be seen from the above analysis that the liquid level value at the next moment is related to the current liquid level, the displacement of the liquid level pumping station, the sewage quantity of the upstream pumping station and the inflow of the branch pipe. According to the nature of data, it can be divided into two categories, as shown in Table 2. The discharge capacity of this pumping station and the lifting capacity of the upstream pumping station can be obtained by calculating the number and power of the starting pumps of the upstream and downstream pumping stations. The inflow of branch pipes cannot be obtained directly, so the weather, holidays and other factors that affect the inflow of branch pipes are taken as indirect factors that affect the liquid level of the pumping station.
Grey relational analysis can quantitatively describe the similarity of these two factors with time. If the trends of the two factors are consistent, the correlation is high. Otherwise, the correlation is low. The specific analysis steps are as follows:
(1) determining a reference sequence and a comparison sequence
Set the downstream pump station water level sequence as the reference sequence:
Comparison series is the time series corresponding to influencing factors. Assuming that there are m influencing factors of pump station liquid level, the vector matrix corresponding to these m time series can be represented by the following formula:
(2) dimensionless treatment
Different time series in the model usually represent different practical meanings and orders of magnitude between urban pipe networks, so there is a certain theoretical basis for dimensionless processing of the series. The dimensionless formula can be expressed as:
(3) Calculate the grey correlation coefficient.
All comparison series need to calculate the grey correlation coefficient with the reference series, and the calculation formula is as follows:
Among them
3.5 Model Parameter Setting and Evaluation Index
Because the internal structure of neural network is too complex, there is no specific theory to calculate the parameters of LSTM model. Generally speaking, the best parameters are determined by repeated experiments. However, from the initial stage of modeling, the number of hidden layers, the length of historical control information Nu and the length of state information Ns have great influence on the prediction performance of the model, while other parameters can be optimized after the above parameters are determined. If the parameters are adjusted many times but the prediction performance of the model is not improved, it means that the structure of the model is not properly selected, and it is necessary to consider re-modeling. On the reconstructed model, a lot of repeated experiments are carried out to adjust the parameters until they are optimal.
There are many parameters that need to be set in LSTM model. Next, the value range and function of several key parameters are briefly introduced. And the length of history and status, that is, the maximum input time is 30 min. If the input time is too long, the model will learn some useless features, while if the input time is too short, the model will not be able to learn all the key information. The number of hidden layers ∈ [1, 5], too few hidden layers will lead to insufficient feature learning ability and information processing ability of the model, while too many hidden layers will complicate the model; The number of neurons ∈ [1, 50], the number of neurons determines the learning ability of the network, if the number is too large, it will lead to the failure of model fitting; Iteration times Epoch ∈ [5003000], if the iteration times are less than the target times, the model fitting will fail, while too many iterations will lead to longer training time and no improvement of model accuracy; The batch size Batch_ sice ∈ [1 1, 300] determines the gradient descending direction during training. If the Batch_ sice is too small, the network training speed is slow and it is not easy to converge, while if the batch _ sice is too large, it is easy to converge to some bad local optima. In order to test the fitting effect of LSTM model, Mean Absolute Percentage Error (MAPE) (square root error RMSE) and average absolute error are used in this paper, and the average error is used to test the prediction accuracy of LSTM model. The closer the test error is to 0, the higher the test accuracy of the model is. Since the prediction model will be used for real-time monitoring of pumping stations, the evaluation requirements of inflection point tracking accuracy are put forward, and the evaluation index β of inflection point tracking error is set. The calculation formula of each index is as follows:
Definition of inflection point: if the second derivative of measured data series of pump station liquid level changes from positive to negative at a certain point, it is defined as the peak point of pump station liquid level, and if the second derivative changes from negative to positive at a certain point, it is defined as the bottom point of pump station liquid level.
The research object of this paper is XM pumping station of a sewage pipeline in B city, and the experimental data comes from Supervisory Control And Data Acquisition (SCADA) database of drainage network in this city. The data is from 0: 00 on June 24th, 2021 to 24: 00 on June 29th, 2022. Liquid level data and pump start-stop signals of XM pump station in this sewage line (the number of pumps running at the same time in the pump station, such as 0, 1, 2, 3 and 4, will be adjusted to non-integer pumps according to the working frequency of variable frequency pumps), and the pump start-stop signals of the four upstream pump stations. The sampling period of this part of data is 1 min. Study the daily weather and holiday data of this area, and the sampling period of this part of data is 24 h. Then, the daily data in the database are counted, and the data of those days with less than 1440 data are processed by the missing data processing method in combination with the actual situation.
(1) If most of the data is missing and difficult to recover, the data of this day can be discarded, because this kind of modeling does not need daily data.
(2) If the missing data is liquid level data, it can be done by linear interpolation according to the front and back liquid levels.
(3) If the missing data is pump start-stop data, since the pump start-stop is judged according to the liquid level, the number of pumps in the missing data can be determined according to the pump liquid level of the missing data.
(4) If the data at the beginning or end of one day is missing, it can be supplemented by the second or third methods according to the data at the end of the previous day or the beginning of the next day.
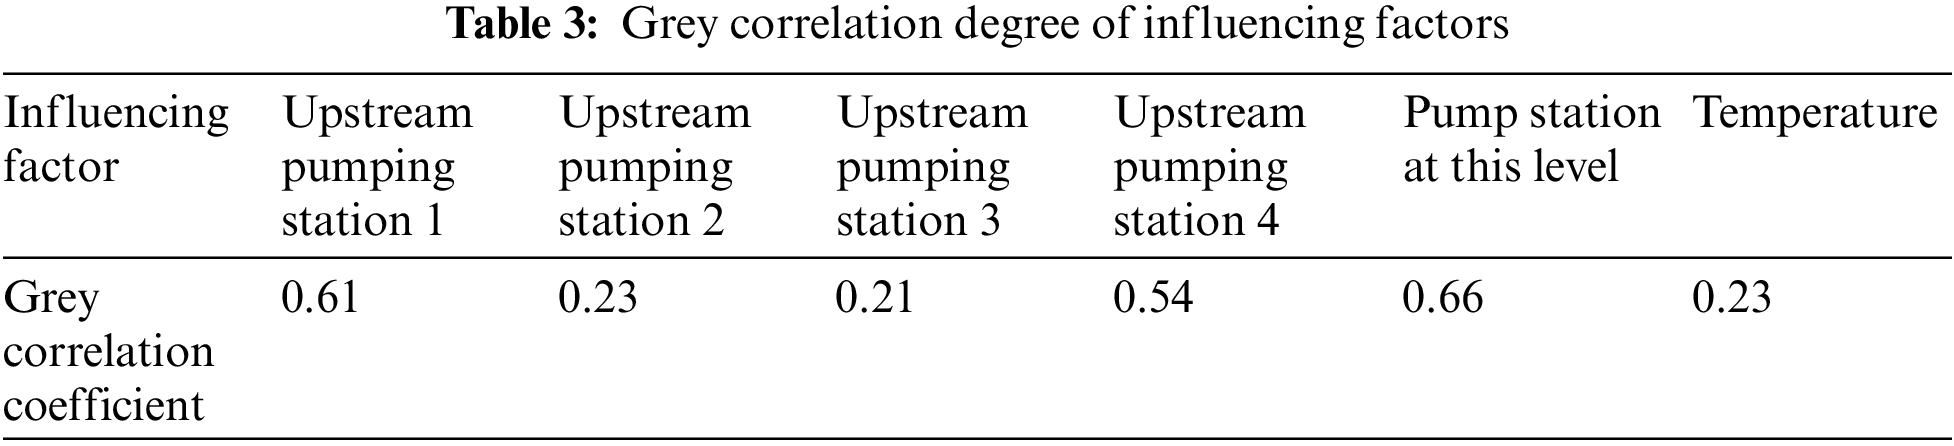
4.1 Calculate the Grey Correlation Coefficient
As can be seen from Table 3, among all the influencing factors, the correlation between upstream pump station 1 and upstream pump station 4 and the sewage level of the terminal pump station is large, while the correlation between upstream pump station 2 and upstream pump station 3 is small. Compared with the measured data, it is consistent with the actual situation. The sewage discharge of upstream pumping stations 2 and 3 is only 16% of that of upstream pumping stations 1 and 4, which has little influence on the sewage level of XM pumping station. However, the overall correlation degree between the second type of influencing factors is not high, which may be because this forecast is a short-term forecast, and these influencing factors often do not change significantly in a short time, resulting in a small correlation degree between these influencing factors and the liquid level of Extended Module (XM) pump station in this modeling. Therefore, the start-stop signal of upstream pump station 1, the start-stop signal of upstream pump station 4, the start-stop signal of XM pump station and the historical liquid level value are taken as the input variables of the prediction model.
4.2 Time Delay Calculation of LSTM Research Area
The determination of input duration is very important. If the input time is too short, the model may not be available. All the key information makes the training effect of the model very poor. However, if the input time is too long, the input data may contain some useless information, which will also make the training effect worse. In this study, the time lag between the upstream pumping station and the downstream pumping station is fully considered to determine the input information length of the model. Calculate the correlation coefficient R between the liquid levels of four upstream pumping stations and downstream pumping stations respectively. The calculated statistical results are shown in Figs. 5–10 show the peak and minimum values of the correlation coefficient R between the liquid levels of four upstream pumping stations and downstream pumping stations:
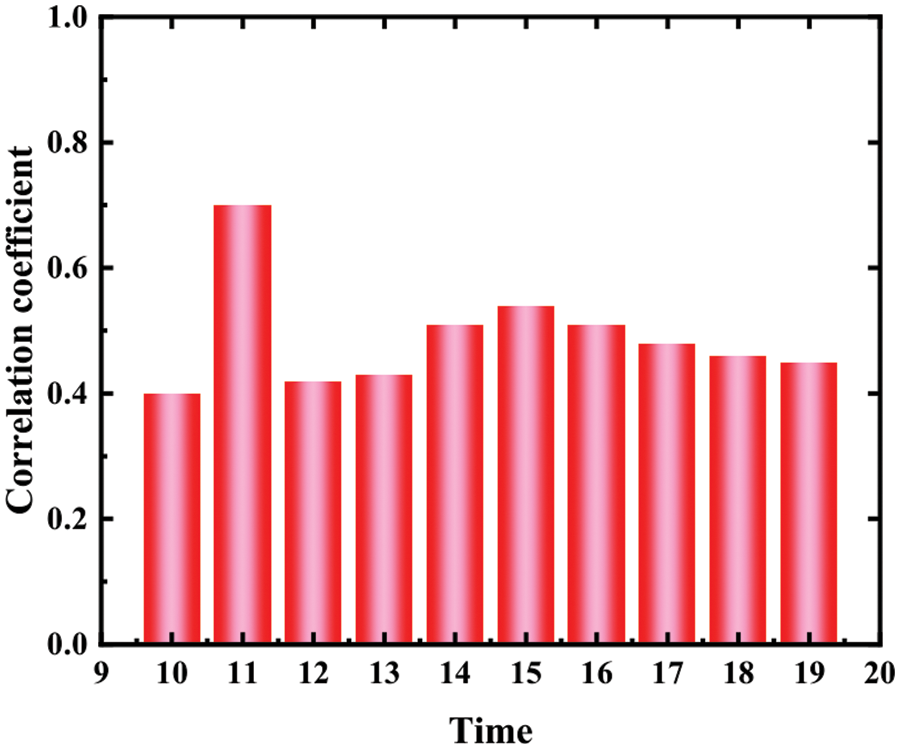
Figure 5: Correlation coefficient between upstream pump station 1 and pump station liquid level
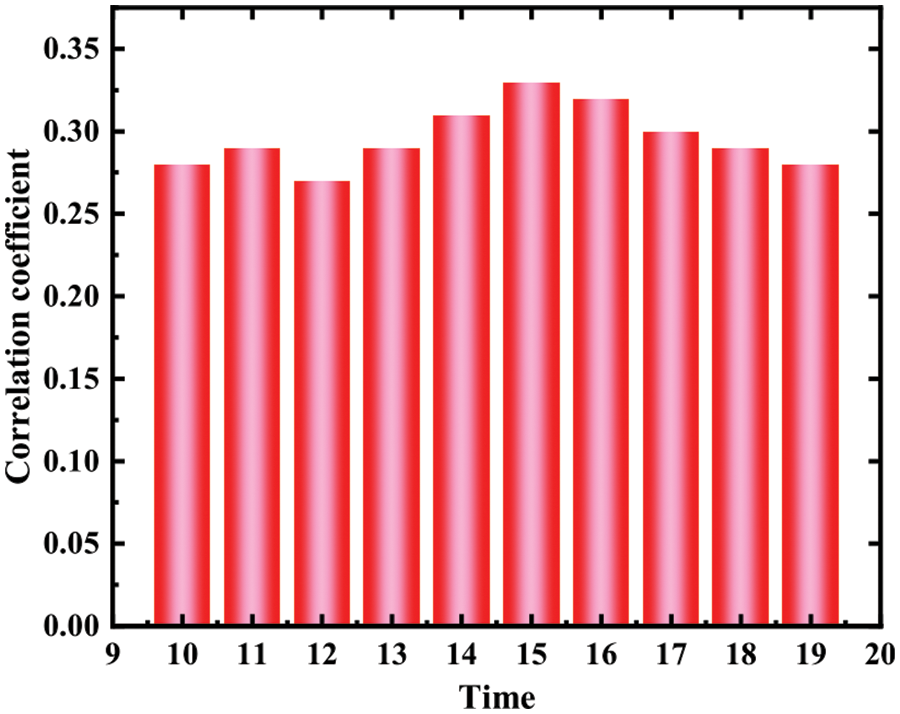
Figure 6: Correlation coefficient between upstream pump station 2 and pump station liquid level
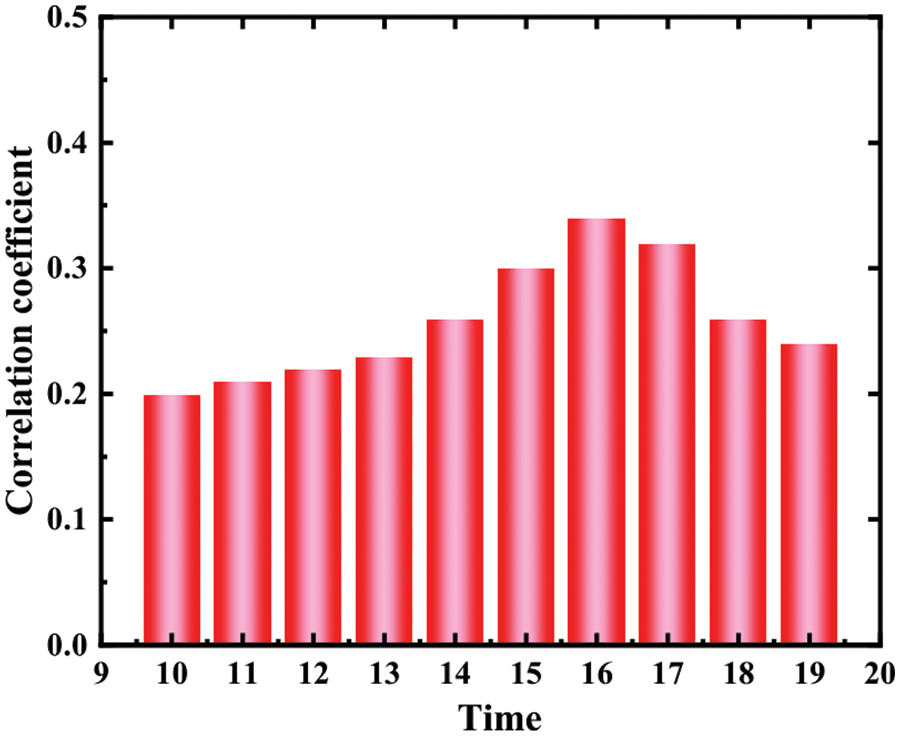
Figure 7: Correlation coefficient between upstream pump station 3 and pump station liquid level
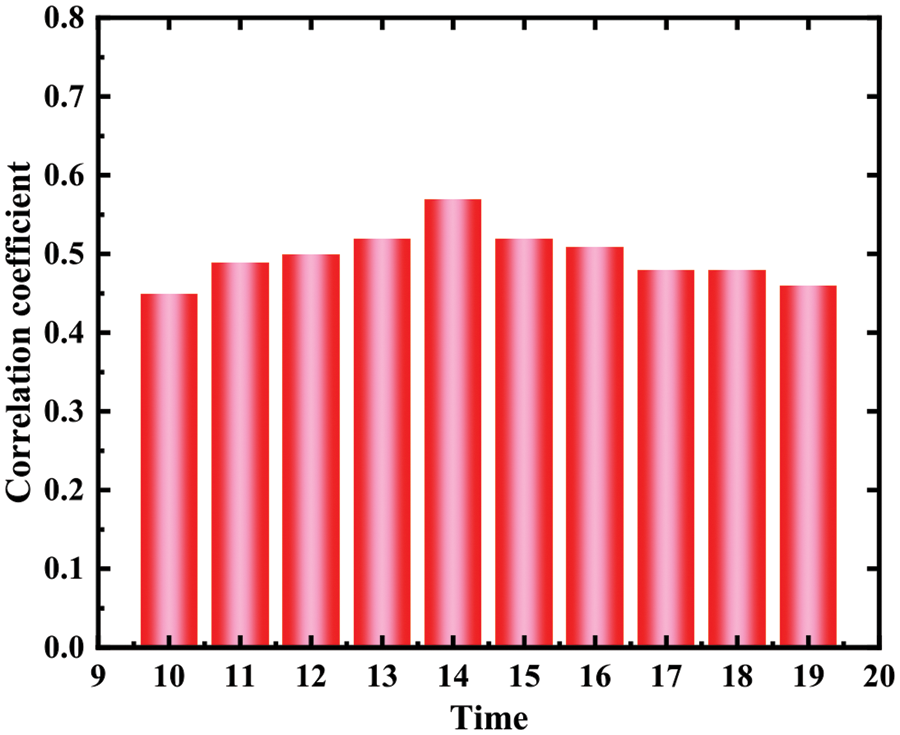
Figure 8: Correlation coefficient between upstream pump station 4 and pump station liquid level
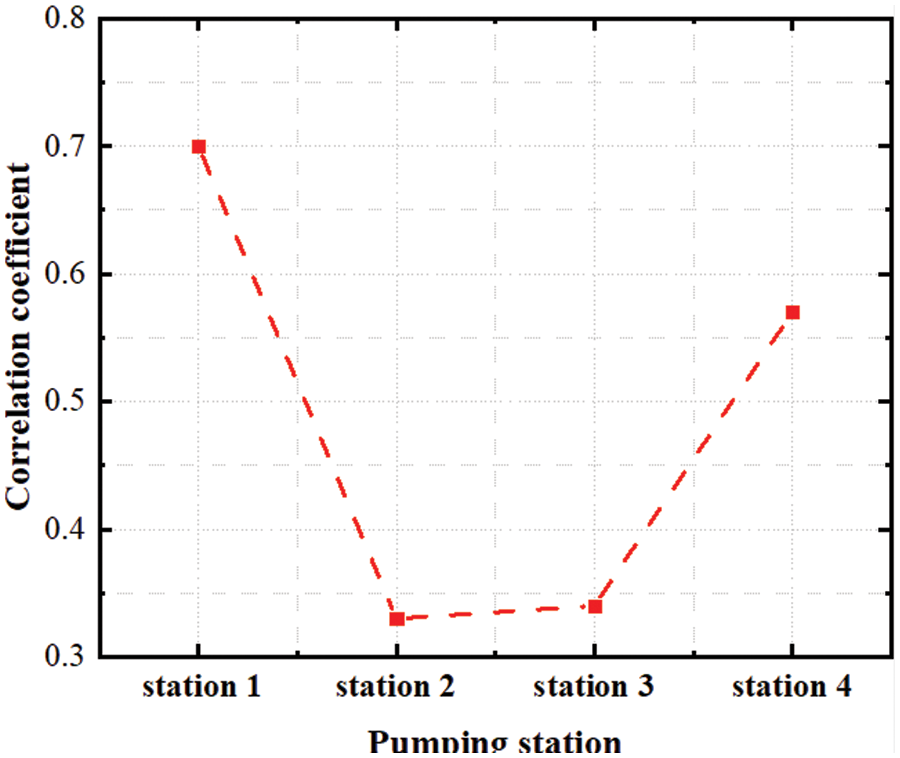
Figure 9: Peak value of correlation coefficient between pump station and pump station level
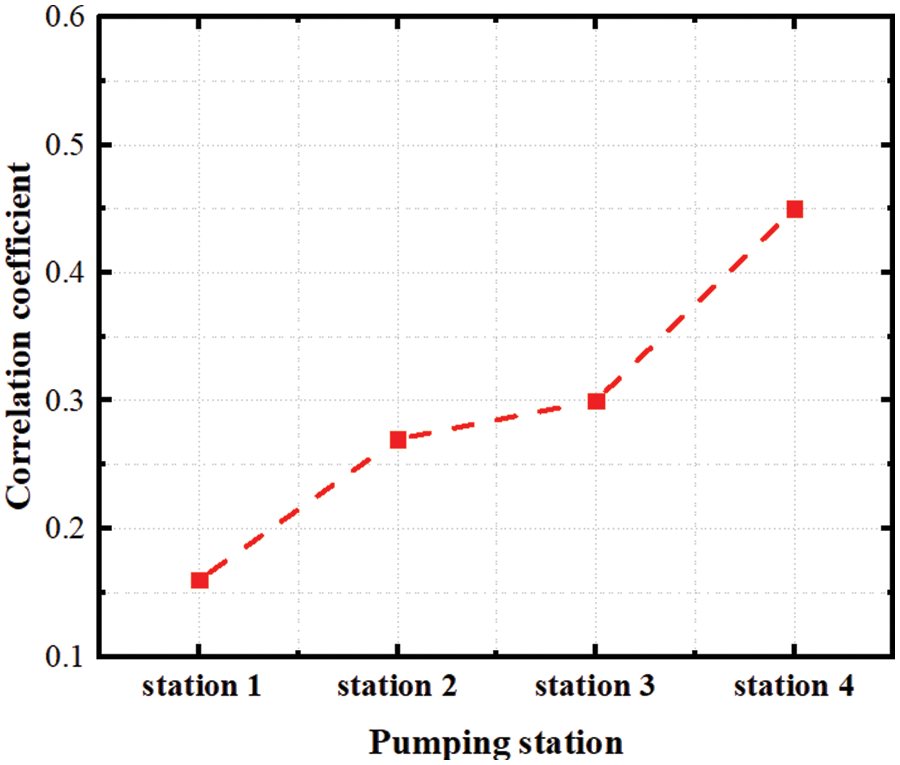
Figure 10: Minimum value of correlation coefficient between pump station and pump station level
Figs. 5–8 respectively shows Pearson correlation coefficient between the opening times of four upstream pumping stations at different times and the liquid level of downstream pumping station at time T. According to the calculation results, it can be found that the correlation coefficients of upstream pump station 1, upstream pump station 4 and XM liquid level pump station are the highest at t-15 and t-9, respectively. This result shows that the time lag between upstream pump station 1 and XM pump station is about 15 min, that is, it takes about 15 min for the sewage lifted from upstream pump station to reach XM pump station, and the time lag between upstream pump station 4 and XM pump station is about 9 min. However, the overall correlation coefficient between upstream pump station 2 and upstream pump station 3 is low, indicating that the correlation degree with XM pump station level is not large, which is the same as the previous grey correlation analysis result.
5 Optimal Design of Complex Urban Drainage Network
5.1 Planning Standards and Contents of Urban Comprehensive Drainage Network
Before upgrading the urban comprehensive drainage network, the transformation personnel must thoroughly understand the specific situation of the urban comprehensive drainage network, and determine the material type, vertical design elevation and overall reasonable layout of the network. By comparing the city’s own water consumption, rainfall and large flow, the comprehensive drainage network of the city is upgraded. With the definition standard as the basic requirement, the urban comprehensive drainage network should be rationally planned, designed, updated and reformed, so as to ensure the safe operation and safety of the urban comprehensive drainage network system. At the present stage, according to the records of the construction log of China’s urban comprehensive drainage pipe network, it is found that some key core concepts are introduced into the design of the pipe network, and the upper limit of the construction standard of the local pipe network should be raised according to local conditions. The problems revealed by earlier urban underground pipe network planning and design are insufficient understanding of the current situation. Secondly, the pipe network planning method is not single, and it is difficult to grasp the preliminary selection of the scheme. In the modeling and analysis of solid model, it is difficult to meet the dynamic change standard because of the lack of relevant theories and supporting points of field data. For cities with perfect regulations, the next thing to do is to speed up the pace of intelligentization of urban pipe network and the basic facilities construction of intelligent software, check and display the design data of urban sewage drainage pipe network dynamically in time, complete the transformation of urban sewage drainage pipe network planning and design from disorder to precise and clear discharge, and create new possibilities in planning and design. The design of urban sewage discharge pipe network refers to determining the location and business size of factories and sewage treatment stations under certain specifications, and establishing a perfect solid model on this basis. Calculate its running state, and design a network intelligent design scheme with energy saving, low investment and high stability. The perfection of pipe network layout is the foundation and premise of urban water supply and drainage pipe network planning, and the rationalization of pipe network layout will further ensure the rationality and stability of water supply and drainage system software operation. When upgrading the layout of the whole pipe network, it is necessary to partition the power supply system, strengthen the diversity of power supply modes and upgrade the diversity of drainage pipeline operation, and effectively set the position of booster station to ensure that the requirements of urban drainage can be met and the consumption brought by the whole process of system operation can be reduced. If the diameter of the designed drain pipe is too small, the pump power will be increased, and the risk of cracking and energy consumption will be increased in the whole process of the drain pipe. If the diameter of the designed drainage pipe network is too large, it will greatly increase the cost of infrastructure projects; At the same time, the diameter of the drainage pipe network is too small, which will lead to the untimely discharge of industrial wastewater, which will lead to urban waterlogging and industrial wastewater overflow. Therefore, in the whole process of pipe diameter design of water supply and drainage network, the relative solid model should be used for analysis and calculation.
5.2 Optimal Design of Drainage Pipe Network
The optimal design of drainage pipe network is an important work, which plays a very important role in urban sewage discharge and urban beautification. Nowadays, many local governments have many problems in the aspects of preparation before resettlement, on-site supervision during resettlement and inspection when resettlement is completed. In the early stage of pipe network resettlement, the main problems are that the relevant drawings of pipe network resettlement project are not carefully checked, the construction organization arrangement is unreasonable and not detailed enough, and the pipeline network resettlement design route is not clear enough. The problems in resettlement are mainly reflected in the inaction of on-site management personnel and the unqualified quality of related materials.
Before upgrading, the designer must thoroughly understand the details of the sewage supply network, and first determine the materials, vertical design elevation and overall reasonable layout of the network. Compare the large water consumption, large rainfall and large flow of urban industry and residents themselves, and upgrade the sewage supply network. Re-planning and designing the sewage supply network based on the defined standards. The optimization of urban drainage system refers to the optimization design and calculation of sewage drainage system under a given pipeline, mainly optimizing the design parameters of pipe diameter, buried depth and different pipe sections. For the designed pipe section, there are many combinations of pipe diameter and buried depth that meet the requirements of design specifications when determining the flow rate. In these combinations, if the pipe diameter is large, the slope is small, the buried depth of the pipeline is small, the construction cost is low, and the pipeline cost is high; On the contrary, the opposite is true. Therefore, for a section of pipeline, there is always a combination of pipe diameter and buried depth, which can minimize the investment. How to coordinate the relationship between the two needs to be determined according to the actual situation. For the optimization of pipeline parameters when the pipeline layout is fixed, there are two optimization methods: indirect optimization method and direct optimization method.
After the completion of planning and design and pipeline layout, many experts at home and abroad have done a lot of research on the optimal design of sewage pipe network, and have worked out a large number of practical methods, and at the same time have achieved fruitful academic results. Through the summary, it is found that there are two upgrading methods of drainage network: direct upgrading and indirect upgrading. The so-called direct upgrading refers to the direct selection, calculation and comparison of various schemes or adjustable parameters according to the change of performance index of drainage network, so as to obtain the optimal solution, while the indirect upgrading is also called analysis and optimization. It is a mathematical model based on the optimal design of drainage network. Through the optimization calculation of the model, the optimal solution of drainage network design can be obtained.
The quality control of urban water supply and drainage engineering construction is an important social issue related to urban construction and development. The quality and safety control [29] in the construction process also ensures the construction of qualified pipe network system. At present, the current situation of quality control of urban water supply and drainage engineering construction in China requires that the design of water supply and drainage system should start from the perspective of providing services for residents, adhere to the people-oriented concept, and ensure that drainage channels are not blocked. Strengthen the monitoring [30] of the whole process of sewage system construction and comprehensively monitor the construction quality. In addition, water supply and drainage engineering construction enterprises should deeply realize the importance of strengthening quality control and fully realize the economic and social benefits of engineering construction. Urban water supply and drainage system is an important part of modern city. The construction quality of urban water supply and drainage engineering is not only related to the normal operation of the city, but also related to the life of citizens. In view of the above prevention and management measures, it is very important to develop high-quality municipal water supply and drainage business.
Aiming at the uncertainty and nonlinearity of sewage flow in the drainage network, the grey correlation method is used to determine the main factors affecting the water level of the pumping station, and the delay information is obtained through correlation analysis. To solve this problem, a water level prediction model based on LSTM is established. Compared with the least squares support vector machine, ELMAN, BP and other prediction models, it is proved that the LSTM model not only has higher prediction accuracy, but also has better inflection point tracking performance. The accuracy of predicting the amplitude and inflection point of sewage water level in pumping stations lays a foundation for the next optimal control of pumping stations. The accuracy of the proposed work shall be enhanced with the introduction of novel optimization algorithms.
Funding Statement: The authors received no specific funding for this study.
Conflicts of Interest: The authors declare that they have no conflicts of interest to report regarding the present study.
References
1. Z. Wang, J. Xu, X. He and Y. Wang, “Analysis of spatiotemporal influence patterns of toxic gas monitoring concentrations in an urban drainage network based on IoT and GIS,” Pattern Recognition Letters, vol. 138, pp. 237–246, 2020. [Google Scholar]
2. J. B. Hu, X. Weng, L. Yang, S. Lei and H. Niu, “Centrifugal modeling test on failure characteristics of soil-rock mixture slope under rainfall,” Engineering Failure Analysis, vol. 142, pp. 106775, 2022. [Google Scholar]
3. A. E. Bakhshipour, M. Bakhshizadeh, U. Dittmer, W. Nowak and A. Haghighi, “A graph-theory based algorithm to generate decentralized urban drainage layouts,” in Proc. of the Int. Conf. on Urban Drainage Modelling, Springer, Cham, pp. 633–637, 2018. [Google Scholar]
4. T. Zhou, F. Yang, W. Liu and Y. Tan, “Analysis of rainwater overflow in underground pipe network,” in Proc. of the Journal of Physics: Conf. Series, IOP Publishing, China, vol. 2280, no. 1, pp. 012055, 2022. [Google Scholar]
5. A. Nedergaard Pedersen, J. Wied Pedersen, A. Vigueras-Rodriguez, A. Brink-Kjær, M. Borup et al., “The bellinge data set: Open data and models for community-wide urban drainage systems research,” Earth System Science Data, Vol. 13, no. 10, pp. 4779–4798, 2021. [Google Scholar]
6. C. Thrysøe, K. Arnbjerg-Nielsen and M. Borup, “Identifying fit-for-purpose lumped surrogate models for large urban drainage systems using GLUE,” Journal of Hydrology, vol. 568, pp. 517–533, 2019. [Google Scholar]
7. X. Zhang, P. Zhao, Q. Hu, H. Wang, M. Ai et al., “A 3D reconstruction pipeline of urban drainage pipes based on multiview image matching using low-cost panoramic video cameras,” Water, vol. 11, no. 10, pp. 2101, 2019. [Google Scholar]
8. A. E. Bakhshipour, M. Bakhshizadeh, U. Dittmer, A. Haghighi and W. Nowak, “Hanging gardens algorithm to generate decentralized layouts for the optimization of urban drainage systems,” Journal of Water Resources Planning and Management, vol. 145, no. 9, pp. 04019034, 2019. [Google Scholar]
9. K. Chandale and K. A. Patil, “Basin delineation and land use classification for a storm water drainage network model using GIS, in Proc of the Recent Trends in Construction Technology and Management, Singapore: Springer, pp. 561–570, 2023. [Google Scholar]
10. A. E. Bakhshipour, U. Dittmer, A. Haghighi and W. Nowak, “Toward sustainable urban drainage infrastructure planning: A combined multi objective optimization and multicriteria decision-making platform,” Journal of Water Resources Planning and Management, vol. 147, no. 8, pp. 04021049, 2021. [Google Scholar]
11. M. Sambito and G. Freni, “Strategies for improving optimal positioning of quality sensors in urban drainage systems for non-conservative contaminants,” Water, vol. 13, no. 7, pp. 934, 2021. [Google Scholar]
12. U. A. Ngamalieu-Nengoue, P. L. Iglesias-Rey, F. J. Martínez-Solano, D. Mora-Meliá and J. G. Saldarriaga Valderrama, “Urban drainage network rehabilitation considering storm tank installation and pipe substitution, Water, vol. 11, no. 3, pp. 515, 2019. [Google Scholar]
13. E. Lähde, A. Khadka, O. Tahvonen and T. Kokkonen, “Can we really have it all?—Designing multifunctionality with sustainable urban drainage system elements,” Sustainability, vol. 11, no. 7, pp. 1854, 2019. [Google Scholar]
14. X. Duan, W. He, Y. Wang, Q. Liu, Y. Tian et al., “Optimization design method of a large-scale multilevel gravity drip irrigation pipe network system based on atom search optimization,” Journal of Irrigation and Drainage Engineering, vol. 148, no. 7, pp. 04022023, 2022. [Google Scholar]
15. I. M. Kourtis and V. A. Tsihrintzis, “Adaptation of urban drainage networks to climate change: A review,” Science of the Total Environment, vol. 771, pp. 145431, 2021. [Google Scholar] [PubMed]
16. N. Jia, R. Sitzenfrei, W. Rauch, S. Liang and Y. Liu, “Effects of urban forms on separate drainage systems: A virtual city perspective,” Water, vol. 11, no. 4, pp. 758, 2019. [Google Scholar]
17. X. Dong, H. Guo and S. Zeng, “Enhancing future resilience in urban drainage system: Green versus grey infrastructure,” Water Research, vol. 124, pp. 280–289, 2017. [Google Scholar] [PubMed]
18. P. Ferrans, M. N. Torres, J. Temprano and J. P. R. Sánchez, “Sustainable urban drainage system (SUDS) modeling supporting decision-making: A systematic quantitative review,” Science of the Total Environment, vol. 806, pp. 150447, 2022. [Google Scholar] [PubMed]
19. D. Zhang, X. Dong and S. Zeng, “Exploring the structural factors of resilience in urban drainage systems: A large-scale stochastic computational experiment,” Water Research, vol. 188, pp. 116475, 2021. [Google Scholar] [PubMed]
20. K. L. Keung, C. K. M. Lee, K. K. H. Ng and C. K. Yeung, “Smart city application and analysis: Real-time urban drainage monitoring by iot sensors: A case study of Hong Kong,” in Proc. of the Int. Conf. on Industrial Engineering and Engineering Management (IEEM), IEEE, Bangkok, Thailand, pp. 521–525, 2018. [Google Scholar]
21. A. Ortiz, M. J. Velasco, O. Esbri, V. Medina and B. Russo, “The economic impact of climate change on urban drainage master planning in Barcelona,” Sustainability, vol. 13, no. 1, pp. 71, 2020. [Google Scholar]
22. E. H. Lee and J. H. Kim, “Development of a reliability index considering flood damage for urban drainage systems,” KSCE Journal of Civil Engineering, vol. 23, no. 4, pp. 1872–1880, 2019. [Google Scholar]
23. Y. Guan, X. Yan, Y. Shang, Z. Fang and S. Ren, “Influence of vent pipe bottom connection position on the discharge capacity of two building drainage pipe systems,” Journal of Pipeline Systems Engineering and Practice, vol. 13, no. 4, pp. 04022036, 2022. [Google Scholar]
24. G. C. Guptha, S. Swain, N. Al-Ansari, A. K. Taloor and D. Dayal, “Assessing the role of SuDS in resilience enhancement of urban drainage system: A case study of Gurugram city, India,” Urban Climate, vol. 41, pp. 101075, 2022. [Google Scholar]
25. Z. Fang, Y. Wang, L. Peng and H. Hong, “Predicting flood susceptibility using LSTM neural networks,” Journal of Hydrology, vol. 594, pp. 125734, 2021. [Google Scholar]
26. N. Jin, F. Yang, Y. Mo, Y. Zeng, X. Zhou et al., “Highly accurate energy consumption forecasting model based on parallel LSTM neural networks,” Advanced Engineering Informatics, vol. 51, pp. 101442, 2022. [Google Scholar]
27. H. Tian, P. Wang, K. Tansey, J. Zhang, S. Zhang et al., “An LSTM neural network for improving wheat yield estimates by integrating remote sensing data and meteorological data in the Guanzhong plain, PR China. Agricultural and Forest Meteorology, vol. 310, pp. 108629, 2021. [Google Scholar]
28. R. Huang, C. Wei, B. Wang, J. Yang, X. Xu et al., “Well performance prediction based on long short-term memory (LSTM) neural network,” Journal of Petroleum Science and Engineering, vol. 208, pp. 109686, 2022. [Google Scholar]
29. E. -S. M. El-kenawy, A. Ibrahim, N. Bailek, B. Kada, M. Hassan et al., “Sunshine duration measurements and predictions in Saharan Algeria region: An improved ensemble learning approach,” Theoretical and Applied Climatology, vol. 147, pp. 1015–1031, 2022. [Google Scholar]
30. P. Harineeshwari and D. Prabakaran, “Design of H-shaped antenna for multiband applications,” in IEEE Int. Conf. on Data Science and Information System (ICDSIS), Hassan, India, 2022, pp. 1–6. [Google Scholar]
Cite This Article
 Copyright © 2023 The Author(s). Published by Tech Science Press.
This work is licensed under a Creative Commons Attribution 4.0 International License , which permits unrestricted use, distribution, and reproduction in any medium, provided the original work is properly cited.
 Downloads
 Citation Tools