
 Submit a Paper
 Propose a Special lssue
 Open Access
ARTICLE

Hybrid Power Bank Deployment Model for Energy Supply Coverage Optimization in Industrial Wireless Sensor Network
1 School of Mechanical and Electrical Engineering, University of Electronic Science and Technology of China, Chengdu, Sichuan, 611731, China
2 Department of Electrical and Computer Engineering, University of Alberta, Edmonton, AB T6G 1H9, Canada
* Corresponding Author: Hang Yang. Email:
Intelligent Automation & Soft Computing 2023, 37(2), 1531-1551. https://doi.org/10.32604/iasc.2023.039256
Received 18 January 2023; Accepted 10 March 2023; Issue published 21 June 2023
 View Full Text
 Download PDF
Abstract
Energy supply is one of the most critical challenges of wireless sensor networks (WSNs) and industrial wireless sensor networks (IWSNs). While research on coverage optimization problem (COP) centers on the network’s monitoring coverage, this research focuses on the power banks’ energy supply coverage. The study of 2-D and 3-D spaces is typical in IWSN, with the realistic environment being more complex with obstacles (i.e., machines). A 3-D surface is the field of interest (FOI) in this work with the established hybrid power bank deployment model for the energy supply COP optimization of IWSN. The hybrid power bank deployment model is highly adaptive and flexible for new or existing plants already using the IWSN system. The model improves the power supply to a more considerable extent with the least number of power bank deployments. The main innovation in this work is the utilization of a more practical surface model with obstacles and training while improving the convergence speed and quality of the heuristic algorithm. An overall probabilistic coverage rate analysis of every point on the FOI is provided, not limiting the scope to target points or areas. Bresenham’s algorithm is extended from 2-D to 3-D surface to enhance the probabilistic covering model for coverage measurement. A dynamic search strategy (DSS) is proposed to modify the artificial bee colony (ABC) and balance the exploration and exploitation ability for better convergence toward eliminating NP-hard deployment problems. Further, the cellular automata (CA) is utilized to enhance the convergence speed. The case study based on two typical FOI in the IWSN shows that the CA scheme effectively speeds up the optimization process. Comparative experiments are conducted on four benchmark functions to validate the effectiveness of the proposed method. The experimental results show that the proposed algorithm outperforms the ABC and gbest-guided ABC (GABC) algorithms. The results show that the proposed energy coverage optimization method based on the hybrid power bank deployment model generates more accurate results than the results obtained by similar algorithms (i.e., ABC, GABC). The proposed model is, therefore, effective and efficient for optimization in the IWSN.Keywords
With the rapid development of modern manufacturing, there is a shift from simple production to intelligent production. Since the factory has its complexity and needs to keep its originality of guaranteeing the running of the production line, adding a traditional cable network is not advisable. The wiring could interfere with the existing process and require the production line to be transformed into a new factory. Thus, there is a high demand for IWSN-enabled intelligent production, which helps monitor the manufacturing process and sets actual databases for future upgrades. Various IWSN applications require deploying different sensor devices to monitor the production line for other purposes. Since the sensor devices must operate and monitor continuously, the power supply becomes a limitation; powering the sensor devices with batteries requires future replacement, recharging, and maintenance, which is not convenient and may miss the detection of some typical parameters. With the booming expansion of efficient printing circuits and the fabrication of highly-integrated devices, the application of powering devices by radio-frequency (RF) is essential for inspiring the use of RF-enabled sensor devices in industries.
Regarding energy harvesting, the sensor devices can only harvest energy within a certain distance from the power banks. The power banks are equipped with grid power and can send RF signals at a fixed capacity. The hybrid power bank operates on RF and uses it to propagate energy to the devices in the deployment area. Many existing works in the literature assumed the range as a circle with a fixed radius, ignoring the influence of the ambient environment and deviating from reality. In contrast, we propose a probabilistic model which improves the accuracy of the harvest range, taking into consideration the influence of obstacles in the environment. Particularly in terms of the geometric plane distance, we focus on the interference of the RF signal from the three-dimensional(3-D) surface. Generally, there exist machines, semi-finished products, carrier boxes, pieces of furniture, and operators in the production line, and they all interfere with the RF signal to the degree that cannot be ignored.
The topic of energy supply coverage has quickly become one of the most attractive variables determining the quality of service in IWSNs. The power bank can serve the sensor devices within their coverage range while all current sensor devices, FOI, and coverage areas are known. Due to the dynamic nature of IWSN, and the sensor devices being self-configurable and able to be online automatically and opportunistically, it is possible to target the overall energy supply coverage. Because the power banks are always online and the interference of the RF signal is dynamic, the coverage rate of a particular point is not deterministic but based on presumptions. However, once a sensor device of the IWSN is deployed, the coverage probability can be determined according to its physical location following the hybrid power bank deployment model. The purpose of studying the energy supply coverage is to find the optimal least number of power banks which not only powers the current sensor devices but also reserve redundancy for the future development of IWSN while guaranteeing the operation of the IWSN.
In the IWSN, coverage, connectivity, and routing are the typical factors to be considered. We focus on the power supply coverage of the IWSN in this research work. The minimum number of power banks and their deployment locations is determined before the deployment of the sensor devices and running the IWSN. If any sensor device fails to be under the coverage area of the power banks, it will not function properly and be disconnected from its application network. Thus the IWSN fails to accomplish its task. In this research work, we first plot the 3-D surface of the application FOI, and then deploy some of the power banks and check the power supply coverage rate of each point on the FOI. Because there exist coverage cavities, there is a need to add more power banks to fill them and calculate the power supply coverage of each point. The newly added power banks cover the coverage cavities and enhance the coverage rate of the areas around the cavities.
With all the analyses above, two critical issues arise. 1) How to mimic the real FOI and compute their coverage rate. 2) How to find the coverage cavities and fill them. First, we propose establishing a 3-D projecting model and the probabilistic model to better reflect RF signal status at the point on the 3-D surface. Second, the wavelet sub-band energy entropy is utilized with metaheuristics methods to find the cavities and decide where to deploy the new power banks, thus improving the overall coverage.
This research work lies in artificial intelligence, modelling, and systems engineering, focusing on the coverage rate of the specific targets or the target areas but expanding the scenarios in work to a broader range. The presumable coverage rate of every point on the FOI and the coverage rate of the targets or the target areas can be derived accordingly. While much of the existing research treats the FOI as a 2-D plane or 3-D space, we draw from practice that it is a 3-D surface, the power banks can only be deployed on the surface, and the RF signals cannot penetrate the surface. As illustrated in Fig. 1, treating the FOI directly as a 2-D ideal plane will ignore the coverage cavities. Hence, the proposed hybrid power bank deployment model is effective due to its flexibility for newly established plants and plants already deployed with some IWSN systems.

Figure 1: A 2-D plane showing coverage cavities in a practical application
In Fig. 1, the coverage cavities are shown in real-life applications where the deployment is implemented considering each power bank’s obstacles and coverage area.
The main contribution of this research work is given as follows:
• Design and implementation of a hybrid metaheuristics algorithm for coverage optimization.
• The FOI settings in the model are tunable, and the interferences are transferred to obstacles of the 3-D surface, which fluctuate the terrain.
• The traditional 2-D Bresenham’s algorithm [1] was extended to 3-D for line-of-sight (LOS) or non-line-of-sight (NLOS) determining of points on 3-D surfaces.
• The traditional artificial bee colony (ABC) algorithm is employed with a dynamic search strategy (DSS) for the NP-hard deployment problem. It balances the global and local search ability and cellular automata to accelerate the convergence speed, thus resulting in a better and quicker solution for power bank deployment locations.
• The comparative experiments on numerical benchmark function optimization are carried out for the artificial bee colony with a dynamic search strategy (ABC-DSS) algorithm compared to the ABC and GABC algorithms, verifying that the proposed algorithm is competitive.
The overall flow of the hybrid power bank deployment model is given in Fig. 2.

Figure 2: Overall flow of the hybrid power bank deployment model
Wireless sensor networks (WSN) are currently used in several applications, such as environmental monitoring, military surveillance, and smart cities [2–4]. Researchers have studied the COP of WSN for years w.r.t. 2-D plane [5–12], 3-D space [13–16], and 3-D terrain [17–19]. Since the sensing region of the sensors on the 2-D plane can be simplified as a disk with the deployment location as the center, the researchers used mathematical calculations to resolve the COP [7,8,12]. Note that the researchers all consider the single sensor coverage region as omnidirectional in the 2-D plane, and the directional type sensor was adopted in [13,14], a heuristic algorithm was utilized in [14], and a pyramid shape sensing type was adopted in [13]. The sensor deployment method in 3-D terrain utilized the heuristic algorithm to conquer the COP and adopted a cone-ball-shaped sensing model for precision [17,19]. There are other heuristic algorithms utilized for targeting COP issues in the literature, such as the marine predator algorithm [11], the Yin-Yang pigeon-inspired optimization algorithm [20], and the whale optimization algorithm [21].
In this paper, we study the COP of IWSN. Since the birth of the IWSNs, the network performance has been tied closely to the ambient environment or the ambient wireless conditions, especially in industrial applications. Precisely, we deploy the power banks on a 3-D surface, which not only takes the shape of the geometry terrain but also appends the interference from the ambient environment to the 3-D surface. Approximation algorithms are efficient algorithms that find approximate solutions to optimization problems (in particular NP-hard problems) with provable guarantees on the distance of the returned solution to the optimal one [22]. In setting the fundamentals of our future research, we first need to guarantee the coverage of the power supply network to maintain the energy supplement. The coverage issues can be classified roughly based on the type of solving methodology, utilizing the scheme based on the classical methods and the scheme based on metaheuristic methods. While the COP problem in the 2-D plane can be seen as a traditional art gallery problem, it becomes NP-hard when extended to 3-D space, 3-D terrain, and 3-D surface. The art gallery problem originates from a real-world problem of minimizing the number of guards guarding an art gallery, which can be optimally resolved in polynomial time [20,23]. For NP-hard problems, while inspired by genetic and biological intelligence, most heuristic methods are advanced and optimized to accomplish a particular task when the traditional mathematic methods are not appropriate. The original and greedily mentioned heuristics methods include genetic algorithms (GA) by Holland in 1992 [24], particle swarm optimization (PSO) by Eberhart and Kennedy in 1995 [25], artificial bee colony(ABC) by Karaboga in 2005 [26], ant colony optimization (ACO) by Dorigo and Blum in 2005 [27], and simulated annealing (SA) by Kirkpatrick et al. in 1983 [27,28], and differential evolution (DE) by Price et al. in 2006 [29]. Other researchers also modified or extended the original type and derived many new methods or solutions. Many comparative experiments on numerical benchmark function optimization were conducted for ABC in [26,30–32], and the experimental results reveal that ABC is competitive over some conventional heuristic optimization methods, such as GA [24,33], DE [29,34], and PSO [25,35]. Thus, in this work, we utilize three ABCs, the traditional ABC algorithm, the GABC algorithm [36], and the proposed ABC-DSS algorithm, which addresses the COP.
Several approximation algorithms and methods have been utilized in the literature for the covering models. The sensing models can be either deterministic or probabilistic. We assume the average covering range is
Some other generally adopted probabilistic models are summarized in Table 1.
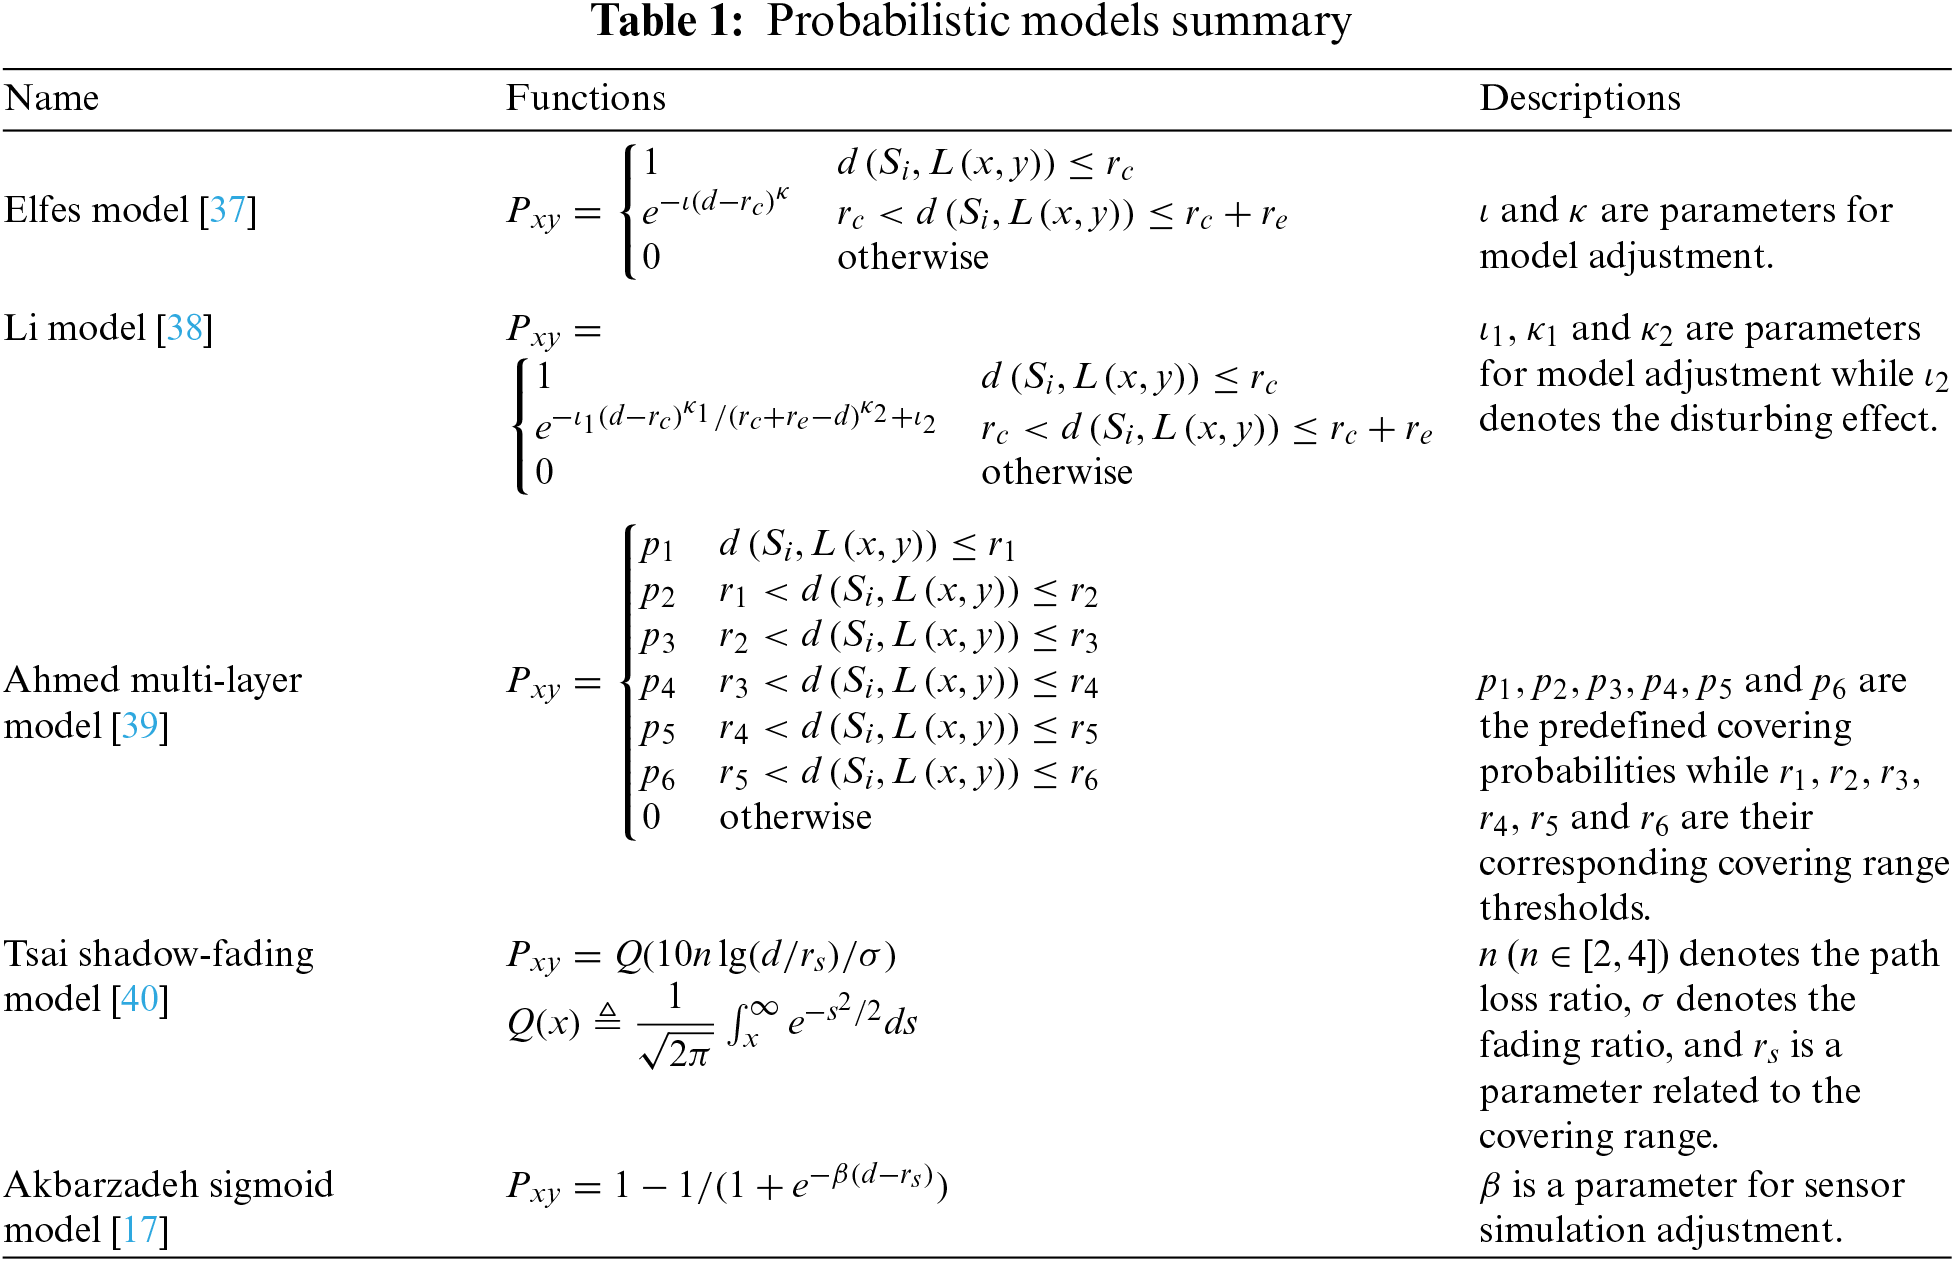
Finally, for the coverage issue, the power banks are omnidirectional to supply as many sensor nodes as possible, and the FOI is established as a 3-D surface with considering obstacles making it more adaptive for IWSN applications compared to other works in this field [12,41,42]. The problem of NP-hardness in the power bank deployment optimization is overcome with heuristic methods like ABC and its derivatives utilized in the paper, including the proposed approach. Thereafter, by adopting the hybrid power bank deployment model, the optimized power bank deployment locations can be determined and generated.
The rest of the research work is organized as follows; Section two illustrates the methodology employed and discusses the proposed algorithm, general method, and other strategies employed. The experiment conducted is further discussed in section three with comparison experiments, and section four presents the results and analysis. Section five outlines the conclusion of the research work.
2.1 Formulation of the Problem
The main objective of this research is to design and implement a hybrid power bank deployment model for energy supply coverage optimization in IWSN, which helps prepare the powering supplement of incoming installation of RF-enabled sensor tags. To closely mimic the practical industry environment, the 3-D surface with obstacles is addressed. Although the coverage rate of a particular point is not deterministic once a sensor device of the IWSN is deployed, the coverage probability can be determined according to its physical location and ambient environment. Thus, a combination of the probabilistic coverage model and the line-of-sight algorithm is typically utilized to accurately compute the covering probability of each point on the FOI, which is divided into the covered and uncovered regions accordingly. The critical point is to achieve the optimum coverage of the FOI with a minimum number of power banks, forming the NP-hard deployment problem. While addressing the NP-hard COP, a dynamic search strategy is deployed to balance the ABC algorithm’s exploration and exploitation ability, inspired by the differential evolution algorithm. The cellular automata mechanism is further introduced to solve the drawbacks of the proposed heuristic algorithm, simplify the convergence process and accelerate the convergence speed when generating the power bank deployment locations. The research is conducted to achieve optimum coverage of the FOI with a minimum number of power banks operating on RF technology, serving as the source of energy for the installation in the deployment region and minimizing the chances of fires and power outages from direct power sources. The limitation of this paper is that the RF signals are set to operate on the same spectrum. This can be improved upon in future works by expanding the spectrum of propagation to satisfy the various installations in the deployment area. The energy supplied by the RF is of the same capacity, irrespective of the required capacity needed by the installed systems in the deployment area. Future works would look at satisfying the energy requirement of each installation in the deployment area. The energy of the hybrid power banks can be in a given range from which each device can be powered according to its corresponding capacity.
Physical obstacles like machines and manufacturing materials in the deployment area all impact electromagnetic waves’ propagation. Instead of ignoring this, we add their interference to the 3-D surface as part of the ambient environment parameter. The 3-D surface model with fluctuation is utilized to mimic the actual environment in the industry as close as possible, as shown in Fig. 2. Due to the fading and shadowing effects of the electromagnetic waves caused by the surrounding obstacles, and the covering range is thus affected. Nevertheless, the surface can be represented by adopting the traditional Cartesian coordinate system for simplicity as
Due to the existence of obstacles, such as machines and carrier boxes in the production line, the RF energy sent by the power bank can be blocked. In the LOS method, either no obstacles reside between the antenna and the system, or there is a partial obstruction. However, in NLOS, there is a full obstruction between the antenna and the system. For indoor wireless network installations, it is important to consider obstacles such as walls, ceilings, and furniture affecting LOS since these all play a role in wireless signal reception. The utilization of the LOS method is illustrated in Fig. 3.

Figure 3: Illustration of LOS and NLOS
A point on the surface is covered only when it is within the range of one or more power banks’ coverage. To determine whether each point is on the surface, a probabilistic covering model is utilized to form a mathematical formula considering the characterization of the point coverage rate as a function of distance and other ambient environmental objects.
First, the average coverage range is defined as
where
Bresenham’s algorithm is extended from 2-D to 3-D to differentiate between the node
Assuming the point at
Next, the optimal location choice for the point
These calculations are conducted recursively for each
As mentioned earlier, the above calculations assume that

After all the above calculations, the FOI is divided into the covered and uncovered regions. The covered area refers to the points covered by one or more power banks, while the uncovered area refers to the points beyond all the power banks’ covering range. The uncovered can be visualized as the cavities on the surface and in the quality of network coverage (QoNC) matrix. The DB6 wavelet is adopted to decompose the separable into an approximation image and three detailed images in finding the coverage cavities. Then, by taking the matrix’s discrete wavelet transform (DWT) iteratively, the overall QoNC indicates the coverage probability provided by the corresponding power banks at each point.
The QoNC for the FOI can be formulated as:
where
Since many points may be under several nodes’ covering range, a scheme is defined when nodes cover a point to modify the probabilistic covering model further to be more accurate. The modified probabilistic covering model is given as:
After all the computations, the probabilistic coverage index is formed for each point as a matrix. For the QoNC matrix, the values of the element with an index
2.4.1 Motivations for Adopting the Heuristic Algorithms
This research aims to optimize the energy supply coverage regarding the power bank deployment strategy. After the first round of deployment of the power banks, some coverage cavities arise. The problem relates to where the extra power banks can be deployed to fill the cavities while balancing the number of power banks and the overall energy supply coverage rate. The NP-hard problem that forms can be solved by the heuristic algorithm, simulating the natural swarm’s working mechanism.
Since we have the model for power net coverage, it is natural that some efforts are made to complete the power net by implementing as few power banks as possible. To better determine the locations of the power banks, the hybrid ABC-DSS with the CA method is adopted to perform the placement optimization.
2.4.2 Overview of the ABC Algorithm
Illuminated by the natural bee swarm’s working flow, which mimics the honey bee swarm’s forgetting mechanism, Karaboga formulated the ABC algorithm to optimize the numerical functions. The ABC algorithm is a self-organized system with four outstanding characteristics: positive feedback, negative feedback, fluctuations, and multiple interactions, which makes it an attractive group optimization algorithm. A general description of the ABC algorithm is given in Algorithm 2.

For the ABC algorithm, there is only one employed bee for each food source. The starting point is set as one-half employed bees and the other half onlookers. Each employed bee is randomly nominated to one source for the first solution. Then by selecting a new candidate solution for each employed bee according to function (12), the employed bee updates its status or not by choosing better fitness acquired from each iteration.
where
When a solution cannot be further improved within a limit parameter, the scout comes out, and a new key will be randomly generated.
where
2.4.3 Overview of the Modified GABC Algorithm
For group optimization algorithms, the exploration and exploitation ability is vital to the quality of the generated solutions. The former refers to finding the optimum solution in the unknown areas in the solution domain. In contrast, the latter refers to utilizing the experiences gained from previous reasonable solutions to investigate better solutions. However, the exploration ability and the exploitation ability usually conflict with each other in practice. Balancing the two capabilities is essential in achieving a reasonably good optimization.
In the ABC algorithm, as mentioned earlier, the parameter
where
2.4.4 Overview of the Proposed Modified ABC-DSS Algorithms
Illuminated by the DE algorithm [29], Eq. (15) is rewritten as shown in Eq. (16).
Analyzing the modified ABC algorithm with Eq. (16), the algorithm has the best solution
To form the dynamic balancing process during the iterations, a self-tuning factor
Then the balancing factor
To avoid premature while escalating the process of convergency, the ABC-DSS is proposed:
Note that when λ = 1, Eq. (20) equals Eq. (12); when λ = 0, Eq. (20) equals Eq. (12). The global search ability and convergence efficiency are satisfied by modifying the updating function. The difference between the proposed ABC-DSS algorithm and the ABC algorithm is that Eq. (12) is replaced with Eq. (20).
However, the problem-solving process is not relatively smooth and quick, leading to finding high-order solutions to resolve the problem further. Inspired by the mapping of cellular networks, the FOI is cut into small cells allowing each cell to form the FOI solution accordingly.
The cellular automata (CA), a discrete problem-solving model, is capable of dealing with complex problems while cutting extensive mathematic computations. Since the FOI is a continuous surface in engineering, it is practical to approximate it with discrete space or discrete values. Typically, the CA consists of a regular grid of cells, each assigned a finite number of states, and the grid can be assigned any finite number of dimensions. The four fundamental elements of CA are lattice structure, cell variables, the concept of neighbourhood, and updating rules. In this study, the cells are distributed in each lattice structure, and the neighbouring cells are connected. Adding that the form of the cellular space is the immediate reflection of the physical dimensions, and the rectangular lattice structure is adopted rather than other commonly used triangular and hexagonal lattice structures as the edge shape of the FOI is rectangular. Each cell of the lattice is a joint of parameters that will be updated over the iteration process. The solving process is by defining a set of neighbourhood cells for the specific cell and assigning a random state for each cell to set the initial state. Thus, a new generation is born with the mathematical function that determines the latest state of each cell related to its current state and the states of its neighbouring cells. The cell variables at the time
where
The neighbouring cells
The configuration of neighbouring cells is a description of the nature of the application, which is vital to the system. The traditional Moore neighbourhood structure [43], which comprises eight cells, is adopted in this article; see Fig. 4.
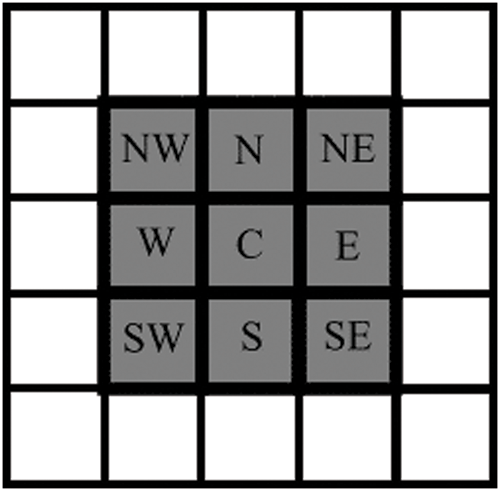
Figure 4: The Moore neighbourhood comprising eight cells
Based on the values needed in the iterations for the updating rules, the updating strategy is:
The primary purpose of the ABC-DSS is to seek optimized nectars by exchanging information about the food source position and nectar amount. ABC-DSS-based CA model is introduced to accelerate the convergence speed and derive optimized network topology for WSNs, thus determining the locations of the power banks. In this article, CA is introduced to specify the neighbour solution
The proposed cellular velocity update equation acts on the design variables and combines available information at the central site; thus, for every discrete time step, the updating equation generates a new design at each site using the related information as follows:
The iteration process is repeated until a stopping criterion is met. The inner and outer loops are regarded as convergent when the limited number of generations in each loop is satisfied.
With all the above modifications, the hybrid power bank deployment model for energy supply coverage optimization is settled, and the optimum power bank deployment locations of a specific FOI are generated.
To validate the proposed algorithm and model the COP, the performance of the three algorithms is tested on numerical benchmark function optimizations as was performed in [36], targeting performance evaluation for the heuristic algorithms. The three algorithms are named ABC algorithm, GABC algorithm, and ABC-DSS algorithm, and the benchmark functions used in this research work are shown in Table 2.
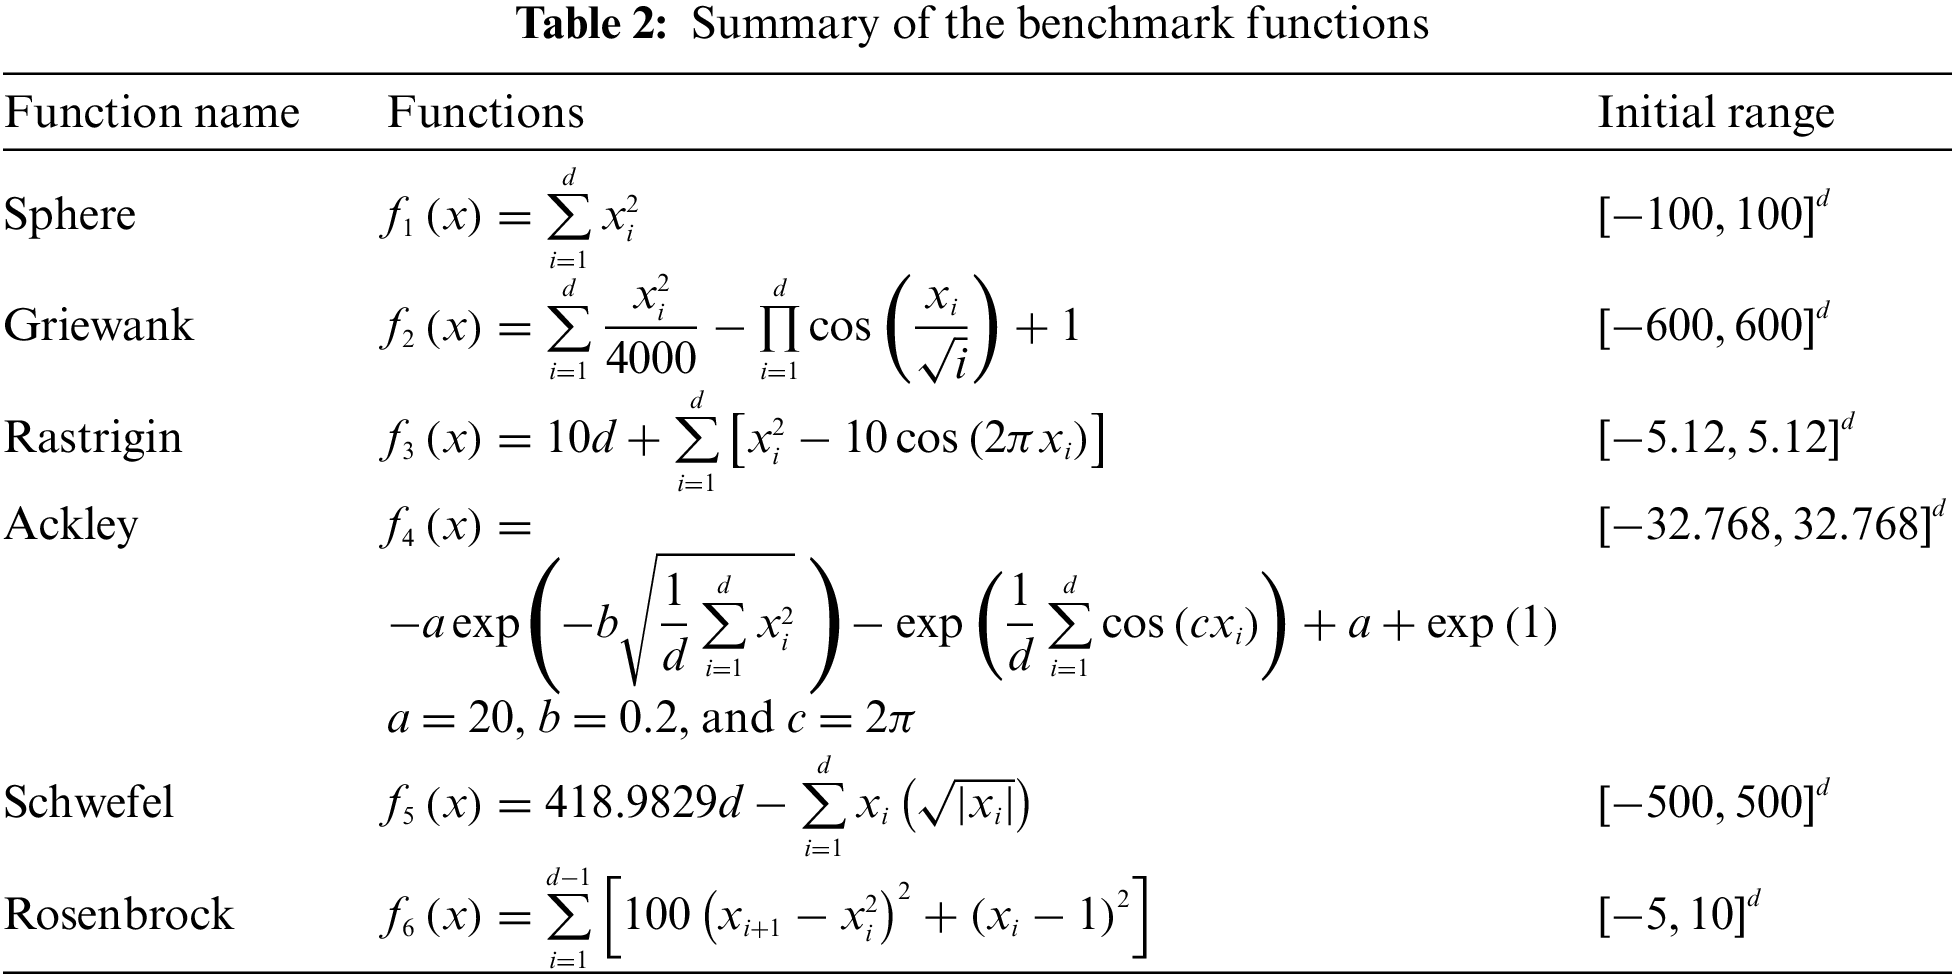
A set of comparative experiments on the above numerical benchmark function optimizations was conducted to compare the performances of the three algorithms. The dimensions of solution space were set to 30 and 100 for the benchmark function to generate the statistical experiment’s means and standard deviation parameters and repeated them 50 times. The population size was set to 80 for all three algorithms, and the maximum generation times were set to 5000.
The performance of the proposed hybrid power bank deployment model in the industrial environment is evaluated, and the accessibility of powering the energy harvesting in IWSNs is verified in comparative experiments performed on the semi-real 3-D surface. First, to generate the 3D surface with as many features as the natural manufacturing environment, the surface-generate program is coded in MATLAB to represent different environments by setting the parameters at different values. In this paper, the surface models utilized are terrains with narrow and winding canyons, towering and steep mountains named even and uneven plants, as shown in Fig. 5.

Figure 5: The 3-D generated surfaces
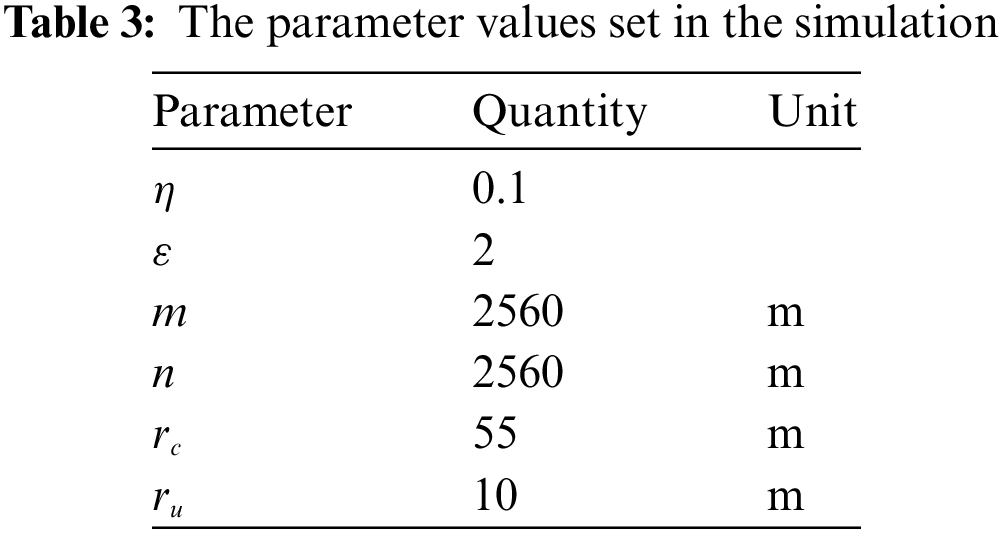
After the generation of the 3-D surfaces, the axis of the surface is extracted discretely as the 3D surface is continuous. Bring our assumption to the semi-extreme situation, and the FOI is defined as 2560 meters long and 2560 meters wide, which is a super sizeable single plant according to industry standards. The parameter values set in the simulation are shown in Table 3.
Simulation experiments were performed using MATLAB 2022B software to evaluate the proposed algorithm’s performance. Six well-known benchmark functions were employed to compare the performance of the ABC, GABC and the ABS-DSS algorithms. Since an absolute 0 may not be reported in practice, and the results below
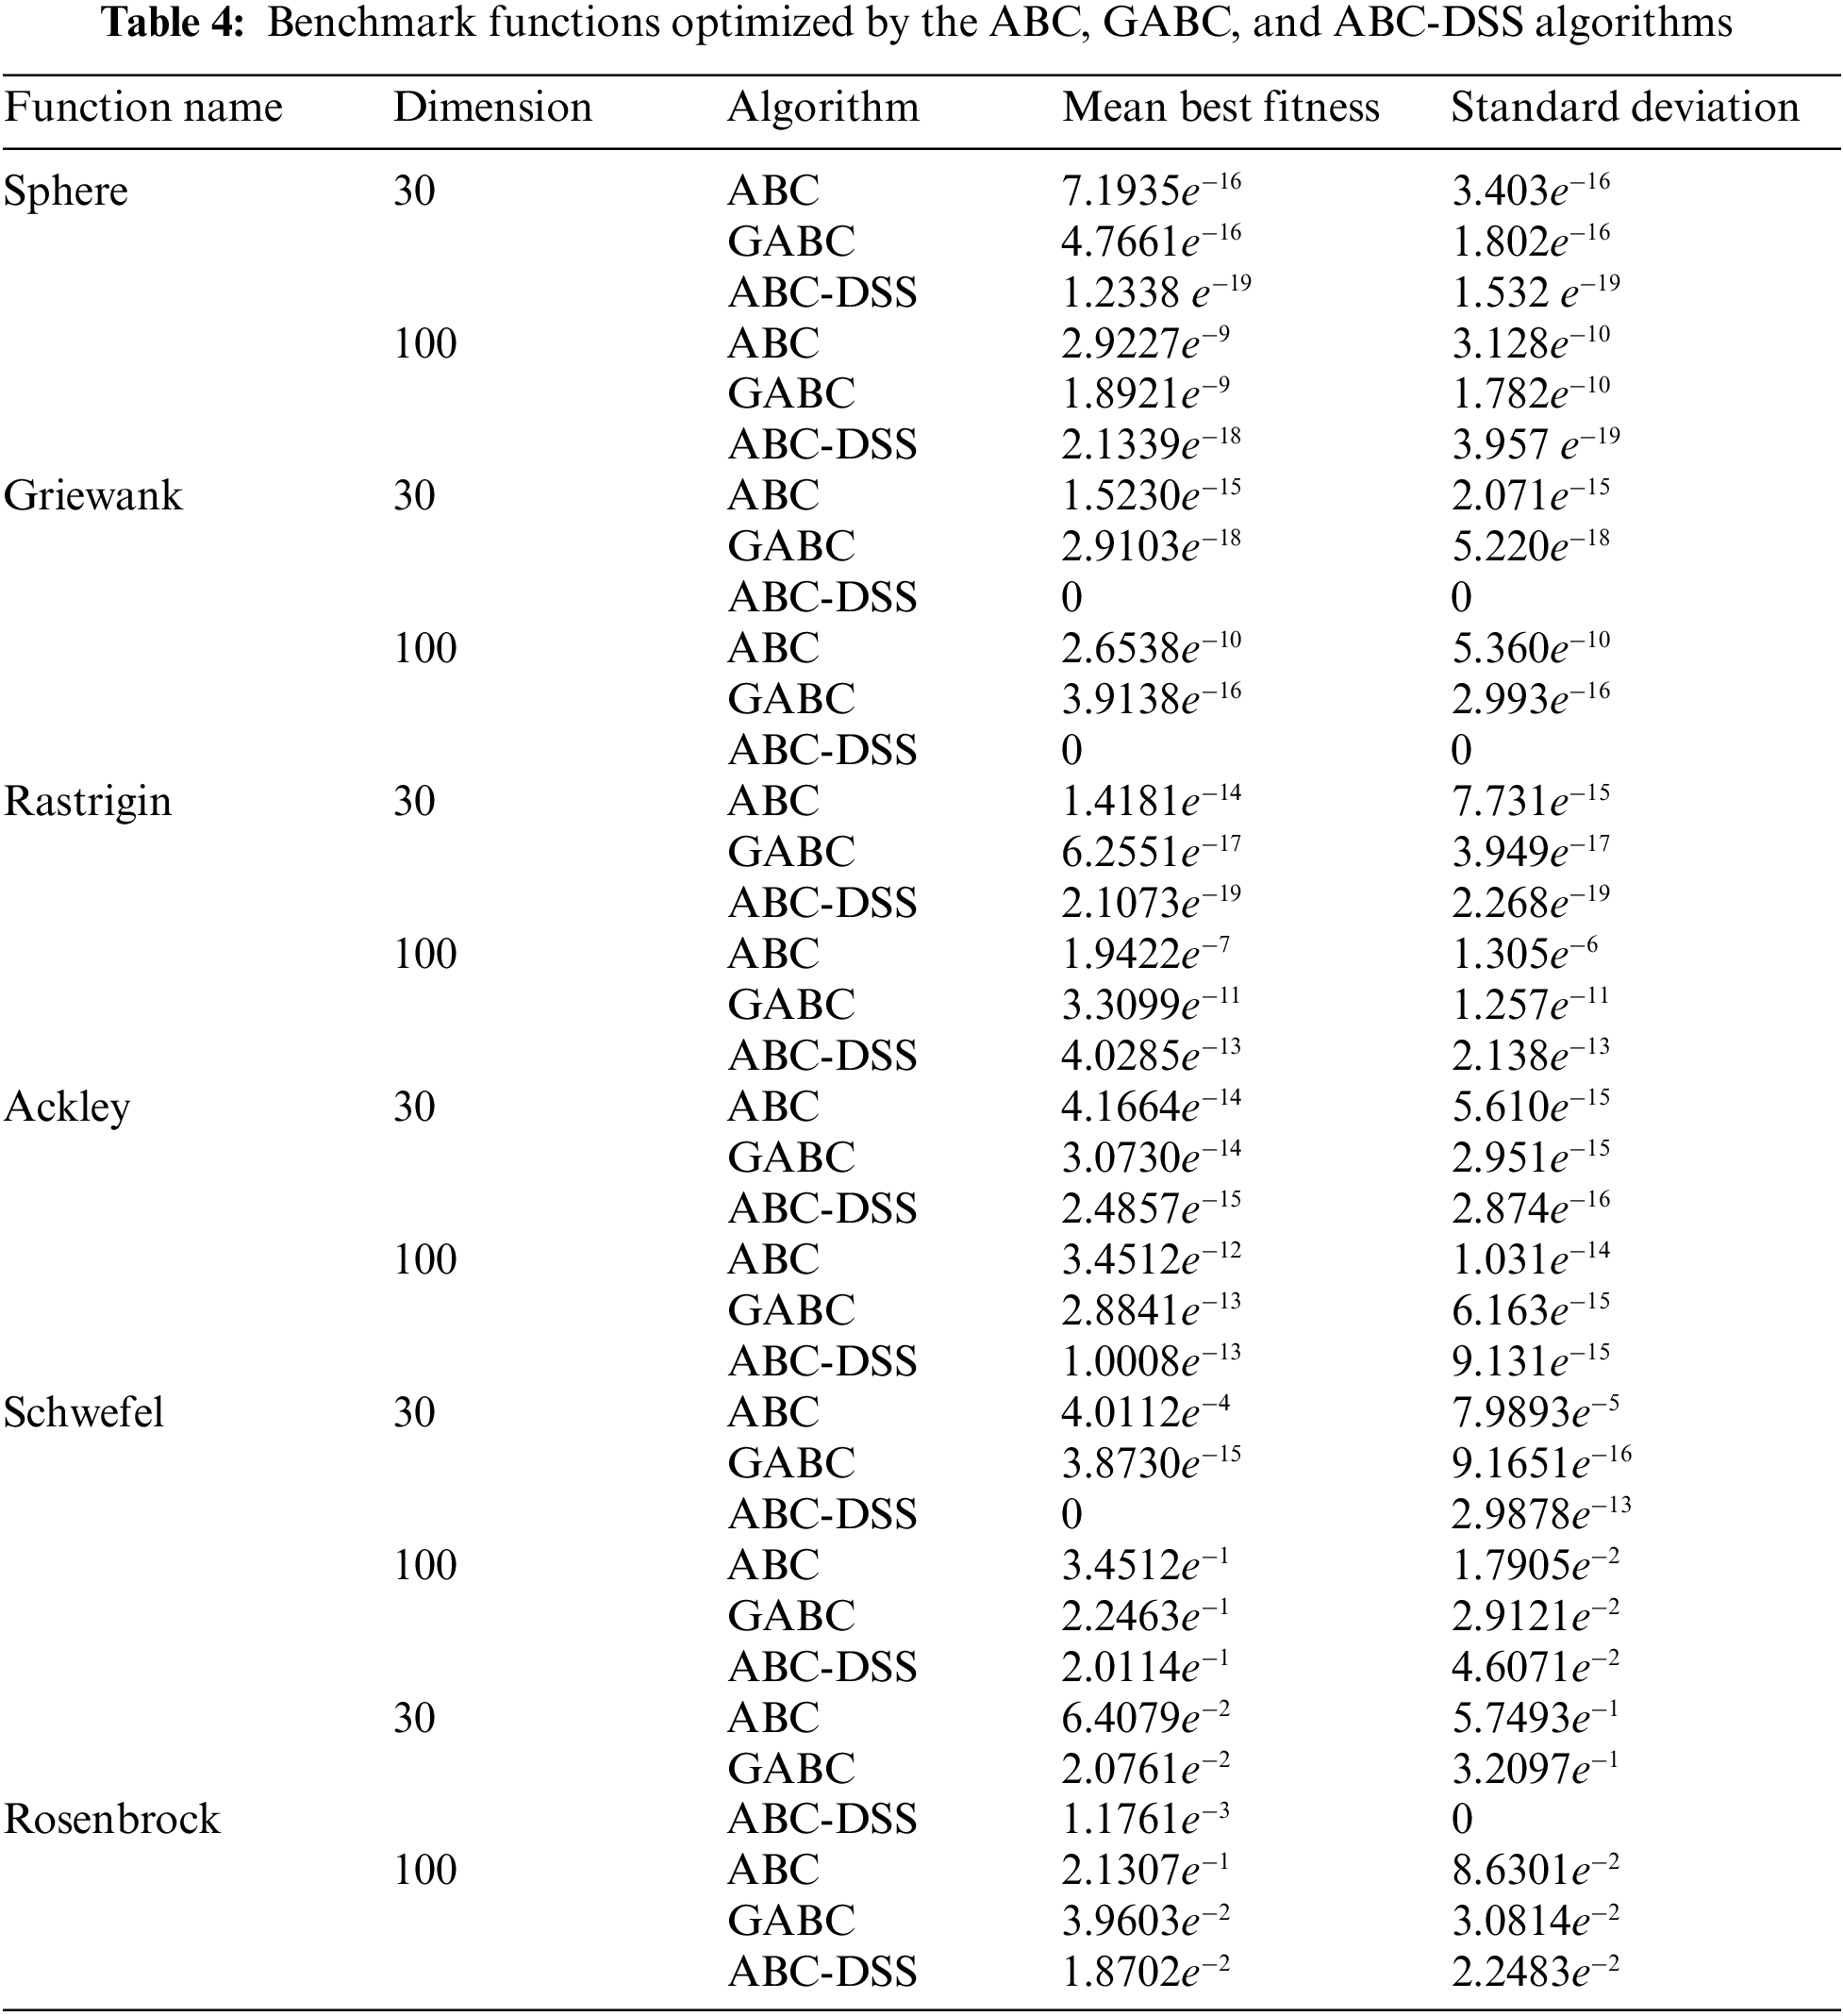
From Table 4, the proposed ABC-DSS algorithm outperforms the GABC and ABC algorithms for both the unimodal and the multimodal function optimization. More specifically, the ABC algorithm tends to fall into a local optimum, causing convergence stagnation; thus, the convergence accuracy of the algorithm is not ideal. The GABC algorithm strengthened the local search ability with the guidance of the current optimal position of the population; thus, the convergence accuracy of the algorithm improved to a certain extent. Compared with [36,47–49], the proposed ABC-DSS algorithm, kept a good balance between the local and global search ability, is not easily trapped in the numerous local optimal points, and thus has better convergence.
4.2 Performance Evaluation Results
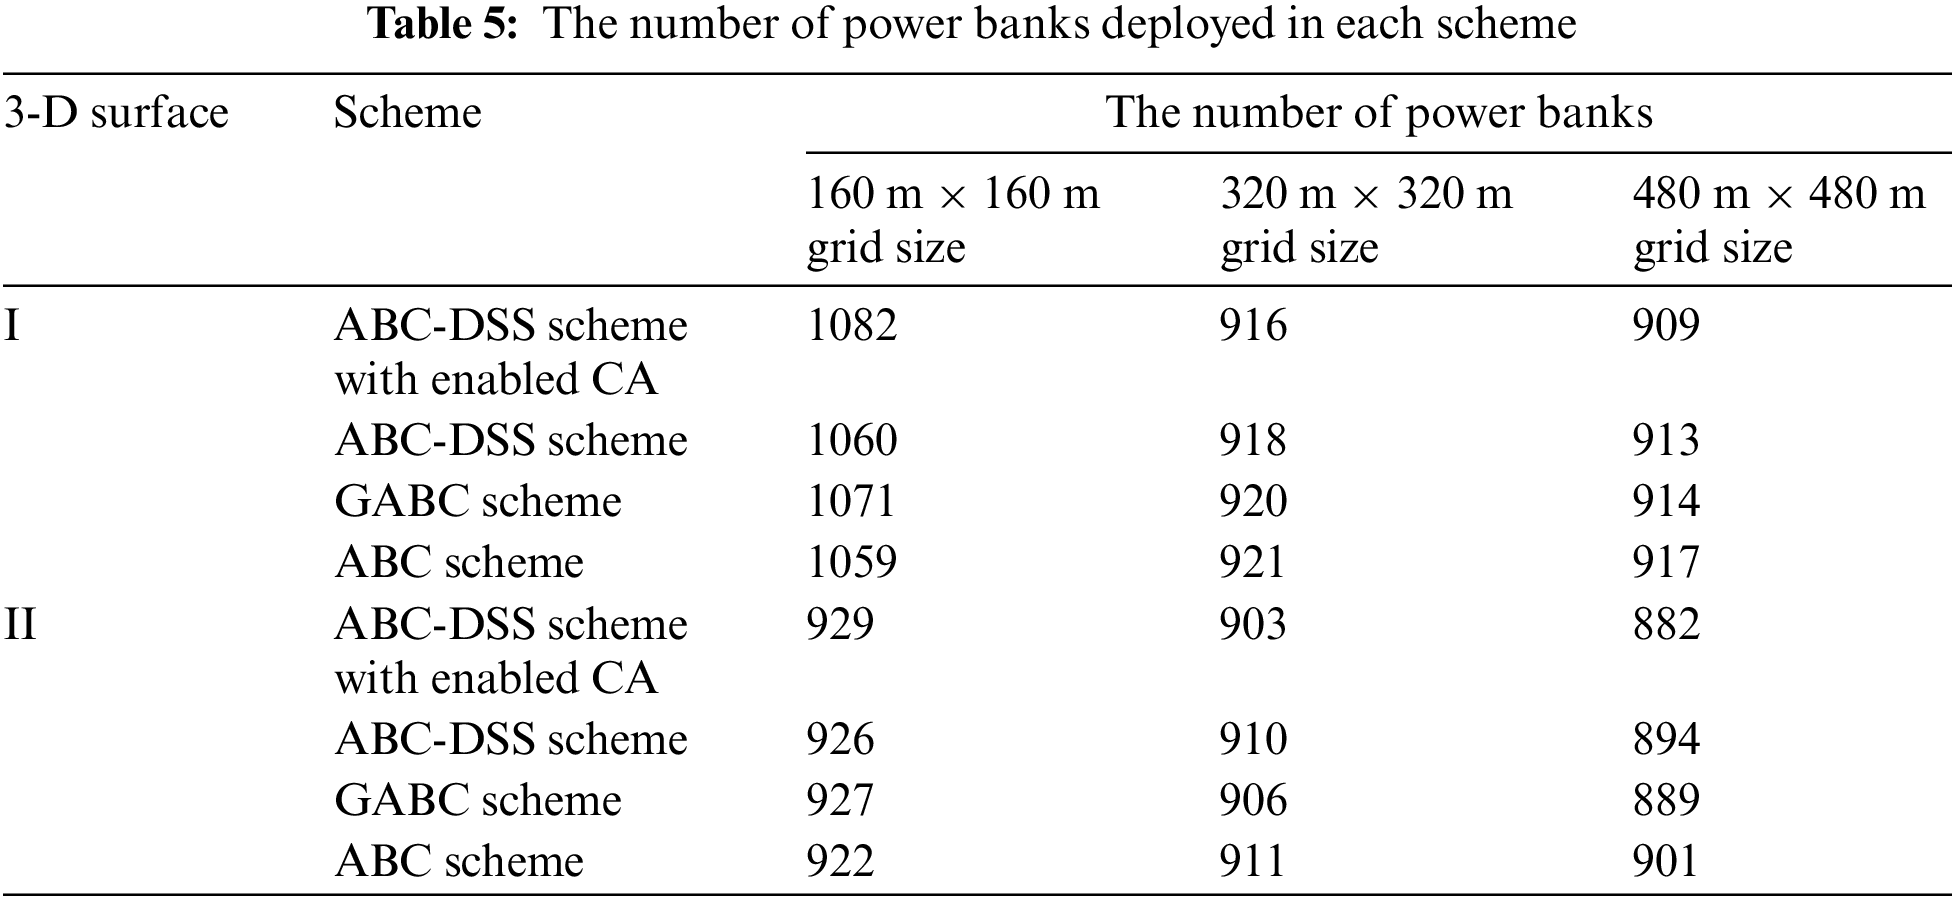
Three strategies are utilized to derive the power bank deployment schemes to address the COP: the ABC-DSS scheme with enabled CA, the ABC-DSS scheme, the GABC scheme, and the ABC scheme. The number of sensors deployed utilizing each scheme is shown in Table 5.
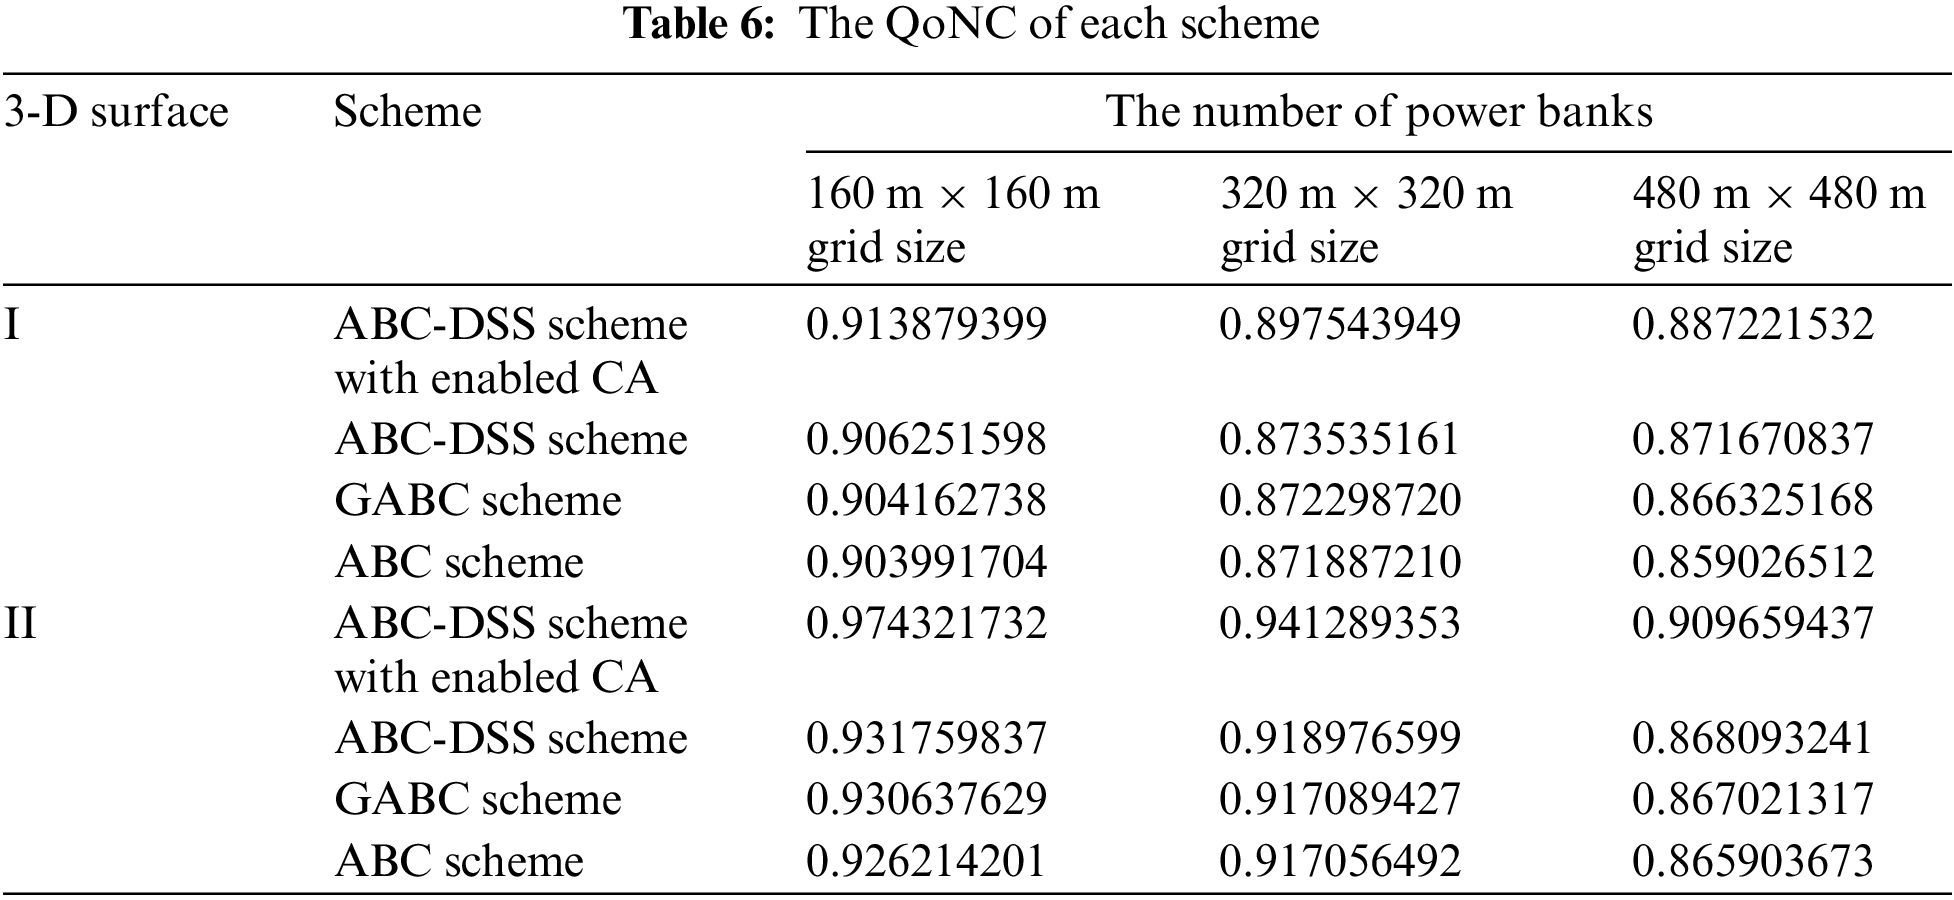
The initial artificial bee number is set as the number of cell grids, and the required QoNC of each cell grid is set to 0.9. The QoNC of each scheme is shown in Table 6.
The grid size of cells was set at three different degrees to conduct the evaluations; one is 160 meters long plus 160 meters wide, the second is 320 meters long plus 320 meters wide, and the third is 480 meters long plus 480 meters wide. The power bank deployment scheme generating consumption time of each scheme is shown in Table 7.
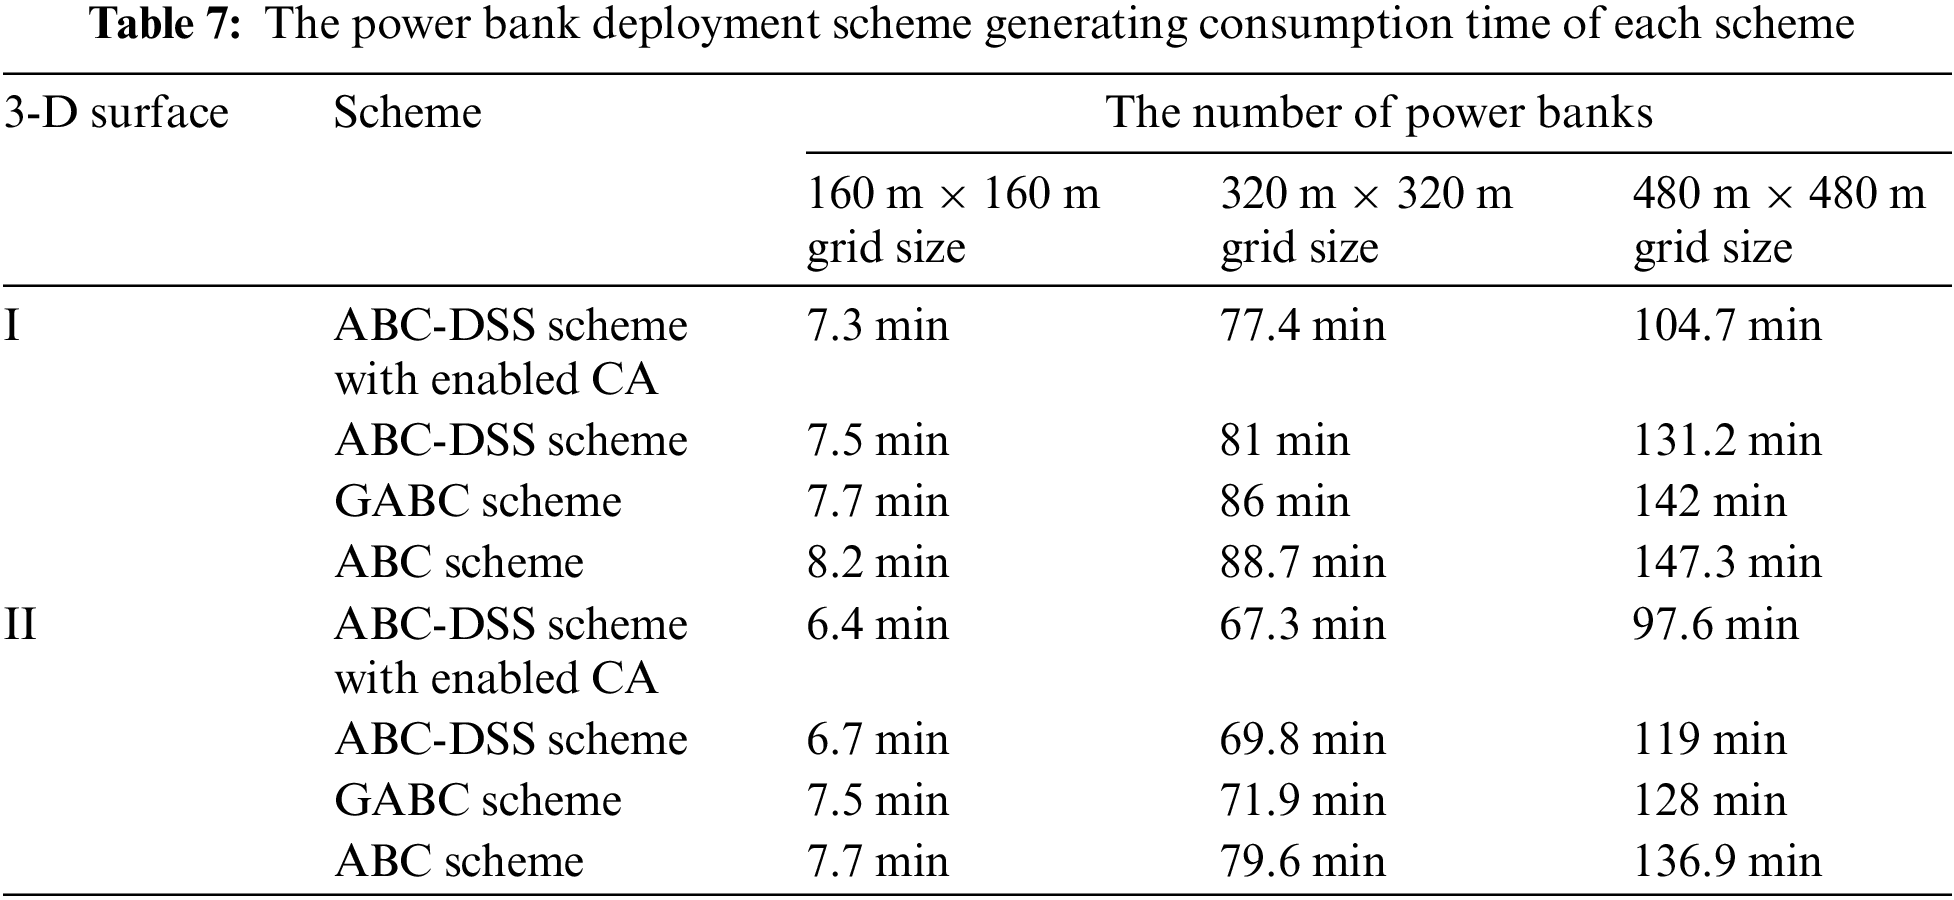
Comparing Tables 5 and 6, we notice that the 160 m × 160 m cell grid scheme results in higher QoNC, although it consumes more power banks. For surface I, Twenty-three power banks are saved between the best and worst schemes while improving the QoNC by 0.01. For surface II, although seven more power banks are utilized between the best and worst scheme, the deployment scheme improved the QoNC by 0.05 and resulted in an extremely high QoNC rate of 0.974. Also, Table 7 shows that the 160 m × 160 m cell grid size scheme consumes less time than the 320 m × 320 m and 480 m × 480 m cell grid size schemes. The time consumed by the 320 m × 320 m cell grid scheme is ten times as long as the 160 m × 160 m cell grid scheme. The reason behind the phenomenon is that the initial artificial bee number was set as the number of cell grids; as a result, the quantity of neighbourhood
Comparing the ABC-DSS scheme with enabled CA and the ABC-DSS scheme to the ABC scheme in Tables 5 and 6, we can conclude the dynamic search strategy is well balanced in ABC’s local and global search abilities to avoid the premature phenomenon. This provides better schemes with higher QoNC. The proposed ABC-DSS scheme with enabled CA scheme outperformed the GABC by 0.01 and the ABC by 0.03 for surface I while surpassing the GABC by 0.04 and the ABC by 0.05 for surface II under 160 m × 160 m cell grid size.
Comparing the ABC-DSS scheme with enabled CA and the ABC-DSS scheme or ABC scheme from Table 7, we can conclude that the CA method helps lower the consumption time of the optimization schemes efficiently. The reason behind the phenomenon is that the CA was utilized to select neighbourhoods in the artificial algorithm other than randomly selecting them, which speeds up the optimization process’s convergence.
Since the expected QoNC of the region is 0.9, which was reached by the schemes mentioned above in most cases, the three schemes are verified. However, considering all factors, the ABC-DSS scheme with enabled CA generates better results. Thus, the proposed hybrid power bank deployment model for IWSN is effective and efficient. That is, the FOI is covered as expected, and the energy web can support the operation of the function of the IWSN. The FOI is not defined as the whole area but as the specified targets or target areas in practice; thus, the QoNC is far beyond 0.9 and could power the entire IWSN.
For the COP of WSN and IWSN, traditional research has mainly considered the monitoring coverage of the network and treated the FOI as in a 2-D plane or 3-D space. However, with the booming expansion of printing efficient circuits and fabrication of highly-integrated devices, the application of powering devices by RF is enabled. RF-enabled sensor devices are generally used in industries. Illuminated by the raised issue of widely spreading RF-enabled sensor devices, we focus on the power banks’ energy supply coverage in this work. The FOI is not simplified but has considered the obstacles for a more practical 3-D surface. In addressing the NP-hard and COP, modifications were made to the ABC algorithm to generate better and quicker convergence results. A DSS was proposed to modify the ABC and balance the exploration and exploitation ability for better convergence. Further, the CA was utilized to enhance the convergence speed and establish the ABC-DSS with enabled CA. Comparative experiments were carried out for benchmark functions and case studies. The results show that the proposed hybrid power bank deployment model for energy supply coverage optimization in IWSN is effective and efficient.
Based on the limitation of this paper, future works would require that the spectrum of propagation by the RF be expanded to satisfy the various installations in the deployment area. The energy distributed by the power banks can also be varied in the deployment area to satisfy the requirement of each installation.
Funding Statement: This work was partly supported by the China Scholarship Council.
Conflicts of Interest: The authors declare they have no conflicts of interest to report regarding the present study.
References
1. J. E. Bresenham, “Algorithm for computer control of a digital plotter,” IBM Systems Journal, vol. 4,no. 1, pp. 25–30, 1965. [Google Scholar]
2. S. W. Nourildean, M. D. Hassib and Y. Mohammed, “Internet of things based wireless sensor network: A review,” Indones. J. Electr. Eng. Comput. Sci., vol. 27, no. 1, pp. 246–261, 2022. [Google Scholar]
3. R. Ouni and K. Saleem, “Framework for sustainable wireless sensor network based environmental monitoring,” Sustainability, vol. 14, no. 14, pp. 8356, 2022. [Google Scholar]
4. S. Gupta and S. Gupta, “Internet of things and the role of wireless sensor networks in IoT,” in Smart Agricultural Services Using Deep Learning, Big Data, and IoT. Hershey, USA: IGI Global, pp. 113–127, 2021. [Google Scholar]
5. M. J. Nene, R. S. Deodhar and L. M. Patnaik, “Algorithm for autonomous reorganization of mobile wireless camera sensor networks to improve coverage,” IEEE Sensors Journal, vol. 15, no. 8, pp. 4428–4441, 2015. [Google Scholar]
6. C. Han, L. Sun, F. Xiao and J. Guo, “An energy efficiency node scheduling model for spatial-temporal coverage optimization in 3D directional sensor networks,” IEEE Access, vol. 4, pp. 4408–4419, 2016. [Google Scholar]
7. X. Han, X. Cao, E. L. Lloyd and C. -C. Shen, “Deploying directional sensor networks with guaranteed connectivity and coverage,” in 2008 5th Annual IEEE Communications Society Conf. on Sensor, Mesh and Ad Hoc Communications and Networks, San Francisco, CA, USA, pp. 153–160, 2008. [Google Scholar]
8. L. C. Shiu, C. Y. Lee and C. S. Yang, “The divide-and-conquer deployment algorithm based on triangles for wireless sensor networks,” IEEE Sensors Journal, vol. 11, no. 3, pp. 781–790, 2010. [Google Scholar]
9. Y. Zhang, X. Sun and B. Wang, “Efficient algorithm for k-barrier coverage based on integer linear programming,” China Communications, vol. 13, no. 7, pp. 16–23, 2016. [Google Scholar]
10. C. A. R. Soares, R. de Souza Couto, A. Sztajnberg and J. L. M. do Amaral, “POSIMNET-R: An immunologic resilient approach to position routers in industrial wireless sensor networks,” Expert Systems with Applications, vol. 188, no. 2, pp. 116045, 2022. [Google Scholar]
11. R. K. Dash, K. Cengiz, Y. A. Alshehri and N. Alnazzawi, “A new and reliable intelligent model for deployment of sensor nodes for IoT applications,” Computers and Electrical Engineering, vol. 101, pp. 107959, 2022. [Google Scholar]
12. N. H. Ali and R. Özdağ, “Coverage analysis and a new metaheuristic approach using the Elfes probabilistic detection model in wireless sensor networks,” Measurement, vol. 200, pp. 111627, 2022. [Google Scholar]
13. T. Brown, Z. Wang, T. Shan, F. Wang and J. Xue, “On wireless video sensor network deployment for 3D indoor space coverage,” in SoutheastCon 2016, Norfolk, VA, USA, pp. 1–8, 2016. [Google Scholar]
14. H. Ma, X. Zhang and A. Ming, “A coverage-enhancing method for 3D directional sensor networks,” in IEEE INFOCOM 2009, Rio de Janeiro, Brazil, pp. 2791–2795, 2009. [Google Scholar]
15. J. Kumari and P. Kumar, “A spherical band-based DV-Hop localization technique for three-dimensional wireless sensor network,” Physical Communication, vol. 56, pp. 101945, 2023. [Google Scholar]
16. J. Zhang, B. Chen, Y. Zhang, C. Jiang and A. Song, “3D self-deployment of jumping robot sensor nodes for improving network performance in obstacle dense environment,” Measurement, vol. 207, pp. 112410, 2023. [Google Scholar]
17. V. Akbarzadeh, C. Gagne, M. Parizeau, M. Argany and M. A. Mostafavi, “Probabilistic sensing model for sensor placement optimization based on line-of-sight coverage,” IEEE Transactions on Instrumentation and Measurement, vol. 62, no. 2, pp. 293–303, 2012. [Google Scholar]
18. S. Temel, N. Unaldi and O. Kaynak, “On deployment of wireless sensors on 3-D terrains to maximize sensing coverage by utilizing cat swarm optimization with wavelet transform,” IEEE Transactions on Systems, Man, and Cybernetics: Systems, vol. 44, no. 1, pp. 111–120, 2013. [Google Scholar]
19. H. R. Topcuoglu, M. Ermis and M. Sifyan, “Positioning and utilizing sensors on a 3-D terrain part I—Theory and modeling,” IEEE Transactions on Systems, Man, and Cybernetics, Part C (Applications and Reviews), vol. 41, no. 3, pp. 376–382, 2010. [Google Scholar]
20. J. Yin, N. Deng and J. Zhang, “Wireless sensor network coverage optimization based on Yin-Yang pigeon-inspired optimization algorithm for Internet of Things,” Internet of Things, vol. 19, no. 8, pp. 100546, 2022. [Google Scholar]
21. M. Toloueiashtian, M. Golsorkhtabaramiri and S. Y. B. Rad, “An improved whale optimization algorithm solving the point coverage problem in wireless sensor networks,” Telecommunication Systems, vol. 79,no. 3, pp. 417–436, 2022. [Google Scholar]
22. D. P. Williamson and D. B. Shmoys, The Design of Approximation Algorithms, 1st ed., vol. 1. Cambridge, United Kingdom: Cambridge University Press, pp. 3–26, 2011. [Google Scholar]
23. J. O’Rourke, “Computational geometry column 15,” International Journal of Computational Geometry and Applications, vol. 2, no. 2, pp. 215–217, 1992. [Google Scholar]
24. J. H. Holland, Adaptation in Natural and Artificial Systems: An Introductory Analysis with Applications to Biology, Control, and Artificial Intelligence, 1st ed., vol. 1. Cambridge, MA, USA: MIT press, pp. 171–185, 1992. [Google Scholar]
25. J. Kennedy and R. Eberhart, “Particle swarm optimization,” in Proc. of ICNN’95-Int. Conf. on Neural Networks, Perth, WA, Australia, vol. 4, pp. 1942–1948, 1995. [Google Scholar]
26. D. Karaboga, “An idea based on honey bee swarm for numerical optimization,” Technical report-tr06, Erciyes university, engineering faculty, computer, 2005. [Google Scholar]
27. M. Dorigo and C. Blum, “Ant colony optimization theory: A survey,” Theoretical Computer Science, vol. 344, no. 2–3, pp. 243–278, 2005. [Google Scholar]
28. S. Kirkpatrick, C. D. Gelatt Jr and M. P. Vecchi, “Optimization by simulated annealing,” Science, vol. 220, no. 4598, pp. 671–680, 1983. [Google Scholar] [PubMed]
29. K. Price, R. M. Storn and J. A. Lampinen, “Differential evolution: A practical approach to global optimization,” in Natural Computing Series (NCS), 1st ed., vol. 1. Berlin, Germany: Springer Science & Business Media, pp. 189–265, 2006. [Google Scholar]
30. D. Karaboga and B. Basturk, “A powerful and efficient algorithm for numerical function optimization: Artificial bee colony (ABC) algorithm,” Journal of Global Optimization, vol. 39, no. 3, pp. 459–471, 2007. [Google Scholar]
31. D. Karaboga and B. Basturk, “On the performance of artificial bee colony (ABC) algorithm,” Applied Soft Computing, vol. 8, no. 1, pp. 687–697, 2008. [Google Scholar]
32. D. Karaboga and B. Akay, “A comparative study of artificial bee colony algorithm,” Applied Mathematics and Computation, vol. 214, no. 1, pp. 108–132, 2009. [Google Scholar]
33. K. -S. Tang, K. -F. Man, S. Kwong and Q. He, “Genetic algorithms and their applications,” IEEE Signal Processing Magazine, vol. 13, no. 6, pp. 22–37, 1996. [Google Scholar]
34. K. Price, R. M. Storn and J. A. Lampinen, Differential Evolution: A Practical Approach to Global Optimization. Dordrecht, Netherlands: Springer Science & Business Media, 2006. [Google Scholar]
35. R. C. Eberhart, Y. Shi and J. Kennedy, “Swarm intelligence,” in Morgan Kaufmann Series in Evolutionary Computation, 1st ed., vol. 1. Amsterdam, Netherlands: Elsevier, pp. 287–326, 2001. [Google Scholar]
36. G. Zhu and S. Kwong, “Gbest-guided artificial bee colony algorithm for numerical function optimization,” Applied Mathematics and Computation, vol. 217, no. 7, pp. 3166–3173, 2010. [Google Scholar]
37. A. Elfes, “Occupancy grids: A stochastic spatial representation for active robot perception,” in Proc. of the Sixth Conf. on Uncertainty in AI, Morgan Kaufmann San Mateo, CA, vol. 2929, pp. 6, 1990. [Google Scholar]
38. S. Li, C. Xu, W. Pan and Y. Pan, “Sensor deployment optimization for detecting maneuvering targets,” in 2005 7th Int. Conf. on Information Fusion, Philadelphia, PA, USA, vol. 2, pp. 7, 2005. [Google Scholar]
39. N. Ahmed, S. S. Kanhere and S. Jha, “Probabilistic coverage in wireless sensor networks,” in The IEEE Conf. on Local Computer Networks 30th Anniversary (LCN’05) l, Sydney, NSW, Australia, pp. 8–681, 2005. [Google Scholar]
40. Y. -R. Tsai, “Sensing coverage for randomly distributed wireless sensor networks in shadowed environments,” IEEE Transactions on Vehicular Technology, vol. 57, no. 1, pp. 556–564, 2008. [Google Scholar]
41. D. Sušanj, D. Pinčić and K. Lenac, “Effective area coverage of 2D and 3D environments with directional and isotropic sensors,” IEEE Access, vol. 8, pp. 185595–185608, 2020. [Google Scholar]
42. J. Liang, M. Tian, Y. Liu and J. Zhou, “Coverage optimization of soil moisture wireless sensor networks based on adaptive Cauchy variant butterfly optimization algorithm,” Scientific Reports, vol. 12, no. 1, pp. 11687, 2022. [Google Scholar] [PubMed]
43. R. Hegselmann and A. Flache, “Understanding complex social dynamics: A plea for cellular automata based modelling,” Journal of Artificial Societies and Social Simulation, vol. 1, no. 3, pp. 1, 1998. [Google Scholar]
44. K. Wójcik, “Forced movement extensions of the particle swarm optimizers with inertia weight,” in Artificial Intelligence and Soft Computing: 21st Int. Conf., ICAISC 2022, Zakopane, Poland, pp. 254–264, 2022. [Google Scholar]
45. R. Ahmed, G. P. Rangaiah, S. Mahadzir, S. Mirjalili, M. H. Hassan et al., “Memory, evolutionary operator, and local search based improved grey wolf optimizer with linear population size reduction technique,” Knowledge-Based Systems, vol. 264, pp. 110297, 2023. [Google Scholar]
46. S. Yang, Y. Qi, R. Yang, X. Ma and H. Zhang, “A surrogate assisted evolutionary multitasking optimization algorithm,” Applied Soft Computing, vol. 132, pp. 109775, 2023. [Google Scholar]
47. H. Shah, N. Tairan, H. Garg and R. Ghazali, “Global gbest guided-artificial bee colony algorithm for numerical function optimization,” Computers, vol. 7, no. 4, pp. 69, 2018. [Google Scholar]
48. Y. Cao, Y. Lu, X. Pan and N. Sun, “An improved global best guided artificial bee colony algorithm for continuous optimization problems,” Cluster Computing, vol. 22, pp. 3011–3019, 2019. [Google Scholar]
49. X. Ruan, J. Wang, X. Zhang, W. Liu and X. Fu, “A novel optimization algorithm combing Gbest-guided artificial bee colony algorithm with variable gradients,” Applied Sciences, vol. 10, no. 10, pp. 3352, 2020. [Google Scholar]
Cite This Article
 Copyright © 2023 The Author(s). Published by Tech Science Press.
This work is licensed under a Creative Commons Attribution 4.0 International License , which permits unrestricted use, distribution, and reproduction in any medium, provided the original work is properly cited.
 Downloads
 Citation Tools