
 Submit a Paper
 Propose a Special lssue
 Open Access
ARTICLE

Pre-Locator Incorporating Swin-Transformer Refined Classifier for Traffic Sign Recognition
1 School of Software Engineering, Chengdu University of Information Technology, Chengdu, 610225, China
2 V.C. & V.R. Key Lab of Sichuan Province, Sichuan Normal University, Chengdu, 610068, China
* Corresponding Author: Wenbin Zheng. Email:
(This article belongs to the Special Issue: Computer Vision and Machine Learning for Real-Time Applications)
Intelligent Automation & Soft Computing 2023, 37(2), 2227-2246. https://doi.org/10.32604/iasc.2023.040195
Received 08 March 2023; Accepted 10 May 2023; Issue published 21 June 2023
 View Full Text
 Download PDF
Abstract
In the field of traffic sign recognition, traffic signs usually occupy very small areas in the input image. Most object detection algorithms directly reduce the original image to a specific size for the input model during the detection process, which leads to the loss of small object information. Additionally, classification tasks are more sensitive to information loss than localization tasks. This paper proposes a novel traffic sign recognition approach, in which a lightweight pre-locator network and a refined classification network are incorporated. The pre-locator network locates the sub-regions of the traffic signs from the original image, and the refined classification network performs the refinement recognition task in the sub-regions. Moreover, an innovative module (named SPP-ST) is proposed, which combines the Spatial Pyramid Pool module (SPP) and the Swin-Transformer module as a new feature extractor to learn the special spatial information of traffic sign effectively. Experimental results show that the proposed method is superior to the state-of-the-art methods (82.1 mAP achieved on 218 categories in the TT100k dataset, an improvement of 19.7 percentage points compared to the previous method). Moreover, both the result analysis and the output visualizations further demonstrate the effectiveness of our proposed method. The source code and datasets of this work are available at .Keywords
Traffic sign recognition is an important sub-task of real-time intelligent transportation systems. In this field, numerous methods have been proposed, and many public datasets have been released. Generally, a traffic sign recognition system consists of two stages: the first is to find the traffic sign locations in the real traffic scenes (traffic sign detection), and then classify the findings (traffic sign classification). Therefore, these methods can be divided into two types according to the processing steps. Such as the German Traffic Sign Detection Benchmark (GTSDB) [1] dataset and the Chinese Traffic Sign Detection Benchmark (CCTSDB) [2] dataset are used for the detection task, and the German Traffic Sign Recognition Benchmark (GTSRB) [3] dataset is used for the classification task. In recent years, some algorithms [4,5] have achieved 99% precision and 95%–99% recall for the detection task, and 99% precision for the classification task at these public datasets. However, these benchmark datasets cannot fully represent the actual traffic environment. In real traffic scenes, there are many difficulties in traffic sign detection, such as small size objects, illumination that is too bright or too dark, partial blurred, or occlusion. Some examples are shown in Fig. 1. Subfigure (c) in Fig. 1 shows the TT100K [6] dataset, which has a significantly lower proportion of traffic sign pixels compared to the other two datasets, indicating a challenging scenario for small object detection. Detecting small objects like traffic signs and lights is challenging for ordinary convolutional neural networks due to their size. After a few pooling layers, their features are almost lost, making detection more difficult.
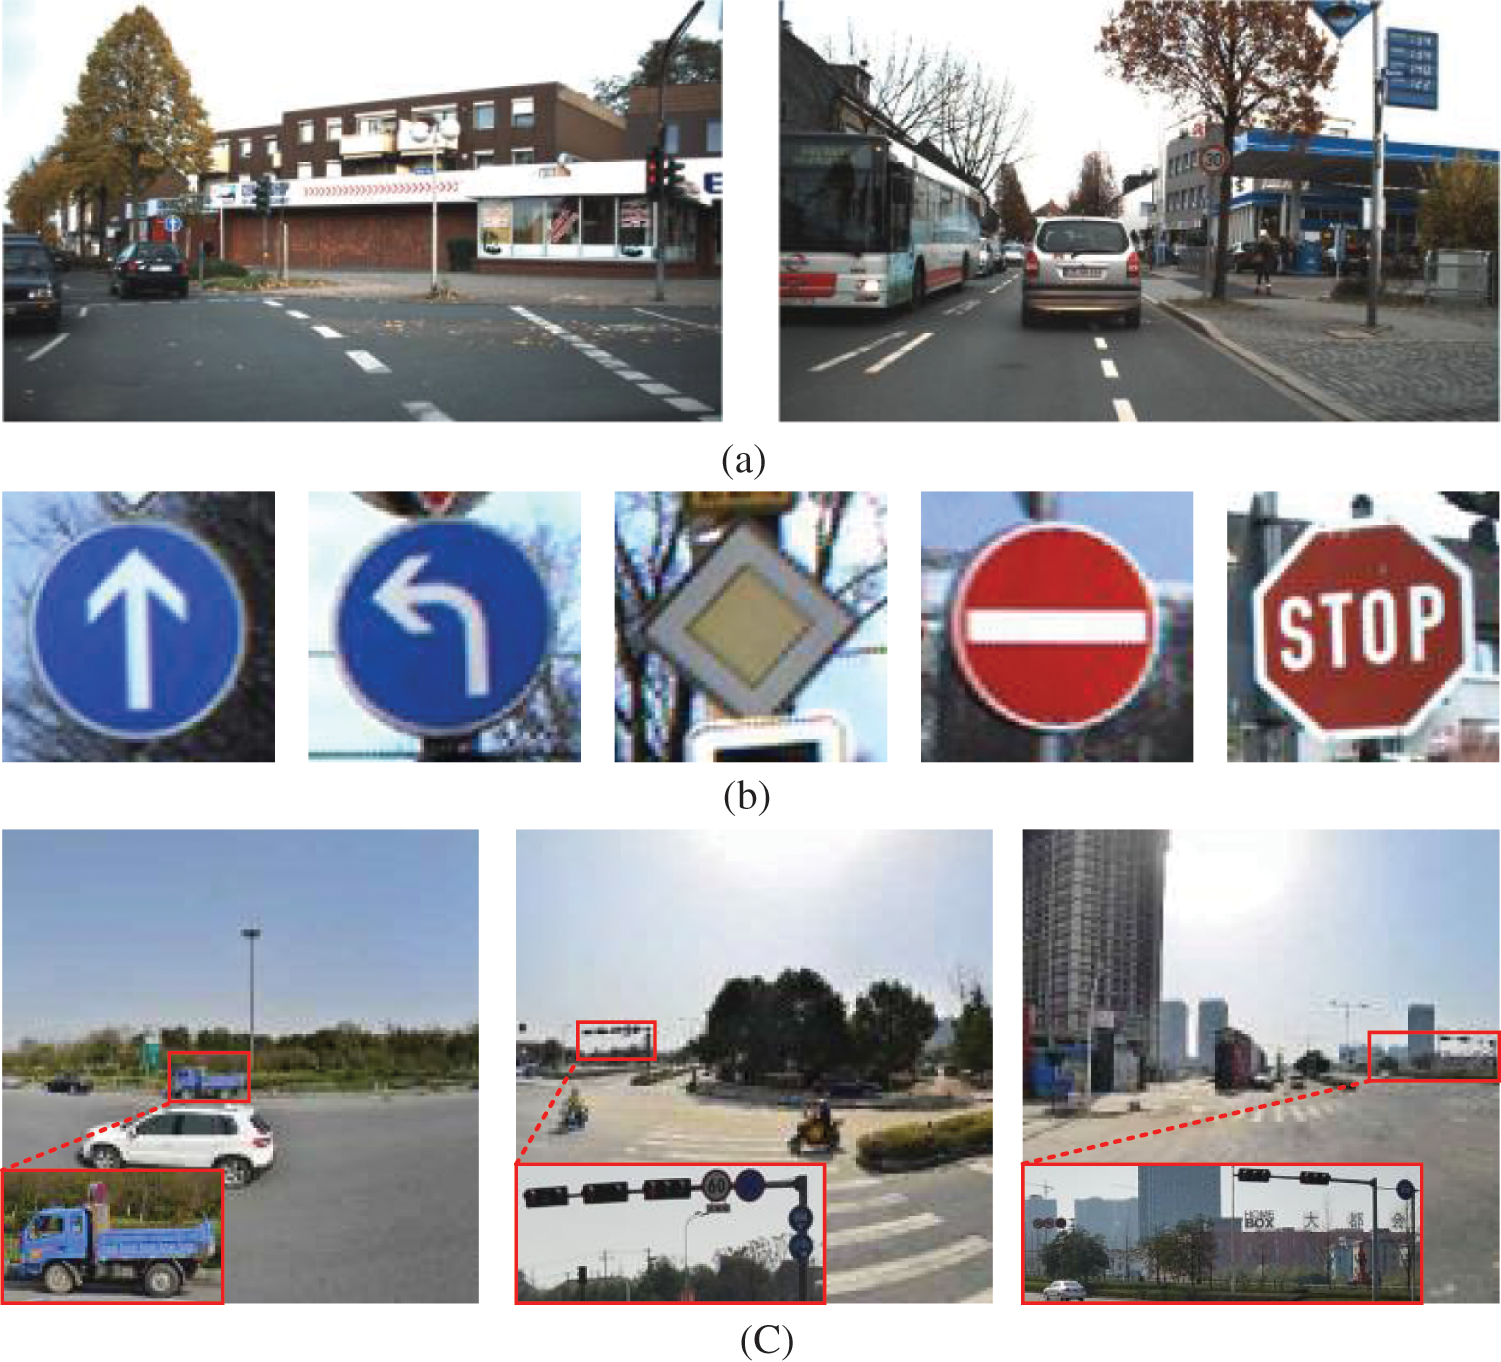
Figure 1: (a) Traffic sign examples in GTSDB dataset; (b) traffic sign examples in GTSRB dataset; (c) TT100K dataset
In realistic traffic scenarios, traffic signs are placed where they are most easily visible in the frontal direction of vehicle travel, usually on the right side of the road, in the median, or above the carriageway. Multiple signs are placed at the same location to ensure coordinated and complete information. Therefore, the spatial distribution of traffic signs is closely linked to other environmental elements such as roads and plays a crucial role in detecting and recognizing them. Additionally, the actual task is not limited to detecting a few categories. The CCTSDB benchmark, for instance, only contains three categories of prohibition, warning, and instruction, while the GTSDB benchmark only detects four major categories of traffic signs. One reason for this is the difficulty in constructing multi-category datasets with accurate labels. Another significant factor is the challenge of accurately detecting traffic signs in the real environment and achieving multi-category classification. The TT100k dataset is a Chinese traffic sign dataset that contains 221 categories, making it the most comprehensive traffic sign dataset currently available. It covers the majority of complex traffic scenes, with a large number of small object samples (37.5%), and the percentage of small and medium-sized targets (s ≤96 × 96) is as high as 89.5%. The image size is 2048 × 2048 pixels, and the small object samples (s ≤32 × 32) only account for less than 0.15% of the image area. Typically, size scaling is directly performed on these large input images, such as scaling the input size of 2048 × 2048 to 640 × 640 or 416 × 416, and then inputting the scaling result to the model for object detection. On the one hand, the original input size is too large, which is not conducive to model training, and on the other hand, it ensures real-time detection speed. However, this inevitably results in the loss of key information about small objects in the original image, which has a greater impact on multi-category recognition tasks. The TT100K dataset class distribution is extremely uneven, as shown in Fig. 2. The number of traffic sign categories reaches thousands of instances (e.g., the number of ‘pn’ categories is 2997), and lesser categories (e.g., ‘p7’) have only one instance, requiring a strong classification capability of the model. Most methods only classify a few super-classes, such as mandatory, hazardous, and prohibited, or a limited number of subclasses, such as 45 classes, which is far from meeting the actual task requirements.
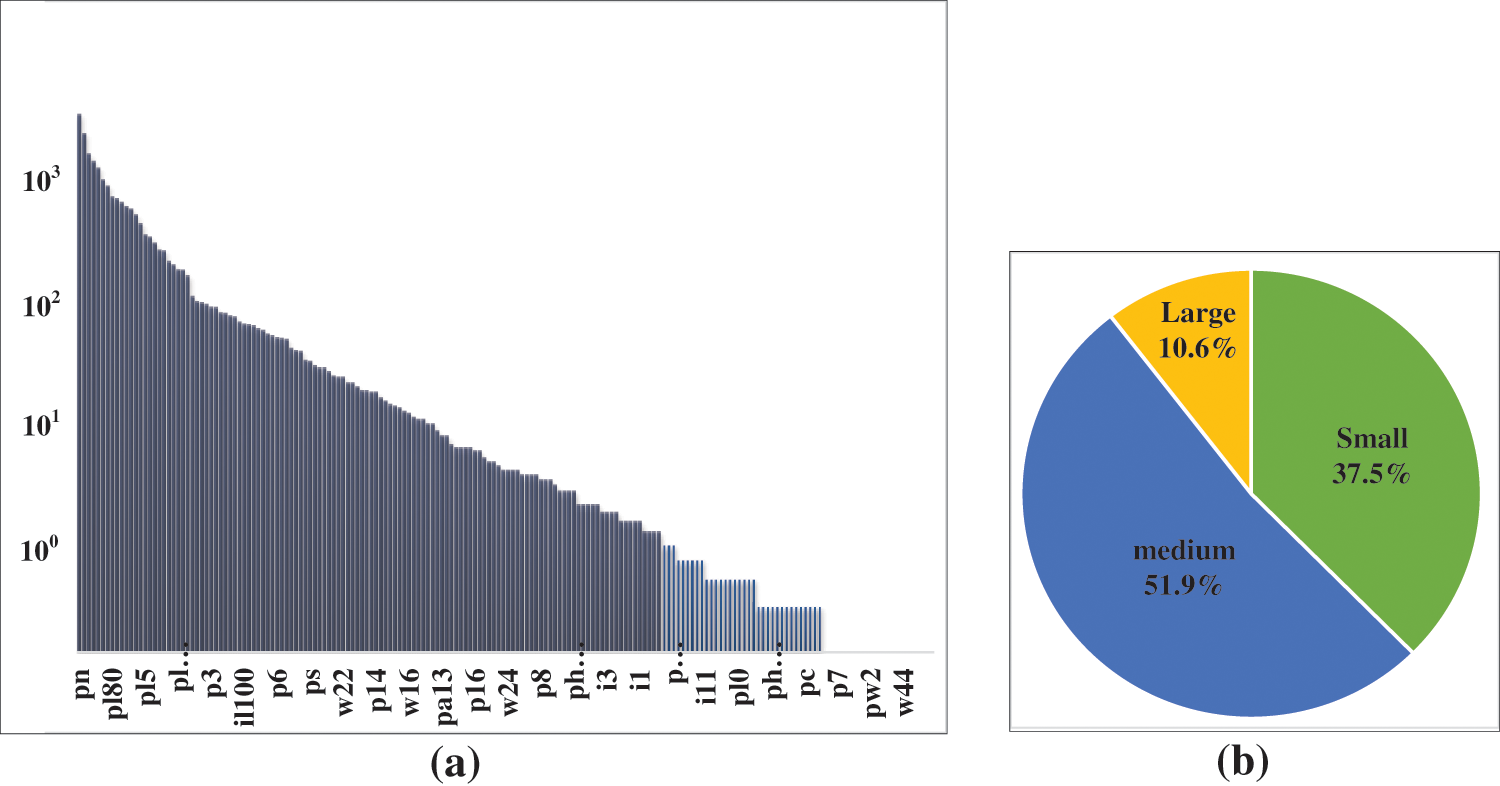
Figure 2: (a) Distribution of the number of traffic signs in TT100k; (b) traffic sign size distribution in TT100k, small objects (s ≤ 32), medium objects (32 < s < 96), and large objects (96 ≤ s)
This paper proposes a novel architecture for traffic sign recognition, comprising a lightweight pre-locator and a refined classification network. To address the loss of small object information due to input scaling of a large image, the pre-locator obtains sub-regions that may contain traffic signs, transforming the large-size original map directly into a specific-size submap for subsequent classification and regression, thus avoiding information loss. Unlike methods that perform limited class detection, we use a decoupled detection head to separate the localization and classification tasks for multi-category classification. Our proposed method achieves excellent performance in detecting and recognizing 218 categories. To learn the special location information of traffic signs, the local multi-scale feature information provided by the SPP [7] layer is fused with the global feature information provided by the Swin-Transformer [8] block, and a feature extraction module is constructed for this information fusion.
The main contributions of this paper are as follows:
1) A pre-positioning network (PPN) based on the ShuffleNetV2 [9] is constructed to improve the performance of small object detection.
2) A refinement classification network (RCN) that uses an improved YOLOX [10] is proposed.
3) A feature extraction module combining Swin-Transformer and SPP is used for the information fusion.
The rest of this paper is structured as follows. Section 2 reviews general object detection frameworks and compares state-of-the-art detection methods for traffic signs. Section 3 describes the proposed method. Section 4 presents the experimental result and analysis. Finally, we summarize the conclusions in Section 5.
This section first introduces general object detection methods, and then focuses on the methods related to traffic sign recognition.
Object detection algorithms can be divided into two research phases: the traditional methods phase and the deep learning-based methods phase. Traditional methods consist of three main parts: region selection (sliding window, ROI [11], etc.), feature extraction (SIFT [12], HOG [13], etc.) and classification (SVM, Adaboost [14], etc.). However, traditional detectors’ performance quickly saturates due to the poor robustness of manually designed features and the complex and time-consuming detection process.
In recent years, the dramatic increase in computing power of computer hardware, the rapid development of deep learning techniques, and the release of high-quality datasets have led to the widespread development of object detection algorithms based on deep learning. The CNN-based approaches have achieved great success in many fields. Devarajan et al. [15] used a CNN-based approach with artificial jellyfish optimization (AJO) to diagnose cervical cancer and achieved good performance. Shitharth et al. [16] proposed an enriched mechanism for detecting and classifying cyber-attack in SCADA systems, which combines RPCA and BCNN methods. Amanullah et al. [17] proposed a CNN-based prediction analysis method for preventing web phishing attacks, which achieved high accuracy. Mainstream CNN-based object detection methods are generally divided into two categories: two-stage methods and one-stage methods. The one-stage methods convert the object detection task into a regression problem, which can directly obtain the class and location coordinates of the object. Typical methods include YOLO [18], SSD [19], and RetinaNet [20]. The two-stage methods divide the detection problem into two stages: the first stage generates a region proposal containing approximate location information of the object, and the second stage classifies and regresses the content in the region of interest (ROI). The representative two-stage detection algorithms Such as Faster RCNN [21], Mask RCNN [11], etc. However, the two-stage architecture proposed in this paper differs from the above: the first stage is to perform coarse localization on the original map to find the sub-regions where objects exist to maximize the preservation of valid input information, especially small object information; the second stage is to perform classification and regression tasks.
For the CNN-based methods, Transformer has been commonly used in the field of computer vision in recent years due to its powerful feature extraction capability and self-attentiveness. Vision Transformer [22] (ViT) was the first to use a transformer in the CV domain, and after that, many Transformer-based methods have been proposed for processing CV domain-related tasks. Among them, the Swin-Transformer, which is based on the idea of the ViT model, innovatively introduces a sliding window mechanism that allows the model to learn information across the window, and through the down-sampling layer, enables the model to process super-resolution images, saving computational effort as well as being able to focus on global and local information.
In the early days, traffic sign recognition methods were artificially designed to extract features, such as methods based on shape, colour, or HOG. Due to this method’s cumbersome operation and inefficient algorithm cannot cope with the complex and changeable traffic environment.
In recent years, CNN-based methods have been mainly used in the field of traffic sign detection and recognition. The Branch Convolutional Neural Network (BNN) proposed by Hu et al. [23] and the weighted multi-convolutional neural network proposed by Natarajan et al. [24], which achieved high accuracy rates in the GTSRB dataset. However, recognizing general traffic signs, which occupy a relatively small area in the scene they are in, remains a challenge. To address this issue, researchers have proposed various methods, Han et al. [25] proposed an improved Faster-RCNN real-time small traffic signs detection algorithm, Sun et al. [26] put forward the Dense-RefineDet model, which combines a high-dimensional feature layer with a low-dimensional feature layer by constructing a dense connection block to obtain additional context information. Although this method improves the recognition rate of small objects, the missed detection rate has increased correspondingly. Jin et al. [27] proposed an improved SSD algorithm, which can enhance the effective channel features and suppress the invalid channel features by integrating low-dimensional features into high-dimensional features and improving the detection performance of small traffic signs. Shen et al. [28] proposed a novel group multi-scale attention pyramid network to improve small object detection performance mainly by learning multiscale information. These methods aim to enhance the detection performance of small traffic signs by integrating low-dimensional features into high-dimensional features, learning multiscale information, and improving the effective channel features while suppressing the invalid ones. Moreover, researchers have also proposed novel approaches to improve the accuracy of the classification task, such as the two-stage approach proposed by Wang et al. [29] and the classifier based on similarity metric learning. In Table 1, the relevant results of these methods are discussed and summarized.

In general, CNN-based algorithms have shown great potential in traffic sign recognition. However, the specific application methods should be adapted according to the traffic sign recognition scenarios. Our proposed method is more suitable for traffic sign recognition scenarios, unlike previous research work. Firstly, we separate the detection task from the recognition task, focusing on each task’s key points. Secondly, we propose a novel two-stage detection framework that can avoid information loss while maintaining fast detection speed. Furthermore, we achieved a better performance improvement by integrating Transformer-based self-attentive information into traffic sign recognition.
The architecture of the proposed method is shown in Fig. 3.
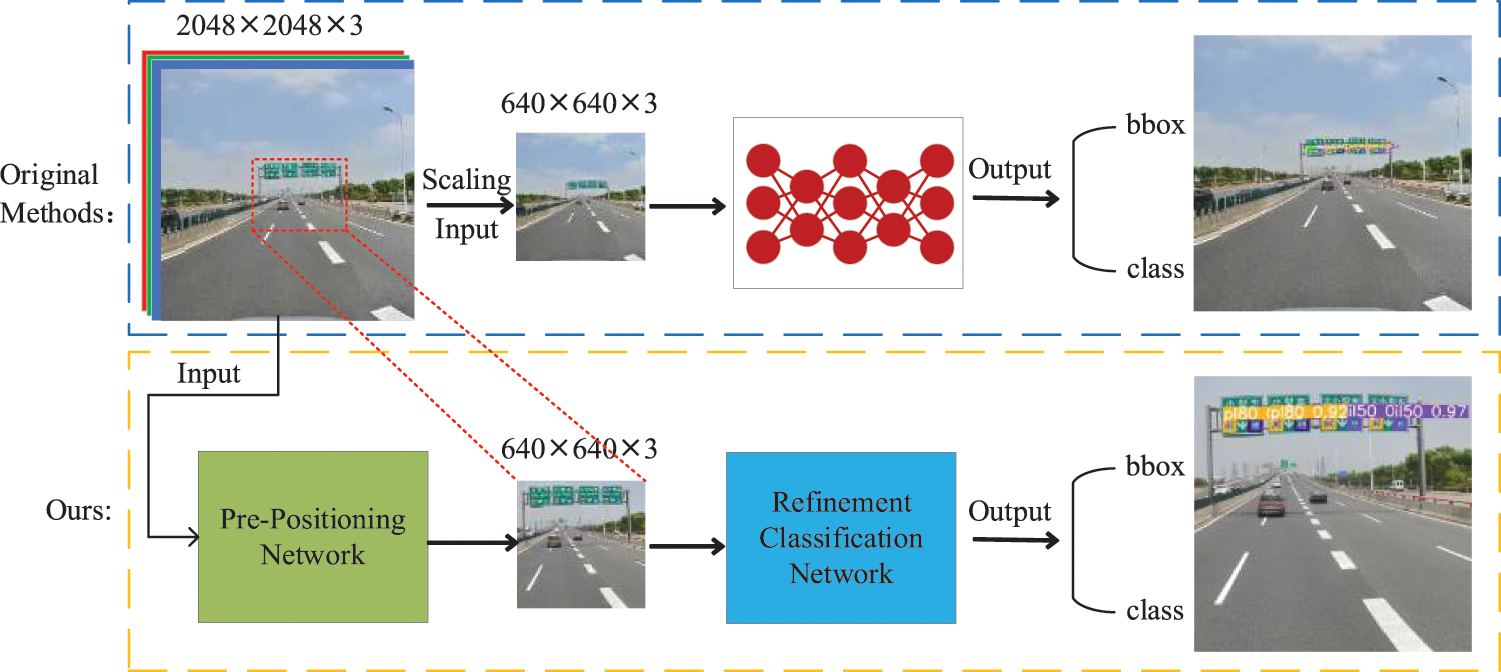
Figure 3: The proposed two-stage architecture
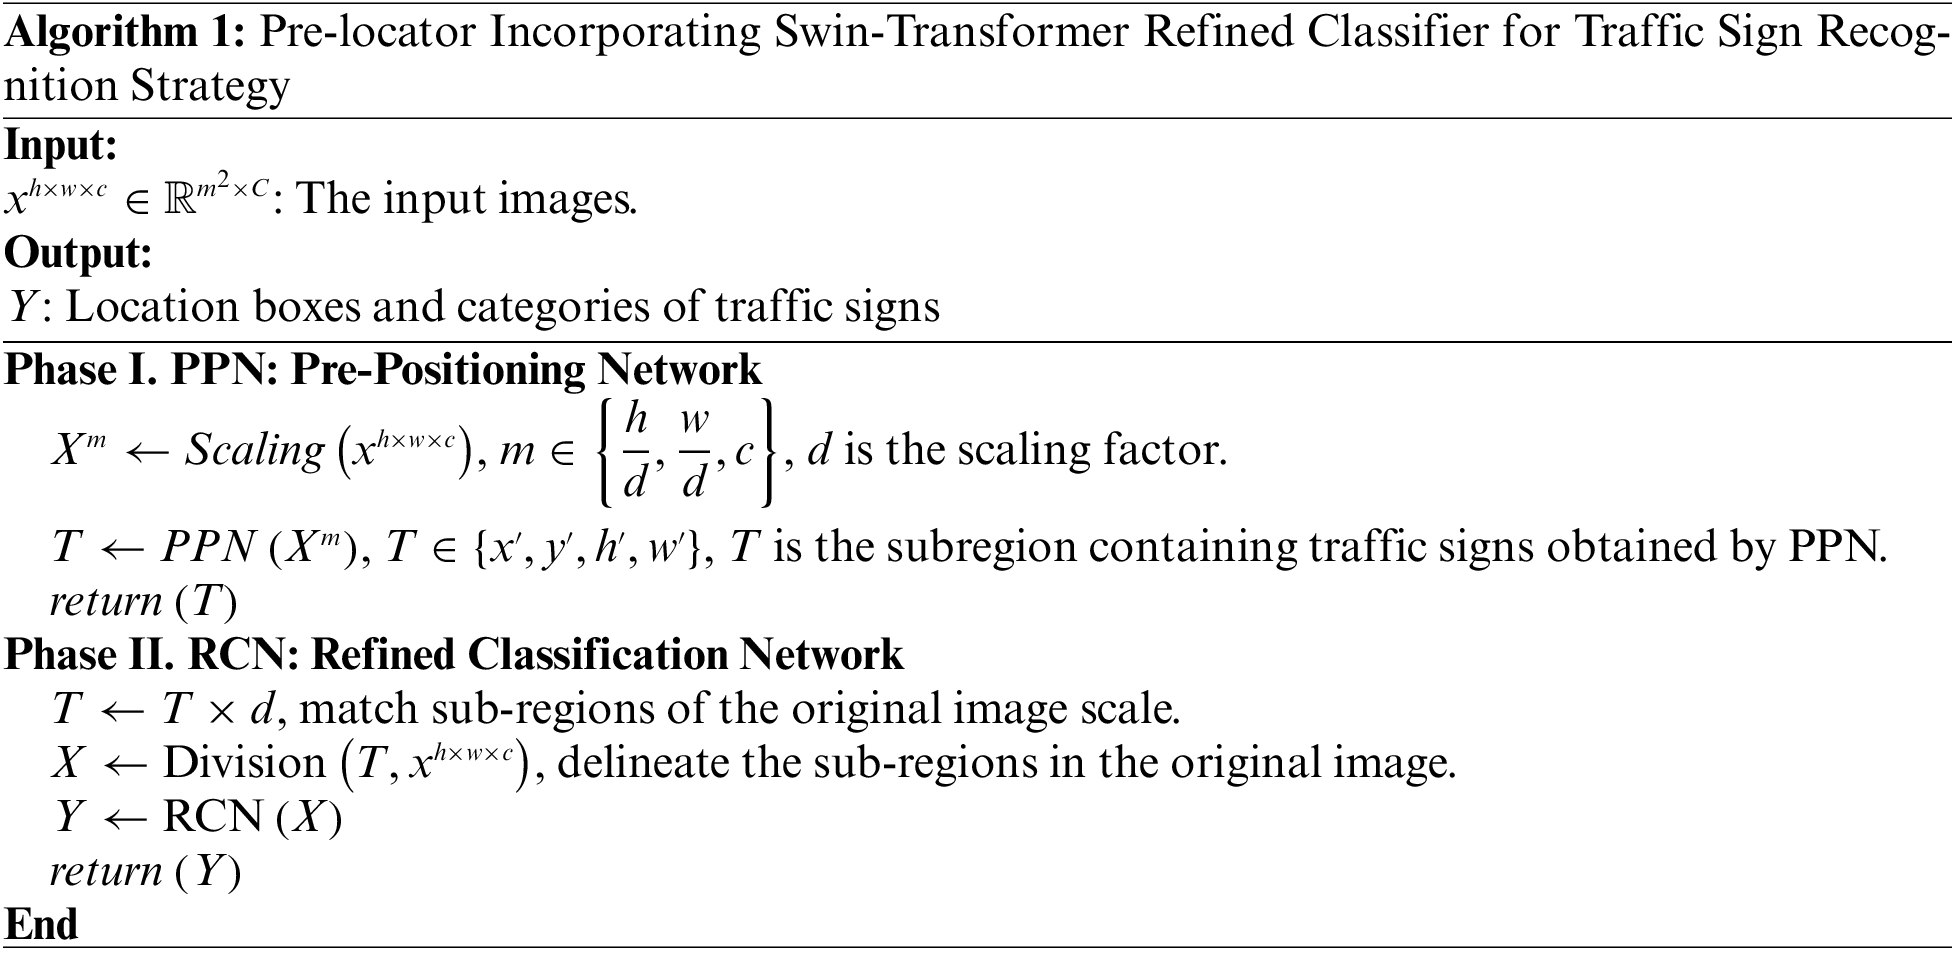
When an image captured from a real traffic scene is input, the first stage is to predict the approximate regions where traffic signs are present by a pre-positioning network (PPN), specifically to obtain sub-regions that may contain traffic signs in the input large image, and then in the next stage, a refined classification network (RCN) is to perform traffic sign recognition on these sub-regions. The specific process is shown in Algorithm 1.
In the PPN stage, for our task requirements, only coarse but inclusive localization boxes of all objects are needed, and we can use the scaled information for approximate position detection since the localization task is not sensitive to this. After that, the masked boxes are then matched to the original input to obtain sub-regions according to the size invariance of the image. This results in a significant increase in detection speed. In the RCN stage, lossless object information can be obtained, ensuring the recognition of the small targets.
3.1 Two-Stage Detection Architecture
In real traffic scenarios, traffic signs are usually concentrated in a certain area, such as the top of the road, as shown in Fig. 3. In many algorithms, the large-size traffic images that are input into the model are directly scaled down to a suitable size for model training. This process causes our original small object information to be lost and reduces the recognition performance of small objects. In addition, we found that this process mainly affects the classification task, as shown in Fig. 4. As we can see through our experiments, when we treat all traffic signs as a class, this time, the YOLOv5 algorithm is also able to detect traffic signs well, indicating that the main detection information can be retained as we narrow down the input scale information during the training process, while the detailed classification information needed to complete the classification task is severely lost in the process, which is reflected in only 71.4% precision and 38.9% recall for the 218 classes of the classification task.
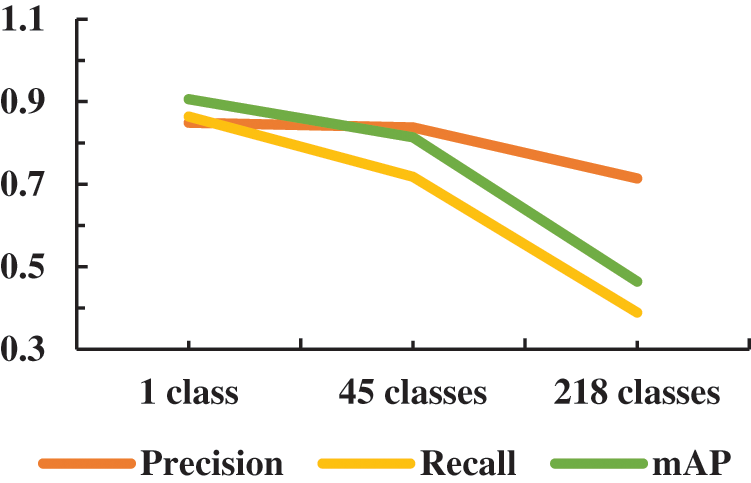
Figure 4: The accuracy, recall and mAP of YOLOv5 on TT100k for different number of categories
Therefore, we use a two-stage network detection, where the first stage aims to perform approximate localization, i.e., to find the sub-regions of the graph that contain traffic signs to preserve the traffic sign information in the original image; the second stage is to perform the main object detection and classification tasks, especially the multi-category classification tasks.
3.2 PPN: A Lightweight Localizer
The PPN consists of shuffleNetV2 as a feature extraction backbone, a lightweight FPN, and a YOLO detection head. Its structure is shown in Fig. 5. To adapt it to our task, only one or a few fixed-size regions containing traffic signs need to be detected. We chose a lightweight detection backbone based on shuffleNetV2, consisting mainly of a convolutional module as well as several Shuffle_Blocks. Shuffle_Blocks, as the main feature extraction layer, is an improvement of ShuffleNetV2 from ShuffleNet and has achieved excellent results in lightweight networks [30,31]. It inherits the group convolution, depth-separable convolution, and channel-mixing operations of ShuffleNet, with lightweight and efficient feature extraction capabilities. The convolutional layer among the neck network FPN is configured with only one layer of convolutional layers, and after the lightweight configuration, the sub-regions with the presence of traffic sign areas can be quickly acquired by feeding them into the YOLO detection head, as shown in Fig. 5. After the adjustment, obtain Lightweight localizer (1.62 M of parameters, 2.42G of GFLOPs, 3.4 M of weight file size).
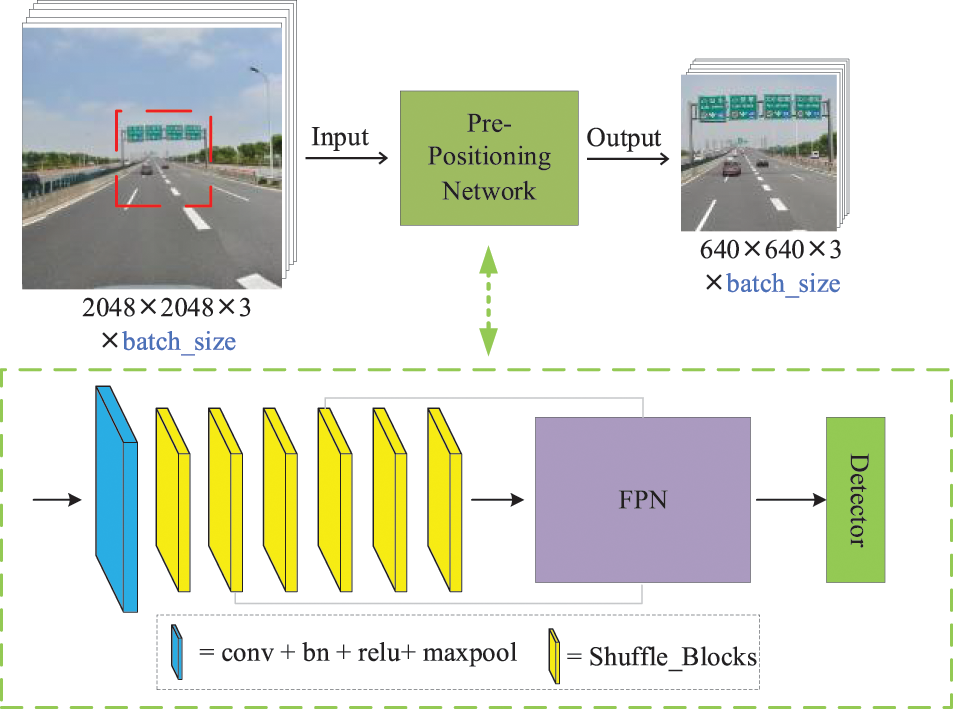
Figure 5: The PPN framework
3.3 Improved YOLOX for the RCN
The original YOLOX is modified for the traffic sign task. Inspired by the visual transformer, Swin-Transformer, TPH-YOLOv5 [32], we use the SPP-ST block as an effective feature extraction module. As shown in Fig. 6, we replace some CSP bottleneck blocks in the original version of YOLOX with SPP-ST blocks. Compared with the original bottleneck blocks in CSPDarknet53, the SPP-ST blocks are more effective in capturing global information and rich contextual information. On the TT100k dataset, the SPP-ST block performs better on small objects.
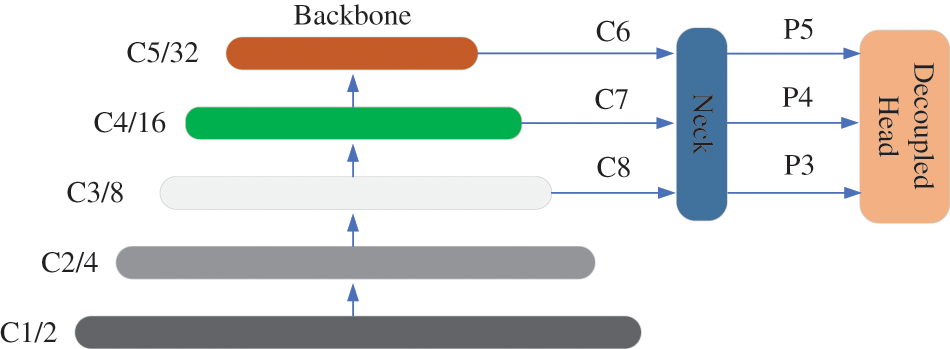
Figure 6: Composition of YOLOX
YOLOX adds Anchor free, advanced tag assignment strategy, decoupling header, and other improvements to YOLOv5 to achieve the highest performance. For traffic sign recognition, one of the great constraints on performance is the recognition of multiple categories, for example, the 221 traffic sign categories in the TT100k dataset need to be distinguished, and there are problems such as many categories, many small objects, and unbalanced data samples, for which the decoupling head in YOLOX can play an excellent role.
The two tasks of localization and classification have different focuses and interests. Classification focuses more on which of the extracted features is most similar to the existing categories. The localization is more concerned with the location coordinates of the ground truth box and thus the bounding box parameter correction. Therefore, if the same feature map is used for classification and localization, the effects will interfere with each other [33]. In addition, in the work of Wu et al., it is pointed out that fc-head is more suitable for classification tasks and conv-head is more suitable for localization tasks, and decoupled detection head is more advantageous for detecting small objects [34]. In YOLOX, the structure of the decoupled detection head is shown in Fig. 7, where a 1 × 1 convolutional layer is used to downscale the features of the FPN input, and then two branches of classification and localization are added, and two 3 × 3 convolutions are used in each of the classification and regression branches, which are finally adjusted to increase the parameters only a little bit to achieve the trade-off between detection effect and speed.
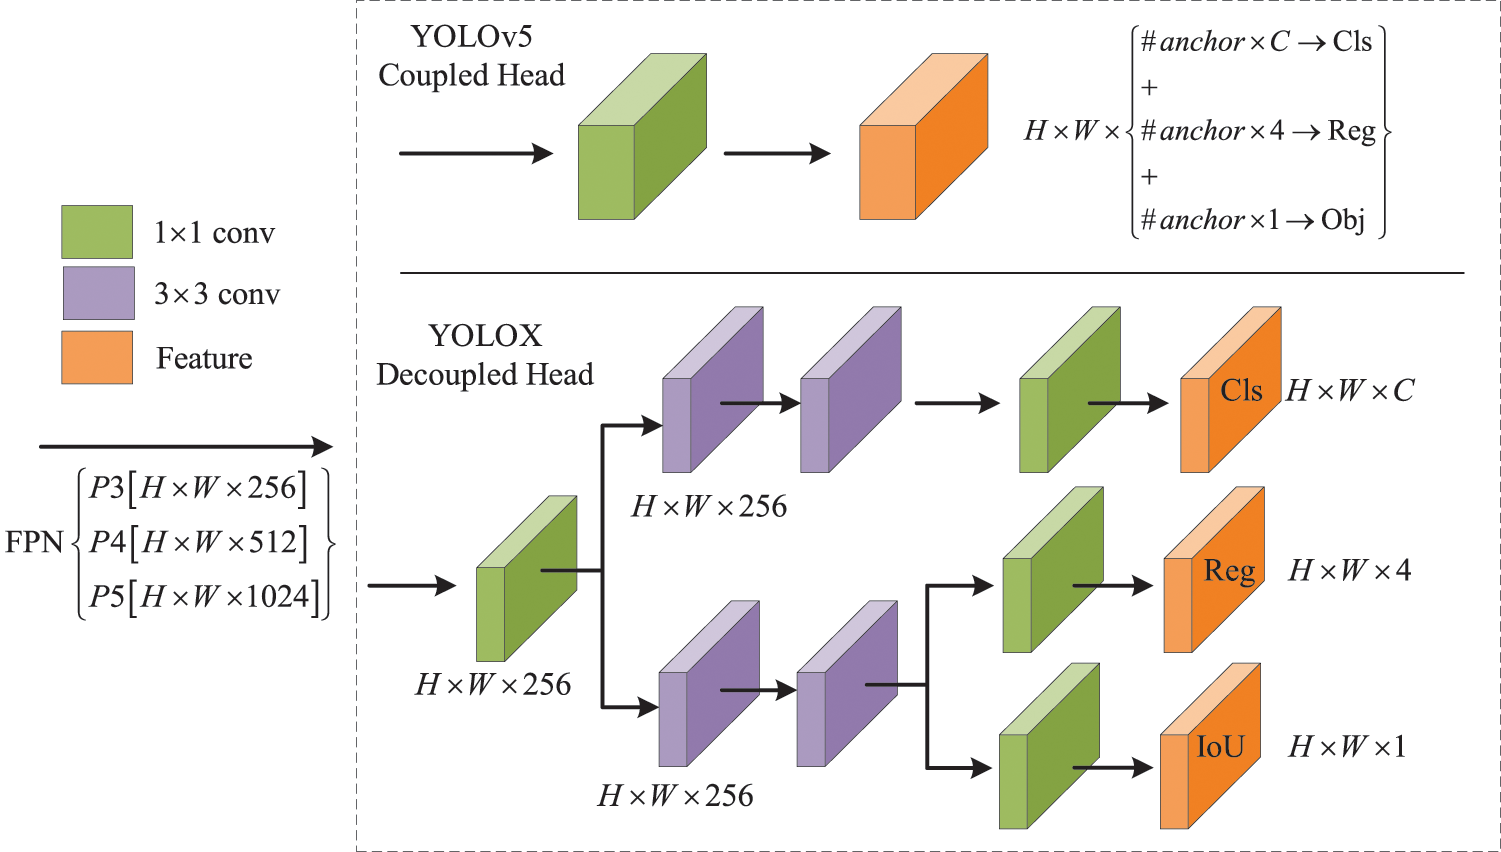
Figure 7: The structure of the decoupled detection head in YOLOX
The SPP-ST block consists of two parts, and the whole is designed in the form of residuals, as shown in Fig. 8. Firstly, the input features are downscaled by a convolution layer, and then passed into two branches, one branch is the SPP module, after kerning the input features as 5 × 5, 9 × 9, 13 × 13 max pooling, the perceptual field information of different sizes is obtained and fused.

Figure 8: Detail components of the SPP-ST block
The other branch is the Swin-Transformer module. Since winning the best paper in ICCV 2021, Swin-Transformer has brought Transformer-based algorithms to the attention of the computer vision field. Before Swin-Transformer was available, there were also many algorithms applying Transformer in the field of computer vision, such as the Vision Transformer (ViT) model proposed by Google in 2020, which applied Transformer to the image classification task by segmenting the input image into many blocks (Patches) of the same size (Patch) into many blocks of the same size, and thus input to the Transformer encoder for self-attentive computation; the DETR [35] target detection model proposed by Facebook AI Institute in 2020, which can obtain high-performance detection results without a priori frames. The Transformer is applied to different computer vision tasks, because the visual information flow is two-dimensional images or even three-dimensional video, and the calculation of Self-Attention in the Transformer needs to be performed on the matrix of the squared dimensions of the input information, the computational complexity is large, and the slightly larger resolution will seriously affect the Transformer’s In this regard, the Swin-Transformer algorithm is proposed.
Swin-Transformer is based on the idea of ViT, which divides the input image into several fixed-size Patches; the difference is that ViT performs Self-Attention computation on N Patches with a complexity of N2, while Swin-Transformer computes N Patches in groups, and the complexity of each group of constant-level Patches, the complexity can then be reduced to constant-level; meanwhile, this process Swin-Transformer replaces the conventional image division method in ViT using Shifted Windows, which avoids ViT’s fixed times of down-sampling to extract high-dimensional features, so that the features of each Patch can make full use of the information of neighbouring blocks, and improves the information interaction between patches, thus improving the performance of the model.
The Swin-Transformer module contains two parts, both of which have the same residual structure, as well as Norm, MLP layers. In the first part, the input feature map is divided into four image regions with regular windows, each of the same size, and self-attention is computed within each window region using a multi-headed self-attention mechanism (W-MSA). As shown in Fig. 9. Since the first part uses regular windows for self-attention calculation, this inevitably limits the information interaction between these four windows, so in the second part, Swin-Transformer also introduces the shifted window operation for better information interaction with other windows. The original 4 windows in “Layer 1” are shifted to 9 windows in “Layer 1 + 1”, and the shifted windows contain the information of the original adjacent windows, which span the boundary of the previous part of the windows for shifted window multi-headed self-attention (SW-MSA) feature extraction, providing the connection between them and enhancing the global information extraction capability.
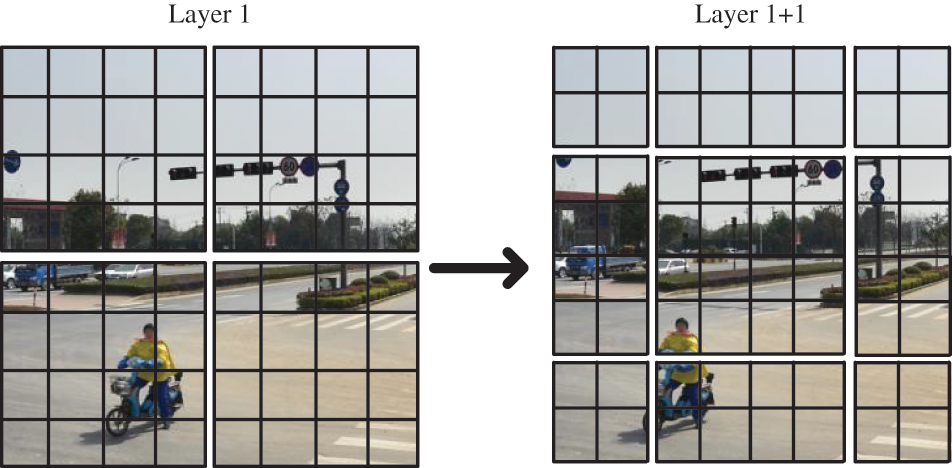
Figure 9: The Swin-transformer’s shifted window for multi-headed self-attention
The “Layer 1” layer first calculates the attention of the four regions, but this process weakens the connection between the traffic sign information in the upper right corner and the location of the road surface, and after the second sliding window process “Layer 1 + 1”, it enhances the knowledge of this location relationship, so that the model can learn this global spatial information.
In this way, it is possible to learn information about the particular distribution of traffic signs in terms of spatial location, concerning other environmental elements. The formula for calculating self-attention with the addition of a relative position encoding is as follows:
Here
The overall encoder formulas are as follows:
where
where
where
4 Experiment Result and Discussion
In this section, we introduce the dataset and evaluation metrics, parameter settings, and implementation details, and compare the performance in terms of accuracy and speed to other competitive approaches. Furthermore, we give the ablation studies and discussion.
4.1 Dataset and Evaluation Metric
We use the Tsing-Tencent 100k as the benchmark to evaluate the proposed method. TT-100k dataset contains 16,811 images of 2048 × 2048 pixels, which were collected from Chinese street scenes. A typical traffic sign is about 80 × 80 pixels in a 2048 × 2048 pixels image, or just 0.2% area of the image. To fully evaluate our method, we remove the three mixed classes “io”, “po”, and “wo” that may affect the classification performance. Finally, the recognition task of 218 categories is done.
Here, we refer to MS COCO’s object scales division methods, including small objects (s ≤ 32), medium objects (32 < s < 96), and large objects (96 ≤ s <+ ∞). Small and medium size objects accounted for 89.4% of the total in the TT100k dataset, The results show that the key to improving the performance of the traffic sign detection model is to improve its ability to detect small objects.
The model detection accuracy evaluation metric uses the precision-recall metric. The equations of these two metrics are shown below:
where TP denotes the number of True Positive sample instances. FP and FN denote False Positive values and False Negative values.
To quantitatively measure the trade-off between precision and recall, the Average Precision (AP) is proposed, which is the area under the precision vs. recall rate curve, and it reliably describes the trade-off between precision and recall. AP is the accuracy of computing one traffic sign class, and mAP is the average value of AP overall traffic sign classes. In this paper, the mAP is calculated under the condition that the Intersection-over-Union (IoU) with a value of 0.5 is used as the evaluation index.
The experimental platform is Ubuntu 20.4.1 operating system, Pytorch-1.7.1 deep learning framework, and the hardware configuration is: graphics GPU NVIDIA GeForce GTX3090, 24 GB video memory, and Intel (r) Core (TM) i9-10850k CPU @3.60 ghz.
We compare the classic two-stage object detection algorithm Faster RCNN [21], Cascade RCNN [36] algorithm, the single-stage algorithms SSD512, YOLOv5, the recent algorithms TPH-YOLOv5 [32] and Scaled-YOLOv4 [37] in the field of object detection and some algorithms in the field of traffic signs.
Algorithm Faster RCNN, Cascade RCNN, and SSD512, were trained on MMDetection [38] for 36 batches. In the training process, the default data enhancement technology and super parameters in the MMDetection framework are adopted, and the stochastic gradient descent (SGD) optimization algorithm is used. Algorithms YOLOv5, YOLOX, TPH-YOLOv5, and ScaledYOLOv4 [37] train 300 batches, and the first three batches are preheated by using the SGD optimization algorithm and Warmup learning rate preheating method. The initial learning rate is 0.01, the learning rate is updated by cosine annealing, and the final learning rate is attenuated to 0.002. The parameter settings of each method are shown in Table 2.

4.3 Comparison with the State-of-the-Art Methods
In this section, we compare the algorithm consisting of PPN and RCN with other state-of-the-art methods. Our improved algorithm obtains state-of-the-art results, specifically achieving 94.1 mAP on detecting 45 categories and 82.1 mAP on 218 categories.
As can be seen from Table 3, we first did experiments with 45 traffic sign categories, most of the current algorithms achieve high performance in detecting and recognizing 45 categories, e.g., method TPH-YOLOv5s achieves 90.5 mAP and fast detection speed of 21.5 ms per image when detecting 1280 × 1280 images, YOLOX achieves better results under the same conditions with 92.5 mAP, 17.1 ms per image, Wang et al. [29] achieved mAP of 92.1. The experimental results show that the YOLOX-s algorithm achieved high performance for the same image input scale (resolution 640 × 640, mAP of 88.1), and when we set the input scale to a resolution of 1280 × 1280, the YOLOX-s algorithm achieves a higher mAP of 92.5 (4.4 percentage point increase), which shows that for traffic sign detection and recognition tasks, obtaining a better performance requires avoiding loss of information.

The performance of many algorithms decreased significantly when the number of categories increased from 45 to 218. For example, YOLOv5’s performance decreased from 80.1 to 46.4 (a decrease of 33.7%), and YOLOX’s performance decreased from 88.1 to 62.4 (a decrease of 25.7%). This highlights the difficulty of multi-category classification tasks in real-world traffic scenarios. To demonstrate the effectiveness of our proposed method, we conducted a detection and recognition task with 218 traffic categories and evaluated the size and detection speed of each model. The improved YOLOX-s model increased in size from 18.2 to 19.8 with a small increase in parameters, and the mAP of 45 categories increased from 92.5 to 94.1 (an increase of 1.6%). Additionally, by adding PPN to the algorithm model of 218 categories, the mAP of the original YOLOX-s increased from 62.4 to 82.1, showing an improvement of nearly 20 percentage points. Our proposed method (PPN + RCN) is faster and more accurate compared to the method proposed by Wu et al. [39] (74.3 mAP achieved on 200 categories).
In summary, our method achieved excellent performance, improving the mAP from 62.4 to 82.1 when compared to YOLOX-s. However, this method comes with increased computational complexity, with the parameter count increasing from 34.4 to 42.2 (22.67% increase), and floating-point operations increasing from 27.2 GFLOPs to 55.2 GFLOPs. The inference speed has also increased from 3.1 to 42.9 ms. Nevertheless, these trade-offs are worthwhile, as our method has achieved the best performance when compared to other advanced methods, striking a better trade-off between speed and accuracy.
4.4 Ablation Studies and Discussion
4.4.1 The Ablation Analysis of PPN
To demonstrate the effectiveness of our incorporation of the PPN network, we did ablation experiments on YOLOv5-s and YOLOX-s, and the results are shown in Table 4. After adding PPN processing, the accuracy and recall of these two algorithms improved; in terms of accuracy, YOLOv5-s with the addition of the pre-locator PPN has a little decrease in small targets and large objects, but among them, equal-size objects gain a significant performance improvement (up 10.6 percent), while YOLOX-s improves performance in all sizes; in terms of recall, the addition of the PPN improves the two model algorithms even more, e.g., YOLOv5-s improves the recall of small objects detection by 36.4 percentage points, medium objects by 33 percentage points, and large objects by 27.4 percentage points, and YOLOX-s improves the recall of small objects by 17.4 percentage points, medium objects by 11.4 percentage points, and large objects by 1.3 percentage points. This indicates on the one hand that the model achieved a large improvement in both detection and classification performance for small targets after adding the PPN network; on the other hand, it also indicates that models such as YOLOv5 are more sensitive to the loss of information classification in multiple categories and can improve the performance of the model in detecting and identifying objects of all sizes when the lost information is reduced.

4.4.2 The Ablation Analysis of SPP-ST Block
As shown in Fig. 10, in this process, we replaced all the C3 modules in YOLOX with SPP-ST, the effect was not obvious, and the number of model parameters increased more, so we only replaced C1, C2, and C5 in the backbone, after such adjustments, our effect reached the best, and the number of model parameters increased by only 5%.
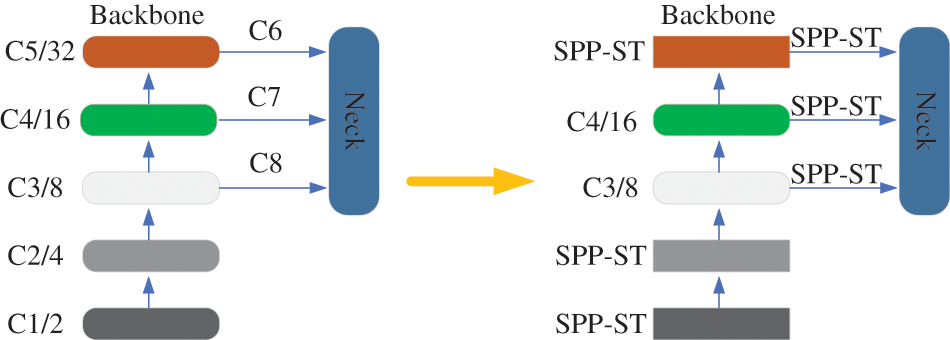
Figure 10: SPP-ST module replaces the C3 module in the same position in YOLOX
YOLOX achieved a large improvement in small object detection performance (from 69.1 to 88.3) after the improvement by PPN before replacing our proposed module, but this process led to a decrease in the detection of large objects. After the improvement by our proposed SPP-ST module, the YOLOX-s algorithm achieves an overall performance improvement and achieves the best detection results, as shown in Table 5.

To visualize the effect of replacing the SPP-ST module, we visualize the thermal features of the C2/4 module in the Backbone and C7 module in the Neck before improving YOLOX-s. As shown in Fig. 11, the more intense heat of the feature represents the higher probability of the presence of traffic signs in the region. Before the improvement, the feature heat map of the C2/4 module shows more scattered and unfocused, especially the features at the small target of traffic signs have a lot of interference, and the feature information of the small target is not accurately extracted, and most of the feature attention is put into other irrelevant scene information; the feature heat map of C7 module shows a broader area, the positioning is not clear enough, and the feature areas are many but not fine; after improvement, it can be seen that the features after the model focus on the traffic sign target with dramatic brightness and less interference from surrounding information, which indicates that SPP-ST can extract more detailed feature information and find the location features and classification features of traffic signs more easily by fusing the multi-scale information of SPP and the rich global information of Swin-Transformer.
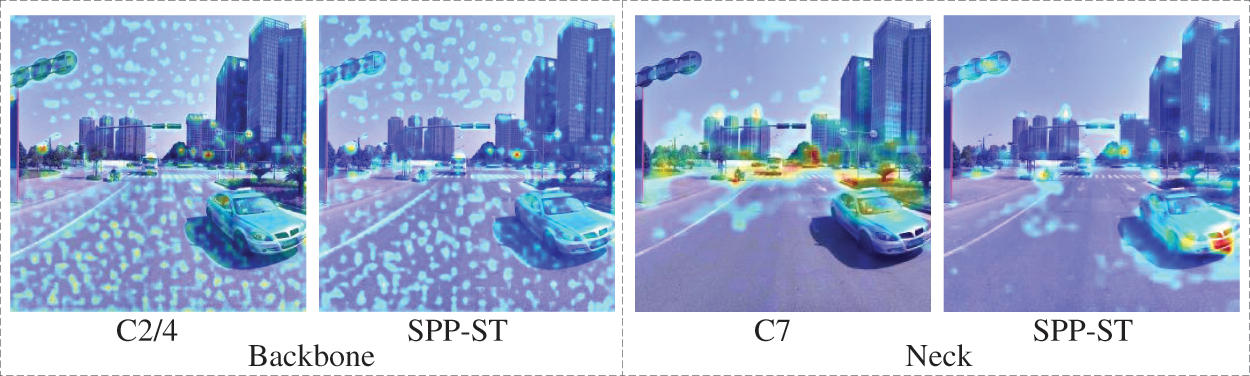
Figure 11: The feature visualization heat map
As shown in Fig. 12, compared with the base network, before the improvement, the base networks such as YOLOv5 and YOLOX had more serious missed detection for small objects (0, 32], and the classification confidence of each target is not high, by adding the PPN network, the loss of small object information was avoided, and the introduction of the SPP-ST module enhanced the feature extraction capability of the module. Our modified network mainly improves the performance for (0, 32] and (32, 96) sizes.
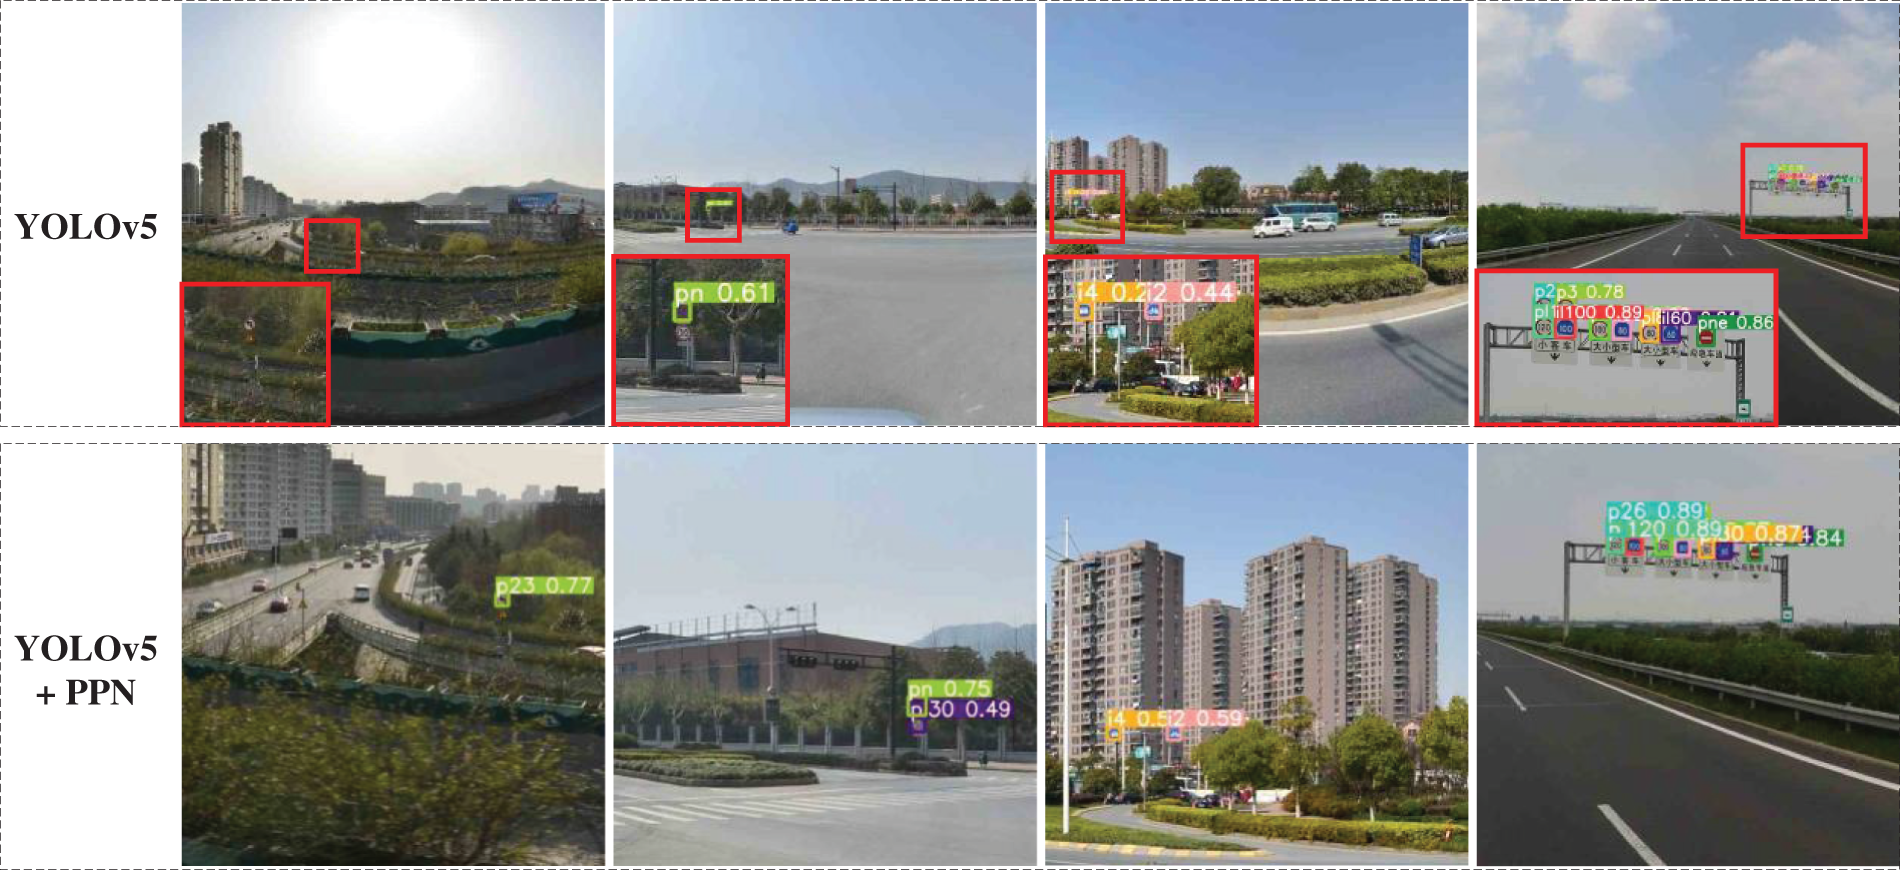
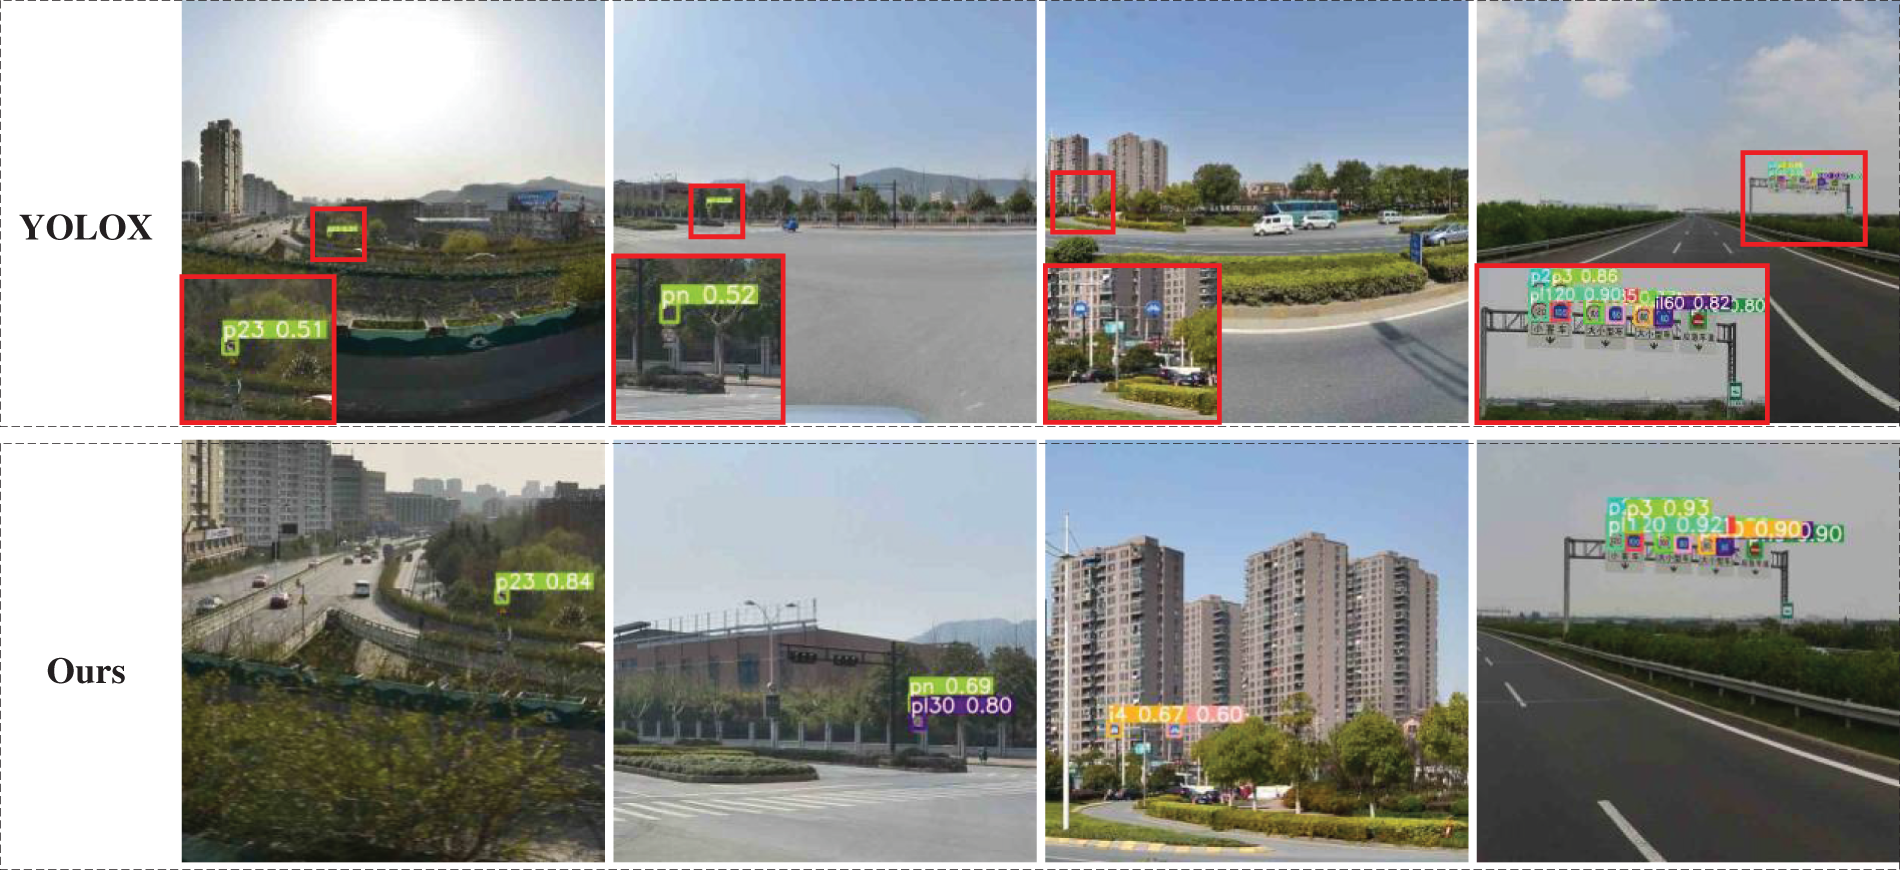
Figure 12: Before the improvement, the base network YOLOv5 and YOLOX had the phenomenon of missing detection for small objects
In this paper, we propose a novel traffic sign recognition method by combining a lightweight localizer with a refinement classifier. The method is capable of detecting and recognizing various subclasses of traffic signs in complex scenes. The lightweight localizer is used to locate the approximate area where traffic signs are present in the original map and transform the large-size original map directly into a specific-size submap for subsequent classification and regression, which avoids the loss of small object information. Moreover, we construct a feature extraction module that incorporates the Swin-Transformer and SPP modules for information fusion. The experiment results show that the proposed method is effective and outperforms the competitive methods. Furthermore, ablation experiments illustrate that the two-stage detection architecture has brought considerable performance improvement for the small object of traffic signs. Meanwhile, the information fusion of the SPP-ST module also contributes to performance improvement.
However, there is still a lot of room for optimization of our method. In this paper, we mainly focus on avoiding the loss of small object information and using the limited input information more effectively, without considering other realistic factors, such as bad weather conditions and dark scenes, which can greatly affect the effectiveness of traffic sign recognition techniques. From the perspective of ground application, the detector also needs to be more lightweight and efficient and reduce the false detection rate.
Funding Statement: This work is supported by the Natural Science Foundation of Sichuan, China (No. 2022NSFSC0571) and the Sichuan Science and Technology Program (No. 2018JY0273, No. 2019YJ0532). This work is supported by funding of V.C. & V.R. Key Lab of Sichuan Province (No. SCVCVR2020.05VS). This work is also supported by the China Scholarship Council (No. 201908510026).
Conflicts of Interest: The authors declare that they have no conflicts of interest to report regarding the present study.
References
1. J. Stallkamp, M. Schlipsing, J. Salmen and C. Igel, “Man vs. computer: Benchmarking machine learning algorithms for traffic sign recognition,” Neural Networks, vol. 32, pp. 323–332, 2012. [Google Scholar] [PubMed]
2. J. Zhang, Z. Xie, J. Sun, X. Zou and J. Wang, “A cascaded r-cnn with multiscale attention and imbalanced samples for traffic sign detection,” IEEE Access, vol. 8, pp. 29742–29754, 2020. [Google Scholar]
3. J. Stallkamp, M. Schlipsing, J. Salmen and C. Igel, “The German traffic sign recognition benchmark: A multi-class classification competition,” in The 2011 Int. Joint Conf. on Neural Networks, San Jose, CA, USA, pp. 1453–1460, 2011. [Google Scholar]
4. U. Kamal, T. I. Tonmoy, S. Das and M. K. Hasan, “Automatic traffic sign detection and recognition using segu-net and a modified tversky loss function with l1-constraint,” IEEE Transactions on Intelligent Transportation Systems, vol. 21, no. 4, pp. 1467–1479, 2019. [Google Scholar]
5. Y. C. Liu, G. Shi, Y. X. Li and Z. Y. Zhao, “M-yolo: Traffic sign detection algorithm applicable to complex scenarios,” Symmetry-Basel, vol. 14, no. 5, pp. 21, 2022. [Google Scholar]
6. Z. Zhe, D. Liang, S. Zhang, X. Huang and S. Hu, “Traffic-sign detection and classification in the wild,” in 2016 IEEE Conf. on Computer Vision and Pattern Recognition (CVPR), Las Vegas, NV, USA, pp. 2110–2118, 2016. [Google Scholar]
7. K. He, X. Zhang, S. Ren and J. Sun, “Spatial pyramid pooling in deep convolutional networks for visual recognition,” IEEE Transactions on Pattern Analysis and Machine Intelligence, vol. 37, no. 9, pp. 1904–1916, 2015. [Google Scholar] [PubMed]
8. Z. Liu, Y. Lin, Y. Cao, H. Hu, Y. Wei et al., “Swin transformer: Hierarchical vision transformer using shifted windows,” in Proc. of the IEEE/CVF Int. Conf. on Computer Vision, Montreal, QC, Canada, pp. 10012–10022, 2021. [Google Scholar]
9. N. Ma, X. Zhang, H. -T. Zheng and J. Sun, “Shufflenet v2: Practical guidelines for efficient cnn architecture design,” in Proc. of the European Conf. on Computer Vision (ECCV), Munich, Germany, pp. 116–131, 2018. [Google Scholar]
10. Z. Ge, S. Liu, F. Wang, Z. Li and J. Sun, “Yolox: Exceeding yolo series in 2021,” arXiv preprint arXiv: 08430, 2021. [Google Scholar]
11. K. M. He, G. Gkioxari, P. Dollar and R. Girshick, “Mask r-cnn,” IEEE Transactions on Pattern Analysis and Machine Intelligence, vol. 42, no. 2, pp. 386–397, 2020. [Google Scholar] [PubMed]
12. D. G. Lowe, “Distinctive image features from scale-invariant keypoints,” International Journal of Computer Vision, vol. 60, no. 2, pp. 91–110, 2004. [Google Scholar]
13. N. Dalal and B. Triggs, “Histograms of oriented gradients for human detection,” in 2005 IEEE Computer Society Conf. on Computer Vision and Pattern Recognition (CVPR’05), San Diego, CA, USA, pp. 886–, 2005. [Google Scholar]
14. P. Viola and M. Jones, “Rapid object detection using a boosted cascade of simple features,” in Proc. of the 2001 IEEE Computer Society Conf. on Computer Vision and Pattern Recognition. CVPR 2001, Kauai, HI, USA, pp. I, 2001. [Google Scholar]
15. D. Devarajan, D. S. Alex, T. Mahesh, V. V. Kumar, R. Aluvalu et al., “Cervical cancer diagnosis using intelligent living behavior of artificial jellyfish optimized with artificial neural network,” IEEE Access, vol. 10, pp. 126957–126968, 2022. [Google Scholar]
16. S. Shitharth, K. M. Prasad, K. Sangeetha, P. R. Kshirsagar, T. S. Babu et al., “An enriched rpco-bcnn mechanisms for attack detection and classification in scada systems,” IEEE Access, vol. 9, pp. 156297–156312, 2021. [Google Scholar]
17. M. Amanullah, V. Selvakumar, A. Jyot, N. Purohit, S. Shitharth et al., “Cnn based prediction analysis for web phishing prevention,” in 2022 Int. Conf. on Edge Computing and Applications (ICECAA), Tamilnadu, India, pp. 1–7, 2022. [Google Scholar]
18. J. Redmon and A. Farhadi, “Yolov3: An incremental improvement,” arXiv: 1804.02767, 2018. [Google Scholar]
19. W. Liu, D. Anguelov, D. Erhan, C. Szegedy, S. Reed et al., “Ssd: Single shot multibox detector,” in European Conf. on Computer Vision, Amsterdam, Netherlands, pp. 21–37, 2016. [Google Scholar]
20. T. -Y. Lin, P. Goyal, R. Girshick, K. He and P. Dollár, “Focal loss for dense object detection,” in Proc. of the IEEE Int. Conf. on Computer Vision, Honolulu, HI, USA, pp. 2980–2988, 2017. [Google Scholar]
21. S. Ren, K. He, R. Girshick and J. J. A. i. n. i. p. s. Sun, “Faster r-cnn: Towards real-time object detection with region proposal networks,” Advances in Neural Information Processing Systems, vol. 39, pp. 1137–1149, 2015. [Google Scholar]
22. A. Dosovitskiy, L. Beyer, A. Kolesnikov, D. Weissenborn, X. Zhai et al., “An image is worth 16×16 words: Transformers for image recognition at scale,” arXiv preprint arXiv: 11929, 2020. [Google Scholar]
23. W. Hu, Q. Zhuo, C. Zhang and J. Li, “Fast branch convolutional neural network for traffic sign recognition,” IEEE Intelligent Transportation Systems Magazine, vol. 9, no. 3, pp. 114–126, 2017. [Google Scholar]
24. S. Natarajan, A. K. Annamraju and C. S. Baradkar, “Traffic sign recognition using weighted multi-convolutional neural network,” IET Intelligent Transport Systems, vol. 12, no. 10, pp. 1396–1405, 2018. [Google Scholar]
25. C. Han, G. Gao and Y. Zhang, “Real-time small traffic sign detection with revised faster-rcnn,” Multimedia Tools and Applications, vol. 78, no. 10, pp. 13263–13278, 2019. [Google Scholar]
26. C. Sun, Y. Ai, S. Wang and W. J. S. Zhang, “Dense-refinedet for traffic sign detection and classification,” Sensors, vol. 20, no. 22, pp. 6570–6586, 2020. [Google Scholar] [PubMed]
27. Y. Jin, Y. Fu, W. Wang, J. Guo, C. Ren et al., “Multi-feature fusion and enhancement single shot detector for traffic sign recognition,” IEEE Access, vol. 8, pp. 38931–38940, 2020. [Google Scholar]
28. L. L. Shen, L. You, B. Peng and C. H. Zhang, “Group multi-scale attention pyramid network for traffic sign detection,” Neurocomputing, vol. 452, pp. 1–14, 2021. [Google Scholar]
29. Z. S. Wang, J. Q. Wang, Y. L. Li and S. J. Wang, “Traffic sign recognition with lightweight two-stage model in complex scenes,” IEEE Transactions on Intelligent Transportation Systems, vol. 23, no. 2, pp. 1121–1131, 2022. [Google Scholar]
30. S. Mehta, H. Hajishirzi and M. Rastegari, “Dicenet: Dimension-wise convolutions for efficient networks,” IEEE Transactions on Pattern Analysis and Machine Intelligence, vol. 44, no. 5, pp. 2416–2425, 2022. [Google Scholar] [PubMed]
31. W. Ji, Y. Pan, B. Xu and J. Wang, “A Real-time apple targets detection method for picking robot based on shufflenetv2-yolox,” Agriculture-Basel, vol. 12, no. 6, pp. 856, 2022. [Google Scholar]
32. X. Zhu, S. Lyu, X. Wang and Q. Zhao, “Tph-yolov5: Improved yolov5 based on transformer prediction head for object detection on drone-captured scenarios,” in Proc. of the IEEE/CVF Int. Conf. on Computer Vision, Montreal Canada, pp. 2778–2788, 2021. [Google Scholar]
33. G. Song, Y. Liu and X. Wang, “Revisiting the sibling head in object detector,” in Proc. of the IEEE/CVF Conf. on Computer Vision and Pattern Recognition, Seattle, WA, USA, pp. 11563–11572, 2020. [Google Scholar]
34. Y. Wu, Y. Chen, L. Yuan, Z. Liu, L. Wang et al., “Rethinking classification and localization for object detection,” in Proc. of the IEEE/CVF Conf. on Computer Vision and Pattern Recognition, Seattle, WA, USA, pp. 10186–10195, 2020. [Google Scholar]
35. N. Carion, F. Massa, G. Synnaeve, N. Usunier, A. Kirillov et al., “End-to-end object detection with transformers,” in Computer Vision–ECCV 2020: 16th European Conf., Glasgow, UK, August 23–28, 2020, Proc., Part I 16, Glasgow, UK, pp. 213–229, 2020. [Google Scholar]
36. Z. Cai and N. Vasconcelos, “Cascade r-cnn: Delving into high quality object detection,” in Proc. of the IEEE Conf. on Computer Vision and Pattern Recognition, Salt Lake City, UT, USA, pp. 6154–6162, 2018. [Google Scholar]
37. C. -Y. Wang, A. Bochkovskiy and H. -Y. M. Liao, “Scaled-yolov4: Scaling cross stage partial network,” in In Proc. of the IEEE/cvf Conf. on Computer Vision and Pattern Recognition, Online, pp. 13029–13038, 2021. https://cvpr2021.thecvf.com/ [Google Scholar]
38. K. Chen, J. Wang, J. Pang, Y. Cao, Y. Xiong et al., “Mmdetection: Open mmlab detection toolbox and benchmark,” arXiv preprint arXiv: 1906.07155, 2019. [Google Scholar]
39. Y. Wu, Z. Li, Y. Chen, K. Nai and J. Yuan, “Real-time traffic sign detection and classification towards real traffic scene,” Multimedia Tools and Applications, vol. 79, no. 25, pp. 18201–18219, 2020. [Google Scholar]
Cite This Article
 Copyright © 2023 The Author(s). Published by Tech Science Press.
This work is licensed under a Creative Commons Attribution 4.0 International License , which permits unrestricted use, distribution, and reproduction in any medium, provided the original work is properly cited.
 Downloads
 Citation Tools