
 Submit a Paper
 Propose a Special lssue
 Open Access
ARTICLE

Point Cloud Based Semantic Segmentation Method for Unmanned Shuttle Bus
School of Automation, Chengdu University of Information Technology, Chengdu, 610225, China
* Corresponding Author: Jianying Yuan. Email:
Intelligent Automation & Soft Computing 2023, 37(3), 2707-2726. https://doi.org/10.32604/iasc.2023.038948
Received 05 January 2023; Accepted 23 April 2023; Issue published 11 September 2023
 View Full Text
 Download PDF
Abstract
The complexity of application scenarios and the enormous volume of point cloud data make it difficult to quickly and effectively segment the scenario only based on the point cloud. In this paper, to address the semantic segmentation for safety driving of unmanned shuttle buses, an accurate and effective point cloud-based semantic segmentation method is proposed for specified scenarios (such as campus). Firstly, we analyze the characteristic of the shuttle bus scenarios and propose to use ROI selection to reduce the total points in computation, and then propose an improved semantic segmentation model based on Cylinder3D, which improves mean Intersection over Union (mIoU) by 1.3% over the original model on SemanticKITTI data; then, a semantic category division method is proposed for road scenario of shuttle bus and practical application requirements, and then we further simplify the model to improve the efficiency without losing the accuracy. Finally, the nuScenes dataset and the real gathered campus scene data are used to validate and analyze the proposed method. The experimental results on the nuScenes dataset and our data demonstrate that the proposed method performs better than other point cloud semantic segmentation methods in terms of application requirements for unmanned shuttle buses. Which has a higher accuracy (82.73% in mIoU) and a higher computational efficiency (inference speed of 90 ms).Keywords
Autonomous driving has emerged as a prominent research topic in academia and industry. According to the report, China would be able to market driverless cars under certain conditions by 2025 [1]. In 2020, civilian car ownership reached 273.40 million, up 7.74 percent from 2019 [2]. While automobiles make people’s life easier, the issue of road accidents cannot be overlooked. In China, there were 244,676 road accidents only in the year 2020, with 61,703 deaths and 250,723 injuries, resulting in direct property losses of about 1.3 billion Yuan [2]. As a result, the development and implementation of safe and dependable driverless technology can drastically reduce traffic accident rates, as well as casualties and property damage.
The rapid improvement of deep learning technologies [3–6] over the previous decade has resulted in significant progress in autonomous driving. Lidar, as one of the most important sensors for self-driving cars, can directly acquire 3D environmental information and has been widely researched. To ensure the safety and dependability of self-driving cars [7], it is critical to parse and semantically segment scene element information at the smallest unit of sensing data (each pixel in an image, each point in a point cloud). The task of point cloud semantic segmentation technology is to assign a semantic information label to each point in the point cloud. Although point clouds can obtain 3D coordinates of their surroundings, processing point clouds remains a difficult task [8].
Accurate point cloud semantic segmentation enables self-driving cars to achieve full-scene semantic parsing and classification within the perception range, providing important supporting information for subsequent scene understanding, and cognitive and other perception tasks (such as decision-making and path planning). However, the sparsity and disorder of point clouds, the distinguishability among objects, and the unbalanced data samples all pose significant challenges to road scene semantic segmentation technology. Although advances in point cloud semantic segmentation technology have been made, the large volume of point cloud data, as well as the complex and variable application scenarios, make it difficult to achieve satisfactory results in specific scenarios. As a result, for campus application scenarios, this paper proposes a point cloud-based semantic segmentation method for campus unmanned shuttle buses. In this method, the characteristics of a campus for self-driving cars are first analyzed, and then a semantic segmentation model based on Cylinder3D [9] was proposed for efficiently and effectively segmenting the environment. The main contributions of this paper are as follows:
(1) A point clouds-based semantic segmentation model for the unmanned shuttle bus is proposed based on the campus scenarios. The mIoU (mean intersection over union) of the proposed method on the SemanticKITTI dataset is 1.3% better than that of Cylinder3D.
(2) We propose to use an ROI (Region of Interest) selection for fast computation and a method for dividing the semantic categories based on the road characteristics of unmanned shuttle buses. The segmentation model is simplified based on the semantic categories to ensure computational efficiency without sacrificing accuracy.
(3) The proposed method is tested and validated in a real-world campus setting to demonstrate its accuracy and efficiency.
The structure of this paper is organized as follows: Section 2 presents the related works. The problem definition is introduced in Section 3. Section 4 gives the details of the proposed model, and the experiments are conducted in Section 5. The conclusion is followed in Section 6.
Point cloud segmentation is a crucial task in point cloud processing. Early point cloud segmentation techniques primarily use geometric information features based on ground segmentation to achieve good segmentation results through hand-crafted feature clustering, model fitting, and region growing [10–12]. Although such point cloud segmentation methods produce some segmentation results, they have several limitations. The hand-crafted features based solely on geometric features cannot meet the practical application requirements for unmanned vehicles in complex and changing traffic scenes. Because of the tremendous success of deep learning technology, the processing of point clouds using deep neural networks for object detection [13–16], semantic segmentation [17], and object tracking [18] have become hot research topics. Deep learning-based point cloud segmentation techniques can be divided into two categories based on data processing methods: direct methods, and indirect methods.
The direct processing method takes points as input directly. PointNet, as a seminal work, constructs the network for classification and segmentation using MLP (Multi-layer Perceptron) and max pool [19]. Because of PointNet only extracts pointwise and global features, Qi et al. further proposed PointNet++ to extract hierarchical features by using FPS (Farthest Point Sampling) and set abstraction module [20]. This model is widely used as the backbone for point-based point cloud analysis models. Wang et al. construct a neighborhood graph using kNN (k-Nearest Neighbor) and propose the DGCNN model [21]. An edge convolution operator is introduced in this model, and a hierarchical dynamic graph structure is used to extract local-global features. Because of the irregularity and disorder of point clouds, the convolution operation will have the problem that the convolution kernels will vary at different positions. To address this issue, Li et al. proposed the PointCNN model [22], in which the point cloud is first transformed to a fixed convolution kernel position region and then the convolution operation is performed. Because of the non-Euclidean structure of point clouds, Wang et al. propose a GNN (Graph Neural Networks) model that aggregates local information using a graph attention module [23]. Hu et al. investigated the point cloud semantic segmentation downsampling method and discover that random sampling produces competitive results. They then proposed RandLA-Net, which combines local information using local spatial coding and attention pooling [24].
In the indirect processing method, the laser point cloud is transformed into a regular structure by projecting into a bird’s-eye-view (BEV)/range-view (RV) image or voxelization to overcome the irregularity of the point cloud, so that semantic segmentation of the point cloud can be performed directly using regular convolution operators. Lawin et al. proposed to project the point cloud onto a set of synthetic 2D images, then 2D-CNN is used to extract the semantic features of these images, and the semantic prediction scores of all images are re-projected back to the point cloud to obtain the final point-wise segmentation results [25]. Wu et al. transformed the point cloud into an RV image and propose SqueezeSeg [26], an end-to-end model based on CNN, to directly output point-wise labels, the result is further refined by conditional random field (CRF). However, SqueezeSeg is still far from being practical, Wu et al. further improve the model structure, and training loss, and proposed SqueezeSegV2 [27], and a domain adaption training pipeline is proposed to reduce the need for large annotated data. Xu et al. investigate the difference in feature distribution between a LiDAR image and a regular RGB image and propose SqueezeSegV3, which uses spatially-adaptive convolution to extract informative features [28]. Occlusions will occur in the RV image, so Zhang et al. projected the point cloud into the BEV image and propose PolarNet [29]. The BEV image partition is based on Polar coordinates to fully utilize the characteristics of the LiDAR scan. In 2016, Huang et al. used 3D CNN to solve the 3D point cloud labeling problem. The point cloud is divided into voxels, and the 3D CNN is used to extract the voxel-wise features and predict voxel labels. The point in a voxel is assigned the same label as the voxel for the point-wise label [30]. Tchapmi et al. proposed the SEGCloud model [31], which uses 3D FCNN (Fully Convolutional Neural Network) [32] to predict coarse voxel labels and then uses trilinear interpolation and fully connected CRF to transfer the predictions back to 3D points and refine the semantic labels on the points. Because of the sparsity of the point cloud, many voxels are empty after voxelization. Using 3D CNN directly on voxels will consume a significant amount of computational power and memory on empty voxels. Graham et al. propose a submanifold sparse convolutional network to improve 3D semantic segmentation efficiency [33]. Tang et al. proposed a highly efficient point cloud inference engine to accelerate sparse convolution computation [34]. Zhu et al. proposed the Cylinder3D model [9], which partitions point clouds using cylindrical voxelization and then uses 3D sparse convolution to obtain semantic segmentation results. PVCNN, which combines point-based and voxel-based methods, significantly improves accuracy and speed in semantic segmentation tasks [35].
In summary, a lot of work for point cloud-based semantic segmentation has been proposed and achieves relatively good results, while they are still encountered the problem of balance between accuracy and speed in practical applications. Therefore, a more efficient and accurate method is required in specified scenarios.
In this paper, we focus on the perception of the surrounding environment problem by the unmanned shuttle bus. The only sensor in use is LiDAR. As shown in Fig. 1, we scan the environment using a single spinning LiDAR. The white car represents the shuttle bus, and the LiDAR is mounted on the bus’s roof. The scanned point clouds are colored by the reflected intensity of the object, and the image in the top-right corner is only for visualization.

Figure 1: The LiDAR data
Based on the point cloud data and the requirement for the safe driving of unmanned shuttle bus in specific environments, we design a model that directly input the point sets and output the semantic labels of interested points. Where the interested points are chosen based on the specific application scenarios and the shuttle bus’s computational efficiency.
According to the problem definition, the framework of our approach is shown in Fig. 2. In the framework, the point cloud is obtained from a spinning LiDAR first. Then based on the characteristics of the shuttle bus and its application scenarios, the region of interest (ROI) is derived and the semantic category is classified. After that, the processed point cloud is fed into a segmentation model for semantic segmentation to obtain the point labels. The following subsections will give the details of each step.

Figure 2: The framework of the proposed approach predicts the semantic labels of point clouds
The point cloud is obtained by spinning the laser emitter, and the horizontal FOV (Field of View) is 360°. Because the points of one frame are not obtained at the same time, the point cloud acquisition must accurately capture a frame of data. Because we need a semantic segmentation model, so we train the model based on widely used benchmark datasets that do not require the acquisition step. During the experimental validation phase, we use the LiDAR drive method integrated into the ROS (Robot Operating System) to acquire data for online testing or to record the ROS bag for offline testing. In ROS, point clouds can be separated automatically in frames one by one.
The purpose of this paper is to predict the semantic labeling of environment points. And the primary goal of semantic segmentation is to allow unmanned shuttle buses to accurately parse their surroundings to ensure accurate decision-making, planning, and control of unmanned shuttle buses. The detection range of the LiDAR sensor is up to 200 meters, but as the distance between the sensor and the object increases, the hit laser points become fewer and the data becomes sparser, making the segmentation results less reliable. Furthermore, the larger the amount of data, the longer the processing time and the unmanned vehicle’s decision control response time. The laser points generated by a typical LiDAR sensor, Velodyne HDL-32E, can reach up to 695,000 per second with a range of 100 meters. Given that the HDL-32E’s sampling frequency is 10 Hz, each frame of the point cloud can contain up to 69,500 points. However, the detection range is not equal contributions in 360° horizontal FOV for the shuttle bus, whose speed is limited to a relatively low speed. As a result, preprocessing the point cloud is required to improve the reliability of the semantic segmentation results without increasing processing time.
Given that the LiDAR sensor has a detection range of 200 meters and that the unmanned shuttle bus is typically limited to less than 20 km/h. And the speed of dynamic objects in the environment is also limited. As a result, the long-distance objects located on the bus’s side and rear have almost no effect on normal vehicle driving. Therefore, we designed the region of interest based on vehicle driving speed, braking comfort, and other factors to reduce the amount of data calculation while ensuring safe driving.
Let the bus is running at a constant speed v, the LiDAR data collection and processing time be
where
Furthermore, a certain threshold
A certain amount of redundancy is added to the road width for the bus’s side, and a 10-meter space is set aside for the bus’s rear. As a result, the safety perception area of the shuttle bus is calculated for various speeds, as shown in Table 1. In this table, the data processing time

The segmentation objects within the scenes can be divided into three major categories: traffic participants (cars, pedestrians, etc.); traffic infrastructure (driving roads, sidewalks, etc.); and other scene targets (trees, grass, buildings, etc.). The accurate segmentation of traffic participants is the foundation for ensuring the safe operation of unmanned shuttle buses, and the accuracy of segmentation must be ensured. The traffic participants are specifically divided into four categories based on the semantic segmentation category division of the typical dataset [37,38] and the characteristics of the shuttle bus scenario: Car, Large Vehicle, Bicycle, and Pedestrian. Considering that the differences between bicycles and motorcycles in terms of driving speed and appearance (as shown in Fig. 3) are not significant, and there is no significant difference in the processing logic of unmanned shuttle vehicles for both of them, the paper classifies both bicycle and motorcycle as a single vehicle to improve data separability. Traffic infrastructure is divided into two categories: Drivable area and Sidewalk. Other scene targets are divided into three categories: Vegetation, Manmade area, and Other Flat area. Table 2 displays the final scene segmentation categories.

Figure 3: The point cloud data of motorcycle and bicycle

So, in summary, when a frame of the point cloud is collected by Lidar sensor, the data preprocessing is used to select the points in the ROI, and then feed into the semantic segmentation model. To train the model, the ground truth labels of the training dataset are divided into 9 categories as shown in Table 2.
The semantic segmentation model of this paper is shown in Fig. 4. This model is based on the Cylinder3D model. The point cloud is first voxelized by cylindrical partition, then two branches (point branch and voxel branch) are used for feature extraction, and finally, the voxel features are de-voxelized and concatenated with point features to estimate the semantic label of each point.

Figure 4: The semantic segmentation model
In the voxel partition and feature generation stage, a Local-feature Adaptive Extraction Module (LAEM) is proposed for effective voxel feature extraction. The details of LAEM are given below:
For a point cloud
where
Cylinder3D combines the point features within a voxel using max-pool to obtain the voxel feature. However, points in the voxel are located in different positions and contribute differently to the voxel feature. Therefore, this paper proposes to use an attention mechanism [39] to design LAEM. A 32-beam LiDAR frame can contain more than 60,000 points, but the number of points within each voxel varies. Padding operations are required to ensure the efficiency of parallel operations while adding extra memory and computation consumption [40]. In contrast, we design a local-global position encoding module
where
where

Figure 5: The positional encoding module
Weighted aggregation can then be used to fuse the point features within a voxel.
where
The voxel features extracted by LAEM are then fed into the backbone network to extract semantic features. The backbone is the same as Cylinder3D and is shown in Fig. 6. In the backbone network, the voxel features are first fed into an asymmetrical convolutional block (3D-AsyConv), the 3D sparse convolution (SpConv) is followed to downsample the features, then the features are fed into the next 3D-AsyConv block. When the global feature is extracted, the DeSpConv is used to upsample the feature to the original dimension. Finally, a dimension-decomposition-based context modeling module is used to generate the final voxel features. More details can be found in [9].

Figure 6: The backbone
The voxel features are concatenated with point branch features, which are obtained by several MLP layers, to estimate the final semantic results. In addition to the training loss function, we use cross-entropy and Lovasz-softmax loss functions.
In this section, experiments based on datasets and our data are carried out to validate the proposed method.
5.1 Experimental Platform and Configuration
In all experiments, we use a platform with an Intel Core i9–10850 K 3.6 GHz CPU, an NVIDIA GeForce RTX 3090, 64 G RAM. The operating system is Ubuntu18.04. In addition, we use an unmanned shuttle bus, as shown in Fig. 7, to capture our dataset, the detailed information is listed in Table 3.

Figure 7: The unmanned shuttle bus

5.2 Experimental Results on Dataset
The SemanticKITTI and nuScenes datasets are used first to validate the effectiveness of the proposed model. For the fair comparison, the dataset evaluation keeps the same class categories as the original dataset, the data processing method as Cylinder3D, and no ROI selection. Concretely, in the SemanticKITTI dataset, the point cloud is voxelized and the voxel resolution is
where C is the number of classes,
Table 4 shows the comparison results of the proposed method with various semantic segmentation models on the SemanticKITTI dataset. It can be seen that the proposed method has excellent performance under a combination of various IOU and mIoU evaluation metrics. When compared to methods based on point cloud projection to 2D images, such as Polar-Net [29] based on the bird’s-eye view and SqueezeSegV3 [28] based on range view, the proposed method improves mIoU metrics by 13% and 14.6 percent, respectively. There is also a significant improvement in segmentation accuracy when compared to methods that operate directly on points, such as RandLA-Net [24] and KPConv [41]. In addition, the proposed method outperforms PVCNN [35] by 2.2% and Cylinder3D by 1.3% in mIoU.

Table 5 shows the comparison results of the proposed method with typical semantic segmentation models on the nuScenes dataset, where the Cylinder3D model results are retraining results based on the official source code. It can be seen that the proposed method performs better for pedestrians, cars, and motorcycles, which are the main participants in traffic scenarios. Although the bicycle is only 32.5, it is 4.9% higher than Cylinder3D, and the total mIoU is 2% higher compared to Cylinder3D.

The experimental results on two datasets show that the proposed method outperforms other methods. However, because the data preprocessing step and category division are not validated, the proposed method is evaluated further on our data in the following section.
5.3 Experimental Results on Our Data
To validate the validity and reliability of the proposed method for the specified scenario (for example, campus), the nuScenes dataset categories are reclassified according to the categories listed in Table 2, then the model is trained and evaluated in the nuScenes dataset, while analyzed and validated in our data.
Table 6 shows the results in the nuScenes dataset based on the categories in Table 2, and Fig. 8 shows some of the visualization results. It can be seen that the total mIoU of the model reaches 82.73%. For important traffic participants (pedestrians, cars, bicycles, large vehicles, etc.), the lowest segmentation IoU reaches 74.32%. For the passable area segmentation IoU reaches 95%, and the lowest IoU is for the sidewalk, which also reaches 73.5%.
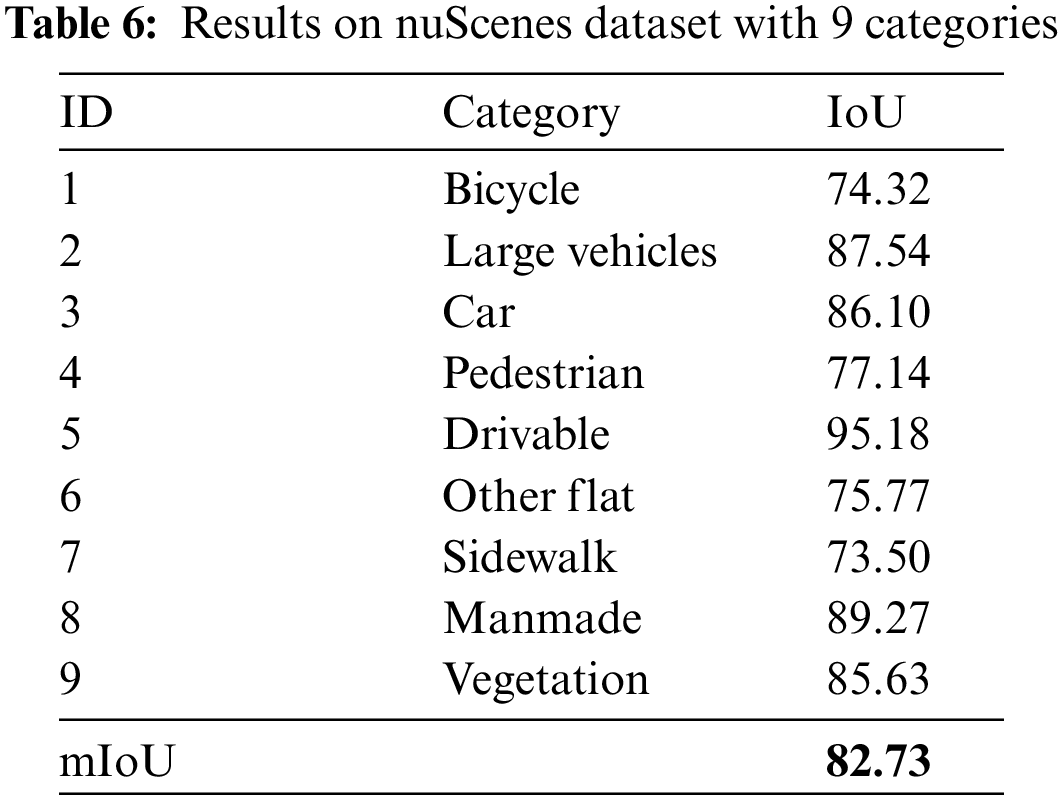

Figure 8: The visualization results on nuScenes dataset with 9 categories
Fig. 9 compares the point numbers of every point cloud frame and the relative inference time consumption with and without ROI selection. As can be seen, the prepared time without ROI takes approximately 33 ms, whereas the prepared time with ROI and ROI selection takes nearly the same time. One frame point cloud with ROI reduces the number of points from 60 thousand to 35 thousand, and the inference time is reduced from approximately 143 ms to approximately 90 ms. In addition, the semantic category is reduced from 16 to 9 and the difference of inter-class is increased, therefore, the backbone model is streamlined accordingly.

Figure 9: The comparison with and without ROI selection. Top: The preparation time of the point cloud; middle: The point numbers; bottom: The inference time of one frame
We use ROS (Robot Operation System) as the system of the unmanned shuttle bus to evaluate our method on the shuttle bus, and the working flowchart of the point cloud process node is shown in Fig. 10.

Figure 10: The point cloud inference node in ROS
Based on the ROS node, we test the inference time of the model with different modules and list the results in Table 7. Where the baseline is the model used in Section 5.2.2. It can be seen that the category division reduces network complexity, the streamlined model reduces the number of learned parameters, reduces the computational and memory pressure of the hardware, and collaborates with the region of interest, resulting in a 38 percent decrease in final inference time, and the inference time is less than 100 ms when compared to the frequency of 10 HZ of LIDAR collected data, which can meet the real-time requirements.

Finally, the unmanned shuttle vehicle is used to collect and label data in various scenes on campus, and Fig. 11 depicts the images corresponding to the scenes with collected point cloud data. Fig. 12 gives the segmentation results in the campus and Fig. 13 gives the detail of the segmentation results. It can be seen that the proposed method has a good segmentation effect.

Figure 11: The corresponding image of our data


Figure 12: The segmentation results with our data
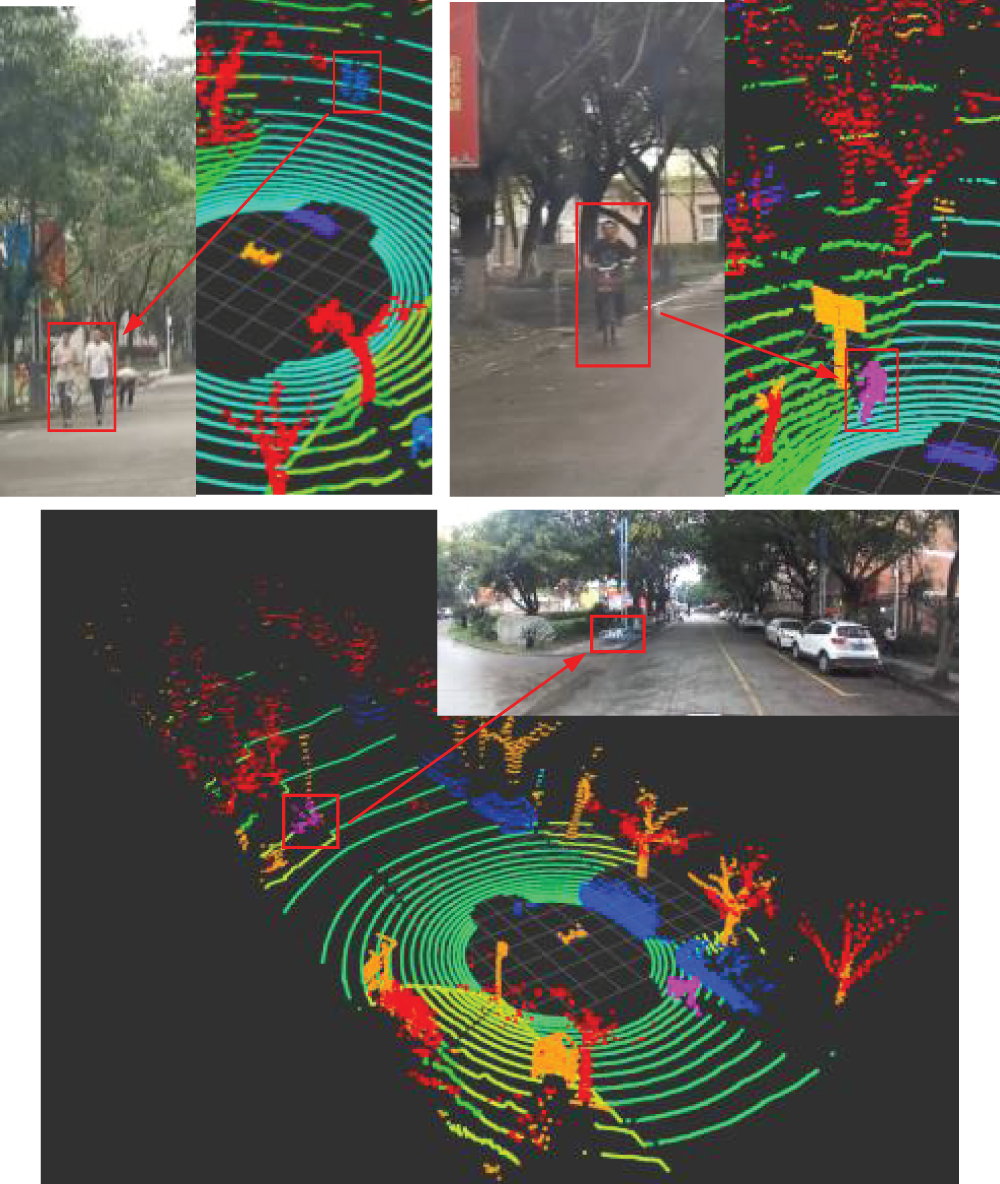
Figure 13: The detail of our segmentation results
The proposed method shows good performance according to the experimental results on SemanticKITTI, nuScenes dataset. After being integrated into ROS, the proposed method only spends 90 ms to obtain the segmentation results in our shuttle bus test platform. Which demonstrates the accuracy and efficiency of the proposed method.
Based on the existing point cloud segmentation model, this paper proposes a point cloud semantic segmentation method for an unmanned shuttle bus scenario. We design a semantic category division method based on the characteristics of the shuttle bus scenario, analyze the shortcomings of the existing semantic segmentation model, and design a local feature adaptive extraction module to improve the feature extraction effect. The proposed method has obvious advantages in overall accuracy and efficiency, as demonstrated by experimental validation on SemanticKITTI, nuScenes, and actual collected data, and serves as a good guarantee for the safe operation of an unmanned shuttle bus. The next step will be to validate various extreme cases to improve the method’s practicality and robustness while combining images with point clouds to achieve more accurate segmentation will also require further research.
Funding Statement: This work is supported by the National Natural Science Foundation of China (62103064), Sichuan Science and Technology Program (2021YFG0295, 2021YFG0133, 2022YFN0020, 2020YFG0177, 2021YFG0187, 2021YFN0104, 2021YFH0069, 2021YJ0086, 21ZDYF3598), the Opening Project of Unmanned System Intelligent Perception Control Technology Engineering Laboratory of Sichuan Province (WRXT2020-005), Scientific Research Foundation of CUIT (KYTZ202109), Key Research and Development Support Program of Chengdu Science and Technology Bureau (2022-YF05-01128-SN).
Conflicts of Interest: The authors declare that they have no conflicts of interest to report regarding the present study.
References
1. National Development and Reform Commission. in Innovative Development Strategy for Intelligent Vehicles. Beijing, China: Industry Division of National Development and Reform Commission, 2020. [Online]. Available: https://www.ndrc.gov.cn/xxgk/zcfb/tz/202002/t20200224_1221077.html [Google Scholar]
2. National Bureau of Statistics of China, China Statistical Yearbook 2021. Beijing, China: China Statistics Press, 2021. [Google Scholar]
3. I. Goodfellow, Y. Bengio and A. Courville, Deep Learning. Cambridge, MA, USA: The MIT Press, 2016. [Google Scholar]
4. Y. LeCun, Y. Bengio and G. Hinton, “Deep learning,” Nature, vol. 521, pp. 436–444, 2015. [Google Scholar] [PubMed]
5. V. Tiwari and C. Bhatnagar, “A survey of recent work on video summarization: Approaches and techniques.,” Multimedia Tools and Applications, vol. 80, pp. 27187–27221, 2021. [Google Scholar]
6. N. Naheed, M. Shaheen, S. A. Khan, M. Alawairdhi and M. A. Khan, “Importance of features selection, attributes selection, challenges and future directions for medical imaging data: A review,” Computer Modeling in Engineering & Sciences, vol. 125, no. 1, pp. 315–344, 2020. [Google Scholar]
7. J. Yuan, G. Zhang, F. Li, J. Liu, L. Xu et al., “Independent moving object detection based on a vehicle mounted binocular camera,” IEEE Sensors Journal, vol. 21, no. 10, pp. 11522–11531, 2021. [Google Scholar]
8. Y. Guo, H. Wang, Q. Hu, H. Liu, L. Liu et al., “Deep learning for 3D point clouds: A survey,” IEEE Transactions on Pattern Analysis and Machine Intelligence, vol. 43, no. 12, pp. 4338–4364, 2020. [Google Scholar]
9. X. Zhu, H. Zhou, T. Wang, F. Hong, Y. Ma et al., “Cylindrical and asymmetrical 3D convolution networks for lidar segmentation,” in Proc. of IEEE/CVF Conf. on Computer Vision and Pattern Recognition (CVPR), Nashville, USA, pp. 9934–9943, 2021. [Google Scholar]
10. J. Liu, Z. Wu and M. Zhou, “Review of point cloud segmentation and application,” Computer Science, vol. 38, no. 4, pp. 21–24 + 71, 2011. [Google Scholar]
11. J. Zhang, X. Zhao, Z. Chen and Z. Lu, “A review of deep learning-based semantic segmentation for point cloud,” IEEE Access, vol. 7, pp. 179118–179133, 2019. [Google Scholar]
12. X. Ma, W. Luo, M. Chen, J. Li, X. Yan et al., “A fast point cloud segmentation algorithm based on region growth,” in Proc. of Int. Conf. on Optical Communications and Networks (ICOCN), Huangshan, China, pp. 1–2, 2019. [Google Scholar]
13. A. Alam, S. A. Abdullah, I. Akhter, S. A. Alsuhibany, Y. Y. Ghadi et al., “Object detection learning for intelligent self automated vehicles,” Intelligent Automation & Soft Computing, vol. 34, no. 2, pp. 941–955, 2022. [Google Scholar]
14. J. Mao, S. Shi, X. Wang and H. Li, “3D object detection for autonomous driving: A review and new outlooks,” 2022. [Online]. Available: https://doi.org/10.48550/arXiv.2206.09474 [Google Scholar] [CrossRef]
15. W. Zimmer, E. Ercelik, X. Zhou, X. Ortiz and A. Knoll, “A survey of robust 3D object detection methods in point clouds,” 2022. [Online]. Available: https://doi.org/10.48550/arXiv.2204.00106 [Google Scholar] [CrossRef]
16. R. Qian, X. Lai and X. Li, “3D object detection for autonomous driving: A survey,” Pattern Recognition, vol. 130, pp. 108796, 2022. [Google Scholar]
17. Y. He, H. Yu, Z. Yang, W. Sun, Y. Wang et al., “Deep learning based 3D segmentation: A survey,” 2021. [Online]. Available: https://doi.org/10.48550/arXiv.2103.05423 [Google Scholar] [CrossRef]
18. A. Kim, G. Brasó, A. Ošep and L. Leal-Taixé, “PolarMOT: How far can geometric relations take us in 3D multi-object tracking?,” in Proc. of European Conf. on Computer Vision (ECCV), Tel Aviv, Israel, pp. 41–58, 2022. [Google Scholar]
19. C. R. Qi, H. Su, K. Mo and L. J. Guibas, “PointNet: Deep learning on point sets for 3D classification and segmentation,” in Proc. of IEEE Conf. on Computer Vision and Pattern Recognition (CVPR), Honolulu, Hawaii, USA, pp. 652–660, 2017. [Google Scholar]
20. C. R. Qi, L. Yi, H. Su and L. J. Guibas, “PointNet++: Deep hierarchical feature learning on point sets in a metric space,” in Proc. of Advances in Neural Information Processing Systems (NIPS), Long Beach, CA, USA, pp. 5099–5108, 2017. [Google Scholar]
21. Y. Wang, Y. Sun, Z. Liu, S. E. Sarma, M. M. Bronstein et al., “Dynamic graph CNN for learning on point clouds,” ACM Transaction on Graphics, vol. 38, no. 5, pp. 1–12, 2019. [Google Scholar]
22. Y. Li, R. Bu, M. Sun, W. Wu, X. Di et al., “PointCNN: Convolution on χ-transformed points,” in Proc. of Advances in Neural Information Processing Systems (NeurIPS), Montréal, Canada, pp. 828–838, 2018. [Google Scholar]
23. L. Wang, Y. Huang, Y. Hou, S. Zhang and J. Shan, “Graph attention convolution for point cloud semantic segmentation,” in Proc. of IEEE/CVF Conf. on Computer Vision and Pattern Recognition (CVPR), Long Beach, CA, USA, pp. 10296–10305, 2019. [Google Scholar]
24. Q. Hu, B. Yang, L. Xie, S. Rosa, Y. Guo et al., “RandLA-Net: Efficient semantic segmentation of large-scale point clouds,” in Proc. of IEEE/CVF Conf. on Computer Vision and Pattern Recognition (CVPR), Seattle, USA, pp. 11108–11117, 2020. [Google Scholar]
25. F. J. Lawin, M. Danelljan and P. Tosteberg, “Deep projective 3D semantic segmentation,” in Proc. of Int. Conf. on Computer Analysis of Images and Patterns, Ystad, Sweden, pp. 95–107, 2017. [Google Scholar]
26. B. Wu, A. Wan, X. Yue and K. Keutzer, “SqueezeSeg: Convolutional neural nets with recurrent CRF for real-time road-object segmentation from 3D lidar point cloud,” in Proc. of IEEE Int. Conf. on Robotics and Automation (ICRA), Brisbane, Australia, pp. 1887–1893, 2018. [Google Scholar]
27. B. Wu, X. Zhou, S. Zhao, X. Yue and K. Keutzer, “SqueezeSegV2: Improved model structure and unsupervised domain adaptation for road-object segmentation from a lidar point cloud,” in Proc. of IEEE Int. Conf. on Robotics and Automation (ICRA), Montreal, Canada, pp. 4376–4382, 2019. [Google Scholar]
28. C. Xu, B. Wu, Z. Wang, W. Zhan, P. Vajda et al., “SqueezeSegv3: Spatially-adaptive convolution for efficient point-cloud segmentation,” in Proc. of European Conf. on Computer Vision (ECCV), Glasgow, UK, pp. 1–19, 2020. [Google Scholar]
29. Y. Zhang, Z. Zhou, P. David, X. Yue, Z. Xi et al., “PolarNet: An improved grid representation for online lidar point clouds semantic segmentation,” in Proc. of IEEE/CVF Conf. on Computer Vision and Pattern Recognition (CVPR), Seattle, USA, pp. 9601–9610, 2020. [Google Scholar]
30. J. Huang and S. You, “Point cloud labeling using 3D convolutional neural network,” in Proc. of Int. Conf. on Pattern Recognition (ICPR), Cancun, Mexico, pp. 2670–2675, 2016. [Google Scholar]
31. L. P. Tchapmi, C. B. Choy, I. Armeni, J. Y. Gwak and S. Savarese, “SEGCloud: Semantic segmentation of 3D point clouds,” in Proc. of Int. Conf. on 3D Vision (3DV), Qingdao, China, pp. 537–547, 2017. [Google Scholar]
32. J. Long, E. Shelhamer and T. Darrell, “Fully convolutional networks for semantic segmentation,” in Proc. of IEEE Conf. on Computer Vision and Pattern Recognition (CVPR), Boston, MA, USA, pp. 3431–3440, 2015. [Google Scholar]
33. B. Graham, M. Engelcke and L. Matten, “3D semantic segmentation with submanifold sparse convolutional networks,” in Proc. of IEEE/CVF Conf. on Computer Vision and Pattern Recognition (CVPR), Salt Lake City, USA, pp. 9224–9232, 2018. [Google Scholar]
34. H. Tang, Z. Liu, X. Li, Y. Lin and S. Han, “TorchSparse: Efficient point cloud inference engine,” in Proc. of 5th Machine Learning and Systems (MLSys), Santa Clara, CA, USA, pp. 302–315, 2022. [Google Scholar]
35. Z. Liu, H. Tang, Y. Lin and S. Han, “Point-voxel CNN for efficient 3D deep learning,” in Proc. of Advances in Neural Information Processing Systems (NeurIPS), Vancouver, Canada, pp. 32, 2019. [Google Scholar]
36. GB 12676-2014, in Technical Requirements and Testing Methods for Commercial Vehicle and Trailer Braking System. Beijing, China: China National Standardization AdministrationCommittee, 2014. [Google Scholar]
37. J. Behley, M. Garbade, A. Milioto, J. Quenzel, S. Behnke et al., “SemanticKITTI: A dataset for semantic scene understanding of lidar sequences,” in Proc. of IEEE/CVF Int. Conf. on Computer Vision (ICCV), Seoul, Korea, pp. 9297–9307, 2019. [Google Scholar]
38. H. Caesar, V. Benkiti, A. H. Lang, S. Vora, V. E. Liong et al., “nuScenes: A multimodal dataset for autonomous driving,” in Proc. of IEEE/CVF Conf. on Computer Vision and Pattern Recognition (CVPR), Seattle, USA, pp. 11621–11631, 2020. [Google Scholar]
39. A. Vaswani, N. Shazeer, N. Parmar, J. Uszkoreit, L. Jones et al., “Attention is all you need,” in Proc. of Advances in Neural Information Processing Systems (NIPS), Long Beach, CA, USA, pp. 5998–6008, 2017. [Google Scholar]
40. A. H. Lang, S. Vora, H. Caesar, L. Zhou, J. Yang et al., “PointPillars: Fast encoders for object detection from point clouds,” in Proc. of IEEE/CVF Conf. on Computer Vision and Pattern Recognition (CVPR), Long Beach, CA, USA, pp. 12697–12705, 2019. [Google Scholar]
41. H. Thomas, C. R. Qi, J. E. Deschaud, B. Marcotegui and F. Goulette, “KPConv: Flexible and deformable convolution for point clouds,” in Proc. of IEEE/CVF Int. Conf. on Computer Vision (ICCV), Seoul, Korea, pp. 6411–6420, 2019. [Google Scholar]
Cite This Article
 Copyright © 2023 The Author(s). Published by Tech Science Press.
This work is licensed under a Creative Commons Attribution 4.0 International License , which permits unrestricted use, distribution, and reproduction in any medium, provided the original work is properly cited.
 Downloads
 Citation Tools