
 Submit a Paper
 Propose a Special lssue
 Open Access
ARTICLE

Enhanced Metaheuristics with Machine Learning Enabled Cyberattack Detection Model
Department of Information Systems, College of Computer and Information Sciences, Prince Sultan University, Riyadh, 12435, Saudi Arabia
* Corresponding Author: Ahmed S. Almasoud. Email:
Intelligent Automation & Soft Computing 2023, 37(3), 2849-2863. https://doi.org/10.32604/iasc.2023.039718
Received 13 February 2023; Accepted 14 April 2023; Issue published 11 September 2023
 View Full Text
 Download PDF
Abstract
The Internet of Things (IoT) is considered the next-gen connection network and is ubiquitous since it is based on the Internet. Intrusion Detection System (IDS) determines the intrusion performance of terminal equipment and IoT communication procedures from IoT environments after taking equivalent defence measures based on the identified behaviour. In this background, the current study develops an Enhanced Metaheuristics with Machine Learning enabled Cyberattack Detection and Classification (EMML-CADC) model in an IoT environment. The aim of the presented EMML-CADC model is to detect cyberattacks in IoT environments with enhanced efficiency. To attain this, the EMML-CADC model primarily employs a data preprocessing stage to normalize the data into a uniform format. In addition, Enhanced Cat Swarm Optimization based Feature Selection (ECSO-FS) approach is followed to choose the optimal feature subsets. Besides, Mayfly Optimization (MFO) with Twin Support Vector Machine (TSVM), called the MFO-TSVM model, is utilized for the detection and classification of cyberattacks. Here, the MFO model has been exploited to fine-tune the TSVM variables for enhanced results. The performance of the proposed EMML-CADC model was validated using a benchmark dataset, and the results were inspected under several measures. The comparative study concluded that the EMML-CADC model is superior to other models under different measures.Keywords
The Internet of Things (IoT) has developed significantly and is performing an important role in the day-to-day lives of human beings [1]. IoT nodes make use of internet protocol addresses and connect to the internet. Such self-configured smart nodes are directed over most cutting-edge application areas, namely, smart education, home automation, decision analytics, smart grids, smart cars, process automation, industrial development, health care system, and many more [2,3]. As per experts, the future is here in which the community exists with as many connected gadgets alike the individuals surviving on this globe. If the volume of applications for IoT increases, the risks also increase in terms of misusing the IoT gadgets for malignant activities such as spying on others, disruption of power networks, remote control of building control systems and even potentially operating traffic signals [4,5].
Conventional firewalls were used for packet filtering earlier, which had many disadvantages, such as rigid pre-defined rules for effective external network assaults. These assaults are very familiar to security specialists. So, there exists a demand for the incorporation of an extra Intrusion Detection System (IDS) with a firewall which alarms the system administrator in case of doubtful signs of anomalies [6]. This method allows the security of adaptable networks by which the anomaly-related IDS can provide a few valuable reviews to network administrators in terms of new and original attack forms as they appear. In general, a firewall necessitates an up-gradation together with an example of the attack types encountered earlier so that it can identify it in future encounters [7,8].
Based on the detection technologies utilized by the system, IDS may be split into Misused-related IDS (MIDS) and Anomaly-related IDS (AIDS). AIDS has the merit of identifying new forms of intrusions [9,10]. It accomplishes a profile of usual operations via Machine Learning (ML) technique. Whenever the activities of a recent subject diverge from its ordinary profile, it is classified as an ‘intrusion’ conduct created by distinct algorithms [11]. Based on well-known system defects and intrusion designs, MIDS has the potential to identify a few distinctive attacks in a precise manner. However, it heavily depends on pre-defined security plans to identify strange attacks on the system, which results in a lack of identification altogether [12]. With the arrival of big data in recent times, conventional IDSs that depend upon signature-oriented recognition methodologies can be enhanced using ML and Artificial Intelligence (AI) techniques to achieve high-precision design based on previous attack data [13]. Such ML methods might depend on a single classifier using one classification method or multi-classifiers that employ different classification models simultaneously.
In the literature [14], the researchers developed an IDS and implemented and evaluated the precision of the technique. This novel IDS applies a hybrid placement approach related to a multi-agent scheme. This novel scheme contains data management modules, data collection modules, response modules, and analysis modules. To validate the proposed model, this study employed Deep Neural Network (DNN) architecture to detect intrusions. The researchers in the study conducted earlier [15] demonstrated an IDS-based ML method for implementation into an IoT platform as a Service. In this study, Random Forest was employed as a classifier to detect the intrusions while Neural Network (NN) classification was deployed for identifying the intrusion.
In the study conducted earlier [16], the researchers presented feature clusters in terms of Flow, Transmission Control Protocol (TCP), and Message Queuing Telemetry Transport (MQTT) through the UNSW-NB15 data feature. Then, the researchers overcome the challenges such as the curse of dimensionality, imbalanced dataset, and overfitting. Next, the study employed supervised ML techniques such as Artificial Neural Networks (ANNs), Random Forest (RF), and Support Vector Machine (SVM) on the cluster. Hawawreh et al. [17–21] presented advanced anomaly detection methodologies that could validate and learn through data gathered from TCP/IP packets. It embraces a successive training procedure, implemented by Deep-FeedForward Neural Network (DNN-FFNN) and Autoencoder (AE) structure, estimated by two popular network datasets.
The current study develops an Enhanced Metaheuristics with Machine Learning enabled Cyberattack Detection and Classification (EMML-CADC) model in an IoT environment. The proposed EMML-CADC model primarily employs data pre-processing to normalize the data into a uniform format. In addition, the Enhanced Cat Swarm Optimization-based Feature Selection (ECSO-FS) approach is applied to choose the optimal feature subsets. Besides, Mayfly Optimization with Twin Support Vector Machine (MFO-TSVM) model is also utilized for the detection and classification of cyberattacks. The MFO model has been exploited to fine-tune the TSVM variables to achieve enhanced results. The proposed EMML-CADC model was experimentally validated for its performance using a benchmark dataset, and the results were inspected under several measures.
In this study, a novel EMML-CADC model is developed to enhance the efficiency of cyberattack detection in an IoT environment. To attain this, the proposed EMML-CADC model primarily employs data pre-processing to normalize the data into a uniform format. In addition, the ECSO-FS approach is applied to choose the optimal feature subsets. Besides, the MFO-TSVM model is also utilized for the detection and classification of cyberattacks. The details related to each module are elaborated on in the succeeding sections.
At the initial stage, the ECSO-FS model is developed to select an optimal subset of features. CSO approach is inspired by two features of cats Seeking Model (SM) and Tracking Mode (TM). In the CSO approach, the cat possesses the location, including the D-dimensional vector, the velocity of dimension and the fitness value, which denote the flag for detecting the incidence of SM or TM and the addition of the cat into the fitness function (FF) value. The ‘finish’ solution would be the optimum position of the cat and sustain the optimum one until the process is over [22].
To model the features of cats in resting period and alert, SM is employed. It consists of seeking a memory pool (SMP), seeking a range of the selected dimension (SRD), counts of dimension to change (CDC), and self-position considering (SPC). The process included in SM is shown below:
Step l: Generate j copies of the present position of
Step 2: For every copy based on CDC, subtract the existing values of SRD per cent and substitute them with prior values.
Step 3: Describe Fitness Value (FS) for all the candidate points.
Step 4: If each FS is unequal, define the selection possibility of the candidate point, after which assume the selection possibility of the candidate point as 1.
Step 5: Define the Fitness Function (FF) for each cat. Once the FF value for each cat is equal, then the selection probability of the cat becomes 1, or else the
Now Fi denotes the fitness value,
TM signifies the following mode of CSO in which the case aims at tracing the target and food. The process is shown below.
Step 1: Upgrade the velocity of each dimension using Eq. (2).
Step 2: Ensure the velocity is at a high range. Once the new velocity is over-ranged, it is regarded as ‘equal to limit’.
Step 3: Upgrade the location of
In this case, the initial value of the chaotic map is set to 0.8.
The purpose of the CSO technique is to identify the optimum feature subset for the offered dataset with superior classification accuracy and lesser features. At this point, it can be combined with a single weight indicator, and the same FF can be utilized as follows:
Here, p typifies the total amount of features, and s refers to the quantity of the chosen features. At this point, the values of
At this point,
2.2 Process Involved in TSVM-Based Classification
In this process, the chosen features are passed onto the TSVM model for the classification process [24]. TSVM model finds two kernel-generated non-parallel functions called
Subjected to,
and
Subjected to,
In Eq. (8), the regularization parameter is
Subjected to
and
Subjected to
where
Here,
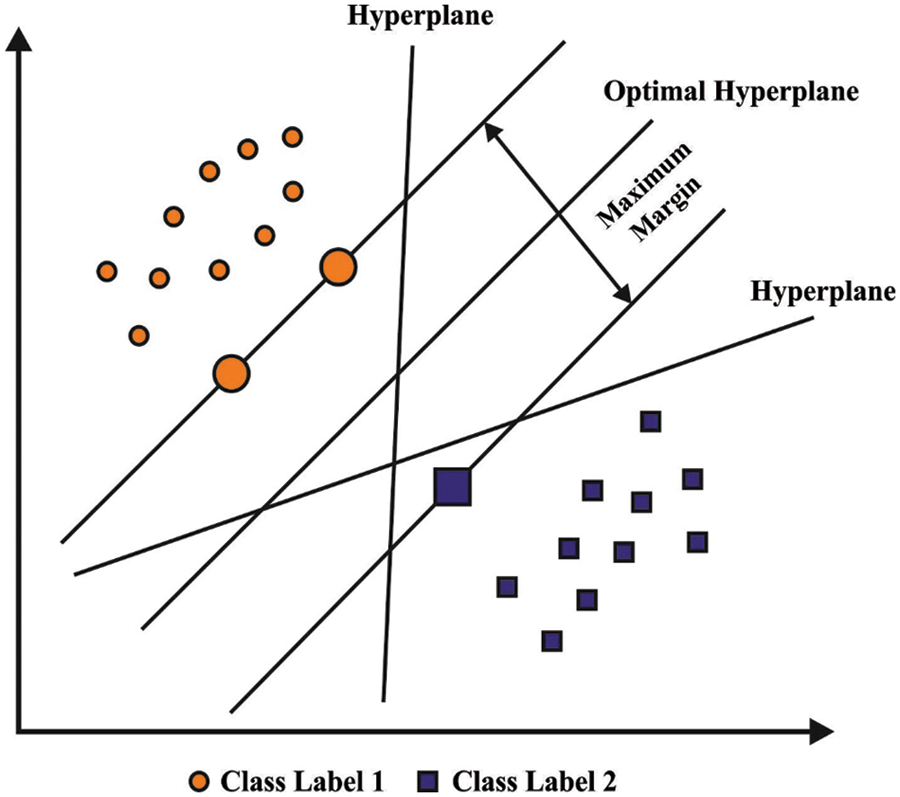
Figure 1: Structure of SVM
2.3 Design of MFO-Based Parameter Tuning
In this study, the MFO model is exploited to fine tune [25–27] the TSVM variables for enhanced results. MFO algorithm is a robust hybrid algorithm which is designed as per the male mayfly’s reproductive behaviour in terms of attracting females through dance. This process merges the advantage of the Firefly Algorithm (FA) and Genetic Algorithm (GA), according to particle swarm optimization (PSO). The MFO algorithm locally searches two populations and updates the speed and position based on particular rules. Individual male adjusts their position by comparing themselves with others [28]. The speed and position of individual males are defined as follows:
Amongst others,
Here, L indicates an arbitrary number within a specific interval; male corresponds to an individual male mayfly; female implies an individual female mayfly; and offspring denotes the individual mayfly. In the principle of observance of population size constant and late generation population, once it accomplishes the best fitness value, the respective parameter of the preceding generation population is replaced. In other terms, the preceding generation’s population would remain constant. Now,
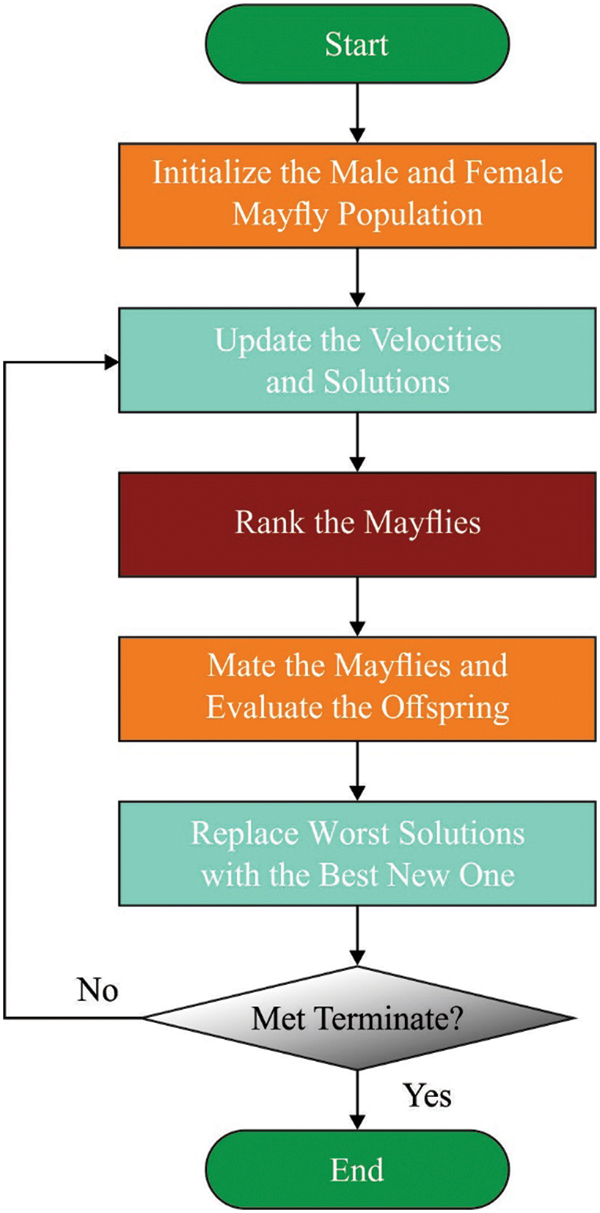
Figure 2: Flowchart of MFO
In this section, the proposed model was experimentally validated using the UNSW-NB15 dataset (https://research.unsw.edu.au/projects/unsw-nb15-dataset). The dataset contains a total of 2,540,044 records or network connections, and there are 10 different classes of attacks that can be detected, along with a class representing normal network traffic. Here are the details of the number of records for each class of attacks: Backdoor: 1746 DoS: 12264 Exploits: 44525 Fuzzers: 24246 Generic: 215481 Reconnaissance: 55604 Shellcode: 1511 Worms: 130 Analysis: 200 Normal: 93000. For experimental validation, ten-fold cross-validation is used.
The results were investigated under several measures. The proposed model is simulated using Python 3.6.5 tool on PC i5-8600k, GeForce 1050Ti 4GB, 16GB RAM, 250GB SSD, and 1TB HDD. The parameter settings are given as follows: learning rate: 0.01, dropout: 0.5, batch size: 5, epoch count: 50, and activation: ReLU. Table 1 reports the overall classification results achieved by the EMML-CADC model on distinct class labels. Fig. 3 illustrates a brief overview of
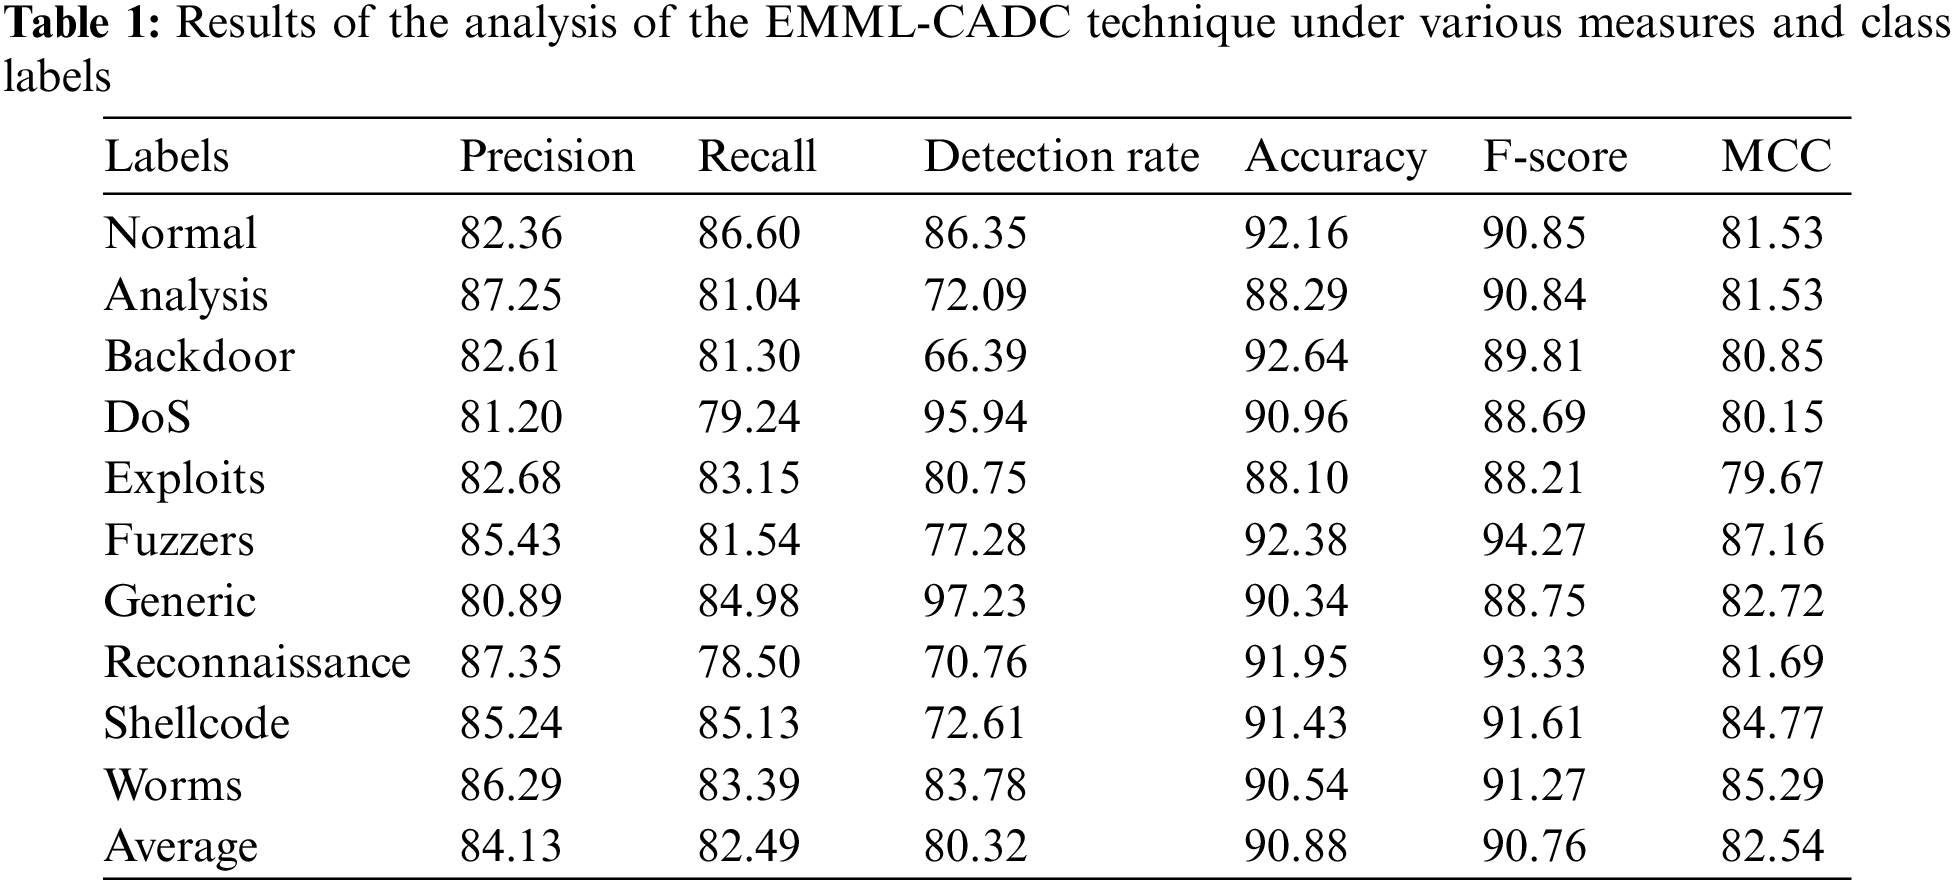
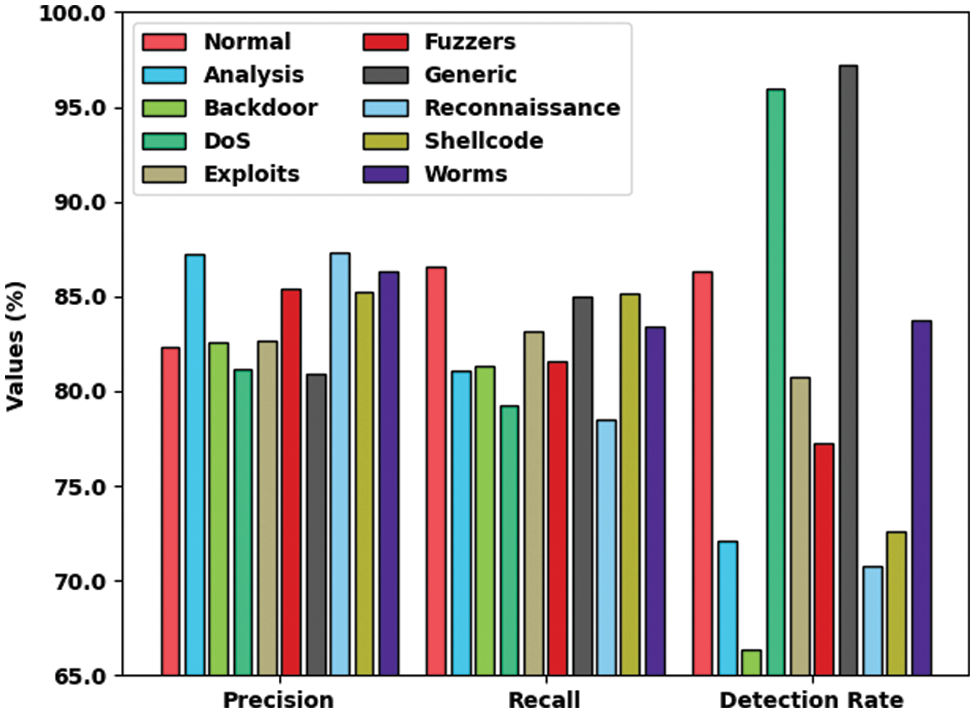
Figure 3:
Fig. 4 demonstrates a brief overview of
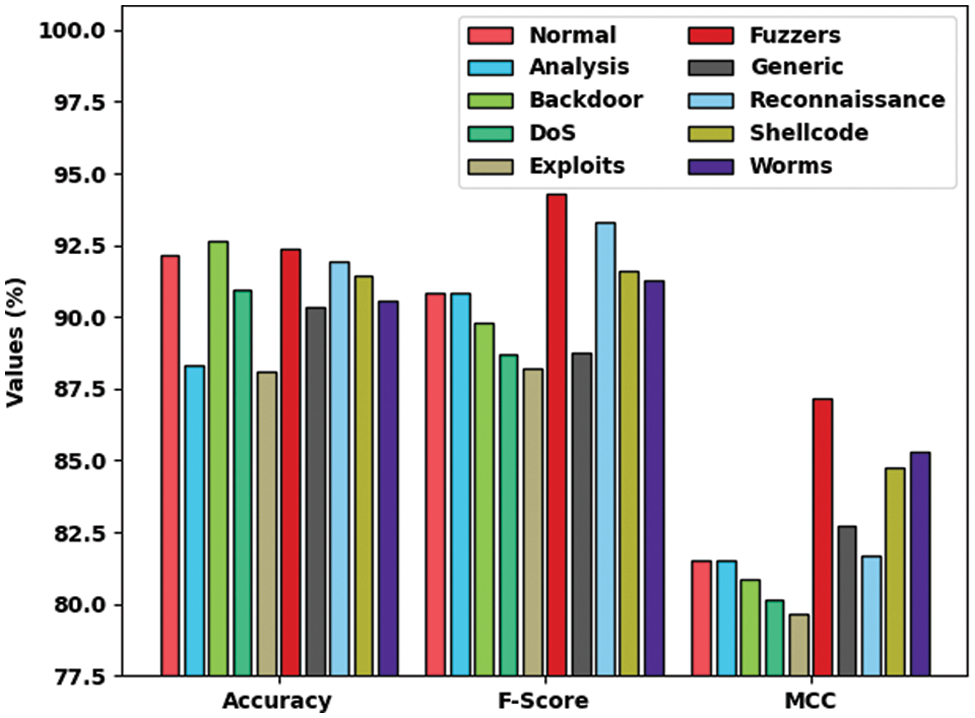
Figure 4:
Table 2 and Fig. 5 demonstrate a brief overview of Elapsed Time (ET) analysis results achieved by the proposed EMML-CADC model on training (TR) and testing (TS) data. The experimental results demonstrate that the EMML-CADC model required the least ET values under both TR and TS data. For instance, under normal class, the proposed EMML-CADC model obtained an ET of 4.0500 and 2.0280 s on TR and TS data, respectively. Meanwhile, with the DoS class, the EMML-CADC method attained an ET of 0.0110 and 0.0260 s on TR and TS data correspondingly. Eventually, with a generic class, the presented EMML-CADC methodology obtained an ET of 1.9220 and 0.0510 s on TR and TS data, respectively. Along with that, with the worms class, the EMML-CADC system reached an ET of 0.0030 and 0.0320 s on TR and TS data correspondingly.
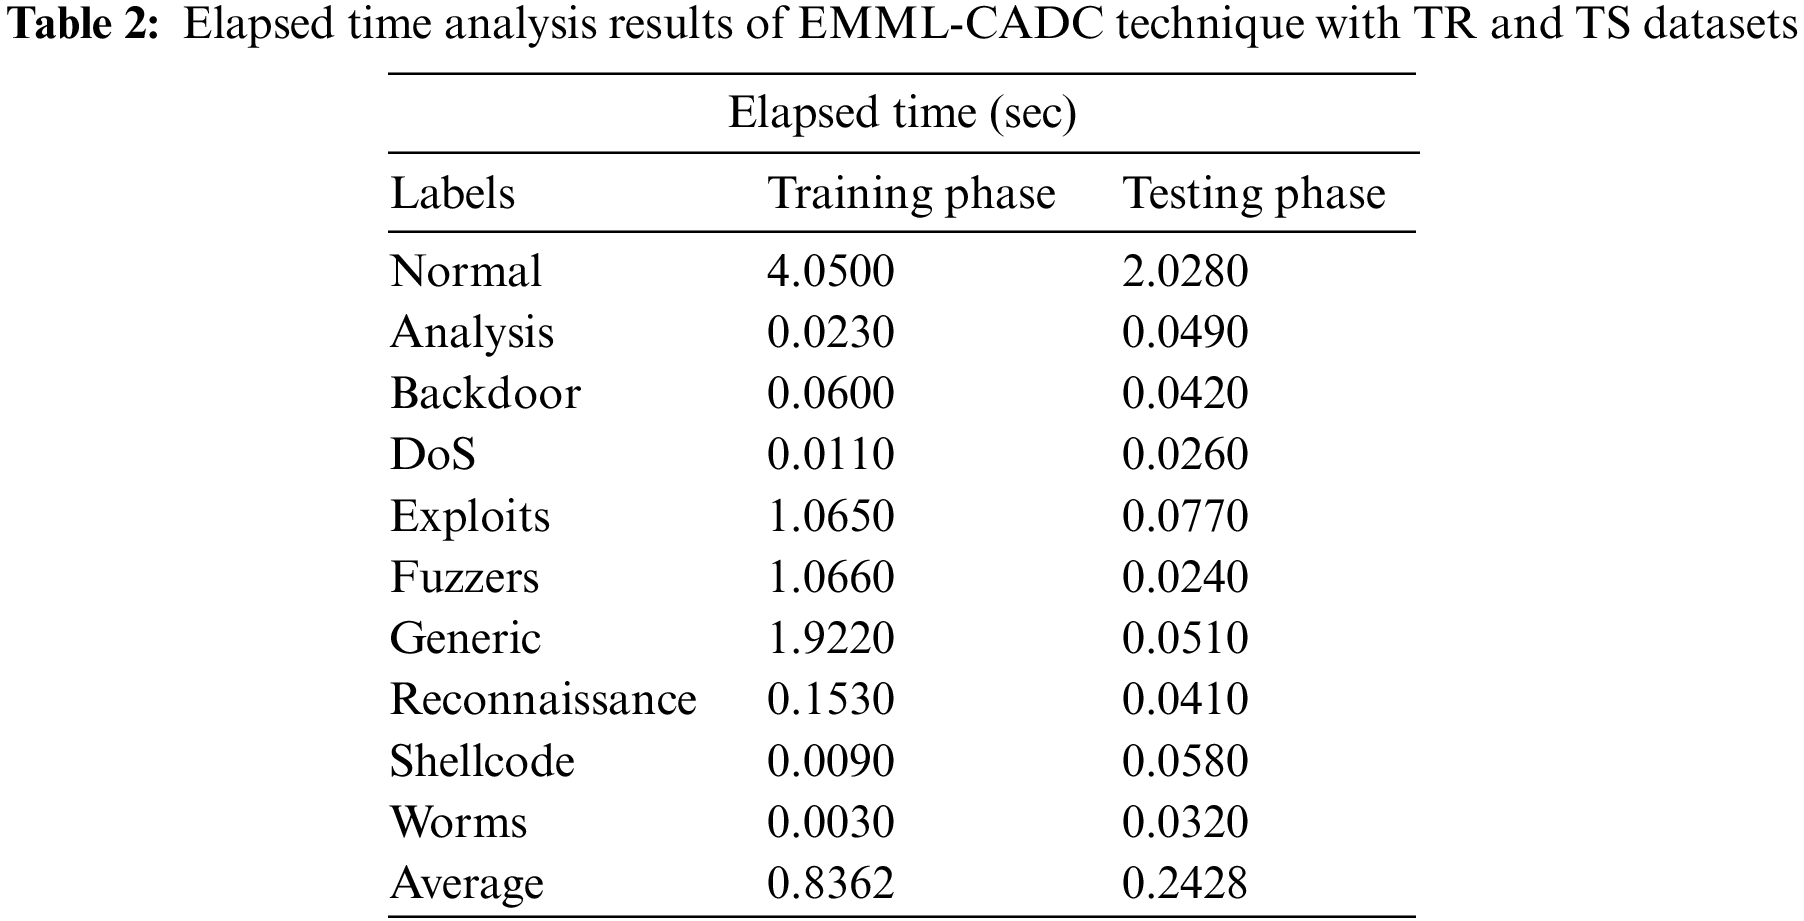
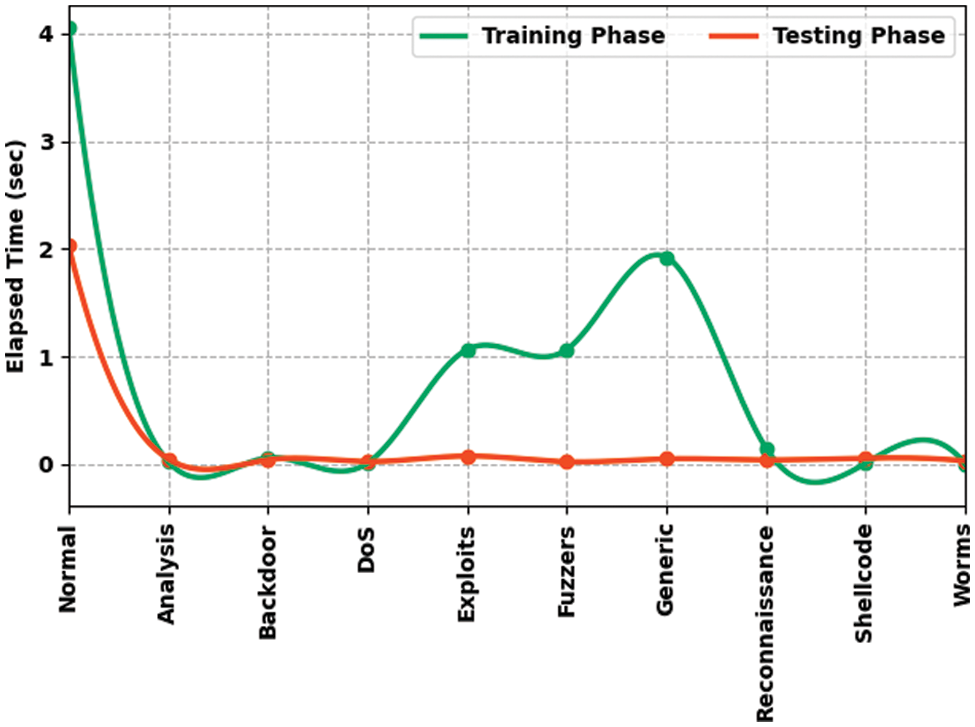
Figure 5: ET analysis results of EMML-CADC technique with TR and TS datasets
Table 3 and Fig. 6 provide a brief illustration of Computational Time (CT) analysis results achieved by the EMML-CADC model on TR and TS datasets. The experimental results demonstrate that the EMML-CADC system required the least CT values under both TR and TS datasets. For example, with normal class, the EMML-CADC model achieved a CT of 0.9200 and 0.0381 s on TR and TS datasets, respectively. In the meantime, with the DoS class, the EMML-CADC model obtained a CT of 0.0110 and 0.0034 s on TR and TS datasets correspondingly. Finally, with generic class, the proposed EMML-CADC model obtained a CT of 0.0940 and 0.0140 s on TR and TS datasets, respectively. In addition to these, with worms class, the proposed EMML-CADC model obtained a CT of 0.0010 and 0.030 s on TR and TS datasets correspondingly.
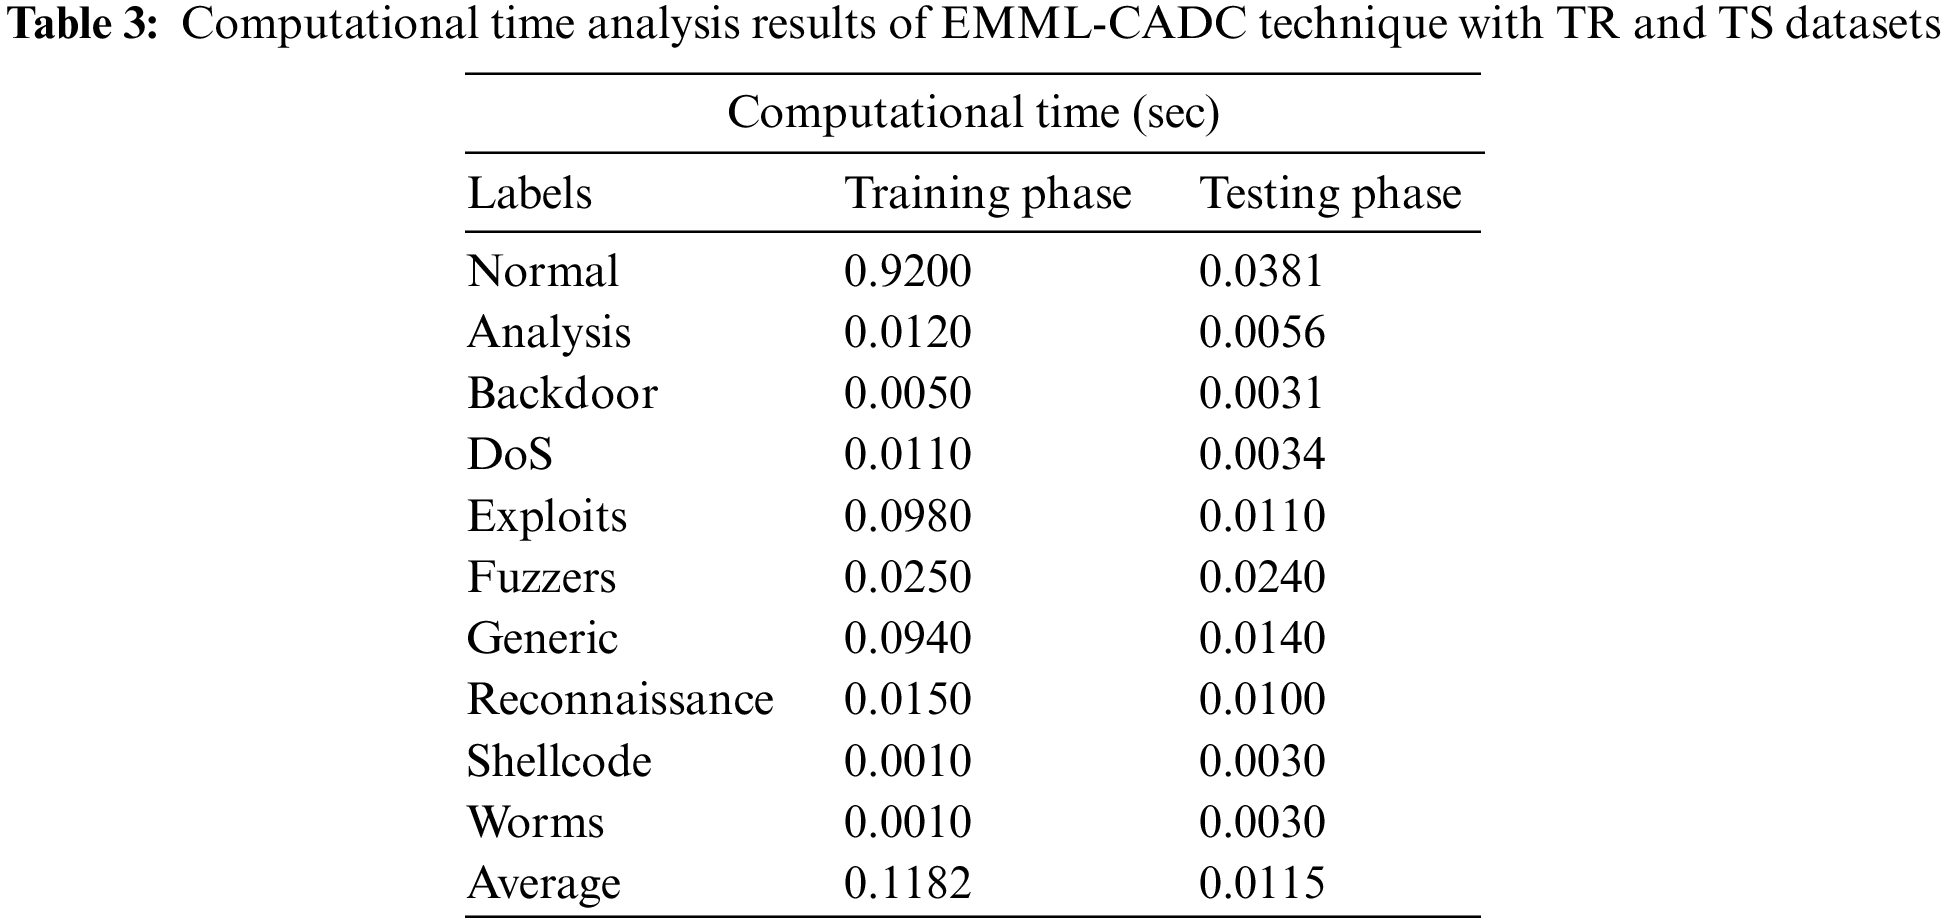
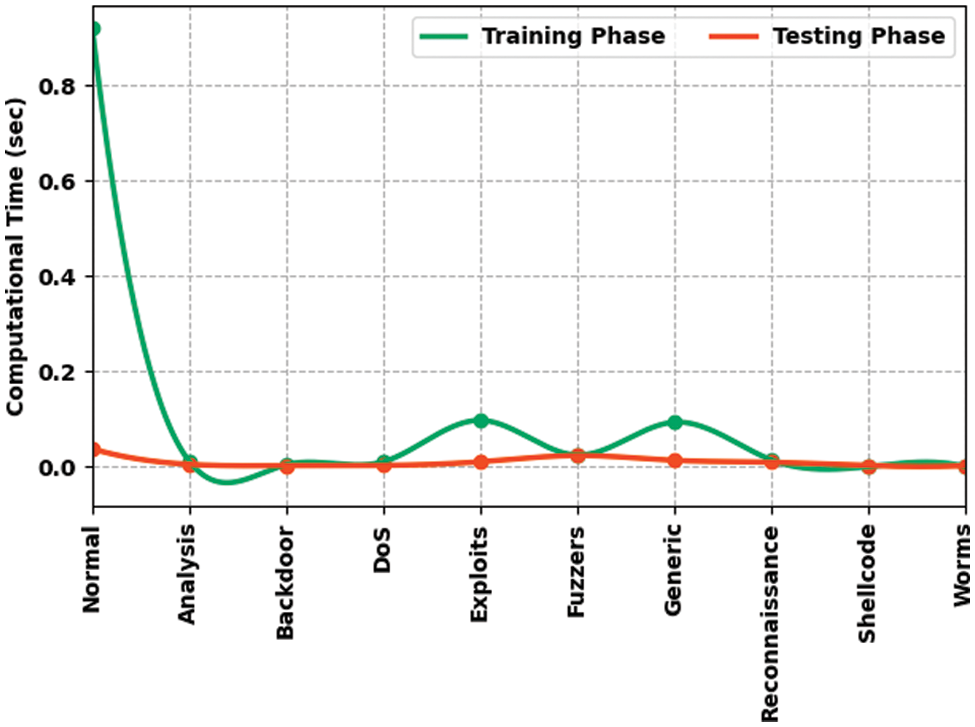
Figure 6: CT analysis results of EMML-CADC technique with TR and TS datasets
Table 4 and Fig. 7 portray the results of comparative DR analysis between the EMML-CADC model and other existing models. The results indicate that the proposed EMML-CADC model achieved better performance than other models. For instance, with standard class, the EMML-CADC model achieved a higher DR of 86.35%, whereas Particle Swarm Optimization (PSO)-light Gradient Boosting Machine (GBM), CMLW, Opt. Convolution Neural Network (CNN), Naïve Bayes (NB), and K-Nearest Neighbor (KNN) models achieved the least DR values such as 80.85%, 57.68%, 78.08%, 52.70%, and 83.60%, respectively. In addition, with the Denial of Service (DoS) class, the EMML-CADC system attained a high DR of 95.94%, while PSO-Light GBM, CMLW, Opt. CNN, NB, and KNN techniques achieved the least DR values, such as 15.40%, 15.60%, 36.22%, 33.50%, and 97.70%. In line with these, with generic class, EMML-CADC methodology presented a high DR of 97.23%, whereas PSO-Light GBM, CMLW, Opt. CNN, NB, and KNN approaches exhibited the least DR values, such as 84.34%, 96.20%, 96.19%, 42.80%, and 44.80%, correspondingly. At last, with worms class, the EMML-CADC method offered a high DR of 83.78%, whereas PSO-Light GBM, CMLW, Opt. CNN, NB, and KNN techniques accomplished the least DR values, such as 77.78%, 33.67%, 54.55%, 40%, and 51.15%, correspondingly.
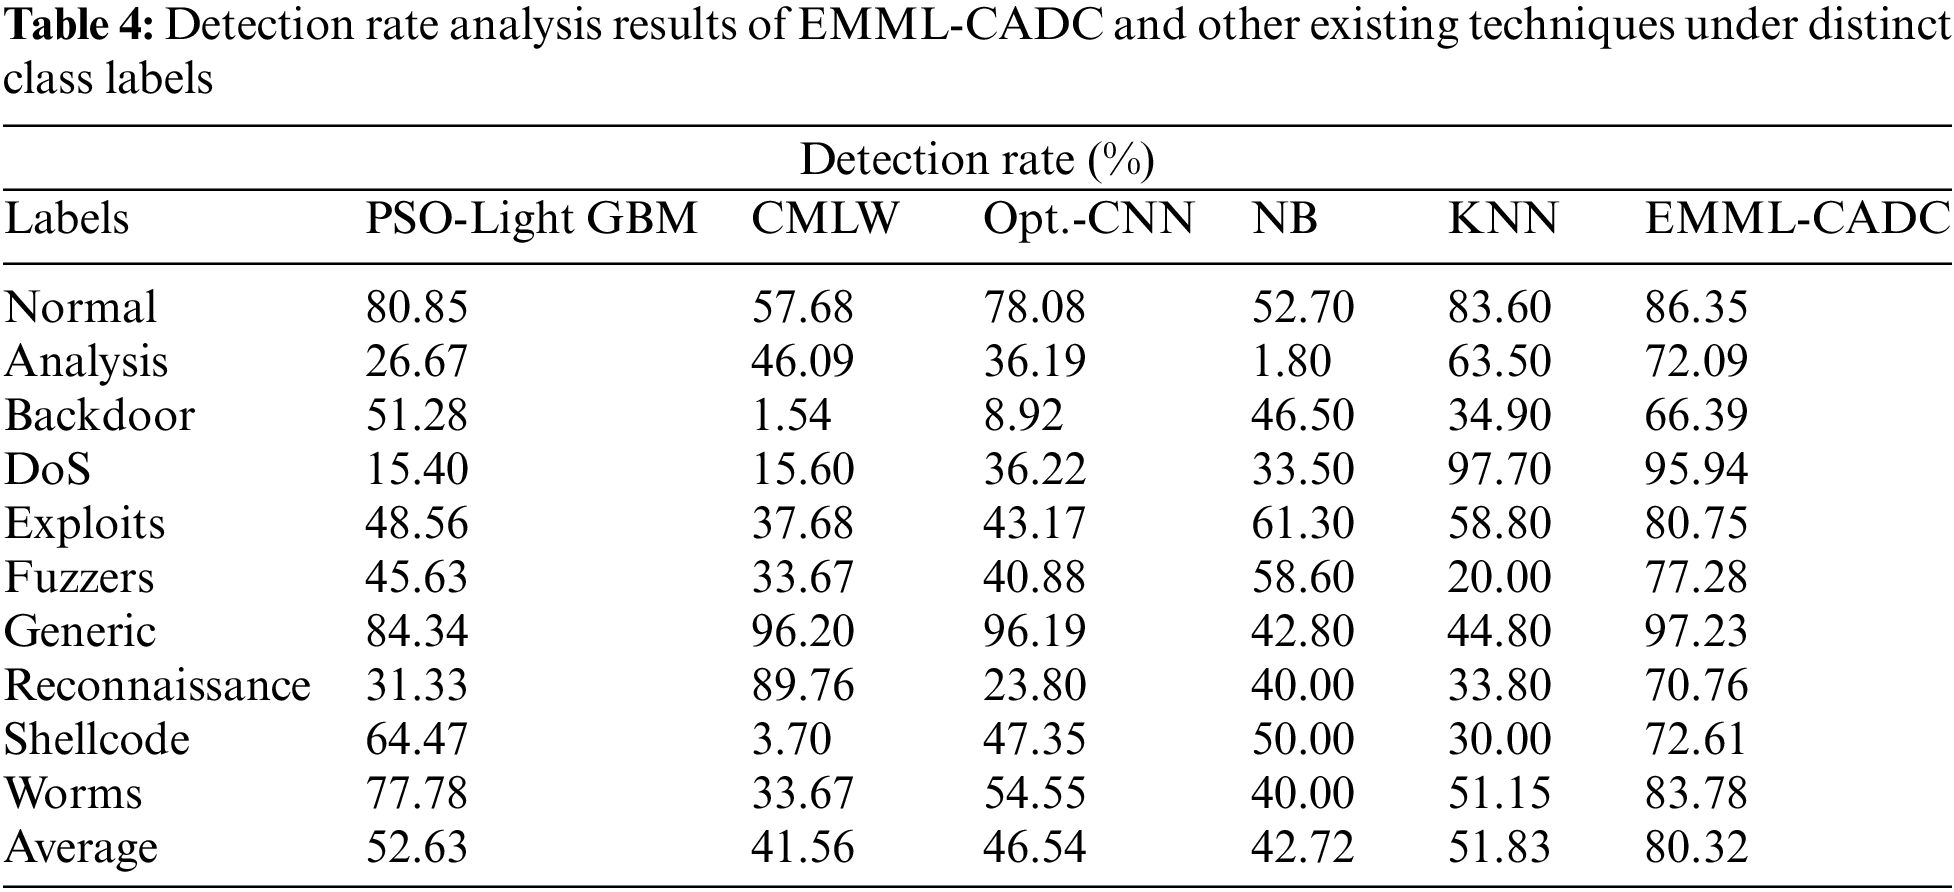
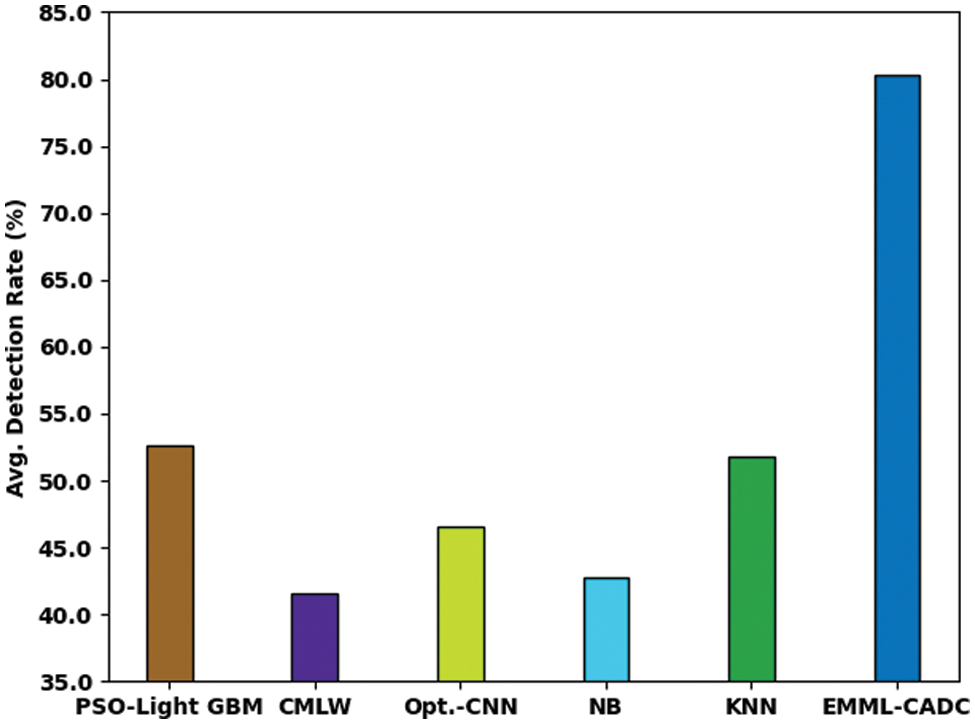
Figure 7: Detection rate analysis results of EMML-CADC and other existing techniques under distinct class labels
A comparison study was conducted between the EMML-CADC model and other techniques in terms of accuracy, and the results are shown in Table 5 [29]. Fig. 8 depicts the comparative
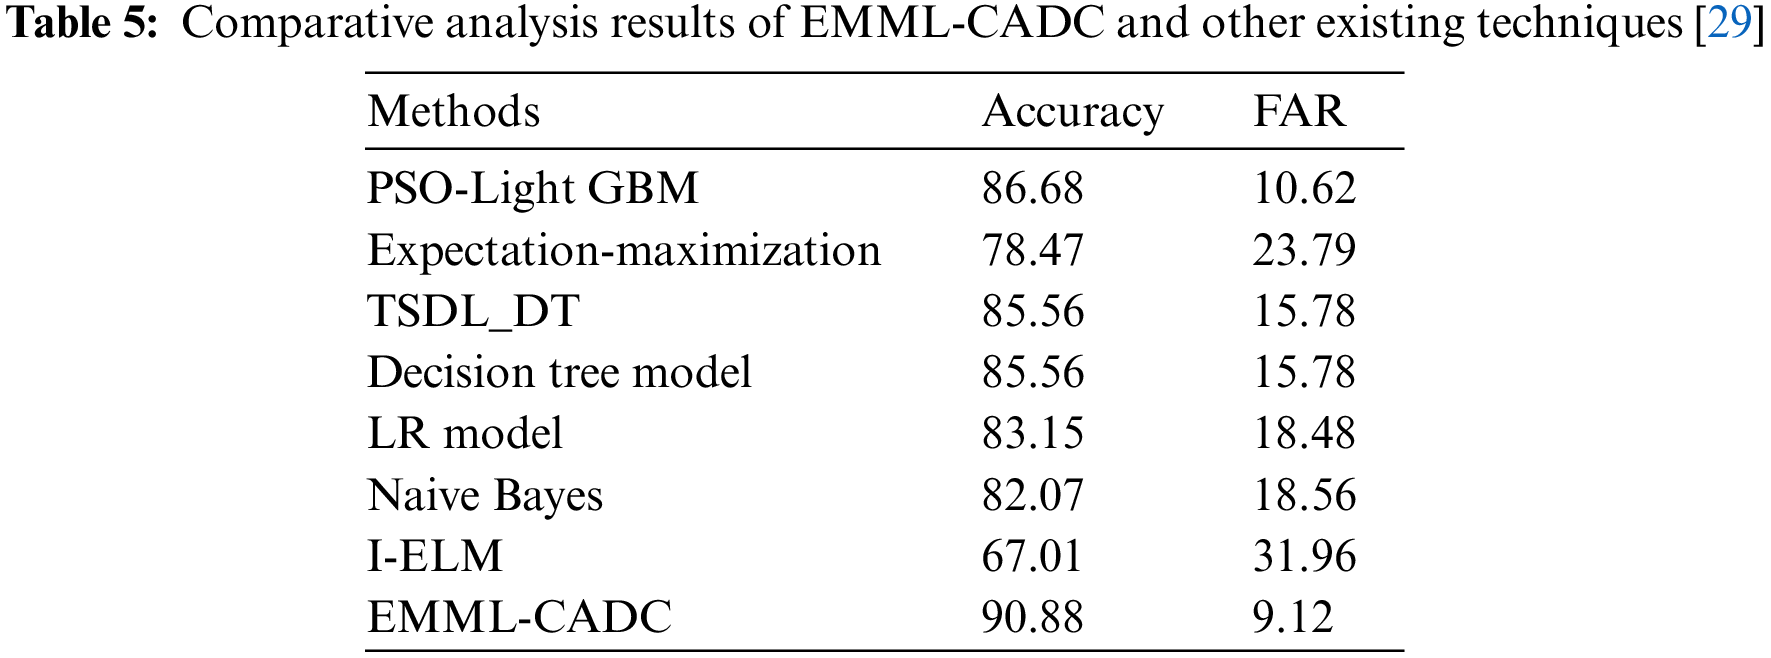
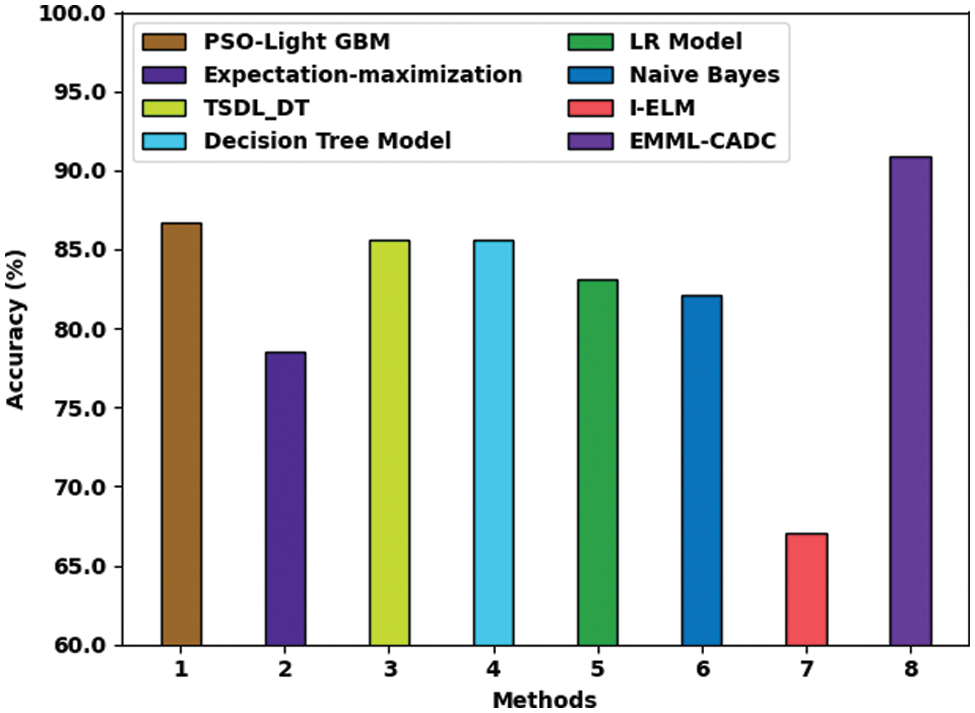
Figure 8:
Fig. 9 shows the comparative False Acceptance Rate (FAR) analysis results accomplished by the EMML-CADC method and existing methods. The I-ELM model presented the highest FAR of 31.96%, whereas the Expectation-maximization model achieved a moderately lesser FAR of 23.79%. Next, LR and NB models accomplished slightly lesser FAR values, such as 18.48% and 18.56%, correspondingly. In line with this, PSO-Light GBM, TSDL_DT, and DT methodology illustrated significantly lesser FAR values, such as 10.62%, 15.78%, and 15.78%, correspondingly. However, the proposed EMML-CADC model achieved the least FAR of 9.12% and outperformed all other methods.
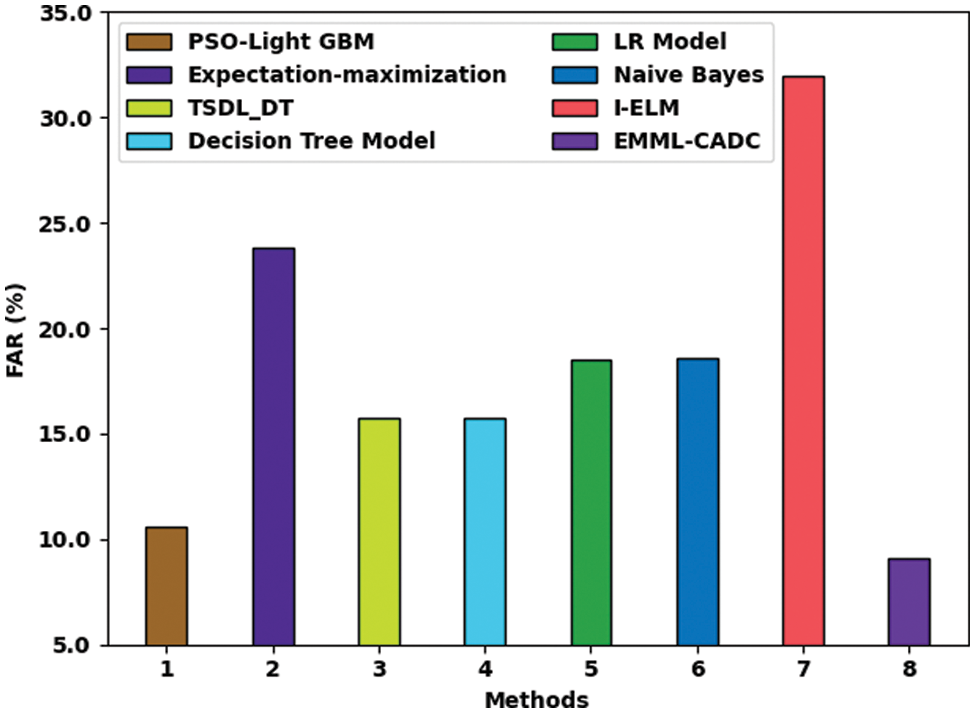
Figure 9: FAR analysis of EMML-CADC technique with recent algorithms
By looking into the above-mentioned tables and figures, it is apparent that the EMML-CADC model accomplished superior results over other methods.
In this study, a novel EMML-CADC model has been developed to enhance the efficiency of cyberattack detection in an IoT environment. To attain this, the proposed EMML-CADC model primarily employs data pre-processing to normalize the data into a uniform format. In addition, the ECSO-FS approach is applied to choose the optimal feature subsets. Besides, the MFO-TSVM model is utilized for the detection and classification of cyberattacks. Here, the MFO model has been exploited to fine-tune the TSVM variables for enhanced results. The performance of the proposed EMML-CADC technique was validated using a benchmark dataset, and the results were inspected under several measures. The comparative study results conclude that the EMML-CADC method is superior to other existing approaches under distinct measures. In future, advanced deep learning classifiers can be involved in the proposed method to improve intrusion detection efficacy in IoT platforms.
Funding Statement: The author would like to thank Prince Sultan University for its support in paying the Article Processing Charges.
Conflicts of Interest: The author declares that they have no conflicts of interest to report regarding the present study.
References
1. A. Verma and V. Ranga, “Machine learning based intrusion detection systems for IOT applications,” Wireless Personal Communications, vol. 111, no. 4, pp. 2287–2310, 2020. [Google Scholar]
2. K. A. P. da Costa, J. P. Papa, C. O. Lisboa, R. Munoz and V. H. C. de Albuquerque, “Internet of Things: A survey on machine learning-based intrusion detection approaches,” Computer Networks, vol. 151, pp. 147–157, 2019. [Google Scholar]
3. B. Yin and X. T. Wei, “Communication-efficient data aggregation tree construction for complex queries in IoT applications,” IEEE Internet of Things Journal, vol. 6, no. 2, pp. 3352–3363, 2018. [Google Scholar]
4. M. Driss, I. Almomani, Z. E. Huma and J. Ahmad, “A federated learning framework for cyberattack detection in vehicular sensor networks,” Complex & Intelligent Systems, vol. 8, pp. 4221–4235, 2022. https://doi.org/10.1007/s40747-022-00705-w [Google Scholar] [CrossRef]
5. S. Alshathri, A. El-sayed, W. El-shafai and E. El-din Hemdan, “An efficient intrusion detection framework for industrial internet of things security,” Computer Systems Science and Engineering, vol. 46, no. 1, pp. 819–834, 2023. https://doi.org/10.32604/csse.2023.034095 [Google Scholar] [CrossRef]
6. S. M. He, K. Xie, K. X. Xie, C. Xu and J. Wang, “Interference-aware multisource transmission in multiradio and multichannel wireless network,” IEEE Systems Journal, vol. 13, no. 3, pp. 2507–2518, 2019. [Google Scholar]
7. Y. S. Luo, K. Yang, Q. Tang, J. Zhang and B. Xiong, “A multi-criteria network-aware service composition algorithm in wireless environments,” Computer Communications, vol. 35, no. 15, pp. 1882–1892, 2012. [Google Scholar]
8. A. Derhab, O. Cheikhrouhou, A. Allouch, A. Koubaa, B. Qureshi et al., “Internet of drones security: Taxonomies, open issues, and future directions,” Vehicular Communications, vol. 39, 100552, 2022. https://doi.org/10.1016/j.vehcom.2022.100552 [Google Scholar] [CrossRef]
9. Z. F. Liao, J. B. Liang and C. C. Feng, “Mobile relay deployment in multihop relay networks,” Computer Communications, vol. 112, no. 1, pp. 14–21, 2017. [Google Scholar]
10. B. Yin and J. Lu, “A cost-efficient framework for crowdsourced data collection in vehicular networks,” IEEE Internet of Things Journal, vol. 8, no. 17, pp. 13567–13581, 2021. [Google Scholar]
11. D. Cao, B. Zheng, B. Ji, Z. Lei and C. Feng, “A robust distance-based relay selection for message dissemination in vehicular network,” Wireless Networks, vol. 26, no. 3, pp. 1755–1771, 2020. [Google Scholar]
12. W. Sun, G. C. Zhang, X. R. Zhang, X. Zhang and N. N. Ge, “Fine-grained vehicle type classification using lightweight convolutional neural network with feature optimization and joint learning strategy,” Multimedia Tools and Applications, vol. 80, no. 20, pp. 30803–30816, 2021. [Google Scholar]
13. W. Sun, X. Chen, X. R. Zhang, G. Z. Dai, P. S. Chang et al., “A multi-feature learning model with enhanced local attention for vehicle re-identification,” Computers, Materials & Continua, vol. 69, no. 3, pp. 3549–3561, 2021. [Google Scholar]
14. C. Liang, B. Shanmugam, S. Azam, M. Jonkman, F. D. Boer et al., “Intrusion detection system for internet of things based on a machine learning approach,” in 2019 Int. Conf. on Vision Towards Emerging Trends in Communication and Networking (ViTECoN), Vellore, India, pp. 1–6, 2019. [Google Scholar]
15. T. Mohamed, T. Otsuka and T. Ito, “Towards machine learning based IoT intrusion detection service,” in Int. Conf. on Industrial, Engineering and other Applications of Applied Intelligent Systems, Lecture Notes in Computer Science Book Series, Montreal, CA, vol. 10868, pp. 580–585, 2018. [Google Scholar]
16. M. Ahmad, Q. Riaz, M. Zeeshan, H. Tahir, S. A. Haider et al., “Intrusion detection in internet of things using supervised machine learning based on application and transport layer features using UNSW-NB15 data-set,” EURASIP Journal on Wireless Communications and Networking, vol. 2021, no. 1, pp. 10, 2021. [Google Scholar]
17. M. A. Hawawreh, N. Moustafa and E. Sitnikova, “Identification of malicious activities in industrial internet of things based on deep learning models,” Journal of Information Security and Applications, vol. 41, pp. 1–11, 2018. [Google Scholar]
18. F. Alrowais, A. S. Almasoud, R. Marzouk, F. N. Al-Wesabi, A. M. Hilal et al., “Artificial intelligence based data offloading technique for secure mec systems,” Computers, Materials & Continua, vol. 72, no. 2, pp. 2783–2795, 2022. [Google Scholar]
19. M. A. Hamza, S. B. Haj Hassine, I. Abunadi, F. N. Al-Wesabi, H. Alsolai et al., “Feature selection with optimal stacked sparse autoencoder for data mining,” Computers, Materials & Continua, vol. 72, no. 2, pp. 2581–2596, 2022. [Google Scholar]
20. A. A. Albraikan, S. B. Haj Hassine, S. M. Fati, F. N. Al-Wesabi, A. M. Hilal et al., “Optimal deep learning-based cyberattack detection and classification technique on social networks,” Computers, Materials & Continua, vol. 72, no. 1, pp. 907–923, 2022. [Google Scholar]
21. A. M. Hilal, J. S. Alzahrani, I. Abunadi, N. Nemri, F. N. Al-Wesabi et al., “Intelligent deep learning model for privacy preserving IIOT on 6G environment,” Computers, Materials & Continua, vol. 72, no. 1, pp. 333–348, 2022. [Google Scholar]
22. A. M. Ahmed, T. A. Rashid and S. A. M. Saeed, “Cat swarm optimization algorithm: A survey and performance evaluation,” Computational Intelligence and Neuroscience, vol. 2020, pp. 1–20, 2020. [Google Scholar]
23. X. Nie, W. Wang and H. Nie, “Chaos quantum-behaved cat swarm optimization algorithm and its application in the PV MPPT,” Computational Intelligence and Neuroscience, vol. 2017, pp. 1–11, 2017. [Google Scholar]
24. D. Tomar and S. Agarwal, “Twin support vector machine: A review from 2007 to 2014,” Egyptian Informatics Journal, vol. 16, no. 1, pp. 55–69, 2015. [Google Scholar]
25. K. Shankar, E. Perumal, M. Elhoseny, F. Taher, B. B. Gupta et al., “Synergic deep learning for smart health diagnosis of COVID-19 for connected living and smart cities,” ACM Transactions on Internet Technology, vol. 22, no. 3, 16, pp. 1–14, 2022. [Google Scholar]
26. D. N. Le, V. S. Parvathy, D. Gupta, A. Khanna, J. J. P. C. Rodrigues et al., “IoT enabled depthwise separable convolution neural network with deep support vector machine for COVID-19 diagnosis and classification,” International Journal of Machine Learning and Cybernetics, vol. 12, pp. 3235–3248, 2021 [Google Scholar] [PubMed]
27. D. Venugopal, T. Jayasankar, M. Y. Sikkandar, M. I. Waly, I. V. Pustokhina et al., “A novel deep neural network for intracranial haemorrhage detection and classification,” Computers, Materials & Continua, vol. 68, no. 3, pp. 2877–2893, 2021. [Google Scholar]
28. K. Zervoudakis and S. Tsafarakis, “A mayfly optimization algorithm,” Computers & Industrial Engineering, vol. 145, pp. 106559, 2020. [Google Scholar]
29. J. Liu, D. Yang, M. Lian and M. Li, “Research on intrusion detection based on particle swarm optimization in IoT,” IEEE Access, vol. 9, pp. 38254–38268, 2021. [Google Scholar]
Cite This Article
 Copyright © 2023 The Author(s). Published by Tech Science Press.
This work is licensed under a Creative Commons Attribution 4.0 International License , which permits unrestricted use, distribution, and reproduction in any medium, provided the original work is properly cited.
 Downloads
 Citation Tools