
 Submit a Paper
 Propose a Special lssue
 Open Access
ARTICLE

LC-NPLA: Label and Community Information-Based Network Presentation Learning Algorithm
School of Mathematics and Computer Science, Yunnan Minzu University, Kunming, 650504, China
* Corresponding Author: Chunsheng Yang. Email:
(This article belongs to the Special Issue: Cognitive Granular Computing Methods for Big Data Analysis)
Intelligent Automation & Soft Computing 2023, 38(3), 203-223. https://doi.org/10.32604/iasc.2023.040818
Received 31 March 2023; Accepted 21 June 2023; Issue published 27 February 2024
 View Full Text
 Download PDF
Abstract
Many network presentation learning algorithms (NPLA) have originated from the process of the random walk between nodes in recent years. Despite these algorithms can obtain great embedding results, there may be also some limitations. For instance, only the structural information of nodes is considered when these kinds of algorithms are constructed. Aiming at this issue, a label and community information-based network presentation learning algorithm (LC-NPLA) is proposed in this paper. First of all, by using the community information and the label information of nodes, the first-order neighbors of nodes are reconstructed. In the next, the random walk strategy is improved by integrating the degree information and label information of nodes. Then, the node sequence obtained from random walk sampling is transformed into the node representation vector by the Skip-Gram model. At last, the experimental results on ten real-world networks demonstrate that the proposed algorithm has great advantages in the label classification, network reconstruction and link prediction tasks, compared with three benchmark algorithms.Keywords
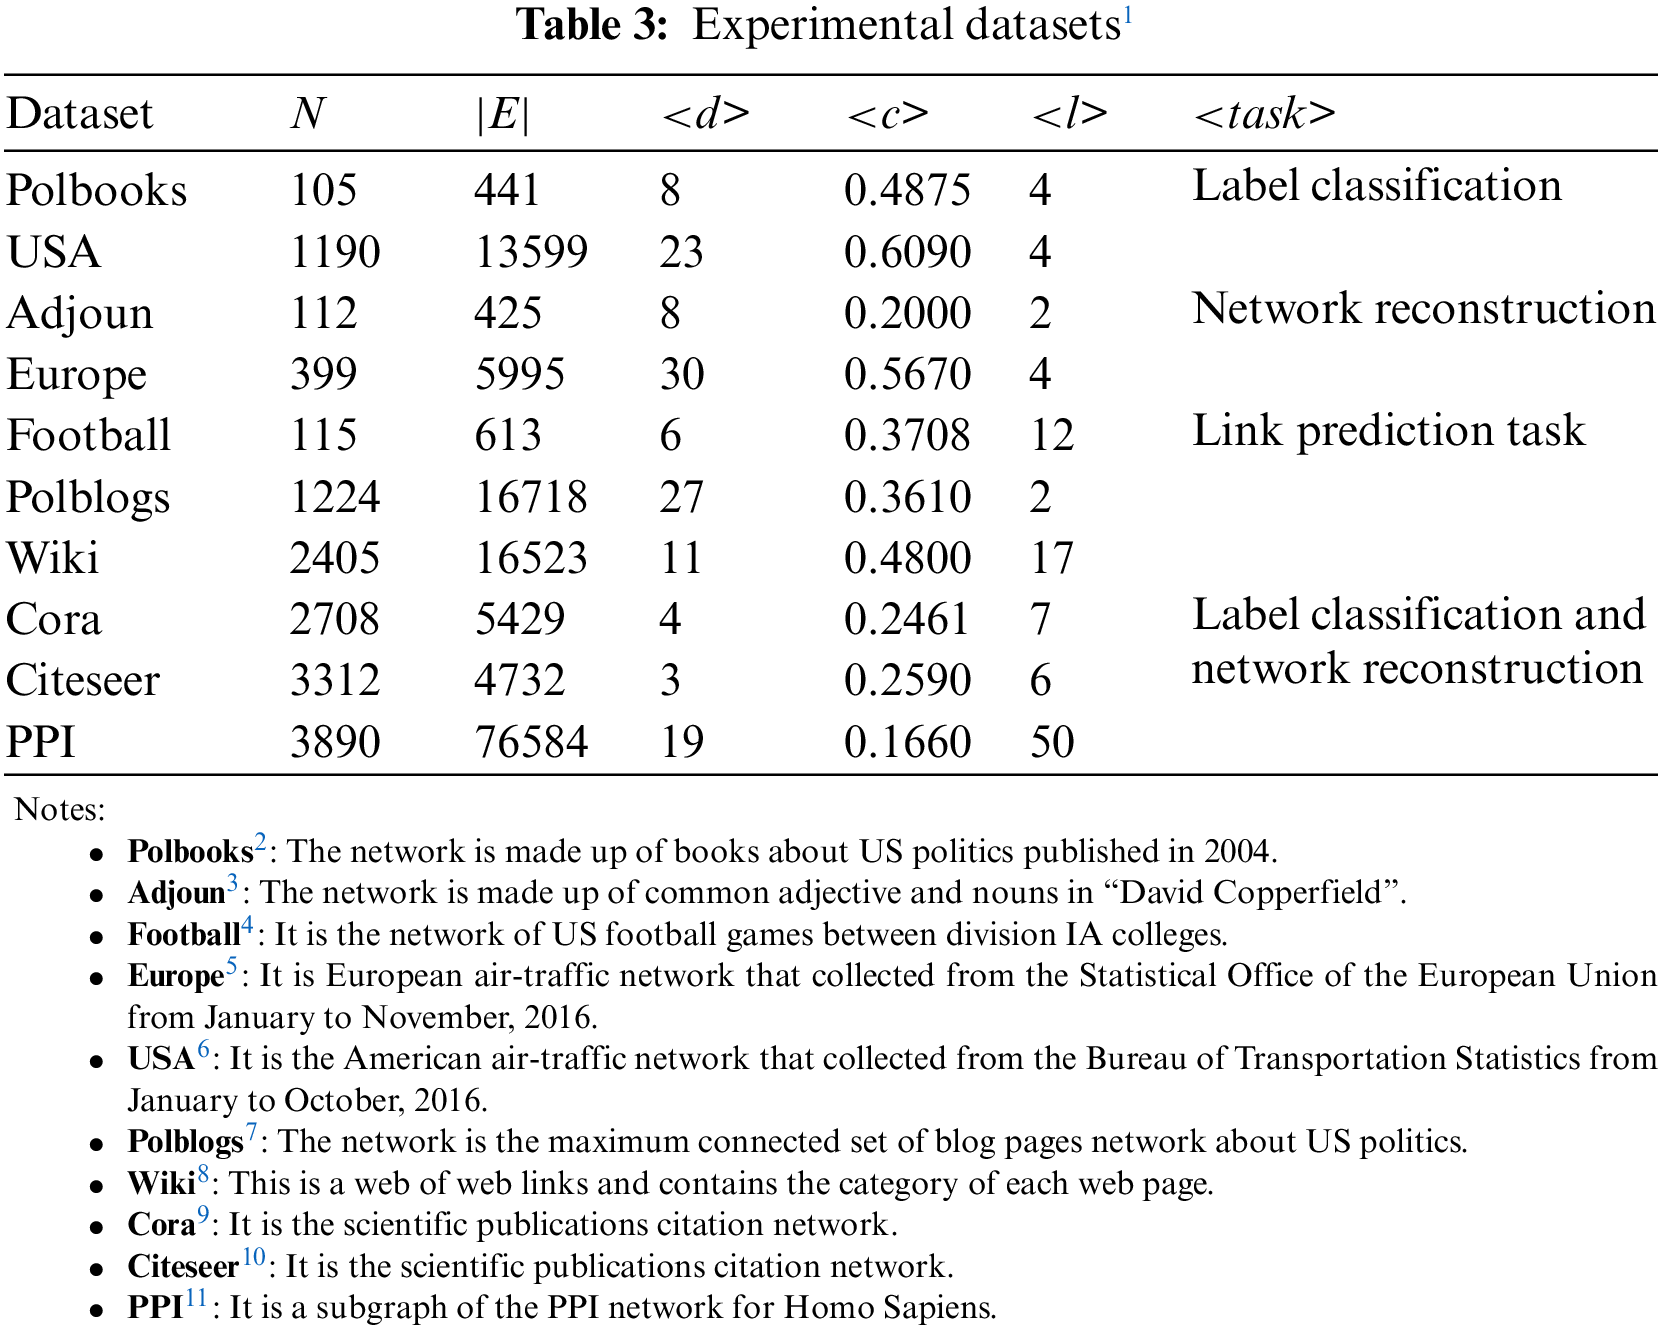
In the real world, various complex networks are abstracted from social scenarios, such as social networks [1], traffic networks [2], citation networks [3] and biological networks [4], and so on [5]. Complex networks describe not only the structure information of nodes, but also the attribute information of nodes. Therefore, due to their quantities of valuable information [6], complex networks have been given special attention in many fields. Especially in recent years, NPLA has attracted the attention of many scholars. This information obtained from network representation learning can be used for downstream tasks, such as node classification [7], link prediction [8], network clustering [9] and network community detection [10], and so on [11–13].
However, with the development of society, the scale of complex networks has changed dramatically, and the link relationships between nodes have become more and more complicated. The more space is needed to store networks. As a result, these traditional complex network analysis methods [14–21] are unable to deal with the impact of increasing network scale and specific machine learning tasks [22].
To solve this problem, many scholars gradually put forward NPLA based on the random walk strategy, which simulates natural language processing model to achieve network embedding, so as to map irregular dimensional complex networks into regular low-dimensional vector spaces. In this process, several models have been proposed. For example, the Deep Walk [23] algorithm is one of the most representative algorithms. And construction is similar to that of Word2vec [24]. The main idea is to use the random walk strategy to sample nodes in the network and learn the vector representation of nodes by utilizing the co-occurrence relationship between nodes in the network. The Line [25] algorithm describes the first-order similarity and second-order similarity of nodes with two different functions from the topological level of the network, and the final vector representation of nodes is obtained by integrating the above two levels. The Sdne [26] algorithm is the first model that applies deep learning to network representation. It considers that Deep Walk, the Line and other algorithms can't learn high-order nonlinear network structure at the level of the algorithm, so the idea of the Sdne algorithm is to describe the nonlinear network structure by using the nonlinear characteristics of the neural network. At the same time, the model still maintains the first-order similarity and second-order similarity mentioned in the Line algorithm. The Struc2vec [27] algorithm holds that the above models are all based on the hypothesis of nearest neighbor similarity, that is, the closer any two nodes are, the more similar they will be. However, in some networks, two nodes may not be close to each other in two-dimension space, but they may be more similar in three-dimensional space.
Unfortunately, these random walks-based NPLA algorithms can only capture the structural information of networks. That is to say, the community information of nodes fails to not be considered in the construction of NPLA. Aiming at this problem, some scholars have also therewith proposed the community information-based random walk NPLA. For instance, based on the local structure information and global structure information of network nodes, CARE [28] algorithm learns the representation vector of nodes. A novel semi-supervised Deep Walk method (SSDW [29]) is proposed for network representation learning, which successfully preserves the community structure in network embedding space. Specifically, a semi-supervised random walk sampling method with effective integration of paired constraints is proposed. Although random walk NPLA based on community information can effectively solve the impact of network size, a lot of information is lost when network is embedded. This is because the networks are always multi-information.
In addition, the link between the label information of nodes is also a kind of very important information in the network. For example, the bipartite graph [30] is a special kind of network (i.e., the vertex set in the graph is divided into two disjoint subsets, so that each edge connects the vertices of the two sets separately). To solve the problem of information loss during network embedding, thus, GraphRNA [31] based on the node attribute of the bipartite graph is proposed. The algorithm can take the direct neighbor of the node as the sampling target, and take the attribute of the node as the sampling target. In other words, attributes are also abstracted into nodes for a random walk in this algorithm, and so alleviates the problem of sampling deviation to central nodes.
Based on the above analysis and discussion, in this paper we propose a label and community information-based network presentation learning algorithm (LC-NPLA) to capture more information. In LC-NPLA, the first-order neighbors of nodes are reconstructed by using the community information and label information of nodes. Moreover, the degree information and label information of nodes are fused to construct a random walk strategy in LC-NPLA. The experimental results on many network data demonstrated that the proposed algorithm achieves a great advantage in the label classification, network reconstruction and link prediction tasks.
The contribution of this paper is as follows:
• The first-order neighbors of nodes are reconstructed by utilizing the community information and label information of nodes.
• A random walk strategy is constructed by integrating the degree information and label information of nodes.
• The LC-NPLA algorithm proposed in this paper can achieve better performance, compared to other benchmark algorithms.
The rest of this article is organized as follows. Section 2 proposes the concepts of network embedding, random walk sequence and pairwise constraint matrix. Section 3 gives the detailed construction procedure of the proposed LC-NPLA. Section 4 gives the experimental materials. Section 5 gives the results and analysis. Section 6 gives the conclusion of this paper.
In this section, some necessary knowledge is introduced, which are network embedding, random walk sequence and pairwise constraint matrix. For more detailed knowledge, one can refer to the references [23,29].
In general, an undirected and unweighted network can be represented as a tuple
The random walk traverses a network starting at a node. At any node, it goes to the neighbor of this node with probability a. A random walk sequence with
2.3 Pairwise Constraint Matrix
Matrix
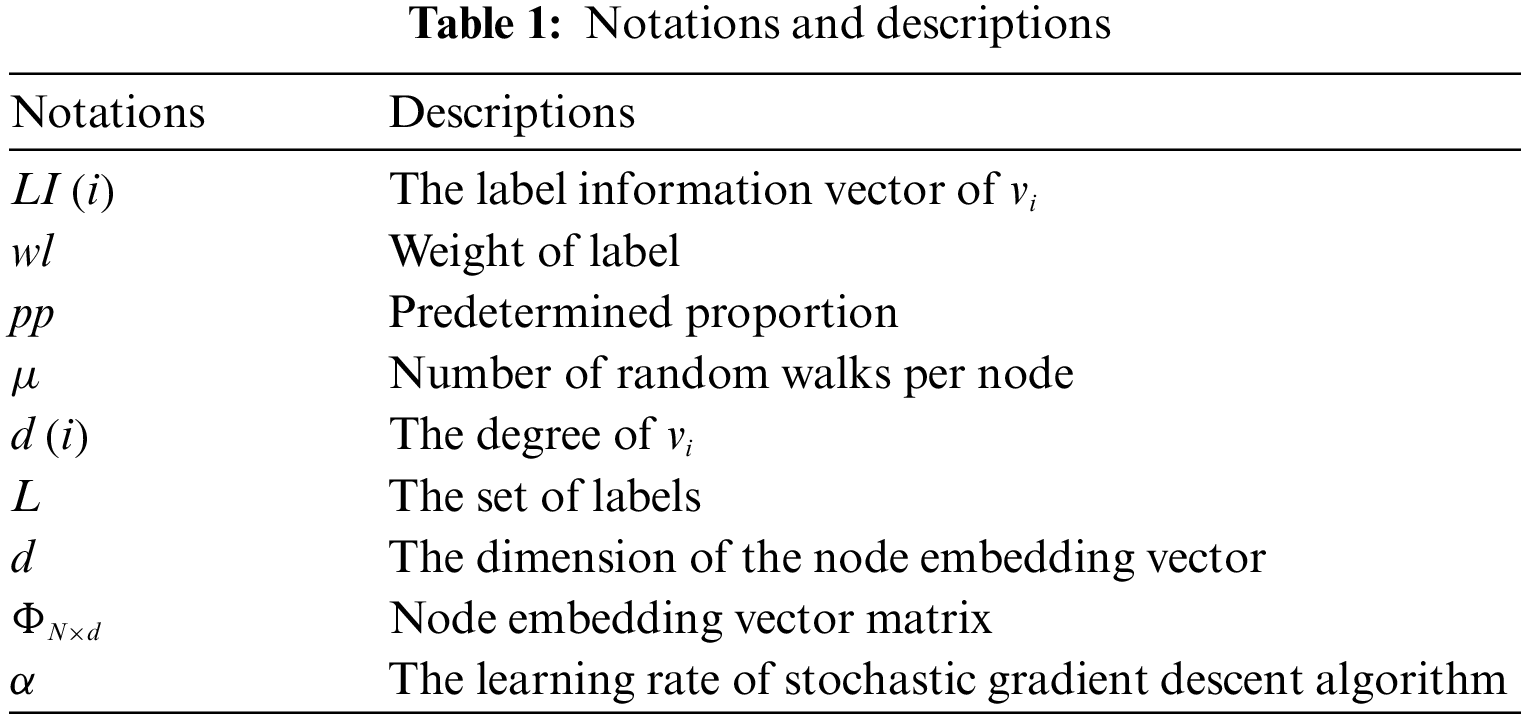
In order to facilitate understanding of this article, some of the relevant concepts are summarized in Table 1.
3 The Proposed LC-NPLA Algorithm
In this section, we propose LC-NPLA and discuss the main components of our algorithm. The specific algorithm flow is divided into the following two parts: Preprocessing process of nodes, Label and Degree strategy (LD strategy). And we also introduce the framework of LC-NPLA.
3.1 Preprocessing Process of Nodes
In Fig. 1,
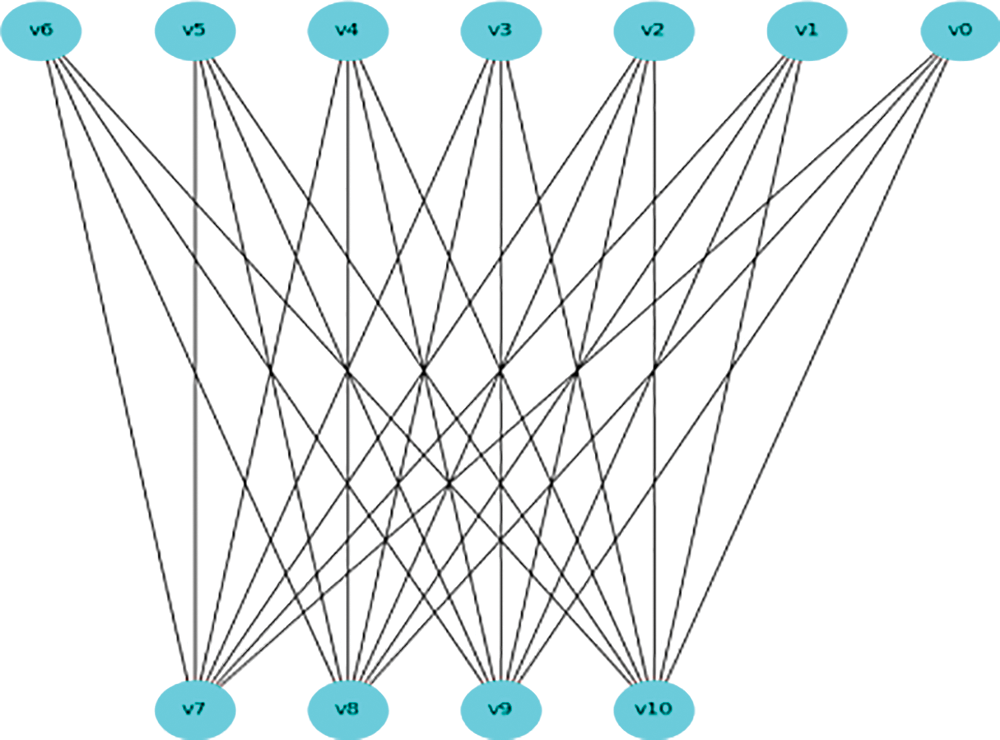
Figure 1: Bipartite graph
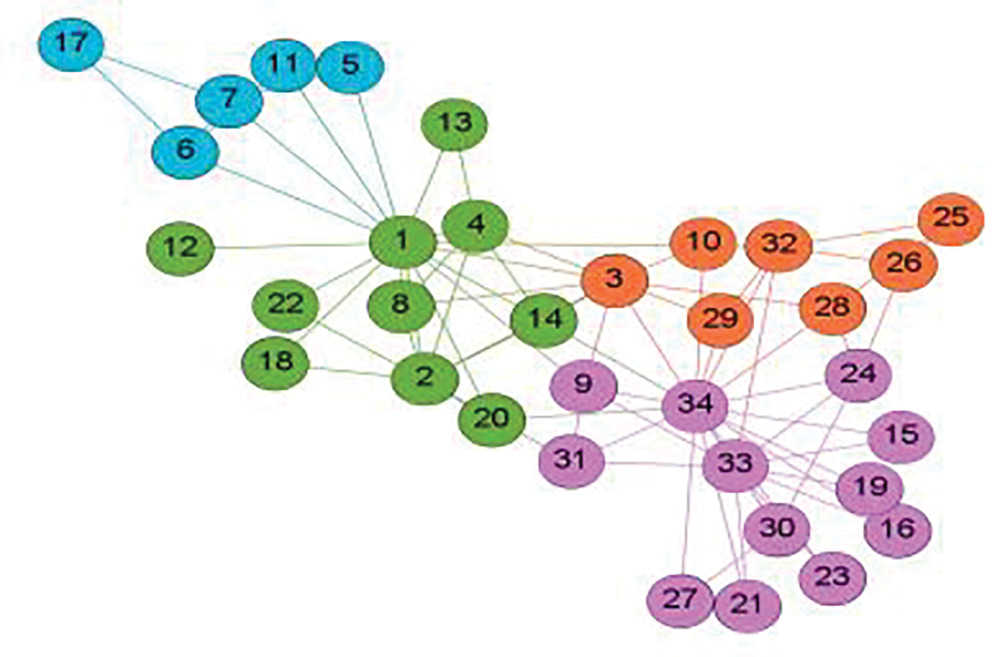
Figure 2: Network with community distribution
From the above discussion, we intend to use the Louvain [32] algorithm to calculate the community distribution of networks for ease of calculation. In this process, due to the limitation of experimental equipment, 10% and 20% of the community information is used to reconstruct the node’s first-order neighbors, respectively. When the community information is 10% and 20%, the specific form of LC-NPLA is LC-NPLA_P10 and LC-NPLA_P20. Therefore, the details of the preprocessing process are given as follows: in the newly first-order neighbors of defined nodes, nodes that belong to different communities but have the same label will be classified into the first-order neighbors of the known nodes. Nodes that belong to different communities but have different labels are not included in the first-order neighbors of the nodes. Therefore, the new first-order neighbors of the nodes will contain more information.
During the preprocessing process of nodes, the new first-order neighbors of nodes are generated. In order to sample these, we design a LD strategy. Specifically, the LD strategy constructs node sequence from the structural level and attribute level of the network.
At the structural level, due to the complexity of node information, the similarity between node and node is asymmetrical even for undirected network. Therefore, KL divergence is selected to measure the structural information of networks based on computational complexity and other factors. So, the KL divergence is used to calculate the difference of the degree distribution of any two nodes as the structural information of the network. The calculation formula of KL divergence is defined as
At the attribute level, because we can’t directly represent the label information of nodes, we first utilize one-hot coding to express the label information of nodes. Then, to represent the attribute information of the network, the Hadamard product is used to calculate the correlation of label information of any two nodes.
In this paper, the weight of label information refers to the proportion of the total number of labels corresponding to each type of label information on all nodes. The specific calculation method is as follows:
where
The calculation formula is
where the calculation formula of the LD strategy is defined as
where
The pseudo-code of the LD strategy can be shown as following algorithm 1:
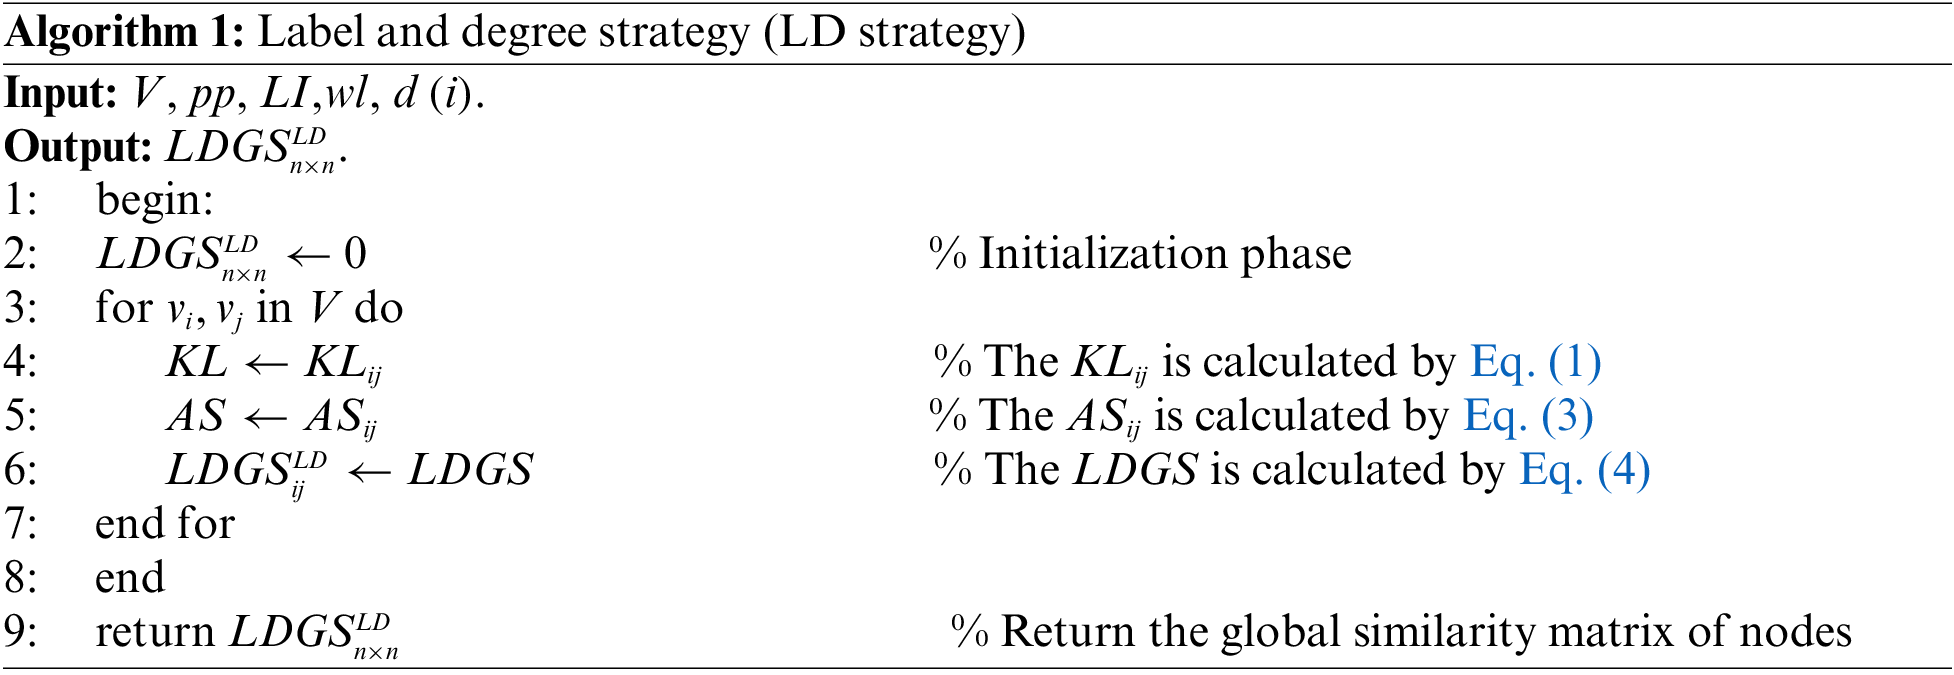
Algorithm 1 description: The Step 4 of algorithm is used to calculate the KL divergence of degree distribution of nodes. The Step 5 of algorithm is used to calculate the one-hot coded Hadamard product of the label information. The Step 6 of algorithm is used to calculate the global similarity matrix.
The Skip-Gram model is a language model. Given a predefined window
where for
Under the Conditional independence hypothesis and Symmetry in feature space hypothesis, Eq. (5) is optimized into the form of probabilistic conjunction. However, in order to reduce the time complexity and facilitate the calculation, we use the log function to transform the form of probabilistic conjunction into the form of continued addition.
To simplify the optimization problem, we made two standard assumptions:
• Conditional independence: by assuming that the likelihood of observing a neighborhood node is independent of observing any other neighborhood node, we factorize the likelihood. The mathematical expression of the vector representation of the source is
• Symmetry in feature space: a source node and its neighborhood node have a symmetric effect in feature space. Accordingly, we model the conditional likelihood of every source-neighborhood node pair as a SoftMax unit parametrized by a dot product of their features. The mathematical expression is
With above assumptions, the objective in Eq. (5) simplifies to
where
As we can see from the second term of Eq. (8), the complexity is very high because we need to traverse the entire thesaurus, so we need to simplify the calculation of this step and reduce the complexity of the operation. Therefore, in order to reduce the complexity of Eq. (8), we convert Eq. (5) into
where
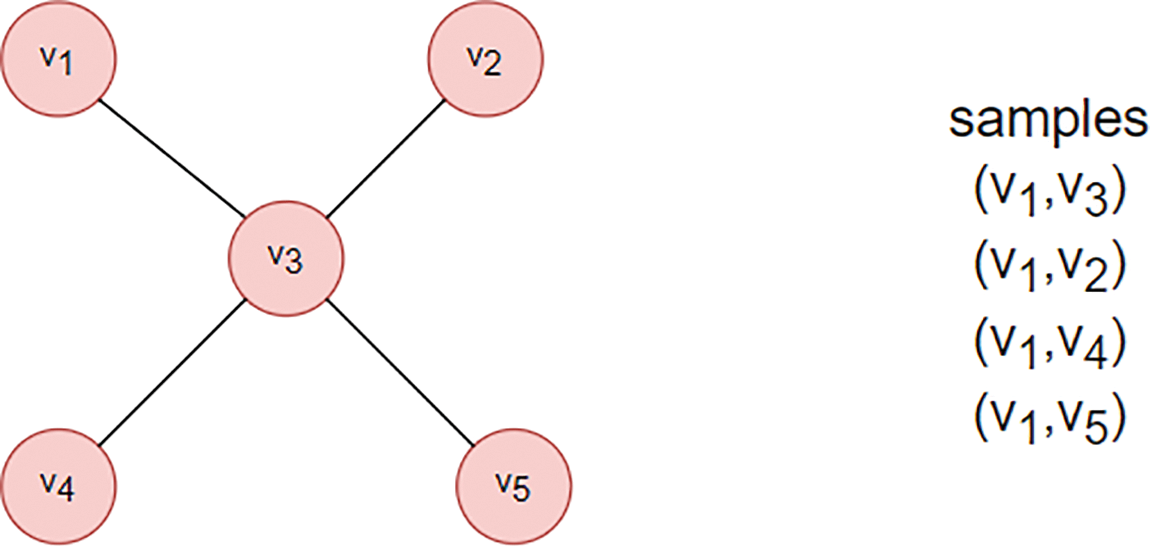
Figure 3: Network G
With
The set of node sequences is entered into the Skip-Gram model. After training, we obtained the node embedding vector. The pseudo-code of the LC-NPLA can be shown as following Algorithm 2:
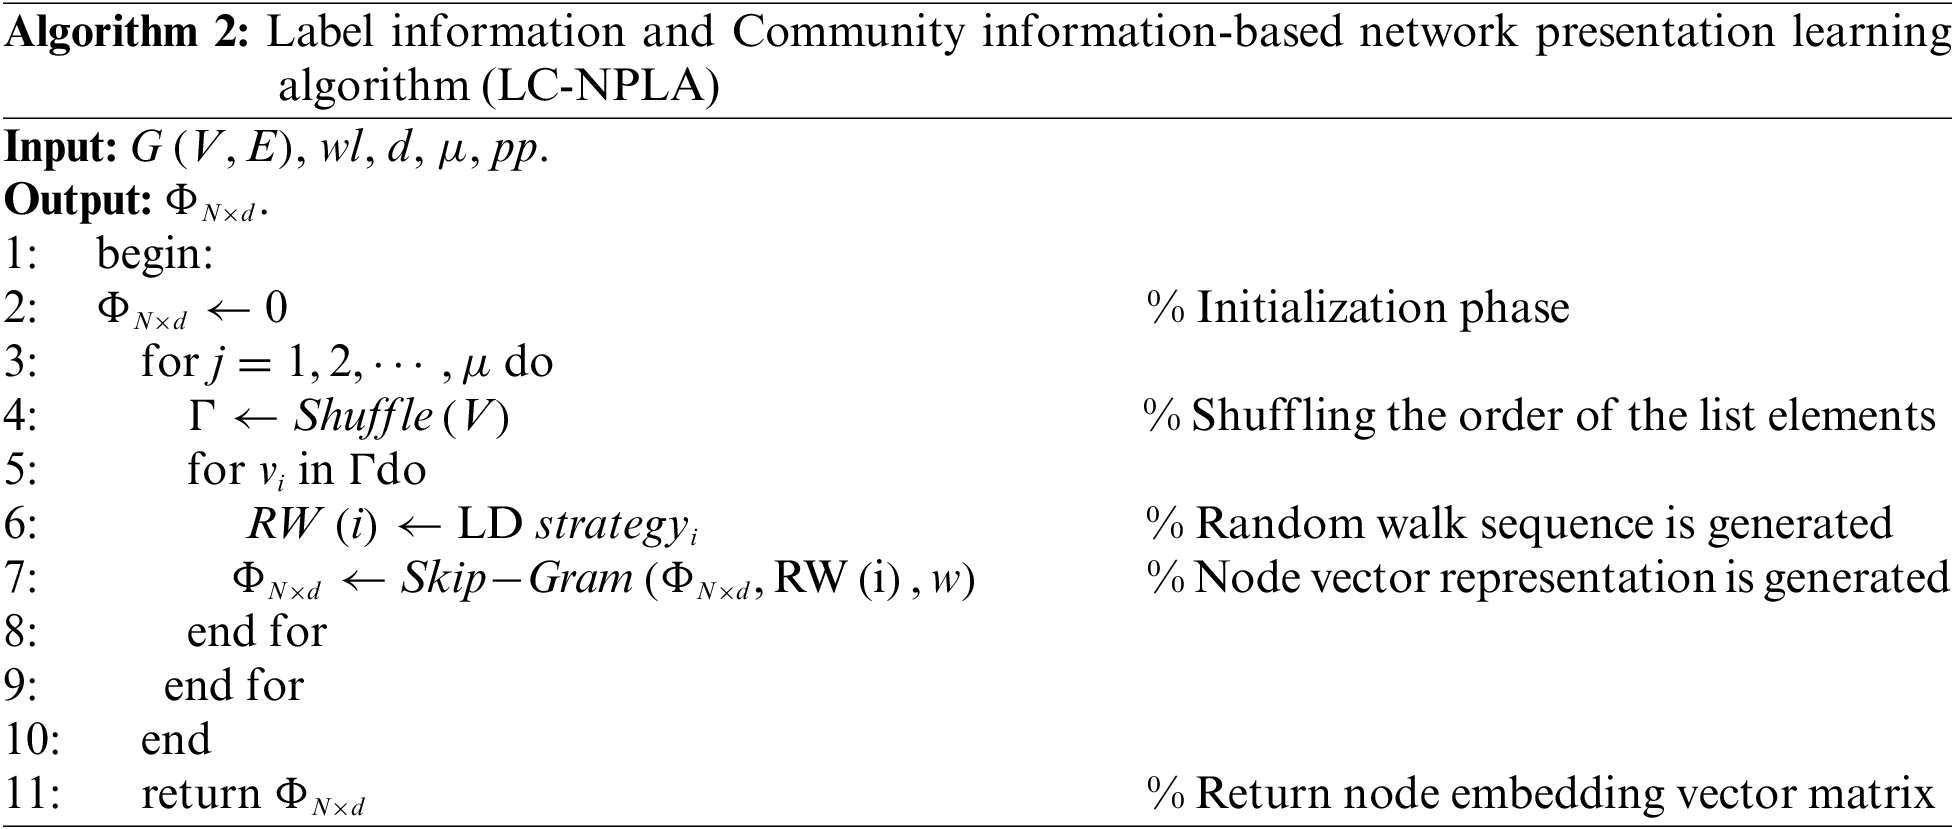
Algorithm 2 description: Given a real network, the Step 6 of algorithm updates the first-order neighbors of nodes through the preprocessing process of nodes, then generates a random walk
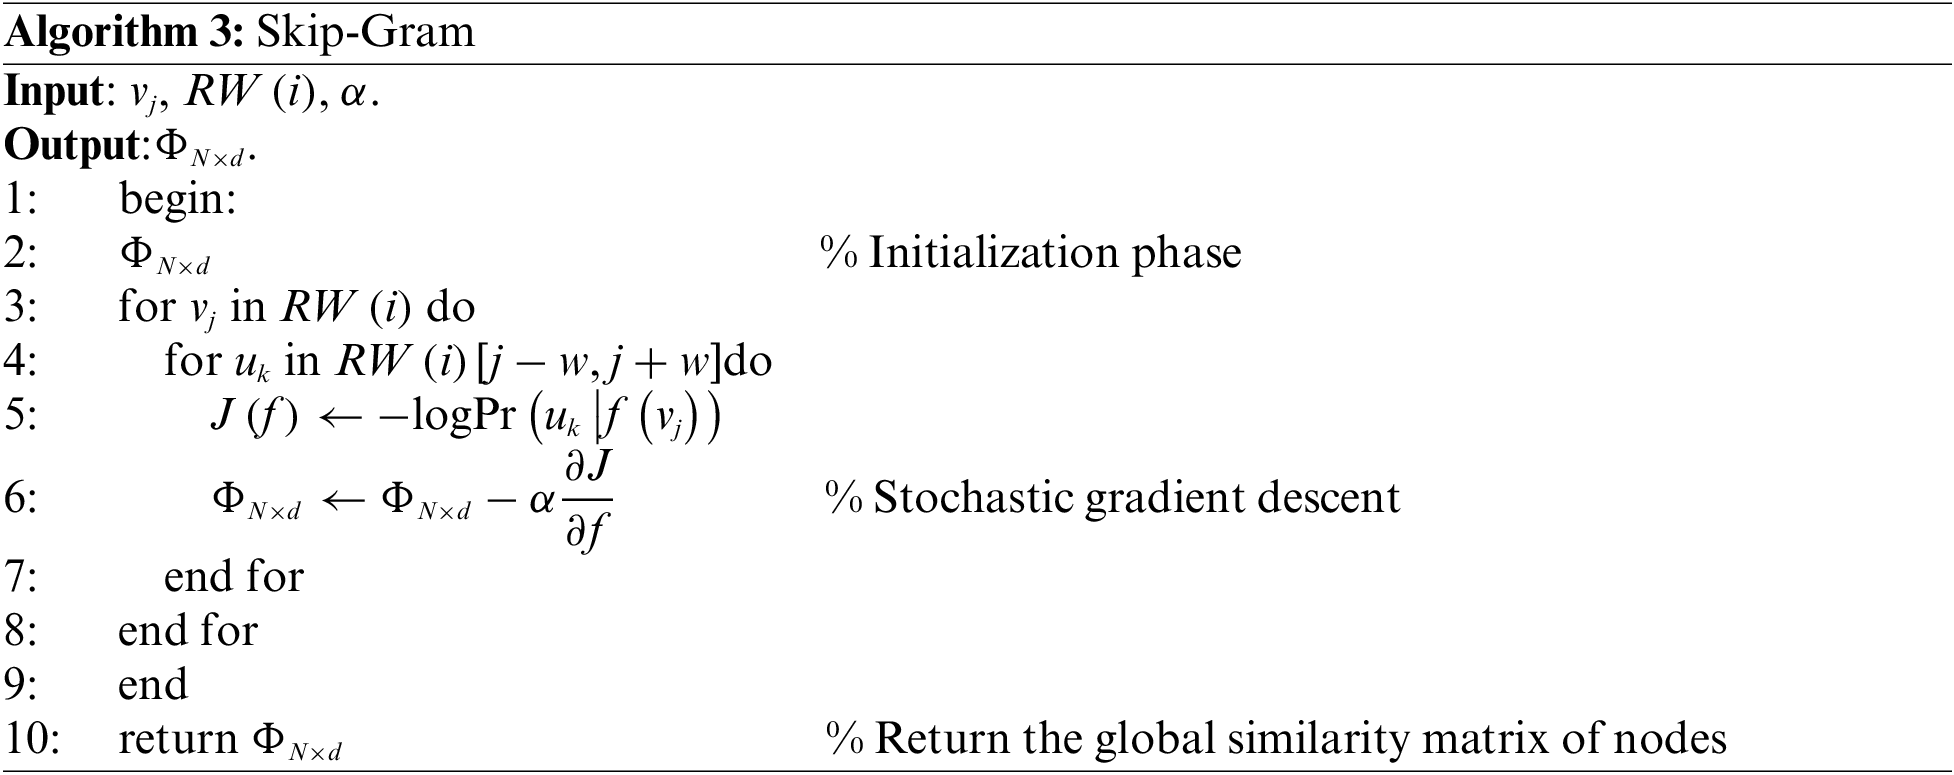
Algorithm 3 description: This paper uses Skip-Gram model to update the embedded vector matrix of nodes according to Eq. (5). Line 2: Initializes a node-embedding vector matrix. The details of the algorithm are described in the following formula. Lines 3–8: The outer for loop represents traversing every node in the random walk sequence of a given node v. The inner for loop represents that each node in the random walk sequence is taken as the target, and w nodes before and after the target node are combined with the target node. The specific operation mode is to update the initial vector matrix of the node by using the stochastic gradient descent algorithm.
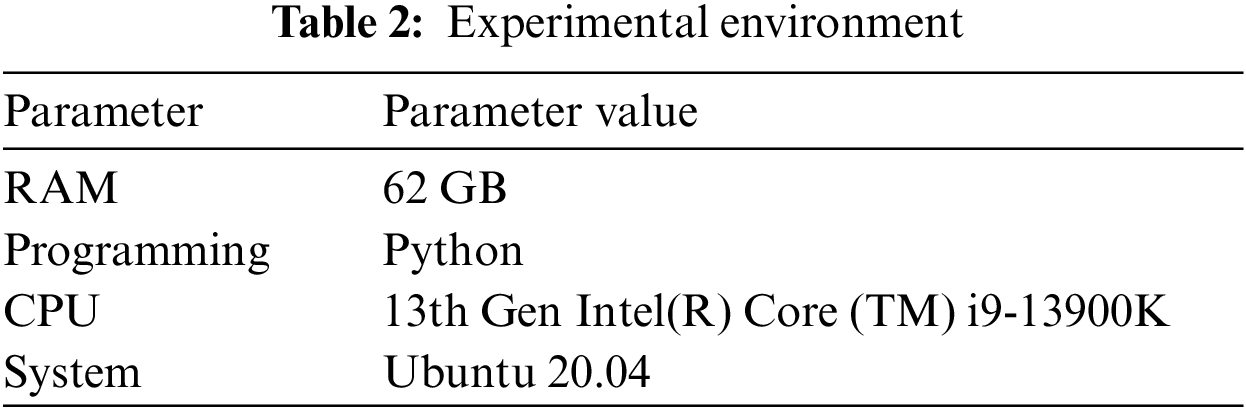
In this section, we introduce some experimental materials, which are the experiment datasets, evaluation criteria and benchmark algorithms. In this paper, the experimental environment is listed in Table 2.
To verify the effectiveness of LC-NPLA, experiments are conducted on the following 10 real network data sets, including Polbooks, Adjoun, Football, Europe, USA, Polblogs, Wiki, Cora, Citeseer and PPI. The information of these data sets is listed in Table 3.
Here, the evaluation criteria of Micro-F1, Macro-F1 and Weighted-F1 are used for the label classification task; the MAP evaluation criterion is used for the network reconstruction task; the AUC evaluation criterion is used for the link prediction task.
4.2.1 Label Classification Task
• Micro-F1: this criterion is determined globally by counting total true positives (
where
is the accuracy rate and
is the recall rate for all labels.
• Macro-F1: This criterion is the average of F1 scores for all labels with following formula:
where
is
• Weighted-F1: This criterion is the weighted average of Macro-F1 with the following for:
where
4.2.2 Network Reconstruction Task
• MAP: This criterion can be applied to estimate the average precision of nodes, and the following mathematical expression is:
where
is the accuracy of
• AUC: This criterion can be interpreted as the probability that an edge randomly selected in the test set would be assigned a higher similarity than that of an edge randomly selected in the unknown edge set. It has the following mathematical expression:
where
Here, we introduce three network presentation learning algorithms that can be applied to make a comparison with our proposed algorithm. Detailed descriptions of them can be found in references [25–27].
The main mechanism of line algorithm can be divided into to two stages to learn the
The main mechanism of the Sdne algorithm can be divided into to two stages to learn the feature representation of nodes. In the first step, it learns the local structure of network by depth automatic encoder. In the second step, it learns the global structure of network by Laplace mapping.
The basic idea of the Struc2vec algorithm is that if two nodes own more similar structures in a network, they should have a higher similarity. The mechanism of it can be divided into four steps. In the first step, structural similarity between each pair of nodes is learned. In the second step, a weighted multilayer network is constructed. In the third step, the multi-layer network is used to generate a sequence of nodes for each node. In the fourth step, feature representation of nodes is learned by Skip-Gram model.
In this section, we focus on testing the effectiveness of the proposed LC-NPLA for label classification, network reconstruction, and link prediction task. Detailed descriptions of benchmark algorithms can be found in references [25–27].
5.1 Results and Analysis of Label Classification Task
We use the one-vs-rest logistic regression that applied in Log-linear [34] algorithm to do the label for nodes. Then we select an arbitrary percentage of labeled nodes as the training data, and the remaining percentage of nodes are regarded as the testing data. In this experiment, the training ratio on Polbooks, USA, Cora, Citeseer and PPI in was set to 10%, 30%, 50%, 70% and 90%, respectively. For LC-NPLA, the parameters are separately made to
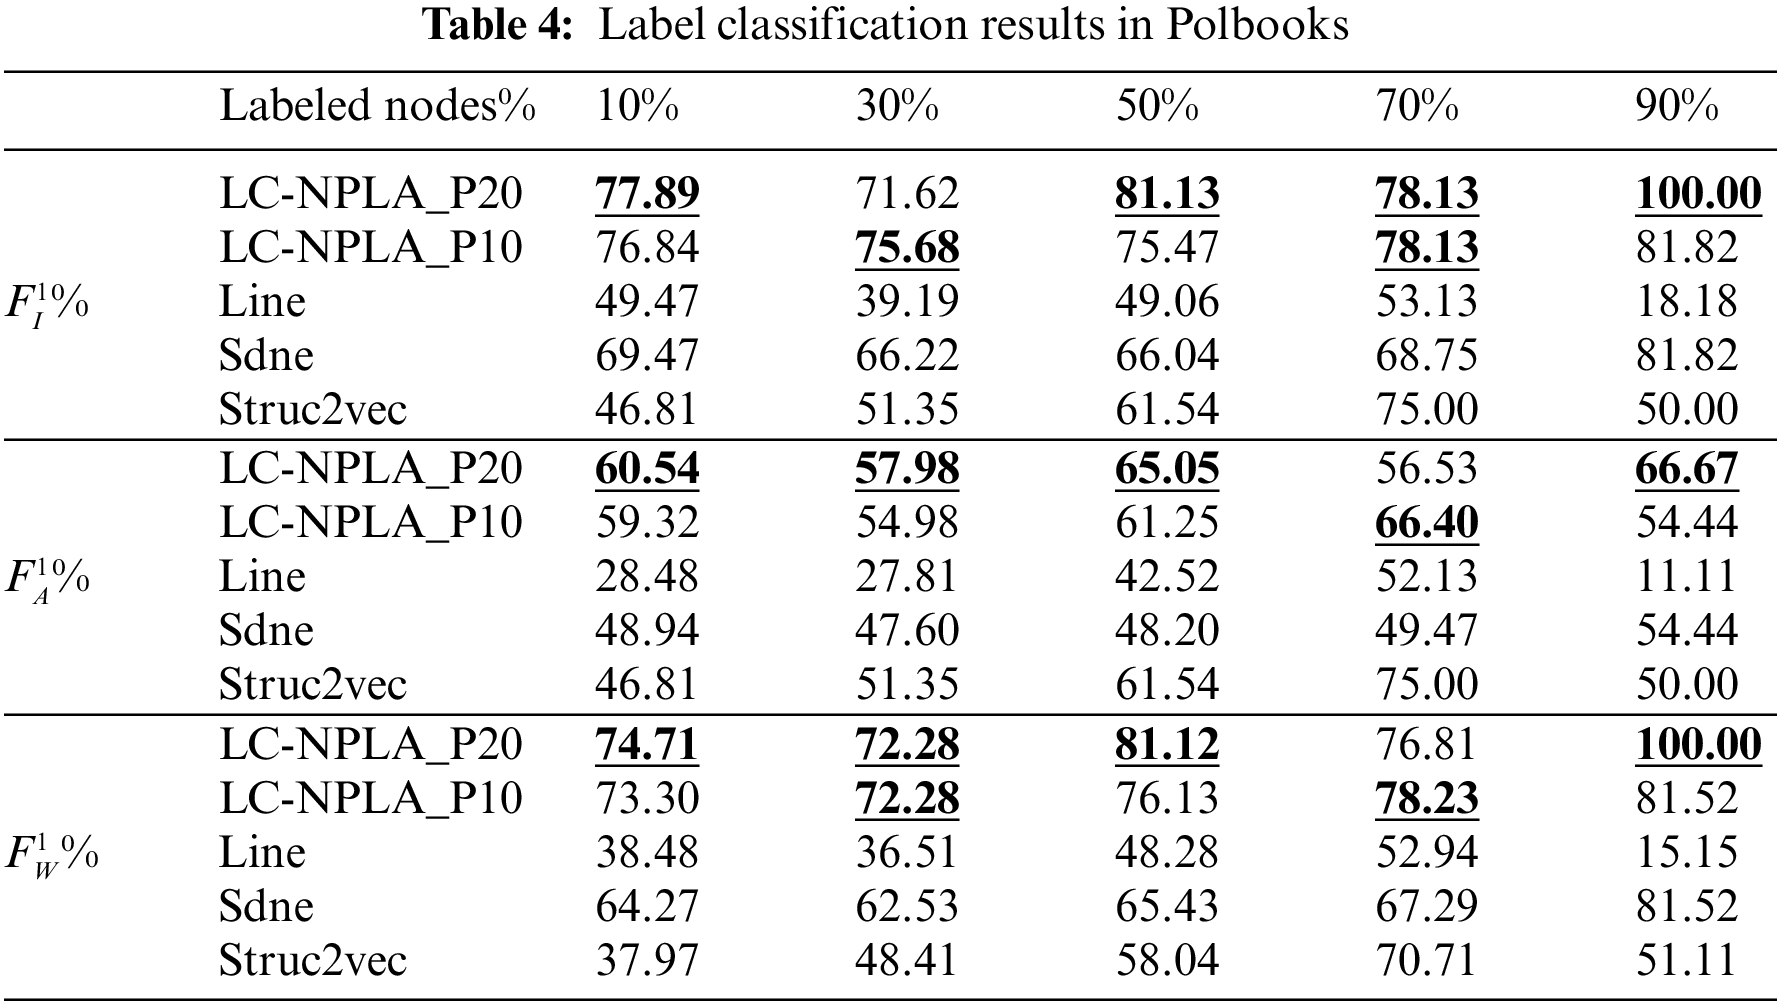
5.1.1 Results on Polbooks Data Set
The experimental results on Polbooks are shown in Table 4. From Table 4, we find that LC-NPLA_P10 and LC-NPLA_P20 are superior to the other benchmark algorithms. This reason may be that the embedding dimension is close to the number of nodes. In reality, LC-NPLA_P20 only needs to mark 20% of the nodes to achieve the great performance of Sdne algorithm with 90% data. This strong performance when only small fractions of the network are labeled is a core strength of our approach.
However, as the ratio of community information increases, noise may affect the accuracy of the algorithm. As a consequence, the Micro-F1, Macro-F1, and Weighted-F1 scores of the LC-NPLA_P20 may be lower than the LC-NPLA_P10. Based on the above analysis, compared with the experimental results on USA, Cora and Citeseer, we find that LC-NPLA can also obtain better results on small data sets.
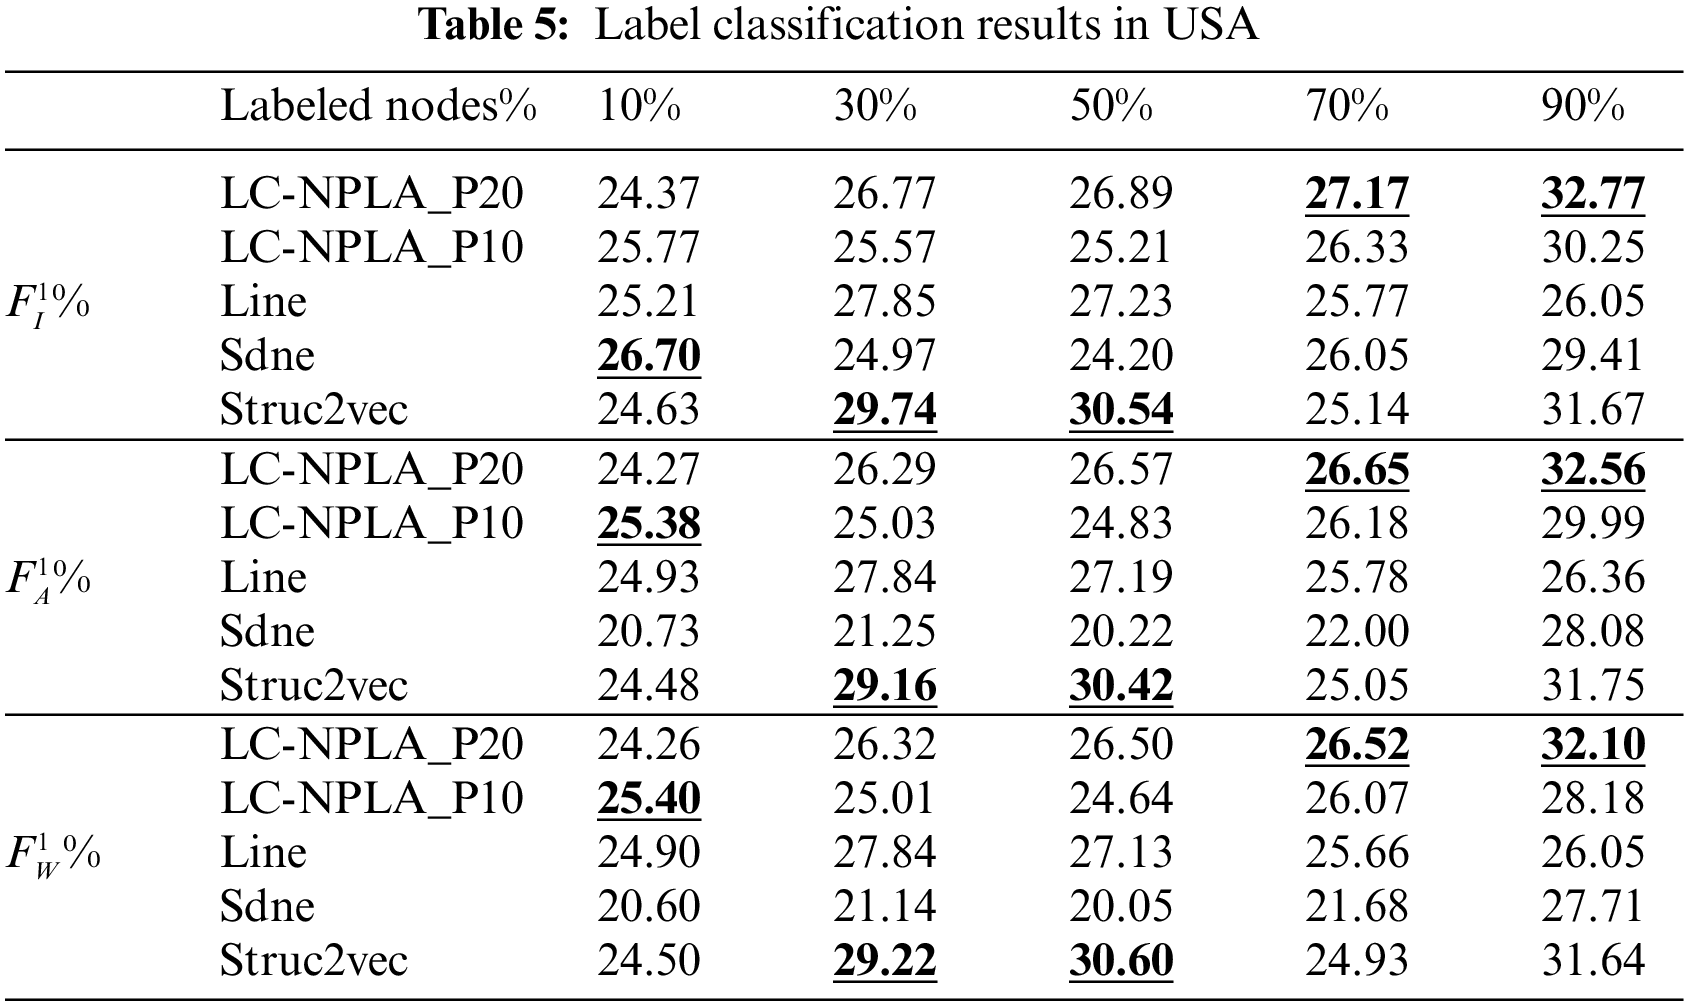
5.1.2 Results on USA Data Sets
The experimental results on USA are shown in Table 5. From Table 5, when the training ratio is 10%, 30% and 50%, the Micro-F1, Macro-F1 and Weighted-F1 scores of the best LC-NPLA are all lower than those of benchmark algorithms. However, when the training ratio reaches 70%, the three scores of the best LC-NPLA are higher than those of three benchmark algorithms. This reason may be that the ability of the best LC-NPLA to get information is affected by the training ratio.
Specially, although the USA has the largest number of edges for Polbooks, USA, Cora and Citeseer, LC-NPLA can still enhance the ability of label classification when the training ratio is 70%. And the Micro-F1, Macro-F1 and Weighted F1 scores of the best LC-NPLA are 1.12%, 0.87% and 0.86% higher than that of the best benchmark algorithm. When the training ratio is 90%, the Micro-F1, Macro-F1 and Weighted F1 scores of the best LC-NPLA are 1.10%, 0.81% and 0.46% higher than that of the best benchmark algorithm, respectively.
Based on the above analysis, although the effect of LC-NPLA is affected by the training ratio, the advantages of LC-NPLA are gradually obvious with the increase of training ratio. When the training ratio increases, it is found that LC-NPLA has obvious advantages in a dataset with a large number of edges.
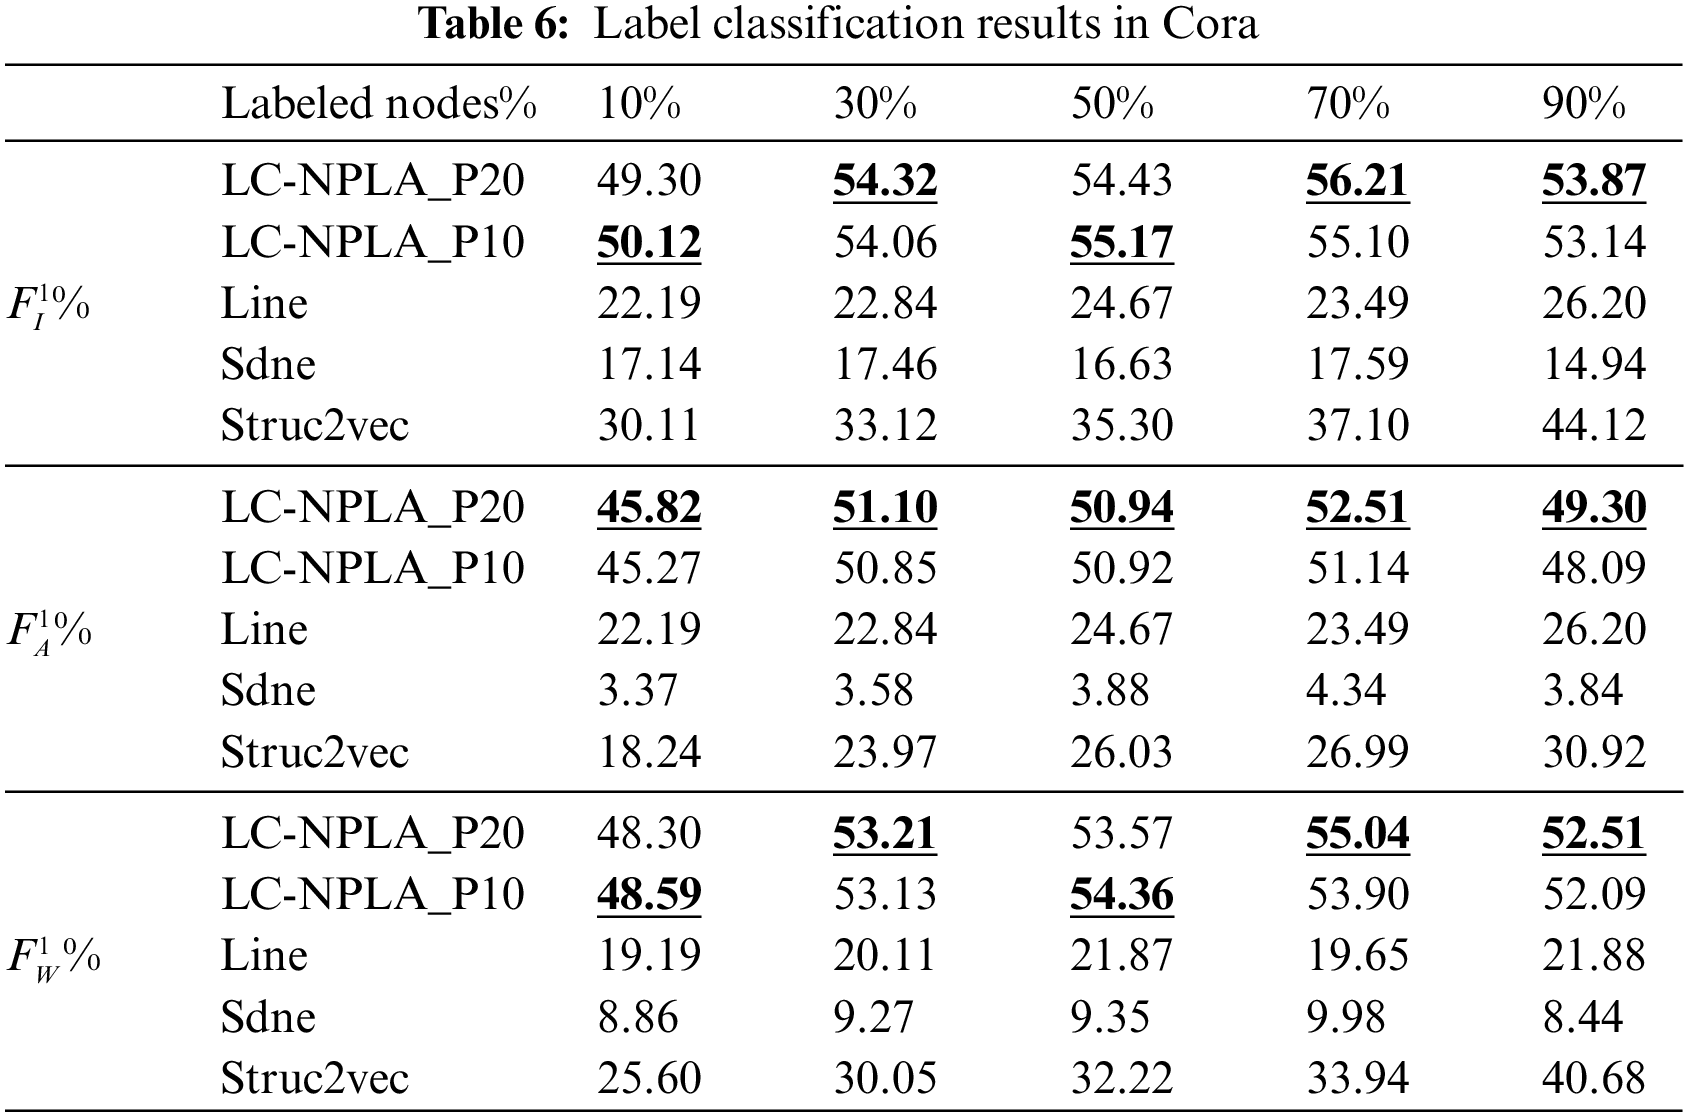
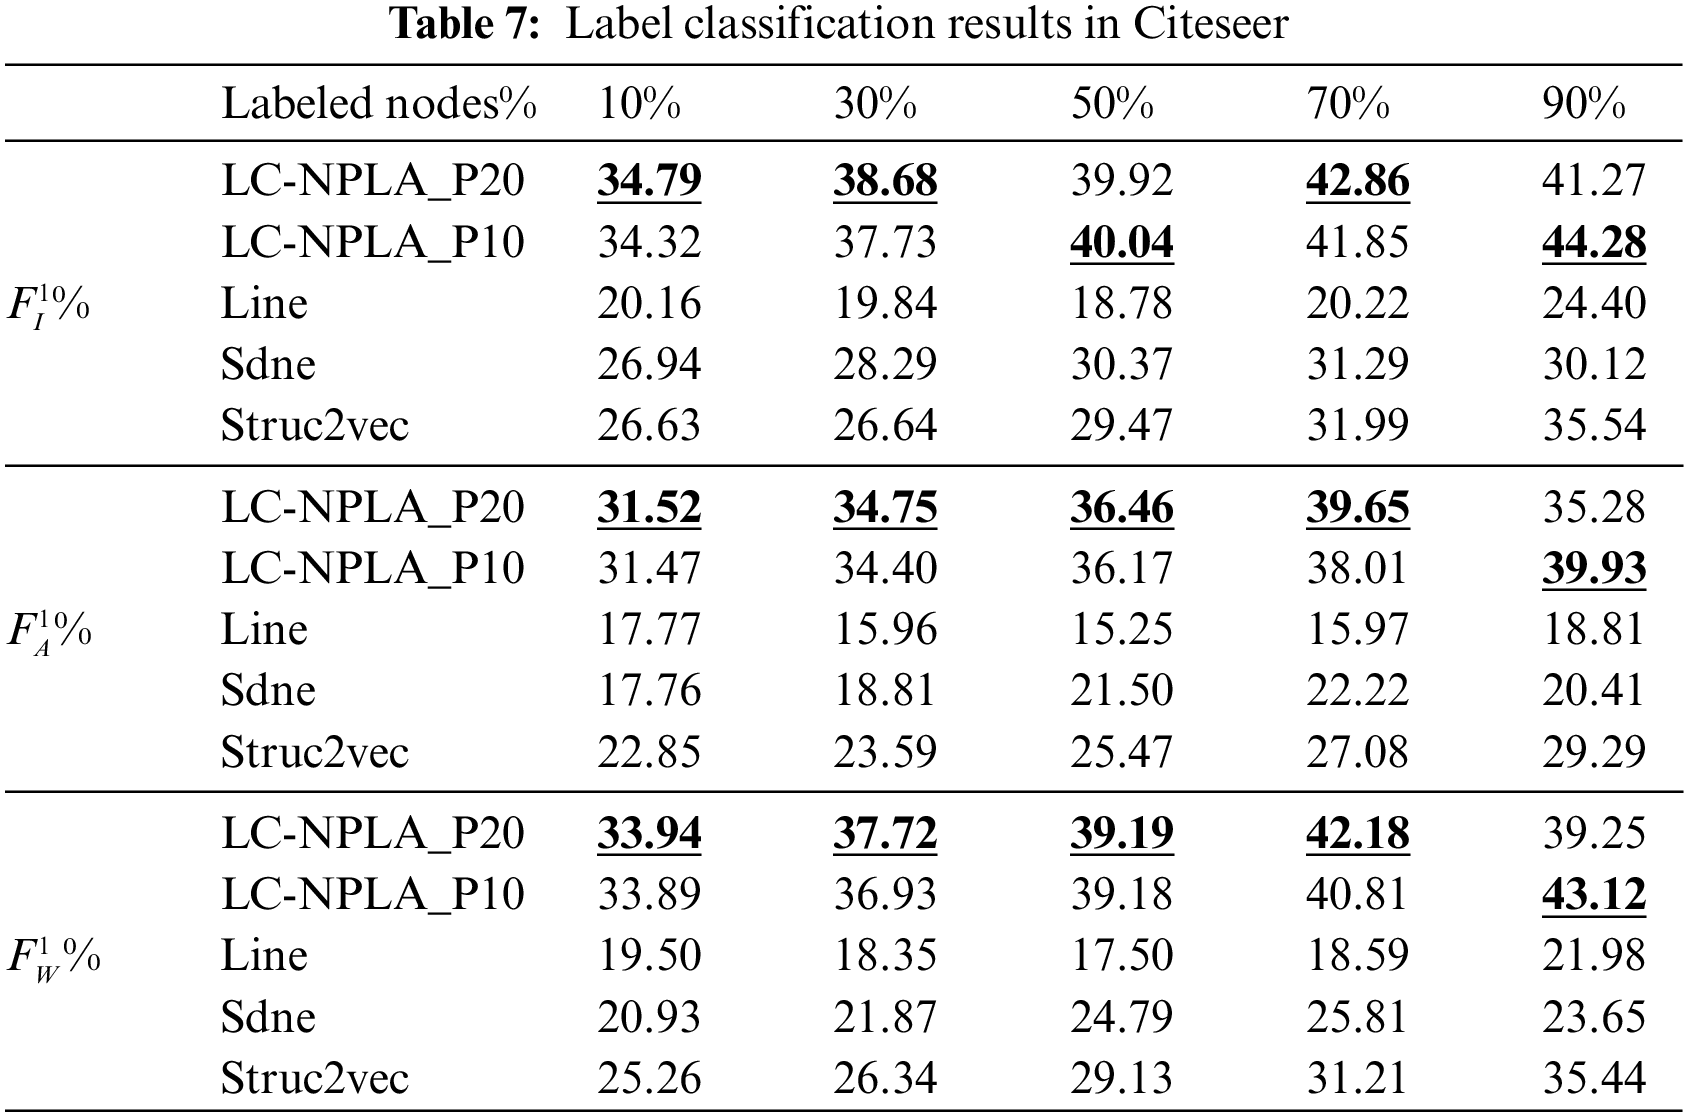
5.1.3 Results on Cora and Citeseer Data Sets
The experimental results on Cora and Citeseer are shown in Tables 6 and 7. For Cora and Citeseer, three scores of the best LC-NPLA are higher than that of the Line algorithm and Struc2vec algorithm. This reason may be that label information and the average clustering coefficient of Cora and Citeseer affect the label classification task. In a nutshell, combining experimental results from Polbooks, USA, Cora and Citeseer, we found that LC-NPLA had better generalization ability in citation network datasets.
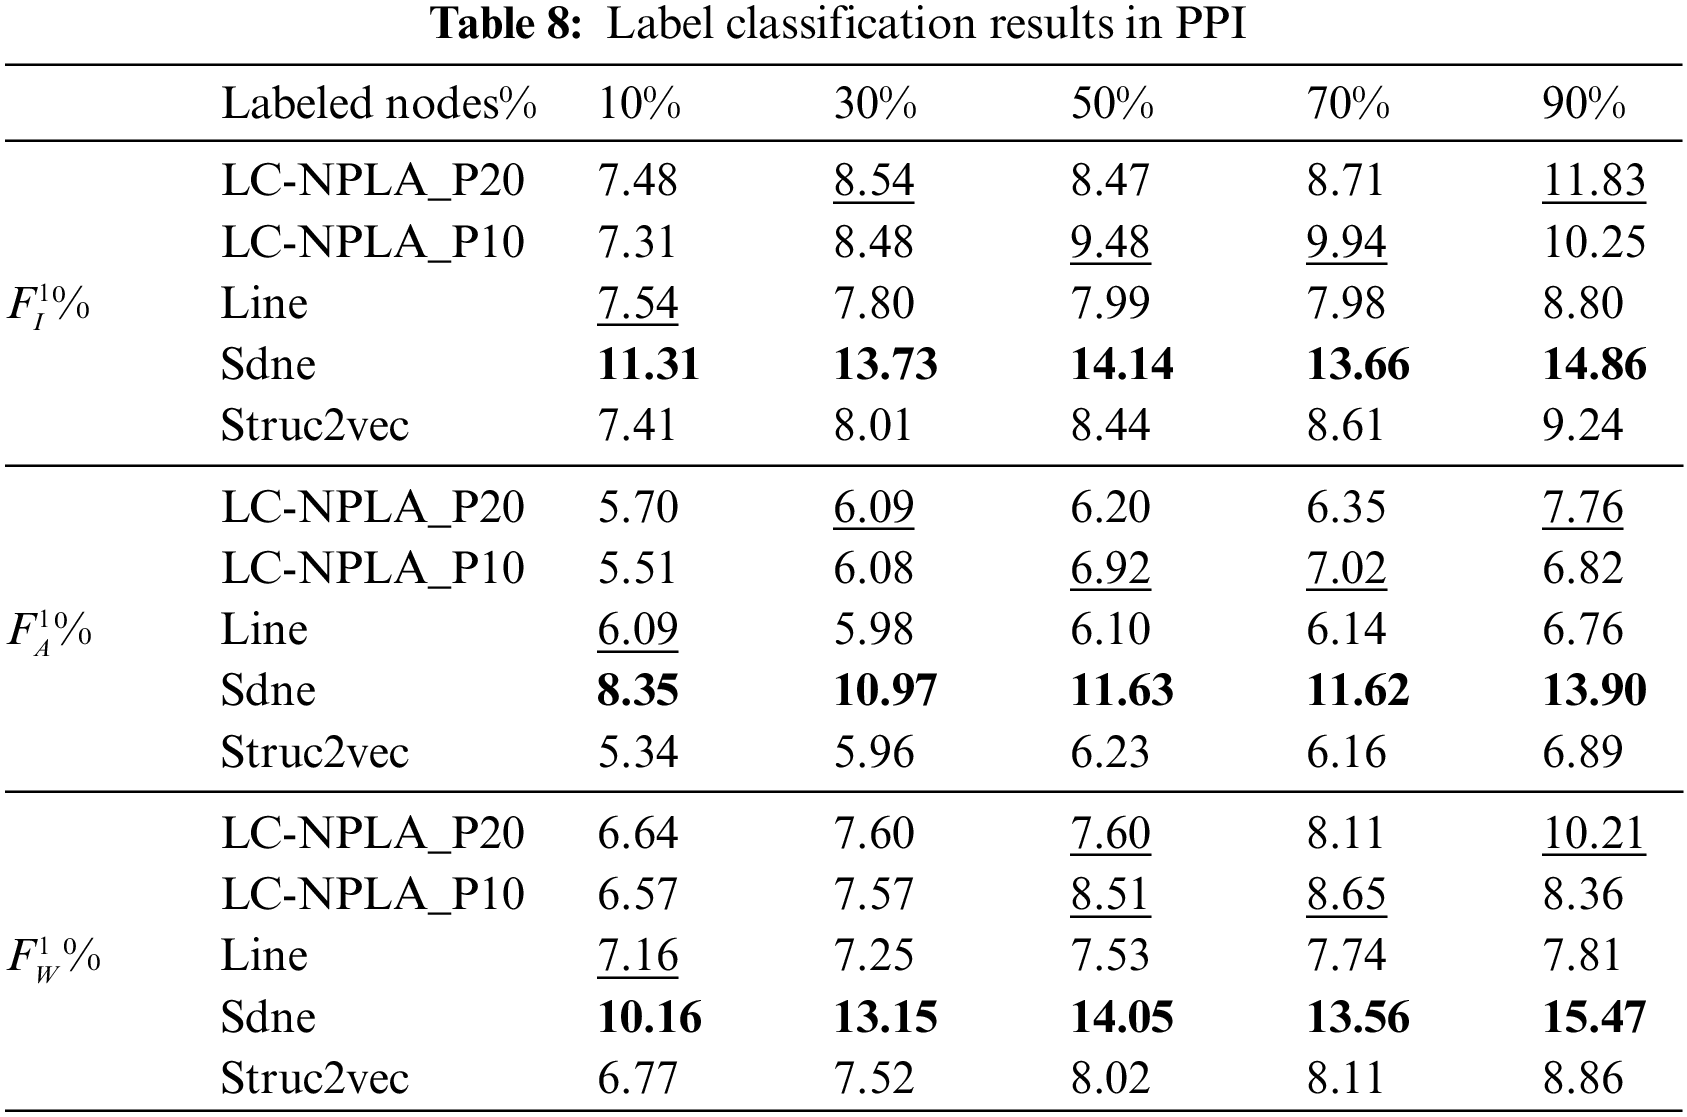
The experimental result on PPI is shown in Table 8. For PPI, it is evident that the Micro-F1, Macro-F1 and Weighted-F1 scores for LC-NPLA_P20 and LC-NPLA_P10 are lower than those of the SDNE model, indicating the SDNE model’s superior local and global learning abilities compared to the LC-NPLA model. Apart from special cases, the LC-NPLA model outperforms the Line and Struc2vec models in terms of Micro-F1, Macro-F1, and Weighted-F1 scores. Although the LC-NPLA model shows some improvement over the Line and Struc2vec models in these metrics on the PPI network dataset, as presented in Table 8, the enhancement effect remains minimal.
5.2 Results and Analysis of Network Reconstruction Task
We rebuild the proximity of the nodes and sort the nodes by proximity and calculate the proportion of true links in the top k predictions as the reconstruction accuracy. And for a network with a large number of nodes, the number of possible node pairs
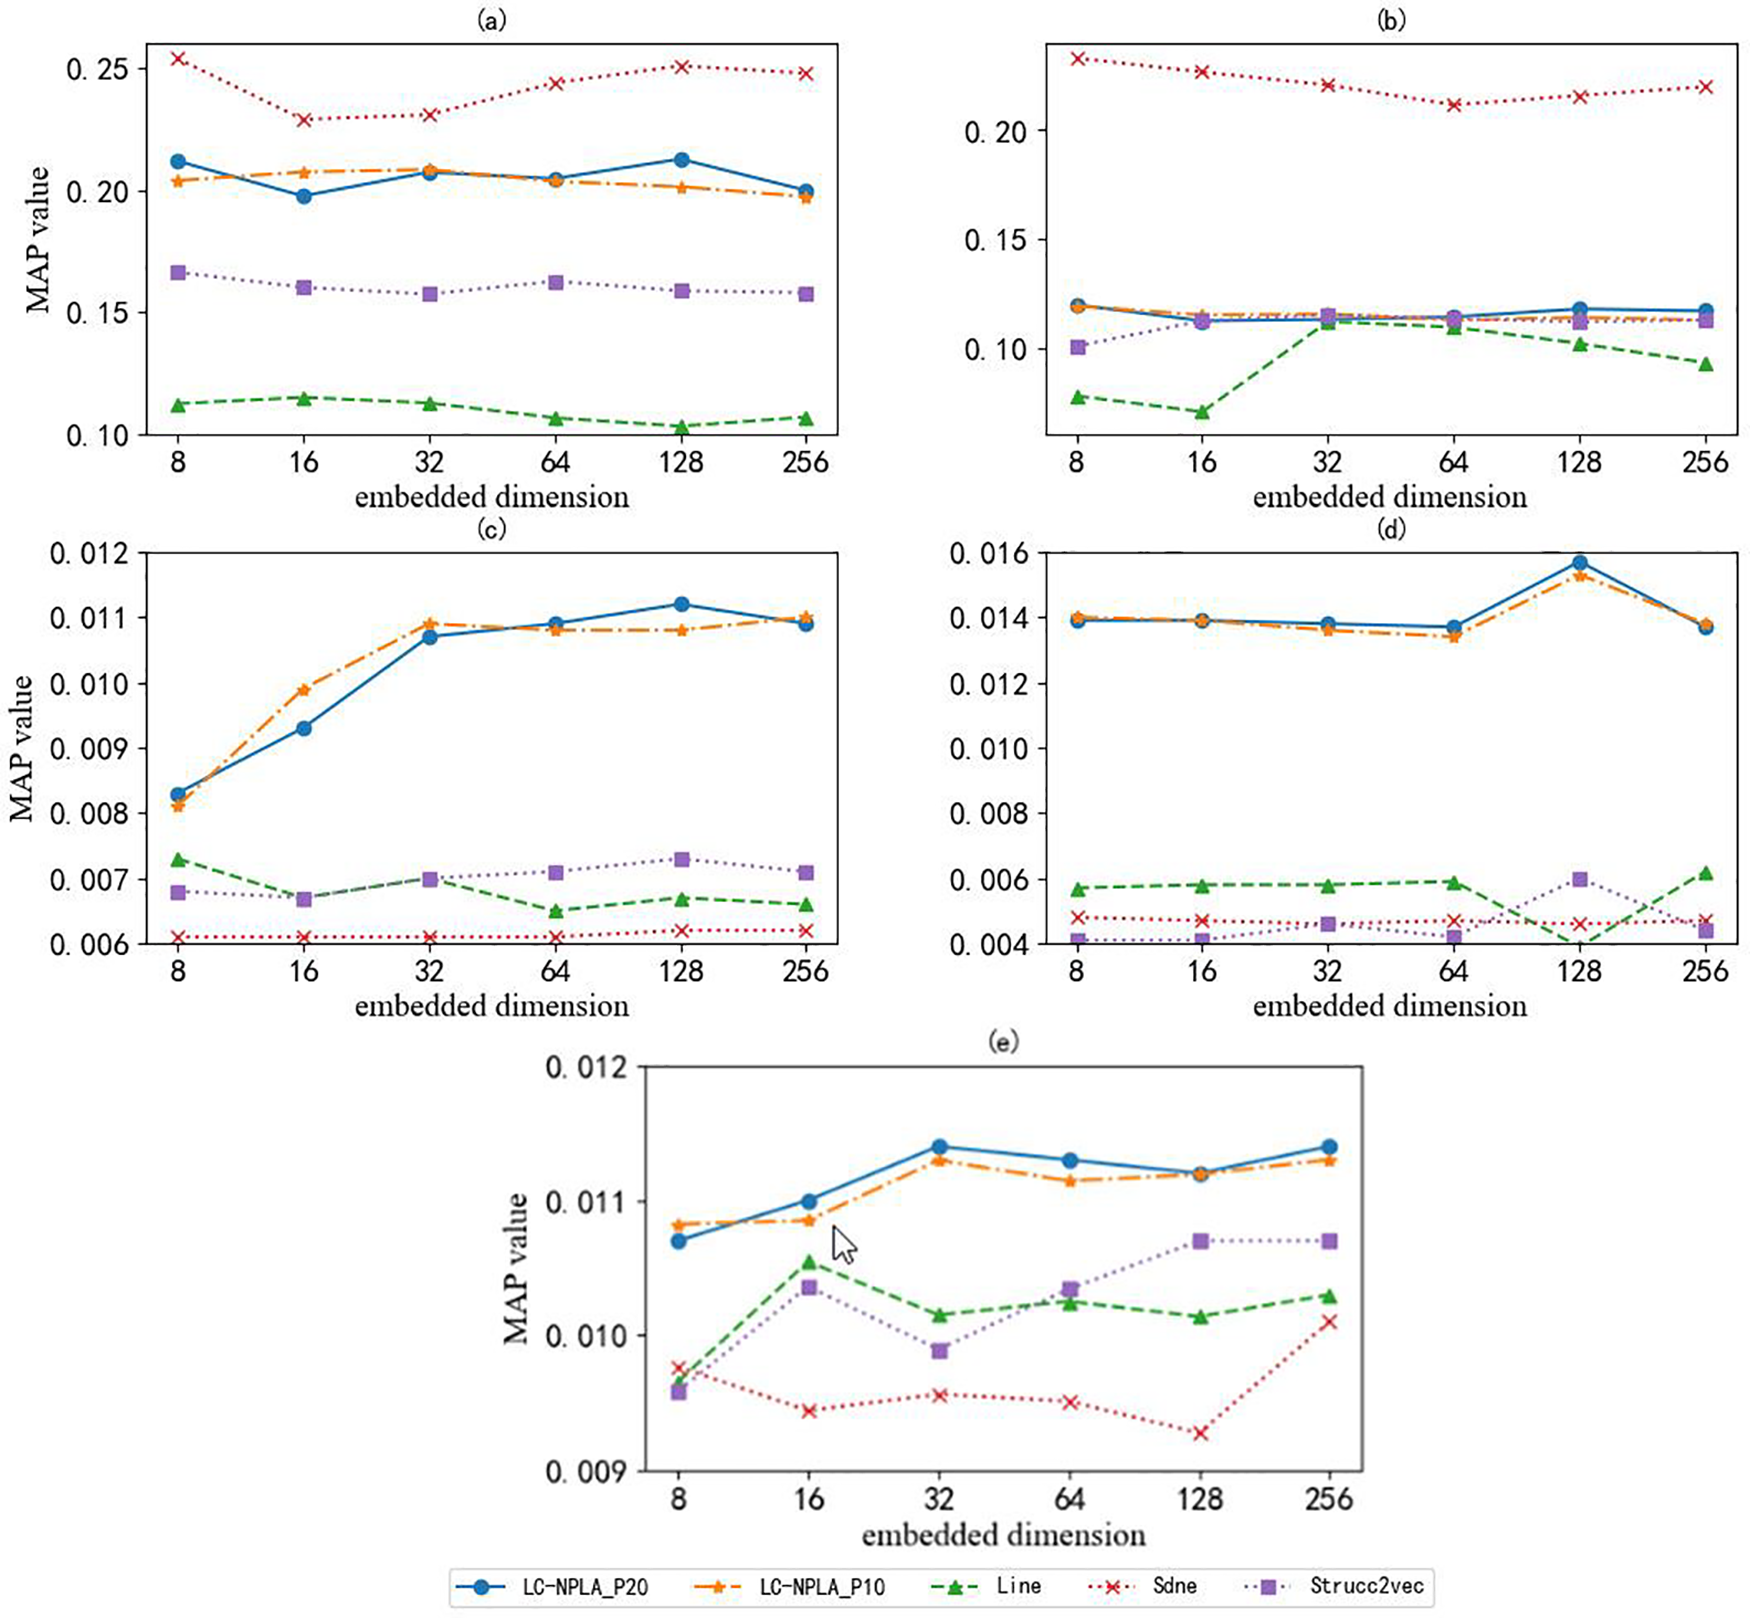
Figure 4: The MAP value of different data sets
5.2.1 Results on Adjoun and Europe Data Sets
Here we can see that the performance of LC-NPLA is highly data set dependent. It achieves good performance on Polblogs but performs poorly on other data sets. As a result, the reconstruction performance of the Sdne algorithm is better than the best LC-NPLA algorithm. The reason may be that the Sdne algorithm collects both local structure information and global structure information. In the Fig. 4a, as the dimension of network embedding increases, we find that the MAP value of LC-NPLA increases weakly. The reason may be that superposition of information leads to overfitting of the model. In the Fig. 4b, we find that the LC-NPLA, Line algorithm, the Sdne algorithm and Struc2vec algorithm are not sensitive to the Europe data set. But in the network reconstruction task, the LC-NPLA is still superior to the Struc2vec algorithm and Line algorithm. Based on the above analysis, we find that LC-NPLA is still effective for the network reconstruction task.
5.2.2 Results on Cora, Citeseer and PPI Data Sets
In the Figs. 4c–4e, here we observe better rebuilding performance for citation network data sets like Cora and Citeseer. The reason may be that label information affects reconstruction performance. These experimental results show the influence of size on reconstruction error. With a few exceptions, MAP values increase as the number of dimensions increases. This makes sense, because more dimensions can store more information.
5.3 Results and Analysis of Link Prediction Task
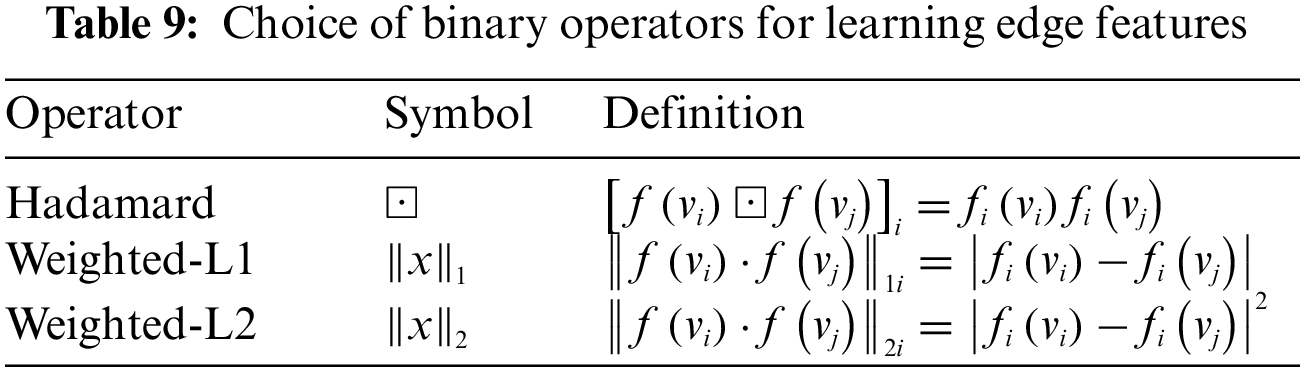
To ensure the accuracy of the LC-NPLA, we select the hidden ratio of 15%, 30% and 45% to divide the train set, verification set and test set. Specially, the degree of AUC greater than 0.50 measures how well the algorithm is better than the algorithm selected randomly. And comparison with embedding based methods bootstrapped using binary operators: Hadamard, Weighted-L1 and Weighted-L2 (See Table 9 for definitions). We summarize our results for link prediction in Table 10.
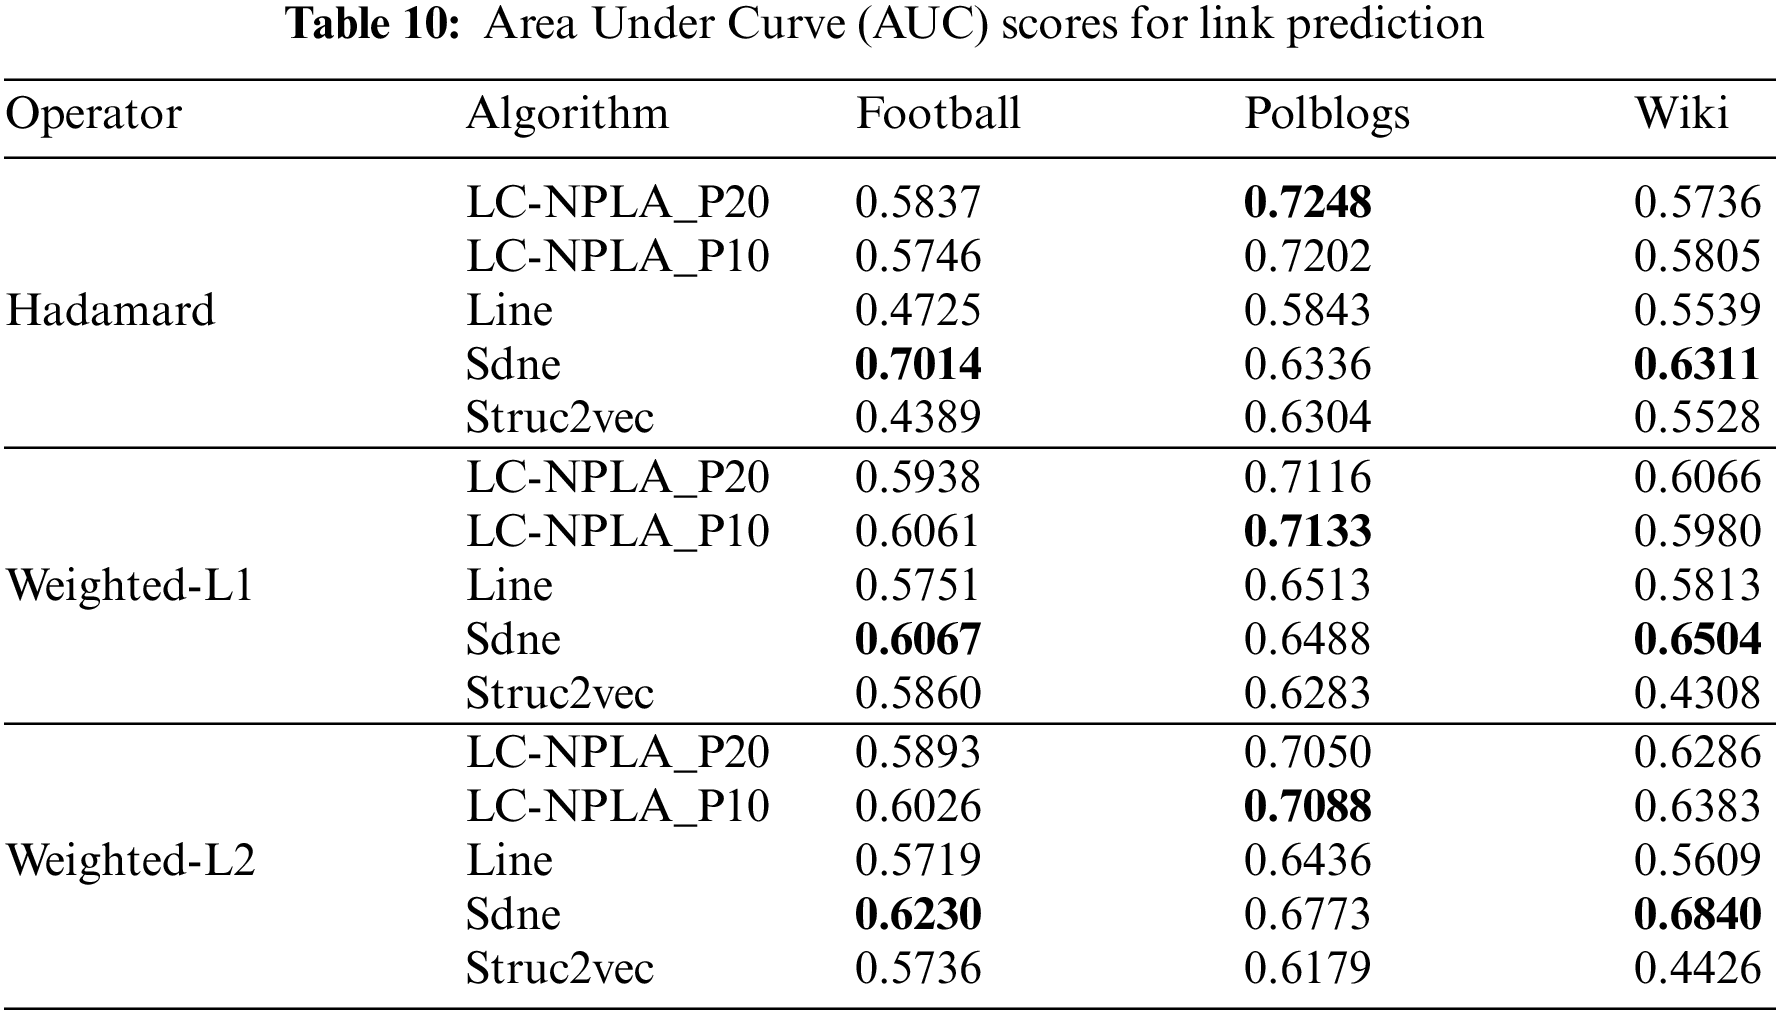
5.3.1 Results on Polblogs Data Set
From Table 10, we find that LC-NPLA has an AUC value greater than 0.50 in each data set. This indicates that LC-NPLA has the predictive ability for Polblogs, Football and Wiki. For Polblogs, LC-NPLA performs better on Polblogs than on Football and Wiki. Therefore, the combination of the three operators with LC-NPLA is stable and gives the best performance on average. This reason may be that the higher average degree increases the predictive ability of LC-NPLA.
5.3.2 Results on Football Data Set
For Football, the link prediction ability of the Sdne algorithm is better than that of LC-NPLA, this reason may be that it can capture the higher-order structure in the network. For the Hadamard operator, neither the Line nor the Struc2vec has predictive ability. Therefore, in the Hadamard operator, the best LC-NPLA is not comparable with the Line algorithm and the Struc2vec algorithm. For the Weighted-L1 operator, compared with the Line algorithm and the Struc2vec algorithm, the best LC-NPLA gains 3.10% and 2.01%, respectively. For the Weighted-L2 operator, gains of 3.07% and 2.90% are obtained, respectively.
5.3.3 Results on Wiki Data Set
For Wiki, the best LC-NPLA gains 2.66% and 2.77% for the Hadamard operator, respectively. For the Weighted-L1 operator, compared to the Line and the Struc2vec, the best LC-NPLA gains 2.53%. For the Weighted-L2 operator, 7.74% is obtained. Experimental results show that LC-NPLA has better link prediction ability on Polblogs than Wiki. This reason may be that LC-NPLA has a better prediction advantage for network data sets with fewer nodes, when the number of edges is similar.
All in all, combining experimental results from Polblogs, Football and Wiki, it is found that the link prediction ability of LC-NPLA is not obvious in Table 10, but the LC-NPLA still has predictive ability on Football, Polblogs and Wiki.
5.4 Time Complexity of LC_NPLA
The Fig. 5 illustrates the runtime of the LC_NPLA algorithm in comparison to other algorithms. As shown in the figure, Struc2vec algorithm requires the most time among all the remaining nine datasets except for Europe dataset, while SDNE algorithm is the fastest. It can be observed that LC_NPLA algorithm not only exhibits an improved embedding effect, but also demonstrates a favorable time complexity compared to Struc2vec algorithm.
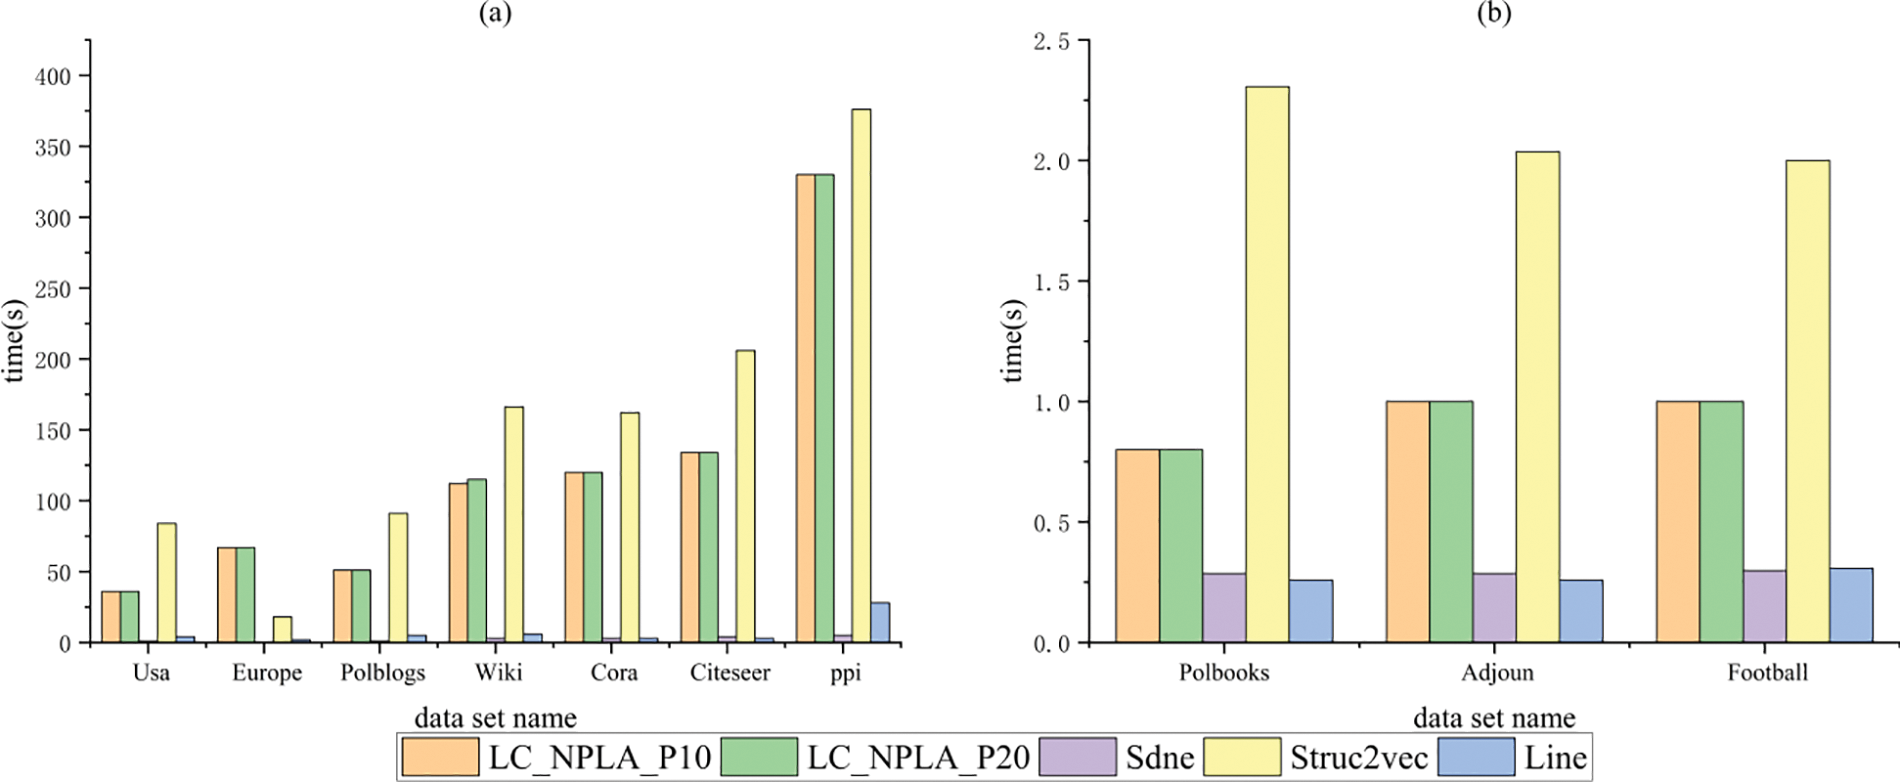
Figure 5: The running time of the algorithm on different network
To further improve the application of node representation vector in downstream tasks, this paper has designed a label and community information-based network presentation learning algorithm. By integrating the label information of nodes and the community information in the network, the LD strategy is defined to expand the first-order neighbor nodes of nodes. In this process, the sequence of nodes is generated by the LD strategy, then the node representation vector is generated by the Skip-Gram model. In 9 real networks, the performance comparison between the proposed algorithm and the other benchmark algorithms was displayed with the help of 5 evaluation metrics. A large number of theoretical derivation and experimental analyses demonstrated that the proposed LC-NPLA was more advantageous in the label classification task, network reconstruction task and link prediction task.
Acknowledgement: We are hugely grateful to the possible anonymous reviewers for their constructive comments with respect to the original manuscript.
Funding Statement: We are hugely grateful to the possible anonymous reviewers for their constructive comments with respect to the original manuscript. What is more, we thank the National Natural Science Foundation of China (Nos. 61966039, 62241604) and the Scientific Research Fund Project of the Education Department of Yunnan Province (No. 2023Y0565). Also, this work was supported in part by the Xingdian Talent Support Program for Young Talents (No. XDYC-QNRC-2022-0518).
Author Contributions: S.L.: Responsible for proposing algorithm ideas, analyzing experimental data as well as writing the paper. C.Y.: Responsible for proposing guidance and revising the final version of the paper. Y.L.: Responsible for collecting network data.
Availability of Data and Materials: All data generated or analyzed during this study are included in this published article.
Conflicts of Interest: The authors declare that they have no conflicts of interest to report regarding the present study.
1<
References
1. Y. F. Zhang, S. Q. Gao, J. Pei and H. Huang, “Improving social network embedding via new second-order continuous graph neural networks,” in Proc. of the 28th ACM SIGKDD Conf. on Knowledge Discovery and Data Mining, Washington DC, USA, pp. 2515–2523, 2022. [Google Scholar]
2. M. Aslani, M. S. Mesgari and M. Wiering, “Adaptive traffic signal control with actor-critic methods in a real-world traffic network with different traffic disruption events,” Transportation Research Part C: Emerging Technologies, vol. 85, no. 85, pp. 732–752, 2017. [Google Scholar]
3. C. Pornprasit, X. Liu, P. Kiattipadungkul, N. Kertkeidkachorn, K. Kim et al., “Enhancing citation recommendation using citation network embedding,” Scientometrics, vol. 127, no. 1, pp. 233–264, 2022. [Google Scholar]
4. W. Nelson, M. Zitnik, B. Wang, J. Leskovec and A. Goldenberg, “To embed or not: Network embedding as a paradigm in computational biology,” Frontiers in Genetics, vol. 10, pp. 381, 2019. [Google Scholar] [PubMed]
5. I. Tiddi and S. Schlobach, “Knowledge graphs as tools for explainable machine learning: A survey,” Artificial Intelligence, vol. 302, no. 302, pp. 103627, 2022. [Google Scholar]
6. L. Deng, S. H. Liu and G. Duan, “Random walk and shared neighbors-based similarity for patterns in graph data,” in Advances in Natural Computation, Fuzzy Systems and Knowledge Discovery, vol. 88. Cham: Springer International Publishing, pp. 1297–1306, 2021. [Google Scholar]
7. J. Z. Li, J. Zhu and B. Zhang, “Discriminative deep random walk for network classification,” in Proc. of the 54th Annual Meeting of the Association for Computational Linguistics, Berlin, Germany, pp. 1004–1013, 2016. [Google Scholar]
8. Y. J. Liu, S. H. Liu, F. S. Yu and X. Y. Yang, “Link prediction algorithm based on the initial information contribution of nodes,” Information Sciences, vol. 608, no. 608, pp. 1591–1616, 2022. [Google Scholar]
9. C. Wang, S. Pan, R. Q. Hu, G. D. Long, J. Jiang et al., “Attributed graph clustering: A deep attentional embedding approach,” in Proc. of the 28th Int. Joint Conf. on Artificial Intelligence, Macao, China, pp. 3670–3676, 2019. [Google Scholar]
10. S. Cavallari, V. W. Zheng, H. Cai, K. C. Chang and E. Cambria, “Learning community embedding with community detection and node embedding on graphs,” in Proc. of the 2017 ACM on Conf. on Information and Knowledge Management, New York, NY, USA, pp. 377–386, 2017. [Google Scholar]
11. P. Goyal and E. Ferrara, “Graph embedding techniques, applications, and performance: A survey,” Knowledge-Based Systems, vol. 151, no. 151, pp. 78–94, 2018. [Google Scholar]
12. X. Du and F. Yu, “A fast algorithm for mining temporal association rules in a multi-attributed graph sequence,” Expert Systems with Applications, vol. 192, no. 192, pp. 116390, 2022. [Google Scholar]
13. S. H. Liu, Y. J. Liu, C. S. Yang and L. Deng, “Relative entropy of distance distribution based similarity measure of nodes in weighted graph data,” Entropy, vol. 24, no. 8, pp. 1154, 2022. [Google Scholar] [PubMed]
14. L. Tang and H. Liu, “Leveraging social media networks for classification,” Data Mining and Knowledge Discovery, vol. 23, no. 3, pp. 447–478, 2011. [Google Scholar]
15. B. B. Sang, H. M. Chen, L. Yang, T. R. Li and W. H. Xu, “Incremental feature selection using a conditional entropy based on fuzzy dominance neighborhood rough sets,” IEEE Transactions on Fuzzy Systems, vol. 30, no. 6, pp. 1683–1697, 2022. [Google Scholar]
16. B. B. Sang, H. Chen, L. Yang, J. Wan, T. Li et al., “Feature selection considering multiple correlations based on soft fuzzy dominance rough sets for monotonic classification,” IEEE Transactions on Fuzzy Systems, vol. 30, no. 12, pp. 5181–5195, 2022. [Google Scholar]
17. B. B. Sang, H. Chen, L. Yang, J. Wan, T. Li et al., “Incremental feature selection using a conditional entropy based on fuzzy dominance neighborhood rough sets,” IEEE Transactions on Fuzzy Systems, vol. 30, no. 6, pp. 1683–1697, 2021. [Google Scholar]
18. B. B. Sang, H. Chen, L. Yang, J. Wan, T. Li et al., “Self-adaptive weighted interaction feature selection based on robust fuzzy dominance rough sets for monotonic classification,” Knowledge-Based Systems, vol. 253, no. C, pp. 109523, 2022. [Google Scholar]
19. D. Luo, F. Nie, H. Huang and C. H. Ding, “Cauchy graph embedding,” in Proc. of the 28th Int. Conf. on Machine Learning (ICML-11), Madison, M, USA, pp. 553–560, 2011. [Google Scholar]
20. M. Ou, P. Cui, J. Pei, Z. Zhang and W. Zhu, “Asymmetric transitivity preserving graph embedding,” in Proc. of the 22nd ACM SIGKDD Int. Conf. on Knowledge Discovery and Data Mining, New York, NY, USA, pp. 1105–1114, 2016. [Google Scholar]
21. M. Belkin and P. Niyogi, “Laplacian eigenmaps and spectral techniques for embedding and clustering,” in Advances in Neural Information Processing Systems, Vancouver, Canada, pp. 585–591, 2001. [Google Scholar]
22. P. Cui, X. Wang, J. Pei and W. Zhu, “A survey on network embedding,” IEEE Transactions on Knowledge and Data Engineering, vol. 31, no. 5, pp. 833–852, 2018. [Google Scholar]
23. B. Perozzi, R. Al-Rfou and S. Skiena, “Deepwalk: Online learning of social representations,” in Proc. of the 20th ACM SIGKDD Int. Conf. on Knowledge Discovery and Data Mining, New York, NY, USA, pp. 701–710, 2014. [Google Scholar]
24. T. Mikolov, K. Chen and G. Corrado, “Efficient estimation of word representations in vector space,” in Proc. of the Int. Conf. on Learning Representations (ICLR) Workshop, Copenhagen, Denmark, pp. 1–12, 2013. [Google Scholar]
25. J. Tang, M. Qu, M. Z. Wang, M. Wang, J. Yan et al., “Line: Large-scale information network embedding,” in Proc. of the 24th Int. Conf. on World Wide Web, New York, NY, USA, pp. 1067–1077, 2015. [Google Scholar]
26. D. Wang, P. Cui and W. Zhu, “Structural deep network embedding,” in Proc. of the 22nd ACM SIGKDD Int. Conf. on Knowledge Discovery and Data Mining, New York, NY, USA, pp. 1225–1234, 2016. [Google Scholar]
27. L. F. R. Ribeiro, P. H. P. Saverese and D. R. Figueiredo, “Struc2vec: Learning node representations from structural identity,” in Proc. of the 23rd ACM SIGKDD Int. Conf. on Knowledge Discovery and Data Mining, New York, NY, USA, pp. 385–394, 2017. [Google Scholar]
28. M. M. Keikha, M. Rahgozar and M. Asadpour, “Community aware random walk for network embedding,” Knowledge-Based Systems, vol. 148, no. 148, pp. 47–54, 2018. https://doi.org/10.1016/j.knosys.2018.02.028 [Google Scholar] [CrossRef]
29. D. Liu, Q. Li, Y. Ru and J. Zhang, “The network representation learning algorithm based on semi-supervised random walk,” IEEE Access, vol. 8, pp. 222956–222965, 2020. [Google Scholar]
30. W. Dou, W. Zhang and Z. Weng, “An attributed network representation learning method based on biased random walk,” Procedia Computer Science, vol. 174, no. 174, pp. 291–298, 2020. [Google Scholar]
31. X. Huang, Q. Q. Song, Y. E. Li and X. Xu, “Graph recurrent networks with attributed random walks,” in Proc. of the 25th ACM SIGKDD Int. Conf. on Knowledge Discovery & Data Mining, New York, NY, USA, pp. 732–740, 2019. [Google Scholar]
32. V. D. Blondel, J. L. Guillaume, R. Lambiotte and E. Lefebvre, “Fast unfolding of communities in large networks,” Journal of Statistical Mechanics: Theory and Experiment, vol. 2008, no. 10, pp. P10008, 2008. [Google Scholar]
33. T. Mikolov, I. Sutskever, K. Chen, G. Corrado and J. Dean, “Distributed representations of words and phrases and their compositionality,” in Advances in Neural Information Processing Systems, Lake Tahoe, LT, USA, pp. 3111–3119, 2013. [Google Scholar]
34. R. E. Fan, K. W. Chang, C. J. Hsieh, X. R. Wang and C. Lin, “LIBLINEAR: A library for large linear classification,” The Journal of Machine Learning Research, vol. 9, no. 61, pp. 1871–1874, 2008. [Google Scholar]
Cite This Article
 Copyright © 2023 The Author(s). Published by Tech Science Press.
This work is licensed under a Creative Commons Attribution 4.0 International License , which permits unrestricted use, distribution, and reproduction in any medium, provided the original work is properly cited.
 Downloads
 Citation Tools