
 Login
Login Register
 Submit a Paper
 Propose a Special lssue
 Open Access
ARTICLE
Hierarchical Trust Management for C-V2X Networks: A Game-Theoretic Edge-Cloud Architecture with LLM-Driven Calibration
1 Department of Computer Science and Engineering, SRM University AP, Neerukonda, Managalagiri, India
2 Department of Computer Science and Information Technology, KLEF (Deemed to be University), Vijayawada, India
* Corresponding Author: Anil Carie. Email:
(This article belongs to the Special Issue: Intelligent Control, Modeling, and Optimization for Autonomous and Renewable Energy Systems)
Intelligent Automation & Soft Computing 2026, 41, 139-166. https://doi.org/10.32604/iasc.2026.088003
Received 26 June 2026; Accepted 31 August 2026; Issue published 21 September 2026
 View Full Text
 Download PDF
Abstract
Connected Vehicle-to-Everything (C-V2X) networks rely on Basic Safety Messages (BSMs) for cooperative awareness, but authenticated vehicles can still transmit falsified kinematic data—an insider attack that cryptographic authentication cannot prevent. Existing misbehavior detection systems (MDSs) achieve high detection rates on static benchmarks yet provide no formal guarantee that honest behaviour is a rational vehicle’s dominant strategy. We present a four-layer hierarchical trust architecture for 5G New Radio (NR) C-V2X that integrates edge AI detection, cloud large language model (LLM)-driven weight calibration, game-theoretic conviction, and ledger-anchored payoff tracking. A Nash equilibrium gate, calibrated with a wide margin above the empirically observed honest-vehicle suspicion ceiling, achieves zero observed false positives across 1584 honest phase-3 instances (one-sided 95% Clopper–Pearson upper bound: 0.19% per instance), without requiring any assumption about the honest-score distribution’s shape. A clawback mechanism makes the expected payoff of attacking strictly negative for all tested temptation levels. Evaluation on NS3 with 3GPP Rel-18 channel models across nine attack types—including rational adversaries with heterogeneous temptation —yields a detection rate (DR) of with false-positive rate (FPR) of observed across 1584 honest phase-3 instances. This zero-FPR result holds for the evaluated single-UAV configuration at vehicles per zone; at , mean FPR rises to (range %– across seeds) due to coverage-boundary effects, and multi-UAV sectorisation to extend this range remains unvalidated futurework. All 95 rational attackers (, seeds 1, 2, 3, 5, 6) chose cooperation, producing a honesty premium of Trust Credits (positive in every seed, range to TC). A five-arm ablation isolates the Nash gate’s and clawback’s independent contributions to this outcome. Investigating cloud LLM calibration’s contribution to detection rate, we identified and corrected a learning-rate implementation fault that had suppressed nearly all of the LLM’s recommended adjustments throughout the original evaluation; under the corrected configuration, calibration produces a statistically significant detection-rate improvement, confirmed with a live cloud-unreachable control ( percentage points, ), reported alongside the original finding for transparency. To our knowledge, this is the first V2X misbehavior detection system to provide formal incentive compatibility under heterogeneous temptation for economically-rational attackers under the specified payoff model; this claim does not extend to attackers pursuing non-economic objectives, collusion, Sybil behaviour, or calibration-pipeline poisoning, which remain open problems.Keywords
The deployment of Cellular Vehicle-to-Everything (C-V2X) communication is accelerating worldwide, with 3GPP Release 18 [1] standardising direct sidelink and network-assisted modes for safety-critical applications. Cooperative awareness—vehicles intermittently transmitting Basic Safety Messages (BSMs) with position, speed, heading, and timestamp—requires integrity that is a deployment-gating issue: a single fake BSM could cause phantom-braking, ghost vehicle injection, or platoon destabilisation [2]. Cryptographic authentication (European Telecommunications Standards Institute (ETSI) TS 102 940, Public Key Infrastructure (PKI)) guarantees only that authenticated vehicles can send messages; it does not guarantee the truthfulness of their content. A fraudulent insider with valid credentials can send forged kinematic data, an attack PKI cannot prevent by design [3]. ETSI TR 103 460 [4] describes a Misbehavior Detection System (MDS) pipeline of plausibility checks, misbehavior reporting (TS 103 759 [5]), and certificate revocation, but provides no formal economic incentive for honest participation. Implementations of machine learning (ML)-based MDS have shown 92%–97% detection rates on the VeReMi benchmark [6], evaluated on datasets such as the VeReMi Extension [7]. These rates are achieved on static, pre-programmed attack patterns; against adaptive opponents, reported FPRs of 2%–8% are operationally prohibitive at highway density (
1.1 Limitations of Existing Approaches
First, no existing system provides formal deterrence. All current MDSs are detection-only: they flag misbehavior but offer no mechanism design argument [8] showing that honest behaviour is a rational vehicle’s dominant strategy.
Second, evaluation benchmarks exclude adaptive attackers. VeReMi and its extensions contain only static attacker profiles. No published system has been evaluated against game-theoretic adversaries that adjust attack intensity based on accumulated suspicion.
Third, false positive rates remain operationally prohibitive. Reported FPRs of 2%–8% translate to
(1) A four-layer hierarchical trust architecture integrating edge AI detection, cloud LLM-driven weight calibration, game-theoretic conviction, and ledger-anchored payoff tracking over 5G NR C-V2X (Section 3).
(2) Nash equilibrium gate with an empirically validated, assumption-free false-positive bound: zero observed false positives across 1584 honest phase-3 instances (one-sided 95% Clopper–Pearson upper bound: 0.19% per instance), calibrated with a wide margin above the empirical honest-suspicion ceiling (Section 3.3).
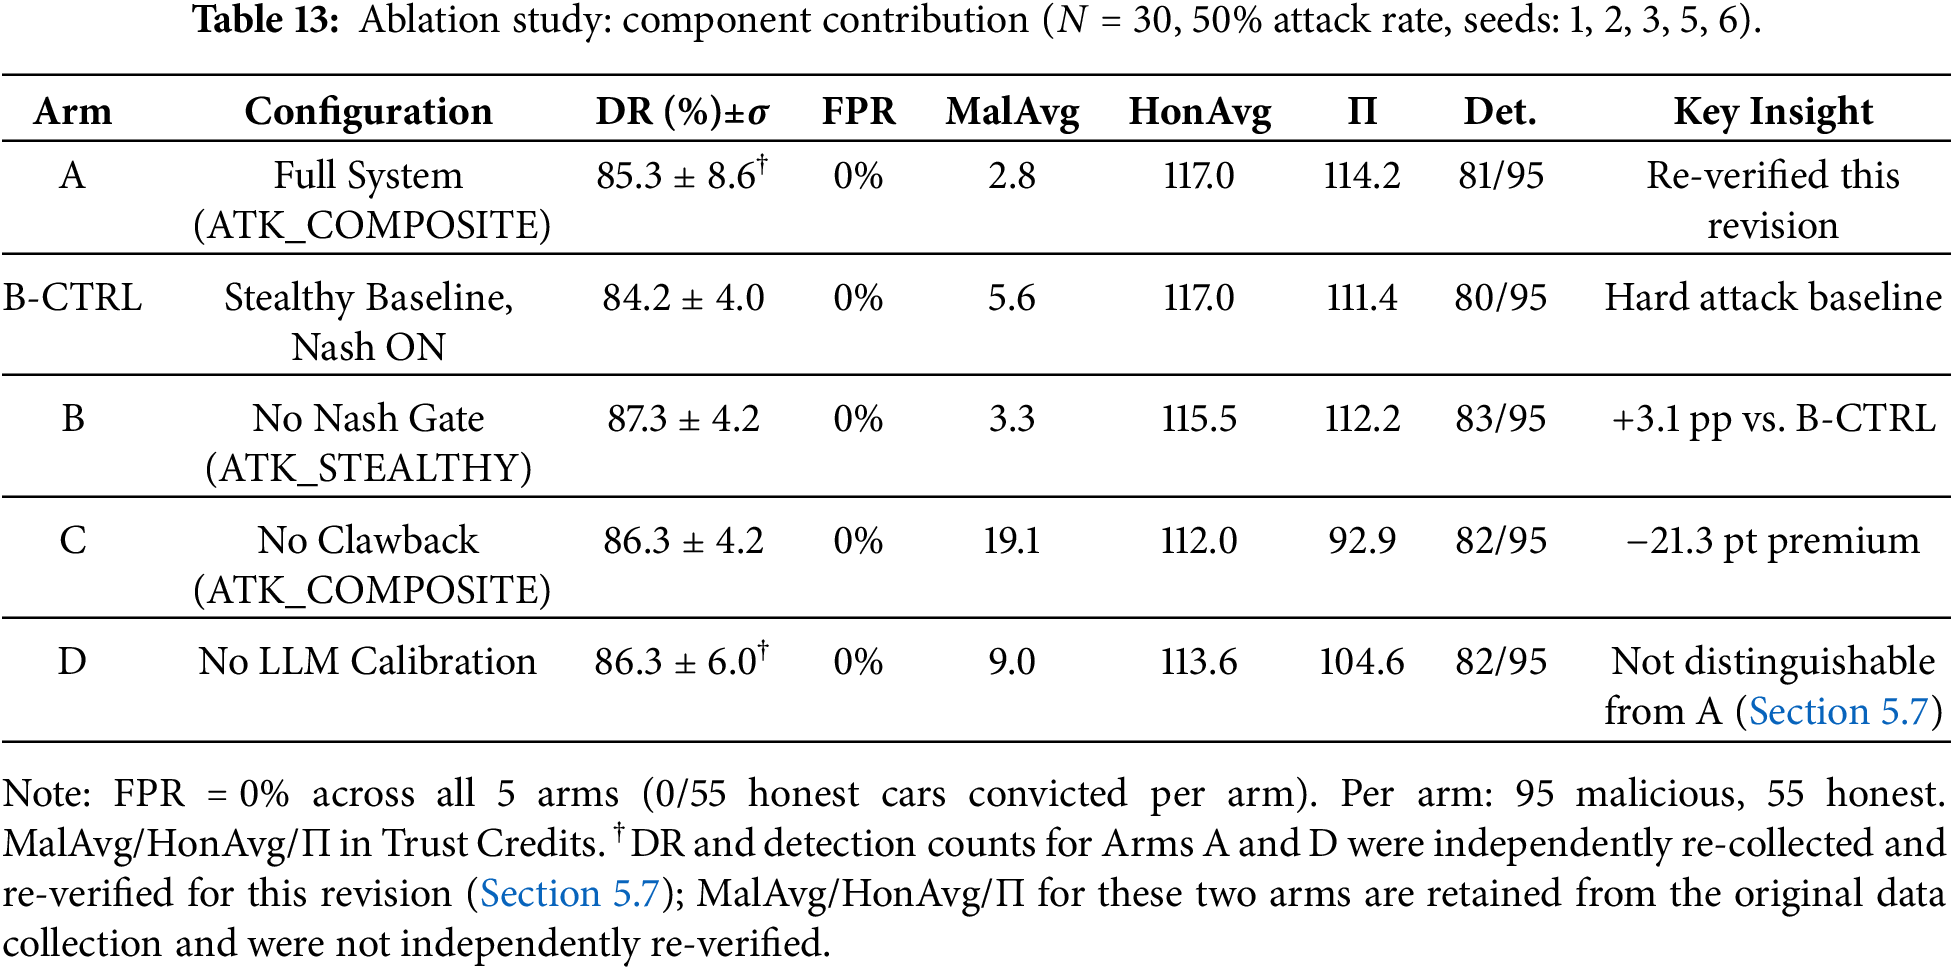
(3) Orthogonal clawback mechanism reducing honesty premium by 21.3 TC when removed, without affecting detection rate (Section 5).
(4) Incentive compatibility demonstrated with 95 rational attackers (
(5) Five-arm ablation study on NS3 with 3GPP Rel-18 channels (Section 5).
Section 2 reviews related work. Section 3 presents the system and threat model. Section 4 develops the game-theoretic analysis. Section 5 reports experimental results. Section 6 discusses results and limitations. Section 7 outlines future work.
2.1 ETSI Misbehavior Detection Framework
The European Telecommunications Standards Institute describes the reference architecture of Cooperative Intelligent Transport Systems (C-ITS) misbehavior detection in TR 103 460 [4]. This reference architecture divides the misbehavior detection process into three steps: plausibility checking, misbehavior reporting (TS 103 759 [5]), and certificate revocation. Bißmeyer [9] combined data-centric checks with attacker identification, concluding that detection alone is insufficient without revocation. Amanullah et al. [10] provide a broader taxonomy and analysis of misbehaviour detection systems across the C-ITS literature, situating plausibility-check and ML-based approaches within a common classification framework. The ETSI framework specifies no economic incentive for honest participation.
2.2 Plausibility-Based and ML-Based Detection
Plausibility checks. So et al. [11] proposed received signal strength indicator (RSSI)-based checks achieving
ML classifiers. Boualouache and Engel [6] survey 40+ ML-based MDSs (92%–97% accuracy, 3%–8% FPR on VeReMi). Kristianto et al. [13] propose semi-supervised federated learning (
LLM-assisted detection. Yoshizawa et al. [16] survey the broader V2X security and privacy landscape, situating misbehavior detection alongside authentication and privacy threats. Friha et al. [17] survey LLM-based edge intelligence broadly, noting that per-packet inference latency with contemporary LLMs is generally incompatible with 100 ms BSM periodicity. Liu and Zhao [18] similarly identify the computational and latency constraints of integrating LLMs directly into 6G vehicular networks. Our split design resolves this: edge ensemble provides real-time per-packet scoring (21 ms round-trip time (RTT)); cloud LLM operates asynchronously on calibration batches (2500 ms RTT).
2.3 Trust Management and Reputation Systems
Ahmad et al. [19] proposed NOTRINO combining event-based and roadside unit (RSU)-aggregated reputation, but not the strategic aspect: a rational vehicle can accumulate high entity trust before a late-flip attack, exactly the ATK_RATIONAL profile we evaluate. Chen et al. [20] proposed a deep reinforcement learning (DRL)-based blockchain trust architecture (DR
2.4 Game Theory in Vehicular Security
Game theory has been applied to vehicular networks primarily in spectrum allocation, task offloading, and routing [24]; Sun et al. [25] survey this broader landscape of game-theoretic applications in vehicular networks. Mehdi et al. [26] analysed vehicle interaction as a two-player game but validated only analytically. Chouikhi et al. [27] combined reputation and game-theoretic incentives at the routing layer but not for BSM plausibility. AlSaqabi and Krishnamachari [28] propose a game-theoretic architecture incentivizing private data sharing in vehicular networks, addressing a complementary incentive problem to the misbehavior-deterrence one studied here. No existing V2X MDS provides a mechanism design argument [8] showing incentive compatibility under heterogeneous temptation.
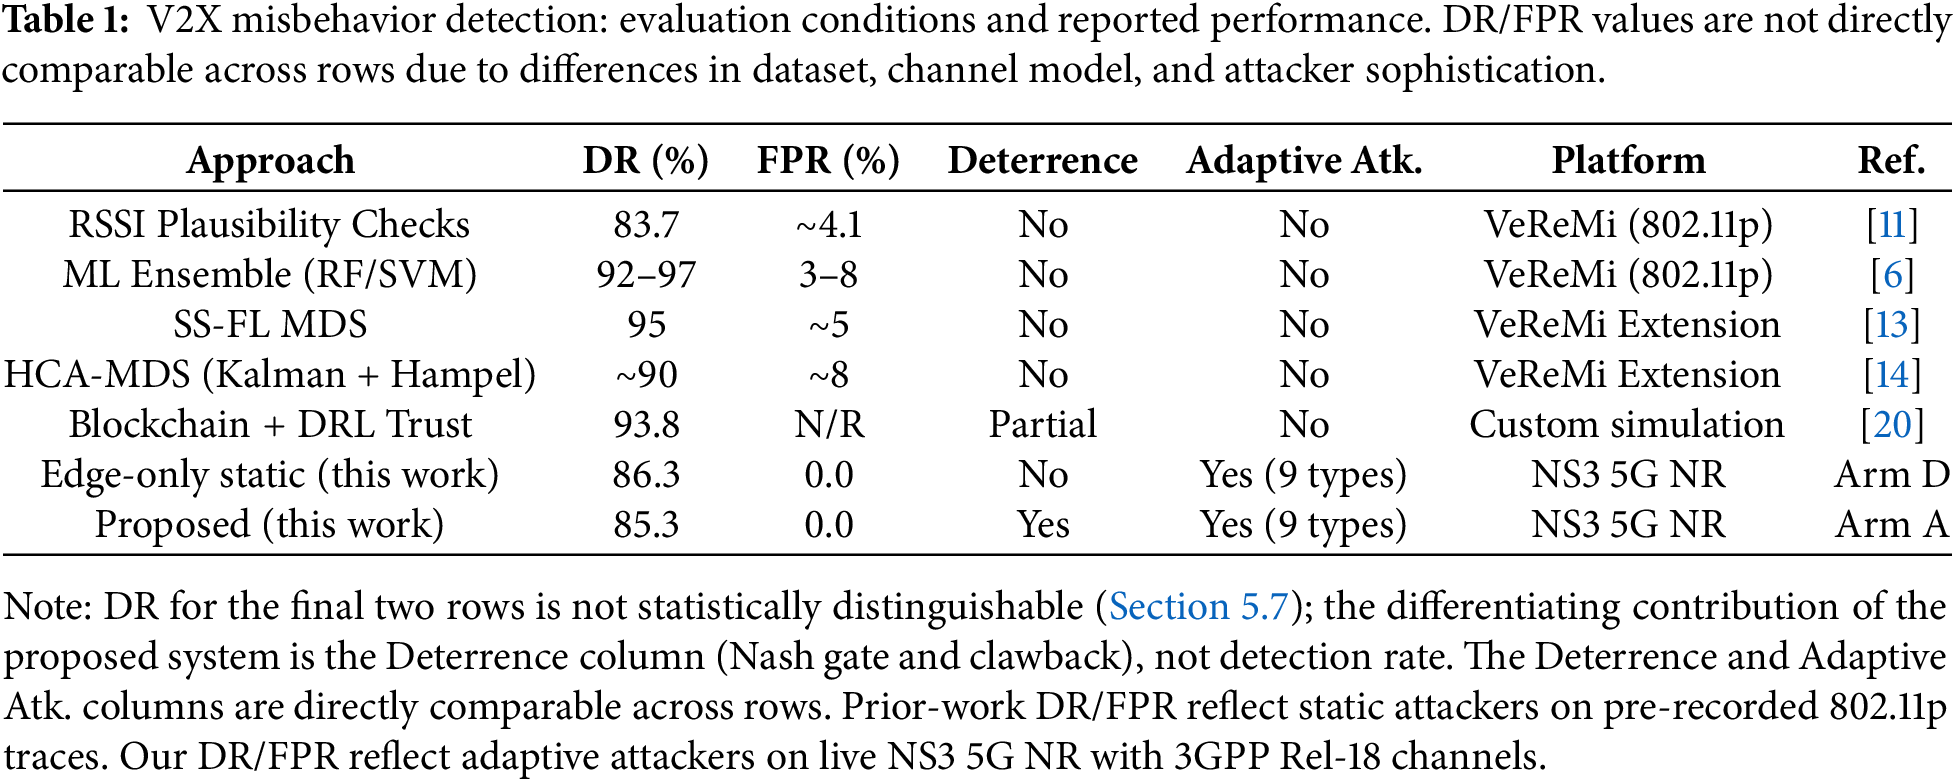
Table 1 summarizes evaluation conditions and reported performance across the approaches discussed above.
3 System Model and Architecture
We consider
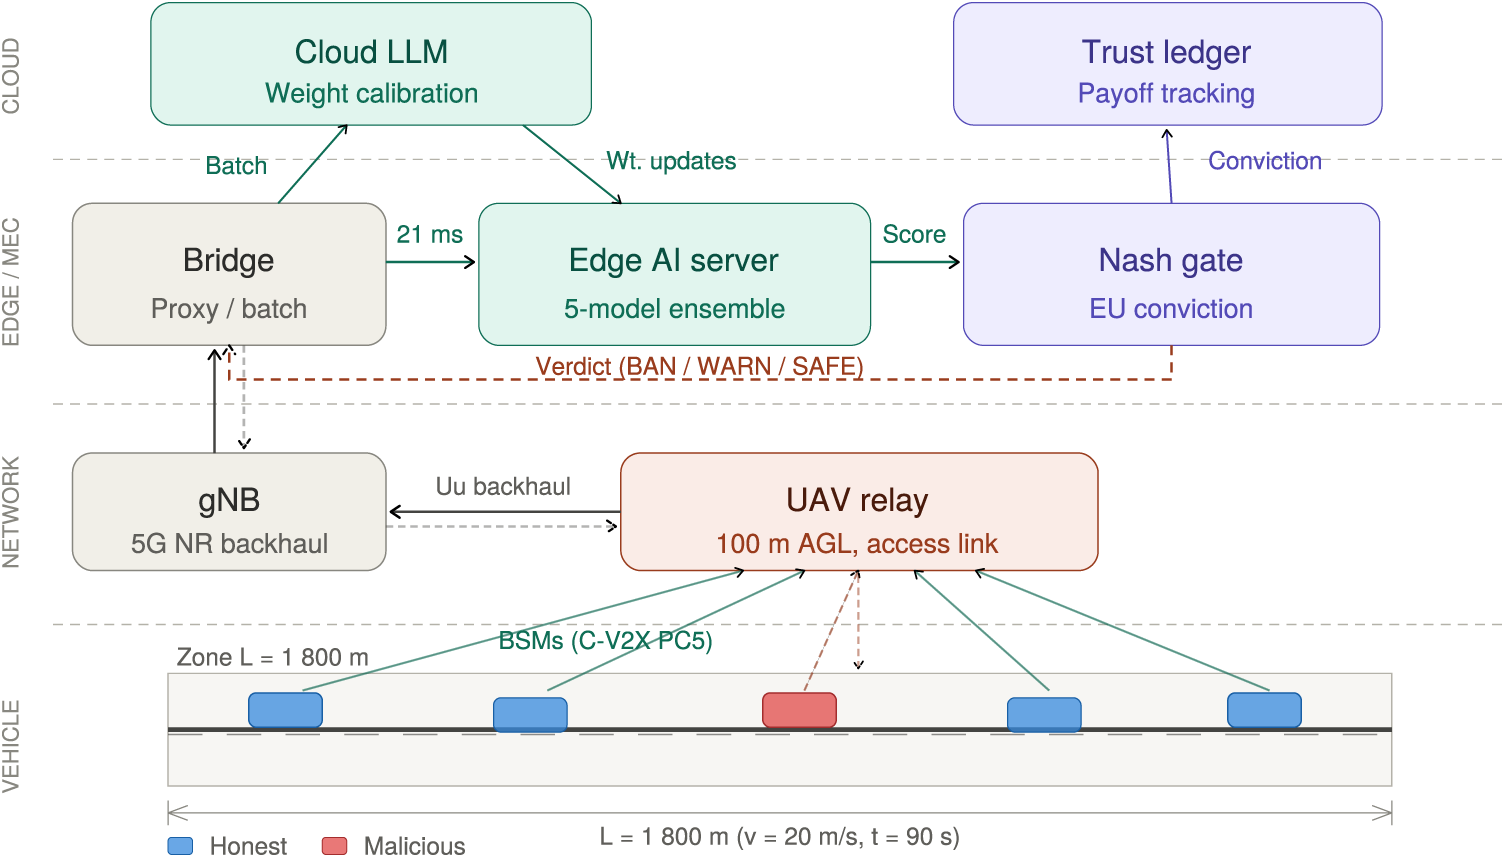
Figure 1: Four-layer hierarchical trust architecture. Data flows from vehicles through the UAV relay to the bridge, which forwards telemetry to the edge AI server and accumulates calibration batches for the cloud LLM. Only LLM-validated calibration results are applied. Edge RTT: 21 ms; Cloud RTT: 2500 ms.
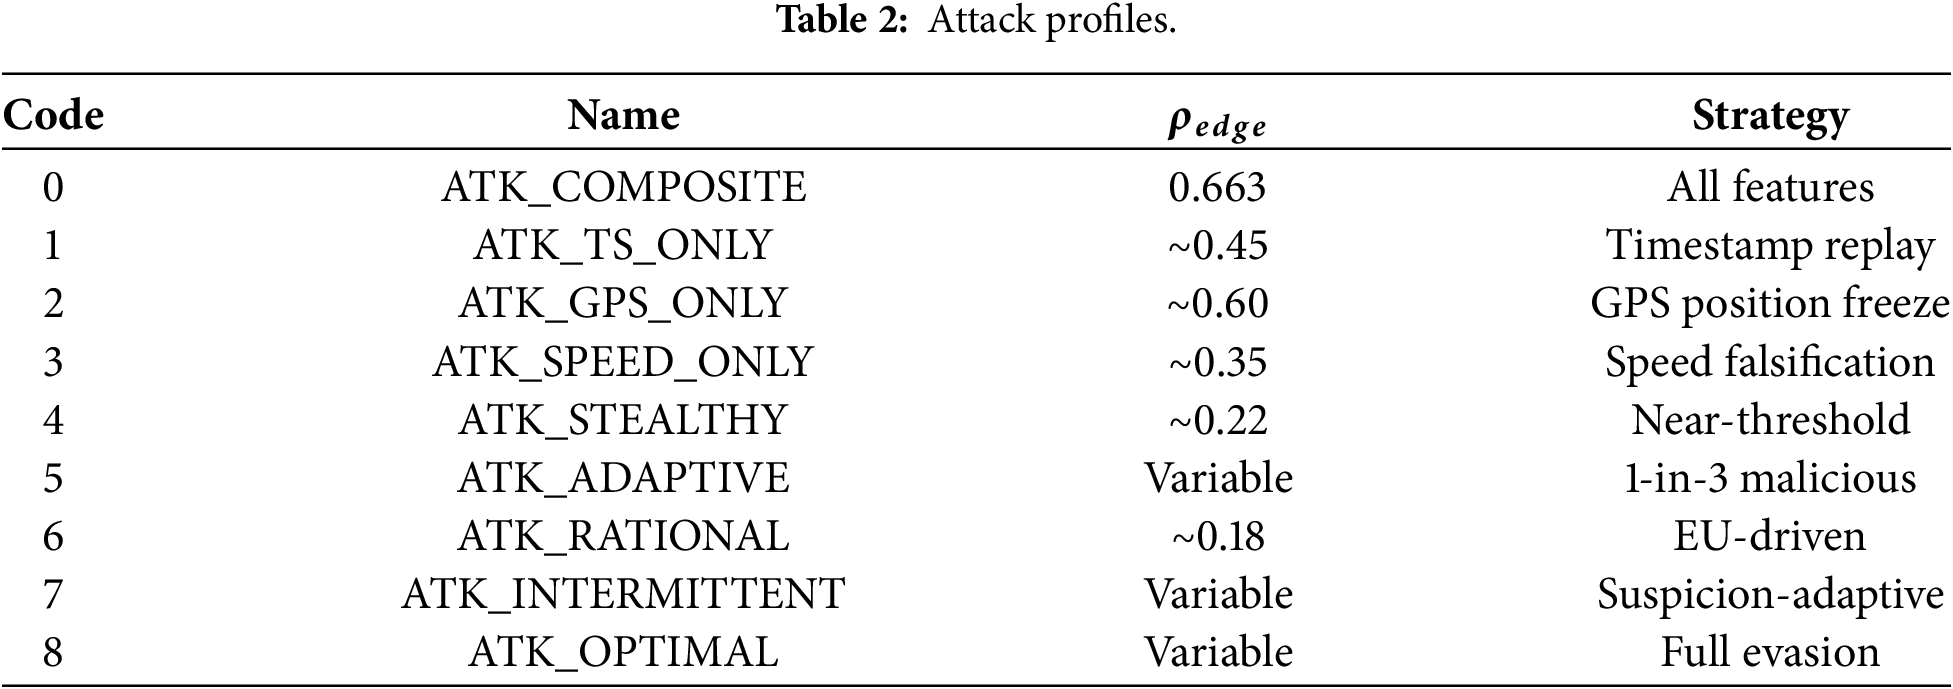
An internal attacker is an authenticated vehicle transmitting falsified BSMs. Nine profiles are defined (Table 2), from strong signals (ATK_COMPOSITE,
Out-of-Scope Threats
Three threat dimensions are explicitly outside the scope of this evaluation. Sybil identity attacks (a vehicle registering multiple pseudonymous identities to evade conviction) are delegated to the PKI/pseudonym layer beneath our trust layer (ETSI TS 102 941); we do not evaluate resistance to Sybil behavior independently. Collusion among multiple attacking vehicles is not modeled; our game-theoretic analysis (Section 4) treats each vehicle’s strategy independently. Calibration-pipeline poisoning (an attacker crafting telemetry specifically to bias the LLM calibration step) is not evaluated experimentally, though we note a partial, verified structural bound: per-round weight deltas are clamped to
3.3 Edge AI Detection (Layer 2)
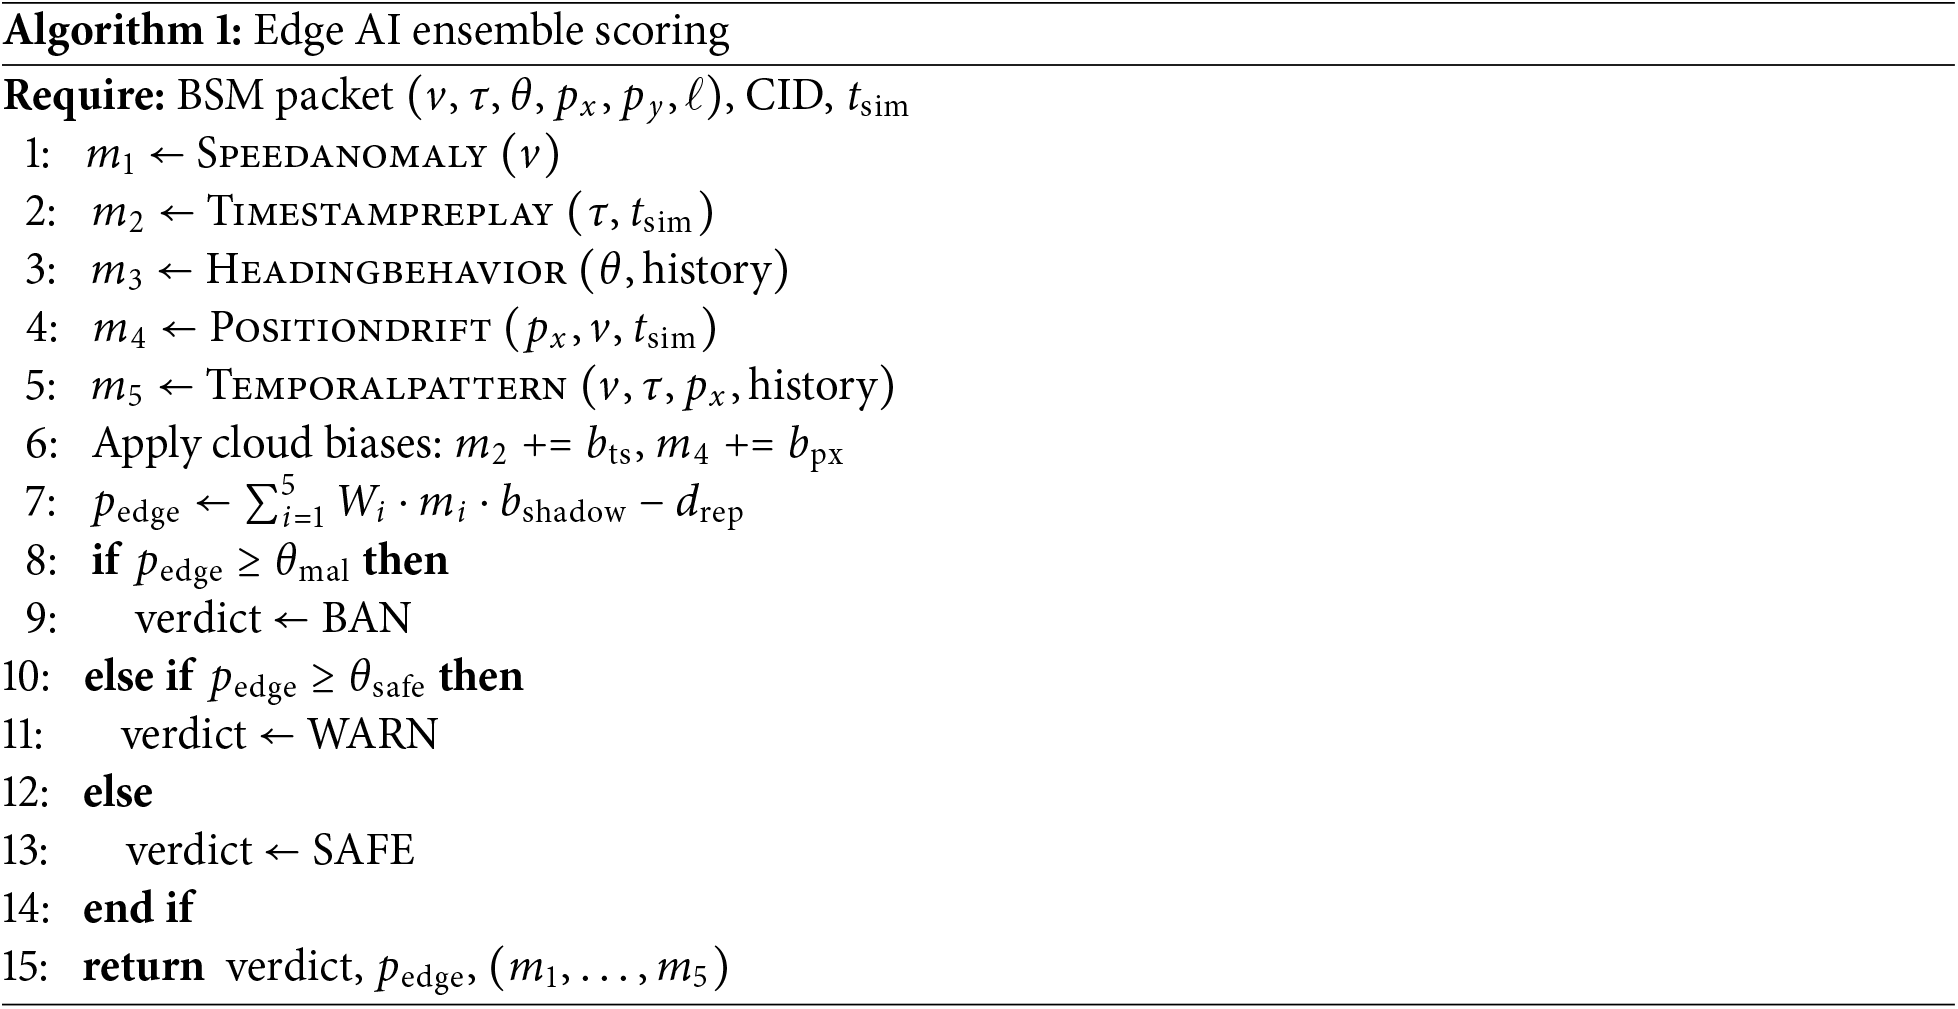
The edge runs a five-model ensemble (Algorithm 1):
where
with
Empirical Result 1 (Assumption-Free FPR Bound)
Fig. 2 shows the resulting distribution. Each simulation run passes every honest vehicle through three sequential motion phases as it traverses the zone, each occupying roughly one third of total simulation time: an initial baseline-speed phase (phase 1,
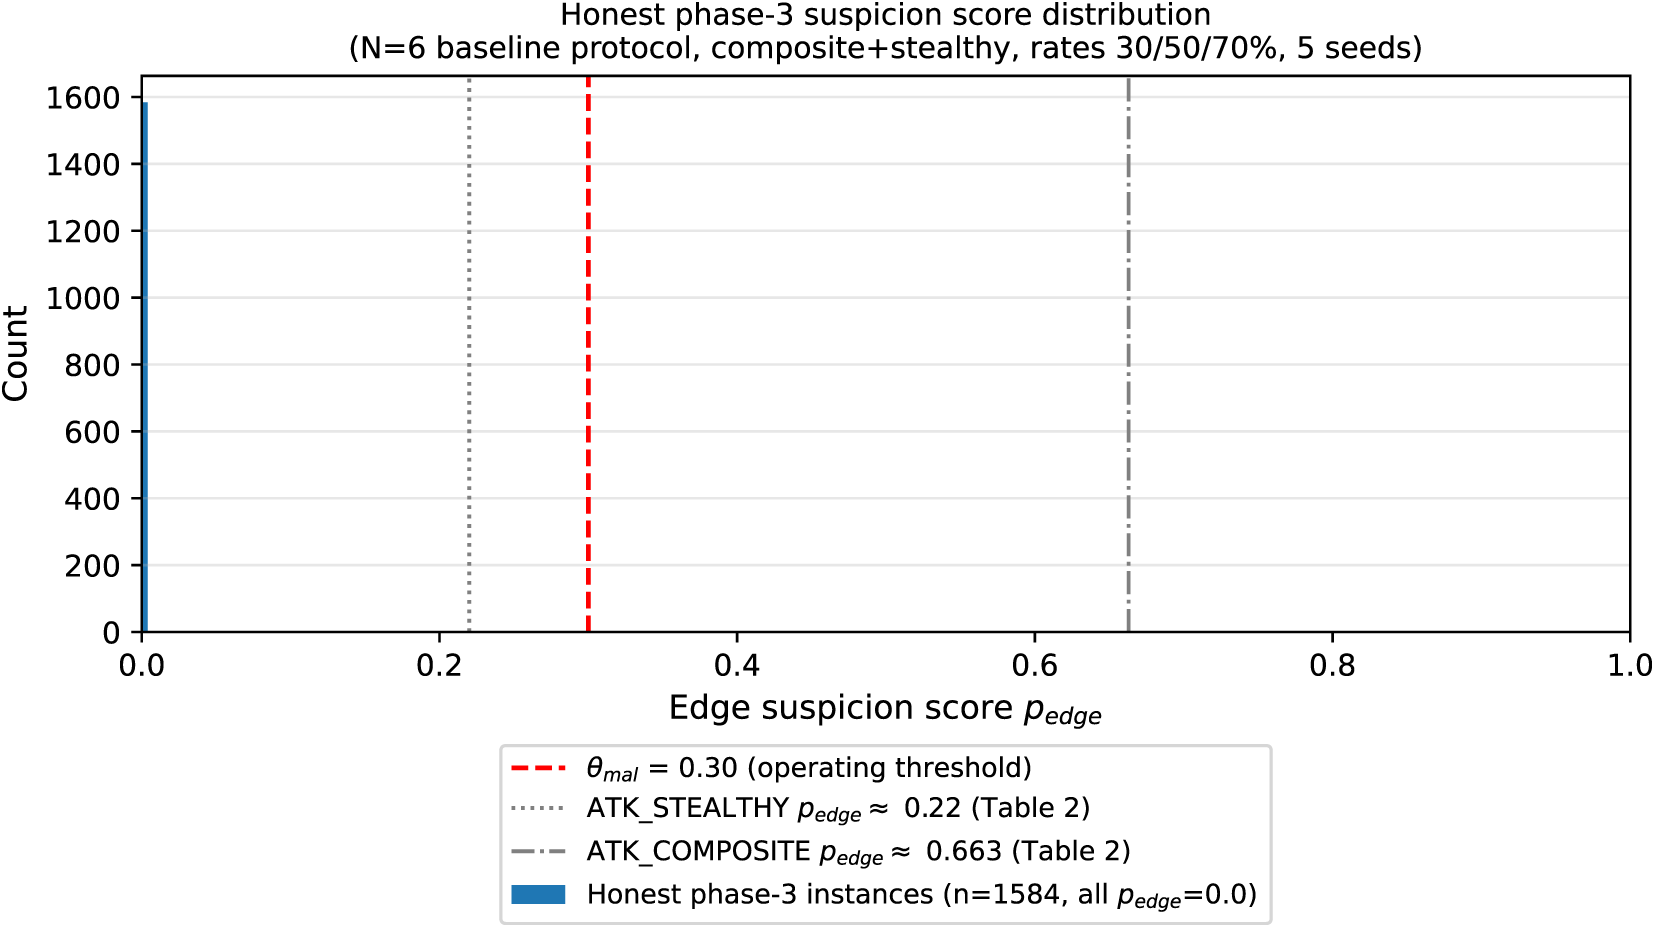
Figure 2: Edge suspicion score (
We report this explicitly as a statistical upper confidence bound under the stated simulation protocol, not as a universal guarantee: it certifies that, were the true per-instance false-positive rate above
The bridge relays telemetry to the edge and collects calibration batches via seven triggers. A Fisher separability gate:
triggers batches when
3.5 Cloud LLM Calibration (Layer 3)
An 8B-parameter locally-hosted LLM balances calibration batches and produces weight deltas (Algorithm 2). Only LLM-validated calibrations are applied; no rule-based fallback.
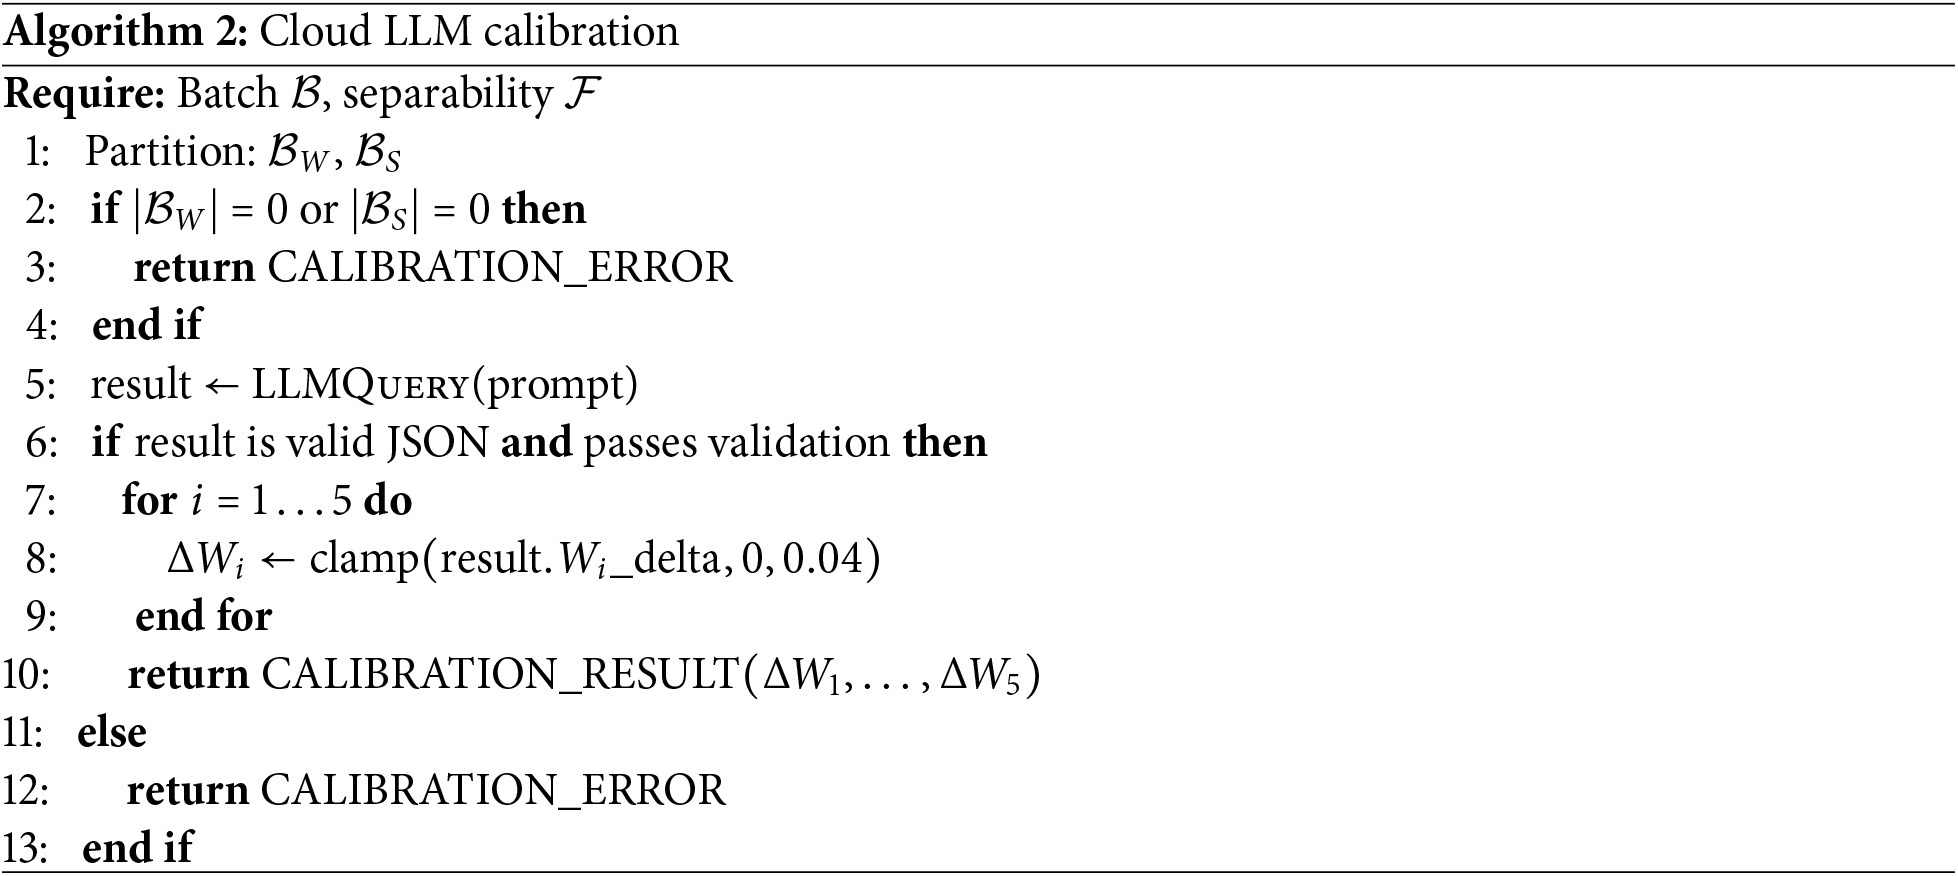
Edge applies:
3.6 Nash Gate Conviction (Layer 1)
Fig. 3 illustrates the resulting decision boundary for the two evaluated attack profiles.
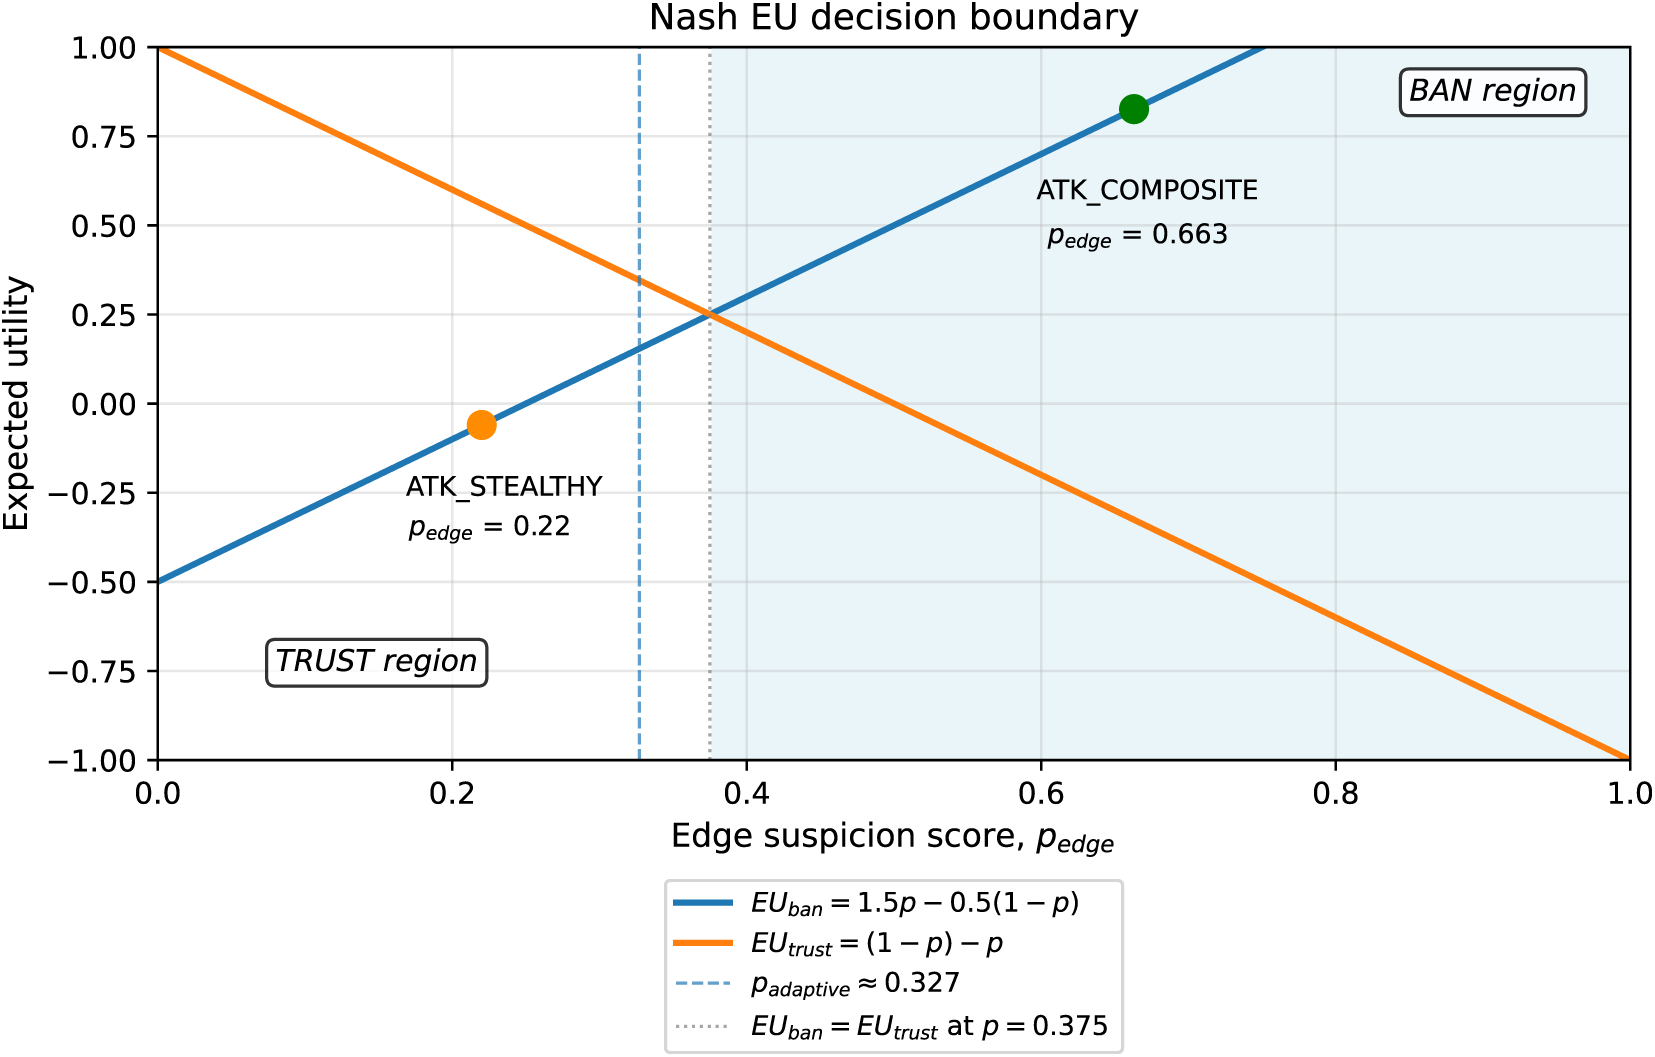
Figure 3: Nash EU threshold decision. ATK_COMPOSITE (
Conviction (Algorithm 3) amends an append-only ledger that persists per-vehicle history across zone transitions. We specify its architecture, schema, and use precisely, correcting terminology in earlier drafts of this work that described the mechanism as a blockchain.
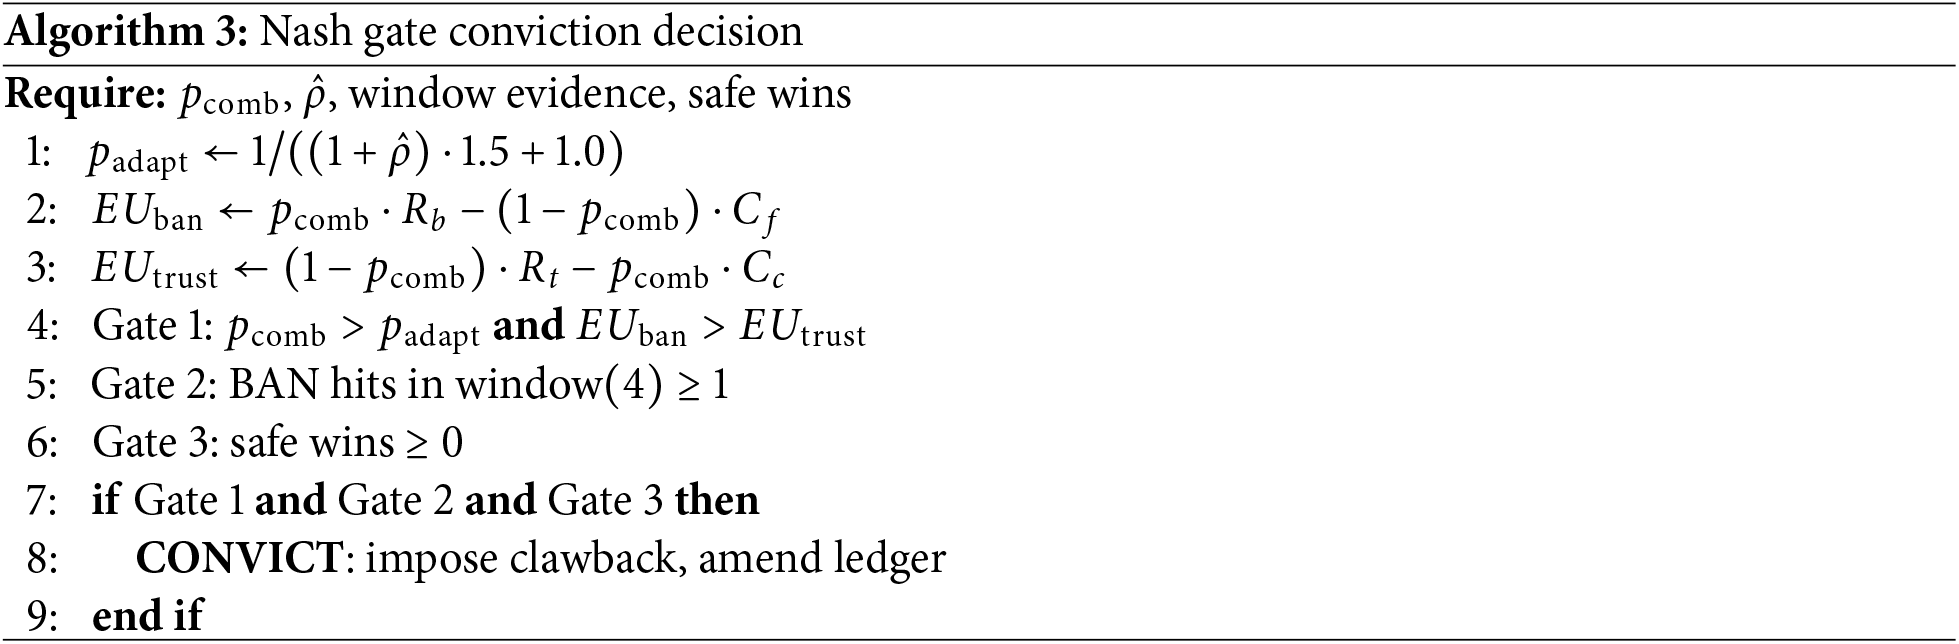
The ledger is a local, append-only structured log maintained by the edge process, with a schema styled after blockchain conventions (sequential block numbers, hash and previous-hash fields). We verified directly against the released implementation that the hash and prev fields are populated with a placeholder value in the current codebase rather than computed cryptographic hashes, and that no hash-chain verification is performed. We therefore refer to this component as an append-only ledger rather than a blockchain throughout this paper: the schema anticipates a future cryptographically-chained implementation, but the tamper-evidence and non-repudiation properties that term implies are not yet present.
Each ledger entry records
3.7.3 Trust Credit Calculation
The cloud calibration process reads the ledger (read-only) to compute each vehicle’s prior safe-win count, which determines the Trust Credit discount applied to the false-ban cost penalty
with
3.7.4 Enforcement and Practical Value
The discount mechanism directly reduces the effective penalty rate for vehicles with strong honest history, implementing the honesty premium (Section 4.3). Conviction (Algorithm 3) triggers the clawback mechanism independent of the ledger’s cryptographic properties, since clawback depends only on payoff accounting, not on tamper-evidence.
A field deployment would require completing the hash-chaining, or adopting a genuine distributed ledger platform, before the tamper-evidence and non-repudiation properties implied by blockchain terminology could be honestly claimed. The persistence layer evaluated here is sufficient for the incentive-compatibility results reported in Section 5 (which depend on payoff accounting, not cryptographic integrity), but is not itself presented as a security contribution of this work.
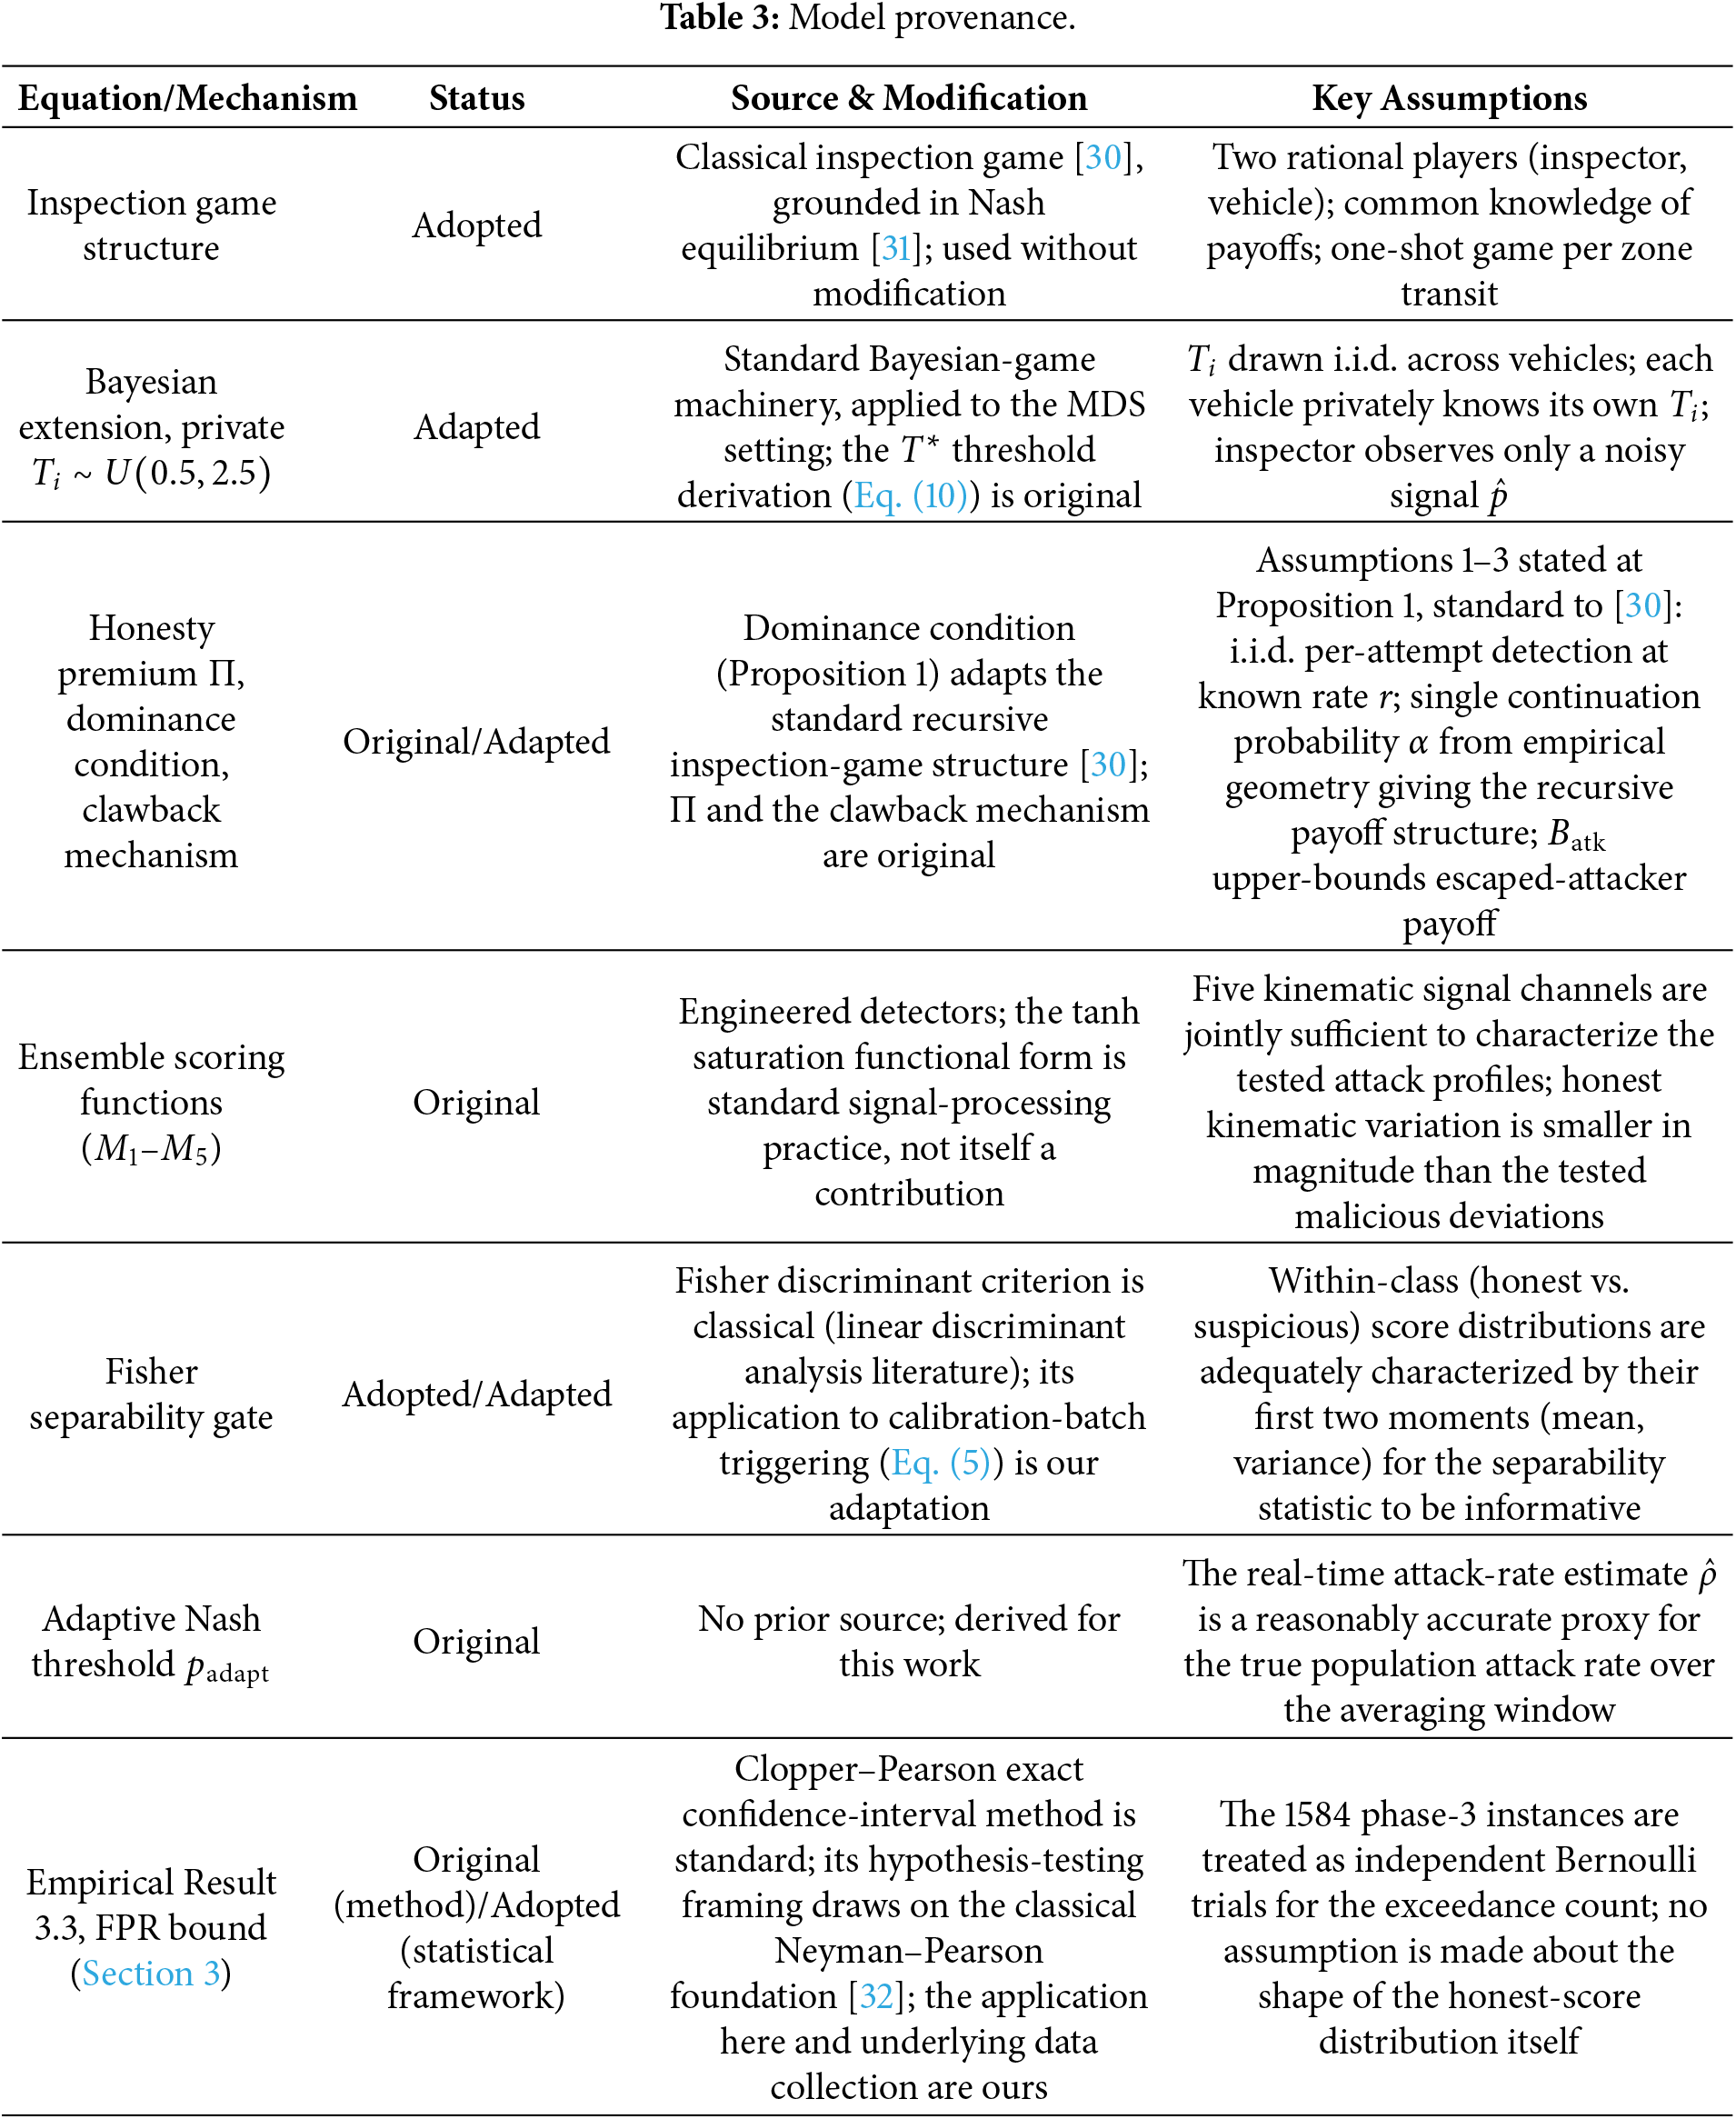
Table 3 states, for each equation or mechanism in this paper, whether it is adopted from prior work without modification, adapted from a known technique to this setting, or original to this work.
4.1 Two-Player Inspection Game
Table 4 specifies the payoff structure underlying the analysis below.

4.2 Heterogeneous Temptation (Bayesian Nash Equilibrium)
Each vehicle draws
Since
Definition 1 (Honesty Premium):
Proposition 1 (Dominance of Honest Strategy): Under the following assumptions, standard to the recursive inspection-game formulation [30] already underlying the game structure of Section 4.1: (1) detection is applied independently and identically to each attack attempt at a known rate
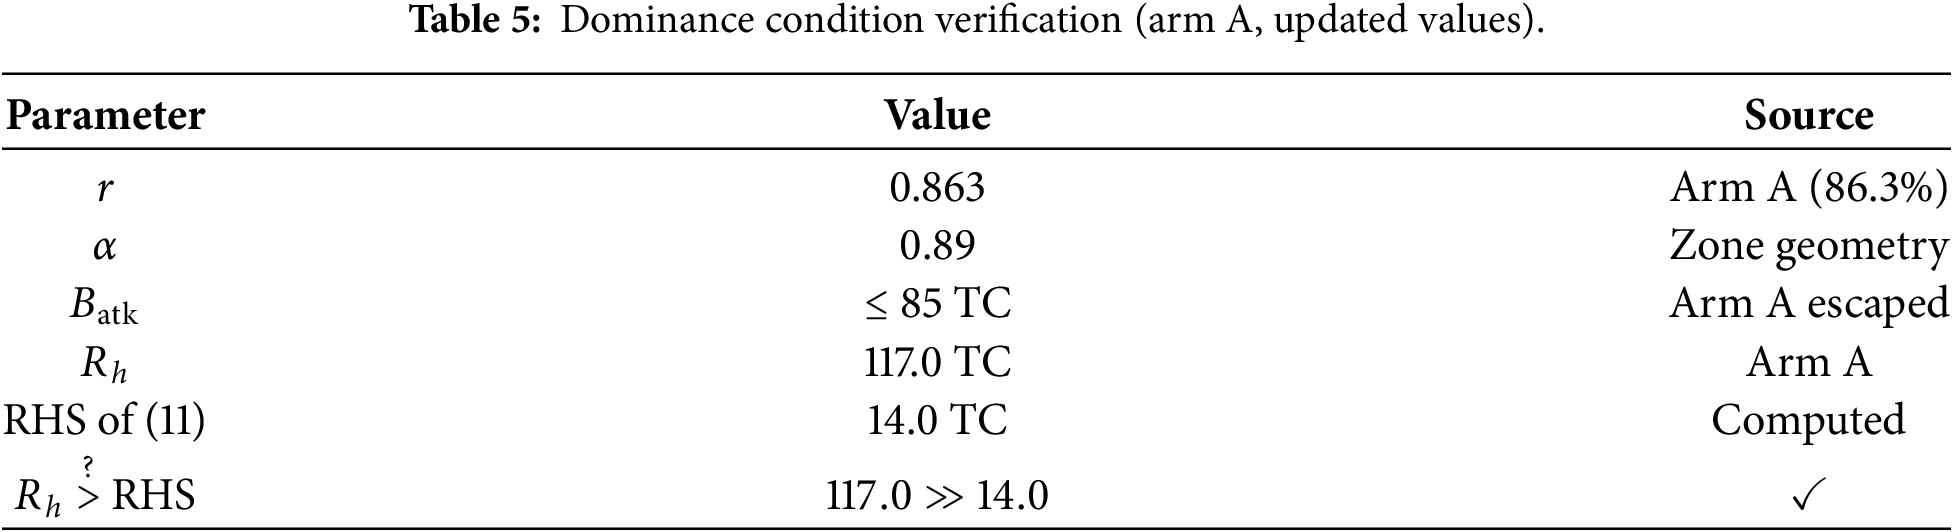
Table 5 verifies this condition numerically against the values observed in Arm A.
4.4 Adaptive Threshold for Nash Gate
at
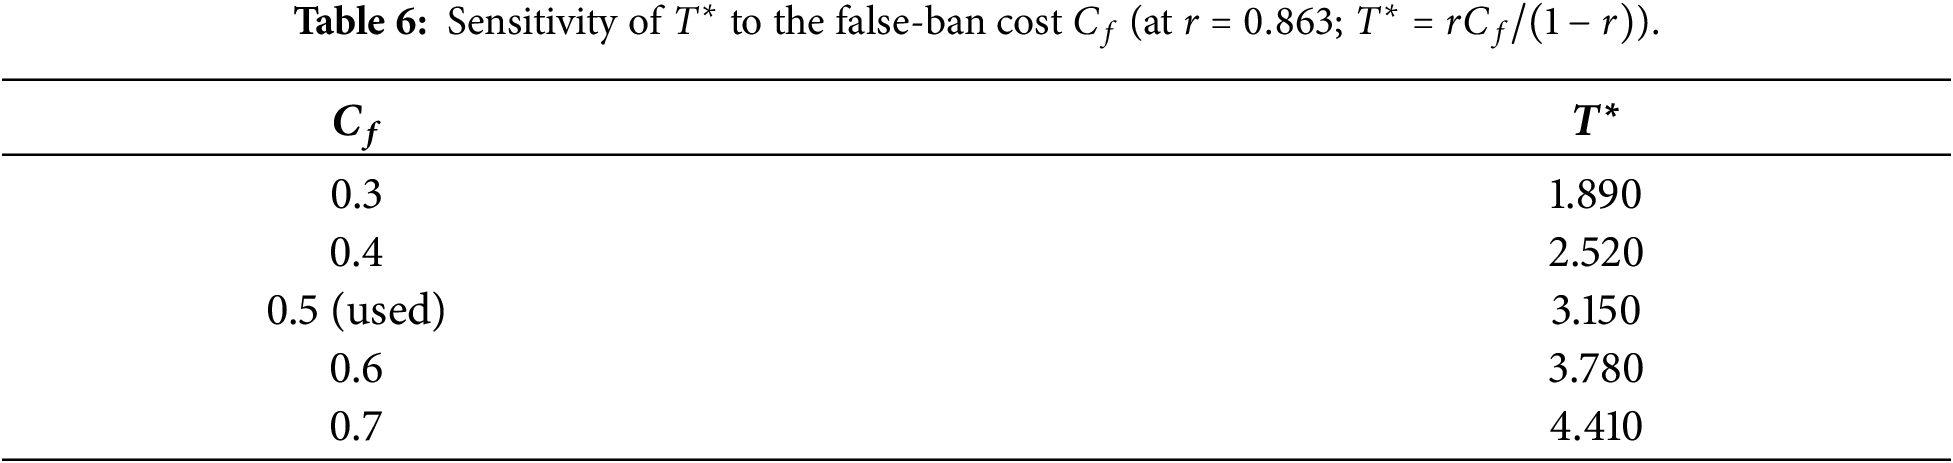
The deterrence conclusions above rely on the fixed payoff parameters
The full-range deterrence claim (Section 4.3)—that detection alone, without clawback, deters the entire temptation range

Our operating point (
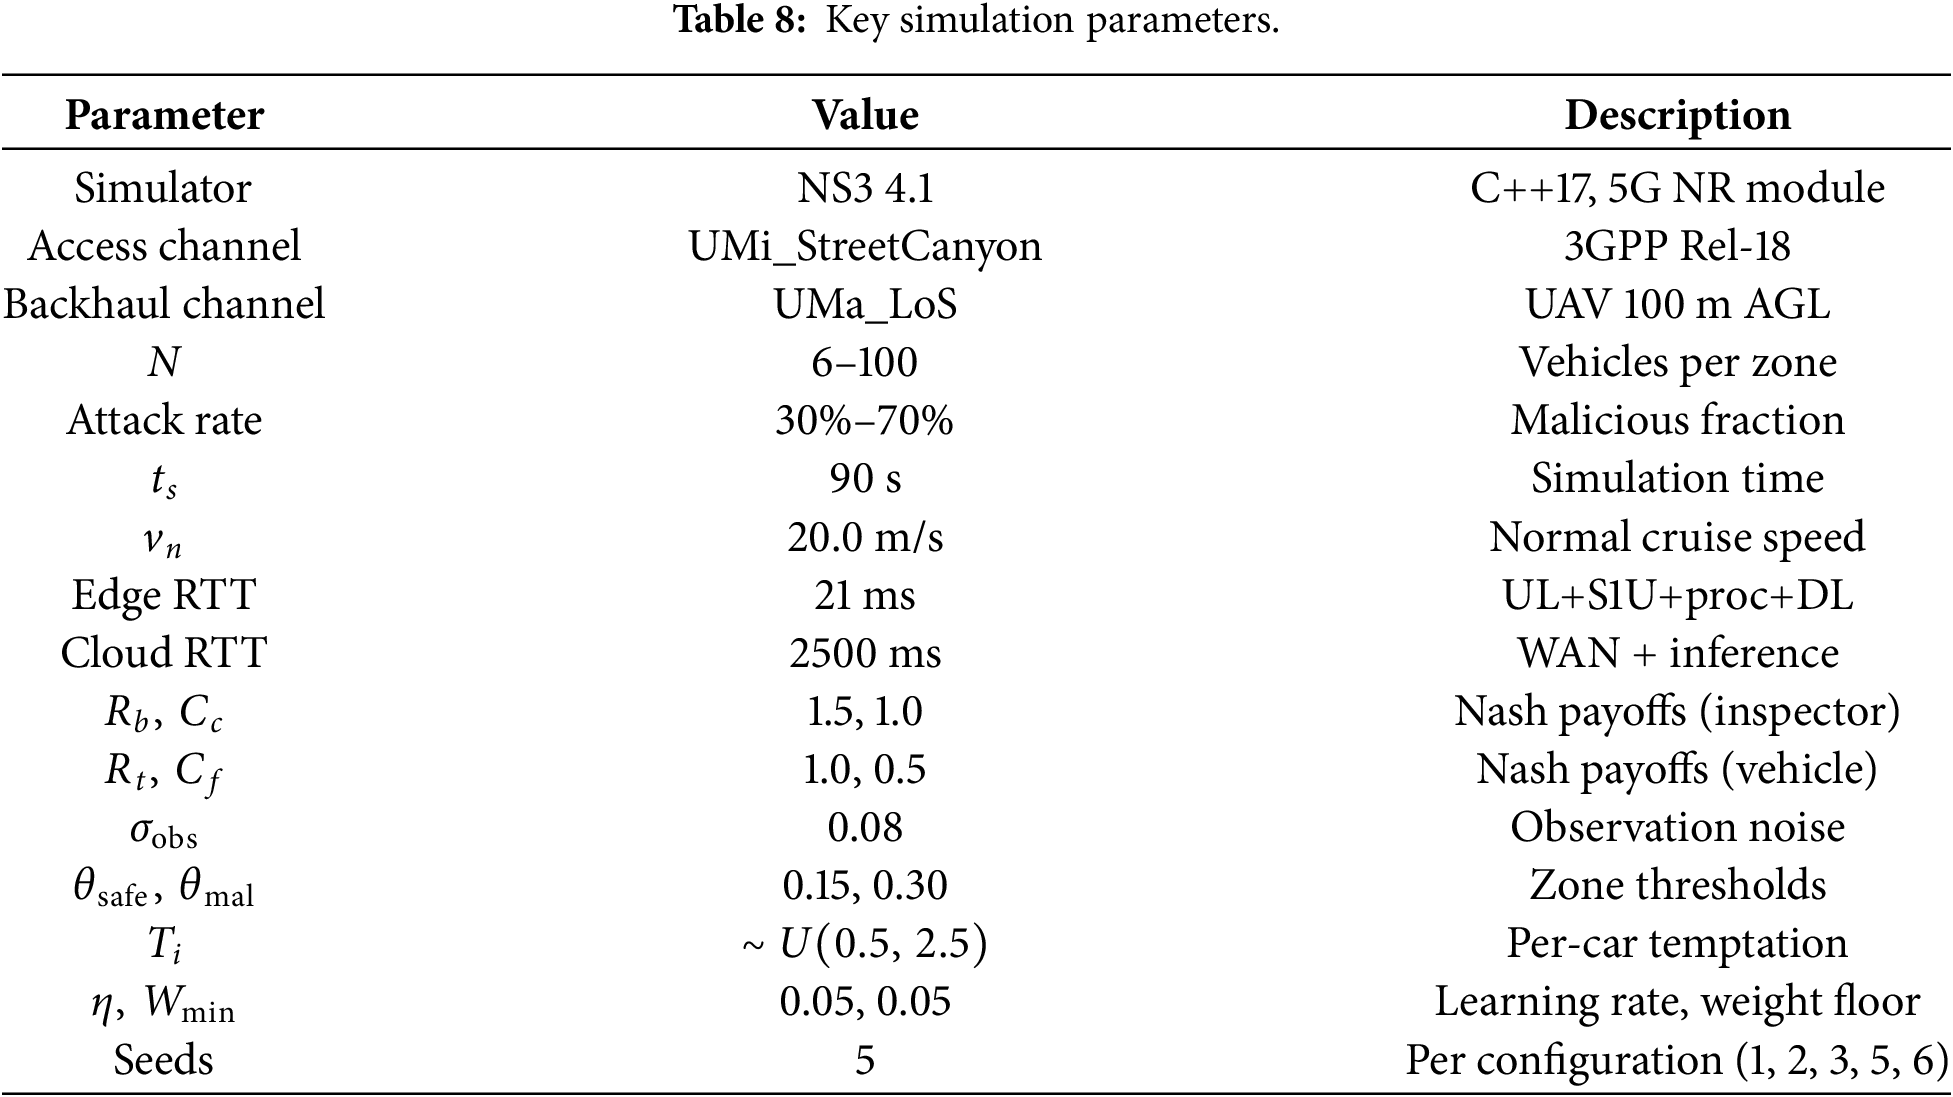
Experiments were conducted using the 5G-LENA NR module on NS3 4.1 (C++17). The edge AI server and bridge run on a 20-core compute node. The cloud LLM (llama3, 8B parameters) runs on a separate GPU server. Key parameters are in Table 8.
All results are the mean
Table 9 presents baseline performance on 30 experiments with
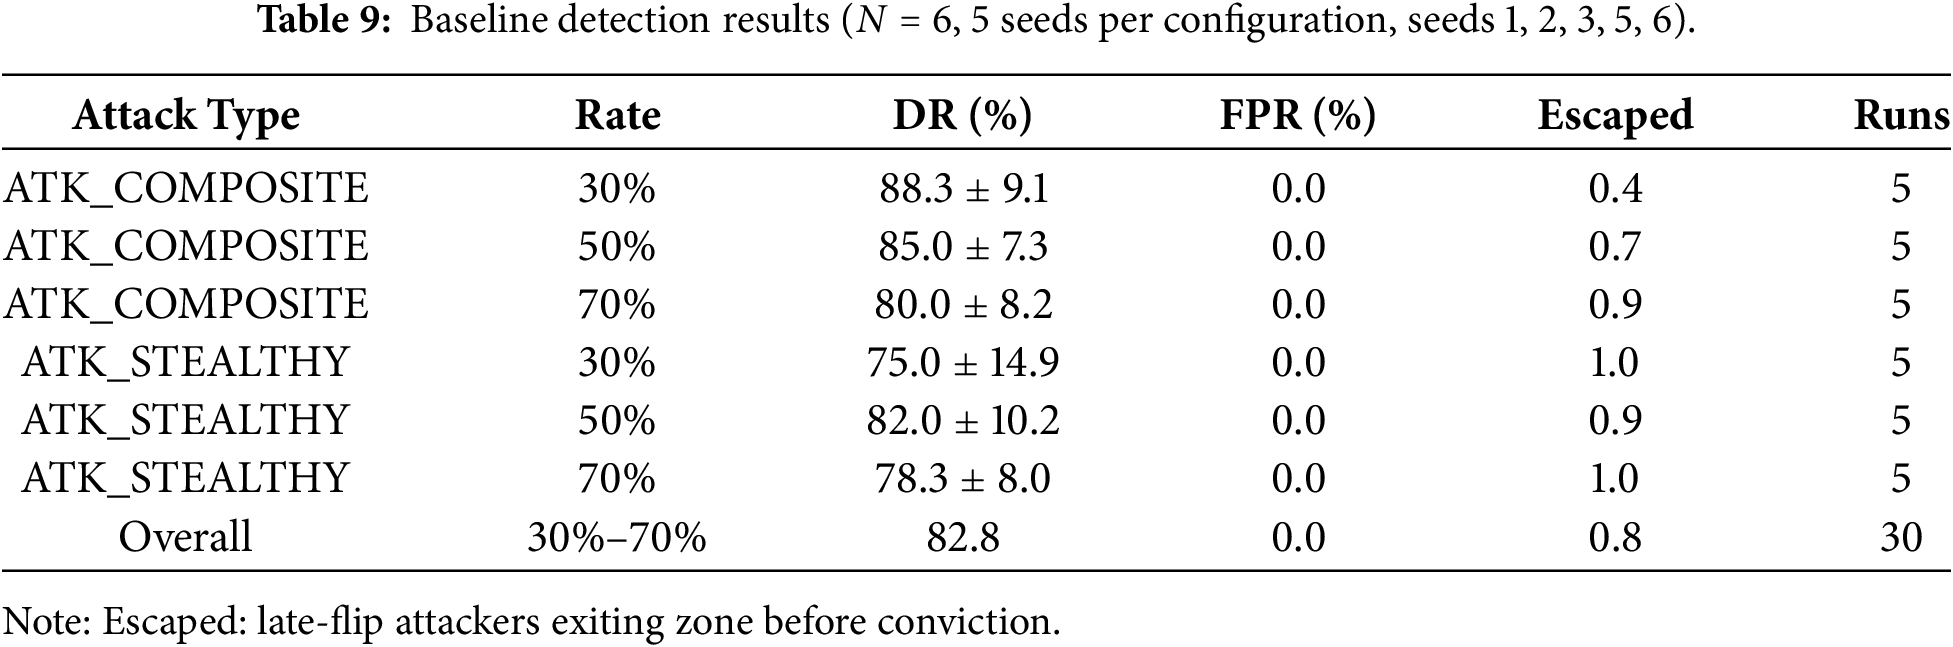
Honest vehicles: 100% earned both cooperative rewards. None incurred penalties.
Table 10 reports DR and FPR with
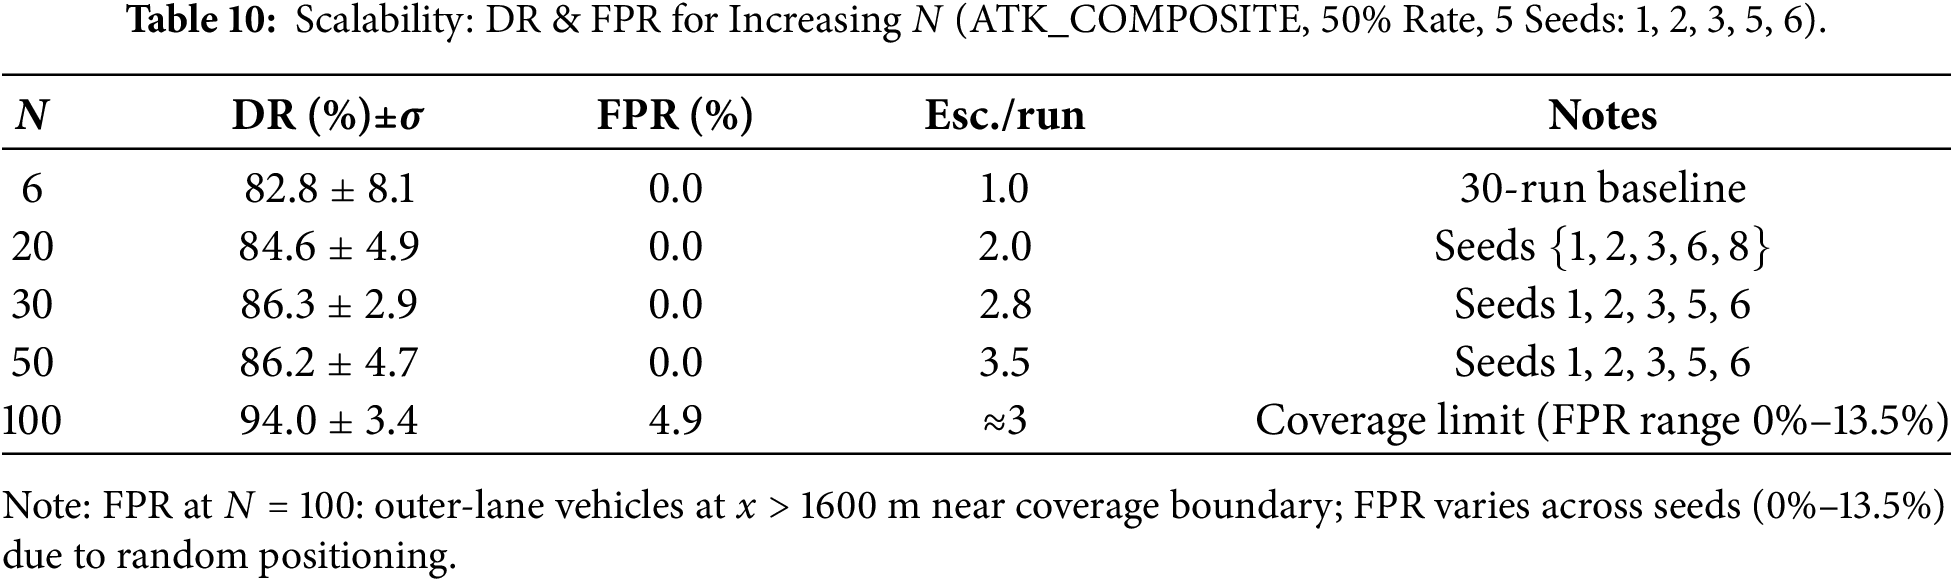
DR remains within [84%, 86%] for
Table 2 defines nine attack profiles. ATK_COMPOSITE and ATK_STEALTHY are reported above; ATK_RATIONAL is reported in Section 5.5 below. Table 11 completes coverage of the remaining six profiles, evaluated under the same protocol as above (
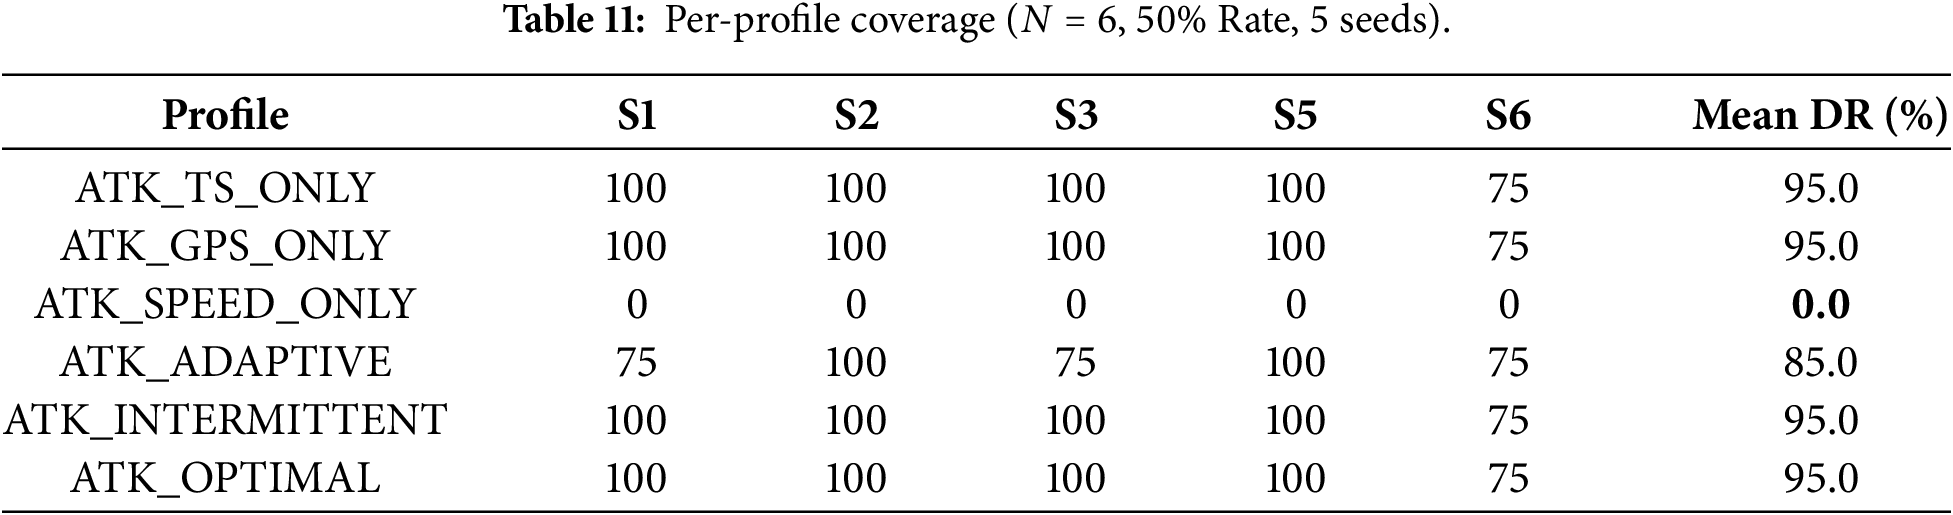
Combined with ATK_COMPOSITE, ATK_STEALTHY (Table 9), and ATK_RATIONAL (reported in Section 5.5 below), all nine profiles defined in Table 2 are evaluated. Two results merit discussion beyond the aggregate numbers. ATK_SPEED_ONLY scores DR
5.5 Mechanism Design Evaluation
Table 12 and Fig. 4 evaluate incentive compatibility against ATK_RATIONAL adversaries with
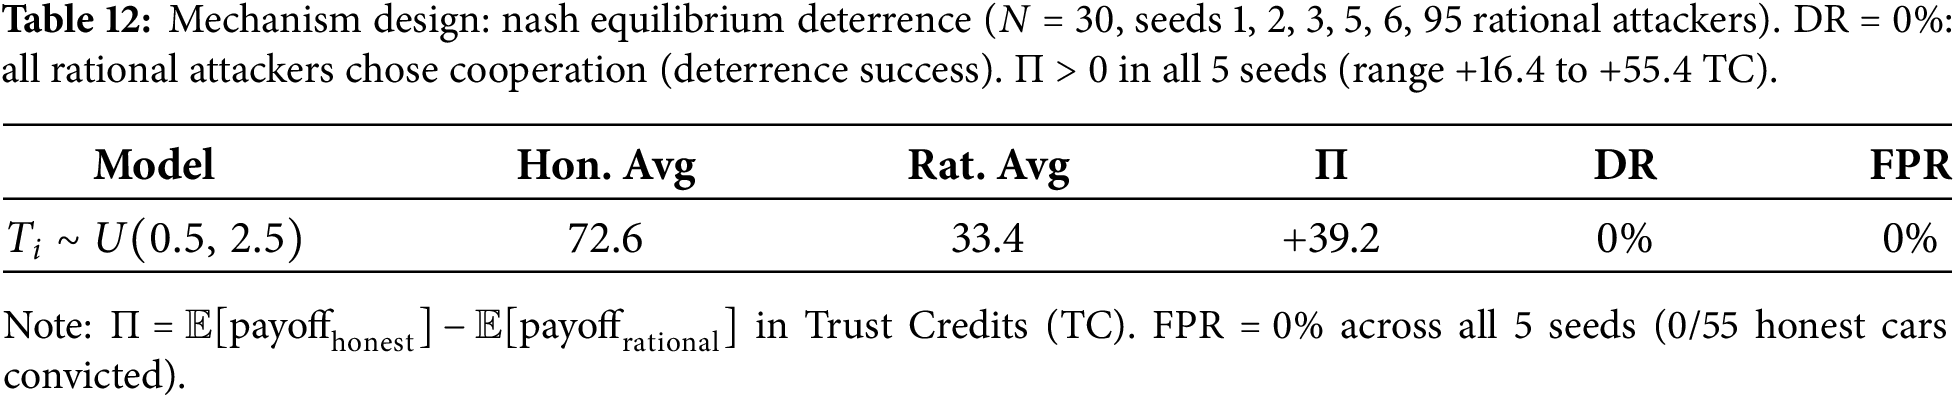
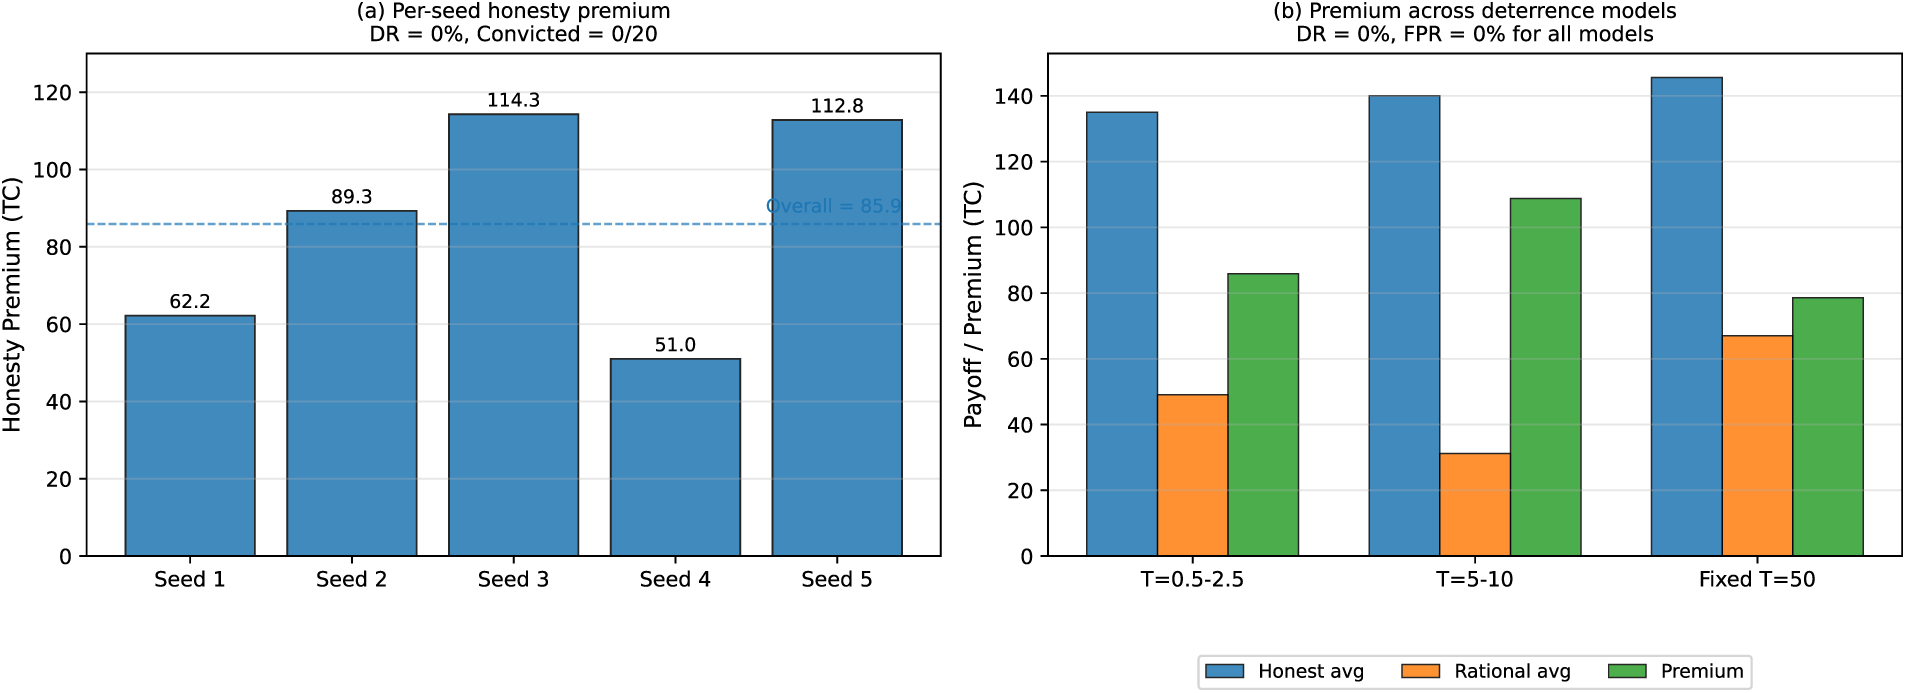
Figure 4: (a) Per-seed payoff of ATK_RATIONAL (N = 30): honesty consistently wins across all 5 seeds. (b) Honesty premium
Table 13 presents the five-arm ablation (
Figs. 5 and 6 visualize these results per seed and as summary bars, respectively.
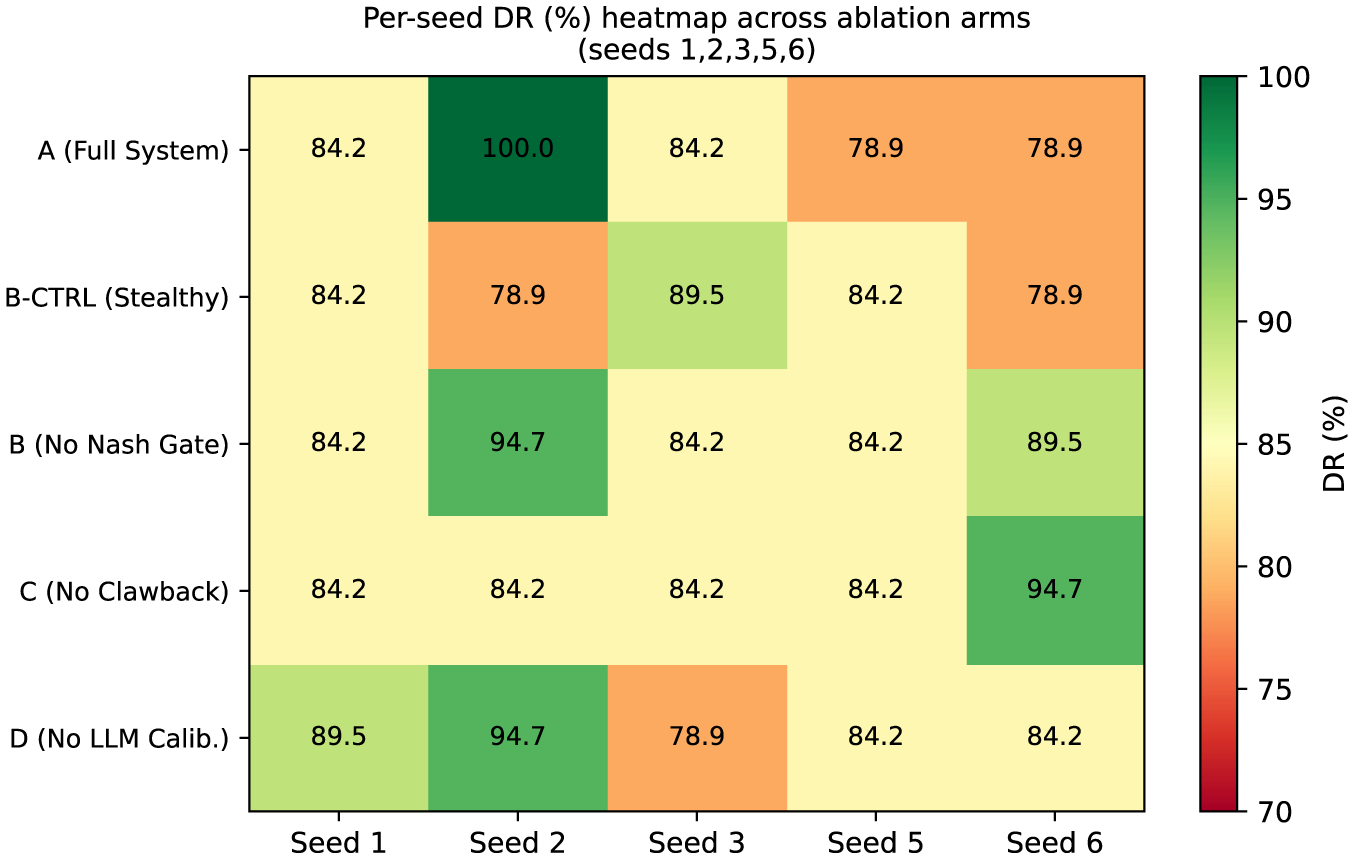
Figure 5: Per-seed DR heatmap across ablation arms (seeds 1, 2, 3, 5, 6).
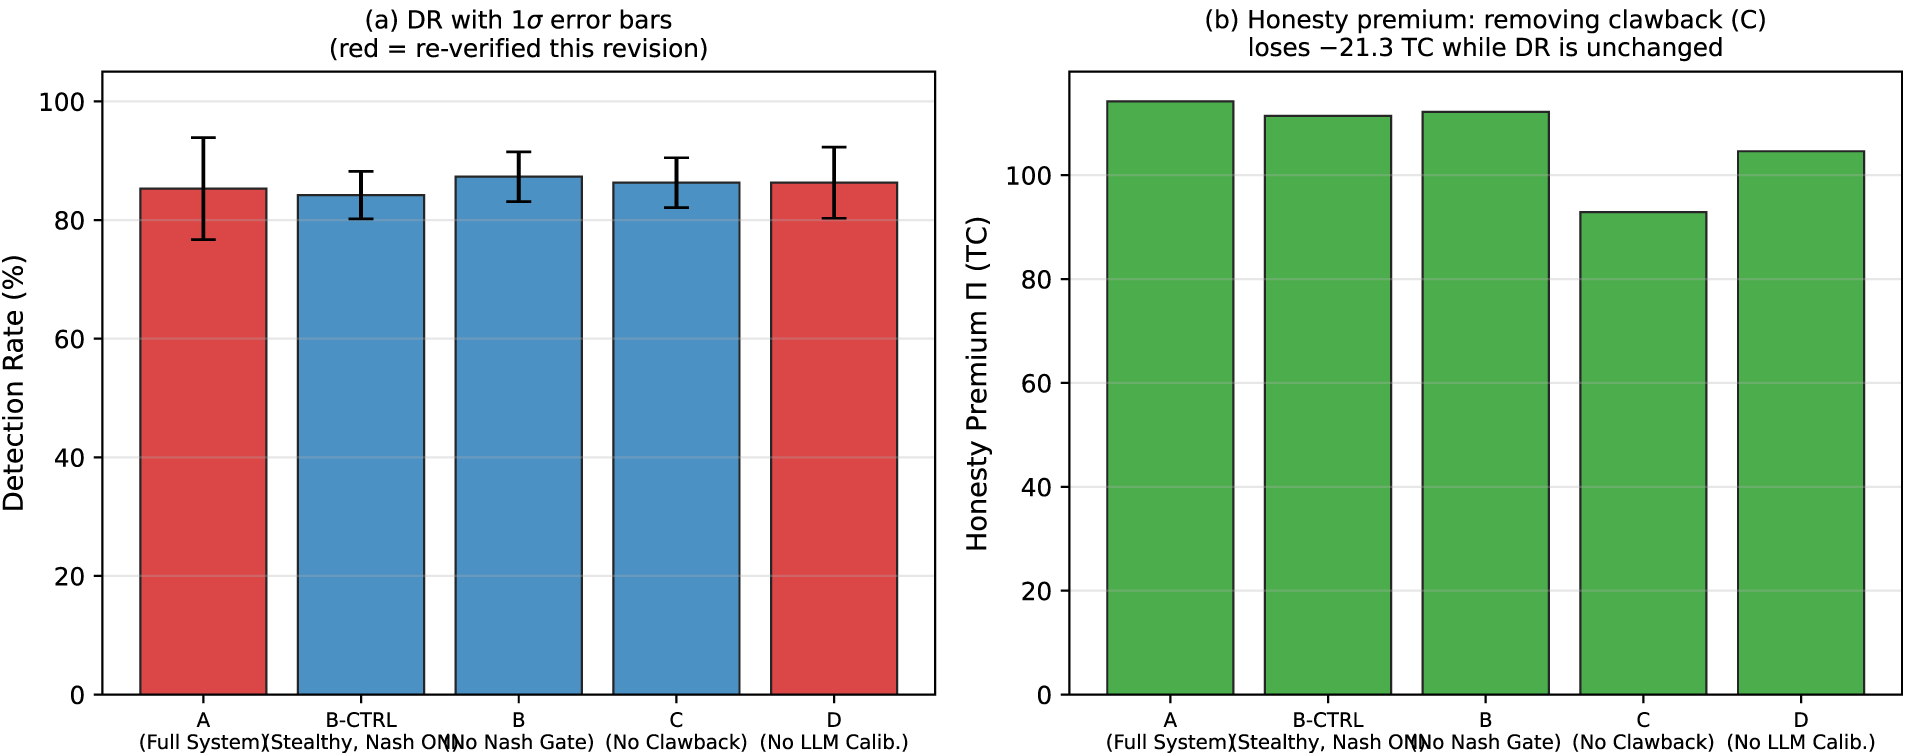
Figure 6: Ablation results. (a) DR with 1
Finding 1 (Nash gate trade-off). B-CTRL vs. B:
Finding 2 (Orthogonality of detection and deterrence). A vs. C: DR statistically unchanged (
Finding 3 (LLM calibration contribution): not measurable, investigated directly. A vs. D:
5.7 Cloud Calibration Analysis
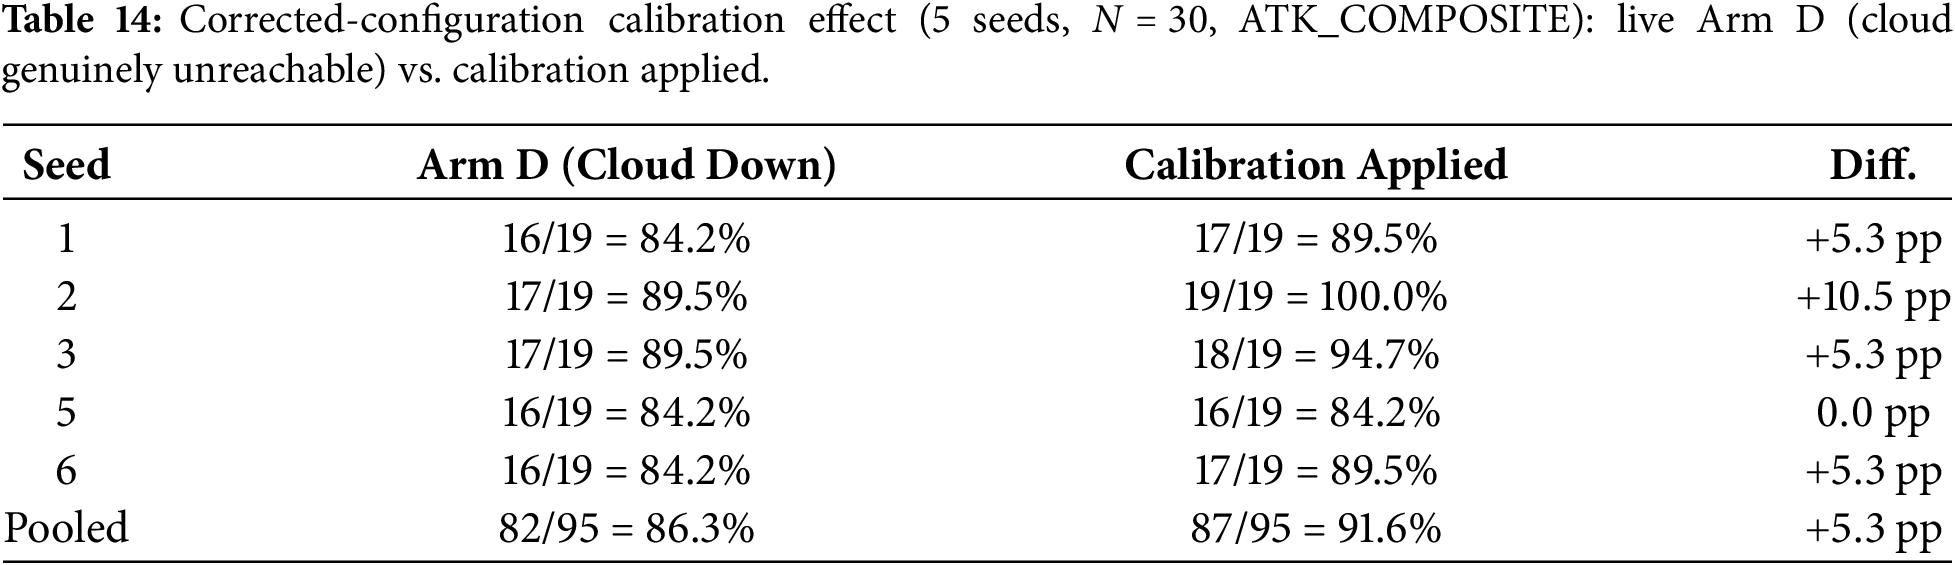
This section reports findings across three distinct configurations, which we name explicitly to avoid conflating them: (i) the originally-evaluated configuration used throughout the manuscript prior to this revision; (ii) the infrastructure-corrected configuration, identical to (i) except for fixing two infrastructure faults (an Ollama port misconfiguration and a GPU-contention timeout) that had prevented the cloud from being reliably reached at all; and (iii) the implementation-corrected configuration, identical to (ii) except for fixing a learning-rate coefficient and a batch-rate floor described below. Arms A/D in Table 13 use configuration (ii); the result in Table 14 uses configuration (iii). We first evaluate calibration under configuration (ii) and find no measurable effect; investigating why leads us to configuration (iii), which produces a real, positive effect. The two tables report different configurations and are not directly comparable row-for-row; we flag this explicitly to avoid the two similarly-scaled percentages being read as competing measurements of the same quantity.
In preparing this revision we discovered that the LLM calibration layer had two infrastructure faults in the original data-collection campaign: a port misconfiguration in the Ollama connection, and GPU contention on the shared inference server pushing real calibration latency past the pipeline’s 25-s timeout. Both were resolved, and Arms A and D were independently re-collected (Table 13) on the corrected configuration.
The resulting difference between arms was not statistically significant. We pursued a second, more decisive line of evidence: a counterfactual replay using 3271 already-logged real telemetry packets with real per-model detector outputs and real ground-truth labels, recomputing detection outcomes under three weight vectors applied to the identical packets—eliminating simulation randomness from the comparison entirely. The three vectors were the configured baseline (
We traced why this held even when the LLM identified the attack correctly. Within each 90 s run, the LLM fired several times via Triggers F and G and identified timestamp replay as the dominant signal with high confidence (0.85–0.95) in every round of every seed, with no instability. A sweep of the weight-delta magnitude on the same real packet data showed the per-round clamp (
5.7.1 A Second, Deeper Root Cause
Investigating further, we found the weight-delta clamp was not the only limiting factor: the edge server’s weight-update rule,
applies a learning-rate coefficient
5.7.2 Corrected-Configuration Result
Under the corrected configuration, full 5-seed evaluation (identical protocol:
Fig. 7 visualizes these results per seed and as the pooled difference.
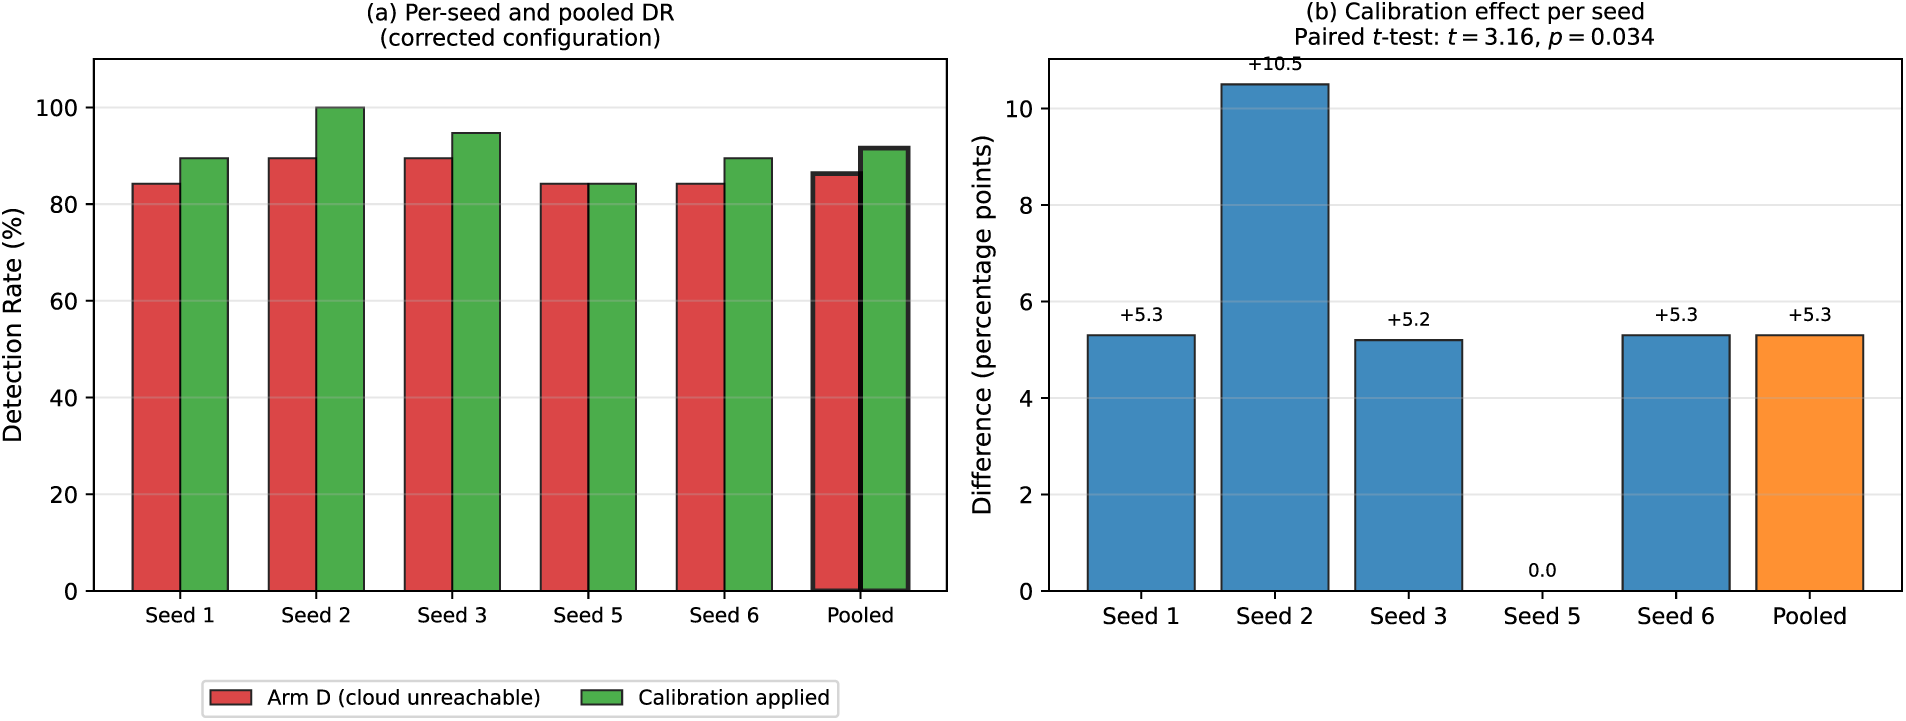
Figure 7: Corrected-configuration calibration effect. (a) Detection rate per seed and pooled, live Arm D (cloud unreachable) vs. calibration applied. (b) Per-seed difference; the effect is positive in 4 of 5 seeds, with one seed showing no difference (paired
The pooled difference (86.3% vs. 91.6%,
We regard both findings in this section as legitimate and worth reporting together rather than presenting only the more favorable one: under the originally-evaluated configuration, LLM calibration’s contribution to detection rate was not measurable, for the specific and now-understood reason that the learning-rate coefficient silently suppressed nearly all of the LLM’s recommended adjustment; under the corrected configuration, the same mechanism, receiving the same class of recommendations from the same model, produces a real, statistically significant, and mechanistically traceable improvement. This does not affect Tables 9–12, which do not depend on calibration’s marginal detection-rate contribution. We additionally observed that LLM identification is not uniformly reliable across attack profiles—consistently correct on ATK_COMPOSITE and appropriately abstaining on the known ATK_SPEED_ONLY blindspot (Section 5.4), but inconsistent within a single run on ATK_GPS_ONLY, which we traced to small calibration batch sizes producing statistically noisy separability estimates. The live, cloud-genuinely-down Arm D re-collection under the corrected configuration reported above confirms the sham-control estimate; a related, still-open prompt-staleness issue (the cloud is not informed of the edge’s live weight state between rounds) is reported in Section 7.
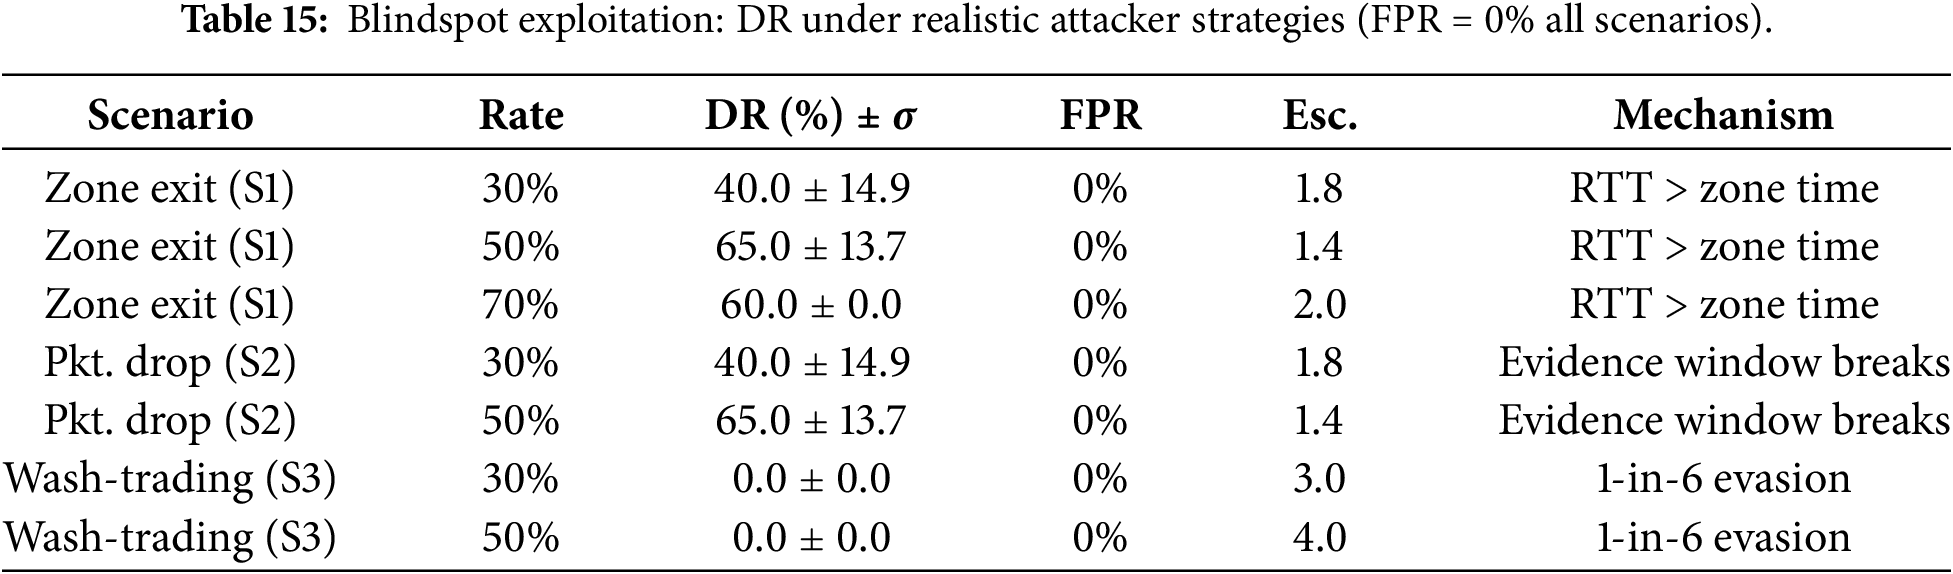
5.8 Blindspot Exploitation Analysis
Fig. 8 visualizes DR under the three scenarios above.
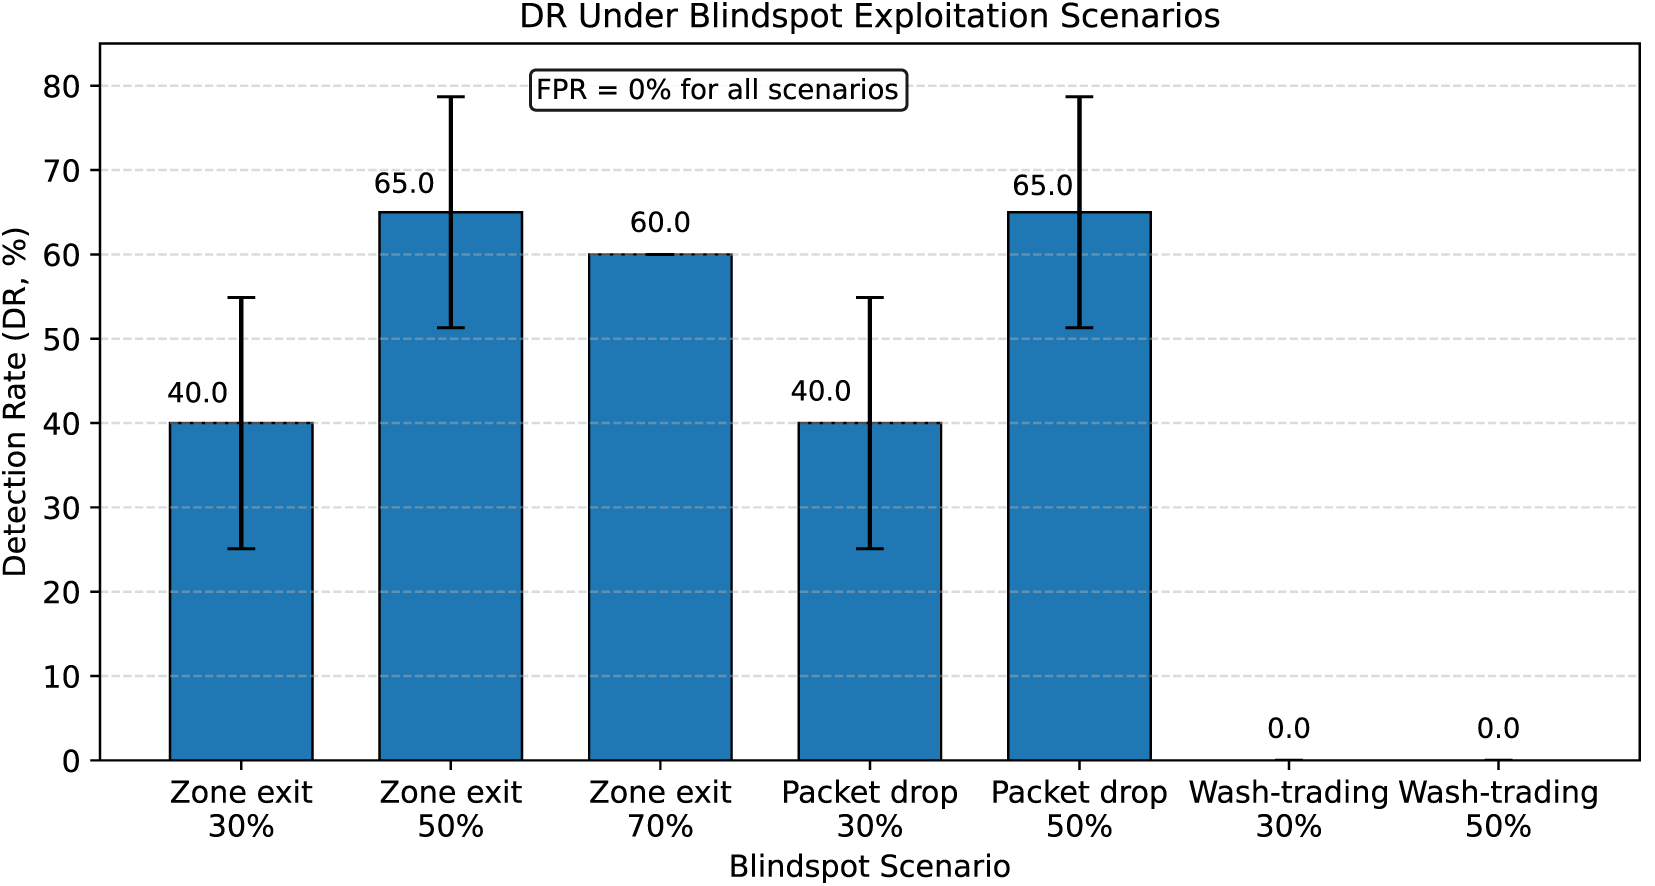
Figure 8: DR under three blindspot scenarios. FPR
Zone exit, packet drop, and wash-trading represent deployment limitations with known root causes; each maps to a future architectural extension. Wash-trading is self-limiting economically: effective per-packet gain is
FPR guarantee. We report an empirical, assumption-free false-positive bound: zero false positives were observed across 1584 honest phase-3 instances (Section 3, Empirical Result 3.3), yielding a one-sided 95% Clopper–Pearson upper bound of 0.19% per instance. This result does not depend on any distributional assumption about honest suspicion scores. Even a 2% FPR would improperly disenfranchise dozens of vehicles per hour at highway density; the observed zero-exceedance result and its associated confidence bound make this risk operationally small at the scale tested (
Detection vs. deterrence. The Nash gate trades 3.1 pp of DR to preserve FPR
LLM calibration: a corrected implementation fault and a directly-evidenced positive result. Under the originally-evaluated configuration, both a full simulation comparison and a decisive counterfactual replay on real telemetry (Section 5.7) showed no measurable contribution to detection outcomes on the tested attack profile. Investigating why, we identified a learning-rate implementation fault that had silently suppressed nearly all of the LLM’s recommended weight adjustments throughout that evaluation. Under the corrected configuration, the same mechanism, receiving the same class of recommendations, produces a statistically significant detection-rate improvement, confirmed with a live cloud-unreachable Arm D control (
Limitations. The valid operating range is
Multi-UAV sectorisation. At
Dynamic threshold adaptation. Wash-trading (1 attack in 6 packets) completely evades detection. Per-vehicle adaptive thresholds would detect slow-rate anomalies against each vehicle’s own baseline.
Attacker model enhancements. Lump-sum temptation, collusion attacks, and ML-based calibration poisoning merit further investigation.
Prompt staleness. We identified that the cloud is not informed of the edge’s live weight state between calibration rounds, relying instead on static prompt text; correcting this requires the bridge to relay the edge’s current weights to the cloud, a larger data-flow change deferred to future work.
Deployment pathway. Coupling with ETSI TS 103 759 [5] reporting would link to the European C-ITS trust infrastructure.
We proposed a hierarchical framework for C-V2X combining misbehaviour detection with economic deterrence. The architecture integrates four layers—real-time per-packet edge scoring, asynchronous cloud-assisted ensemble calibration, game-theoretic conviction, and ledger-based payoff tracking (Section 3.7)—each contributing a distinct mechanism rather than a single monolithic detector. Evaluated on NS3 with 3GPP Rel-18 5G NR channels across all nine attack profiles defined in Table 2, the system achieves DR
The central methodological contribution is not detection accuracy alone but demonstrated incentive compatibility: 95 rational attackers (
These results come with real limitations, stated plainly rather than deferred to a single paragraph. Validation is simulation-only; real vehicular trajectory replay and hardware-in-the-loop testing are the necessary next steps before any deployment claim (Section 6). The detection ensemble has an identified blindspot against pure low-magnitude speed deviation (Section 5.4) and against wash-trading style evasion (Table 15); both are named explicitly rather than hidden inside an aggregate metric. Collusion, Sybil identity attacks, and calibration-pipeline poisoning are out of scope for this study (Section 3.2) and remain open problems for this system class generally, not weaknesses unique to our design.
Beyond
Acknowledgement: Not applicable.
Funding Statement: The authors received no specific funding for this study.
Author Contributions: Conceptualization, Anil Carie, Sanjeev Kumar Makala, Awadhesh Dixit and Shaik Teena; methodology and software, Anil Carie, Sanjeev Kumar Makala, Awadhesh Dixit and Shaik Teena; formal analysis and investigation, Anil Carie, Sanjeev Kumar Makala, Awadhesh Dixit and Shaik Teena; writing—original draft preparation, Anil Carie, Sanjeev Kumar Makala, Awadhesh Dixit, Shaik Teena, Satish Anamalamudi, Pandu Sowkuntla and Bhaskar Marapelli; writing—review and editing, Anil Carie, Sanjeev Kumar Makala, Awadhesh Dixit, Shaik Teena, Satish Anamalamudi, Pandu Sowkuntla and Bhaskar Marapelli; supervision, Satish Anamalamudi, Pandu Sowkuntla and Bhaskar Marapelli. All authors reviewed and approved the final version of the manuscript.
Availability of Data and Materials: All NS-3 simulation scripts, Python edge/bridge server source code, and configuration files used in this study are publicly available at: https://github.com/carieanil1204/v2x-hierarchical-trust. The repository includes unified_v81_adaptive.cc (NS-3 C++), edge_ai_server_v85_adaptive.py, edge_cloud_bridge_v6_triggers_FG.py, experiment_realistic.conf, and analysis scripts to reproduce all reported tables from raw PAYOFF log output. The cloud LLM uses llama3:8b via Ollama (open-source, https://ollama.com). No proprietary software or datasets are required.
Ethics Approval: Not applicable.
Conflicts of Interest: The authors declare that no conflicts of interest.
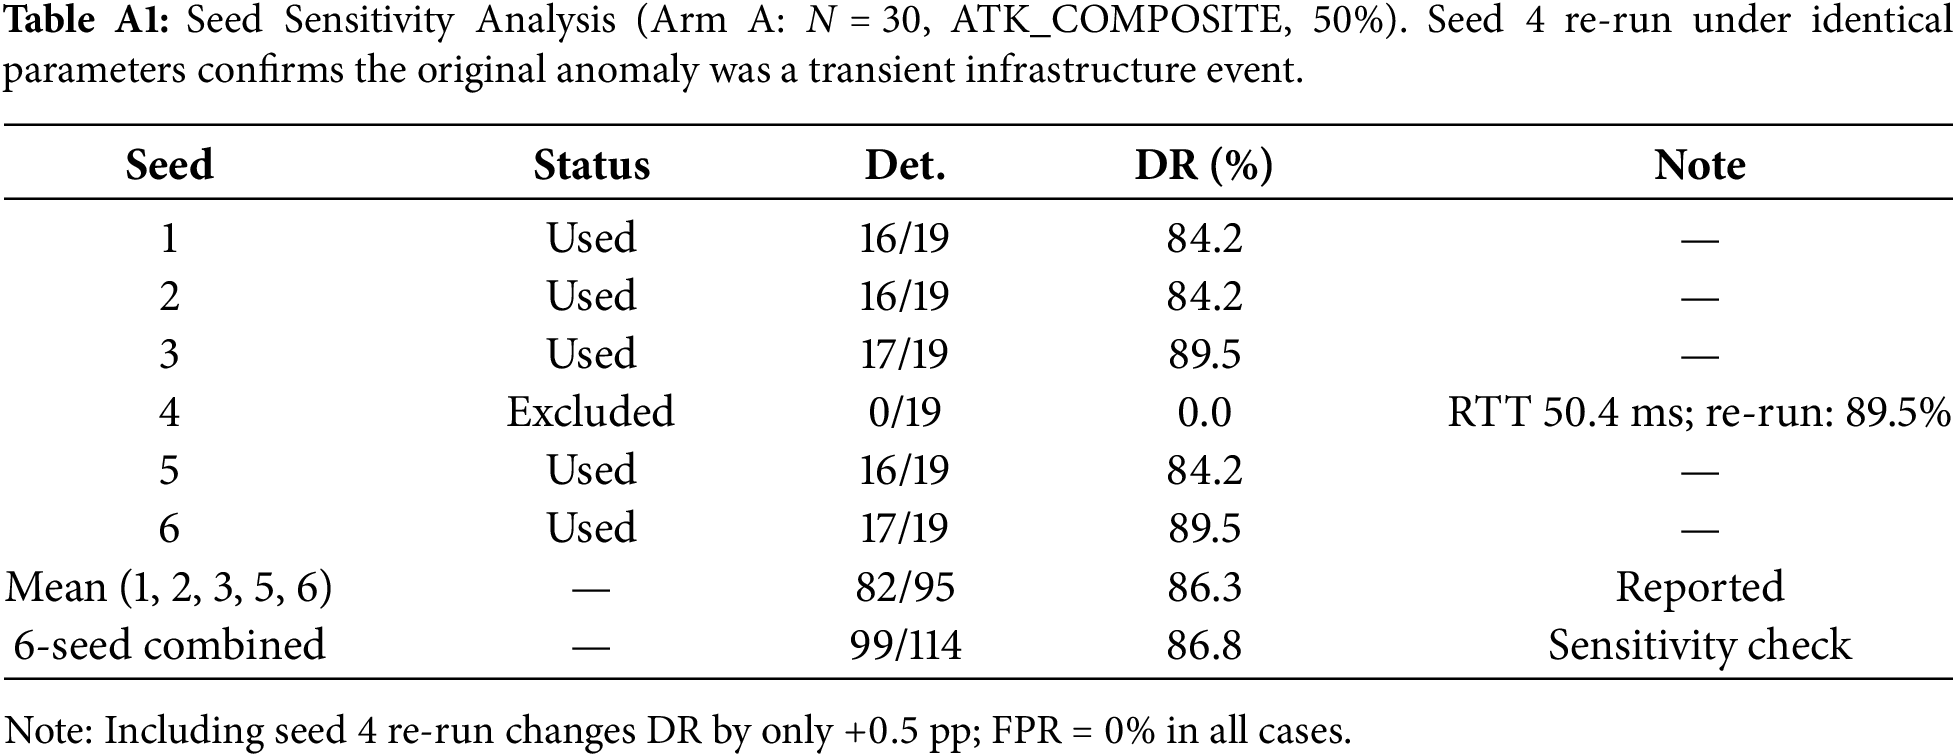
Appendix A Seed Exclusion Detail
All results in Section 5 are the mean
Appendix B LLM Calibration Reproducibility Detail
This appendix specifies the cloud calibration mechanism precisely, transcribed directly from the released source (ai_cloud_llm_v84_adaptive.py) rather than reconstructed from memory.
Appendix B.1 Prompt Template
The cloud LLM is queried with the following prompt, populated per batch with Fisher separability scores and per-verdict-class summary statistics computed by the bridge:
You are a V2X network security analyst calibrating edge AI
detection weights.
The bridge has summarised vehicle telemetry from a road zone.
Vehicles are classified as SUSPICIOUS (WARN/BAN) or SAFE by the
edge AI.
FEATURE SEPARATION SCORES (Fisher F-score, higher = clearer attack
signal): Timestamp replay separation, GPS position freeze
separation, Speed anomaly separation, Heading freeze
separation, Max separation overall.
CURRENT EDGE AI WEIGHTS:
ATTACK TYPE GUIDE: ts_replay, gps_freeze, speed_attack,
heading_freeze, composite.
TASK: Identify the dominant attack type and recommend weight deltas
to improve future detection. Keep deltas small (max 0.04 per
weight).
Reply ONLY with valid JSON: attack_type_detected, confidence,
(
Appendix B.2 Response Validation
The system operates in a strict, no-fallback mode by explicit design (source comment, verbatim): “Cloud must return only Ollama-backed calibration output. If Ollama is unavailable, malformed, or returns bad JSON, return CALIBRATION_ERROR instead of any rule-based fallback.” No heuristic substitute is applied when the LLM path fails: a failed calibration round simply does not update the edge weights. JSON extraction is two-stage: a direct substring extraction between the first {and last} in the response, falling back to a regular-expression search if that fails to parse (handling cases where the model wraps its answer in markdown fences or adds surrounding prose).
Appendix B.3 Failure Handling
The implementation distinguishes five calibration-failure conditions, each returned as a specific CALIBRATION_ERROR reason: ollama_busy (a request already in flight; concurrent requests are dropped via an in-flight guard, not queued); bad_json (the incoming batch payload fails to parse); empty_batch (no vehicle summaries in the batch); ollama_bad_json (Ollama’s raw response contains no extractable JSON); and ollama_unavailable (the request raised an exception—timeout, connection refused, or other error). We note that ollama_unavailable is not a theoretical failure mode: it is precisely the mechanism we diagnosed and resolved during infrastructure verification for this revision (Section 5.7).
Appendix B.4 Applied Weight Deltas
When a calibration response passes validation, per-weight deltas are clamped to
References
1. TS 23.287. Architecture enhancements for 5G System (5GS) to support Vehicle-to-Everything (V2X) services (Release 18). Sophia Antipolis: 3rd Generation Partnership Project (3GPP); 2024. [Google Scholar]
2. Lu R, Zhang L, Ni J, Fang Y. 5G vehicle-to-everything services: gearing up for security and privacy. Proc IEEE. 2019;108(2):373–89. doi:10.1109/JPROC.2019.2948302. [Google Scholar] [CrossRef]
3. ETSI TR 103 415. Intelligent transport systems (ITS); security; pre-standardization study on pseudonym change management. Valbonne, France: European Telecommunications Standards Institute (ETSI); 2018. 415 p. [Google Scholar]
4. ETSI TR 103 460. Intelligent transport systems (ITS); security; pre-standardization study on misbehaviour detection. Valbonne, France: European Telecommunications Standards Institute (ETSI); 2020. [Google Scholar]
5. ETSI TS 103 759. Intelligent transport systems (ITS); security; misbehaviour reporting service. Valbonne, France: European Telecommunications Standards Institute (ETSI); 2023. [Google Scholar]
6. Boualouache A, Engel T. A survey on machine learning-based misbehavior detection systems for 5G and beyond vehicular networks. IEEE Commun Surv Tutor. 2023;25(2):1128–72. doi:10.1109/COMST.2023.3236448. [Google Scholar] [CrossRef]
7. Kamel J, Wolf M, Van Der Hei RW, Kaiser A, Urien P, Kargl F. Veremi extension: a dataset for comparable evaluation of misbehavior detection in vanets. In: Proceedings of the ICC 2020—2020 IEEE International Conference on Communications (ICC); 2020 Jun 7–11; Virtual. p. 1–6. doi:10.1109/ICC40277.2020.9149132. [Google Scholar] [CrossRef]
8. Myerson RB. Optimal auction design. Math Oper Res. 1981;6(1):58–73. doi:10.1287/moor.6.1.58. [Google Scholar] [CrossRef]
9. Bissmeyer N. Misbehavior detection and attacker identification in vehicular ad-hoc networks. Darmstadt, Germany: Technische Universität Darmstadt; 2014. doi:10.26083/tuprints-00004257. [Google Scholar] [CrossRef]
10. Amanullah MA, Loke SW, Baruwal Chhetri M, Doss R. A taxonomy and analysis of misbehaviour detection in cooperative intelligent transport systems: a systematic review. ACM Comput Surv. 2023;56(1):1–38. doi:10.1145/3596598. [Google Scholar] [CrossRef]
11. So S, Petit J, Starobinski D. Physical layer plausibility checks for misbehavior detection in V2X networks. In: Proceedings of the 12th Conference on Security and Privacy in Wireless and Mobile Networks; 2019 May 15–17; Miami, Florida. p. 84–93. doi:10.1145/3317549.3323406. [Google Scholar] [CrossRef]
12. Van Der Heijden RW, Lukaseder T, Kargl F. Veremi: a dataset for comparable evaluation of misbehavior detection in vanets. In: International Conference on Security and Privacy in Communication Systems. Berlin/Heidelberg, Germany: Springer; 2018. p. 318–37. doi:10.1007/978-3-030-01701-9_18. [Google Scholar] [CrossRef]
13. Kristianto E, Lin PC, Hwang RH. Misbehavior detection system with semi-supervised federated learning. Veh Commun. 2023;41:100597. doi:10.1016/j.vehcom.2023.100597. [Google Scholar] [CrossRef]
14. Almalki S, Sheldon FT. An online misbehavior detection model for intelligent transportation systems. ScienceOpen Posters. 2022. doi:10.14293/S2199-1006.1.SOR-.PP0OK2W.v1. [Google Scholar] [CrossRef]
15. Fatih Yuce M, Ali Erturk M, Ali Aydin M. Misbehavior detection with collective perception in V2X networks: a survey. Trans Emerg Telecommun Technol. 2025;36(10):e70267. doi:10.1002/ett.70267. [Google Scholar] [CrossRef]
16. Yoshizawa T, Singelée D, Muehlberg JT, Delbruel S, Taherkordi A, Hughes D, et al. A survey of security and privacy issues in V2X communication systems. ACM Comput Surv. 2023;55(9):1–36. doi:10.1145/3558052. [Google Scholar] [CrossRef]
17. Friha O, Ferrag MA, Kantarci B, Cakmak B, Ozgun A, Ghoualmi-Zine N. Llm-based edge intelligence: a comprehensive survey on architectures, applications, security and trustworthiness. IEEE Open J Commun Soc. 2024;5:5799–856. doi:10.1109/OJCOMS.2024.3456549. [Google Scholar] [CrossRef]
18. Liu C, Zhao J. Resource allocation in large language model integrated 6G vehicular networks. arXiv:2403.19016. 2024. doi:10.48550/arXiv.2403.19016. [Google Scholar] [CrossRef]
19. Ahmad F, Kurugollu F, Kerrache CA, Sezer S, Liu L. Notrino: a novel hybrid trust management scheme for internet-of-vehicles. IEEE Trans Veh Technol. 2021;70(9):9244–57. doi:10.1109/TVT.2021.3049189. [Google Scholar] [CrossRef]
20. Chen J, Li Y, Deng J, Qin B, He C, Huang Q, et al. Design of a dynamic trust management and defense decision system for shared vehicle data based on blockchain and deep reinforcement learning. Sci Rep. 2025;15(1):26662. doi:10.1038/s41598-025-11511-y. [Google Scholar] [CrossRef]
21. Han H, Zhang M, Xu Z, Dong X, Wang Z. Decentralized trust management and incentive mechanisms for secure information sharing in VANET. IEEE Access. 2024;12:124414–27. doi:10.1109/ACCESS.2024.3453368. [Google Scholar] [CrossRef]
22. Zhao J, Huang F, Liao L, Zhang Q. Blockchain-based trust management model for vehicular ad hoc networks. IEEE Internet Things J. 2024;11(5):8118–32. doi:10.1109/JIOT.2023.3318597. [Google Scholar] [CrossRef]
23. Noor-A-Rahim M, Liu Z, Lee H, Khyam MO, He J, Pesch D, et al. 6G for vehicle-to-everything (V2X) communications: enabling technologies, challenges, and opportunities. Proc IEEE. 2022;110(6):712–34. doi:10.1109/JPROC.2022.3173031. [Google Scholar] [CrossRef]
24. Sedar R, Kalalas C, Vázquez-Gallego F, Alonso L, Alonso-Zarate J. A comprehensive survey of V2X cybersecurity mechanisms and future research paths. IEEE Open J Commun Soc. 2023;4:325–91. doi:10.1109/OJCOMS.2023.3239115. [Google Scholar] [CrossRef]
25. Sun Z, Liu Y, Wang J, Li G, Anil C, Li K, et al. Applications of game theory in vehicular networks: a survey. IEEE Commun Surv Tutor. 2021;23(4):2660–710. doi:10.1109/COMST.2021.3108466. [Google Scholar] [CrossRef]
26. Mehdi MM, Raza I, Hussain SA. A game theory based trust model for vehicular ad hoc networks (VANETs). Comput Netw. 2017;121:152–72. doi:10.1016/j.comnet.2017.04.024. [Google Scholar] [CrossRef]
27. Chouikhi S, Khoukhi L, Ayed S, Lemercier M. An efficient reputation management model based on game theory for vehicular networks. In: Proceedings of the 2020 IEEE 45th Conference on Local Computer Networks (LCN); 2020 Nov 16–19; Sydney, Australia. p. 413–6. doi:10.1109/LCN48667.2020.9314791. [Google Scholar] [CrossRef]
28. AlSaqabi Y, Krishnamachari B. Incentivizing private data sharing in vehicular networks: a game-theoretic approach. arXiv:2309.12598. 2023. doi:10.1109/VTC2023-Fall60731.2023.10333865. [Google Scholar] [CrossRef]
29. Casella G, Berger R. Statistical inference. Boca Raton, FL, USA: CRC Press; 2024. doi:10.1201/9781003456285. [Google Scholar] [CrossRef]
30. Avenhaus R, von Stengel B, Zamir S. Inspection games. In: Aumann RJ, Hart S, editors. Handbook of game theory with economic applications. Amsterdam, The Netherlands: Elsevier; 2002. p. 1947–87. doi:10.1016/S1574-0005(02)03014-X. [Google Scholar] [CrossRef]
31. Nash JF Jr. Equilibrium points in n-person games. Proc Natl Acad Sci. 1950;36(1):48–9. doi:10.1073/pnas.36.1.48. [Google Scholar] [CrossRef]
32. Neyman J, Pearson ES. On the problem of the most efficient tests of statistical hypotheses. Philos Trans R Soc Lond Ser A Contain Pap A Math or Phys Character. 1933;231(694–706):289–337. doi:10.1098/rsta.1933.0009. [Google Scholar] [CrossRef]
33. TS EE 123 287. Architecture enhancements for 5G system (5GS) to support vehicle-to-everything (V2X) Services (3GPP TS 23.287 version 16.4. 0 release 16). Sophia Antipolis, France: ETSI; 2020. [Google Scholar]
Cite This Article
 Copyright © 2026 The Author(s). Published by Tech Science Press.
This work is licensed under a Creative Commons Attribution 4.0 International License , which permits unrestricted use, distribution, and reproduction in any medium, provided the original work is properly cited.
 Downloads
 Citation Tools
