
 Submit a Paper
 Propose a Special lssue
 Open Access
ARTICLE
Multiple Data Augmentation Strategy for Enhancing the Performance of YOLOv7 Object Detection Algorithm
Department of Electrical & Computer Engineering and Computer Science, Jackson State University, Jackson, 39217, USA
* Corresponding Author: Khalid H. Abed. Email:
Journal on Artificial Intelligence 2023, 5, 15-30. https://doi.org/10.32604/jai.2023.041341
Received 19 April 2023; Accepted 22 May 2023; Issue published 08 August 2023
 View Full Text
 Download PDF
Abstract
The object detection technique depends on various methods for duplicating the dataset without adding more images. Data augmentation is a popular method that assists deep neural networks in achieving better generalization performance and can be seen as a type of implicit regularization. This method is recommended in the case where the amount of high-quality data is limited, and gaining new examples is costly and time-consuming. In this paper, we trained YOLOv7 with a dataset that is part of the Open Images dataset that has 8,600 images with four classes (Car, Bus, Motorcycle, and Person). We used five different data augmentations techniques for duplicates and improvement of our dataset. The performance of the object detection algorithm was compared when using the proposed augmented dataset with a combination of two and three types of data augmentation with the result of the original data. The evaluation result for the augmented data gives a promising result for every object, and every kind of data augmentation gives a different improvement. The mAP@.5 of all classes was 76%, and F1-score was 74%. The proposed method increased the mAP@.5 value by +13% and F1-score by +10% for all objects.Keywords
Identifying objects in images and videos is a simple task for humans. It is easy for humans to perceive and recognize items in their surrounding area during the day. Through the use of Computer Vision and Artificial Intelligence (AI), computers possess the capability to recognize and identify objects. Scientists have used AI in a variety of daily life applications, including self-driving cars, predictive analysis applications, object detections and facial identification and recognition technologies. Since object detection is one of the most significant topics of artificial intelligence, it has been an area of great interest to many in the field. Object detection involves two primary operations: classifying and locating. Implementing AI technology such as Convolutional Neural Networks (CNN) can make object detection more efficient and more accurate. Computer vision technology has been extensively implemented and is still being developed for many purposes, such as object recognition, motion tracking, and object identification. Detecting and monitoring the motion of objects is critical in computer vision. Various algorithms have been created to achieve this goal [1].
Data augmentation is a beneficial approach that allows us to expand our dataset without the need for extra images and the time-consuming labelling process. Applying data augmentation procedures, including cropping, horizontal and vertical flipping, modification of contrast, hue, saturation, brightness of images, and generating noise or blur is considered a standard method for training large neural networks [2]. Data augmentations techniques can generate a new image. The generated images with data augmentations are a copy of the same images with some changes to the content of the original images [3]. Data augmentation can be helpful in establishing an object recognition model for Self-Driving Cars [4]. Data augmentation techniques can expand the size of images and create new data instead of having to add more images to the dataset and label them. In addition, these techniques can aid in developing a reliable object detection model that can recognize objects under adverse weather conditions [5].
Object detection is one of the most fundamental and commonly employed techniques in computer vision. The aim of this task is to detect objects by drawing multiple bounding boxes around the objects within an image or video, which are very critical in various areas, including autonomous driving. These object detection algorithms can be separated into two classes: One-step algorithms and two-step algorithms. The most popular two-step algorithm is the Region-based Convolutional Neural Network (R-CNN); the R-CNN and its variants were created by Girshick [6,7]. R-CNN comprises two output layers: one contains the names of the classes, and the other holds the boxes for the predicted objects. On the other hand, the single step algorithms, such as Single Shout multiple Detection (SSD) [8] and the You Only Look Once (YOLO) algorithms [9–12] are developed by Redmond in 2015. One-step detection collects all the output results in a single layer. This output layer can be called a tensor too, storing the class names and the bounding boxes of the predicted objects. The one-step algorithms work faster than the two-step algorithms and can detect either a single or multiple objects at the same time.
Today, the YOLO algorithm is a well-known one-step object detection algorithm. Due to its speed and accuracy, the YOLO is the top object detection algorithm. It was challenging to detect objects in fog, rain, and snow, as well as during the night-time. Our latest research revealed the method of detecting objects at night-time and bad weather conditions [13]. This study aims to identify the most suitable data augmentations and combine them to form a dataset, which includes the best data augmentation for our work. This will enable us to duplicate the dataset, select the optimal data augmentations and improve the metrics model Mean Average Precision (mAP), Precision, and Recall for object detection. Our aim is to increase the accuracy of the Person’s object recognition. With its extra flexibility, the Person’s object is more sensitive than any other, making it hard to detect. To optimize the detection of all objects in our dataset, the YOLOv7 [14] has been implemented.
The rest of the paper is constructed as follows. In Section 2, we discuss the prior research method of relevant work. In Section 3, we present the proposed methodology. Section 4 presents the results, Section 5 points out the limitation scenarios, Section 6 provides discussion, and Section 7 is the conclusion.
2.1 Two-Step Objects Detection Algorithms
The two-stage algorithms are accurate algorithms, but they are also more complicated and have a slow speed. It mainly includes two steps. In the first step, all Regions of Interest (RoIs) are generated. In the second step, the algorithm performs regional classification and location on the RoIs generated in the previous step. The R-CNN algorithm is an example of a two-step algorithm created in 2015. The R-CNN algorithm uses the selective search algorithm to draw the bounding boxes around the generated regions based on the segmentation of each region [15]. The R-CNN uses 2000 CNN per one image. They improved the R-CNN algorithm through the release of Fast R-CNN and Faster R-CNN. Mask R-CNN [16] is another variant of R-CNN algorithms.
2.2 One-Step Objects Detection Algorithms
The two-step algorithms may be more accurate however, they do not have the same speed as the one-step algorithms. One-step algorithms have a special feature that offers exceptional speed, making it an attractive option. The YOLO algorithms series has become a widely used algorithm as a one-step algorithm for objects detection. It could lower the rate of missed detection and false detection, increase accuracy, and speed up the process. YOLO algorithms are highly recommended for real-time detection due to their velocity and reliability. YOLO comprises a single CNN that predicts multiple bounding boxes and the classes prediction for the bounding boxes. Redmond developed YOLOv1, YOLOv2 or YOLO9000 in 2015. Redmond’s team released YOLOv2 with Darknet-19, which is a special classifier for YOLO algorithms. The latest work for Redmond in 2018 was developing YOLOv3 with the Darknet-53. Bochkovskiy’s YOLOv4, released in 2020, with the CSP-Darknet-53 and has a distinct architecture compared to the previous version of YOLO algorithms. By integrating the MOSAIC data augmentation [13] into YOLOv4, Average Precision (AP) has increased to 43%. YOLOv7 significantly boosts both speed and accuracy. YOLOv7 has the higher accuracy value, with 56.8%. YOLOv7 outperforms YOLOR, YOLOX, Scaled YOLOv4. YOLOv7 was trained only on MS COCO dataset without using a pre-trained model [14].
Data augmentation is a key technique for increasing the accuracy of object detection datasets. Deep-learning models can reach a great level of accuracy in image recognition, but this requires a large amount of data to be present in the dataset. Data augmentation is a frequently employed technique to extend datasets and enhance the generalization capacity of a model by augmenting the number of training samples. Data augmentation is divided into two categories: geometrical data augmentations and photometric data augmentations. Geometric data augmentation involves transforming images by cropping, rotating, scaling, and translation. Photometric data augmentation is a process that can change the values of the image, such as contrast, sharpness, blurring, brightness, and color. Recent studies have implemented various data augmentation methods to double the size of images in a dataset [10–12].
In this work we implement photometric data augmentation strategies to improve YOLOv7-p5 metrics without the need to add extra images to the dataset. For this research, we have used a dataset from our earlier study [12], which is part of the Open Image dataset [17]. The hardware and software used in implementing this work included Ubuntu 20.04, Python 3.9, Core i7 11800H with 32 GB RAM, and RTX 3080 laptop GPU. Applying data augmentation techniques to duplicate the dataset images as decreasing or increasing the brightness of the images and adding blur or noise to the images. First, the training was performed with the original version of the dataset. After that, we applied data augmentation to increase the size of the dataset and evaluate the impact of these data augmentations on the evaluation dataset with YOLOv7 to improve the detection of all objects. Table 1 shows the four data augmentation techniques that were used in this work.
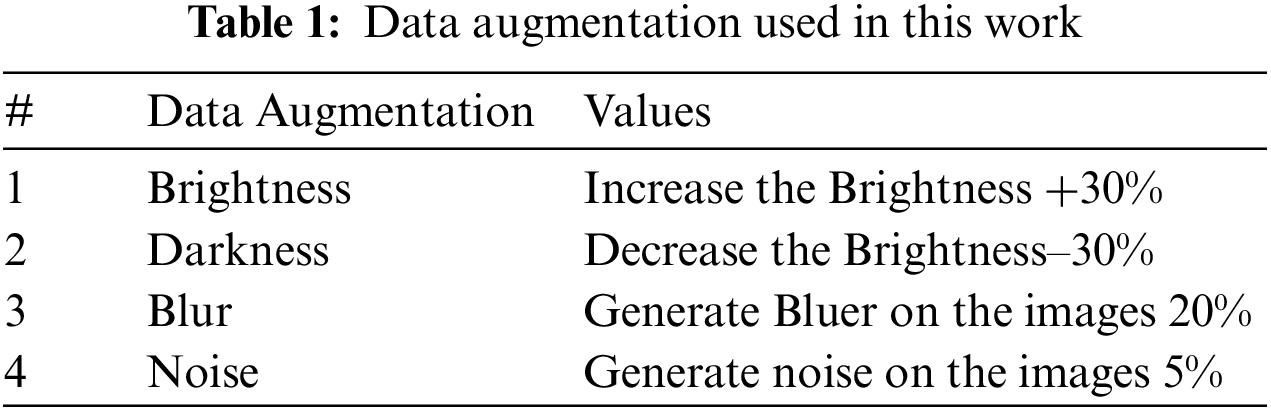
Table 1 indicates the data augmentations used in this work. The number of images for the training dataset (original dataset) was 8,600 with four classes (Car, Bus, Motorcycle, and Person). Using these kinds of data augmentations will duplicate the number of images. Although the content of the images differs, they contain the same objects. Lowering the brightness will generate an extra image with low light. The model will be more efficient in identifying objects during night-time or low light conditions, and increasing the light will also enhance the object detection model. By adding blur and noise into the generated images, it will provide extra features to the detection models to detect an object in bad weather, including snow, rain and foggy conditions. These models can be deployed to recognize objects for an autonomous car system, since it will help the car to identify objects during the night and in poor weather conditions. Fig. 1 presents the data augmentations techniques methods that we use in this work.
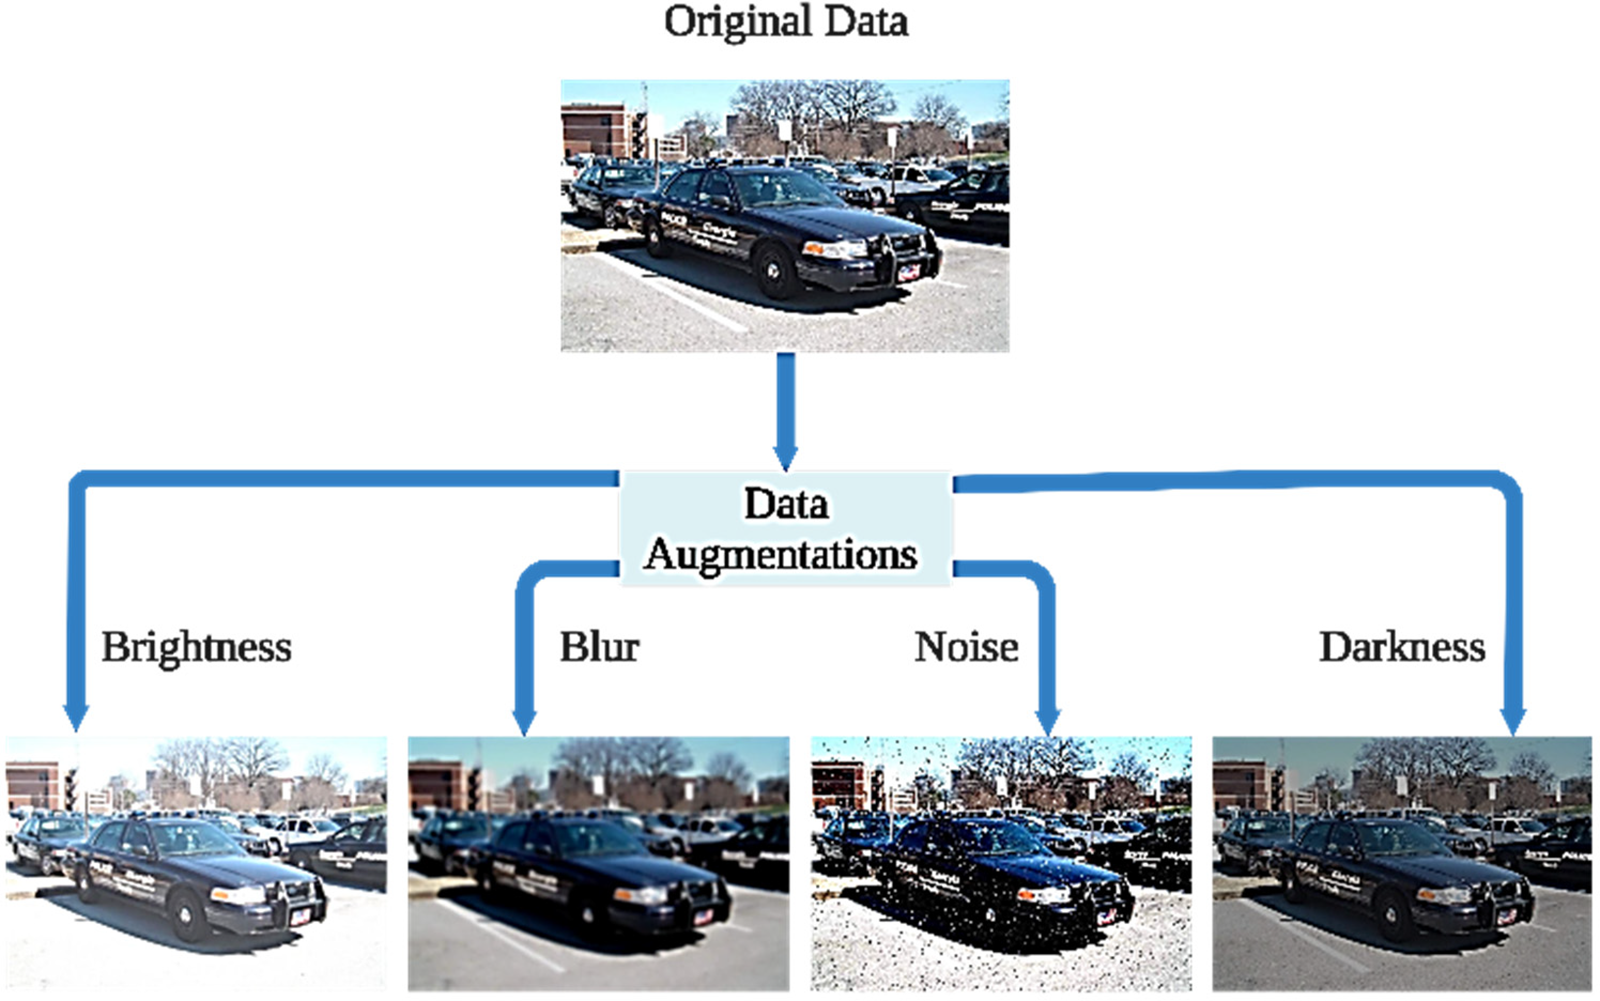
Figure 1: Data augmentation using brightness, blur, noise and darkness
The data augmentations were done using the user-friendly Roboflow website [18], which is optimized for image processing. Next, we will go through all the data augmentation methods and weigh the pros and cons to find the best one.
We started the training with the original dataset and then used a range of data augmentations, including increasing the brightness, decreasing the brightness, and adding blurring or noise. Applying data augmentation techniques to increase the size of the dataset without needing additional images can increase the model detection metrics. To duplicate the dataset, multiple data augmentation techniques were applied on the original dataset. Table 2 displays the five experiments we have done with the dataset, compared to the original dataset in this work.
This work began with the use of an original dataset, which was then manipulated in five distinct experiments. The original dataset has 8,600 images of four objects (Car, Bus, Motorcycle, and Person). The data from each experiment has been doubled through data augmentation techniques. In this work, a duplicated dataset was created for each experiment by combining different types of data augmentation, including brightness, darkness, blurring, and noise. The first four experiments Exp_1, Exp_2, Exp_3, and Exp_4 use combinations of two types of data augmentations, and the last experiment Exp_5 uses a combination of three types of data augmentations: noise + brightness + darkness.
We performed 70 training epochs with 8,600 images as a dataset. Epoch is a set of iterations. Eq. (1) has been used to calculate the iterations per epoch. The batch size is the number of images fed for every iteration, and a batch size with 16 images has been chosen in this work. To calculate the number of iterations per epoch, the total number of dataset images is divided by the batch size, which results in 538 iterations for every epoch. The objective of the F1-score calculation is to combine the precision and recall value to generate new hybrid metrics that represent the precision and recall in one metric called F1-score. The F1-score has been calculated using (2).
The labels for the objects in the training data set Bus: 17,085, Car: 12,518, Motorcycle: 5,255, and Person: 4,572. The evaluation dataset contained 2,100 images. The total number of labels in the evaluation dataset is 7881, Bus labels 851, Car labels 2537, Motorcycle labels 996, and 3497 labels for Person. Evaluation per object has been used (V5_metrics) which will provide us with all the metrics for every object. The metrics used for the object detection model YOLOv7 in this work: Mean Average Precision (mAP@.5), Precision, Recall, and F1-score. Fig. 2 shows the evaluation matrices for epoch 38. The 38th epoch achieved the best outcome out of the 70 epochs of training. The model began to overfit at the 50th epoch and the mAP@.5 dropped from 76% to 74% while the F1-score fell from 74% to 70% at the 70th epoch.

Figure 2: The evaluation per object’s metrics values with the original dataset
The results in Fig. 2 are not good enough. This work proposes a method that generates data augmentations for our dataset to duplicate our dataset and improve the evaluation metrics result for the objects (Car, Bus, Motorcycle, and Person). The following experiments show how data augmentation enhanced our dataset and the performance of our model.
The dataset was augmented to 21,405 images by including newly created images that contain the same objects as the original data, but with varied content, higher brightness, and blurred images. The iterations per epoch were calculated using (1), resulting in 1,338 iterations per epoch with a batch size of 16. Data augmentation of this type increases the metrics of the object detection model. Fig. 3 indicates the improvement of each object. Fig. 3 shows 86% increase in the mean Average Precision at 0.5 (mAP@.5) and 82% increase in the F1-score for all objects at epoch 38. The model metrics kept rising, reaching a 90% mAP@.5% and 86% F1-score at the 70th epoch.

Figure 3: The evaluation per object’s metrics values with the brightness and blur augmented data
The dataset was augmented to 21,400 images by adding newly generated images that contain the same objects as the original data, but with varied content like increasing the brightness value and adding noise for the generated images. The iterations per epoch were calculated using (1), resulting in 1,338 iterations per epoch with a batch size of 16. Through the use of this experiment, a promising result was achieved as the metrics of the objects detections model increased. At epoch 38, the improvements of this method resulted in 89% mAP@.5% and 84% F1-score for all objects. The mAP@.5 and F1-score continued to improve until they reached 92% mAP@.5% and 88% of F1-score at the 70th epoch. Through this method, all objects experienced improvement. Fig. 4 shows the improvement of all objects when the model was evaluated with augmented data with brightness and noise.

Figure 4: The evaluation per object’s metrics values with the brightness and noise augmented data
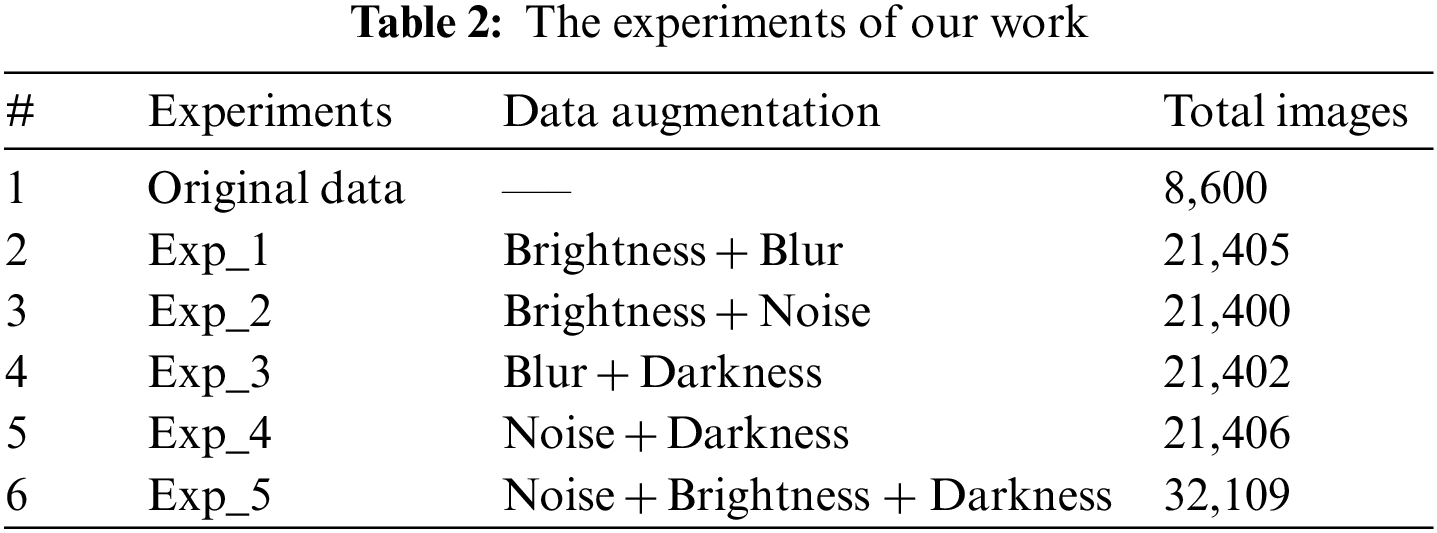
The dataset was duplicated to 21,402, by adding newly generated images that contain the same objects as the original data, but with different content like decreasing the brightness value and adding blur for the new generated images. The iterations per epoch were calculated using (1), resulting in 1,338 iterations per epoch with a batch size of 16. This experiment has combined low-light and blur data augmentations. Upon implementation of blur data augmentation, we noticed that we get the lowest value of improvement as in Exp_1 Brightness + Blur, but we still have a better result compared with the original dataset. By combining blur and darkness data augmentations through the method, the mAP@.5 and F1-score for all objects achieved an 86% and 82% increase at epoch 38. The mAP@.5 and F1-score had increased to 89% and 85%, respectively, at the 70th epoch. This method produces a result similar to Exp_1, but it exceeds the result from the original data. Fig. 5 shows the improvement of all objects when the model was evaluated with augmented data with blur and darkness.
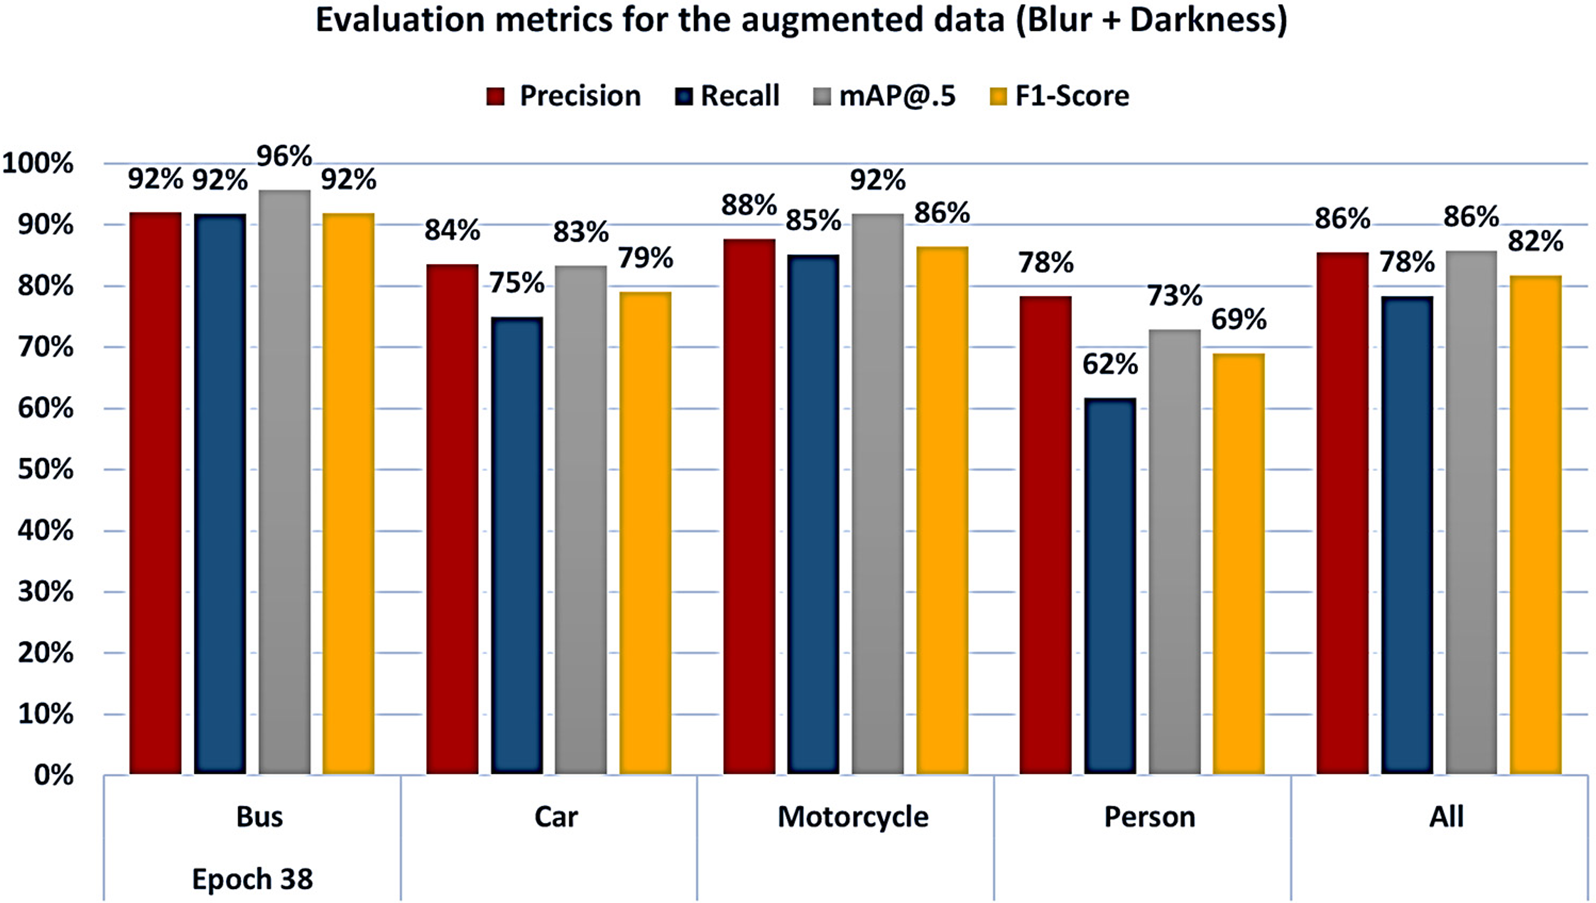
Figure 5: The evaluation per objects metrics values with the blur and darkness augmented data
The dataset was augmented to 21,406 images by including newly created images that contain the same objects as the original data, but with varied content, low-light images to generate the darkness, and add noise on the images. Eq. (1) was used to calculate the number of iterations per epoch, which was 1,338 with a batch size of 16. This experiment has combined noise and low-light data augmentations. Upon implementation of noise data augmentation, we noticed; we get the highest value of improvement as in Exp_2 Brightness + Noise. At epoch 38, this method improvement was 88% mAP@.5% and 83% F1-score for every object. The mean Average Precision at 0.5 (mAP@.5) and the F1-score continued to increase until a reach 92% mAP@.5% and 87% F1-score was achieved on the 70th epoch. This method produced an improvement in all objects. Fig. 6 shows the improvement of all objects when the model was evaluated with augmented data with noise and darkness.
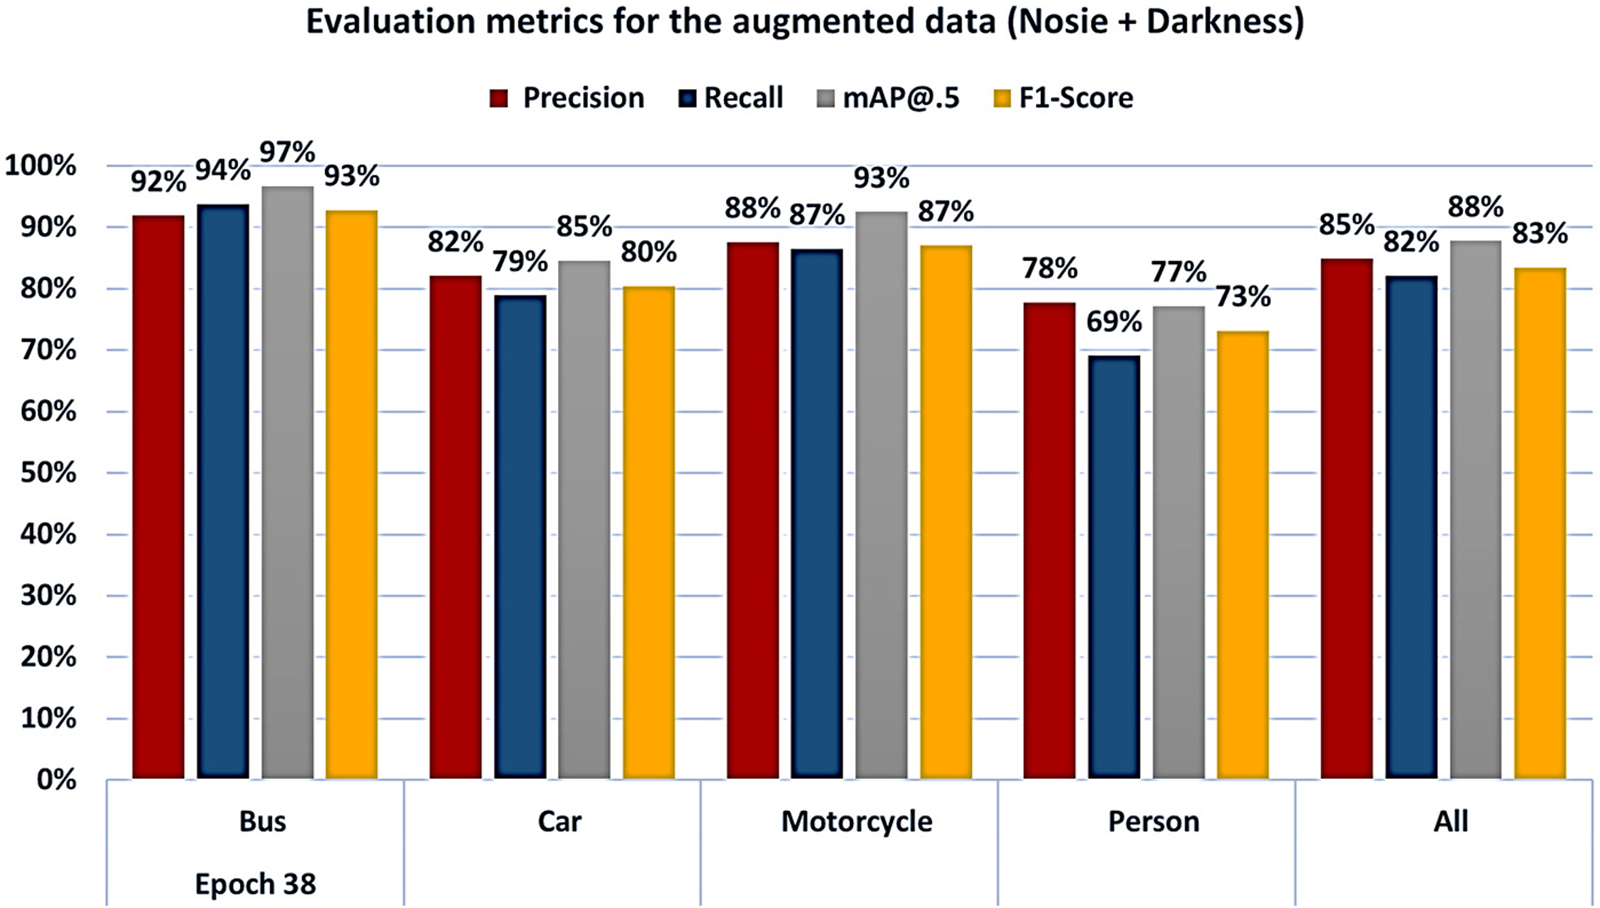
Figure 6: The evaluation per object’s metrics values with the noise and darkness augmented data
4.5 Exp_5 Noise + Brightness + Darkness
This experiment employed three types of augmentations: noise, brightness, and darkening. To achieve the desired result, we have combined noise augmentation with darkness and brightness augmentation. The dataset was increased three times the original dataset (32,109) by including newly created images with brightness, darkness, and noise images. Eq. (1) was used to calculate the number of iterations per epoch, resulting in 2,007 with a batch size of 16. This method has the highest result value when three types of data augmentations are implemented, which is significantly better than the two types of data augmentations used by the other methods, as demonstrated in Exp_2, and Exp_4. At epoch 38, the improvements of this method resulted in 89% mAP@.5% and 84% F1-score for all objects. The mAP@.5 and F1-score continued to improve until they reached 93% mAP@.5% and 89% of F1-score at the 70th epoch. Through this method, all objects experienced improvement. Fig. 7 shows the improvement of all objects when the model was evaluated with augmented data with noise brightness and darkness.

Figure 7: The evaluation per object’s metrics values with the noise, brightness and darkness augmented data
The Bus class showed the least improvement at +6% for both the mAP@.5 and F1-score, while the Person class got the greatest improvement at +25% for the mAP@.5 and +20% for the F1-score. For Car and Motorcycle, their mAP@.5 improved by 10%, with an additional 9% increase in F1-score. The three data augmentations-Exp_5 Noise + Brightness + Darkness-resulted in a 13% improvement in mAP@.5 score and a 10% increase in F1-score for all objects, allowing Exp_5 to take first place in this work. Exp_2 Brightness + Noise resulted in the same outcome as Exp_5 + 13% for the mAP@.5 and +10% F1-score for all objects, but Exp_5 produced better results by employing three types of data augmentation and got a higher value of F1-score for the person class. Exp_4 Noise + Darkness takes third-place improvement with +12% for the mAP@.5 and +9% for the F1-score for all objects. Exp_1 Brightness + Blur takes the fourth-place improvement with +10% for the mAP@.5 and + 8% for the F1-score for all objects. The last-place improvement was Exp_3 Blur + Darkness with the same result of Exp_1 + 10% for the mAP@.5 and + 8% for the F1-score for all objects, but Exp_1 got a better improved result for a person object. Fig. 8 indicates the results of the Precision and Recall for our five improved experiments and the original dataset result.
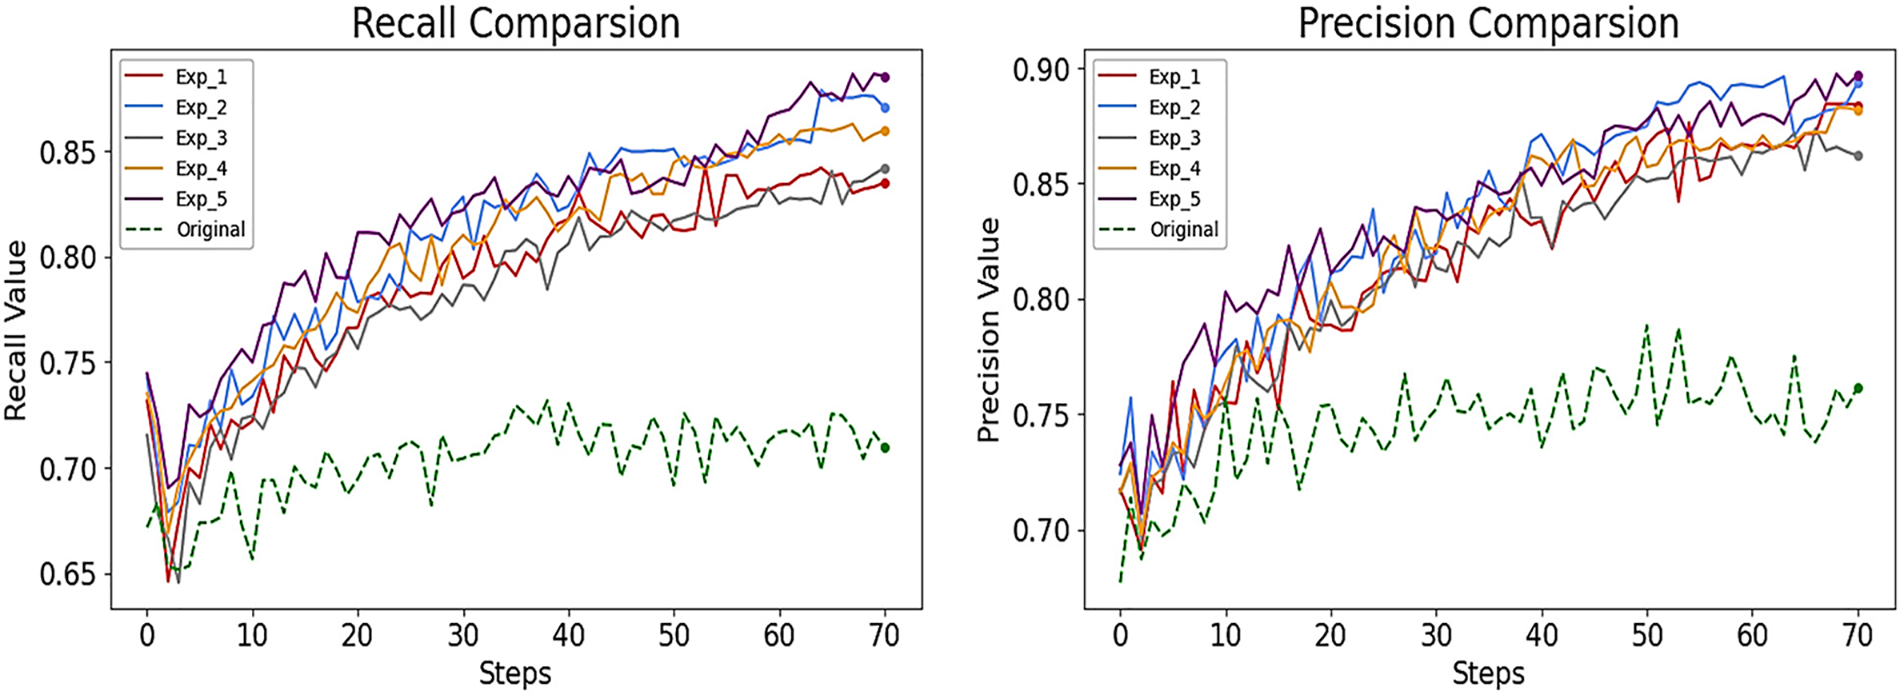
Figure 8: The results of the recall and precision for the five experiments compared with the original data results
Fig. 9 shows the result of the Mean Average Precision at 0.5 (mAP@.5) and the F1-score of our five improved experiments compared with the original data results.
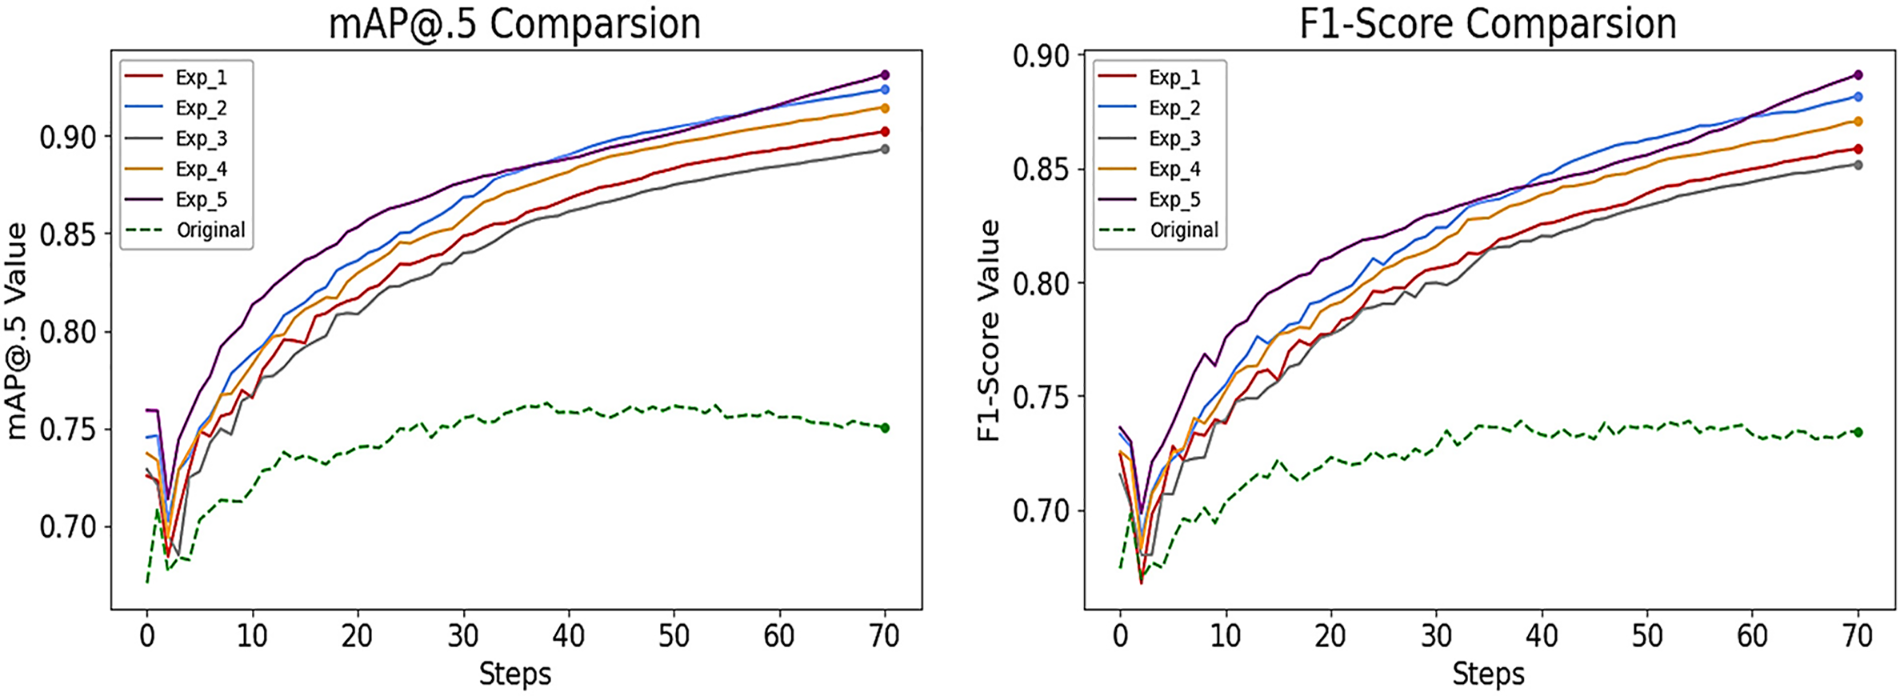
Figure 9: The results of precision for the five experiments compared with the original data results
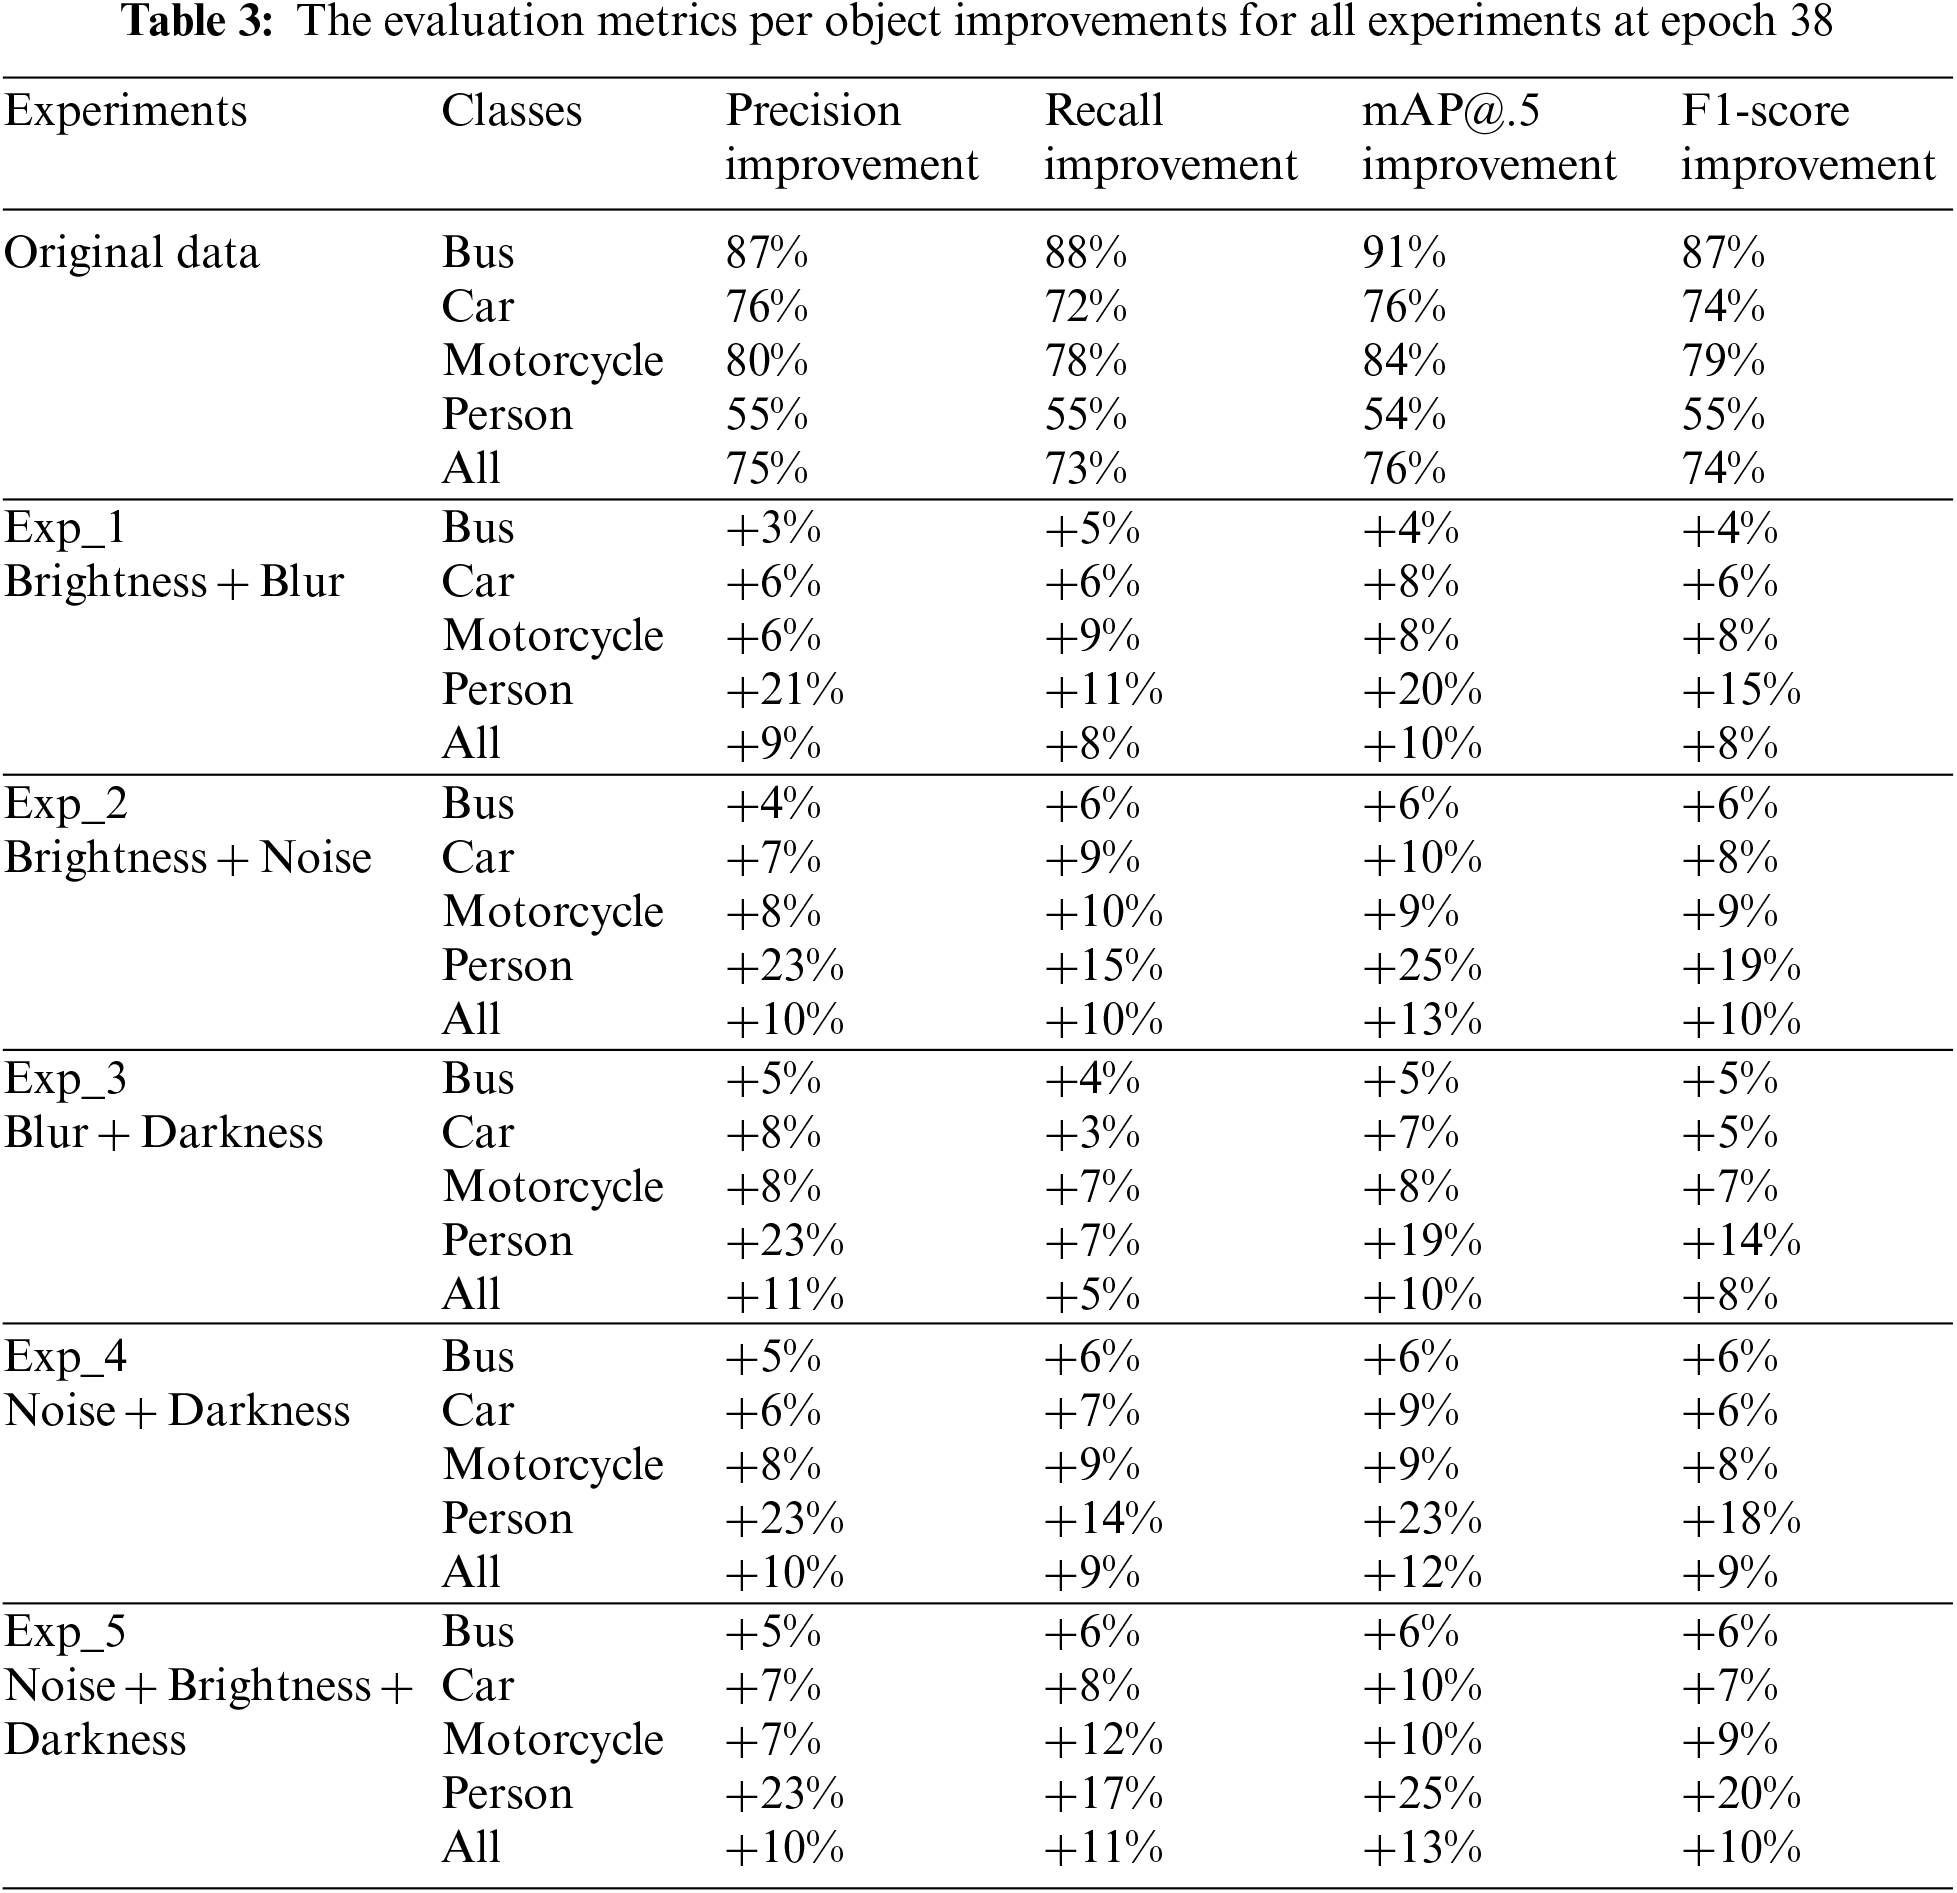
From the results shown in Figs. 8 and 9, we can see that the original data is the lowest value and Exp_5 with purple color is the highest value for each mAP@.50, F1-score, precision, and recall. Exp_1 with red color, Exp_2 with blue color, and Exp_3 with gray color, Exp_4 with orange color gives an intermediate value between Exp_5 and the original data. Table 3, preview of the metrics improvement (Precision, Recall, mAP@.5, and F1-score) of our five improved experiments compared with the metrics that were obtained from training with the original data for each object at epoch 38.
To verify the results of our improved methods, we compared the detection results between our original model and Exp_5 model in two different scenarios to demonstrate the improvement of our data augmentation techniques on all objects, focusing especially on the Person object. Fig. 10 displays the YOLOv7 detection results under daylight conditions, and Fig. 11 displays the YOLOv7 detection results for both the original data and the Exp_5 models under nighttime conditions. By examining Fig. 10, it is evident that our improved model Exp_5 can accurately identify a person riding a motorcycle at daylight time, while the model trained on the original dataset is not. Compared to the original dataset model, YOLOv7 with the Exp_5 model had a significantly better accuracy in detecting all objects.
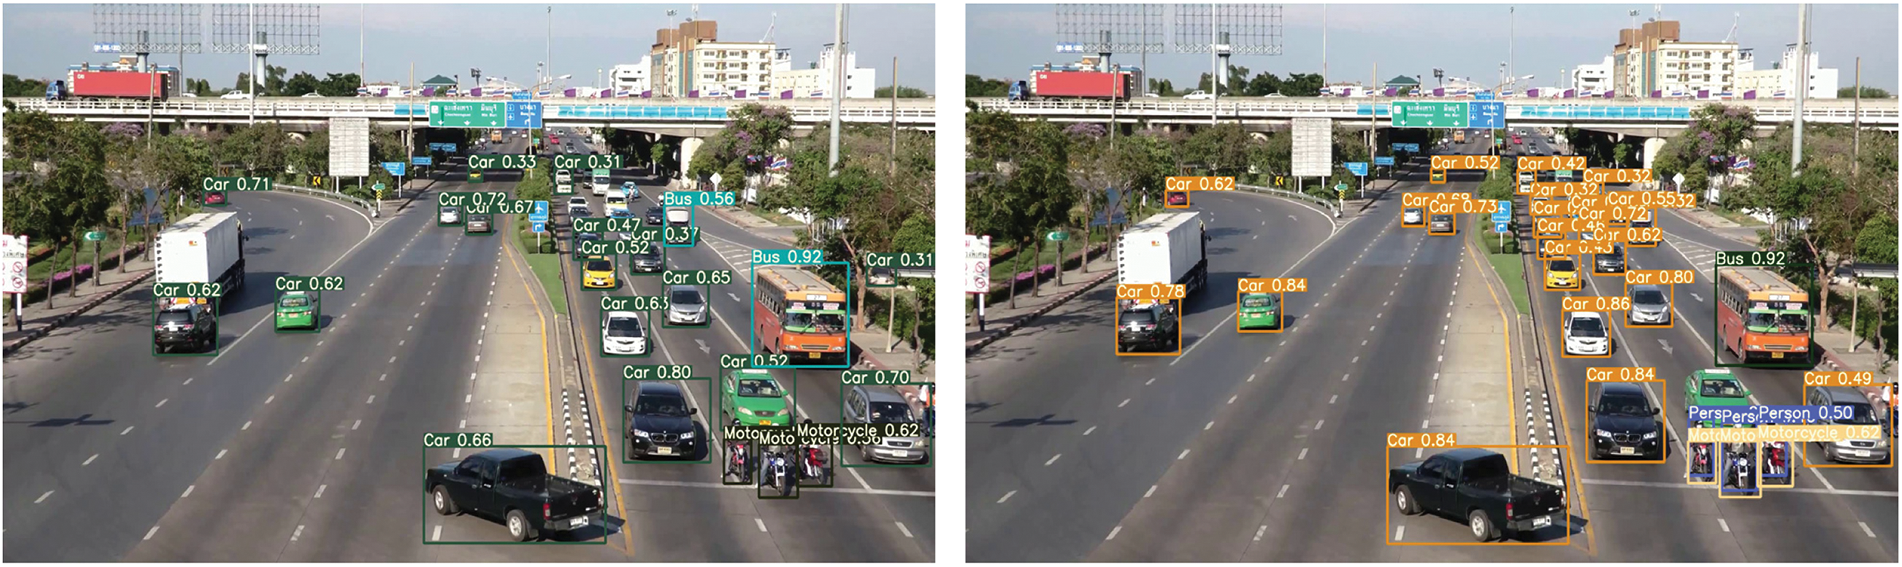

Figure 10: The detection result for YOLOv7 for original dataset and Exp_5 models at day-light time
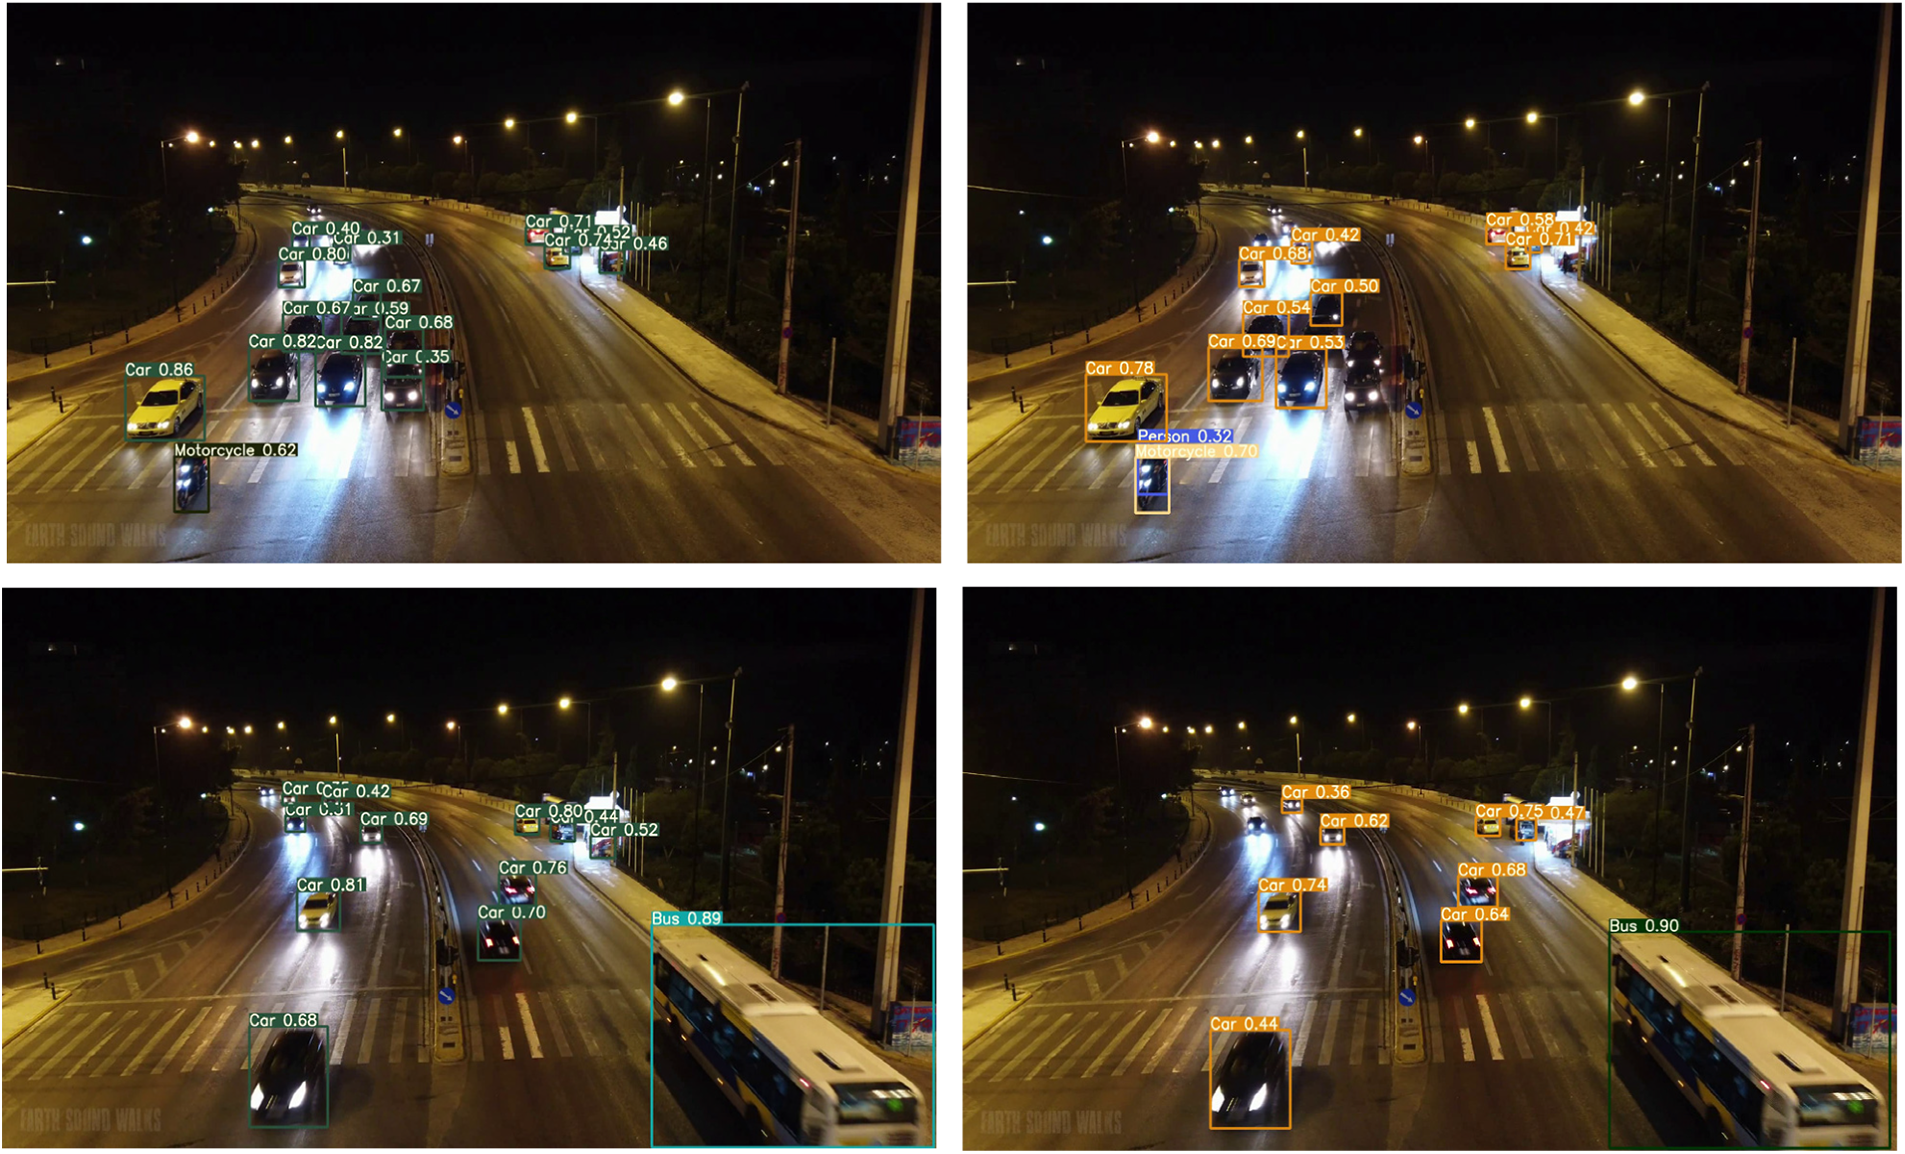
Figure 11: The detection result for YOLOv7 for original dataset and Exp_5 models at night-time
By choosing a second scenario to verify the detection of our improved method. Nighttime scenario has been chosen to evaluate the models and compare between them to choose the best one. Fig. 11 presents the detection results for YOLOv7 of both original and Exp_5 models at nighttime. The detection of Exp_5 model at night was accurately identify a person riding a motorcycle, while the model trained with original data could not. The detection of the bus object with the Exp_5 model was better than the detection of the model that was trained with the original data + 1. This is the second successful scenario for testing our Exp_5 model and it works better than the original model by detecting person objects at night. Using multiple data augmentation enables YOLOv7 to detect person object at night while the person riding the motorcycle.
5 Limitation of YOLOv7 in This Work
In this work YOLOv7 have a limitation in the two scenarios.
There is difficulty in detecting objects in some scenarios due to conflicts; for example, it is hard to differentiate between a bus and a car from a long distance, or between a truck and a bus. The background objects, such as walls and streets, can create conflicts, leading to identifying parts of the roads or traffic lights as cars or buses.
According to our results in this work, the best multiple data augmentation technique that gives the highest result was the three types of data augmentation in Exp_5. The best two types of data augmentation were adding noise data augmentation as in Exp_2 and Exp_3, which gives a better improvement than the blur data augmentation. With these experiments, we provided that: 1) using the multiple data augmentation could give a better result as we got in Exp_5 the highest value of improvement for all objects. 2) Implementing noise data augmentation produces more desirable results than using blur data augmentation. The three-type data augmentation gave us an impressive result compared with the two-type data augmentation in this work. In this work, we got the highest improvement for all the objects mAP@.5 +13% and F1-score +10% with two type data augmentation as in Exp_2 results and we got the same improvement with three types of data augmentation as in Exp_5 results. The detection of a person’s class has been improved in all our experiments in this work. The highest value of mAP@.5 for the “Person” class was +25%, and F1-score was +20% in Exp_5. The detected objects (Bus, Car, Motorcycle, and Person) have been improved in all five experiments, and the “Person” class achieved the highest improvement.
This research applies data augmentation methods to duplicate the data set pictures and improve the mAP@.5, precision and recall for YOLOv7. A per object evaluation or V5_metrics assessment has been applied to evaluate the trained models. This kind of evaluation gives mAP@.5, precision, and recall for every object. We began by constructing the model with a dataset without implementing any augmentations. For the Experiments Ex_1, Exp_2, Exp_3 and Exp_4, two types of data augmentation have been used, while for Exp_5, three types of data augmentation have been implemented. All five experiments showed an improvement beyond the original data, with Exp_5 demonstrating the greatest advancement. Then we evaluate our Exp_5 models to verify the result of Exp-5 compared with a model that was trained with original data. The three-type data augmentation in Exp_5 gives better results compared with the original. First-place Experiment Exp_5 achieved the highest improvement value among all the classes, making it the highest performer. The second-place experiment, Exp_2, resulted in the same outcomes for all classes as Exp_5, but the Person class was lower than Exp_5. Exp_4, which occupied the third position, produced outcomes that surpassed the blurred information from Exp_1 and Exp_3 for every class. Exp_3 and Exp_1 performed worse than all other experiments in this work. We concluded that noise data augmentation had a better effect on our dataset than blur data augmentation, thus providing us with a means of creating more reliable robotic object detection models that can be used for autonomous cars.
Acknowledgement: The authors acknowledge the contribution and the support of the Department of Electrical & Computer Engineering and Computer Science at Jackson State University (JSU).
Funding Statement: This work was partly supported by the United States Air Force Office of Scientific Research (AFOSR) contract FA9550-22-1-0268 awarded to KHA, https://www.afrl.af.mil/AFOSR/. The contract is entitled: “Investigating Improving Safety of Autonomous Exploring Intelligent Agents with Human-in-the-Loop Reinforcement Learning,” and in part by Jackson State University.
Author Contributions: The authors confirm contribution to the paper as follows: study conception and design: A. Abdulghani, M. Abdulghani, W. Walters, K. Abed; data collection: A. Abdulghani; analysis and interpretation of results: A. Abdulghani, M. Abdulghani, W. Walters, K. Abed; draft manuscript preparation: A. Abdulghani, M. Abdulghani, K. Abed. All authors reviewed the results and approved the final version of the manuscript.
Availability of Data and Materials: Data can be accessed using this address: https://universe.roboflow.com/abdulghani-m-abdulghani/custom-dataset-for-pedestrians-and-automobile-detection.
Conflicts of Interest: The authors declare that they have no conflicts of interest to report regarding the present study.
References
1. R. Girshick, J. Donahue, T. Darrell and J. Malik, “Rich feature hierarchies for accurate object detection and semantic segmentation,” in 2014 IEEE Conf. on Computer Vision and Pattern Recognition, Columbus, OH, USA, pp. 580–587, 2014. https://doi.org/10.1109/CVPR.2014.81 [Google Scholar] [CrossRef]
2. C. Shorten and T. M. Khoshgoftaar, “A survey on image data augmentation for deep learning,” Journal of Big Data, vol. 6, no. 60, 2019. https://doi.org/10.1186/s40537-019-0197-0 [Google Scholar] [CrossRef]
3. T. A. Korzhebin and A. D. Egorov, “Comparison of combinations of data augmentation methods and transfer learning strategies in image classification used in convolution deep neural networks,” in 2021 IEEE Conf. of Russian Young Researchers in Electrical and Electronic Engineering (ElConRus), St. Petersburg, Moscow, Russia, 2021. https://doi.org/10.1109/ElConRus51938.2021.9396724 [Google Scholar] [CrossRef]
4. T. deVries and G. W. Taylor, “Improved regularization of convolutional neural networks with cutout,” arXiv:1708.04552, 2017. [Google Scholar]
5. M. Abdelhack, “A comparison of data augmentation techniques in training deep neural networks for satellite image classification,” arXiv:2003.13502. https://doi.org/10.48550/arXiv.2003.13502 [Google Scholar] [CrossRef]
6. R. Girshick, “Fast R-CNN,” in 2015 IEEE Int. Conf. on Computer Vision (ICCV), Santiago, Chile, pp. 1440–1448, 2015. https://doi.org/10.1109/ICCV.2015.169 [Google Scholar] [CrossRef]
7. S. Ren, K. He, R. Girshick and J. Sun, “Faster R-CNN: Towards real-time object detection with region proposal networks,” IEEE Transactions on Pattern Analysis and Machine Intelligence, vol. 39, no. 6, pp. 1137–1149, 2017. https://doi.org/10.1109/TPAMI.2016.2577031 [Google Scholar] [PubMed] [CrossRef]
8. W. Liu, D. Anguelov, D. Erhan, C. Szegedy, S. E. Reed et al., “SSD: Single shot multibox detector,” in European Conf. on Computer Vision, Santiago, Chile, 2015. [Google Scholar]
9. J. Redmon, S. Divvala, R. Girshick and A. Farhadi, “You only look once: Unified, real-time object detection,” in 2016 IEEE Conf. on Computer Vision and Pattern Recognition (CVPR), Las Vegas, NV, USA, 2016. https://doi.org/10.1109/CVPR.2016.91 [Google Scholar] [CrossRef]
10. J. Redmon and A. Farhadi, “YOLO9000: Better, faster, stronger,” in 2017 IEEE Conf. on Computer Vision and Pattern Recognition (CVPR), Honolulu, HI, USA, pp. 6517–6525, 2017. https://doi.org/10.1109/CVPR.2017.690 [Google Scholar] [CrossRef]
11. J. Redmon and A. Farhadi, “YOLOv3: An incremental improvement,” arXiv:1804.02767. https://doi.org/10.48550/arXiv.1804.02767 [Google Scholar] [CrossRef]
12. A. Bochkovskiy, C. Y. Wang and H. Y. M. Liao, “YOLOv4: Optimal speed and accuracy of object detection,” arXiv:2004.10934. https://doi.org/10.48550/arXiv.2004.10934 [Google Scholar] [CrossRef]
13. A. M. A. Abdulghani and G. G. Menekşe Dalveren, “Moving object detection in video with algorithms YOLO and faster R-CNN in different conditions,” Avrupa Bilim ve Teknoloji Dergisi, vol. 33, pp. 40–54, 2022. https://doi.org/10.31590/ejosat.1013049 [Google Scholar] [CrossRef]
14. C. Y. Wang, A. Bochkovskiy and H. Y. M. Liao, “YOLOv7: Trainable bag-of-freebies sets new state-of-the-art for real-time object detectors.” arXiv:2207.02696. [Google Scholar]
15. J. R. R. Uijlings, K. E. A. van de Sande, T. Gevers and A. W. M. Smeulders, “Selective search for object recognition,” International Journal of Computer Vision, vol. 104, pp. 154–171, 2013. https://doi.org/10.1007/s11263-013-0620-5 [Google Scholar] [CrossRef]
16. K. He, G. Gkioxari, P. Dollár and R. Girshick, “Mask R-CNN,” in 2017 IEEE Int. Conf. on Computer Vision (ICCV), Venice, Italy, pp. 2980–2988, 2017. https://doi.org/10.1109/ICCV.2017.322 [Google Scholar] [CrossRef]
17. A. Kuznetsova, H. Rom, N. G. Alldrin, J. R. R. Uijlings, I. Krasin et al., “The open images dataset V4,” International Journal of Computer Vision, vol. 128, pp. 1956–1981, 2018. [Google Scholar]
18. “Roboflow: Give your software the power to see objects in images and video,” [Online]. Available: https://roboflow.com [Google Scholar]
Cite This Article
 Copyright © 2023 The Author(s). Published by Tech Science Press.
This work is licensed under a Creative Commons Attribution 4.0 International License , which permits unrestricted use, distribution, and reproduction in any medium, provided the original work is properly cited.
 Downloads
 Citation Tools