
 Login
Login Register
 Submit a Paper
 Propose a Special lssue
 Open Access
ARTICLE
On Mechanical Properties of Polymer Composite Simulated Ice Structures for Flight Testing
1 State Key Laboratory of Mechanics and Control for Mechanical Structures, Nanjing University of Aeronautics and Astronautics, Nanjing, China
2 Shanghai Aircraft Design and Research Institute, COMAC, Shanghai, China
* Corresponding Authors: Nan Zhang. Email: ; Guangming Zhou. Email:
(This article belongs to the Special Issue: Structure, Design and Mechanism of Flight Composite Materials)
Journal of Polymer Materials 2026, 43(3), 8 https://doi.org/10.32604/jpm.2026.087192
Received 11 June 2026; Accepted 12 August 2026; Issue published 24 September 2026
 View Full Text
 Download PDF
Abstract
Ice accretion on aircraft airfoils poses a serious threat to flight safety by degrading aerodynamic performance and potentially causing premature stall. In airworthiness certification, dry-air flight tests with simulated ice shapes are required, and the structural strength of such artificial ice must be rigorously verified to prevent in-flight detachment. The study investigates both the aerodynamic impact of a typical glaze ice shape on a civil aircraft airfoil and the mechanical behavior of a designed simulated ice structure. Firstly, computational fluid dynamics (CFD) simulations using the k-ω SST turbulence model are conducted for climb/descent (0.2 Ma) and cruise (0.6 Ma) conditions. The results show that the ice shape significantly reduces the maximum lift coefficient (by up to 45% at 0.6 Ma) and advances the stall angle, thereby severely impairing flight performance. Secondly, due to the advantages of UV curable resin in terms of shrinkage control and processing accuracy, a composite sandwich structure composed of a 3D-printed hollow core and glass-fiber reinforced polymer (GFRP) skins is proposed for a polymer composite simulated ice structure and analyzed via finite element simulations. At the same time, its high thermal deformation temperature and the glass transition temperature can meet the environmental temperature requirements during the flight process. The design achieves a safety factor of 4.65 against the peak aerodynamic load (1.89 kN/m). Damage analysis reveals that failure occurs by progressive debonding of the adhesive layers, while the GFRP and core remain intact. Finally, experimental validation using a 3D-printed artificial ice and aluminum mold confirms the failure mode and yields a simulation error of 9.10%, demonstrating good predictive capability. Through finite element simulation and experimental verification, the mechanical properties of the designed polymer sandwich structure were analyzed, and the interface debonding process of each component was also analyzed. This study provides a validated structural design for simulated ice shape and quantifies the aerodynamic penalties of leading-edge ice, supporting safe airworthiness flight testing.Keywords
When an aircraft flies at subsonic speeds within cloud layers below 8000 m, ice may accrete on the leading edge of the wing. Ice formation is primarily caused by supercooled droplets, whose diameters typically range from 5 to 50 μm. Upon impact with the aircraft surface, these droplets freeze, leading to ice deposits [1,2,3]. The accumulation of ice on the wing surface adversely affects the aircraft’s aerodynamic characteristics, increasing drag coefficient and reducing lift coefficient, thereby posing a significant threat to flight safety [4]. Consequently, it is essential to assess aircraft flight performance under icing conditions and to demonstrate safe operation under both continuous and intermittent maximum icing conditions.
Flight testing is a key component of compliance verification for icing conditions. Its main objective is to confirm that the aircraft can maintain adequate flight quality after ice accretion and that the degraded performance remains within acceptable limits. Icing certification flight tests are generally classified into three categories. The first category is dry-air flight tests with anti-icing systems activated, which verify the normal operation of anti-icing equipment without compromising flight quality under clear atmospheric conditions and establish the operational envelope of anti-icing systems. The second category refers to dry-air flight tests with simulated ice shapes. Ice replicas are mounted on the aircraft, and tests are conducted under stable dry-air conditions to assess aerodynamic performance and flight handling characteristics. This approach greatly reduces the reliance on flight tests conducted in unpredictable natural icing environments. The third category is natural icing flight tests, which validate the actual location and geometric features of in-flight ice accretion. Such tests also confirm that the performance degradation trends caused by natural ice are consistent with those induced by simulated ice.
Among all test items, dry-air flight tests with simulated ice shapes play a decisive role in the entire airworthiness verification framework. The implementation workflow consists of four sequential steps: ice shape prediction based on numerical simulations and icing wind tunnel tests, aerodynamic assessment of predicted ice configurations, onboard installation of ice specimens while preserving original geometric features, and full-scale flight validation. To understand the development of such simulated ice testing methods, it is instructive to review the historical and technical evolution of icing research.
In 1978, NASA and the FAA held a seminar at the Lewis Research Center, restarting extensive icing research. With the rapid development of computational fluid dynamics (CFD), the focus shifted toward numerical simulation of icing phenomena and experimental validation. Potapczuk and Gerhart [5] used the Reynolds-averaged Navier–Stokes (RANS) method to numerically compute the two-dimensional (2D) aerodynamic characteristics of two ice shapes. Kwon and Sankar [6] were the first to perform numerical analysis of the aerodynamic characteristics of a three-dimensional (3D) iced NACA 0012 airfoil at 4° and 8° angles of attack (AOAs). Good agreement between numerical predictions and experimental data was achieved at 4° AOA, whereas obvious discrepancies emerged near the leading edge at 8° AOA due to severe local flow separation. Lee and Bragg [7] adopted quarter-circle profiles to simulate horn ice on a NACA 23012 airfoil and performed parametric tests on ice height and chordwise position. The results revealed that ice located at 12% chord caused the most severe lift loss, and this conclusion was also applicable to the NLF 0414 airfoil. Papadakis et al. [8] reported that when the ice angle was perpendicular to the airfoil chord line, the aerodynamic degradation was the most severe.
To improve icing prediction capability, a series of professional icing simulation software has been developed worldwide, including LEWICE [9] from the United States, ONERA [10] from France and FENSAP-ICE [11] from Canada. Existing studies have confirmed that flow separation bubbles downstream of horn ice were the primary cause of aerodynamic performance deterioration [12]. Upper-surface horn ice mainly affected lift coefficient and stall angle, while lower-surface horn ice dominates performance degradation at low and negative AOAs [13]. Moreover, ice surface roughness had a limited impact on overall aerodynamic characteristics, as verified by multiple published works [14].
At present, research on icing has primarily focused on developing more accurate icing prediction models and aerodynamic performance calculation methods. Min and Yee [15] introduced leading-edge surface roughness and convective coefficients to compute four ice shapes. The results outperformed LEWICE predictions and resolved the issue of excessive ice-horn growth. Suo et al. [16] proposed an icing prediction model based on a geometry-constrained neural network. With flight velocity, ambient temperature, liquid water content, median volumetric diameter, and icing time as inputs and ice thickness as the output, the model incorporated geometric constraints into the loss function to improve prediction accuracy. The results showed that the geometric constraints effectively reduced fluctuations in ice shape prediction and enhance accuracy. The trained model could be used for rapid assessment of wing icing conditions. Zhao et al. [17] established a deep operator network and conducted training and testing on the NACA 0012 iced airfoil. The predicted results were compared with those of the traditional direct CNN network. Unlike the traditional CNN, which can only predict aerodynamic coefficients under fixed flow conditions consistent with the training data, this network can flexibly predict aerodynamic coefficients under different flow conditions. Bornhoft et al. [18] performed aerodynamic analyses on realistic ice shapes obtained by laser scanning and on simplified ice shapes. The results indicated that realistic ice shapes yielded better computational accuracy and that introducing roughness features on simplified ice shapes was necessary.
While the above studies have advanced ice prediction and aerodynamic performance calculation capabilities, there is relatively little content regarding the actual simulation of ice type installation and flight test verification. Flemming et al. [19] defined the critical icing conditions for the S-92A helicopter to meet airworthiness requirements. Through CFD calculations, the critical ice shapes for various components and the associated aerodynamic data were obtained. For the vertical and horizontal tails, the simulated ice shapes were fabricated by wire-cut foam core wrapped with glass fiber and installed on the designated surfaces. The outer layer of the ice shapes was coated with 40-grit aluminum oxide, while 40-grit sandpaper was applied to the main and tail rotors. Flight tests showed that the ice shapes on the tail had a relatively minor impact on aerodynamic characteristics, whereas rotor roughness caused a 70% loss of power. Ratvasky et al. [20] conducted flight tests with simulated ice shapes on a commercial jet aircraft. Three ice shapes were used in the tests. The actual flight data agreed well with the simulation results; however, a stall dive tendency was observed when the flaps were extended. Deiler et al. [21] performed flight tests on an aircraft after installing a supercooled large droplet (SLD) ice shape. The results indicated a significant degradation in aircraft performance after ice accretion, but the SLD ice shape was not more critical compared with other ice shapes. In 2016, Boeing filed a patent for the installation of simulated ice shapes applicable to actual airworthiness certification processes [22]. The patent employed 3D-printed simulated ice shapes attached to the designated surface using double-sided tape, and linear components were used to remove the simulated ice shapes. Li et al. [23] performed CFD simulations on the icing configuration of a civil aircraft wing and proposed a simulated ice shape structure. The mechanical properties of the structure were obtained through finite element analysis, verifying its feasibility for actual flight test applications.
To fill the above-mentioned gaps, this paper presents an integrated study that couples aerodynamic analysis, structural design, finite element simulation, and experimental validation for a simulated ice shape intended for dry-air flight tests. Unlike most existing works that focus solely on ice prediction or aerodynamic degradation, the present work systematically quantifies the aerodynamic penalty of a realistic glaze ice shape on a civil aircraft wing at climb/descent and cruise phases, and extracts the corresponding surface loads as design inputs. A composite sandwich structure with a 3D-printed hollow core and extended GFRP bonding tabs is proposed, and its mechanical response under the peak aerodynamic load is evaluated using cohesive-zone and Tsai-Wu failure criteria. The predicted failure mode and load are validated through quasi-static tests on a 250 mm hand-lay-up specimen. This paper is based on the necessity of simulated ice for airworthiness certification. It adopts mature processing techniques and material systems for structural design, focusing on the mechanical properties of the designed structure. This provides a verifiable method for the engineering design and airworthiness certification of the simulated ice, thereby directly supporting airworthiness flight tests.
2 Aerodynamic Analysis of the Iced Airfoil
This study focuses on a civil aircraft airfoil with a chord length of 2.36 m. Based on experimental data [24] from the CIRA-IWT icing wind tunnel, the ice shape shown in Fig. 1 was obtained. The x-direction and y-direction represent the freestream direction and the wing normal direction, respectively.
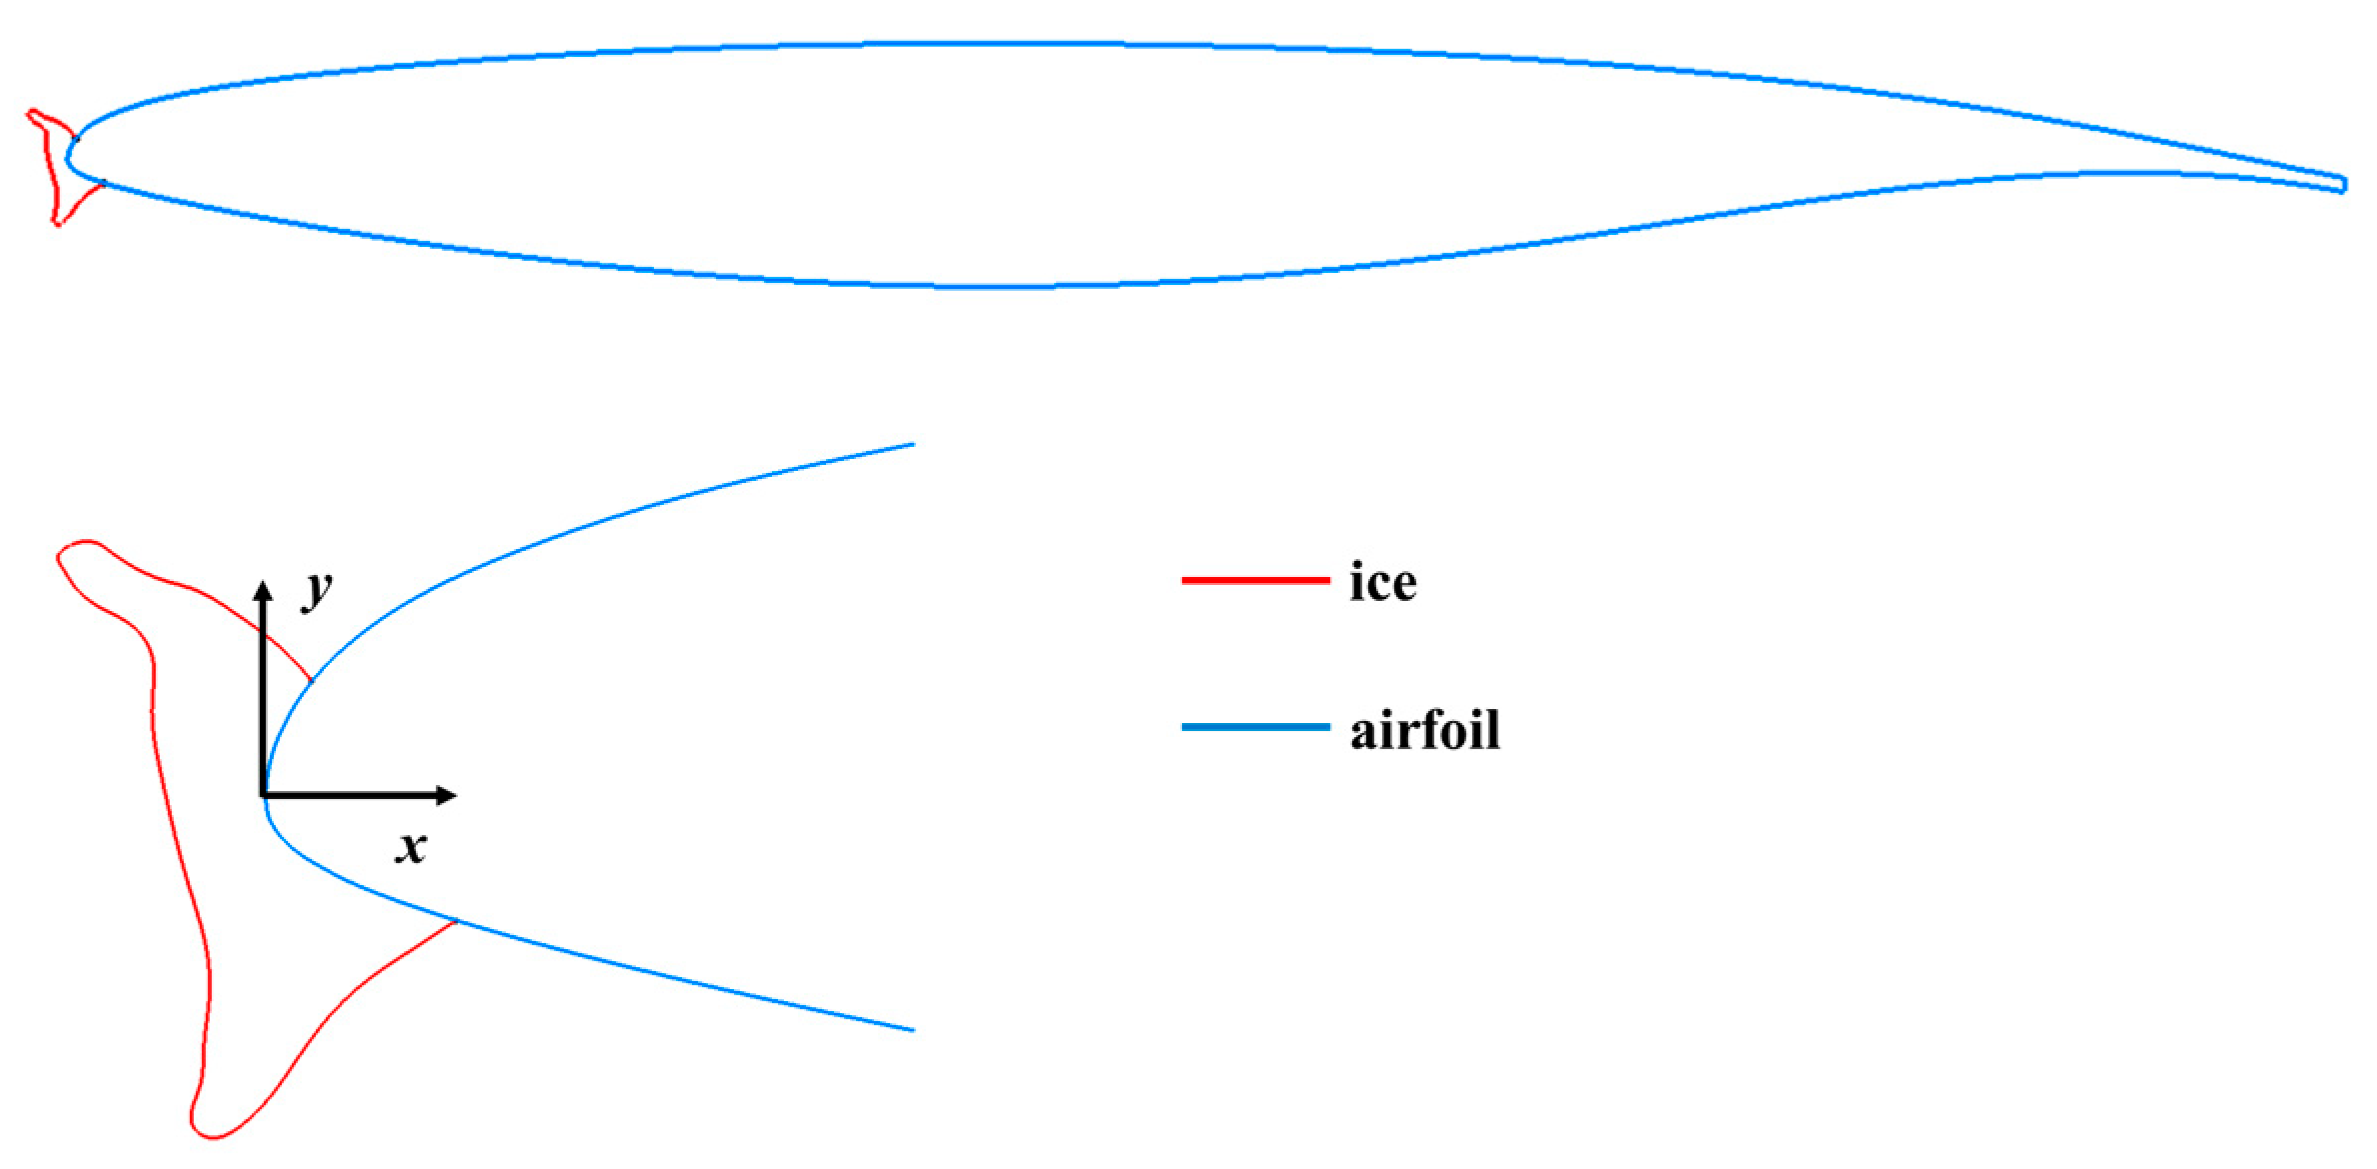
Figure 1: Ice shape on the airfoil section.
The aerodynamic performance of this ice shape is first analyzed to evaluate its impact on the clean wing performance. Aerodynamic loads on the ice surface are then extracted to provide input for subsequent mechanical analyses.
Considering the operational scenarios of the civil aircraft, the climb/descent phase and the cruise phases are selected for computation. The k-ω SST turbulence model [25] is employed, which combines the standard k-ε [26] and k-ω [27] models and offers high accuracy and reliability in flow field simulations. Compared to other turbulence models, the k-ω SST turbulence model is more effective in simulating turbulence at high angles of attack and offers higher accuracy in aerodynamic performance evaluation [28]. The computational domain size is 100 m, greater than 25 times the chord length, satisfying the pressure far-field boundary condition. The specific computational inputs are listed in Table 1. Airfoil deformation is neglected, and the no-slip wall condition is considered.
Table 1: Calculation parameters for different flight phases.
| Flight Phase | Mach Number (Ma) | Temperature (K) | Altitude (m) |
|---|---|---|---|
| Climb/Descent | 0.2 | 242.65 | 2000 |
| Cruise | 0.6 | 272.15 | 7000 |
2.2 Grid Independence Verification
Grid generation is completed in ICEM software with a O-block topology scheme. As shown in Fig. 2, Mesh refinement is implemented locally around ice horns, where the first-layer grid size on the airfoil was 0.003 mm to achieve a y+ value of 1, with a mesh growth rate of 1.1. The same O-block meshing strategy was applied to the clean airfoil for comparison.
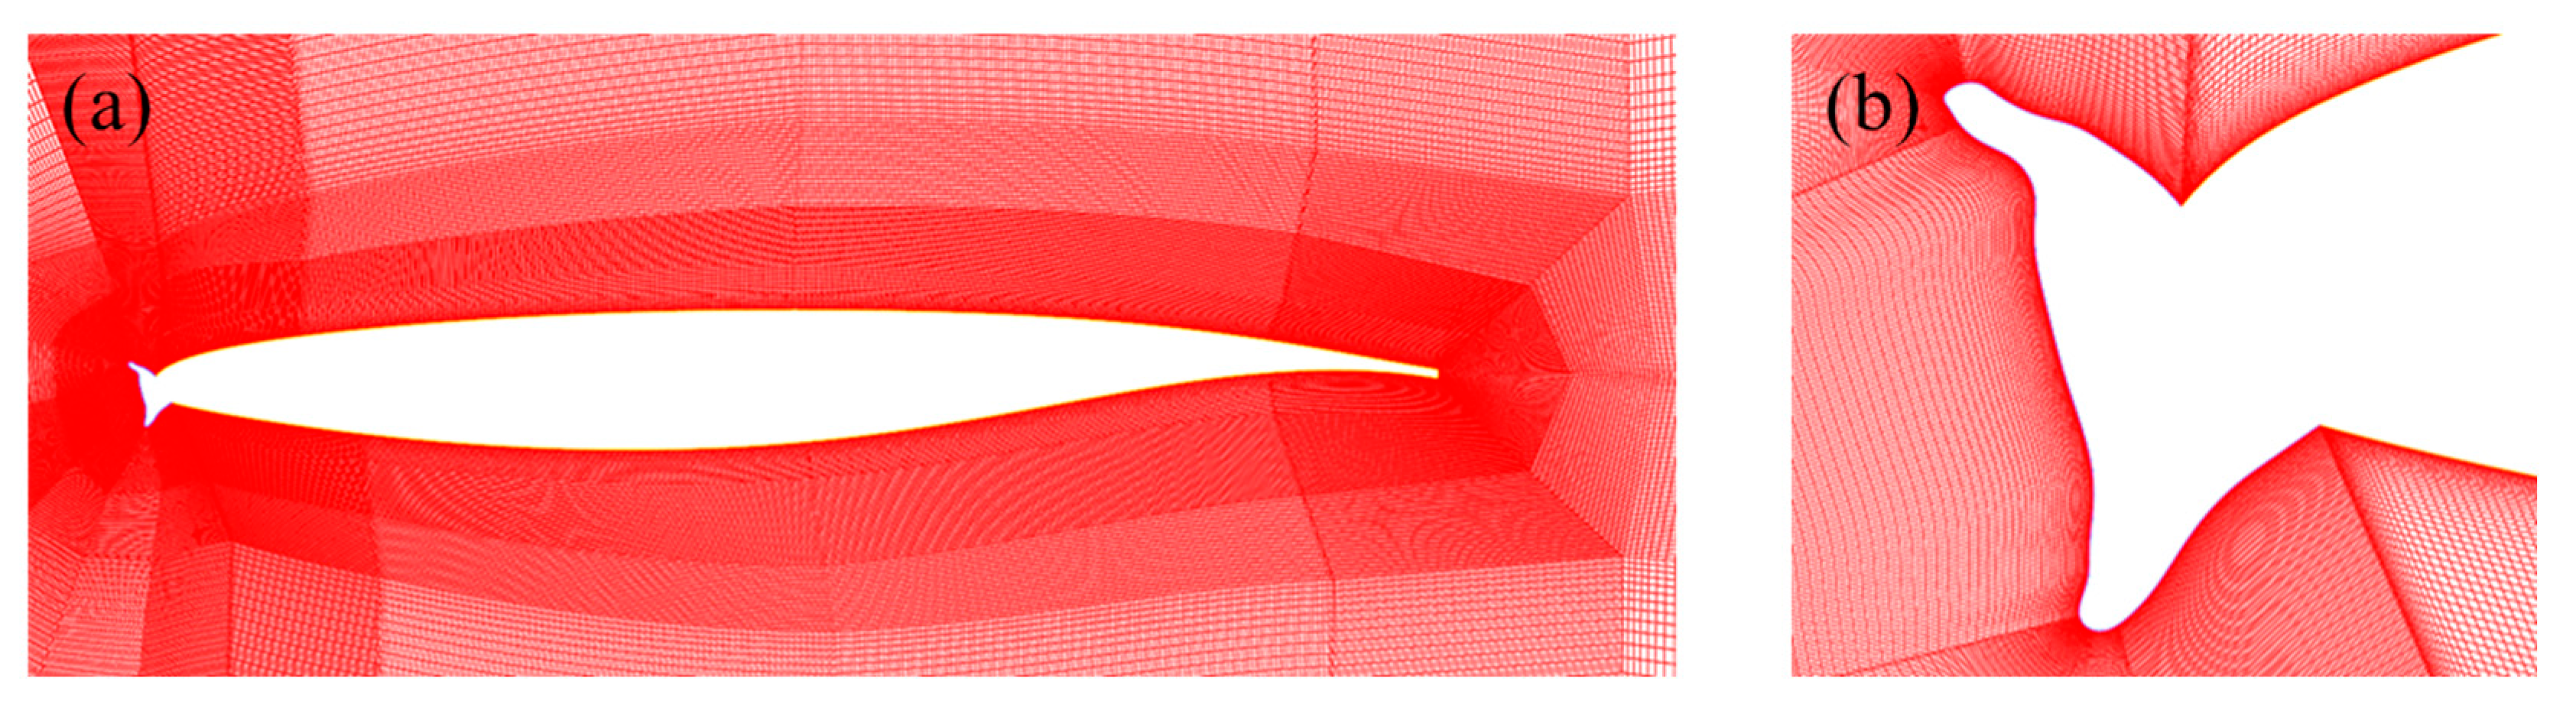
Figure 2: Grid of airfoil with ice shape: (a) total grid; (b) refined grid of the leading edge.
CFD predictions are sensitive to grid density, necessitating a grid convergence verification. Following the International Towing Tank Conference (ITTC) recommended specifications, three grid sets are refined proportionally with a scaling factor of
Table 2: Grid independence verification results.
| Case | Number of Cells | CL | CD |
|---|---|---|---|
| 1 | 225,462 | 0.152 | 0.025 |
| 2 | 440,154 | 0.177 | 0.027 |
| 3 | 881,358 | 0.181 | 0.028 |
2.3 Comparison of Lift and Drag Coefficients
Leading-edge ice alters the original airfoil geometry and triggers premature boundary-layer separation, preventing full flow attachment over the airfoil surface and inducing prominent aerodynamic degradation.
Fig. 3 shows the lift and drag coefficients versus AOA for the clean and iced airfoils at 0.2 Ma and 0.6 Ma. For the clean airfoil, an increase in Mach number raises the lift coefficient at a given AOA but also causes an earlier stall angle. Higher incoming flow velocity accelerates suction-side flow and intensifies near-surface low-pressure regions to improve lift generation; meanwhile, compressibility-induced shock waves emerge on the upper airfoil, accelerating boundary-layer detachment and reducing stall angle.
Conversely, geometric distortion from leading-edge ice disrupts flow acceleration and suppresses shock formation, further facilitating flow separation. Consequently, the iced airfoil suffers substantial lift coefficient loss and pronounced drag coefficient increment. Compared with the clean airfoil, the maximum lift coefficient of the iced airfoil decreases from 1.57 to 0.65 at 0.2 Ma, and the stall angle reduces from 13° to 5.5°. At 0.6 Ma, the maximum lift coefficient drops from 1.08 to 0.59, and the stall angle reduces from 6.5° to 4.5°. Such dramatic aerodynamic degradation quantitatively demonstrates the detrimental influence of leading-edge icing.
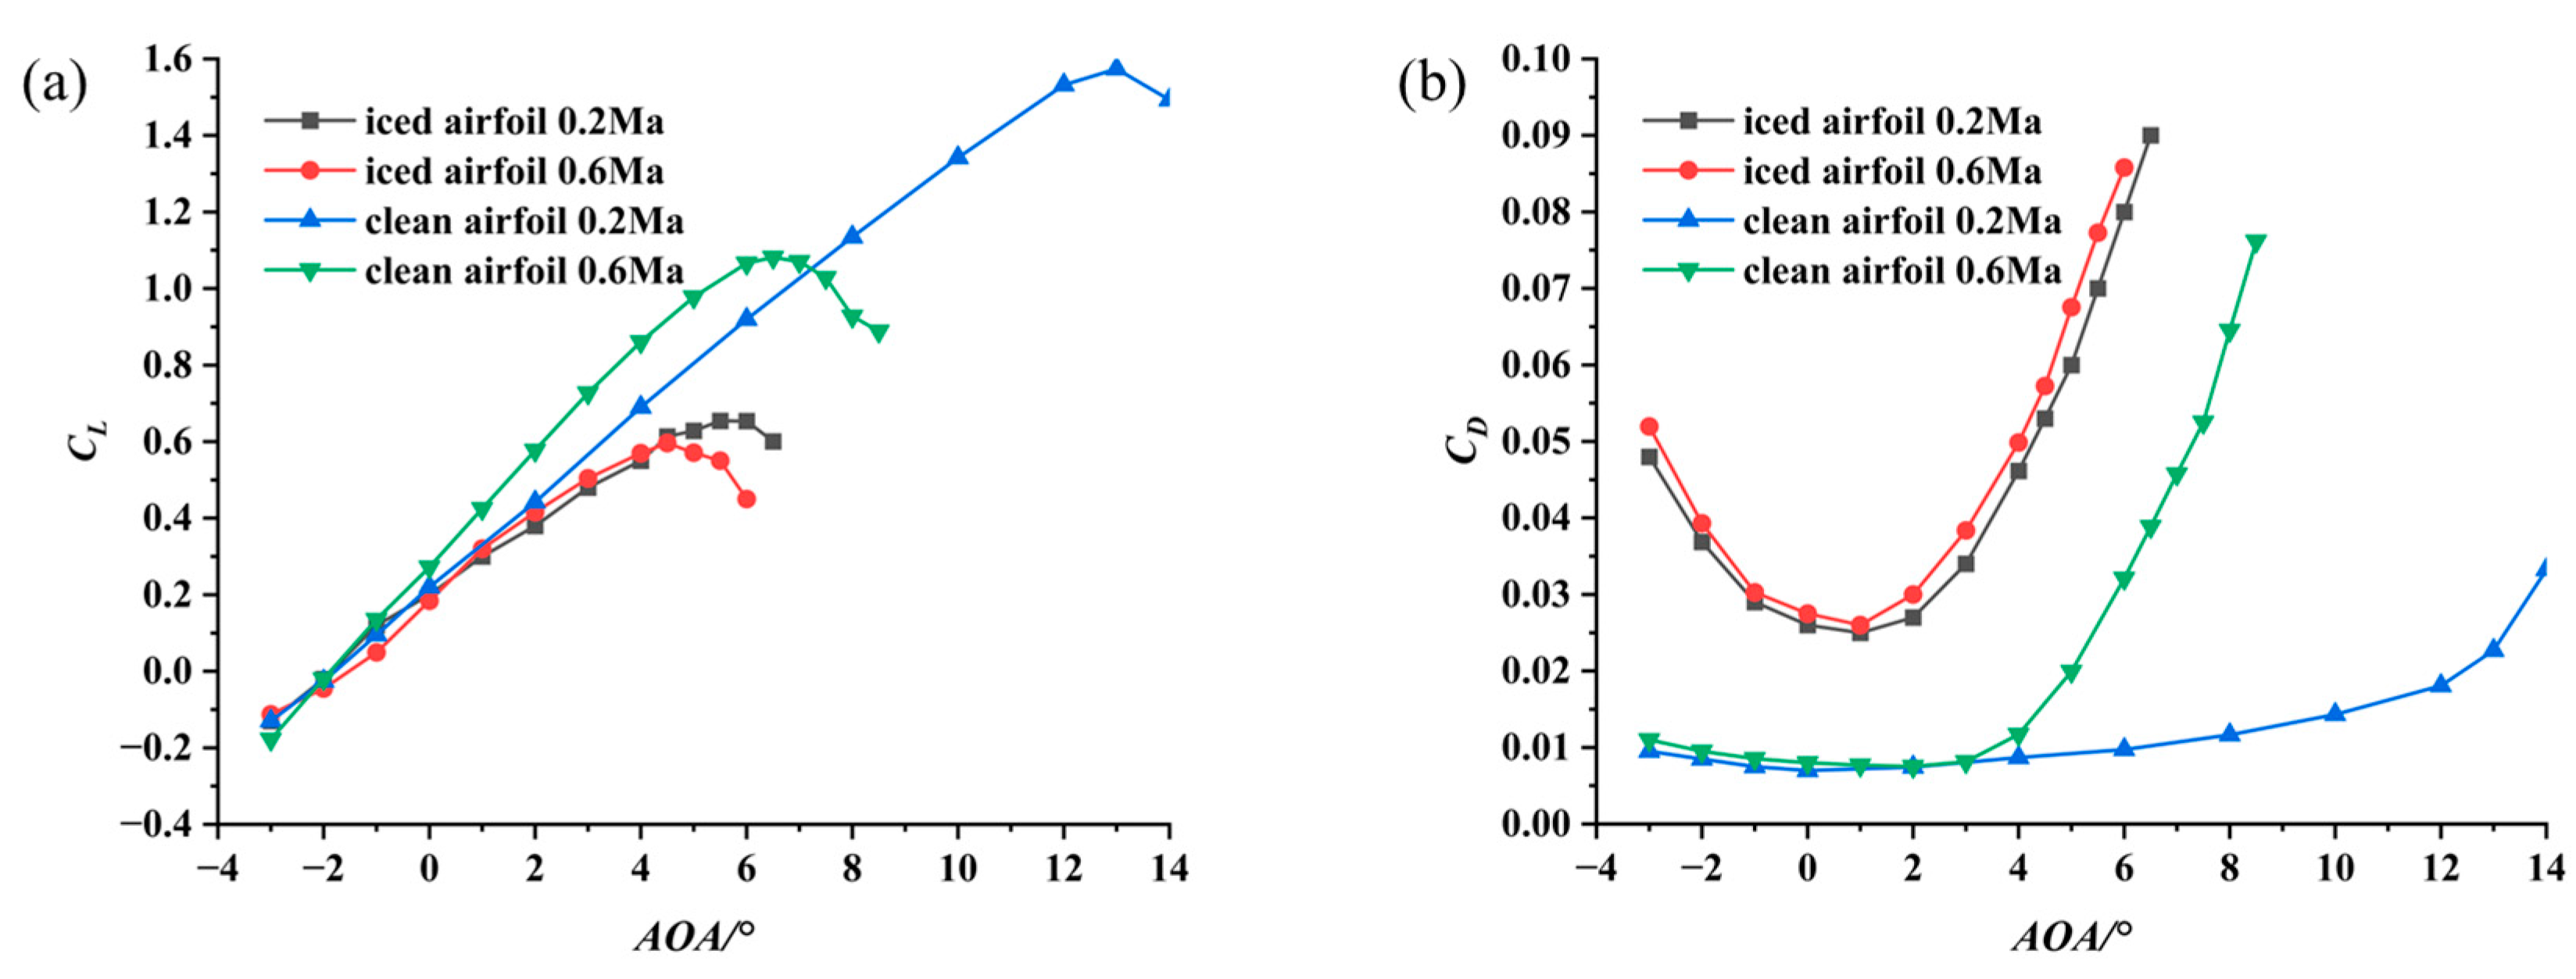
Figure 3: Variations of aerodynamic coefficients at different AOA and Ma: (a) CL vs. AoA; (b) CD vs. AoA.
To understand the underlying flow mechanisms causing these aerodynamic penalties, the pressure coefficient distributions and velocity fields are examined. Fig. 4 presents the pressure coefficient (CP) distributions for the clean and iced airfoils at different AOA under 0.2 Ma. The presence of the leading-edge ice shape significantly affects the pressure coefficient distribution, with more dramatic pressure variations on the leeward side of the ice horn. At 0.6 Ma, the shock wave at the leading edge disappears due to the influence of the ice horn on the flow characteristics, and a pronounced adverse pressure gradient forms (Fig. 5).
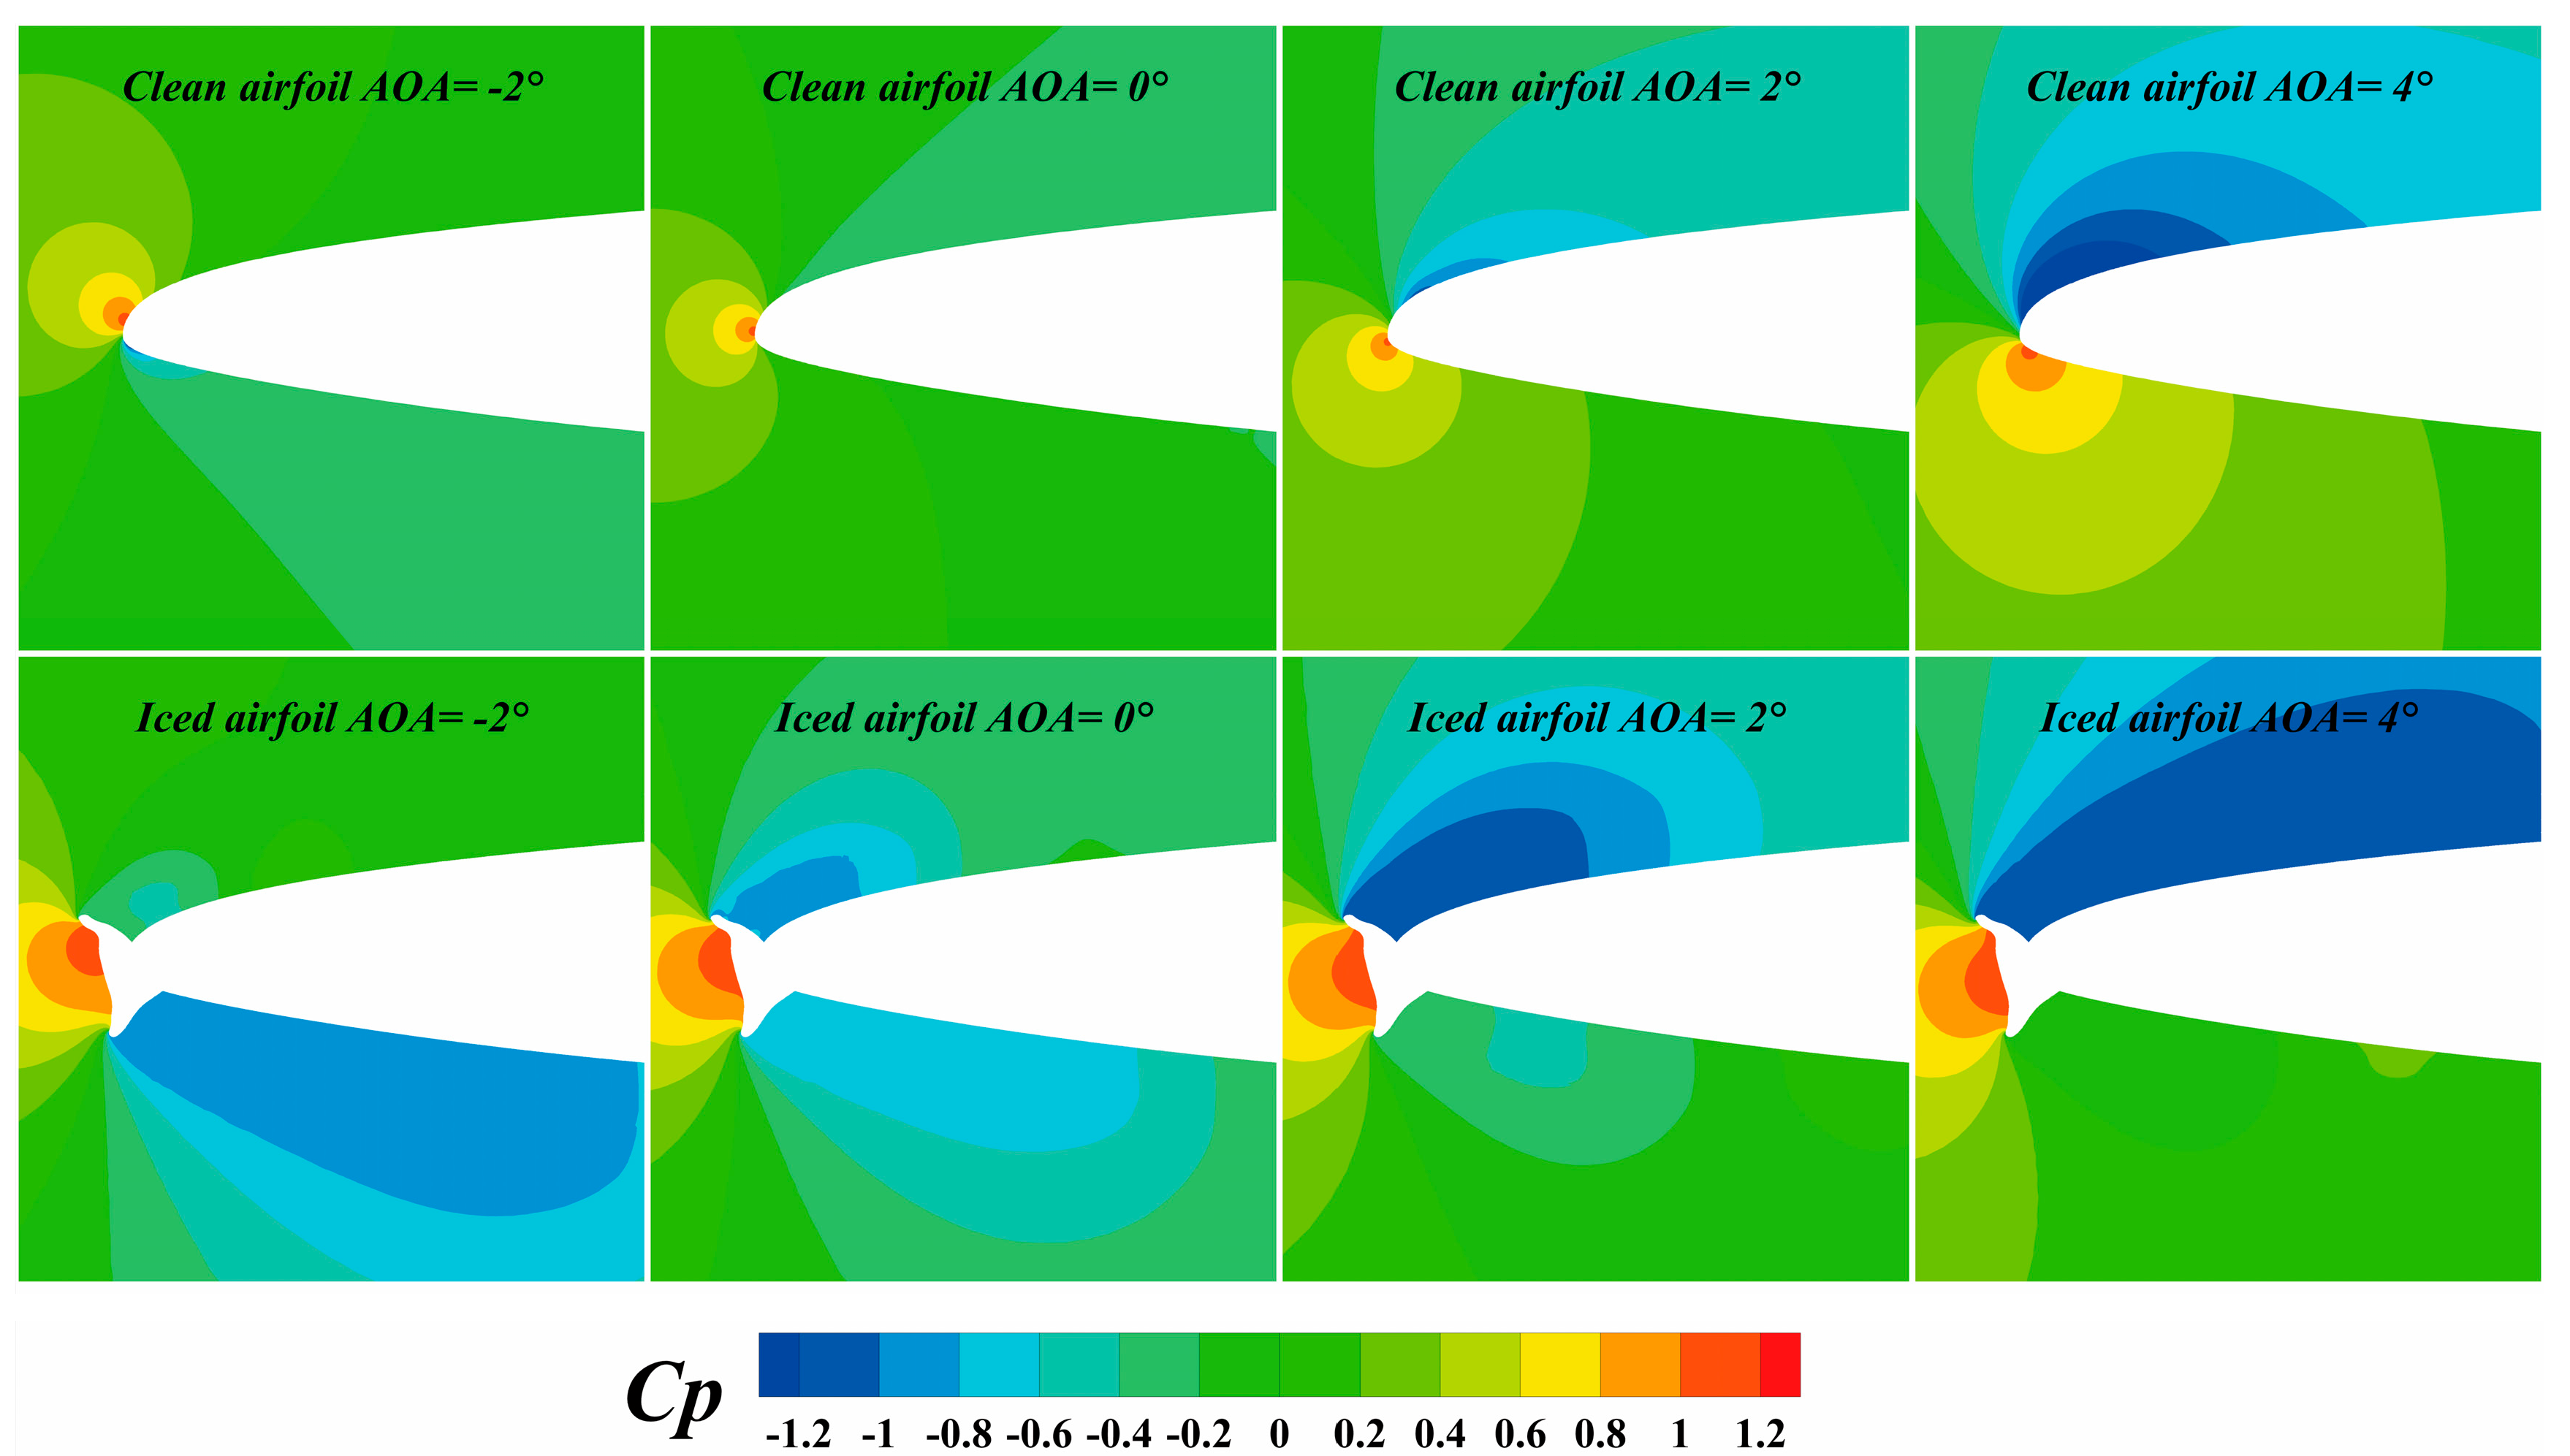
Figure 4: Pressure coefficient distributions at 0.2 Ma.
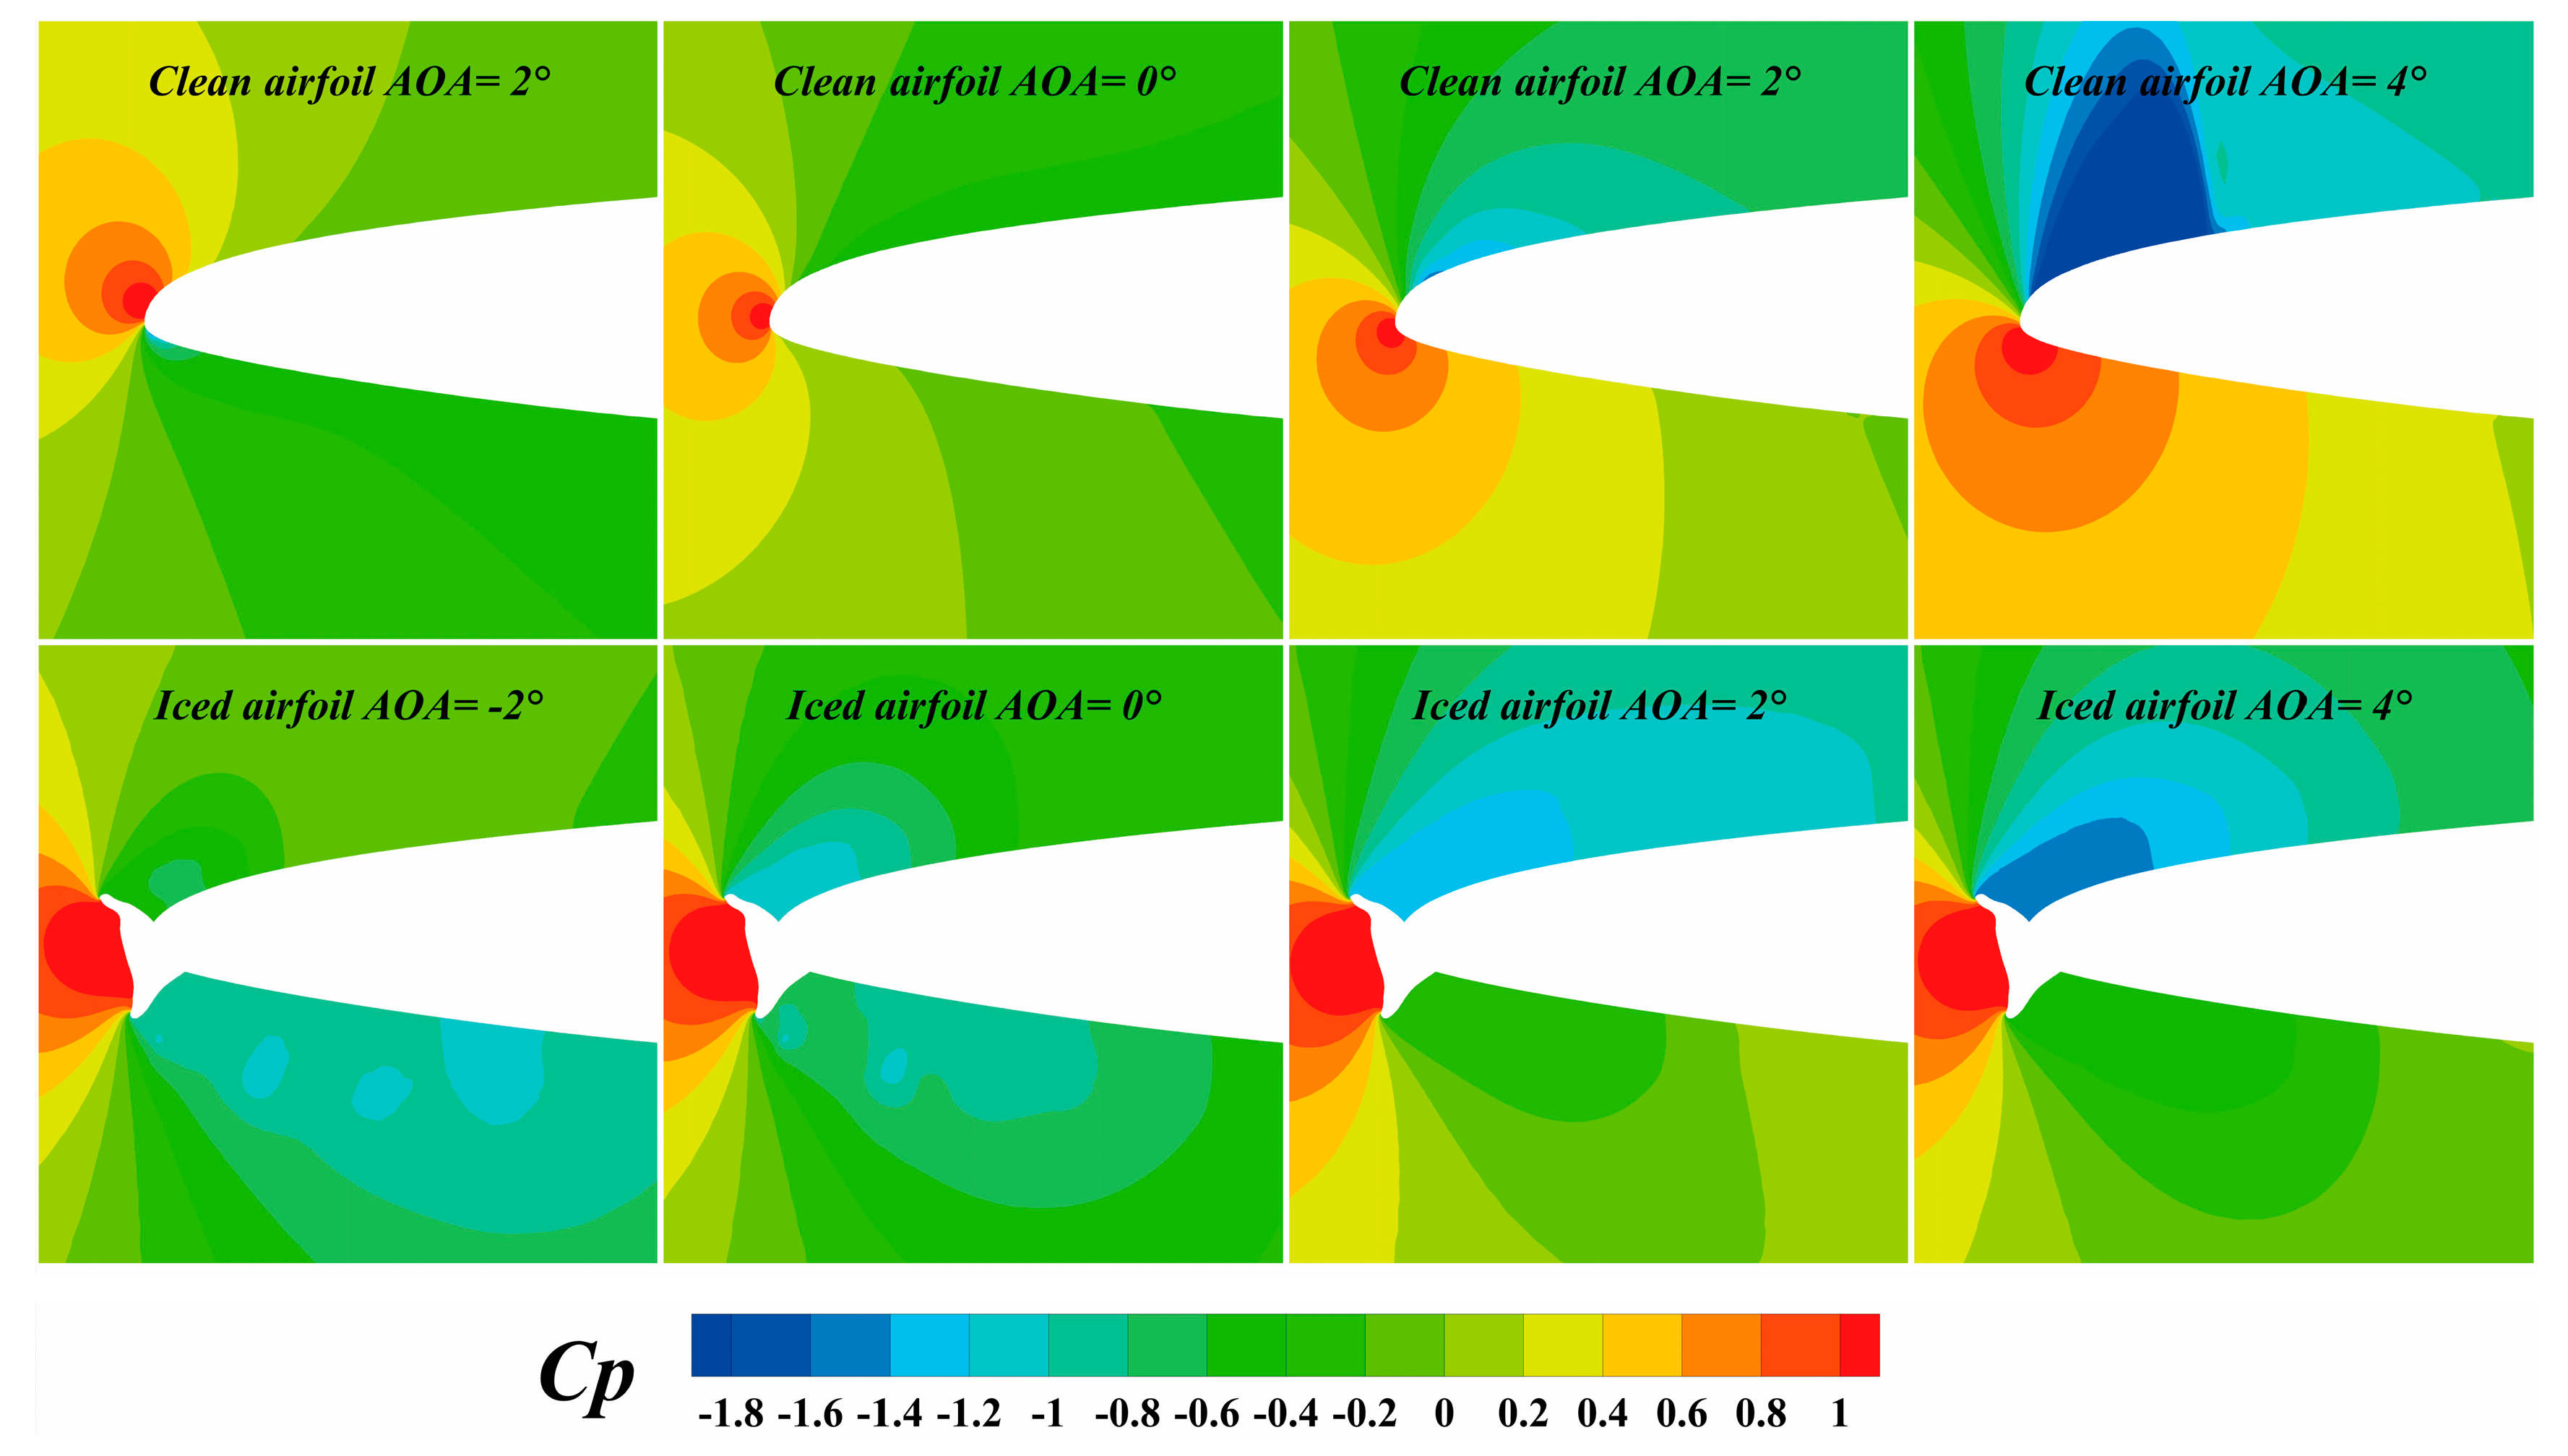
Figure 5: Pressure coefficient distributions at 0.6 Ma.
Fig. 6 illustrates velocity distributions and near-wall streamline distributions at different AOA under 0.2 Ma and 0.6 Ma. The horn ice disrupts the flow field at the leading edge, and distinct separation vortices appear behind the ice horn. As the angle of attack increases, the separation vortex region behind the lower ice horn gradually shrinks, while that behind the upper ice horn expands. At the stall angle, separation vortices cover the entire upper surface, causing complete flow detachment and a sharp drop in lift.
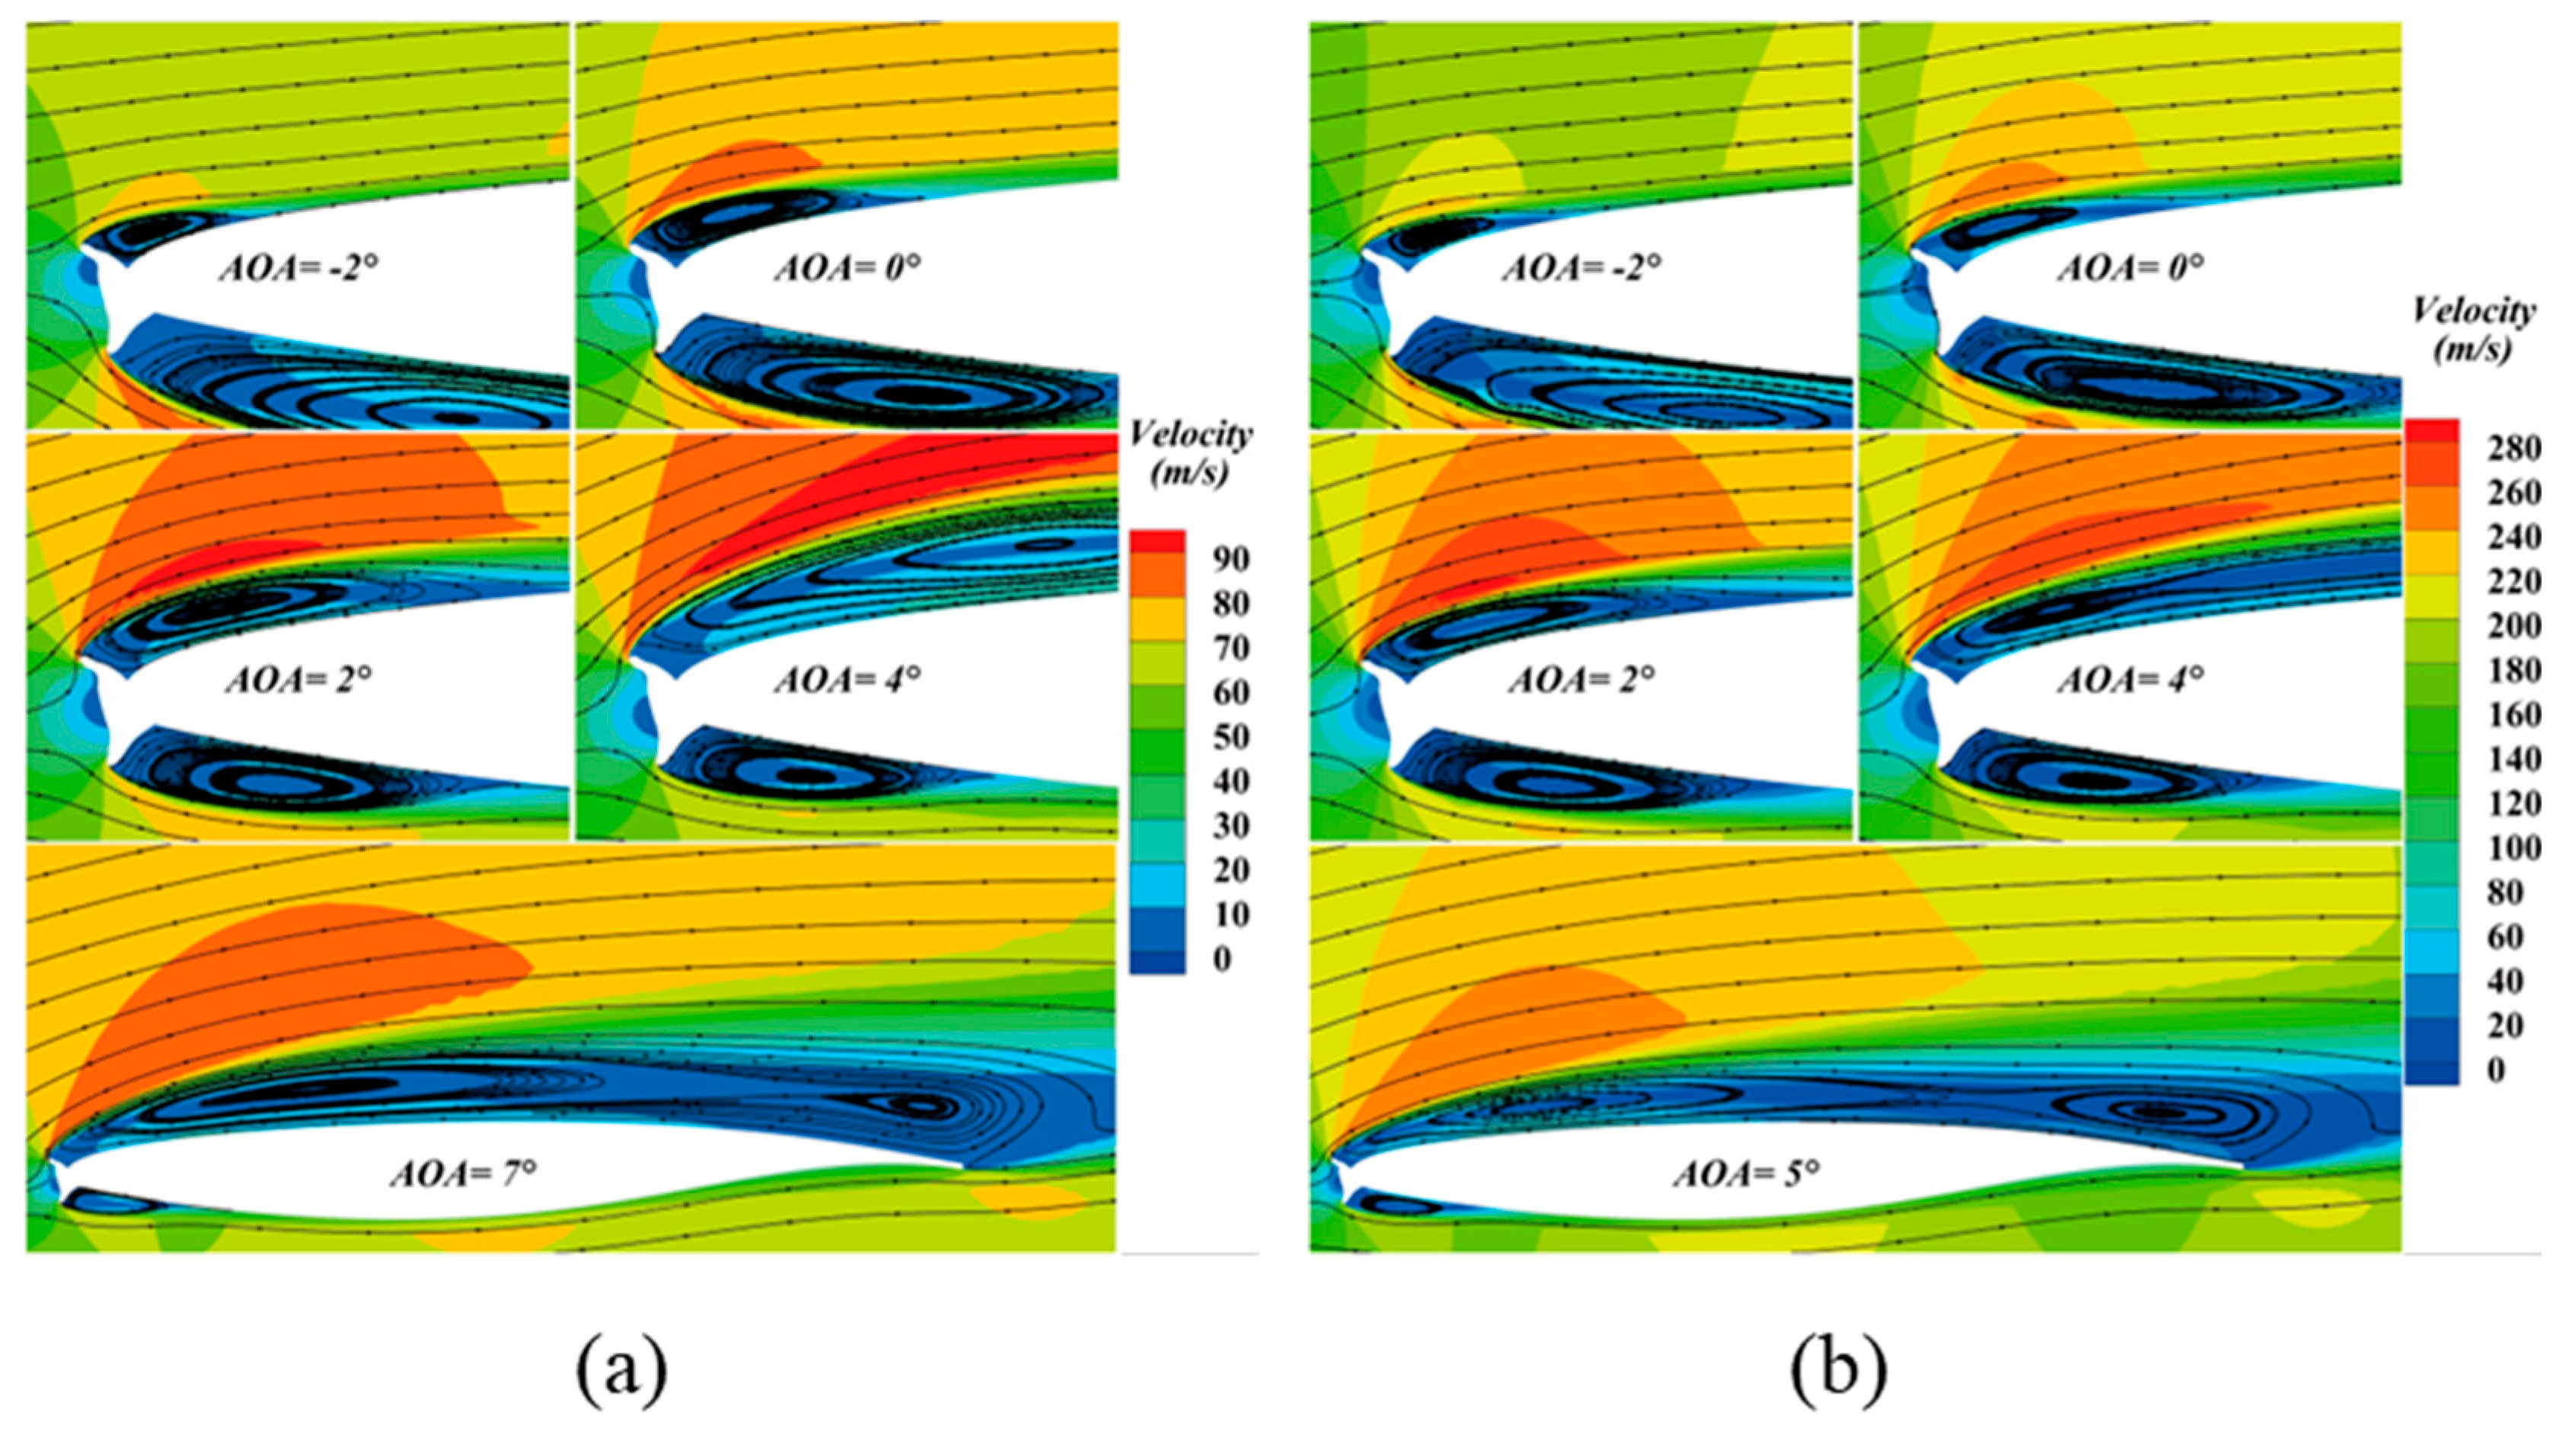
Figure 6: Velocity distributions and streamlines: (a) 0.2 Ma; (b) 0.6 Ma.
2.5 Comparison of Aerodynamic Loads
By extracting the aerodynamic forces along the chord and normal directions of the ice surface, it is possible to effectively compare the aerodynamic loads experienced at different angles of attack. Fig. 7 shows the computed aerodynamic loads per unit length on the ice surface. As the AOA increases, the normal load increases, while the chordwise load varies only slightly. Normal load peaks at stall angle with a maximum magnitude of 1.89 kN/m and declines sharply afterwards due to large-scale flow separation. In addition, an increase of Mach number leads to a noticeable rise in aerodynamic loads, imposing higher requirements on the structural strength of the ice shape. These loads serve as the input for the subsequent structural analysis of the simulated ice.
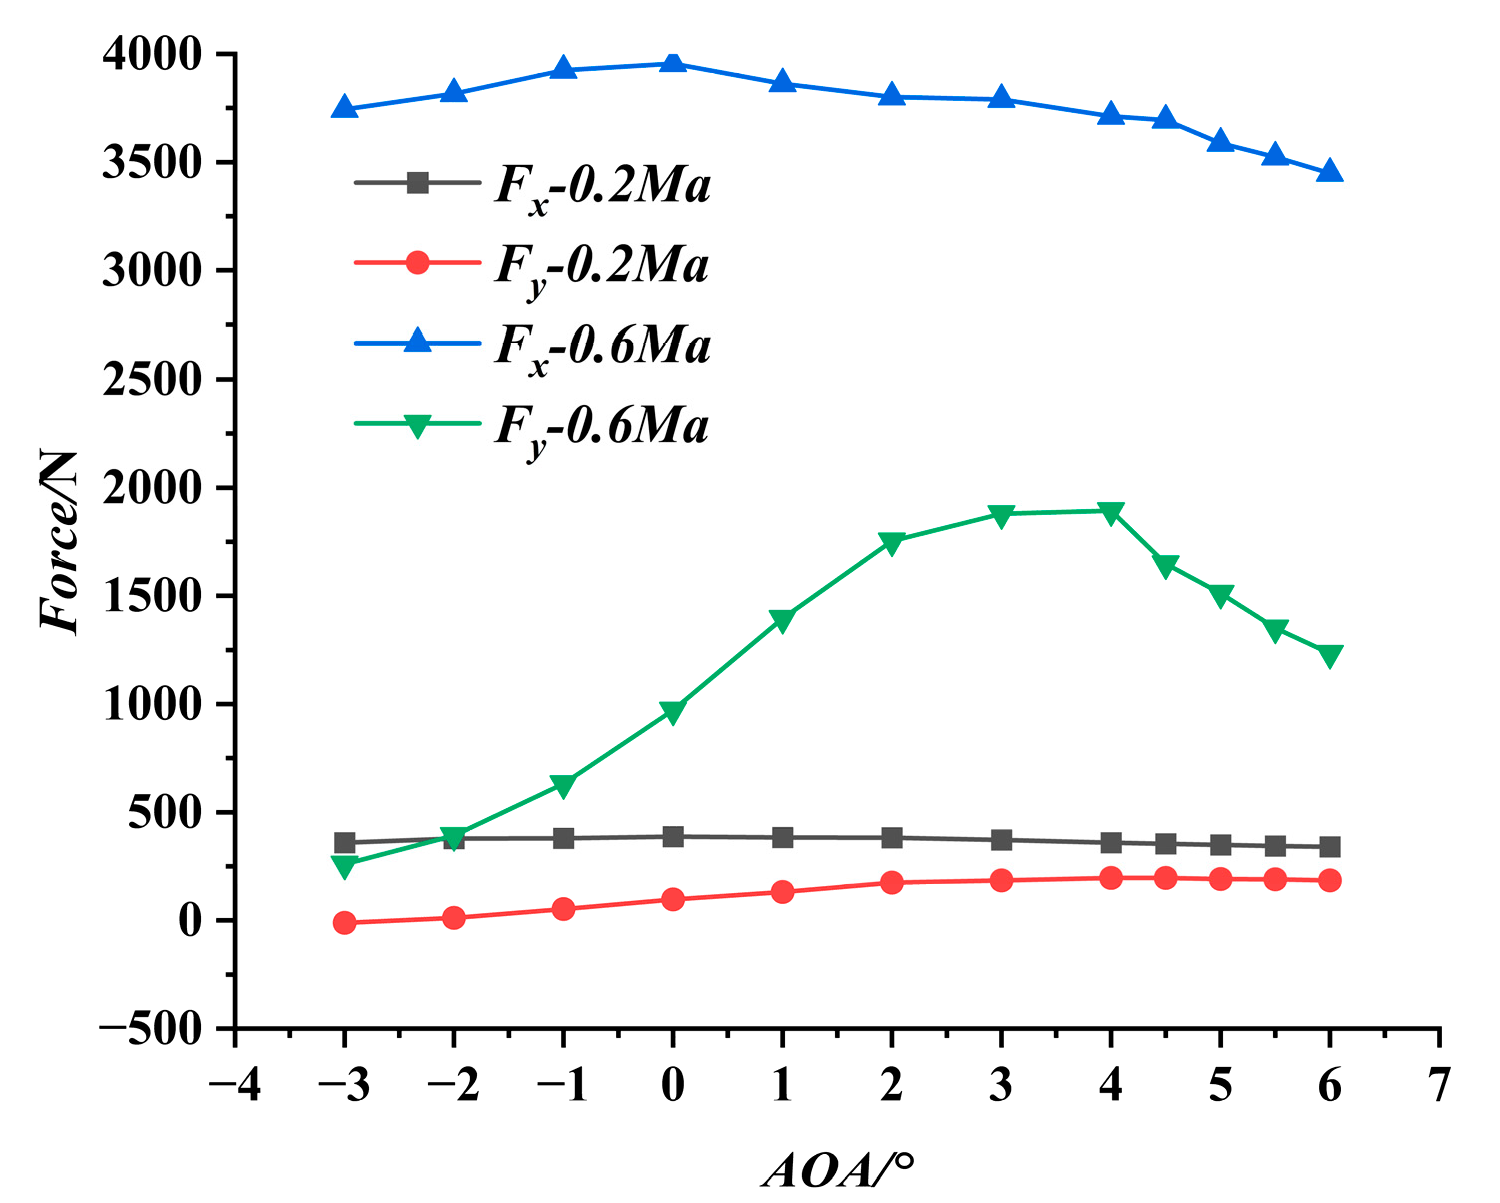
Figure 7: Aerodynamic loads per unit length on the ice surface.
3 Finite Element Simulation of the Simulated Ice Shape
Based on the above analysis, the computed profile was extruded by 250 mm to create a mechanical simulation model for subsequent load application and strength assessment.
3.1 Structural Design of Simulated Ice
The design of the simulated ice structure follows four principles: (a) adoption of commercially available conventional raw materials; (b) feasibility of high-precision mechanical machining; (c) moderate structural elasticity to accommodate minor elastic deformation of the host wing during flight; (d) simplified structural layout and manufacturing workflow for on-site engineering implementation.
Based on these principles, a composite sandwich structure consisting of a glass-fiber reinforced plastic (GFRP) skin with a UV-curable resin 3D-printed core was adopted, as shown in Fig. 8. To reduce weight, the 3D-printed core is hollow with a wall thickness of 1 mm.
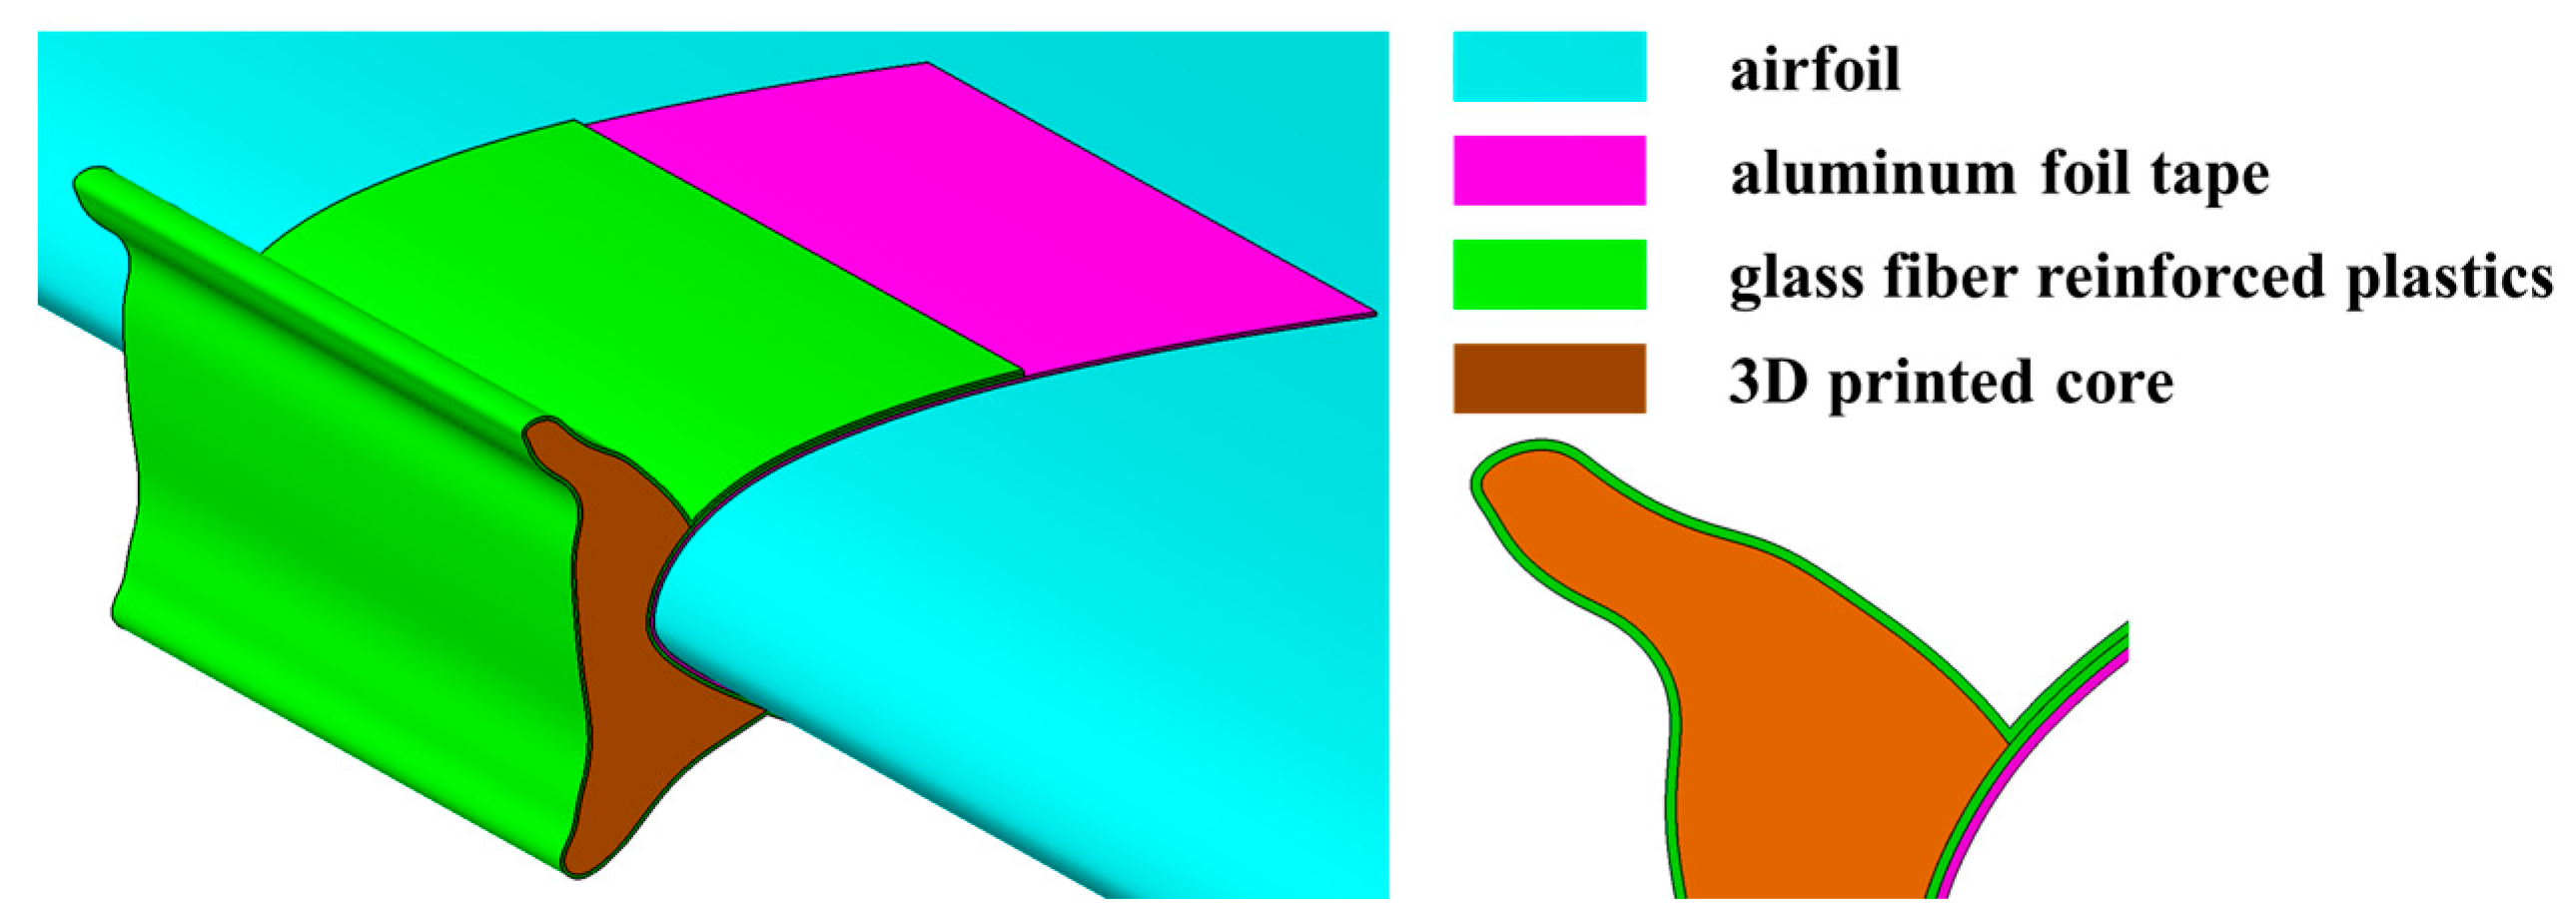
Figure 8: Schematic diagram of the proposed design.
Key advantages of the proposed design are summarized below: (a) aluminum foil tape is inserted between the ice specimen and airfoil to avoid direct contact and facilitate convenient post-test disassembly and surface cleaning; (b) 3D-printing guarantees high forming precision, low weight and satisfactory surface hardness of the inner core; (c) GFRP wraps the core and extends 50 mm chordwise to improve interfacial bonding strength; (d) assembly can be completed under ambient dry conditions without rigorous environmental constraints.
To meet the requirements of processing accuracy and material applicability, UV-curable resin was selected for processing. The UV light curing processing method is technologically mature and has no special process requirements. The UV-curable resin system adopts a cationic photopolymerization epoxy system. Since it does not require a heating source, it can undergo polymerization through UV irradiation. Traditional thermosetting epoxy requires a temperature increase of over 60°C, which can cause slight melting of ice corners and loss of corresponding geometric features. By using segmented and thin-layer UV exposure, the heat release and shrinkage stress during polymerization can be reduced; glass fiber fillers further inhibit part warping and dimensional deviation, making it suitable for high-precision and complex curved surface ice model printing [29].
Simulations were performed using Abaqus/Standard. The airfoil was modeled as an analytical rigid body since the airfoil deformation during actual flight was small and negligible. C3D8R elements were used to mesh the composite material and the 3D-printed core. The finite element model is shown in the Fig. 9a, comprising 422,550 elements with a mesh quality greater than 0.9. In the model, three layers of zero thickness cohesive elements [30] were also inserted at the inner surface of the outer glass fiber layer (the blue outer adhesive layer in Fig. 9b), the inner surface of the core (the yellow middle adhesive layer in Fig. 9b), and the inner surface of the inner glass fiber layer (the red inner adhesive layer in Fig. 9b). By adding this adhesive layer, simulations can be conducted on the surface delamination between the composite material and the core material (the blue outer adhesive layer and the yellow middle adhesive layer), as well as between the structure and the airfoil (the red inner adhesive layer).
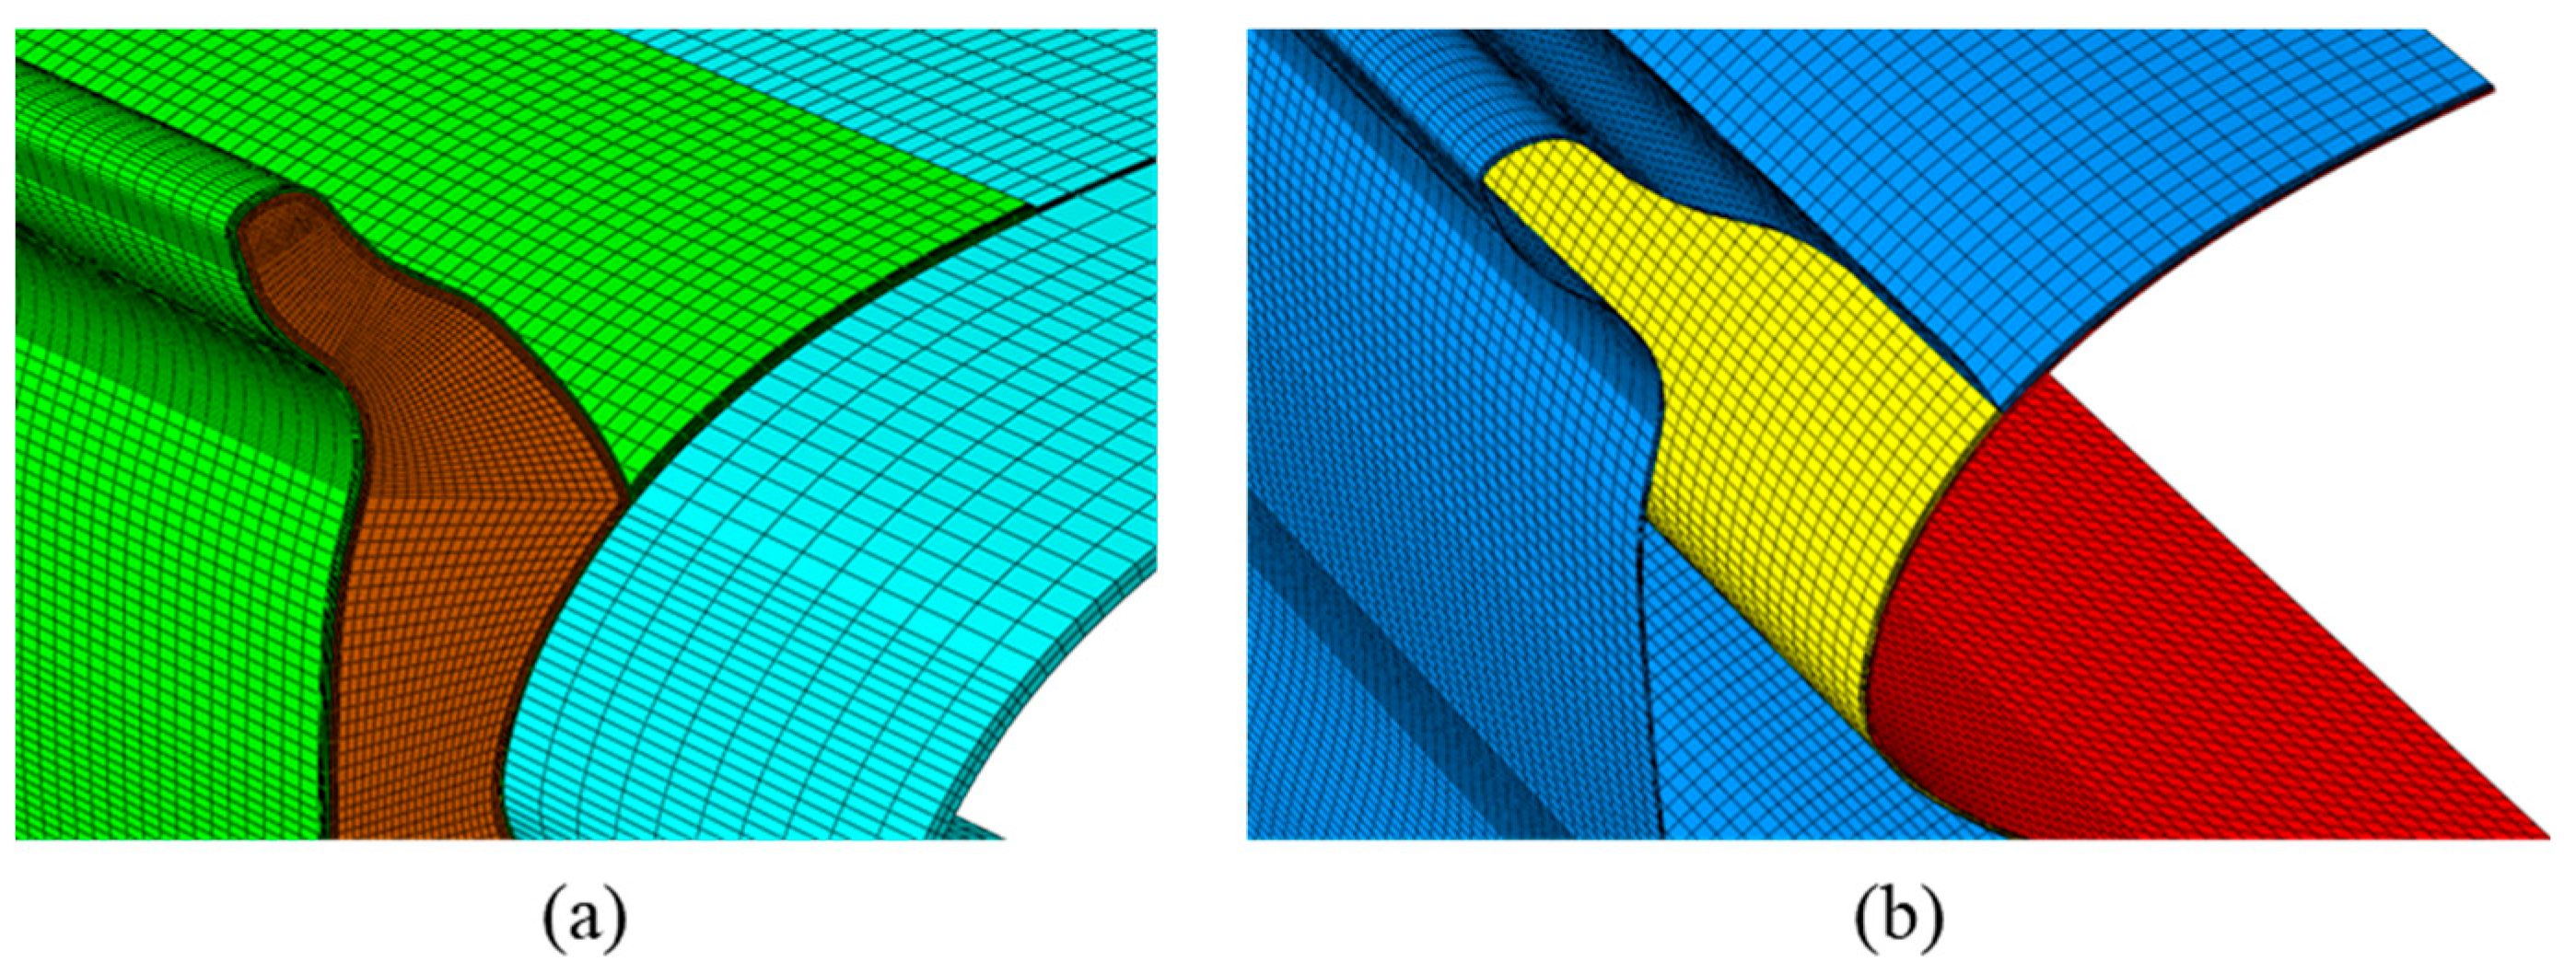
Figure 9: Finite element model: (a) total elements; (b) cohesive elements.
To evaluate the overall structural strength, damage criteria were defined. For interface failure, a traction-separation constitutive law was adopted for the cohesive elements. The elastic constitutive equation is expressed as:
A quadratic stress criterion was used to determine damage initiation:
ABAQUS intrinsic variable SDEG quantifies cohesive-layer damage: damage initiates when SDEG > 0 and full debonding (complete load loss) occurs at SDEG = 1. The Tsai-Wu failure criterion [31] is used to predict intralaminar failure of GFRP and coded into a user subroutine. Composite remains intact when SDV1 < 1 and initiates damage when SDV1 = 1, where SDV1 denotes the failure index defined by
The UV-curable resin (9111A) has a density of 1100 kg/m3, an elastic modulus of 3.64 GPa, and a Poisson’s ratio of 0.33. The thermal deformation temperature of this material is 54°C, and the glass transition temperature is 80.8°C. Both of these are higher than the flight environment, ensuring that the material will not deform during the flight test. It undergoes curing under 355 nm ultraviolet light and can be processed on a 3D printer (ZRapid iSLA660), offering great processing convenience.
Table 3 lists key parameters of the epoxy-based GFRP to be used in finite element analysis, including elastic modulus (E1, E2, E3) in three principal directions, Poisson’s ratio (v12, v13, v23), shear modulus (G12, G13, G23), in-plane shear strength (S12), as well as directional tensile strengths (XT, YT) and compressive strengths (XC, YC).
Table 3: Material properties of GFRP [32].
| | | | | | | | | |
|---|---|---|---|---|---|---|---|---|
| 20,960 | 18,065 | 5680 | 3420 | 2130 | 2130 | 0.13 | 0.29 | 0.29 |
| 488 | 303 | 380 | 253 | 67 | 2.0 |
The mechanical properties of the adhesive interlayer, including cohesive strength, fracture energy, and stiffness parameters, are detailed in Table 4. The equivalent thickness of the adhesive layer is 0.1 mm.
Table 4: Material properties of adhesive layer [32].
| 30,000 | 10,000 | 10,000 | 2.63 | 1.39 | 1.39 | 0.56 | 0.92 | 0.92 |
As demonstrated in Section 2, aerodynamic loads reached maximum magnitude at stall conditions, and normal load dominates structural failure risk during practical flight certification tests. The axial load, when viewed from a macroscopic perspective, exerts a pressure load on the simulated ice model. However, it does not cause the ice model to fall off, so it is not taken into account. Since the simulation model is a uniform cross-section model, the aerodynamic loads applied to each section are consistent. To facilitate comparison with the subsequent test conditions, all nodes on the upper surface of simulated ice are kinematically coupled to a single reference point, and displacement-controlled normal loading is applied incrementally until global structural collapse. The structural safety factor is defined as the ratio between ultimate simulated failure load and peak operational aerodynamic load.
3.3 Numerical Simulation Results
The load-displacement curve shown in Fig. 10 indicates that the ultimate failure load of the 250 mm-span specimen is 2.20 kN, corresponding to a unit-length failure load of 8.80 kN/m, far beyond the maximum applied aerodynamic normal load of 1.89 kN/m. The resultant structural safety factor is calculated as 4.65, which fully satisfies flight-test structural integrity requirements.
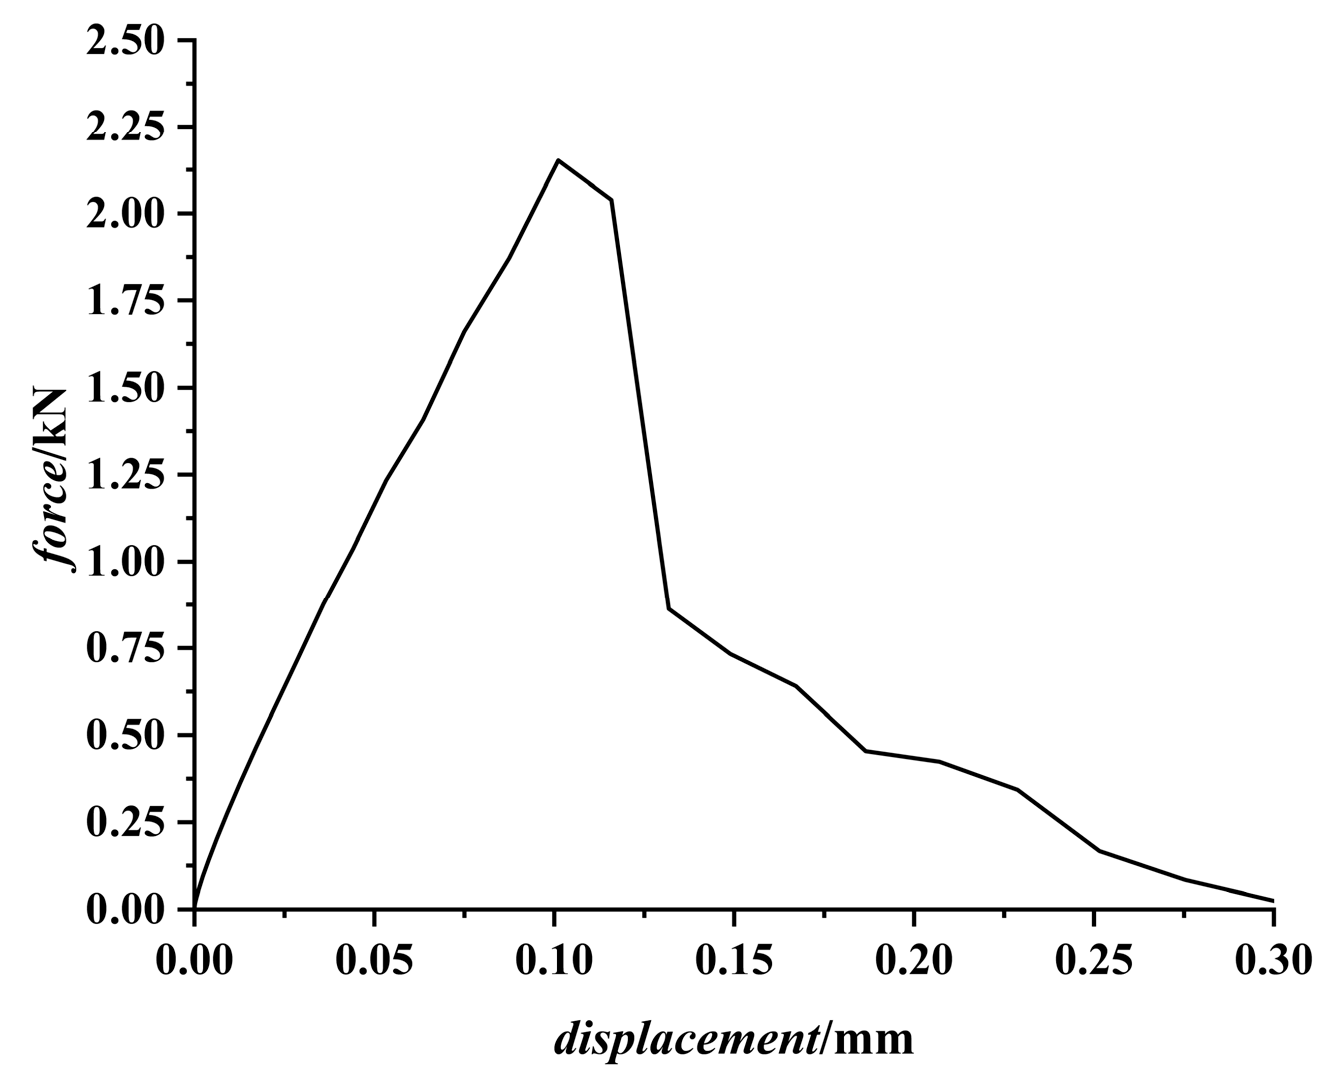
Figure 10: The load-displacement curve.
Fig. 11 shows the adhesive damage cloud at displacement loading of 0.028 mm. Initial interfacial damage emerges at the leading edge of inner and middle adhesive layers, accompanied by minor localized damage at outer adhesive bonding junctions.
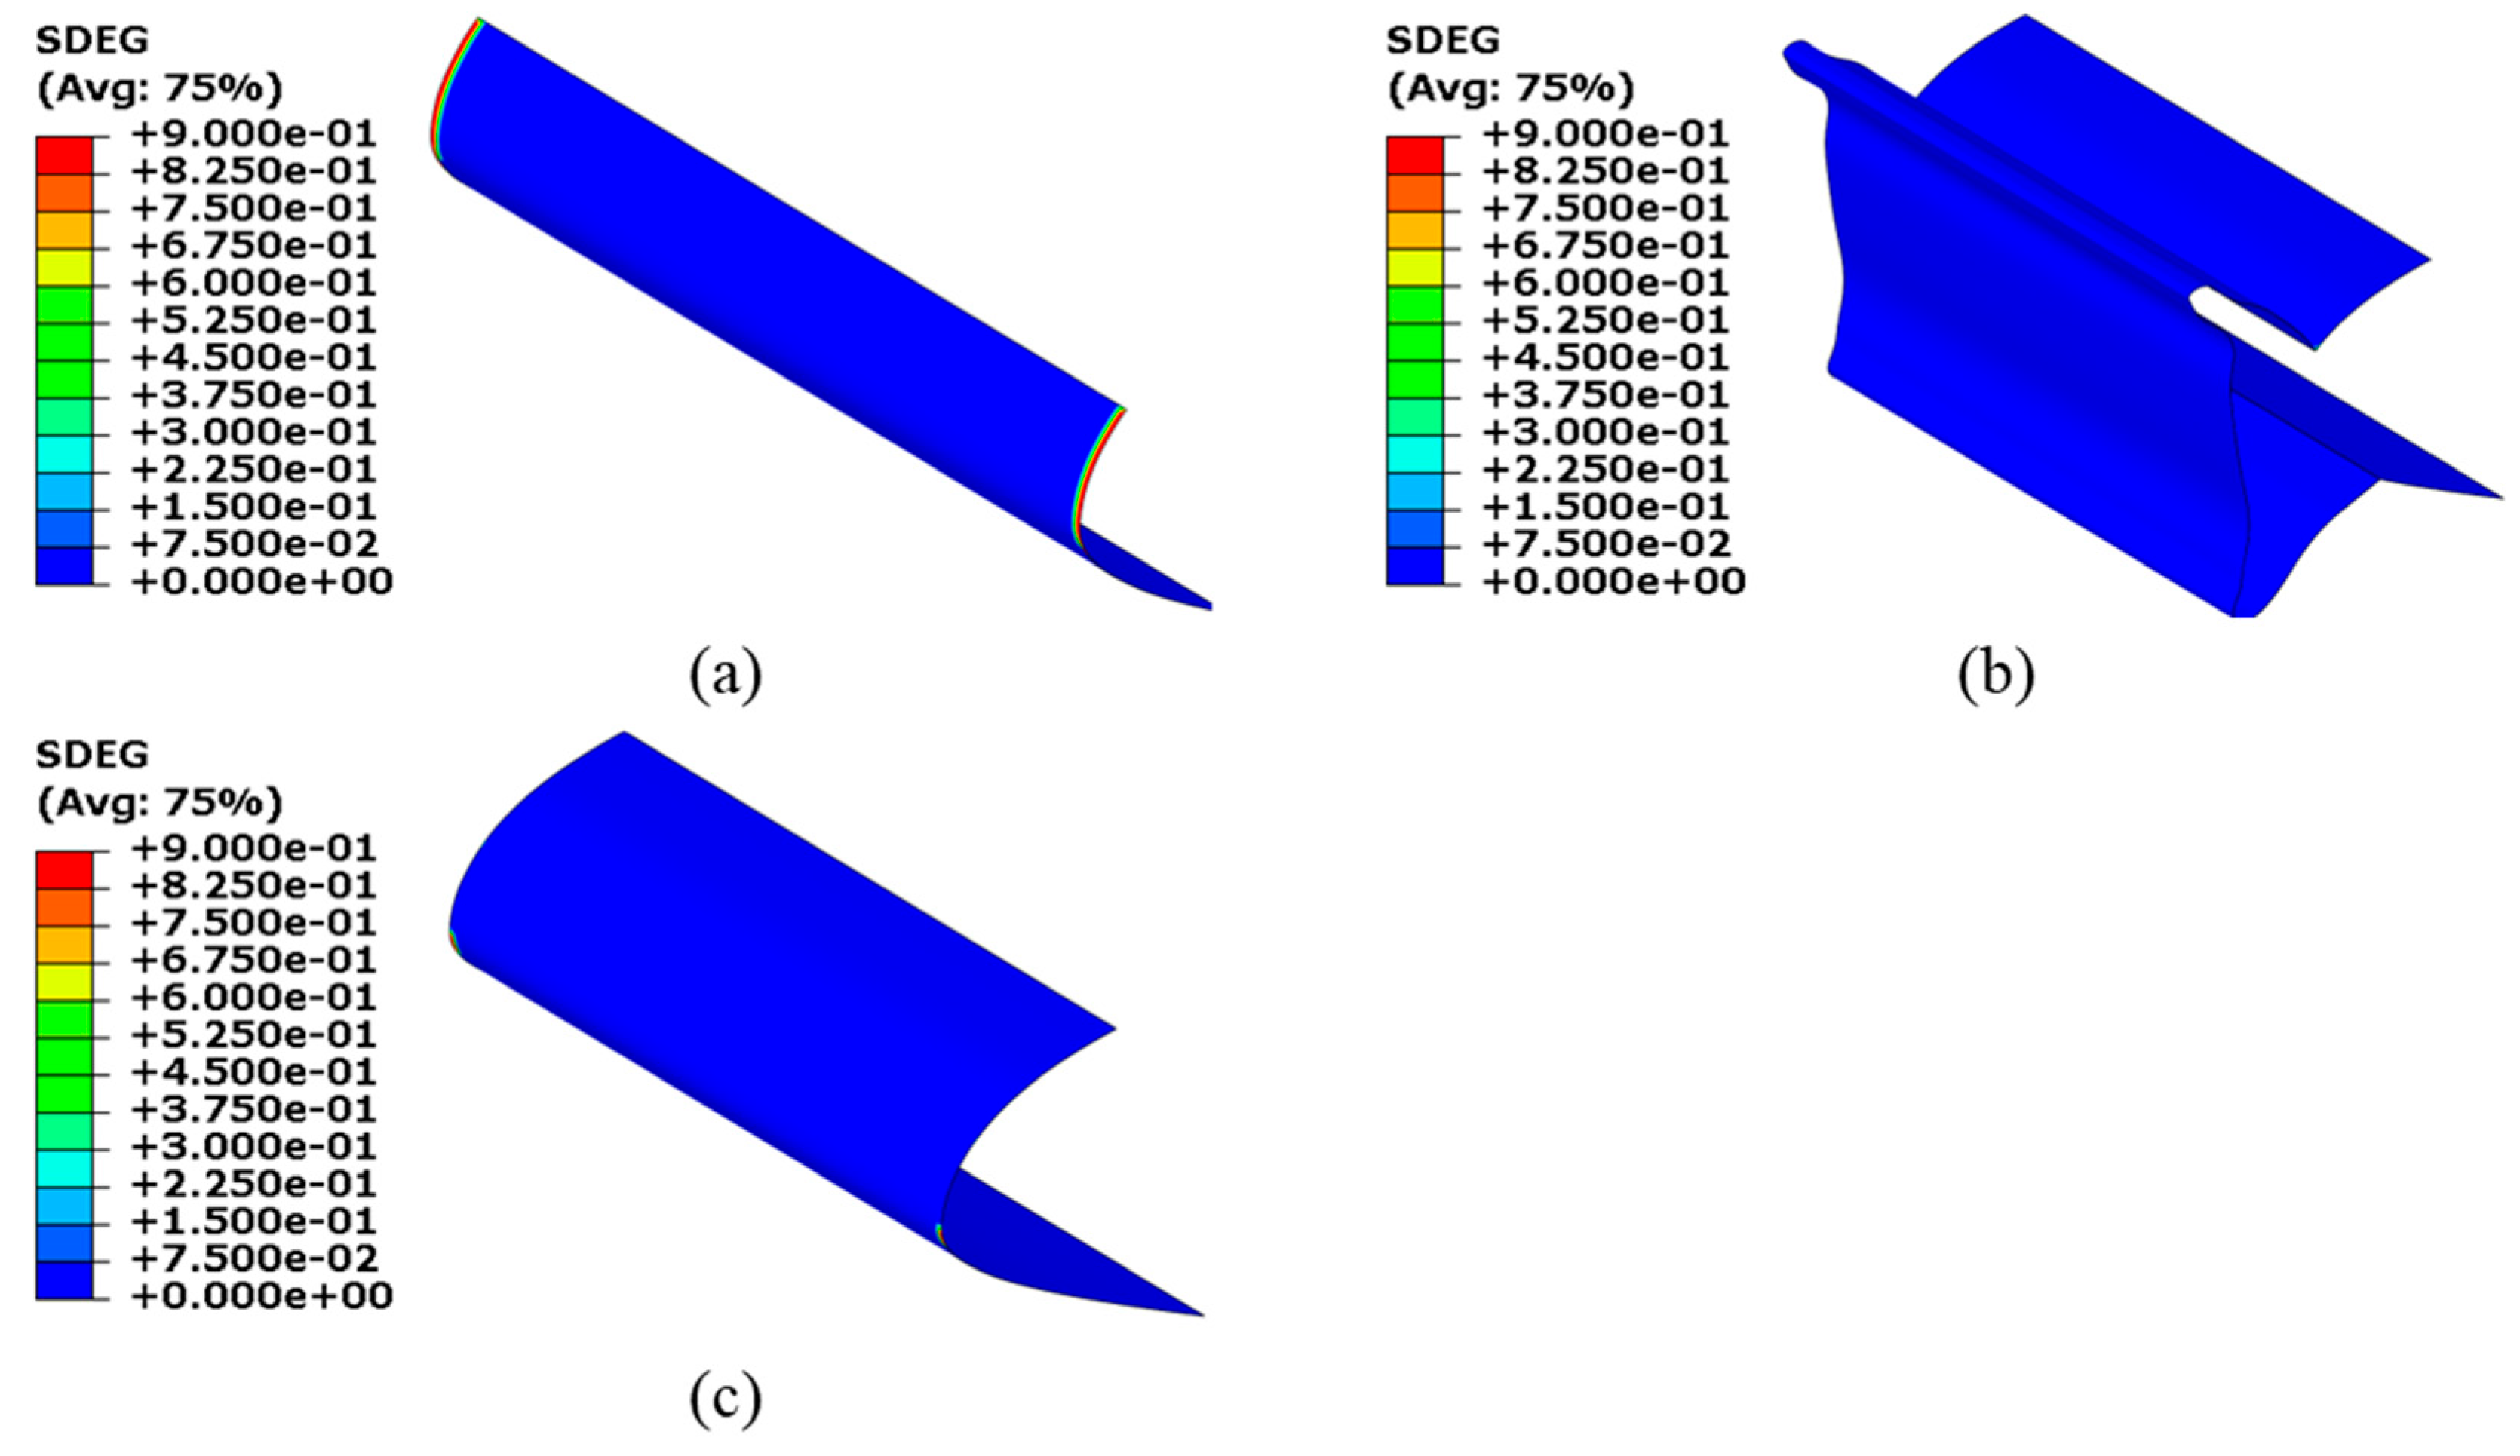
Figure 11: Adhesive damage cloud at displacement loading of 0.028 mm: (a) middle adhesive; (b) outer adhesive; (c) inner adhesive.
Fig. 12 shows the adhesive damage cloud at the peak load. With load progressively increasing to the peak load, damage propagates along all adhesive edges, while chordwise-extended outer adhesive layer remains intact and sustains residual structural load.
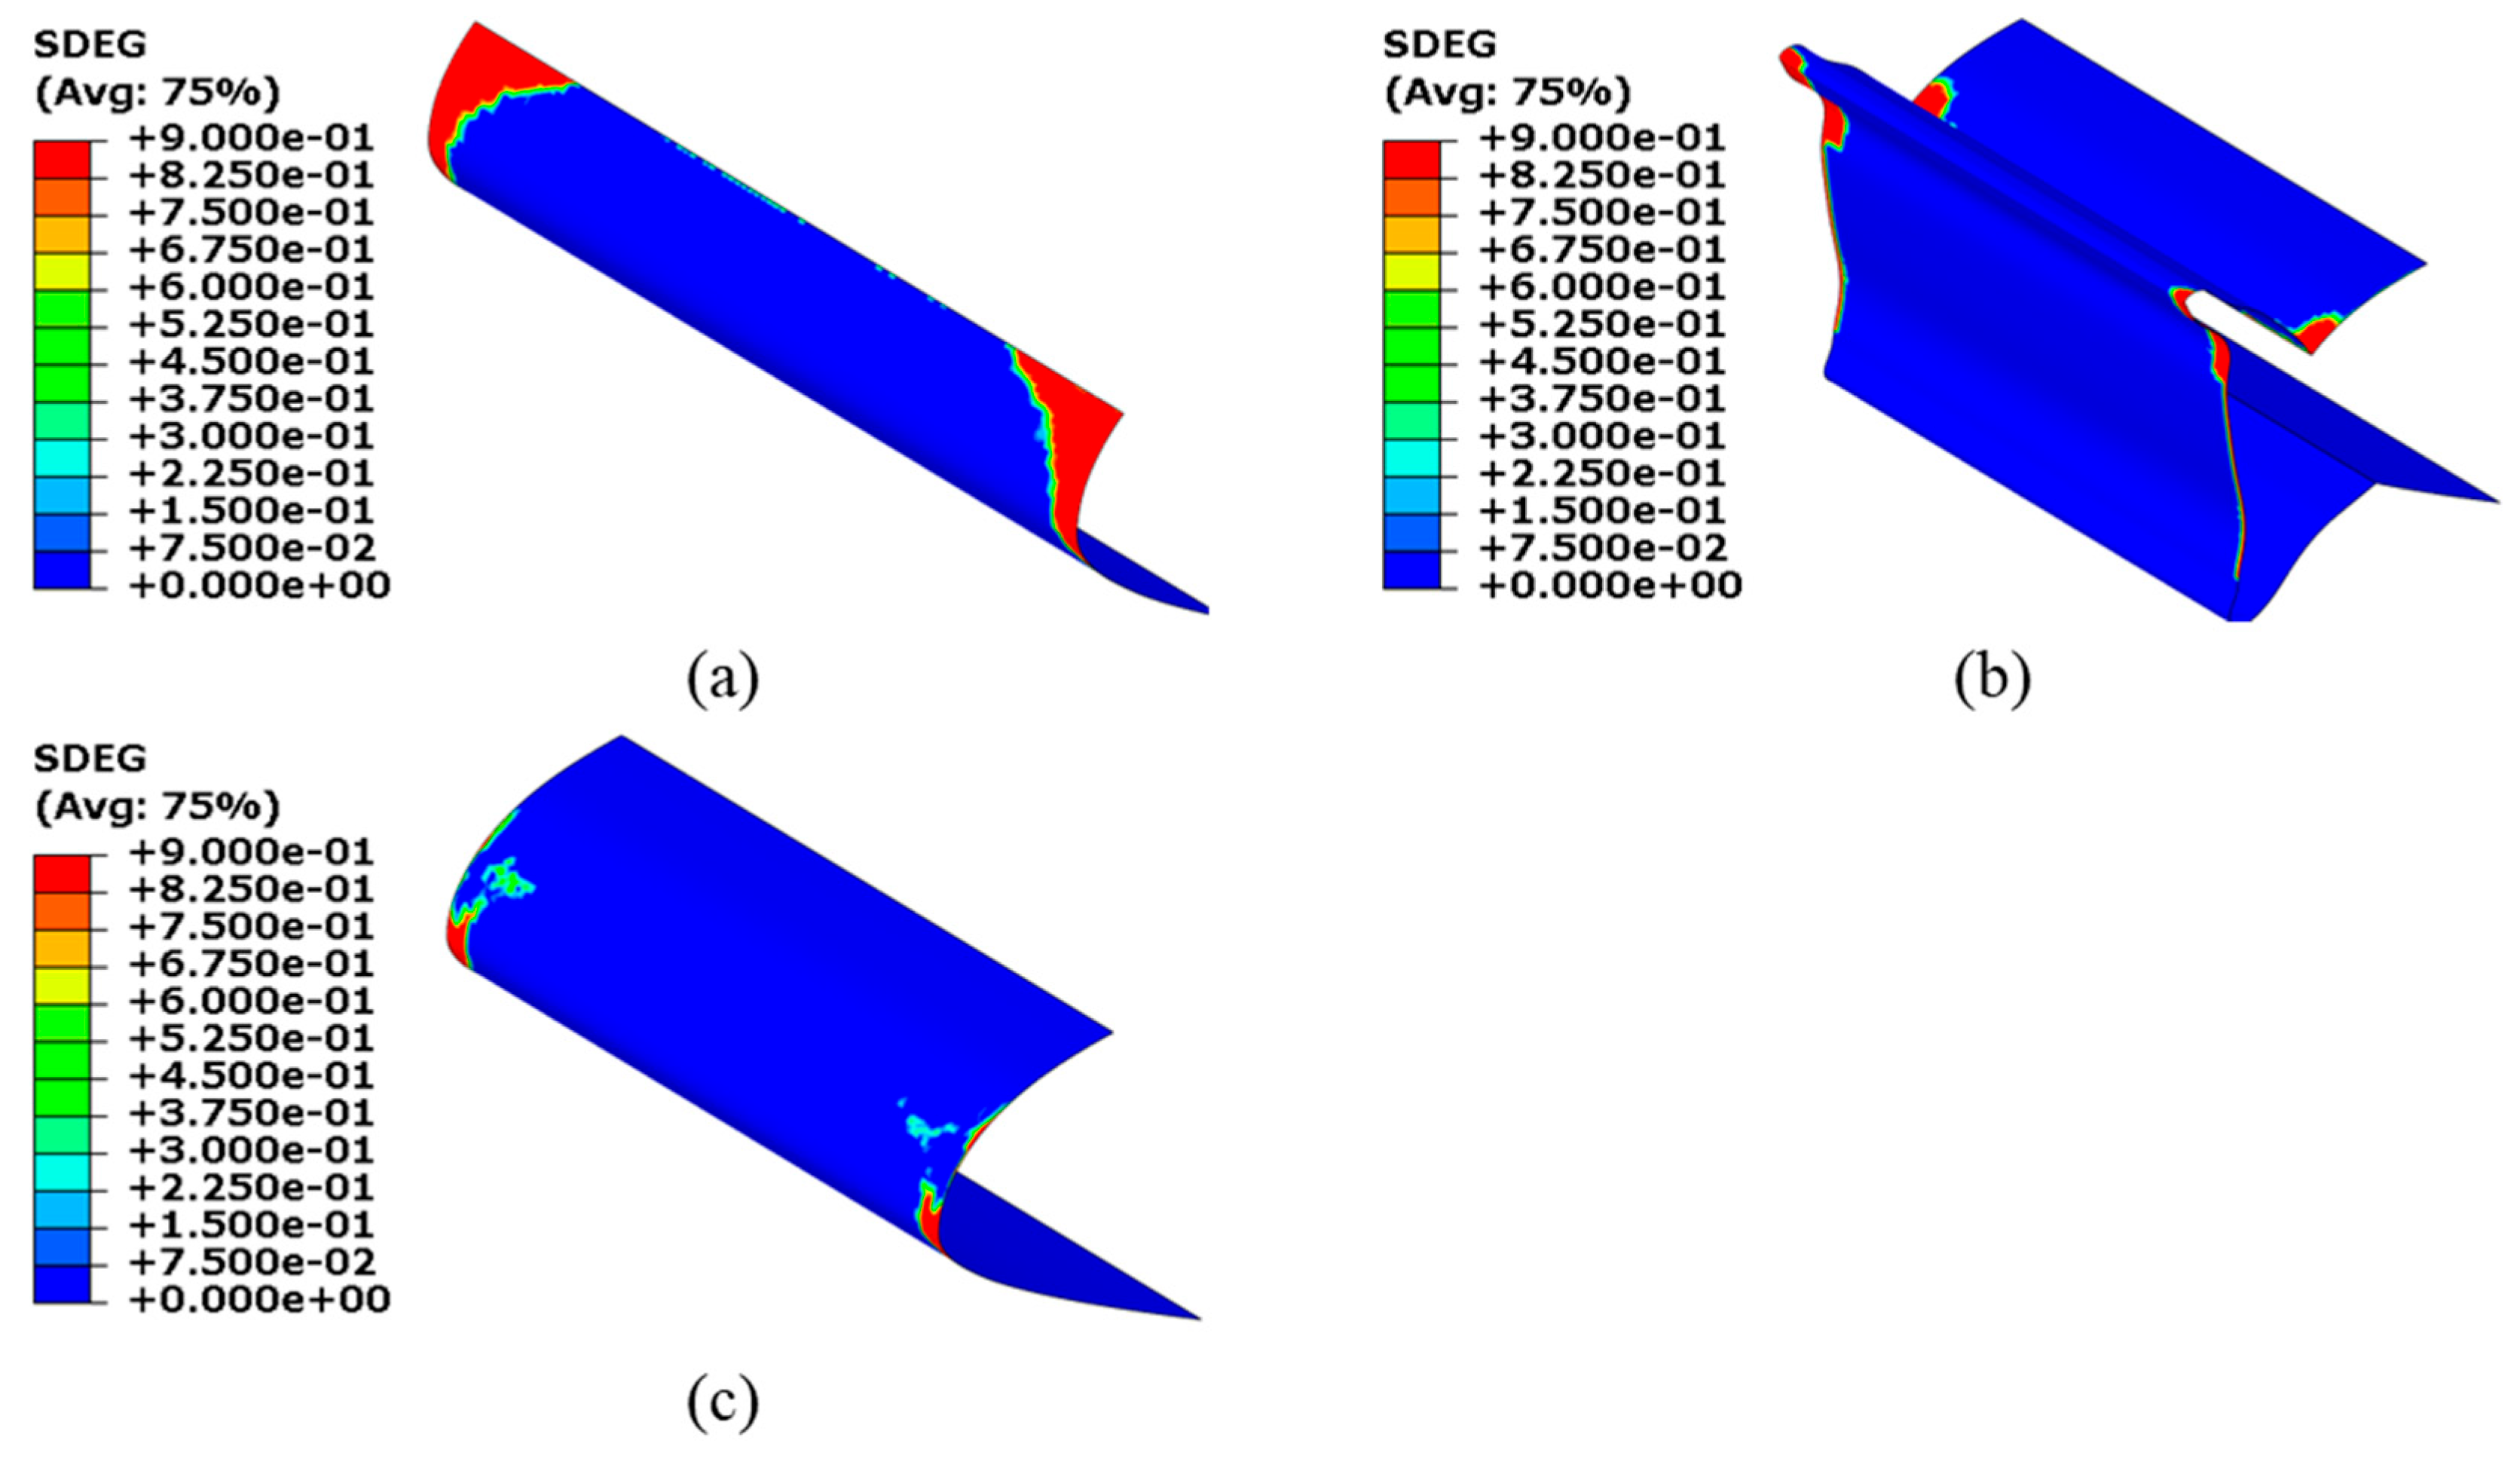
Figure 12: Adhesive damage cloud at peak load: (a) middle adhesive; (b) outer adhesive; (c) inner adhesive.
Fig. 13 shows the adhesive damage cloud under further loading after the peak load. It is seen that damage in the middle and outer adhesive layers expands from the core junction outward, reducing the effective bonding area and causing a continuous decrease in load-carrying capacity, eventually leading to debonding.
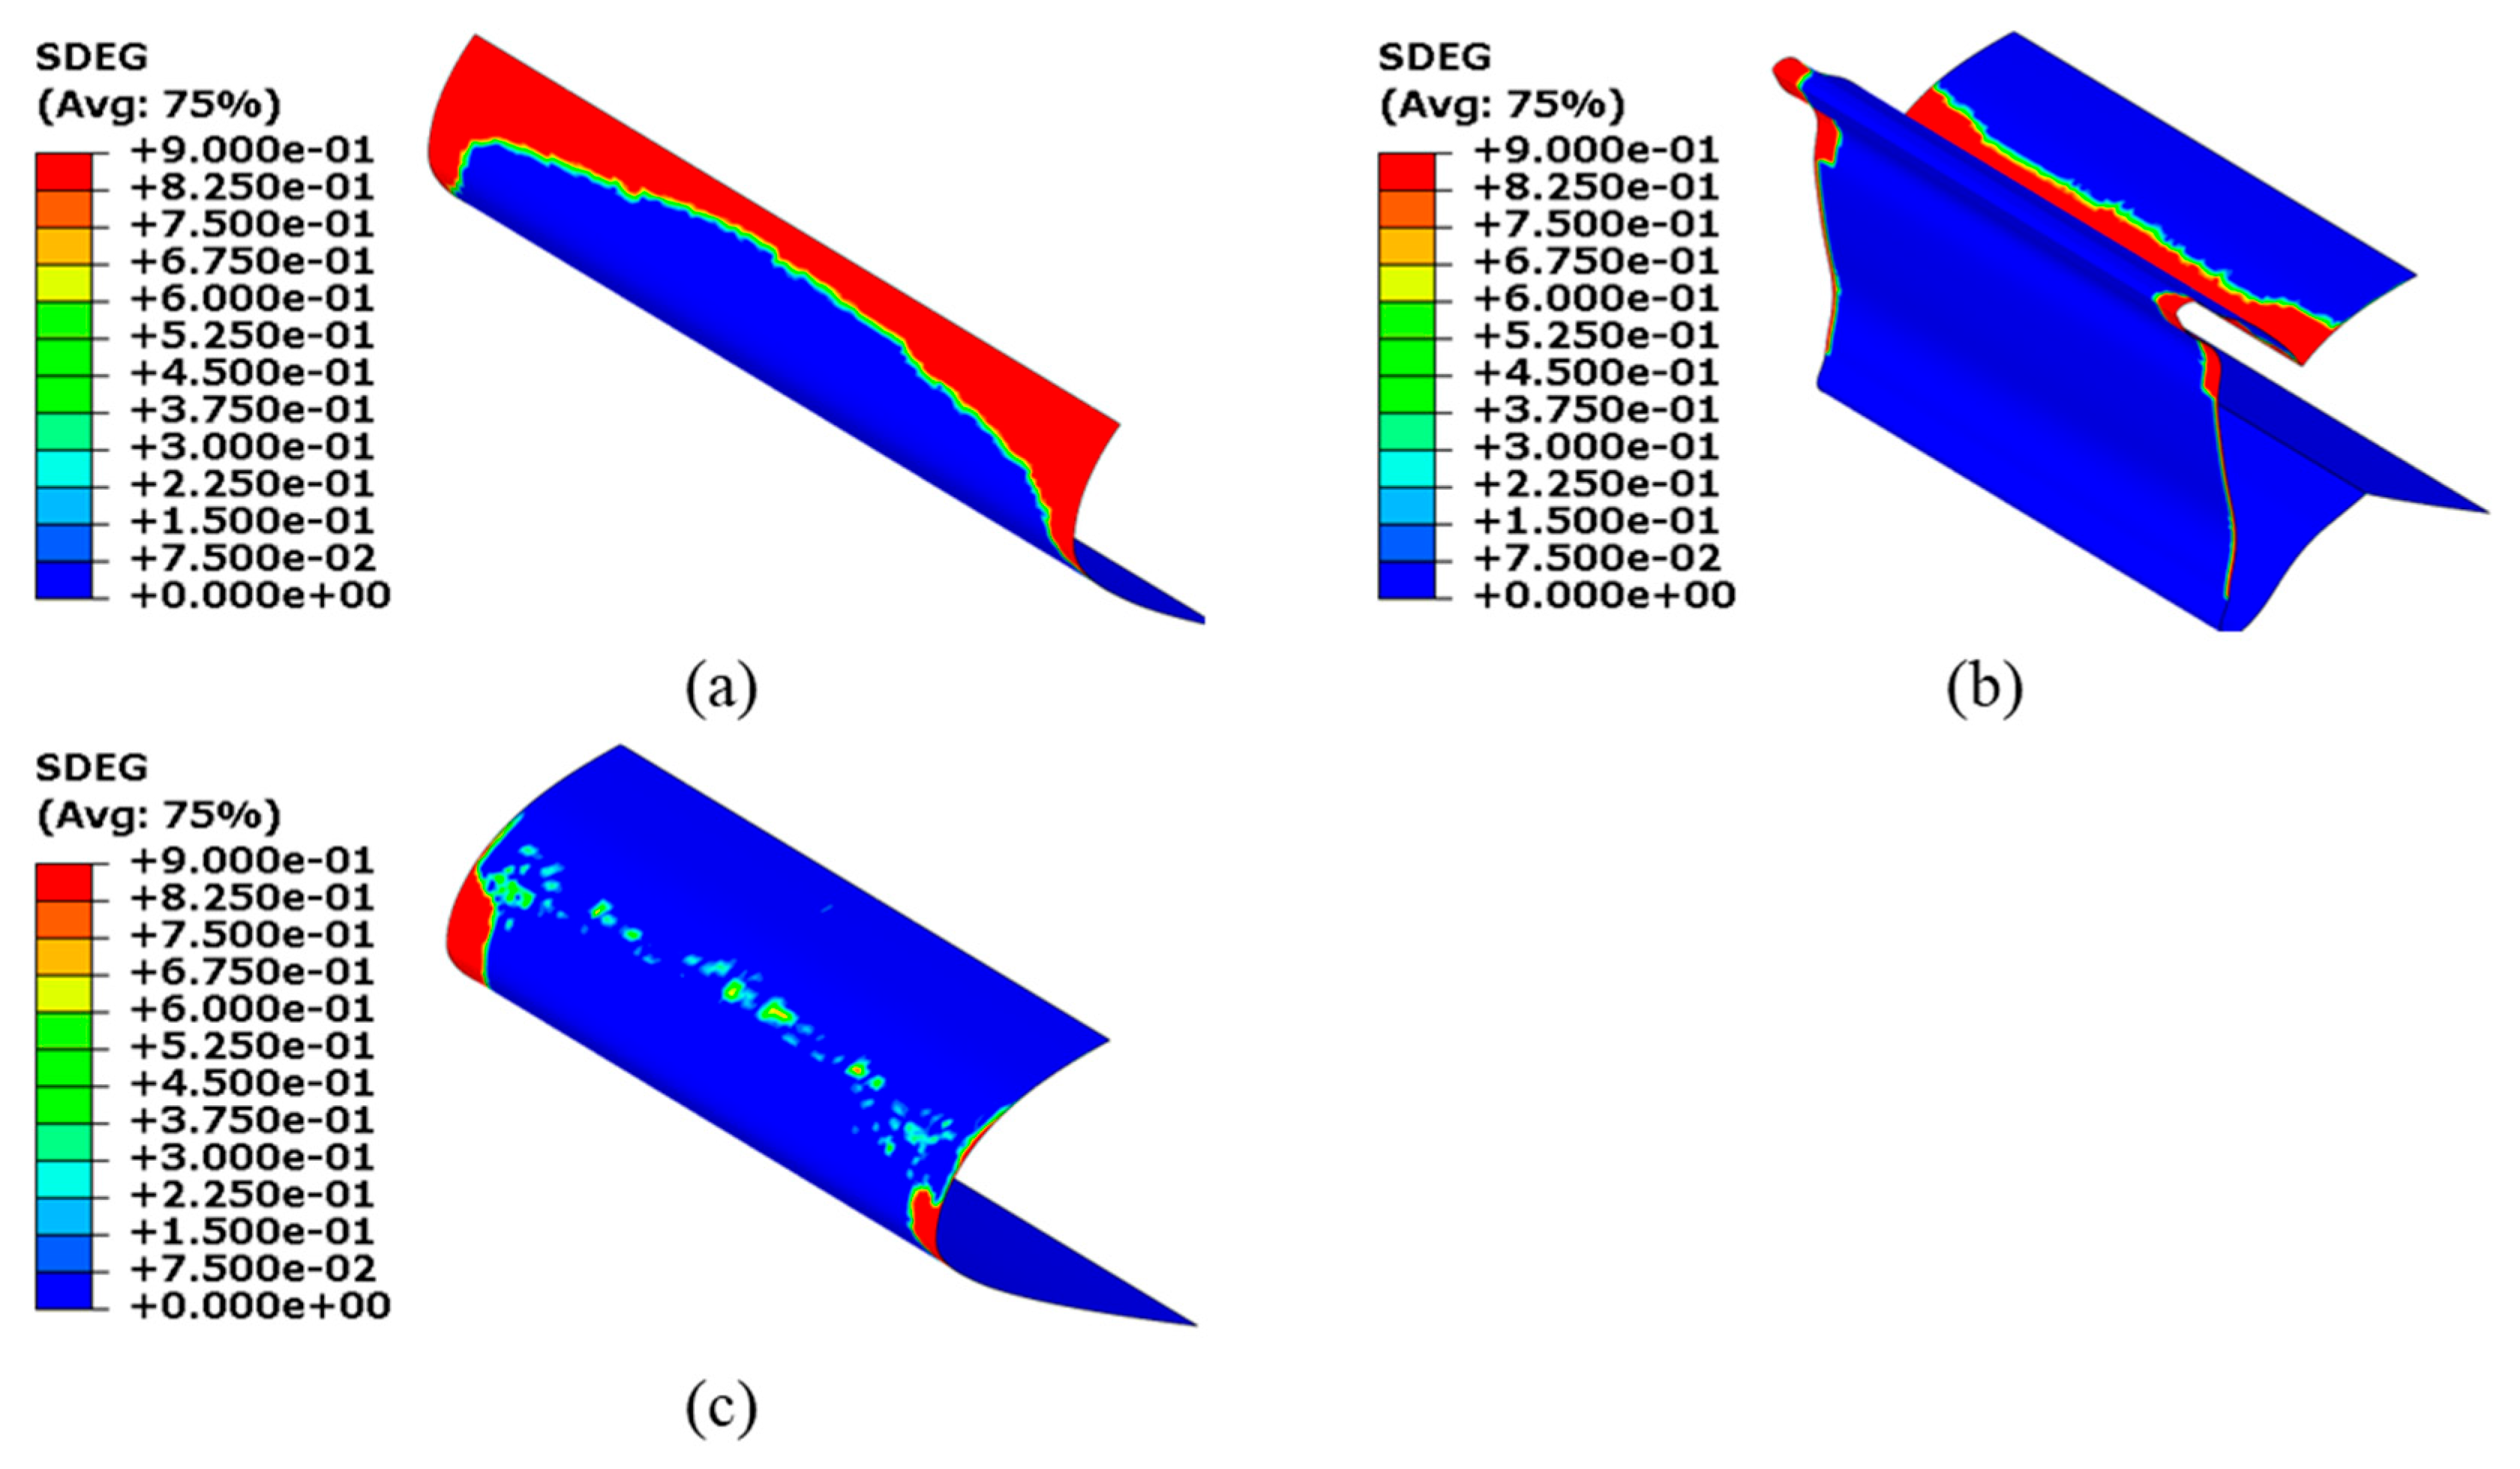
Figure 13: Adhesive damage cloud under further loading after the peak load: (a) middle adhesive; (b) outer adhesive; (c) inner adhesive.
At the final loading stage, the outer and middle adhesive layers are completely damaged, whereas the inner adhesive layer is still not fully deboned; nevertheless, the structure loses its load-carrying capacity (Fig. 14). The analysis shows that the extended GFRP strips on both sides play a crucial role in the structural load bearing capacity, and their integrity directly affects the bonding performance.
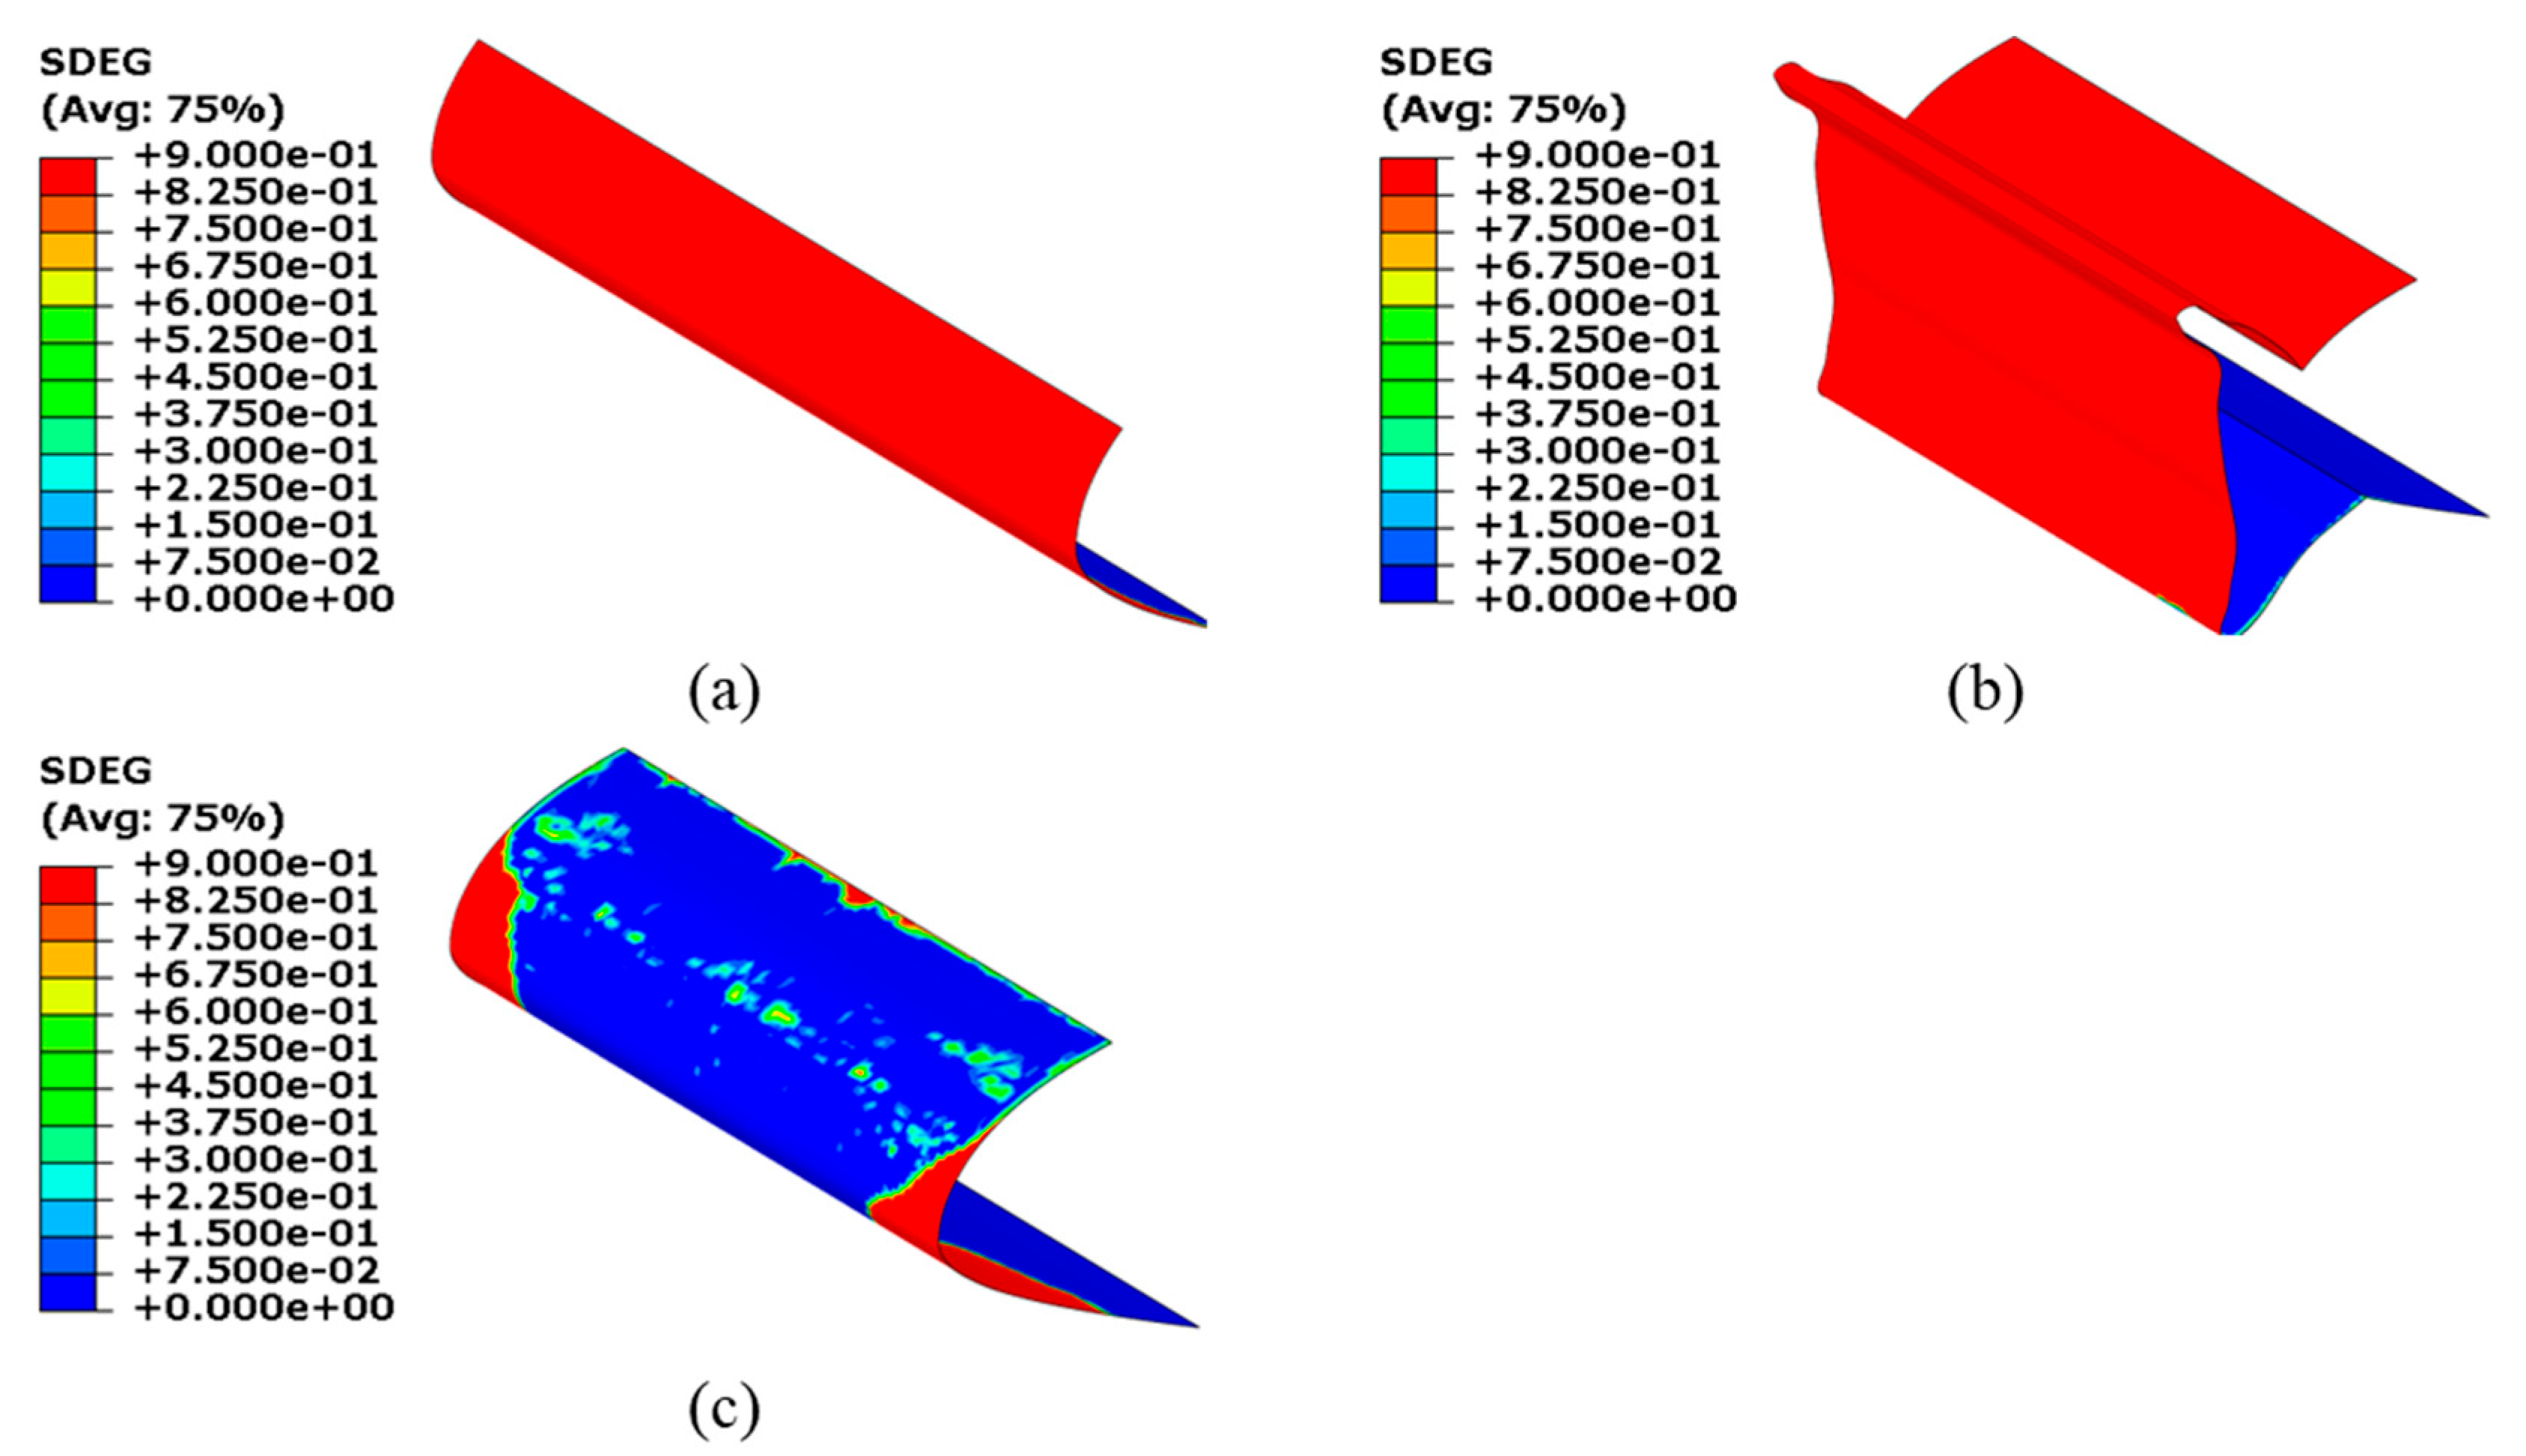
Figure 14: Adhesive damage cloud at the final loading stage: (a) middle adhesive; (b) outer adhesive; (c) inner adhesive.
In addition to adhesive damage, the integrity of the GFRP skins and the 3D-printed core was also evaluated. Fig. 15 shows the distribution of Tsai-Wu damage factor of GFRP at the peak load. Fig. 16 illustrates the von Mises stress distribution of the 3D printed sandwich core at the peak load. The Tsai-Wu damage factor of the GFRP is only 4.75 × 10⁻⁴, indicating a sufficient safety margin; the GFRP main body does not fail. The maximum von Mises equivalent stress of hollow 3D-printed core is 14.07 MPa, below material ultimate strength without structural strength.
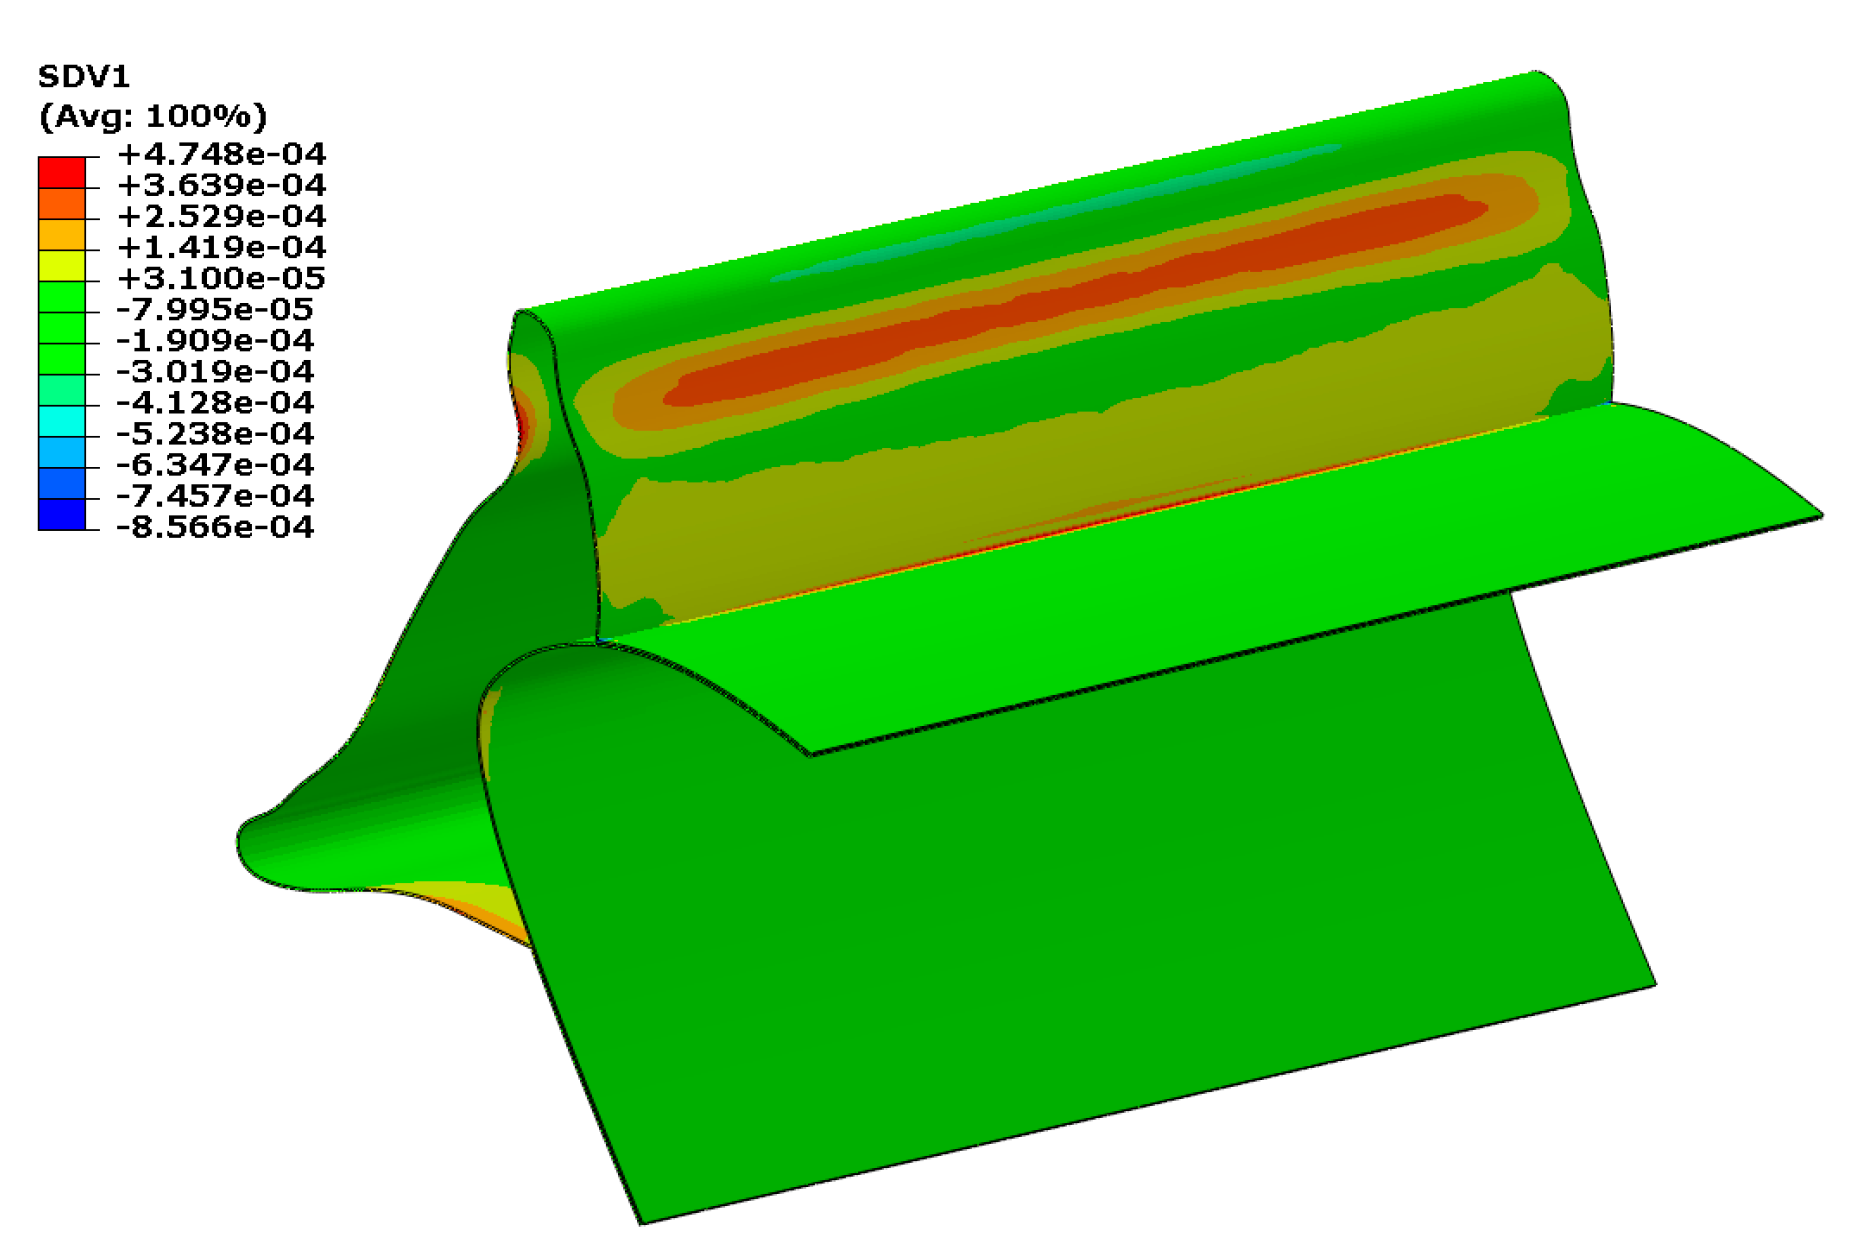
Figure 15: The distribution of Tsai-Wu damage factor of GFRP at the peak load.
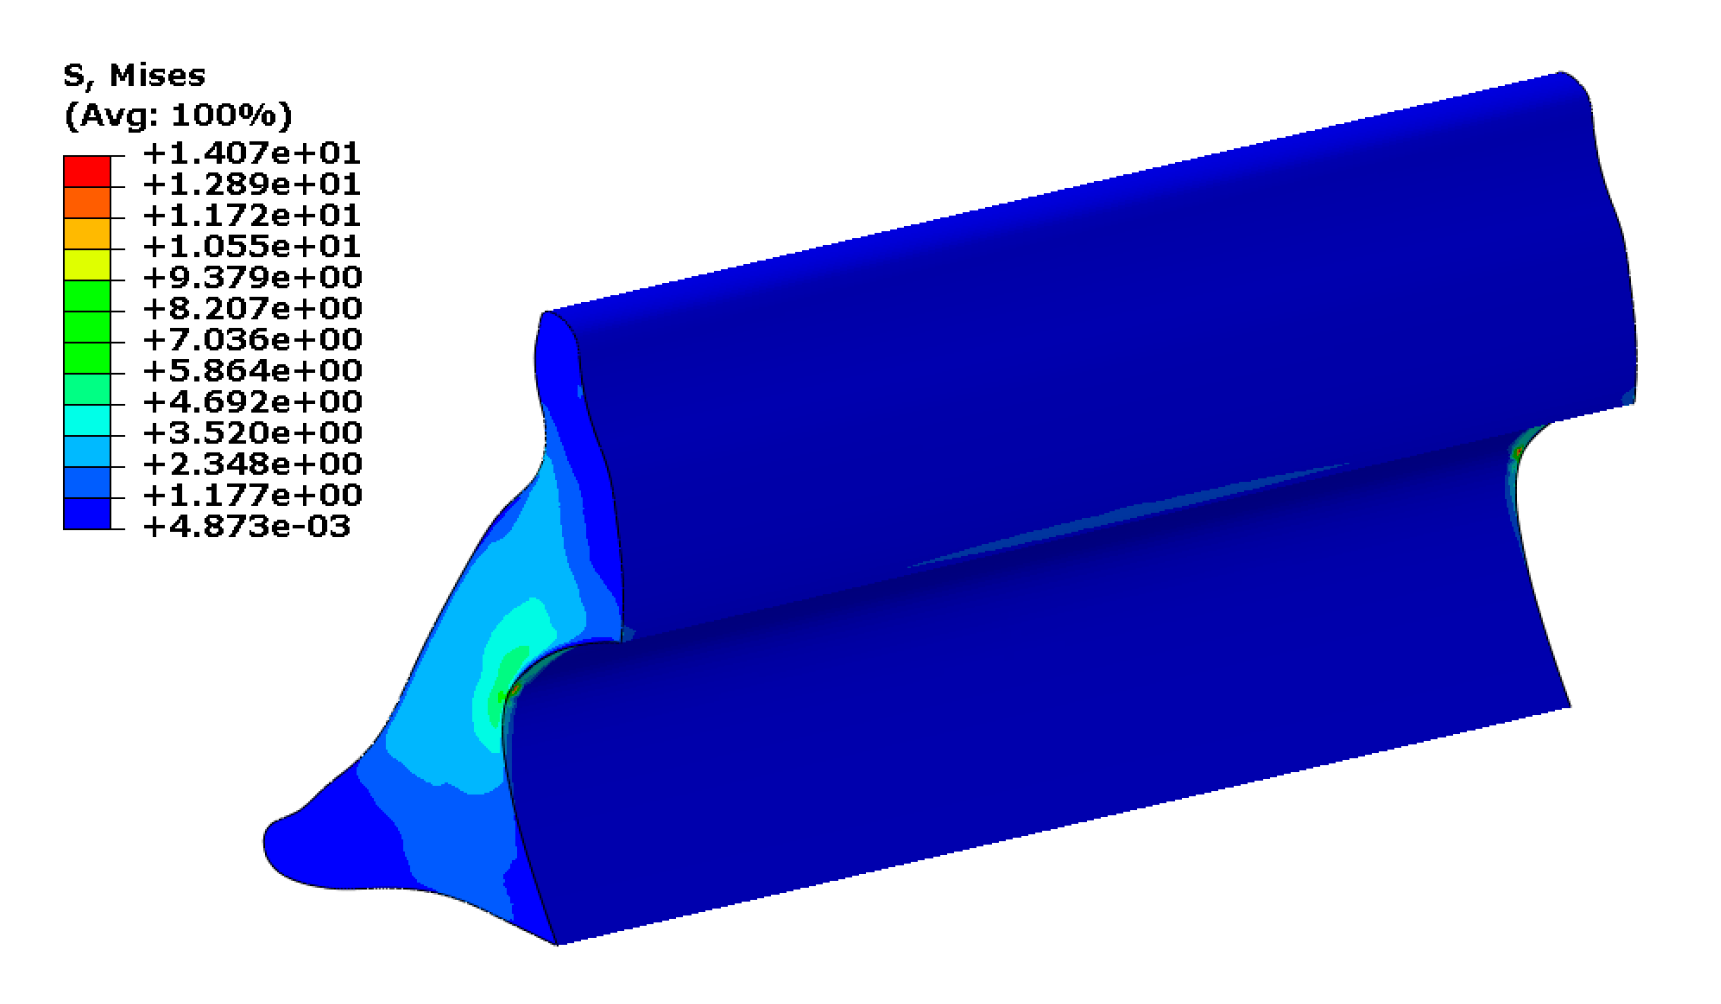
Figure 16: The von Mises stress distribution of the 3D printed sandwich core at the peak load.
To validate the finite element predictions, quasi-static mechanical tests were conducted on a fabricated specimen. An aluminum fixture with the corresponding cross-section was machined as a base to simulate the wing leading-edge geometry. A simulated ice core with a wall thickness of 1 mm and a length of 250 mm was fabricated using 3D-printing. The simulated ice core was installed on the aluminum fixture surface using a hand lay-up composite molding process. The test components are shown in Fig. 17.
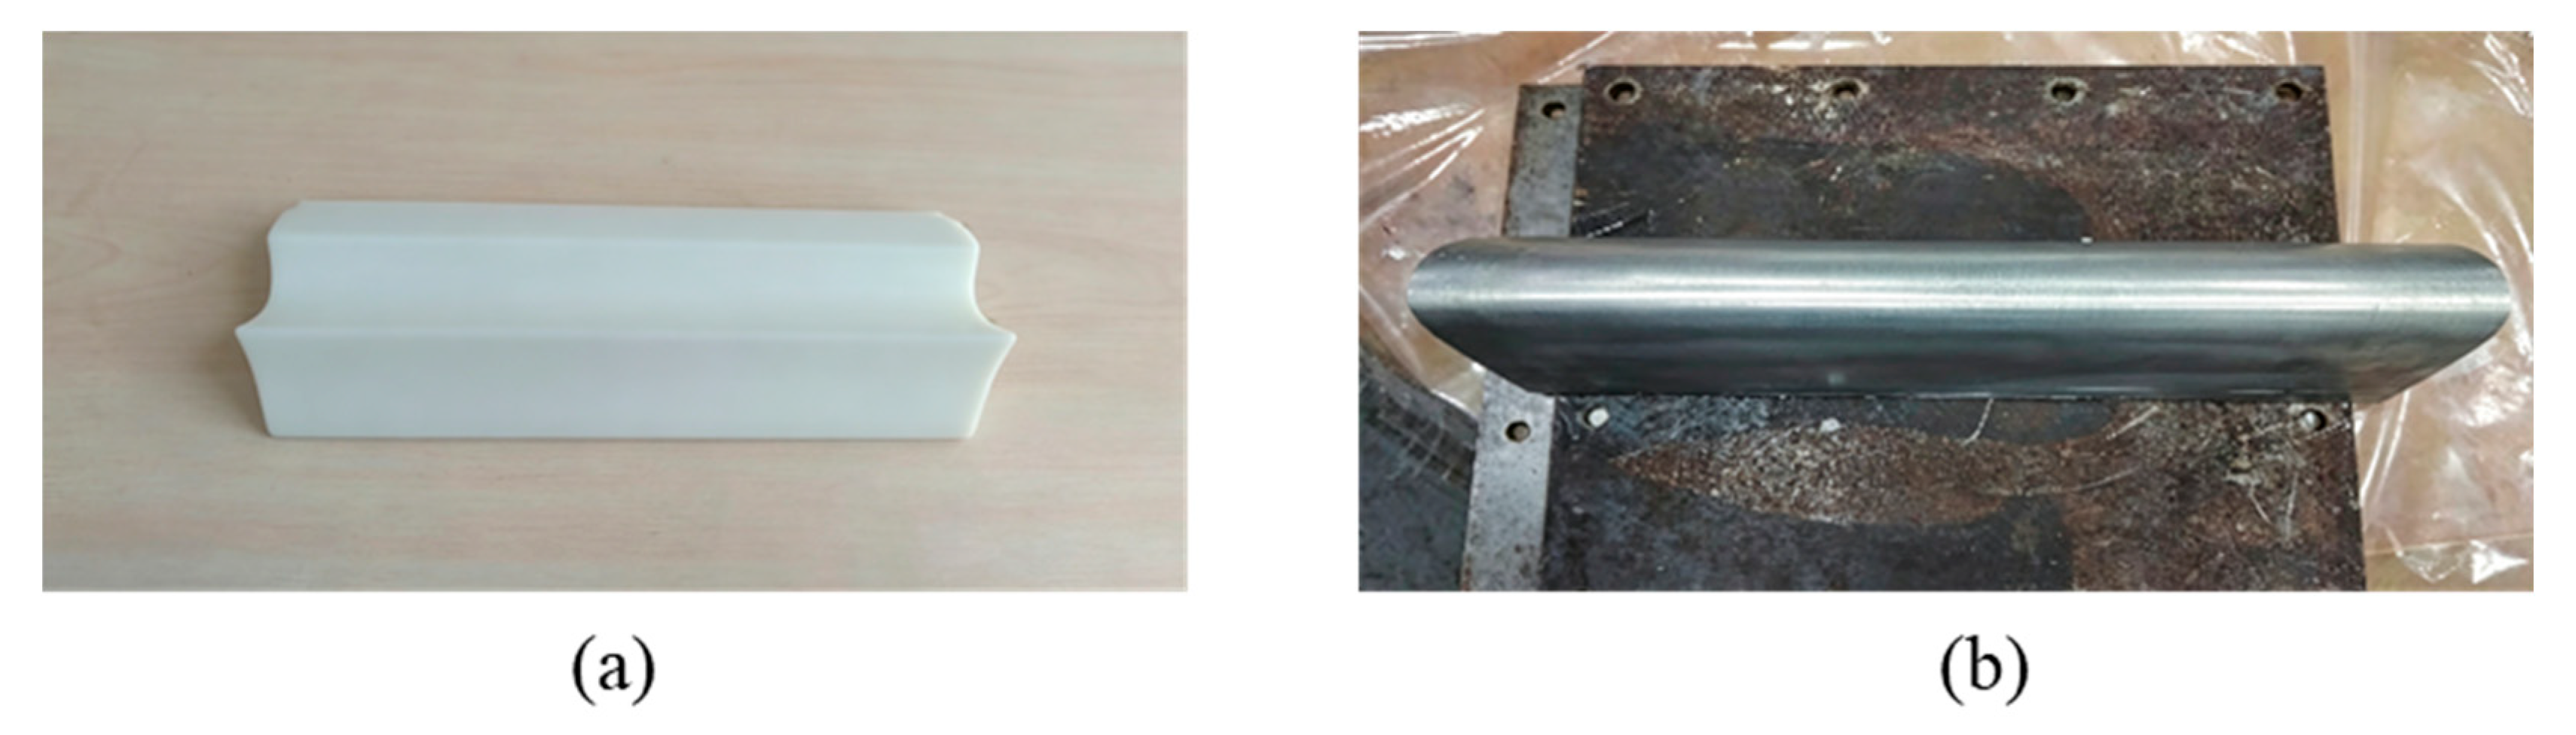
Figure 17: Test components: (a) 3D-printed ice core; (b) aluminum fixture.
A canvas bag was adhered to the upper surface of the simulated ice for uniform load via hydraulic actuator loading. The failure mode of simulated ice when the structure lost its load-carrying capacity is shown in Fig. 18. The inner surface of the core separated from the inner GFRP layer, and the upper extended part of the outer GFRP layer deboned, causing the structure to lose load-carrying capacity. The test failure mode is consistent with the simulated one. The test failure load of the 250-mm test section is 2.42 kN, while the finite element simulated one is 2.20 kN. The error is 9.10%, indicating that the simulation can accurately predict the structural load bearing capacity.
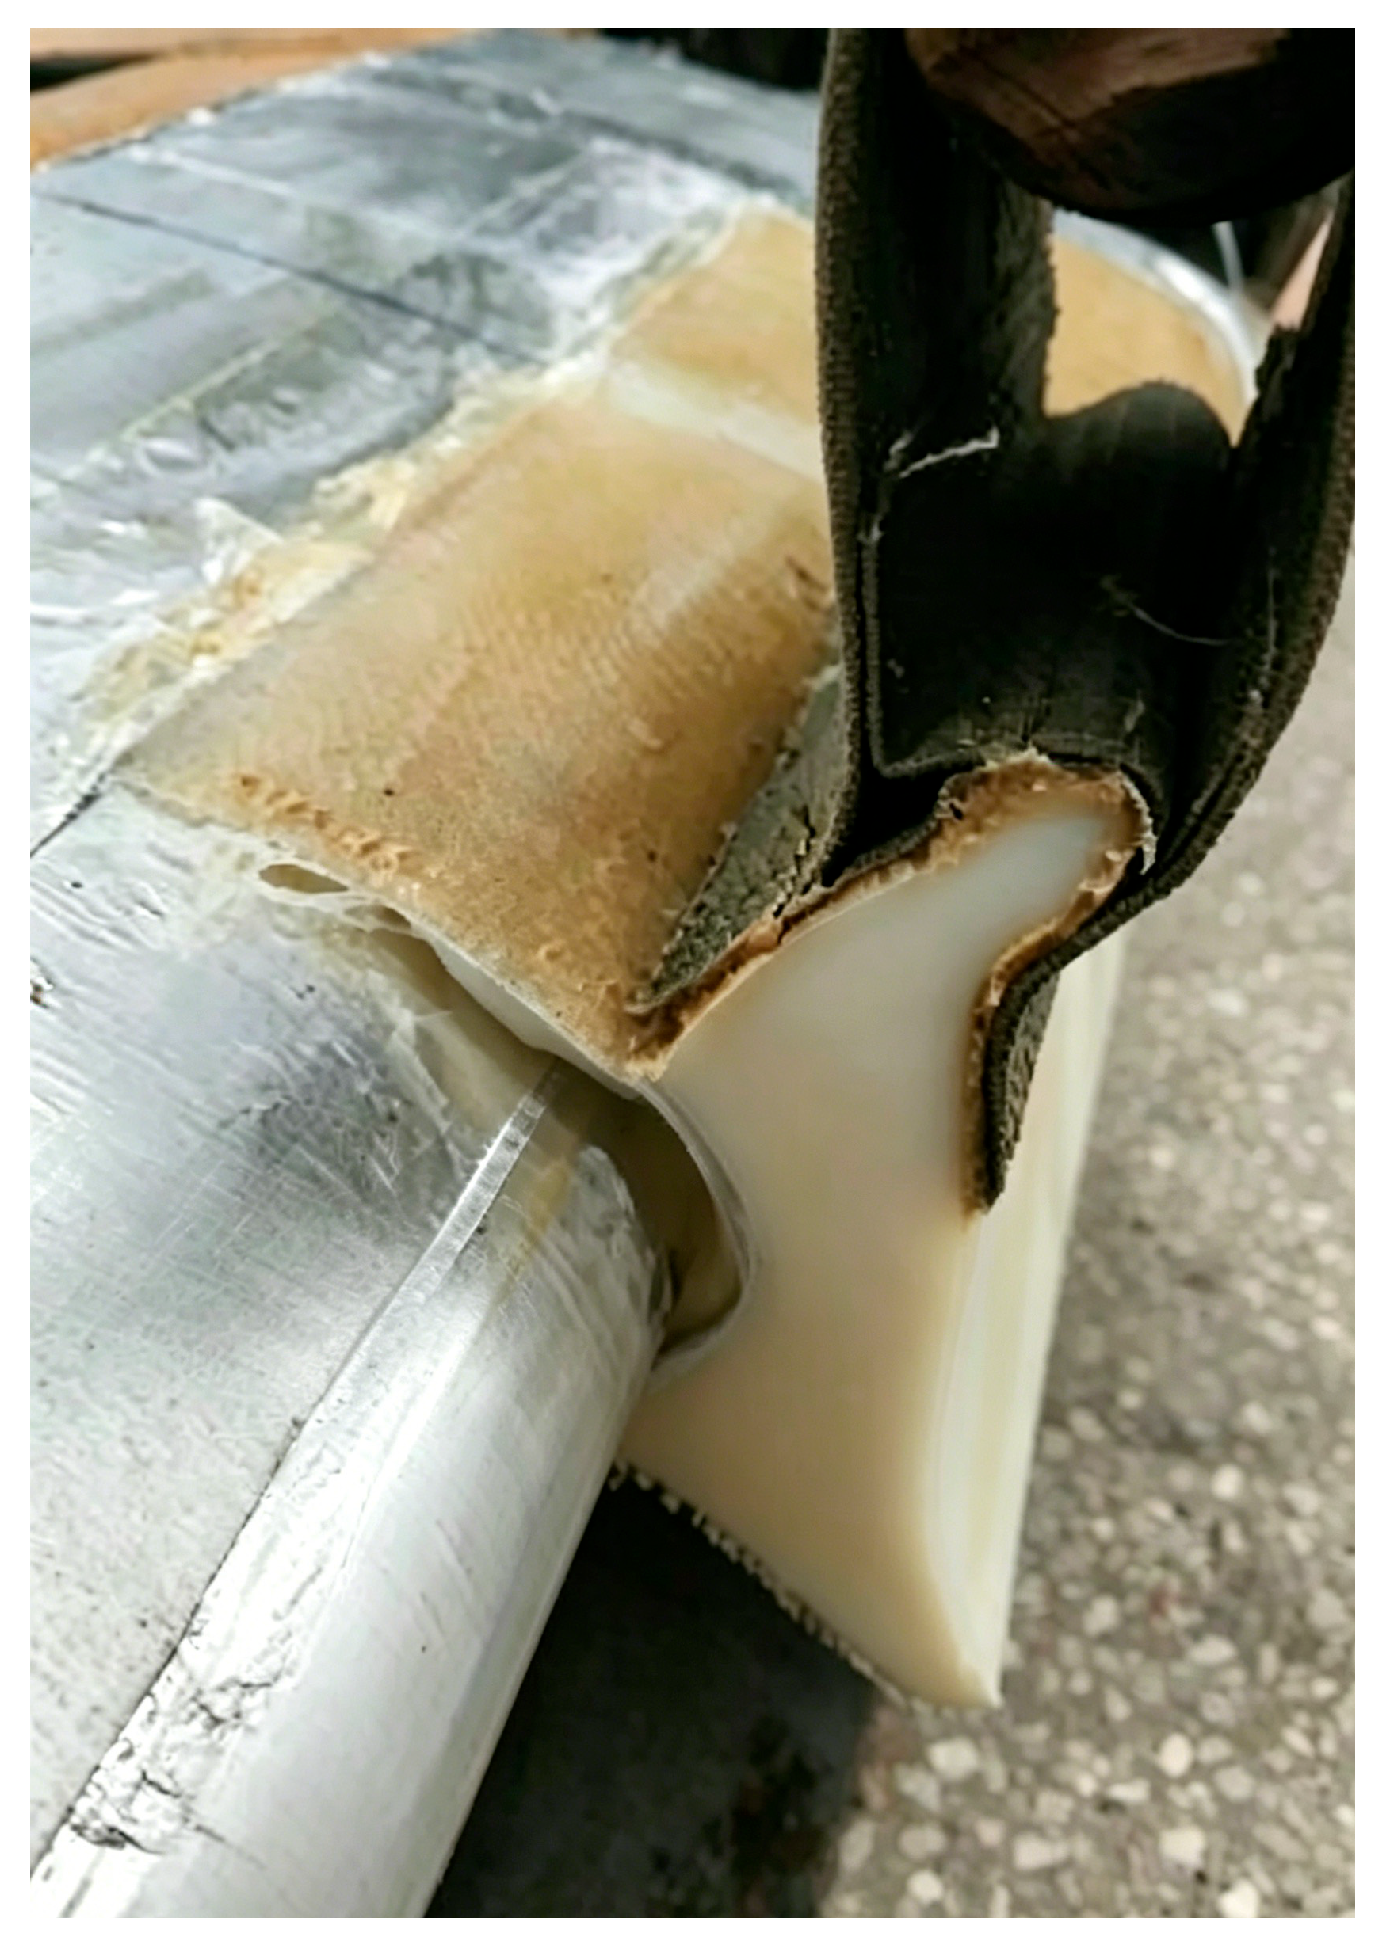
Figure 18: The failure mode of simulated ice.
Leading-edge ice accretion severely deteriorates airfoil aerodynamic performance and threatens in-flight safety. Therefore, dry-air flight certification with substitute simulated ice is indispensable for aircraft airworthiness approval. Based on mature processing methods and materials, this paper proposes a polymer composite simulated ice structure that meets the requirements of airworthiness certification, and conducts corresponding CFD aerodynamic analysis, finite element simulation analysis, and experimental verification to prove the reliability of the designed structure. Through the above analyses, the following conclusions are mainly drawn:
- (a)Aerodynamic performance degradation: The glaze ice at the leading edge induces disordered flow around the ice shape, affecting the entire flow field and causing earlier boundary layer separation and massive vortex formation. This leads to premature stall, posing a serious threat to flight safety. At 0.2 Ma, the maximum lift coefficient drops by approximately 58.6% (from 1.57 to 0.65), and the stall angle reduces from 13° to 5.5°. At 0.6 Ma, the maximum lift coefficient drops by approximately 45.4% (from 1.08 to 0.59), and the stall angle reduces from 6.5° to 4.5°. The maximum normal aerodynamic unit-length load acting on the icing surface reaches 1.89 kN/m at stall. This value serves as the critical design load for simulated ice structural design.
- (b)Structural design and analysis: A composite sandwich structure was designed, with the 3D-printed core providing the aerodynamic shape and inner/outer GFRP layers extending 50 mm chordwise to enhance structural strength. The axial load exerts a pressure load on the simulated ice model which does not cause the structure to fall off, so it is not taken into account. Finite element analysis shows that the safety factor is 4.65 against the maximum aerodynamic normal unit-length load (1.89 kN/m), meeting the safety requirements for actual flight tests. The structural failure mode is debonding of the core adhesive layer and the outer adhesive layer, leading to loss of load-carrying capacity, while the GFRP main body and the core remain undamaged.
- (c)Experimental validation: An aluminum fixture of the wing leading edge and a 3D-printed core were manufactured, and the simulated ice was installed using a hand lay-up molding process. A canvas bag was adhered to the designated area for loading. The error between test failure load and the finite element simulated one is 9.10%, indicating good prediction of structural load bearing capacity. Debonding between the core and the outer GFRP adhesive layer was also observed in the experiment, validating the simulation results.
Overall speaking, the designed simulated ice meets the structural requirements for dry-air flight tests in certification campaigns. This paper analyzes the mechanical properties of the designed polymer composite sandwich structures based on the evolution process of interface detachment and the stress of each component. The results are verified through experiments. For actual flight test applications, further research should focus on three-dimensional wing aerodynamic interference effects and multi-condition durability assessment of simulated ice. Since this work only focuses on one typical ice shape, future work should expand the research scope to various icing configurations and complex loads such as vibration under diverse atmospheric icing environments to enrich the application boundary of the proposed simulated ice.
Acknowledgement:
Funding Statement: This work was partially supported by the Carbon Peaking and Carbon Neutrality Technology Innovation Special Fund of Jiangsu Province (Grant No. BE2022008) and the Priority Academic Program Development of Jiangsu Higher Education Institutions.
Author Contributions: The authors confirm contribution to the paper as follows: Xiang Li: methodology, validation, formal analysis, software, visualization, and writing—original draft. Feng Zhou: formal analysis, software, visualization. Guohui Chang: formal analysis, investigation, and data curation. Deng’an Cai: writing—review & editing, and validation. Nan Zhang: supervision, writing—review & editing, and validation. Guangming Zhou: conceptualization, supervision, writing—review & editing, and funding acquisition. All authors reviewed and approved the final version of the manuscript.
Availability of Data and Materials: The authors confirm that the data supporting the findings of this study are available within the article.
Ethics Approval: Not applicable.
Conflicts of Interest: Given his role as guest editor of this journal, Deng’an Cai had no involvement in the peer review of this article and had no access to information regarding its peer review. Full responsibility for the editorial process for this article was delegated to another journal editor. The authors declare no other conflicts of interest.
References
1. Zhang X , Liu X , Wu X , Min J . Impacting-freezing dynamics of a supercooled water droplet on a cold surface: rebound and adhesion. Int J Heat Mass Transf. 2020; 158: 119997. doi:10.1016/j.ijheatmasstransfer.2020.119997. [Google Scholar] [CrossRef]
2. Xue D , Liu Z , Wang B , Yang J . Impacts of COVID-19 on aircraft usage and fuel consumption: a case study on four Chinese international airports. J Air Transp Manag. 2021; 95: 102106. doi:10.1016/j.jairtraman.2021.102106. [Google Scholar] [CrossRef]
3. Cao Y , Tan W , Wu Z . Aircraft icing: an ongoing threat to aviation safety. Aerosp Sci Technol. 2018; 75: 353– 85. doi:10.1016/j.ast.2017.12.028. [Google Scholar] [CrossRef]
4. Page JH , Ozcer I , Zanon A , De Gennaro M , Llamas-Sandin RC . Aerodynamics and ice tolerance of the large passenger aircraft advanced rear end forward swept horizontal tailplane with leading edge extension. Aerosp Sci Technol. 2025; 161: 110018. doi:10.1016/j.ast.2025.110018. [Google Scholar] [CrossRef]
5. Potapczuk M , Gerhart P . Progress in development of a Navier-Stokes solver for evaluation of iced airfoil performance. In: Proceedings of the 23rd Aerospace Sciences Meeting; 1985 Jan 14–17; Reno, NV, USA. doi:10.2514/6.1985-410. [Google Scholar] [CrossRef]
6. Kwon O , Sankar L . Numerical study of the effects of icing on finite wing aerodynamics. In: Proceedings of the 28th Aerospace Sciences Meeting; 1990 Jan 8–11; Reno, NV, USA. doi:10.2514/6.1990-757. [Google Scholar] [CrossRef]
7. Lee S , Bragg MB . Experimental investigation of simulated large-droplet ice shapes on airfoil aerodynamics. J Aircr. 1999; 36( 5): 844– 50. doi:10.2514/2.2518. [Google Scholar] [CrossRef]
8. Papadakis M , Alansatan S , Seltmann M . Experimental study of simulated ice shapes on a NACA 0011 airfoil. In: Proceedings of the 37th Aerospace Sciences Meeting and Exhibit; 1999 Jan 11–14; Reno, NV, USA. doi:10.2514/6.1999-96. [Google Scholar] [CrossRef]
9. Wright W . User’s manual for LEWICE version 3.2. Cleveland, OH, USA: NASA Glenn Research Center; 2008. Report No.: NASA/CR-2008-214255. [Google Scholar]
10. Hedde T , Guffond D . ONERA three-dimensional icing model. AIAA J. 1995; 33( 6): 1038– 45. doi:10.2514/3.12795. [Google Scholar] [CrossRef]
11. Beaugendre H , Morency F , Habashi W . ICE3D, FENSAP-ICE’S 3D in-flight ice accretion module. In: Proceedings of the 40th AIAA Aerospace Sciences Meeting & Exhibit; 2002 Jan 14–17; Reno, NV, USA. doi:10.2514/6.2002-385. [Google Scholar] [CrossRef]
12. Kim H , Bragg M . Effects of leading-edge ice accretion geometry on airfoil performance. In: Proceedings of the 17th Applied Aerodynamics Conference; 1999 Jun 28–Jul 1; Norfolk, VA, USA. doi:10.2514/6.1999-3150. [Google Scholar] [CrossRef]
13. Olsen W , Shaw R , Newton J . Ice shapes and the resulting drag increase for a NACA 0012 airfoil. In: Proceedings of the 22nd Aerospace Sciences Meeting; 1984 Jan 9–12; Reno, NV, USA. doi:10.2514/6.1984-109. [Google Scholar] [CrossRef]
14. Addy H , Broeren A , Zoeckler J , Lee S . A wind tunnel study of icing effects on a business jet airfoil. In: Proceedings of the 41st Aerospace Sciences Meeting and Exhibit; 2003 Jan 6–9; Reno, NV, USA. doi:10.2514/6.2003-727. [Google Scholar] [CrossRef]
15. Min S , Yee K . New roughness-induced transition model for simulating ice accretion on airfoils. AIAA J. 2021; 59( 1): 250– 62. doi:10.2514/1.j059222. [Google Scholar] [CrossRef]
16. Suo W , Sun X , Zhang W , Yi X . Aircraft ice accretion prediction based on geometrical constraints enhancement neural networks. Int J Numer Meth Heat Fluid Flow. 2024; 34( 9): 3542– 68. doi:10.1108/hff-01-2024-0019. [Google Scholar] [CrossRef]
17. Zhao T , Qian W , Lin J , Chen H , Ao H , Chen G , et al. Learning mappings from iced airfoils to aerodynamic coefficients using a deep operator network. J Aerosp Eng. 2023; 36( 5): 04023035. doi:10.1061/jaeeez.aseng-4508. [Google Scholar] [CrossRef]
18. Bornhoft B , Moin P , Jain SS , Bose ST . On the use of artificial ice shapes for large-eddy simulations in aircraft icing. J Aircr. 2025; 62( 5): 1240– 57. doi:10.2514/1.c038146. [Google Scholar] [CrossRef]
19. Flemming R , Papadakis M , Murty H , Wong SH . The design, fabrication, and testing of simulated ice shapes for the S-92A helicopter. In: Proceedings of the 42nd AIAA Aerospace Sciences Meeting and Exhibit; 2004 Jan 5–8; Reno, NV, USA. doi:10.2514/6.2004-736. [Google Scholar] [CrossRef]
20. Ratvasky T , Barnhart B , Lee S , Cooper J . Flight testing an iced business jet for flight simulation model validation. In: Proceedings of the 45th AIAA Aerospace Sciences Meeting and Exhibit; 2007 Jan 8–11; Reno, NV, USA. doi:10.2514/6.2007-89. [Google Scholar] [CrossRef]
21. Deiler C , Ohme P , Raab C , Mendonca C , Silva D . Facing the challenges of supercooled large droplet icing: results of a flight test based joint DLR-embraer research project. SAE Int J Adv Curr Pract Mobil. 2019; 2( 1): 192– 204. doi:10.4271/2019-01-1988. [Google Scholar] [CrossRef]
22. Bosetti C , Krueger FN , Gunter IM , Walters D , inventors; The Boeing Company, assignee. Systems and methods for icing flight tests. US10337952B2. 2019 Jul 2. [Google Scholar]
23. Li X , Chang G , Cai DA , Zhou G . Design and analysis of simulated ice for a civil aircraft airfoil. J Reinf Plast Compos. 2026: 07316844261435073. doi:10.1177/07316844261435073. [Google Scholar] [CrossRef]
24. Bai F , Yan W , Li H . The research of correlationship and critical ice shape acquisition in CIRA-IWT icing wind tunnel. In: The Proceedings of the 2021 Asia-Pacific International Symposium on Aerospace Technology (APISAT 2021), Volume 1. Singapore: Springer; 2021. p. 227– 44. [Google Scholar]
25. Werner M , Schütte A , Weiss S . Turbulence model effects on vortex interaction prediction on a multiswept delta wing. J Aircr. 2023; 61( 1): 211– 21. doi:10.2514/1.C037421. [Google Scholar] [CrossRef]
26. Aubin J , Fletcher DF , Xuereb C . Modeling turbulent flow in stirred tanks with CFD: the influence of the modeling approach, turbulence model and numerical scheme. Exp Therm Fluid Sci. 2004; 28( 5): 431– 45. doi:10.1016/j.expthermflusci.2003.04.001. [Google Scholar] [CrossRef]
27. Jones WP , Launder BE . The prediction of laminarization with a two-equation model of turbulence. Int J Heat Mass Transf. 1972; 15( 2): 301– 14. doi:10.1016/0017-9310(72)90076-2. [Google Scholar] [CrossRef]
28. Martini F , Ibrahim H , Montoya LTC , Rizk P , Ilinca A . Turbulence modeling of iced wind turbine airfoils. Energies. 2022; 15( 22): 1– 20. doi:10.3390/EN15228325. [Google Scholar] [CrossRef]
29. Jiang F , Drummer D . Analysis of UV curing strategy on reaction heat control and part accuracy for additive manufacturing. Polymers. 2022; 14( 4): 759. doi:10.3390/polym14040759. [Google Scholar] [CrossRef]
30. Wei Y , Jin X , Luo Q , Li Q , Sun G . Adhesively bonded joints—A review on design, manufacturing, experiments, modeling and challenges. Compos Part B Eng. 2024; 276: 111225. doi:10.1016/j.compositesb.2024.111225. [Google Scholar] [CrossRef]
31. Cai Y , An X , Zou Q , Yao D , Fu H , Zhang H , et al. Numerical investigation on the design and optimization of stacking pattern for high flexural performance carbon fiber reinforced resin matrix composites. Fibres Polym. 2022; 23( 9): 2719– 35. doi:10.1007/s12221-022-0119-1. [Google Scholar] [CrossRef]
32. Xu L , Cai D , Xu Z , Jia M , Wang K , Lin N , et al. Design and analysis of a new frangible composite cover with a high ratio of external to internal load-bearing limit. Appl Compos Mater. 2023; 30( 1): 157– 83. doi:10.1007/s10443-022-10078-5. [Google Scholar] [CrossRef]
Cite This Article
 Copyright © 2026 The Author(s). Published by Tech Science Press.
This work is licensed under a Creative Commons Attribution 4.0 International License , which permits unrestricted use, distribution, and reproduction in any medium, provided the original work is properly cited.
 Downloads
 Citation Tools
