
 Submit a Paper
 Propose a Special lssue
 Open Access
ARTICLE

Spatio-Temporal Characteristics of Heat Transfer of Methanation in Fluidized Bed for Pyrolysis and Gasification Syngas of Organic Solid Waste
1
Key Laboratory of Energy Thermal Conversion and Control of Ministry of Education, School of Energy & Environment, Southeast
University, Nanjing, 210096, China
2
China Energy Science and Technology Research Institute Co., Ltd., Nanjing, 210023, China
* Corresponding Author: Xiaojia Wang. Email:
Journal of Renewable Materials 2023, 11(10), 3659-3680. https://doi.org/10.32604/jrm.2023.029220
Received 08 February 2023; Accepted 03 March 2023; Issue published 10 August 2023
 View Full Text
 Download PDF
Abstract
Methanation is an effective way to efficiently utilize product gas generated from the pyrolysis and gasification of organic solid wastes. To deeply study the heat transfer and mass transfer mechanisms in the reactor, a successful three-dimensional comprehensive model has been established. Multiphase flow behavior and heat transfer mechanisms were investigated under reference working conditions. Temperature is determined by the heat release of the reaction and the heat transfer of the gas-solid flow. The maximum temperature can reach 951 K where the catalyst gathers. In the simulation, changes in the gas inlet velocity and catalyst flow rate were made to explore their effects on CO conversion rate and temperature for optimization purposes. As the inlet gas velocity increases from 2.78 to 4.79 m/s, the CO conversion rate decreases from 81.6% to 72.4%. However, more heat is removed from the reactor, and the temperature rise increases from 78.03 to 113.49 K. When the catalyst flow rate is increased from 7.18 to 17.96 kg/(m2 ·s), the mass of the catalyst in the reactor is increased from 0.0019 to 0.0042 kg, and the CO conversion rate is increased from 66.8% to 81.5%. However, this increases the maximum temperature in the reactor from 940.0 to 966.4 K.Keywords
Nomenclature
| | Values of parameters under quasi-stable state [-, K, m/s] |
| | Instantaneous values of parameters [-, K, m/s] |
| | Probability of parameters [%] |
| | Drag coefficient [-] |
| | Turbulence model constant [-] |
| | Isobaric specific heat capacity [J·(kg·K)−1] |
| | Diameter of catalyst particles [mm] |
| | Total number of values of the parameter [-] |
| | Count [-] |
| | Turbulent kinetic energy generation term [kg·(m·s3)−1] |
| | Gravity [m |
| | Radial distribution function [-] |
| | Heat transfer coefficient between gas phase and catalyst phase [] |
| | Stress tensor invariant [-] |
| | Nusselt number of catalyst phase [-] |
| | Count [-] |
| | Mass of spice i [kg] |
| | Equilibrium constant of reaction [Pa2] |
| | Surface adsorption equilibrium constant of species i [Pa−1] or [-] |
| | Conductivity of granular temperature [W |
| k | Rate constant [ |
| | Pressure [Pa] |
| | Partial pressure of species i [bar] |
| | Prandtl number [-] |
| | Pressure of catalyst phase [Pa] |
| r | Kinetic rate of reaction [mol |
| | Reynolds number of catalyst [-] |
| | Ideal gas constant (J·mol−1·K−1) |
| | Source term of mass transfer of gas phase [-] |
| | Source term of mass transfer of catalyst phase [-] |
| | Energy source term [W |
| | Time [s] |
| | Temperature [K] |
| | Velocity [m |
| | CO conversion rate [-] |
| Greek Symbols | |
| | Volume fraction [-] |
| | Momentum exchange coefficient [-] |
| | Density [kg |
| | Stress tensor [Pa] |
| | Shear viscosity [Pa |
| | Gas phase laminar viscosity [Pa |
| | Gas phase turbulent viscosity [Pa |
| | Dissipation rate of gas turbulence [-] |
| | Turbulent kinetic energy of gas [-] |
| | Thermal conductivity of gas phase [W·m−1·K−1] |
| | Thermal conductivity of catalyst phase [W·m−1·K−1] |
| | Bulk viscosity of catalyst [Pa |
| | Collision dissipation of energy [kg/(m·s3)] |
| | Interphase energy exchange [kg |
| | Constant [-] |
| | Pseudo particle temperature [m2 |
| Subscripts | |
| g | Gas phase |
| c | Catalyst phase |
| i | CH4, CO, H2, H2O |
| | Catalyst volume friction, temperature, gas velocity, catalyst velocity |
| | Time of recording data |
| in | Inlet |
| out | Outlet |
| | Gas velocity, catalyst velocity |
With the rapid growth of population and the improvement of urban construction level, the amount of organic solid waste (OSW) has also been increasing sharply. On the whole, the OSW generally includes municipal solid waste (MSW), agricultural solid waste, and industrial solid waste [1,2]. The related research points out that the total production of MSW in the world will reach 3.4 × 10⁹ tons by 2050 [3]. For these OSW, the traditional treatment methods include landfill, incineration, and composting [4–6]. However, these treatment methods have some disadvantages, such as a long treatment period, serious environmental pollution, and low utilization rate of organic matter. Therefore, innovative waste treatment approaches, such as hydrothermal carbonization (HTC) and plasma technology, have begun to appear [7–9]. OSW’s pyrolysis and gasification technology is considered one of the most promising technologies by virtue of product gas with higher heating values (HHV) [10].
In the process of pyrolysis and gasification, sufficient contact between gasification agents and volatile compounds in the OSW leads to less waste heat, better-quality gas products, and higher energy efficiency [11,12]. Deng et al. [13] developed a set of self-supporting pyrolysis and gasification process in an updraft fixed bed reactor, which uses the self-produced syngas as the heat source to achieve significant energy recovery. Chun et al. [14] proposed a pyrolysis and gasification device which combines a screw carbonizer and a drum activator, and explored the pyrolysis and gasification behavior of the sludge. Under the condition of high temperature and low moisture content, the activated carbon with high adsorption capacity and clean combustible gas with HHV of 10107 kJ/Nm3 were generated. Li et al. [15] designed a new type of atmospheric fixed bed reactor on the basis of experiment and simulation. The high-temperature products were recycled to the gasification system depending on the recovery system, and the heat conversion efficiency was dramatically improved.
As the cleanest energy, the demand for natural gas is increasing [16]. The rich CO and H2 in pyrolysis and gasification products can produce natural gas through a methanation reaction [17]. Therefore, methanation technology has received more and more attention. The fixed-bed reactor is the earliest developed methanation reaction device, which has achieved large-scale industrial applications [18]. However, the investigations found that there were serious hot spots in the reactor because the methanation reaction was highly exothermic [19,20], which led to the deactivation of the catalyst and the reduction of the reaction efficiency [21]. Researchers have proposed a series of improvement measures to solve this problem. Moioli et al. [22] proposed a system in which several fixed-bed reactors were connected in series. This system can realize the gradual increase of inlet temperature to avoid the risk of reactor thermal deactivation. Moreover, the addition of external heat exchange cooling equipment and an intermediate cooling cycle can also solve hot spots [23,24]. In addition to improving the reactor, more stable catalysts have also been developed. A new type of metal catalyst with a multilayer honeycomb structure was successfully prepared, and experiments showed that it also had superior stability at high temperatures [25]. However, these methods have increased the operation cost of the methanation process to a certain extent, so experts have begun to consider using the fluidized bed for the methanation reaction [23,24].
It was found that during the methanation process in the fluidized bed, the whole reactor was almost isothermal, which could preserve the activity of the catalyst. Moreover, it was conducive to the process of heat and mass transfer [19,26,27]. A circulating fluidized bed (CFB) reactor with changing diameters was assembled to control the temperature and prevent the catalyst sintering [28]. It was found that a higher methane yield could be obtained by enlarging the reactor, which also proved the feasibility of the large-scale application of methanation reactors. In the fluidized bed reactor with submerged heat exchange tubes, the methanation efficiency could be close to the ideal state because the tube effectively removed a large amount of reaction heat [29,30]. The magnetic fluidized bed reactor was proved to have advantages in inhibiting particle agglomeration, enhancing fine particle fluidization quality, and improving gas-solid contact efficiency [20]. Liu et al. [31] proposed a laboratory transport bed reactor to lessen the equipment size and catalyst consumption by virtue of the rapid flow inside the reactor.
Compared with experimental research, numerical simulation can save the steps of building reactors and speed up the efficiency of device optimization [26]. It is an effective tool for studying methanation reactors. Li et al. [26,32] combined the discrete element method (DEM) simulation method with an improved local-structure-dependent (LSD) drag model, focusing on the flow behavior of particles and the evolution process of bubbles. A post-processing technology called the approximate image processing method (AIPM) was developed to further obtain geometric parameters such as the shape and size of bubbles. Du et al. [33] used the Multiphase Particle-In-Cell (MP-PIC) model to conduct the numerical study of the heat transfer coefficient of the catalyst for the first time and found that the heat transfer coefficient of the catalyst at the inlet was the largest and changed sharply in the dense phase region of the reactor. Increasing the inlet gas velocity and operating temperature also increased the heat transfer coefficient of the catalyst. Numerous investigations [34–36] found that the inlet gas velocity not only affected the contact time between the gas phase and the solid phase but also influenced the removal efficiency of the reaction heat. Large gas velocity can effectively remove the reaction heat and promote the reaction in the direction of CH4 generation. But at the same time, it also led to the reduction of gas-solid contact time so that the reaction could not be completely carried out. The influence of catalyst dosage on CO conversion rate was also very complex. More catalysts promoted the reaction [34,35], but it also made it difficult to remove the reaction heat [37]. Temperature dominated the rate of the chemical reaction. It controlled both kinetics and thermodynamics processes [31]. When the temperature was lower than 380°C, the reaction was mainly controlled by kinetics. The increase in temperature made the molecular thermal motion more intense, the reaction rate increased, and the conversion rate of CO increased. When the temperature was higher than 380°C, the reaction was mainly controlled by thermodynamics. The increase in temperature made the reaction proceed in the direction of the endothermic reaction, and the conversion rate of CO decreased [38]. However, few people have explored the variation and distribution of temperature in the reactor. And how to achieve a balance between controlling temperature and realizing high conversion is worth studying.
To enhance the utilization efficiency of the OSW pyrolysis gasification syngas and solve the catalyst sintering problem caused by the hot spot phenomenon, the three-dimensional reaction model of the fluidized bed reactor was established in this study. The main contributions of this work are (a) the successful construction of a three-dimensional comprehensive model of the fluidized bed reactor to simulate the gas-solid multiphase flow, (b) the in-depth study of the heat transfer mechanism in the methanation process to solve the problem of catalyst deactivation, and (c) the understanding of the effects of gas velocity and particle flowrate on CO conversion and temperature to be further referenced for experimental optimization.
In the fluidized bed methanation reactor, the gas phase and solid phase exist simultaneously. The continuity equations, momentum equations, and energy equations of these two phases are solved, respectively.
Continuity equation for gas phase:
Continuity equation for catalyst phase:
Momentum equation for gas phase:
Momentum equation for catalyst phase:
The energy equation for gas phase:
The energy equation for catalyst phase:
More physical quantities need to be described as a result of closing the conservation equation.
Stress tensor of gas phase:
Shear viscosity of gas phase:
where,
Shear viscosity of gas phase:
The pressure of catalyst phase:
Momentum exchange coefficient:
Heat transfer coefficient:
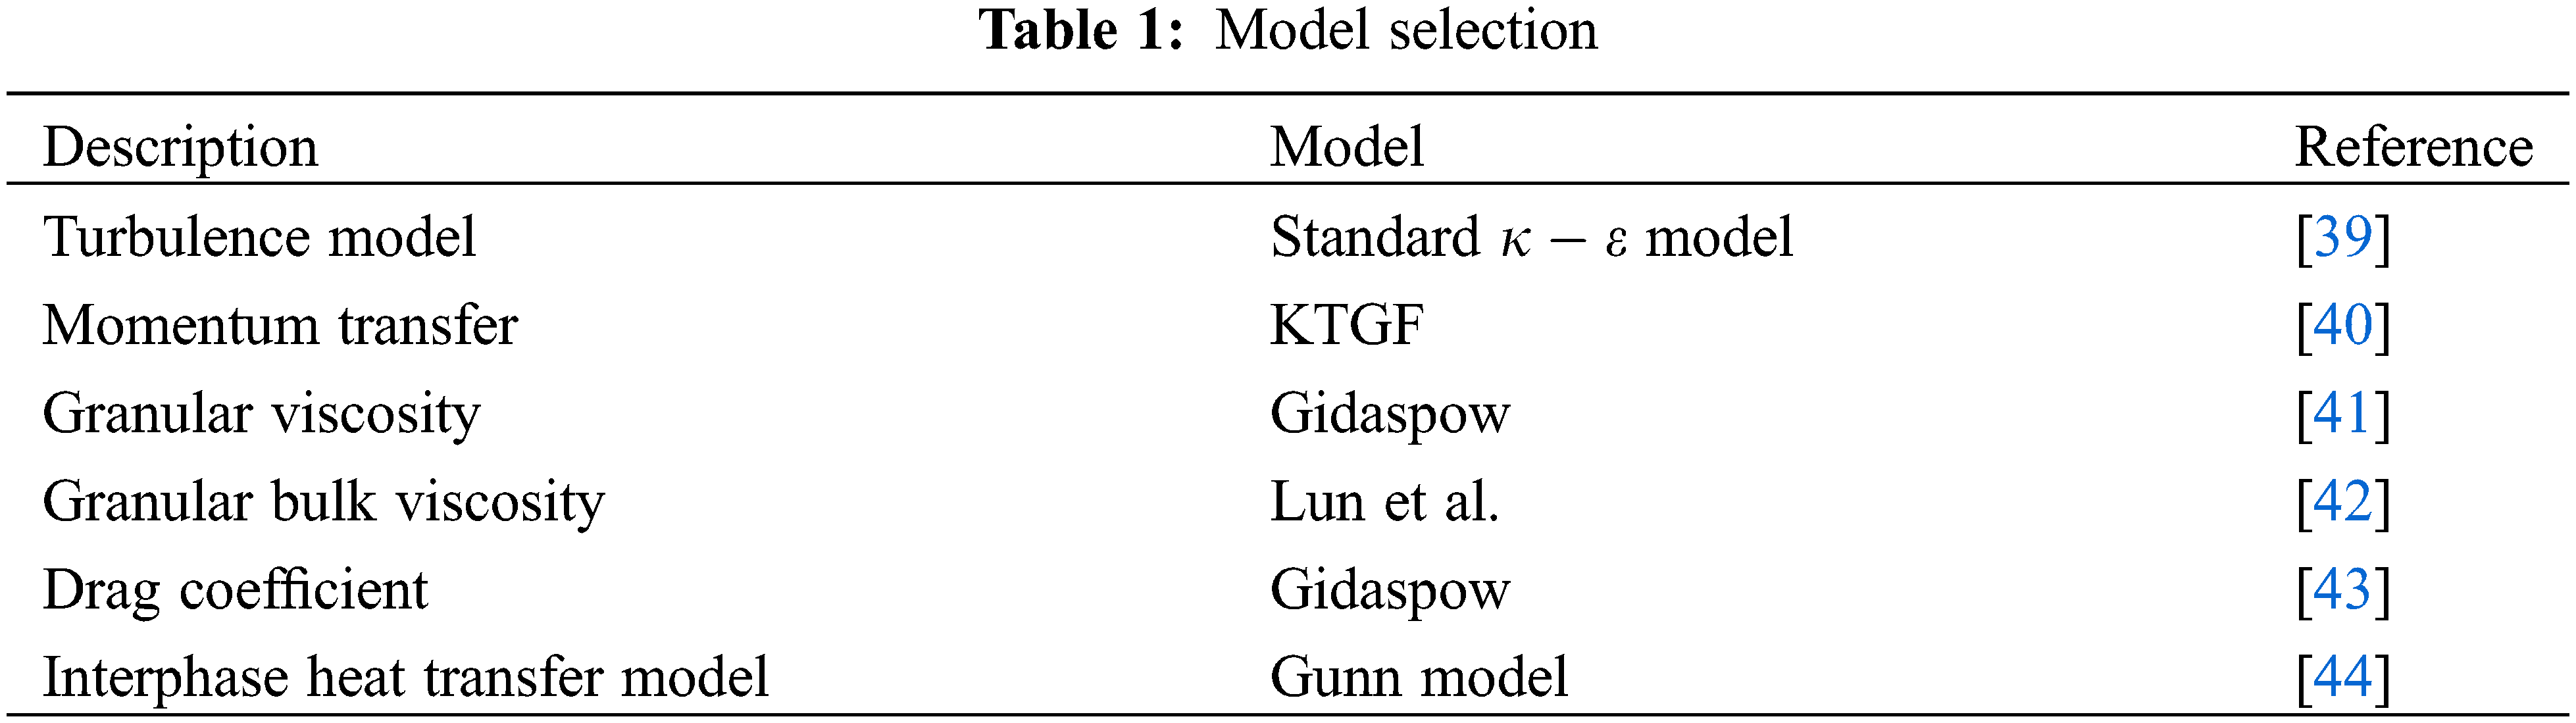
The Kinetic theory of granular flow (KTGF) is used to obtain the properties of the solid phase, while the Gidaspow drag model is selected to describe the force between the gas and solid phases. For the sake of closing the energy equations, the heat transfer between gas and solid phases is described mathematically with the Gunn heat transfer model. Table 1 presents more detailed model choices.
The reaction equation for CO to generate CH4 under the catalysis of catalyst is as follows:
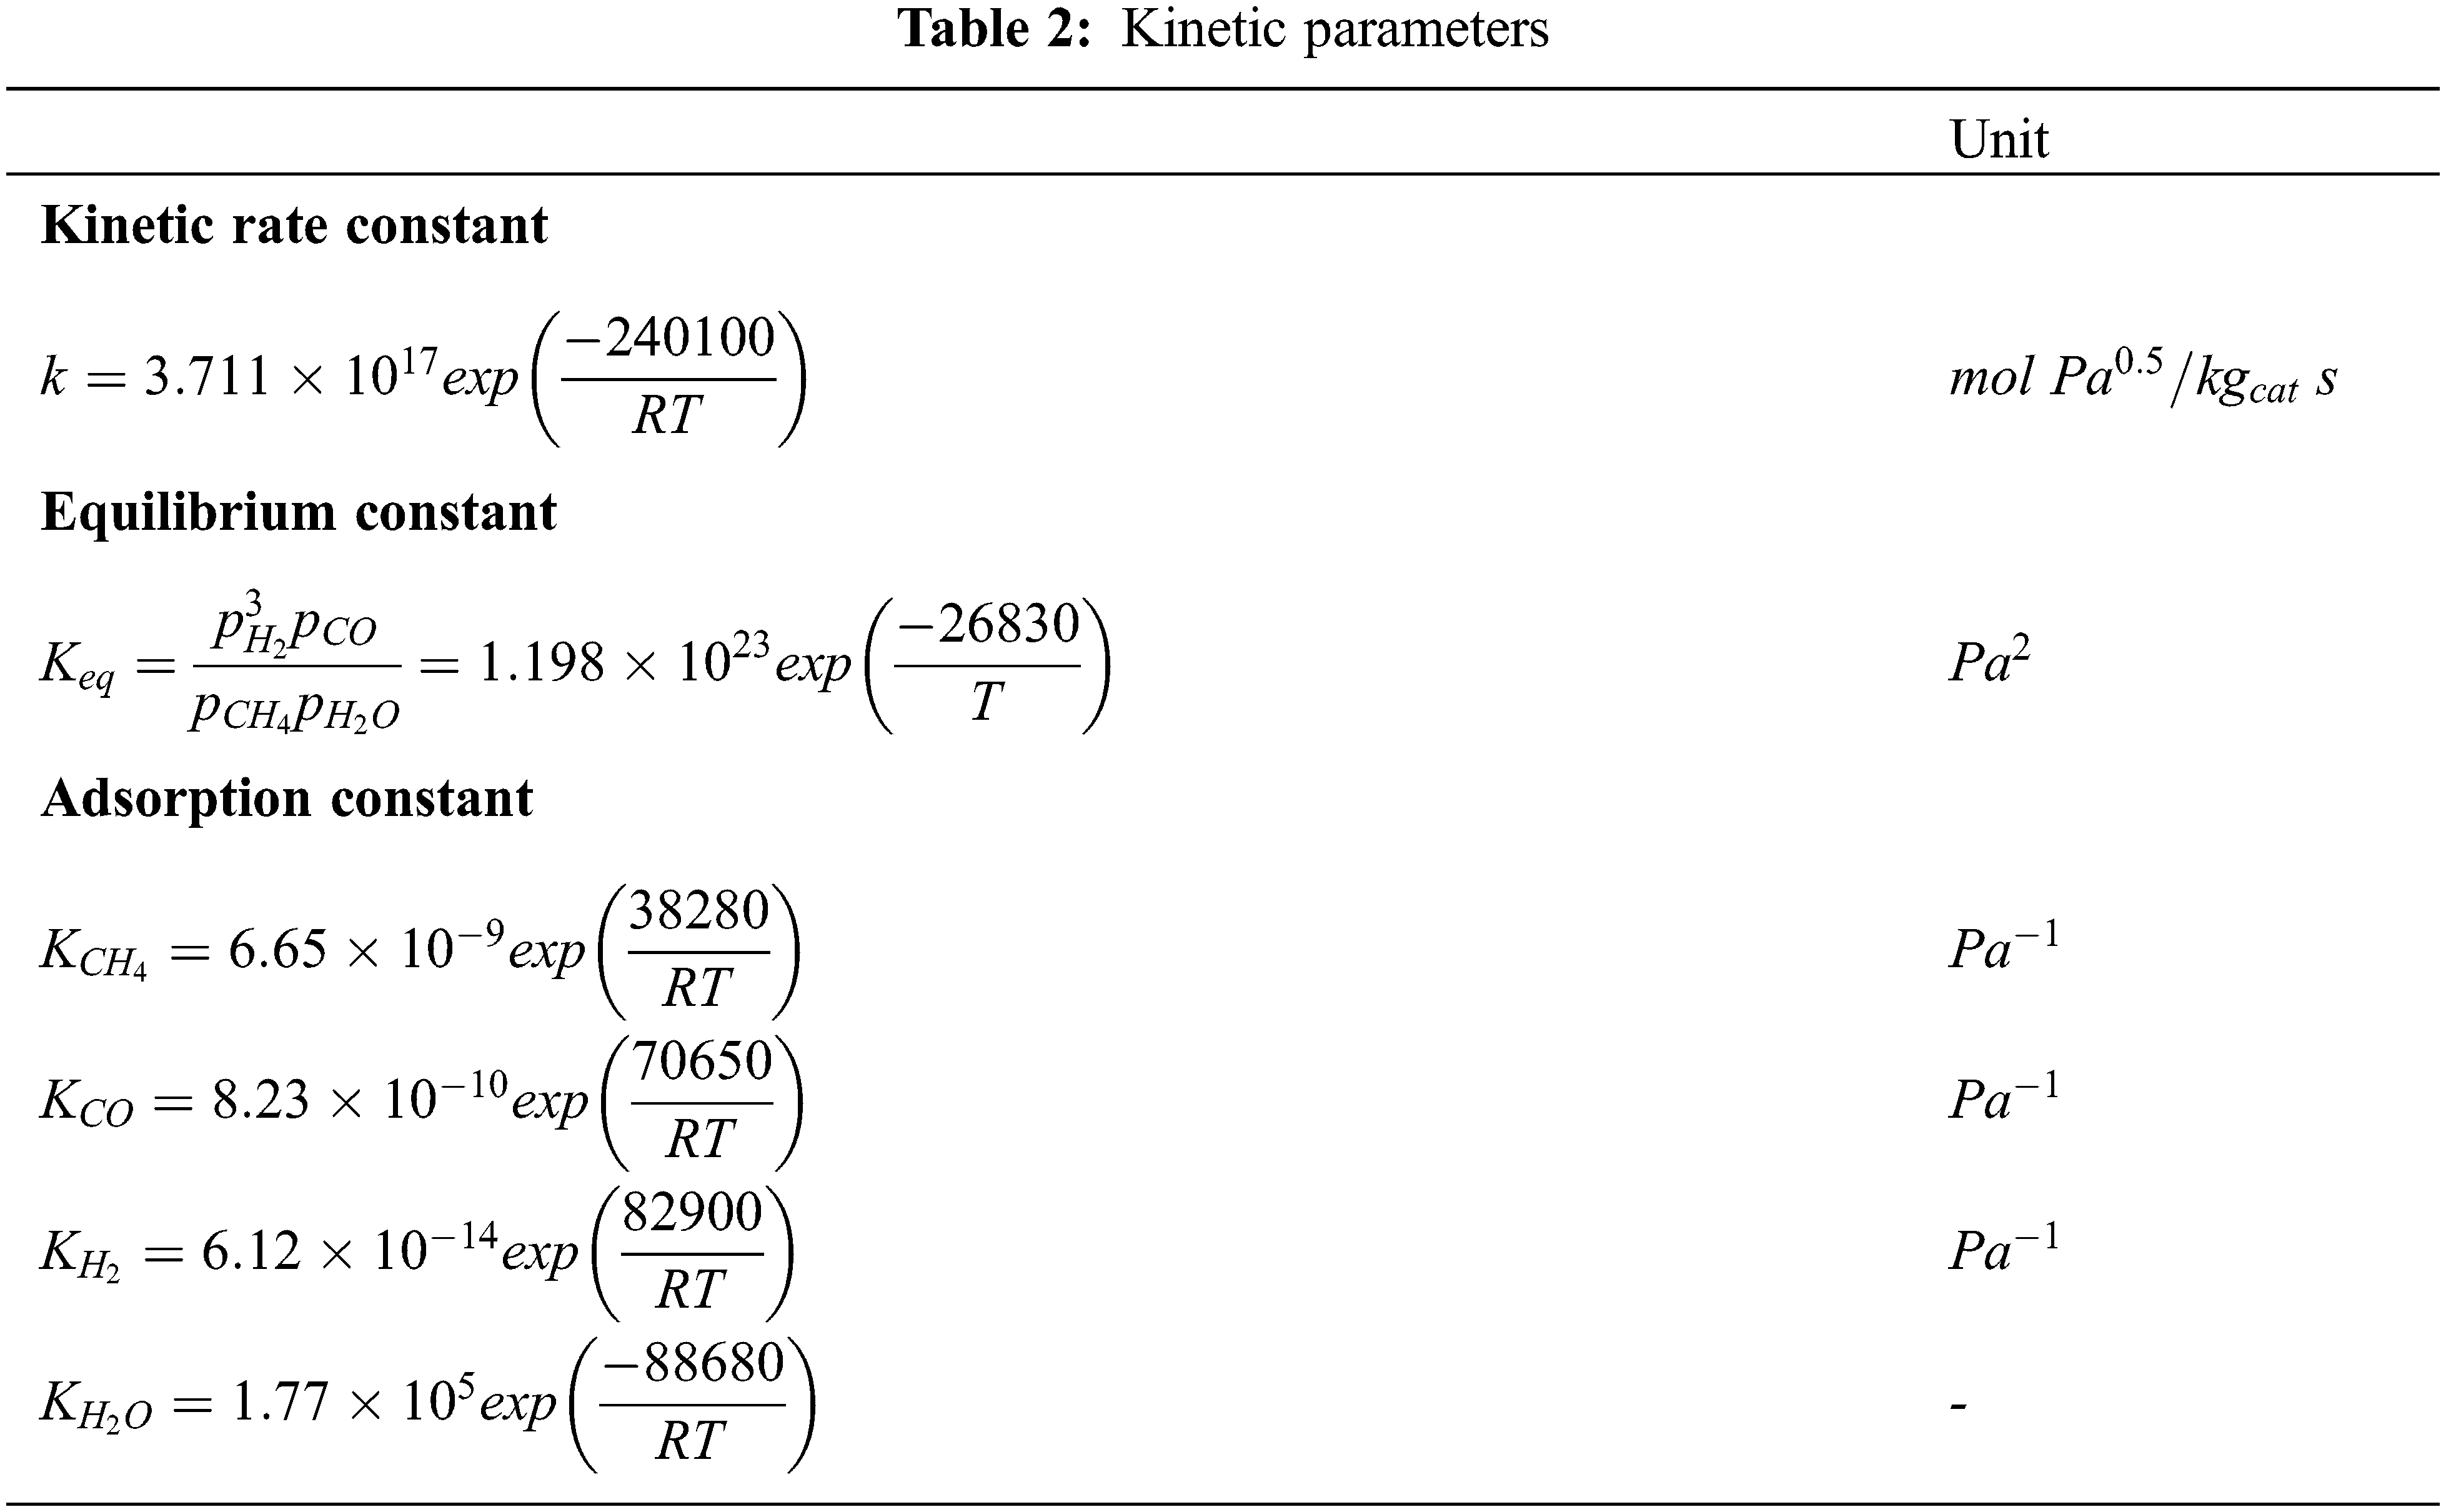
According to the kinetic rate model of CO methanation proposed by Chein et al. [38] and Xu et al. [45], we can get the following information:
where,
In Eqs. (29)–(30),
Methanation can be evaluated by the conversion rate of CO. The CO conversion rate is defined as follows:
Under the quasi-stable state, the values of parameters
where,
The probability
where,
2.4 Geometry and Calculating Settings
The fluidized bed reactor proposed by Liu et al. [31] is selected for this simulation, as shown in Fig. 1. The height of the whole reactor is 1800 mm, the inner diameter is 10 mm, and the outlet length is 250 mm. In terms of the mesh, the hybrid grid is used to accurately capture the multiphase flow characteristics. The tetrahedral meshes are used for the solid inlet with complex flow conditions, and the conventional hexahedral meshes are used for other parts.
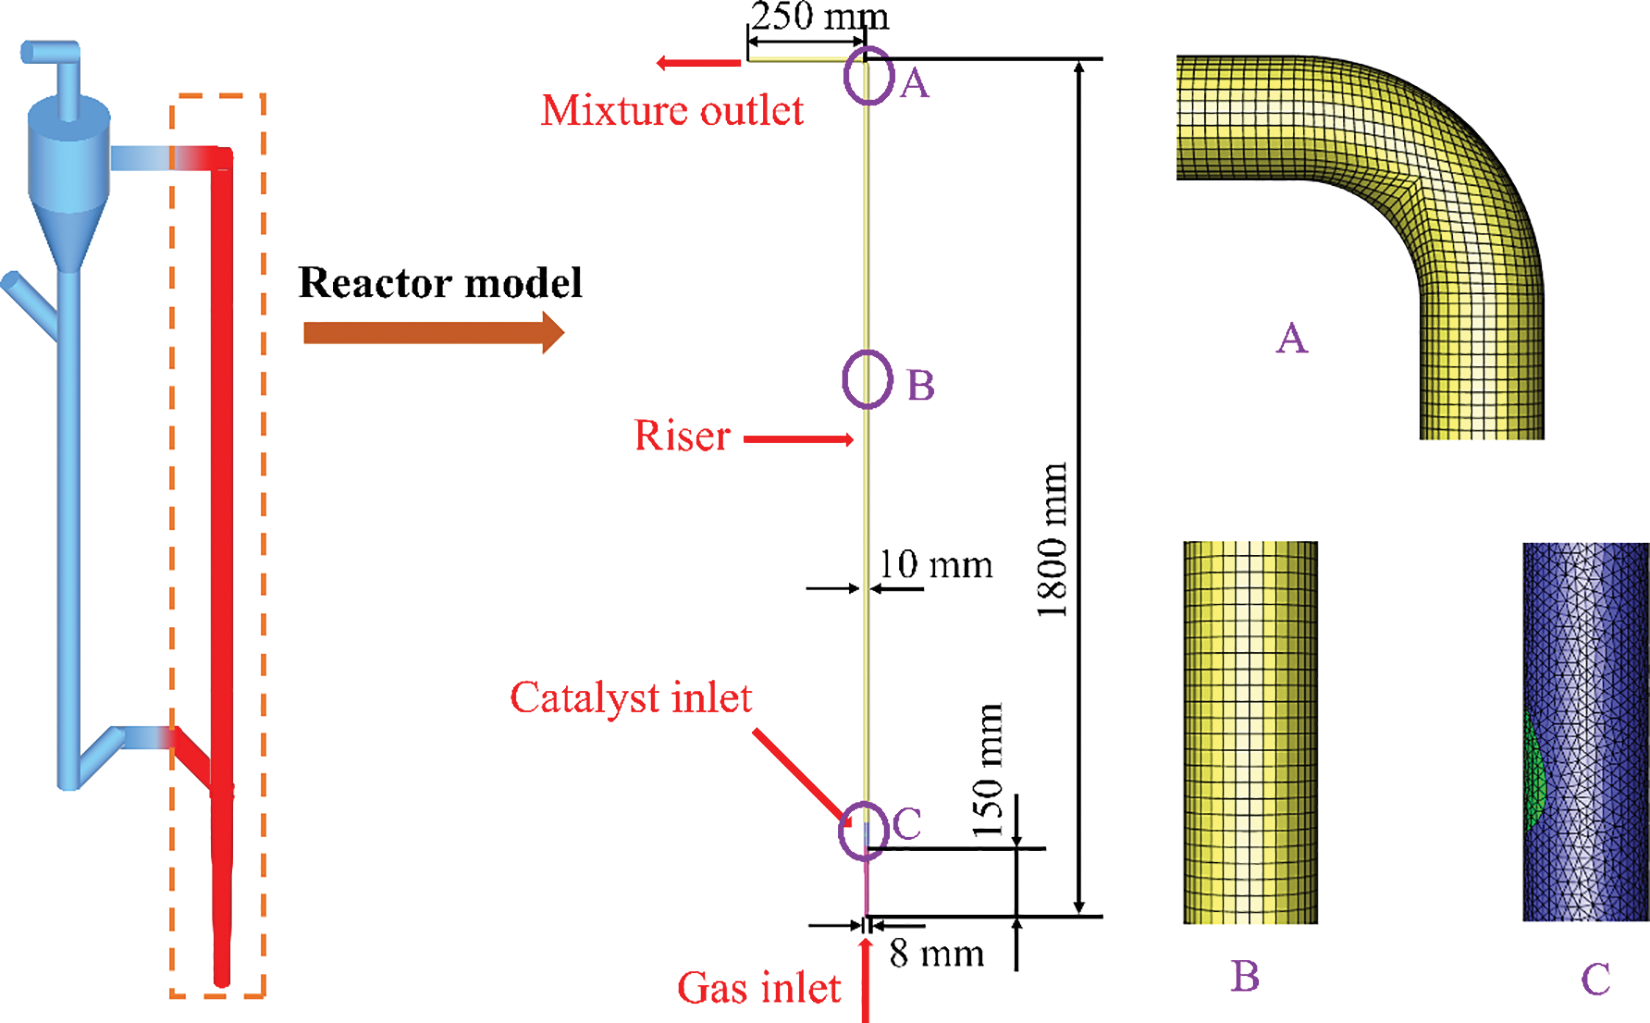
Figure 1: Schematic diagram and grid partition of the fluidized bed methanation reactor
The mixture of the gas inlet is composed of CO, H2 and N2. Among them, CO and H2 are the main reactants of the methanation reaction, and the mole fraction ratio is controlled at H2:CO = 3:1, which is consistent with the best value found in the experiments [37]. In order to achieve a high CO conversion rate, the temperature of the gas is preheated to 400°C. The solid inlet is filled with spherical particles with a density of 1000 kg/m3 and an average diameter of 0.04 mm. At the same time, a certain amount of N2 is introduced for gas transmission.
Both catalyst inlet and gas inlet are set as velocity inlets, while the mixture outlet is selected as the pressure outlet. The boundary condition of the reactor wall is set as the adiabatic and no-slip wall. Before adding catalyst particles, it must be ensured that the gas flow field inside the reactor is uniform and stable. In the subsequent simulation, the Pressure-Based method is adopted to solve the control equations while the Phase Coupled SIMPLE scheme is applied to the pressure-velocity coupling. The energy equations are solved by the Second Order Upwind, and other equations are solved by the First Order Upwind. The time step is set to 1 × 10⁻⁴ s, and the max iterations per time step are set to 10.
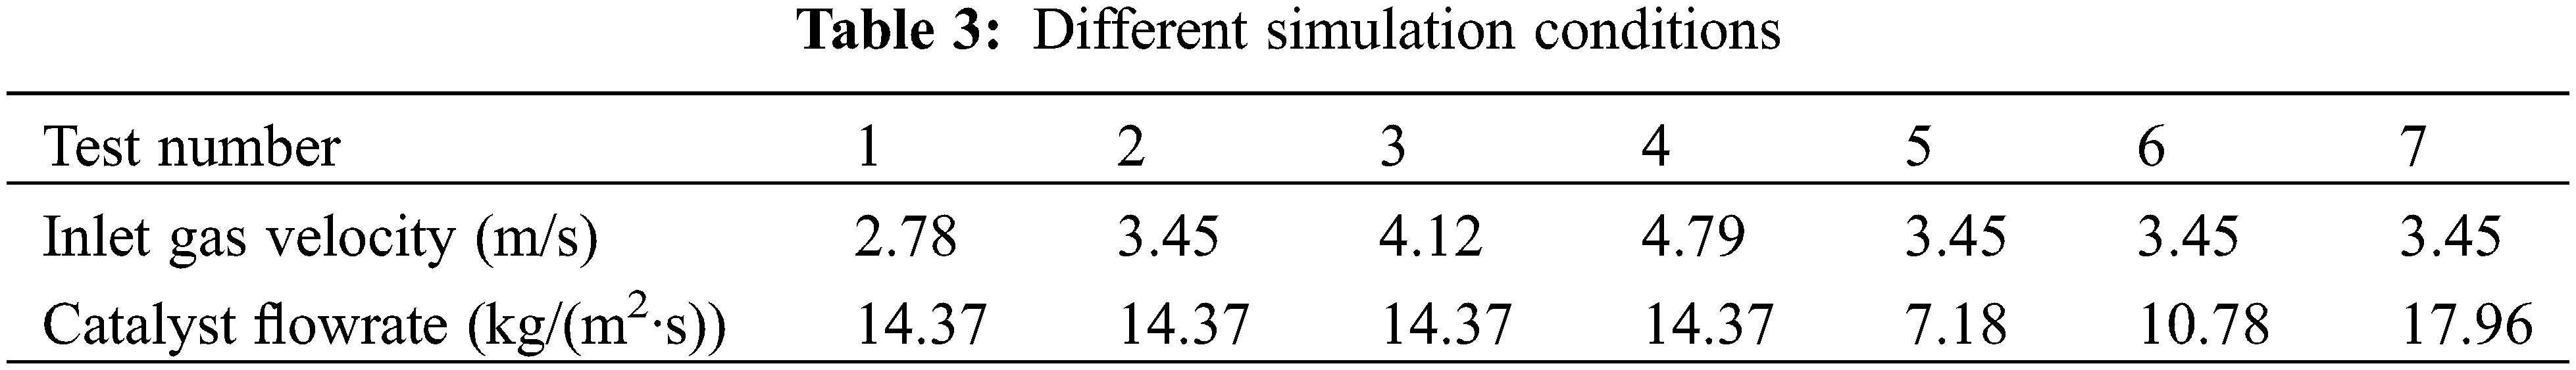
In this work, different operating parameters were set to investigate the mass transfer behavior and heat transfer mechanism of the methanation process in the fluidized bed reactor. According to previous studies, we can find that the flow behavior directly affects the reaction rate and the heat transfer efficiency [41,44]. Therefore, the inlet gas velocity and catalyst flowrate are determined as the research variables. Table 3 shows the different working conditions in this study, and test 2 is the reference working condition for specific analysis. Tests 1, 2, 3, and 4 change the velocity of inlet gas. Tests 2, 5, 6, and 7 are used to study the influence of the number of catalyst particles on the operation performance of the methanation reactor.
3.1 Mesh Independence and Model Feasibility
The number of meshes directly impacts the time and accuracy of the calculation. In order to select the most suitable method of meshing, three different kinds of meshes are divided as exhibited in Table 4. Under the same simulation conditions, the temperature distribution in the reactor with different meshes is predicted, which is demonstrated in Fig. 2. The results of fine meshes, medium meshes, and coarse meshes are similar. Along the height of the reactor, the temperature increases rapidly and then decreases slowly. The results of the medium and fine meshes are basically the same, while the results of the coarse meshes are obviously different. Generally speaking, the calculation results of fine meshes are more reliable, but the huge number of grids may consume a large amount of the calculation time. The medium meshes with 670733 grids were adopted to achieve a balance between the computational cost and the simulation accuracy.
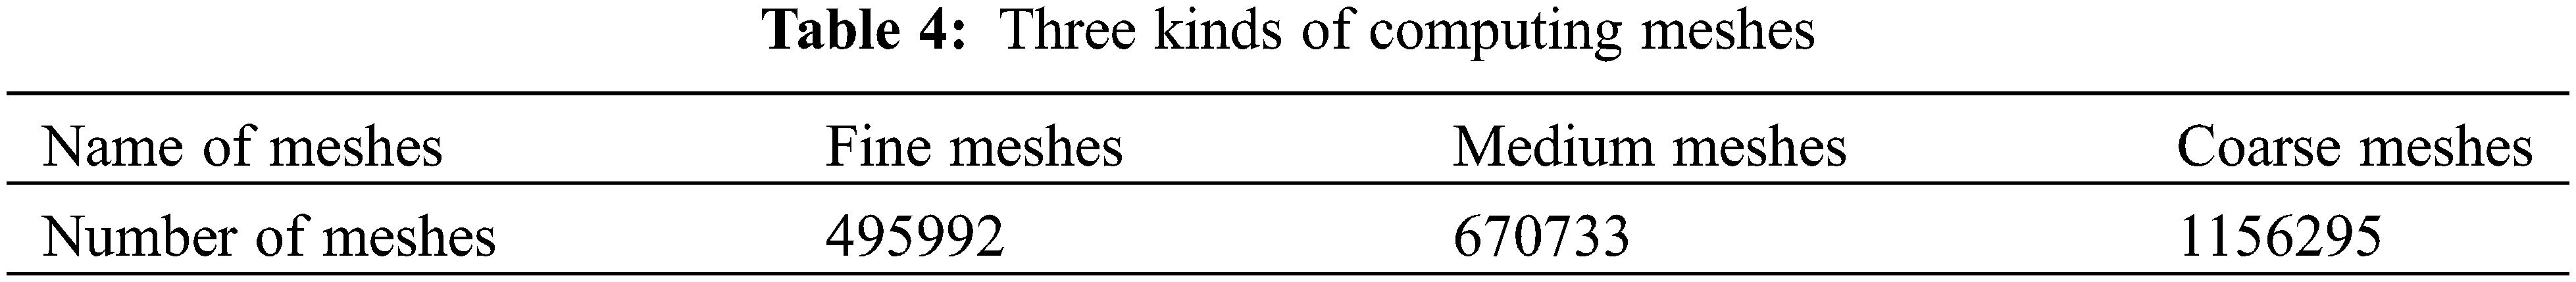
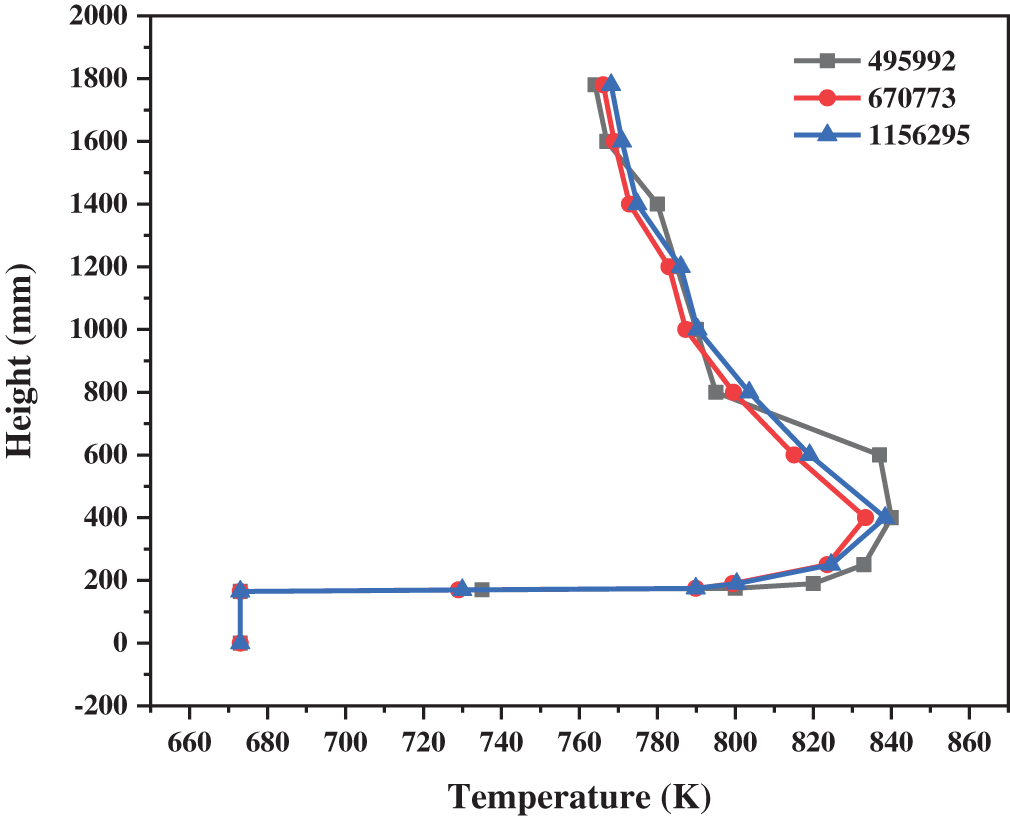
Figure 2: Temperature distribution with different meshes
In order to verify whether the calculation model and the reaction model are reasonable, the experimental results are compared with the simulation results. As exhibited in Fig. 3, when the gas inlet velocity is 2.75 m/s and the particle circulating temperature is 400°C, the particle conveying velocities are changed, and the different CO conversion rates are obtained. The errors of the final results under the four working conditions are all within 10%, so the model is in good agreement with the experiment.
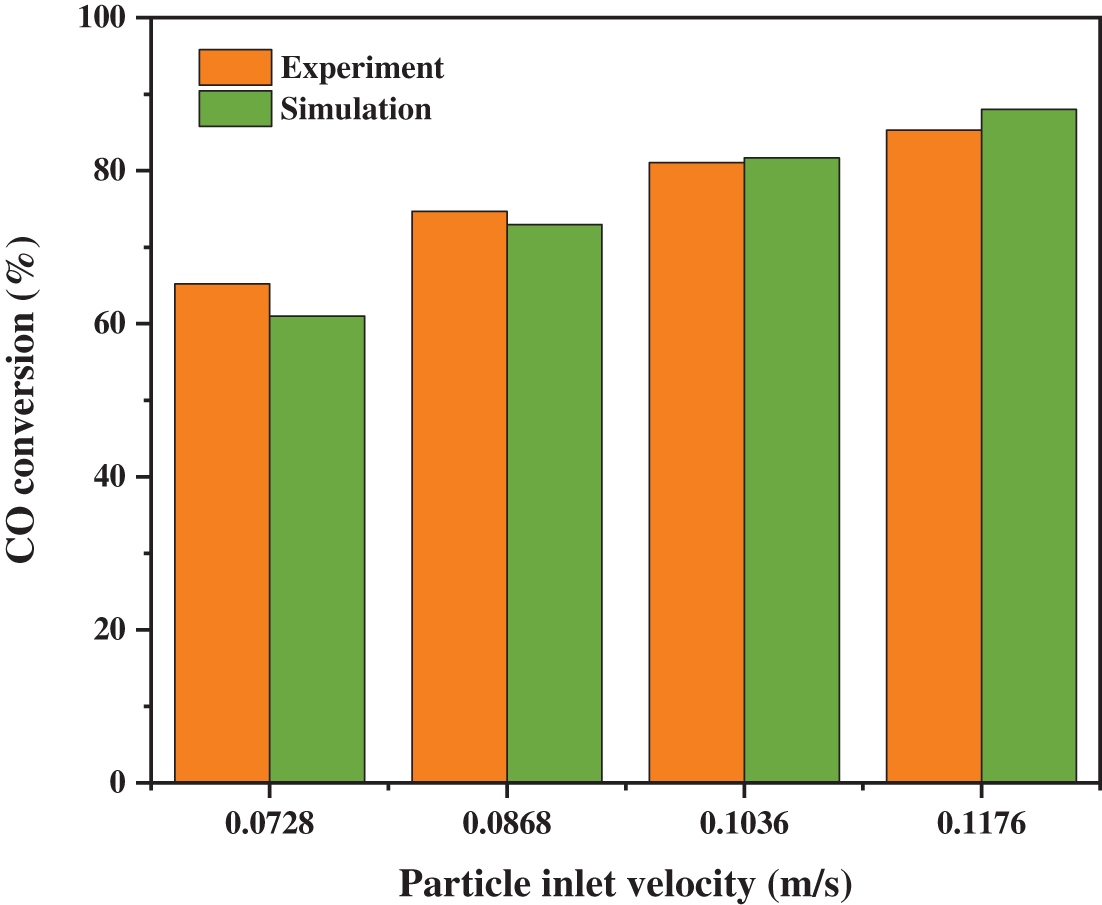
Figure 3: Comparison between simulation results and experimental results
3.2 Simulation under the Reference Case
In the process of simulation, the catalyst volume fraction at different heights is monitored and analyzed, as illustrated in Fig. 4. In the region above the height of the catalyst inlet, the variation trend of catalyst volume fraction can be divided into three processes. In the first stage, the catalyst particles are just transported into the reactor. The accumulation of the particles appears near the solid inlet, and the volume fraction of the particles gradually increases. In the second stage, the gas flow area decreases, and the gas velocity increases because of the accumulation of particles. The particles in the reactor are carried away by high-velocity flowing gas. In the third stage, the gas phase and the solid phase gradually form a stable coexistence situation, and the operation of the reactor becomes stable. Comparing the variation characteristics at different heights, it is found that the fluctuation range of catalyst volume fraction declines with the increase in height. Because the proportion of the catalyst particles in the top area is small, the disturbance will not influence the distributions greatly.
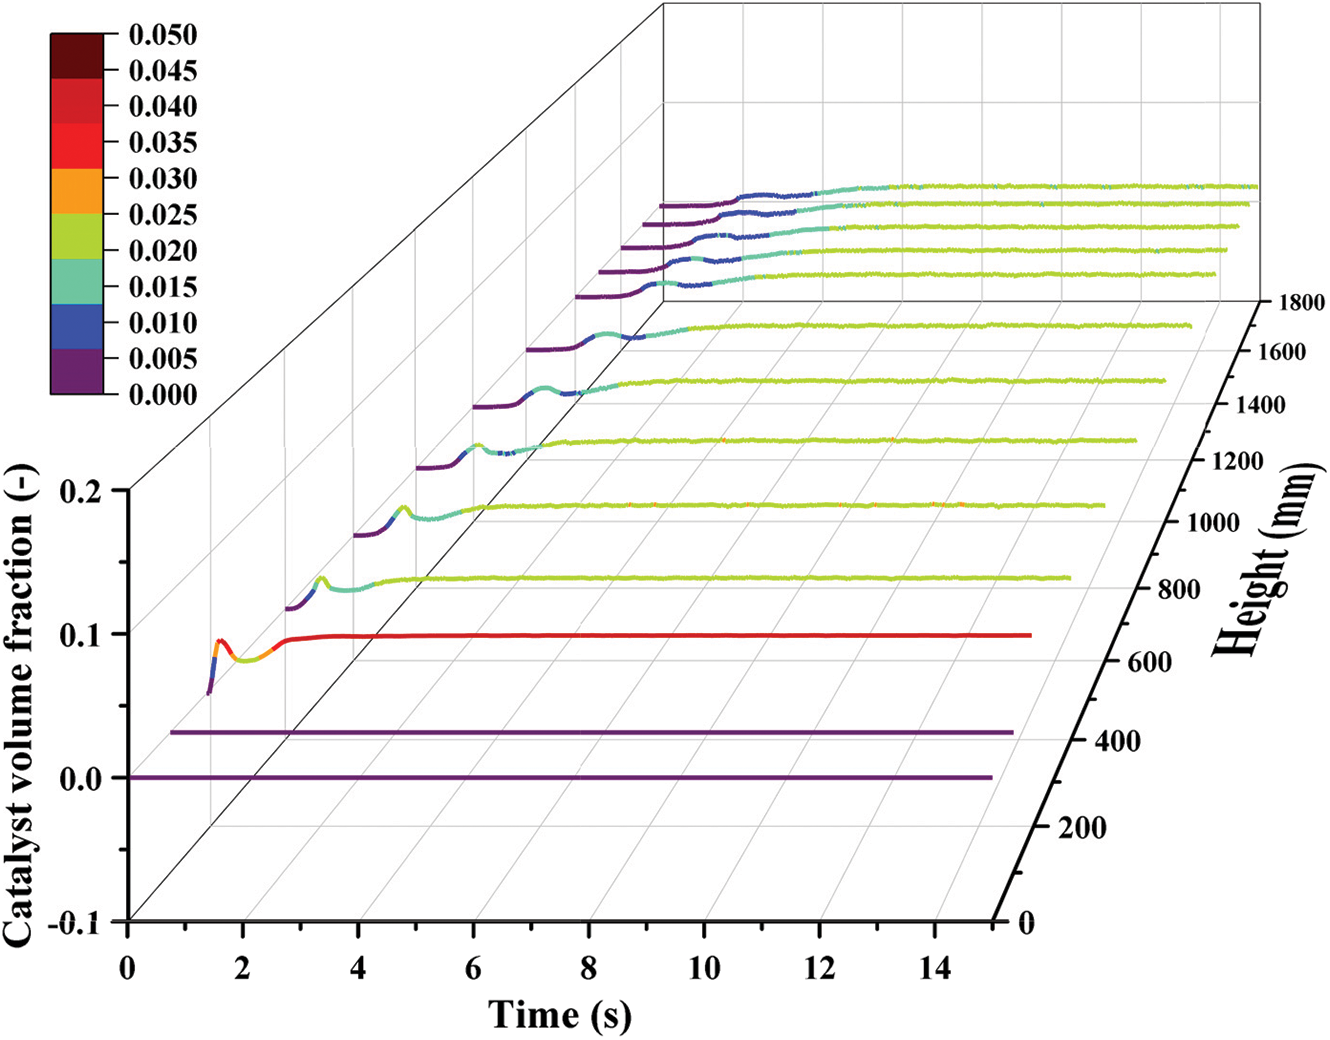
Figure 4: Variations of particle volume fraction at different heights
Fig. 5 describes the catalyst volume fraction in the reactor along the height. There are no catalyst particles below the solid inlet, which is consistent with Fig. 4. At the entrance of the catalyst particles, the particle volume fraction of the section is the maximum value, which is 0.042. At the same time, the maximum value of 0.4 also appears on the volume fraction cloud map, which is consistent with the proportion of catalyst volume fraction at the particle inlet. In the upper part, the catalyst volume fraction is unchanged, distributed between 0.02 and 0.025. Observing the cloud maps at the crosses, there is a certain degree of particle aggregation on the side of the solid inlet. As the height rises, the particle agglomeration phenomenon has been significantly weakened, although the values of the catalyst volume fraction remain unchanged.
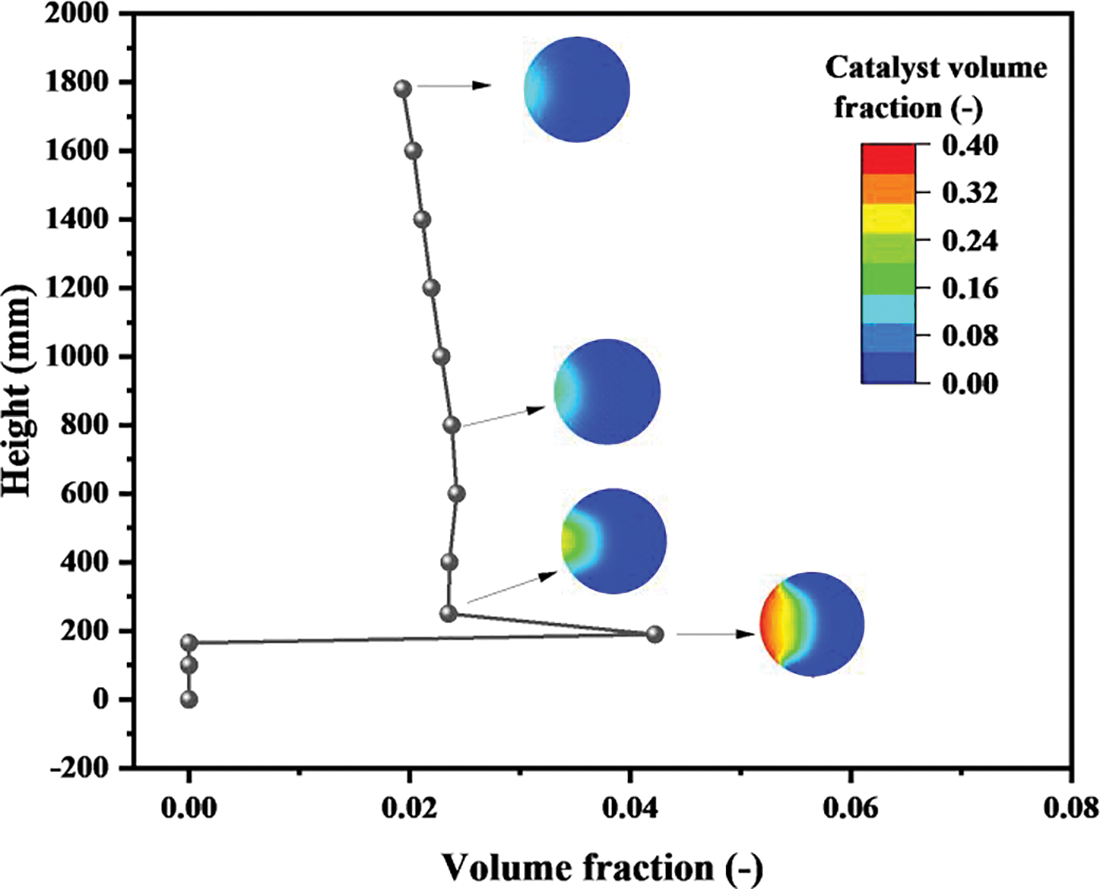
Figure 5: Distributions of particle volume fraction on sections with different heights
Fig. 6 records the variations of pressure at different heights with time. In the whole reactor, the pressure decreases first and then fluctuates to a fixed value. The methanation catalytic reaction is a rapid reaction with reduced volume. After the catalysts are added to the reactor, the methanation reaction leads to the transient negative pressure state. Hence, pressure drops sharply at the beginning. Later, with the continuous inflow of the gas and the catalyst, the internal pressure increases first, then followed by the stable condition. The pressure distribution on each section is gradually getting normal.
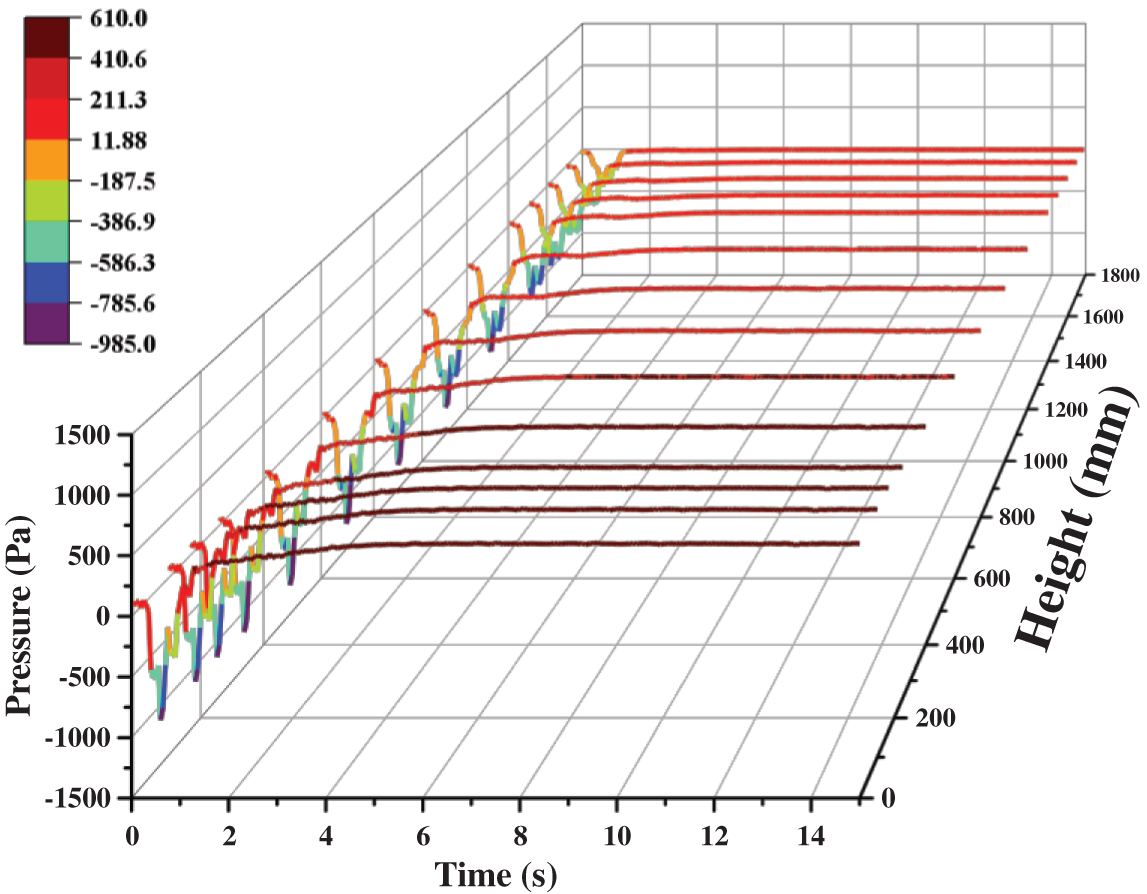
Figure 6: Variations of pressure at different heights with time
Comparing the values of the pressure at different heights, it is found that the pressure is inversely proportional to height. It is easy to understand that when the gas flows through the reactor, there are energy consumption terms such as resistance loss along the way, local resistance loss, and collision loss with particles. As the height reduces, more pressure is required to compensate for these losses, and the higher the pressure value will be. Meanwhile, the outlet of the reactor is set as a pressure outlet, so its pressure value is 0. In addition, the pressure fluctuation is gradually weakened during the upward flow of the gas and the catalyst. In the quasi-steady state, the pressure fluctuation range decreases from 17.7 Pa at the inlet to 4.5 Pa at the outlet.
As shown in Fig. 7, the gas velocity shows a downward trend as a whole. In the region of Z < 150 mm, the gas velocity decreases sharply since the pipe diameter of the reactor becomes larger. In the region of Z > 150 mm, the gas velocity slowly decreases because the methanation reaction on the catalyst surface is a process of volume reduction. The volume reduction contributes to a slight decrease in the velocity of the gas. The catalyst particles enter the reactor at a very small velocity, which can be intuitively seen from cloud maps of the velocity distribution. Then, the fast-flowing gas brings about a sharp increase in the catalyst velocity. Some interesting conclusions can be drawn by comparing the velocity changes of the gas phase and the solid phases’ velocity changes. The velocity difference between the gas and the catalyst becomes smaller and smaller with the climbing of height. This proves that the development of the multiphase fluid flow is complete. However, their velocities are not entirely consistent as a result of a certain relative slip.
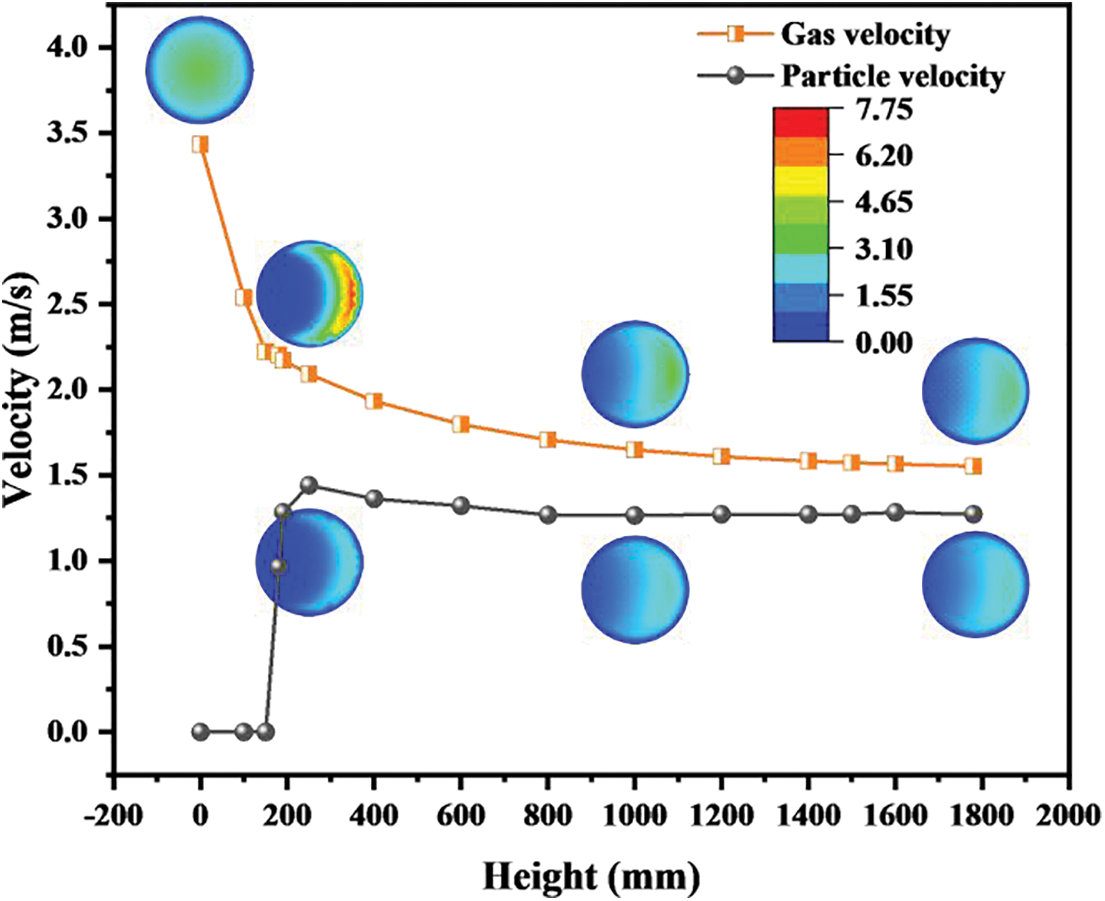
Figure 7: Distributions of velocities on sections with different heights
The probability density distribution can more intuitively reveal the distribution probability of parameters in different intervals. Select a certain number of research points equidistantly on the research object (such as cross sections) and read the parameter values (such as gas velocity) on these points. The range of parameter values is divided into 20 or 40 cells on average, and the probability of occurrence of values in each cell is counted. Finally, the probability density distribution is obtained by sorting the data.
In order to show the velocity distributions of different sections more accurately, a probability bar chart, as presented in Fig. 8, is drawn. Take the gas velocity probability diagram as an example. The data processing method is as follows. Firstly, the variation range of gas velocity is determined to be 0~8 m/s, and then the probability of each small velocity interval is calculated in increments of 0.2 m/s. The statistical method used in the catalyst velocity probability diagram is consistent with the above. Figs. 8a and 8b have many obvious similarities. At the cross-section of Z = 0 mm, there is no catalyst, so the gas velocity is not affected by the catalyst. The gas velocity distribution is very uniform, with a nearly 70% probability of the velocity being in the range of 3.4 m/s to 3.6 m/s, which is determined by the gas inlet velocity. Since the no-slip wall boundary condition is selected, some lower velocities appear near the wall. At the section of Z = 175 mm, the velocity is close to 0 m/s in large part of the area because the velocity at the inlet of the catalyst particles is very small. At the same time, the gas flow at the inlet of the catalyst compresses the original gas flow in the reactor, so that a larger velocity will be formed in some places. At the sections of Z = 1000 and Z = 1780 mm, the velocity distribution is very uniform, too large and too small velocities hardly appear, and the probability of occurrence of each velocity interval is less than 15%.
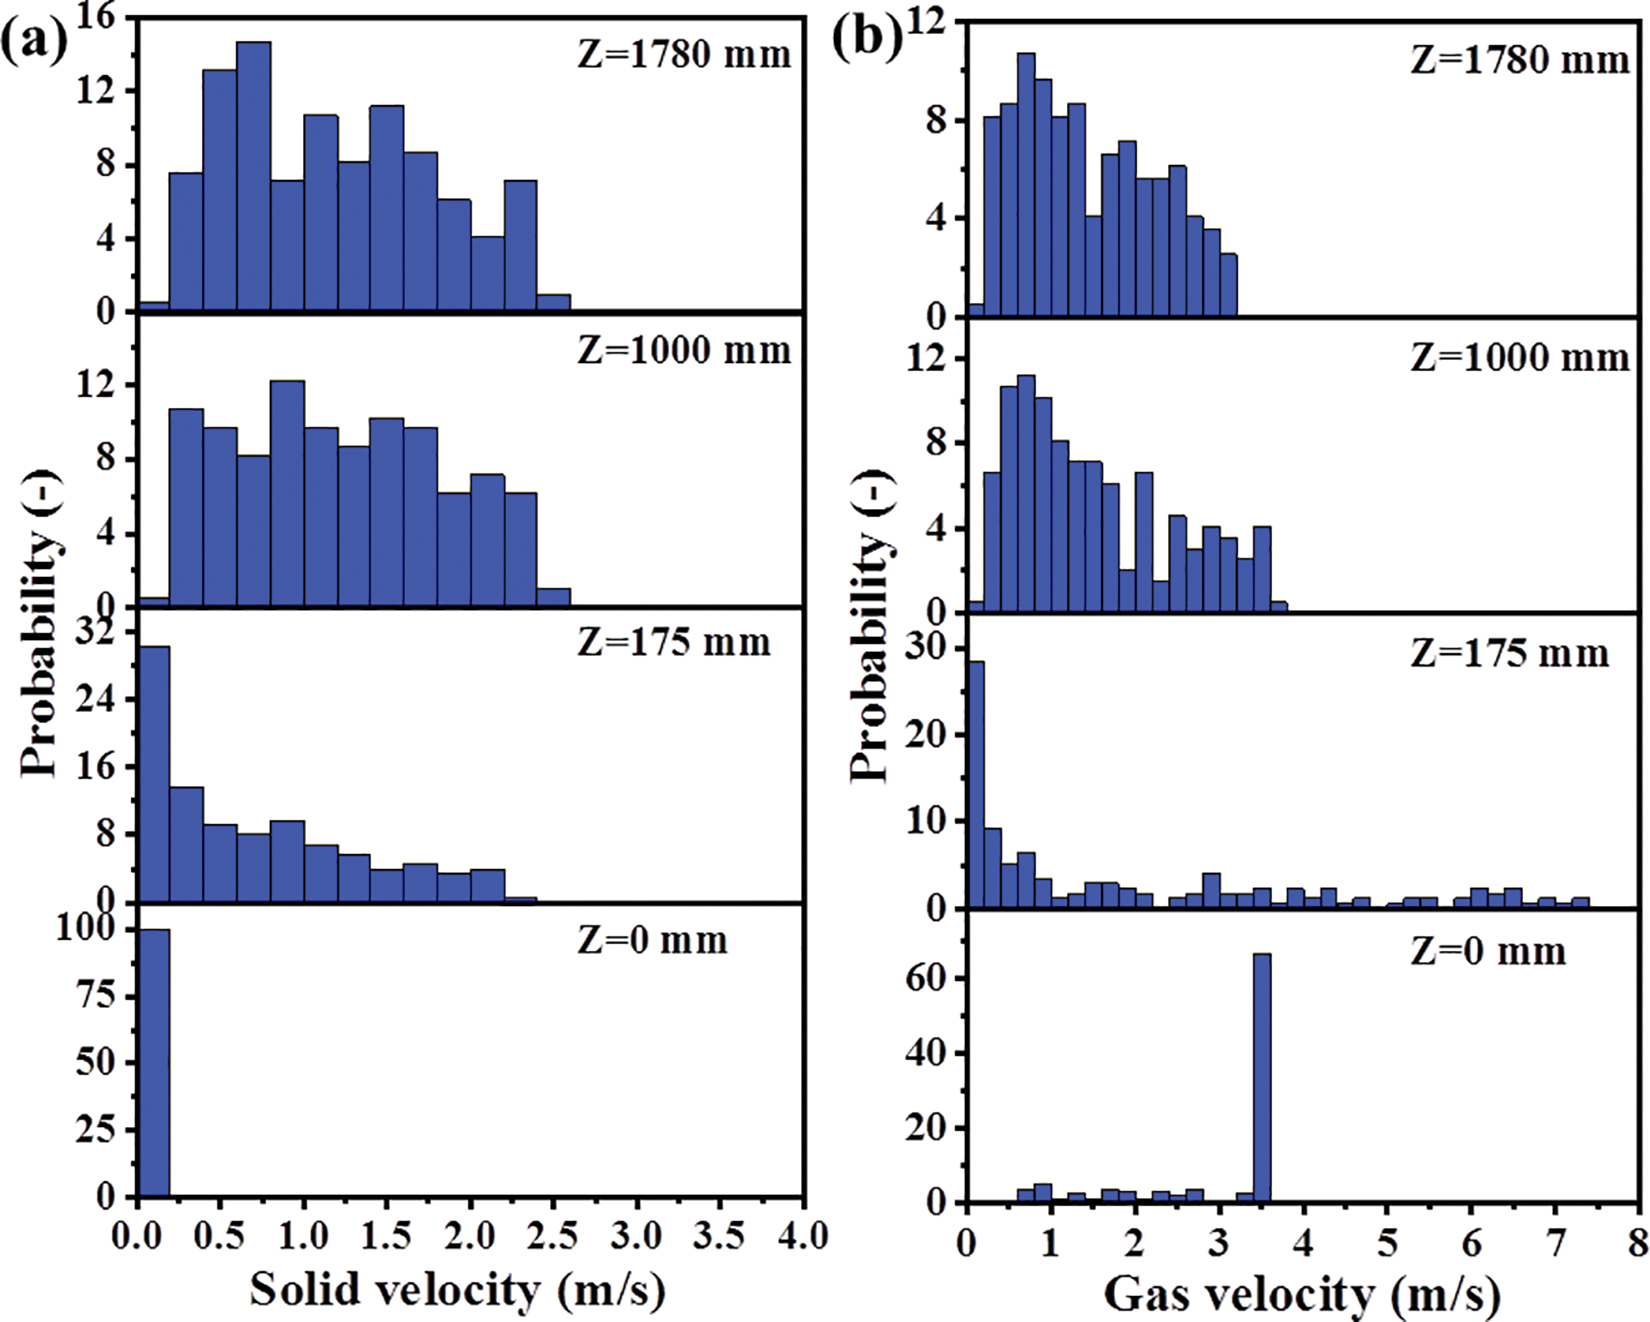
Figure 8: Probability distribution of velocity: (a) solid velocity; (b) gas velocity
3.2.4 Temperature Distribution
Since the methanation reaction is a strongly exothermic process, observing the temperature distribution inside the reactor to prevent the occurrence of hot spots is of great importance for the experiment. As shown in Fig. 9, the overall temperature rise of the whole reactor is 93.14 K, but the highest temperature occurs at the section of Z = 400 mm with a value of 833.39 K. In the region of Z > 400 mm, the temperature drops slowly, and the rate of decrease gets slower. The magnitude of the temperature is determined by the heat released by the reaction and the heat carried away by the gas and the solid. As the concentration of catalyst particles increases, both the reaction rate and the released heat increase. As the gas and the catalyst particles are mixed better, the gas-solid contact area increases, and more heat will be carried away accordingly. From the above analysis, it can be seen that the catalyst particles are prone to aggregation in the region of Z < 400 mm, so the reaction heat is very large. At the same time, the gas and the catalyst particles are not well mixed, and the heat cannot be removed in time. As a result, the heat builds up gradually and peaks at 400 mm. In the region of Z > 400 mm, although the volume fraction of the catalyst particles is basically unchanged, good gas-catalyst mixing enables the heat to be removed effectively.
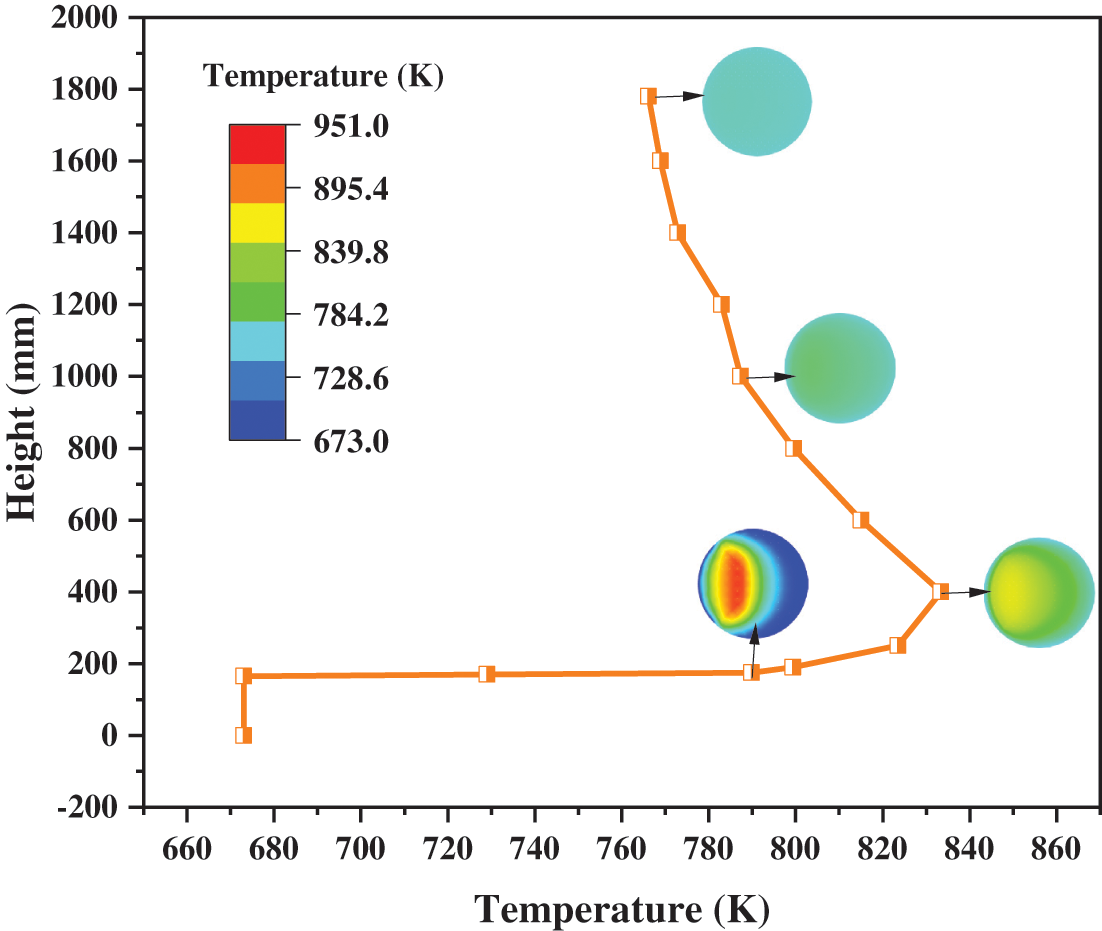
Figure 9: Distributions of temperature with different heights
Sections with heights of 175, 400, 1000, and 1780 mm were selected as research objects. As demonstrated in Fig. 10, the 3D diagram of cross-sectional temperature can vividly observe the temperature level and distribution. At the same time, the temperature curves on the Y = 0 mm section are also drawn. It is obvious that although the maximum temperature of the section appears at Z = 400 mm, the temperature of the hot spot is at Z = 175 mm. Because Z = 175 mm is the cross-section of the solid inlet, the concentration of the catalyst particles is highest here. At the cross-section of Z = 175 mm, the temperature varies from 673 to 951 K, while the temperature varies from 673 to 769 K at the cross-section of Z = 1780 mm. This means that as the height increases, in addition to the continuous decrease of the maximum temperature, the minimum temperature on the cross-section is also increasing. According to Figs. 10a–10d, the minimum temperature appears near the wall. But its value gradually increased from 673 K at the beginning to 739, 758, and 761 K. Therefore, the temperature distribution on the cross-section becomes more uniform as the height increases.
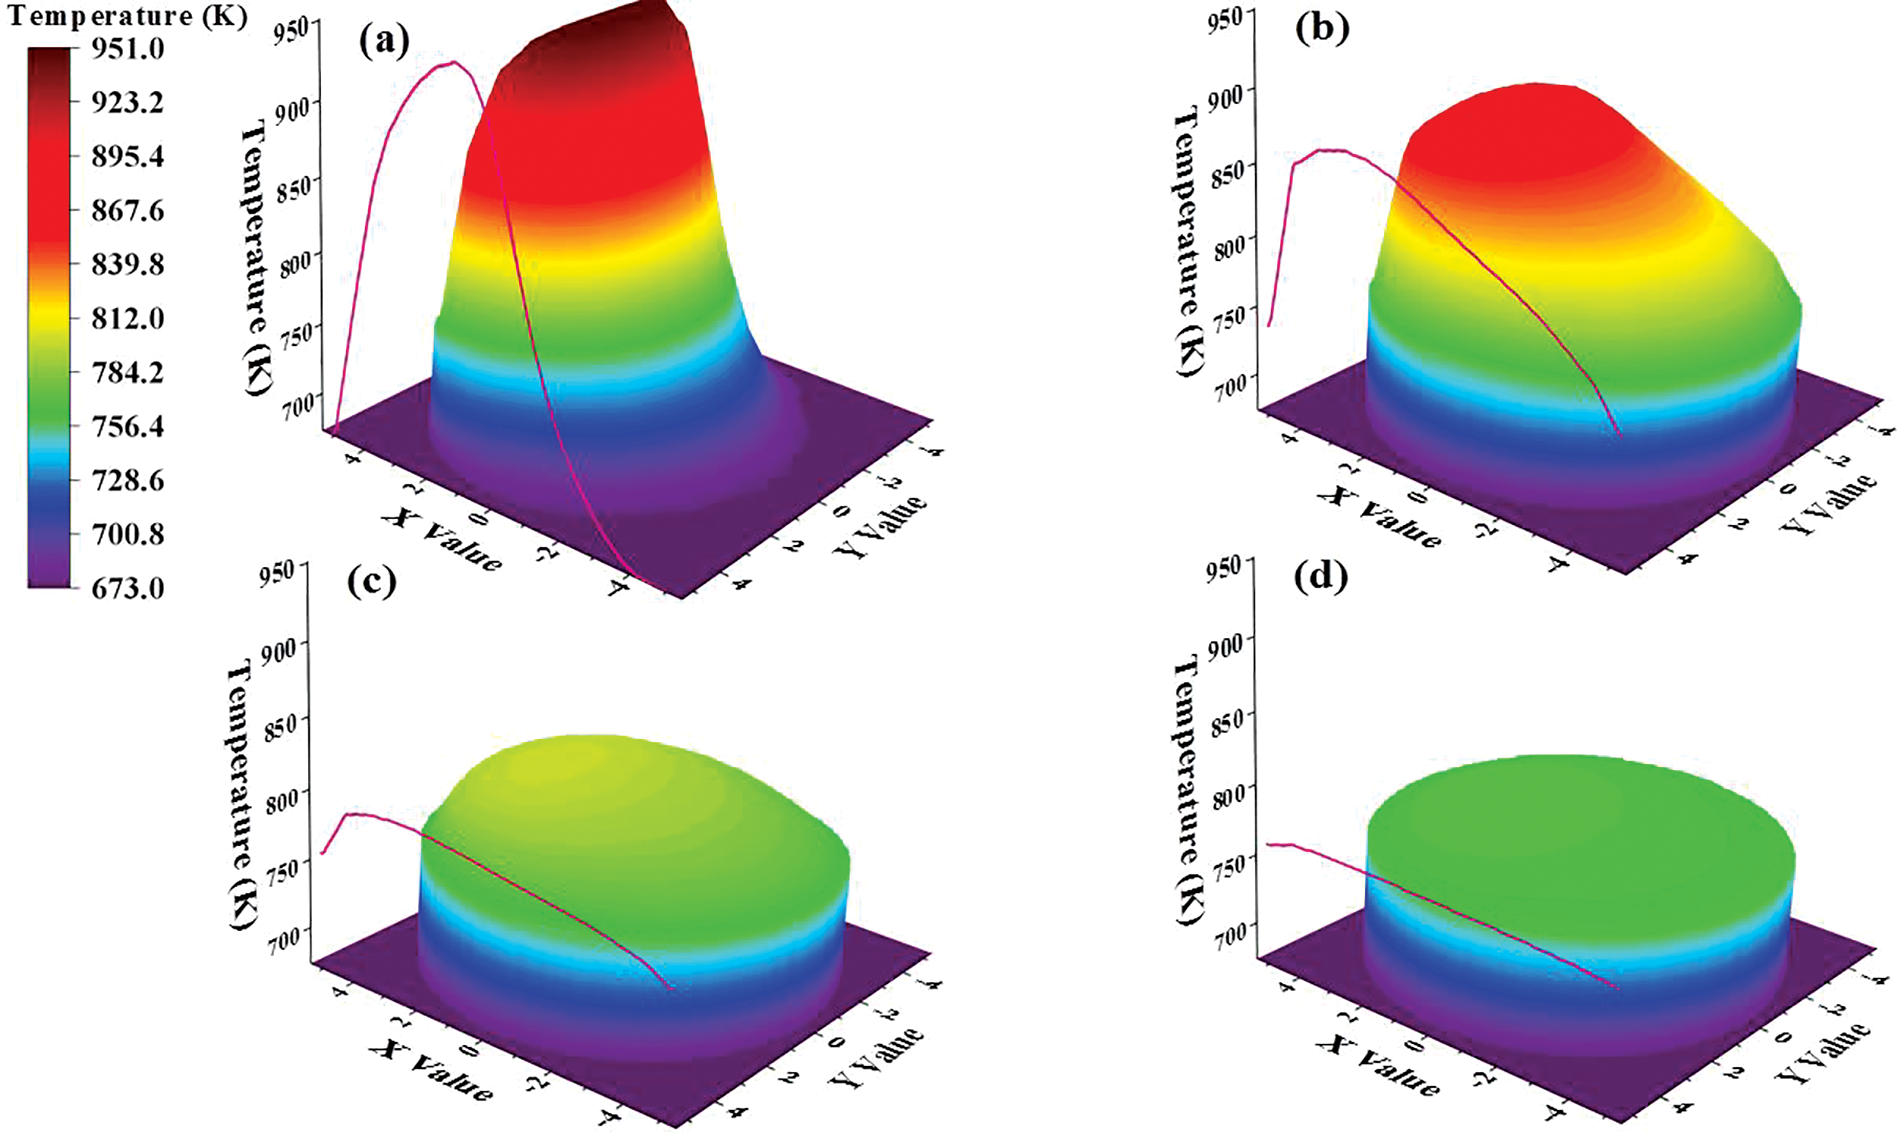
Figure 10: Distributions of temperature on sections: (a) Z = 175 mm; (b) Z = 400 mm; (c) Z = 1000 mm; (d) Z = 1780 mm
3.3 Simulation under Variable Conditions
Every working condition is named according to different inlet gas velocities and catalyst flowrate. For example, the working condition with an inlet gas velocity of 2.78 m/s and catalyst flowrate of 14.37 kg/(m2·s) is called “2.78–14.37”. Other working conditions are named according to this method as well.
3.3.1 Characteristics of Catalyst Volume Fraction
Fig. 11 is composed of some curves which show the variation of the catalyst volume fraction under the different operating conditions. The overall volume fraction in the reactor becomes smaller with the increase of the inlet gas velocity. With the increase of the catalyst flowrate, the catalyst volume fraction becomes larger. Hence, reducing the inlet gas velocity and increasing the catalyst flowrate can make more catalysts remain in the reactor to achieve full contact between the gas and catalyst phases. In addition, we have some interesting findings. In the area with a height of 0~250 mm, the changing trend of catalyst volume fraction under all operating conditions is basically the same. In the area with a height of 250~600 mm, the result distribution under different operating conditions can be divided into two types. Under the conditions of high gas velocity and small catalyst flowrate, the volume fraction of the catalyst decreases slowly with the increase of the height. However, under the conditions of low gas velocity and a large catalyst flow rate, the catalyst volume fraction has a small increase in this region.
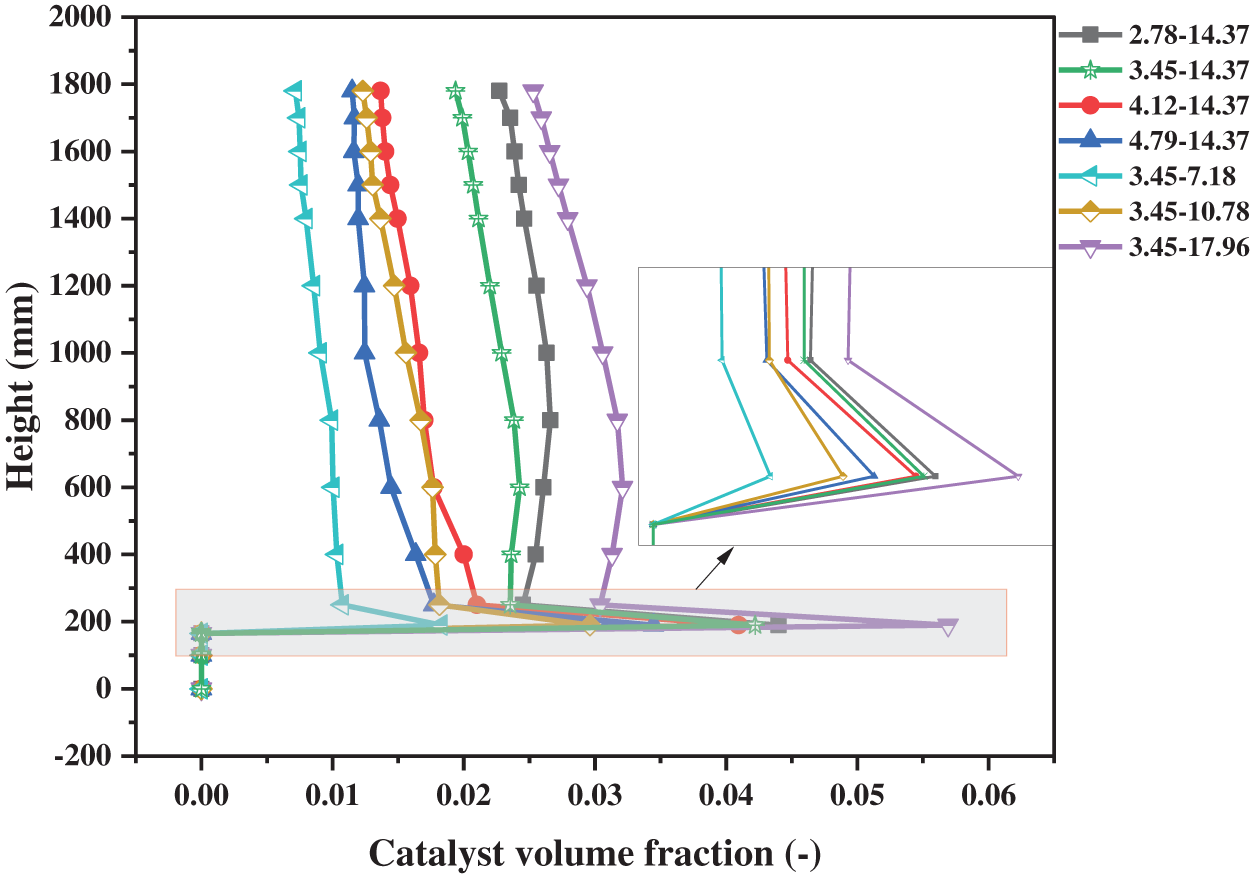
Figure 11: Distributions of catalyst volume fraction on sections with different working conditions
Under the quasi-stable state, the mean mass of the catalyst particles in the reactor and its variation range is shown in Fig. 12. The mass of the catalyst in the reactor directly determines the reaction rate, and the variation of the particle mass affects the operation stability of the reactor. As the inlet gas velocity increases, the mass of the catalyst gradually decreases. This is because high-velocity flowing gas can carry more catalysts away from the reactor. In addition, if the gas velocity is too large or too small, the variation range of the catalyst mass will increase. When the inlet gas velocity is too low, the back-mixing of catalyst particles is very serious, and the lower part of the reactor is blocked. When the inlet gas velocity is too high, the catalyst particles cannot smoothly pass through the upper corner of the reactor, and a slight blockage will also appear. The increase of the catalyst flowrate obviously increases the particle mass inside the reactor. However, the catalyst flowrate does not have prominent effects on the variation range of the catalyst particle mass.
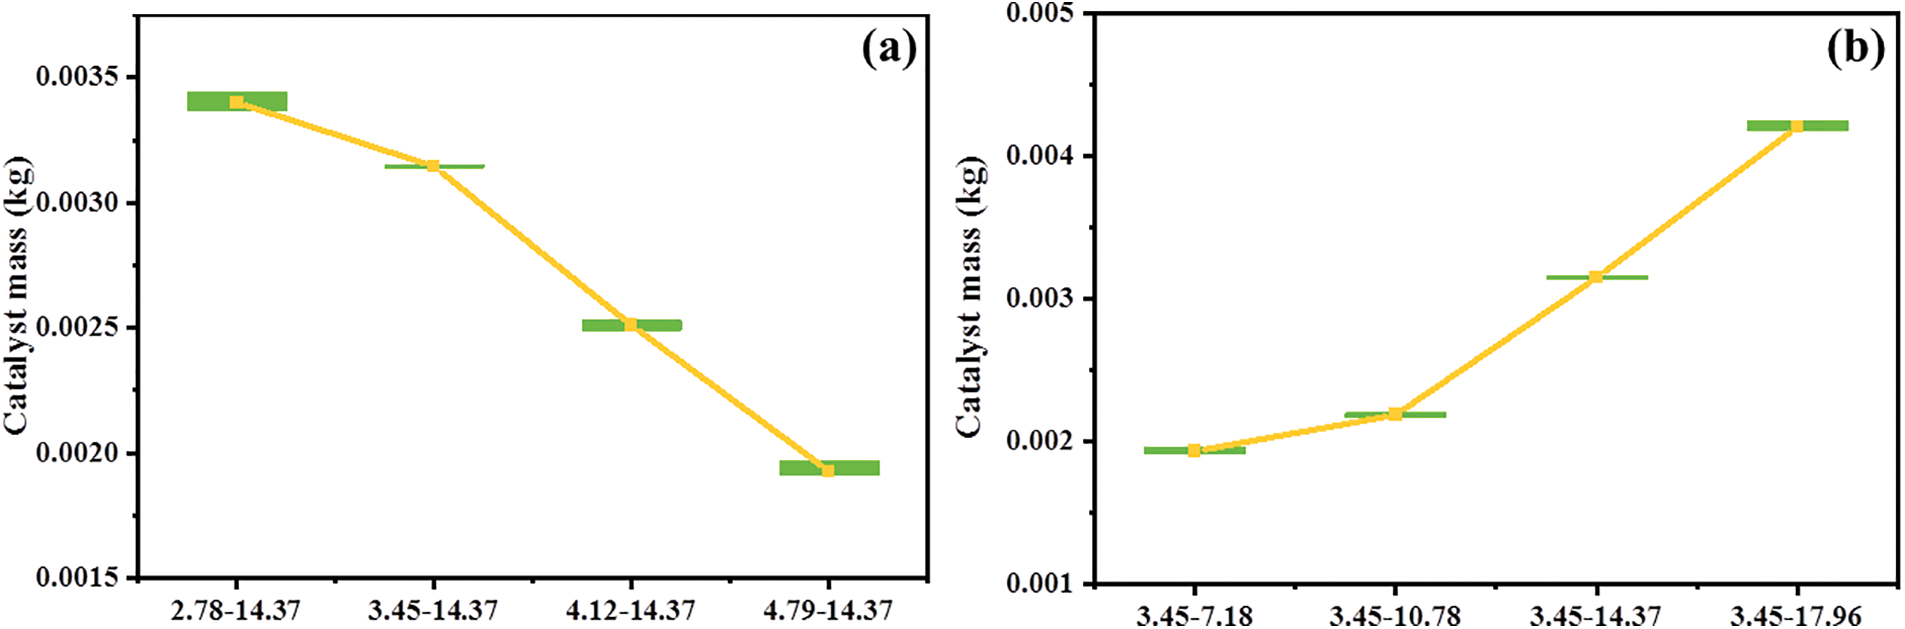
Figure 12: Catalyst mass in the reactor with different working conditions: (a) different inlet velocity; (b) different catalyst flowrate
3.3.2 Characteristics of Conversion Rate
In the simulation process of the methanation reaction, the inlet gases include CO, H2, and N2. When the gas mixture at the outlet was detected, H2O and CH4 were found in addition to the gas components at the inlet. This indicates that the methanation reaction has occurred. By monitoring the composition of the gas mixture, the CO conversion rate can be calculated using Eq. (32). And the degree of methanation reaction can be evaluated. Therefore, the mole fractions of each gas component at the reactor outlet and the corresponding calculated CO conversion are plotted as shown in Fig. 13.
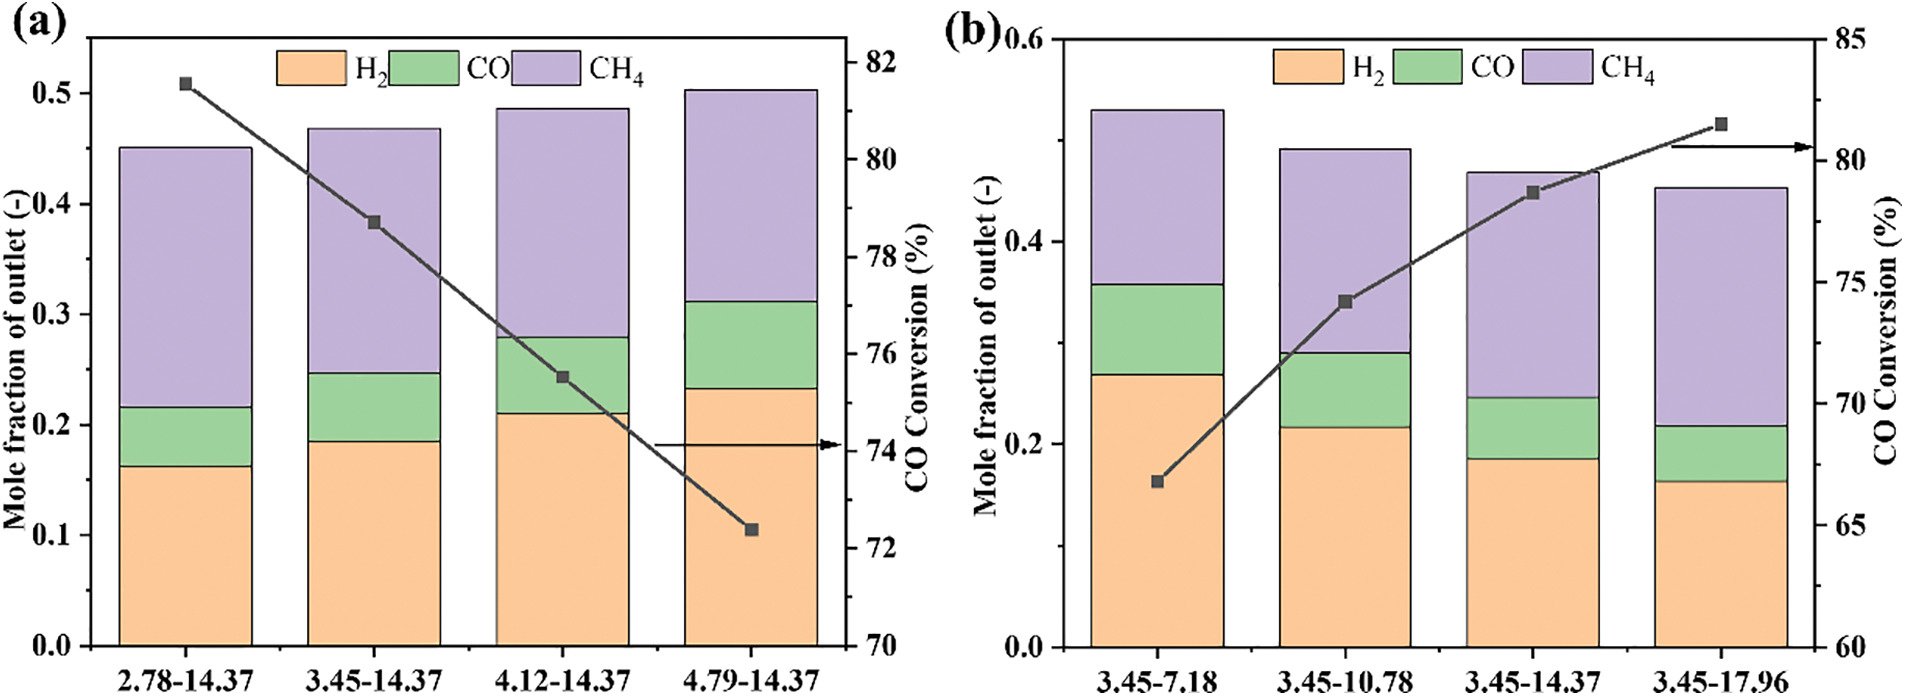
Figure 13: CO conversion and spices distribution with different working conditions: (a) different inlet velocity; (b) different catalyst flowrate
With the increase of inlet gas velocity, the conversion rate of CO decreases from 81.6% to 72.4%, basically showing a linear downward trend. This leads to the corresponding reduction of the product CH4 of the methanation reaction, during the reaction raw materials CO and H2 increase. The increase of catalyst flowrate leads to the increase of CO conversion rate from 66.8% to 81.5%. However, the increase rate decreases from 11.1% to 3.5% with the increase of the catalyst flowrate. In other words, too many catalyst particles cannot promote the increase of CO conversion but will lead to waste of catalyst. In comparison with Fig. 12, the mass of the catalyst has a direct and obvious relationship with the CO conversion. The increase of catalyst mass enhances the contact between the raw gas and the catalyst, resulting in a thorough CO reaction.
3.3.3 Characteristics of Temperature
The temperature affects not only the progress of the methanation reaction but also the activity of the catalyst. Therefore, the temperature rise from the inlet to the outlet of the reactor and the maximum temperature inside the reactor are recorded. The results are plotted in Fig. 14. The climbing of the inlet gas velocity increases the temperature, but the maximum temperature is smaller. From the change in the catalyst volume fraction, the conclusion is that the rise in the inlet velocity reduces the residence time of the catalyst in the reactor. This phenomenon makes the contact time between the raw gas and the catalyst insufficient, and thus the methanation reaction is limited. However, the increased inlet gas velocity is beneficial for the removal of the reaction heat. If the reaction heat is not removed in time, the catalyst will be inactivated and the reaction device will be damaged because of the high temperature. The increase of the inlet gas velocity accelerates the circulation of the catalyst and the gas and takes more reaction heat away from the device.
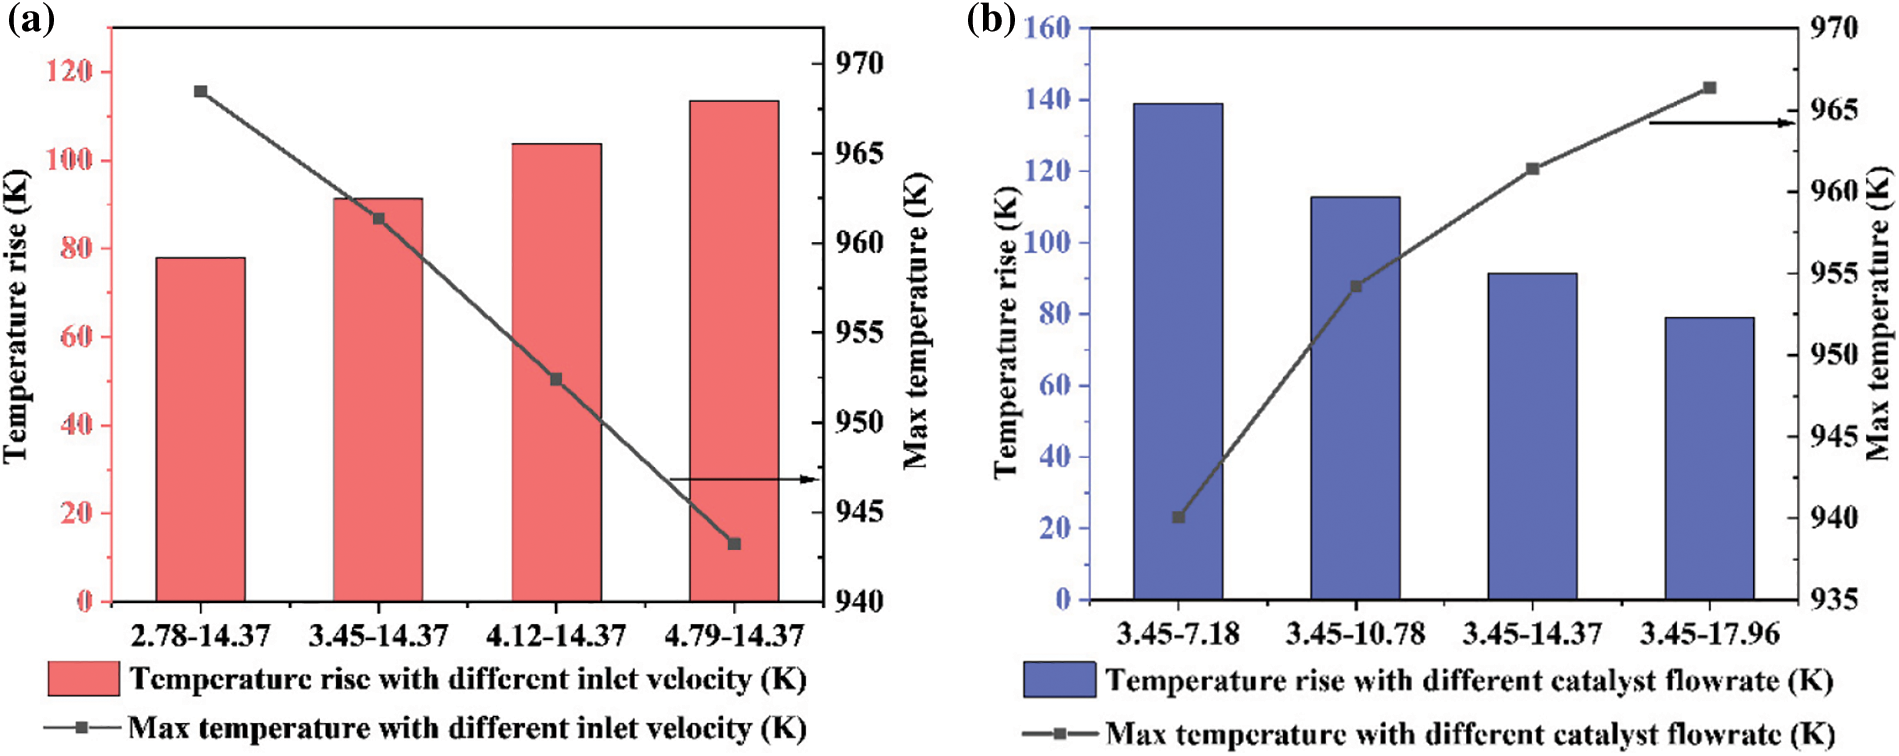
Figure 14: Temperature rise and max temperature in the reactor: (a) different inlet velocity; (b) different catalyst flowrate
Increasing the catalyst flowrate will obviously increase the catalyst mass inside the reactor, as shown in Figs. 11 and 12b. The increase of the catalyst leads to an increase in the reaction rate, and the maximum temperature inside the reactor increases accordingly. However, heat transfer is insufficient since too many catalyst particles cannot fully contact the gas. Most of the heat still stays in the reactor and cannot be effectively removed.
The fluidized bed methanation reactor can efficiently utilize pyrolysis and gasification syngas from OSW. A comprehensive model coupled with flow and heat transfer was established to explore the mechanism of mass transfer and heat transfer. The following conclusions can be drawn from the simulation results:
1) The pressure and catalyst volume fraction along the height show similar trends. At the bottom, the values of parameters fluctuate greatly. As the height increases, these fluctuations are gradually weakened and even eliminated. Under the quasi-steady state, the pressure fluctuation range decreases from 17.7 Pa at the section with a height of 0 mm to 4.5 Pa of 1780 mm.
2) The distribution of temperature is directly related to the catalyst volume fraction. Where the catalyst gathers, the reaction gives off a lot of heat, and the maximum temperature can reach 951 K. In the area where the catalyst is dispersed, the full mixing of gas and catalyst increases heat dissipation efficiency, and the maximum temperature on the cross-section decreases to 769 K.
3) The increase of inlet gas velocity not only reduces the residence time of the catalyst which makes the CO conversion rate decreases from 81.6% to 72.4% but also increases the instability of operation. However, when the inlet gas velocity is small, the mixing of the gas phase and the solid phase is inadequate. Insufficient heat exchange prevents the heat from being discharged from the reactor in time, and the maximum temperature in the reactor can reach 968.4 K.
4) The catalyst flowrate directly determines the catalyst mass remaining in the reactor. With the increase of catalyst flowrate, the CO conversion rate can be increased from 66.8% to 81.5%. However, when the flowrate is too large, the growth rate of CO conversion decreases to 3.5%. This shows that excessive catalyst flowrate is easy to brings about the waste of the catalyst.
Funding Statement: This work was supported by the National Key Research and Development Program of China [Grant Number 2019YFC1906802].
Conflicts of Interest: The authors declare that they have no conflicts of interest to report regarding the present study.
References
1. Selvakumar, P., Sivashanmugam, P. (2017). Optimization of lipase production from organic solid waste by anaerobic digestion and its application in biodiesel production. Fuel Processing Technology, 165, 1–8. [Google Scholar]
2. Ding, Y., Zhao, J., Liu, J., Zhou, J., Cheng, L. et al. (2021). A review of China’s municipal solid waste (MSW) and comparison with international regions: Management and technologies in treatment and resource utilization. Journal of Cleaner Production, 293, 126144. [Google Scholar]
3. Kaza, S., Yao, L., Bhada-Tata, P., Woerden, F. V. (2018). What a Waste 2.0: A global snapshot of solid waste management to 2050. World Bank Publications. [Google Scholar]
4. Fei, F., Wen, Z., Clercq, D. D. (2019). Spatio-temporal estimation of landfill gas energy potential: A case study in China. Renewable and Sustainable Energy Reviews, 103, 217–226. [Google Scholar]
5. Song, J., Sun, Y., Jin, L. (2017). PESTEL analysis of the development of the waste-to-energy incineration industry in China. Renewable and Sustainable Energy Reviews, 80, 276–289. [Google Scholar]
6. Wei, Y., Li, J., Shi, D., Liu, G., Zhao, Y. et al. (2017). Environmental challenges impeding the composting of biodegradable municipal solid waste: A critical review. Resources, Conservation and Recycling, 122, 51–65. [Google Scholar]
7. Motavaf, B., Dean, R. A., Nicolas, J., Savage, P. E. (2021). Hydrothermal carbonization of simulated food waste for recovery of fatty acids and nutrients. Bioresource Technology, 341, 125872. [Google Scholar] [PubMed]
8. Ma, D., Feng, Q., Chen, B., Cheng, X., Chen, K. et al. (2019). Insight into chlorine evolution during hydrothermal carbonization of medical waste model. Journal of Hazardous Materials, 380, 120847. [Google Scholar] [PubMed]
9. Meena, S. K., Sahu, R., Ayothiraman, R. (2021). Utilization of waste wheat straw fibers for improving the strength characteristics of clay. Journal of Natural Fibers, 18(10), 1404–1418. [Google Scholar]
10. Wu, C., Williams, P. T. (2010). Pyrolysis-gasification of post-consumer municipal solid plastic waste for hydrogen production. International Journal of Hydrogen Energy, 35(3), 949–957. [Google Scholar]
11. Ge, S., Chen, D., Yin, L., Hong, L., Zhou, H. et al. (2022). Municipal solid wastes pyro-gasification using high-temperature flue gas as heating resource and gasifying agent. Waste Management, 149, 114–123. [Google Scholar] [PubMed]
12. Im-orb, K., Wiyaratn, W., Arpornwichanop, A. (2018). Technical and economic assessment of the pyrolysis and gasification integrated process for biomass conversion. Energy, 153, 592–603. [Google Scholar]
13. Deng, N., Zhang, A., Zhang, Q., He, G., Cui, W. et al. (2017). Simulation analysis and ternary diagram of municipal solid waste pyrolysis and gasification based on the equilibrium model. Bioresource Technology, 235, 371–379. [Google Scholar] [PubMed]
14. Chun, Y., Kim, S., Yoshikawa, K. (2011). Pyrolysis gasification of dried sewage sludge in a combined screw and rotary kiln gasifier. Applied Energy, 88(4), 1105–1112. [Google Scholar]
15. Li, E., Hu, Q., Chen, H., Cai, J., Qiu, Y. et al. (2019). Modeling and process design of municipal solid waste pyrolysis and gasification with a fixed-bed chamber. IOP Conference Series: Earth and Environmental Science, 332(2), 022030. [Google Scholar]
16. Zhang, Q., Guo, X., Yao, X. (2020). Modeling, simulation, and systematic analysis of high-temperature adiabatic fixed-bed process of CO methanation with novel catalysts. Applied Energy, 279, 115822. [Google Scholar]
17. Hatta, A. H., Jalil, A. A., Hassan, N. S., Hamid, M. Y. S., Rahman, A. F. A. et al. (2022). A review on recent bimetallic catalyst development for synthetic natural gas production via CO methanation. International Journal of Hydrogen Energy, 47(72), 30981–31002. [Google Scholar]
18. Kosaka, F., Yamaguchi, T., Ando, Y., Mochizuki, T., Takagi, H. et al. (2020). Effect of Ni content on CO2 methanation performance with tubular-structured Ni-YSZ catalysts and optimization of catalytic activity for temperature management in the reactor. International Journal of Hydrogen Energy, 45(23), 12911–12920. [Google Scholar]
19. Jia, C., Dai, Y., Yang, Y., Chew, J. (2020). A fluidized-bed model for NiMgW-catalyzed CO2 methanation. Particuology, 49, 55–64. [Google Scholar]
20. Li, J., Zhou, L., Zhu, Q., Li, H. (2013). Enhanced methanation over aerogel NiCo/Al2O3 catalyst in a magnetic fluidized bed. Industrial & Engineering Chemistry Research, 52(20), 6647–6654. [Google Scholar]
21. Götz, M., Lefebvre, J., Mörs, F., Koch, A. M., Graf, F. et al. (2016). Renewable power-to-gas: A technological and economic review. Renewable Energy, 85, 1371–1390. [Google Scholar]
22. Moioli, E., Gallandat, N., Züttelab, A. (2019). Parametric sensitivity in the Sabatier reaction over Ru/Al2O3-theoretical determination of the minimal requirements for reactor activation. Reaction Chemistry & Engineering, 4, 100–111. [Google Scholar]
23. Ngo, S. I., Lim, Y., Lee, D., Go, K. S., Seo, M. W. (2020). Flow behaviors, reaction kinetics, and optimal design of fixed- and fluidized-beds for CO2 methanation. Fuel, 275, 117886. [Google Scholar]
24. Coppola, A., Massa, F., Salatino, P., Scala, F. (2019). Fluidized bed CaO hydration-dehydration cycles for application to sorption-enhanced methanation. Combustion Science and Technology, 191(9), 1724–1733. [Google Scholar]
25. Ratchahat, S., Sudoh, M., Suzuki, Y., Kawasaki, W., Watanabe, R. et al. (2018). Development of a powerful CO2 methanation process using a structured Ni/CeO2 catalyst. Journal of CO2 Utilization, 24, 210–219. [Google Scholar]
26. Li, J., Yang, B. (2019). Multi-scale CFD simulations of bubbling fluidized bed methanation process. Chemical Engineering Journal, 377, 119818. [Google Scholar]
27. Liu, J., Cui, D., Yao, C., Yu, J., Su, F. et al. (2016). Syngas methanation in fluidized bed for an advanced two-stage process of SNG production. Fuel Processing Technology, 141(1), 130–137. [Google Scholar]
28. Sun, L., Luo, K., Fan, J. (2021). 3D unsteady simulation of a scale-up methanation reactor with interconnected cooling unit. Energies, 14(21), 7095. [Google Scholar]
29. Ngo, S. I., Lim, Y., Lee, D., Seo, M. W. (2021). Flow behavior and heat transfer in bubbling fluidized-bed with immersed heat exchange tubes for CO2 methanation. Powder Technology, 380, 462–474. [Google Scholar]
30. Sun, L., Lin, J., Kong, D., Luo, K., Fan, J. (2022). Three-dimensional computation fluid dynamicss simulation of CO methanation reactor with immersed tubes. Energies, 15(1), 321. [Google Scholar]
31. Liu, J., Cui, D., Yu, J., Su, F., Xu, G. (2019). Syngas methanation over spray-granulated Ni/Al2O3 catalyst in a laboratory transport-bed reactor. Chemical & Engineering Technology, 42, 129–136. [Google Scholar]
32. Li, J., Agarwal, R. K., Zhou, L., Yang, B. (2019). Investigation of a bubbling fluidized bed methanation reactor by using CFD-DEM and approximate image processing method. Chemical Engineering Science, 207, 1107–1120. [Google Scholar]
33. Du, Y., Liang, J., Yang, S., Hu, J., Bao, G. et al. (2022). Numerical investigation of the Ni-based catalytic methanation process in a bubbling fluidized bed reactor. Energy, 257, 124708. [Google Scholar]
34. Sun, L., Luo, K., Fan, J. (2021). Three-dimensional simulation of the methanation process in a circulating fluidized-bed reactor. Industrial & Engineering Chemistry Research, 60, 16417–16429. [Google Scholar]
35. Liu, Y., Hinrichsen, O. (2014). CFD simulation of hydrodynamics and methanation reactions in a fluidized-bed reactor for the production of synthetic natural gas. Industrial & Engineering Chemistry Research, 53(22), 9348–9356. [Google Scholar]
36. Sun, L., Luo, K., Fan, J. (2018). Production of synthetic natural gas by CO methanation over Ni/Al2O3 catalyst in fluidized bed reactor. Catalysis Communications, 105, 37–42. [Google Scholar]
37. Sun, L., Luo, K., Fan, J. (2017). Numerical simulation of CO methanation for the production of synthetic natural gas in a fluidized bed reactor. Energy & Fuels, 31, 10267–10273. [Google Scholar]
38. Chein, R. Y., Yu, C., Wang, C. (2016). Numerical simulation on the effect of operating conditions and syngas compositions for synthetic natural gas production via methanation reaction. Fuel, 185(89), 394–409. [Google Scholar]
39. Benzarti, S., Mhiri, H., Bournot, P. (2022). Entrance effects on gas-solid hydrodynamics of turbulent fluidized beds filled with Geldart B particles. Powder Technology, 402, 117337. [Google Scholar]
40. Wang, X., Shao, Y., Jin, B. (2021). Spatiotemporal statistical characteristics of multiphase flow behaviors in fuel reactor for separated-gasification chemical looping combustion of solid fuel. Chemical Engineering Journal, 412, 128575. [Google Scholar]
41. Cai, M., Tian, Z., Liu, Z., Liu, B. (2022). A computational fluid dynamics model coupled with ethylene polymerization kinetics for fluidized bed polyethylene reactor. Powder Technology, 407, 117647. [Google Scholar]
42. Lun, C. K., Savage, S. B., Jeffrey, D. J., Chepurniy, N. (1984). Kinetic theories for granular flow: Inelastic particles in couette flow and slightly inelastic particles in a general flowfield. Journal of Fluid Mechanics, 140, 223–256. [Google Scholar]
43. Wen, Z., Zhu, L., Luo, Z. (2022). A quasi-three-phase approach for simulating gas-solid fluidized bed under different flow patterns. Powder Technology, 398, 117041. [Google Scholar]
44. Lim, J., McGregor, J., Sederman, A. J., Dennis, J. S. (2016). The role of the Boudouard and water-gas shift reactions in the methanation of CO or CO2 over Ni/γ-Al2O3 catalyst. Chemical Engineering Science, 152, 754–766. [Google Scholar]
45. Xu, J., Froment, G. F. (2010). Methane Steam reforming, methanation and water-gas shift: I. Intrinsic kinetics. AIChE Journal, 35(1), 88–96. [Google Scholar]
Cite This Article
 Copyright © 2023 The Author(s). Published by Tech Science Press.
This work is licensed under a Creative Commons Attribution 4.0 International License , which permits unrestricted use, distribution, and reproduction in any medium, provided the original work is properly cited.
 Downloads
 Citation Tools