
 Submit a Paper
 Propose a Special lssue
 Open Access
ARTICLE

Research and Application of Log Defect Detection and Visualization System Based on Dry Coupling Ultrasonic Method
1
College of Mechanical and Electronic Engineering, Nanjing Forestry University, Nanjing, 210037, China
2
College of Materials Science and Engineering, Nanjing Forestry University, Nanjing, 210037, China
3
College of Civil Engineering, Nanjing Forestry University, Nanjing, 210037, China
4
College of Information Science and Technology, Nanjing Forestry University, Nanjing, 210037, China
*
Corresponding Author: Zheng Wang. Email: wangzheng63258@163.com
Journal of Renewable Materials 2023, 11(11), 3917-3932. https://doi.org/10.32604/jrm.2023.028764
Received 06 January 2023; Accepted 11 May 2023; Issue published 31 October 2023
 View Full Text
 Download PDF
Abstract
In order to optimize the wood internal quality detection and evaluation system and improve the comprehensive utilization rate of wood, this paper invented a set of log internal defect detection and visualization system by using the ultrasonic dry coupling agent method. The detection and visualization analysis of internal log defects were realized through log specimen test. The main conclusions show that the accuracy, reliability and practicability of the system for detecting the internal defects of log specimens have been effectively verified. The system can make the edge of the detected image smooth by interpolation algorithm, and the edge detection algorithm can be used to detect and reflect the location of internal defects of logs accurately. The content mentioned above has good application value for meeting the requirement of increasing demand for wood resources and improving the automation level of wood nondestructive testing instruments.Keywords
As one of the earliest materials used by human beings, wood has many advantages, such as unique characteristics of low-carbon and energy-saving, environmental-friendly naturalness, beauty and texture comfort, large strength-to-density ratio, excellent thermal insulation and electrical insulation, easy processing and forming, good decorative and high cost-effective. It can be made into sawn timber, furniture, plywood, and other products and used as raw materials for papermaking and chemical fiber industries. It is widely applied in the field of architecture, furniture, interior decoration, the chemical industry, transportation, the military, musical instruments, and other industries [1–3]. Wood is the only biological material among the four major raw materials (wood, steel, cement, and plastic). It is a renewable resource, which can be obtained not only from natural forests but also from artificially cultivated forests. According to the world’s existing forest stock, at least 3 billion m3 will be increasing every year. With the application of modern forestry science and technology, scientific management, and rational cutting, the sustainable development and sustainable utilization of forest resources can be completely realized, and the forest resources can become inexhaustible resources and materials, which have incomparable advantages compared with petroleum, minerals, and other underground resources.
With the rapid development of modern industrial technology, non-destructive testing methods and technologies such as ultrasonic testing [4–7], vibration testing [8–11], X-ray testing [12,13], and infrared detection [14,15] have emerged in the wood processing field. Meanwhile, many researchers used probabilistic methods to study the mechanical properties of materials [16–19]. These methods have played an important role in upgrading the technology of detecting the defect of wood and accelerating the systematization and automation of detection [20]. In recent years, ultrasonic testing has been widely used globally to analyze wood quality through the characteristics like propagation speed of ultrasonic in the wood. However, the location and size of the internal defects of the wood are identified inaccurately, and the detection is ineffective. Liu et al. used the longitudinal wave ultrasonic method to detect the elastic modulus of wood and created a detection system based on DSP [21,22]. In 2018, Voessing proved that Air-coupled ultrasound (ACU) is used through transmission to detect delamination, rot, and cracks in wood without permanently altering the structure. Novel ferroelectric transducers with a high signal-to-noise ratio enable high-precision structure recognition [23]. In 2021, Zhang et al. proved that the non-contact transverse vibration method and UT are shown as an efficient non-destructive evaluation method for assessing the CLT structural state right after the manufacturing as a quality assurance method or after their service in the field as a diagnostic tool [24–26]. In order to satisfy the growing urgent demand for wood in the market, it is particularly significant to promote the research and development of high-level detection and evaluation systems for wood quality and improve the utilization rate of wood [27].
The B-scan imaging technology in ultrasonic testing is a technology using the ultrasonic flaw detection principle to extract the echo information perpendicular to the designated section of the acoustic beam and form a two-dimensional image. Its principle is simple, and it can obtain information from different sections. Although it is widely used, it has not been effectively used in wood defect detection. For example, using the ultrasonic B-scan method to carry out air-coupled ultrasonic detection research on the internal quality of wood can quickly and effectively detect the size, shape, and location of wood defects, such as wormholes and cracks in the wood [28], which can better strengthen the research and development of wood defects detection and visualization system based on the ultrasonic method. It is significant to improve the automation, intelligence, and information standards of wood testing equipment, save wood resources, improve the utilization rate and quality of wood, and promote the sustainable development of domestic wood processing enterprises practically. Therefore, this paper first invented a wood defects detection and visualization system based on the dry coupling ultrasonic method. Its main innovation points are as follows: first, rubber was used as the dry coupling agent, which solves the problem of serious attenuation of traditional detection ultrasonic signals in the propagation process. The digital driver M542C was used to control the motor to drive the built circular scanning platform to scan and test the cross-section of the log specimen. The scanning platform ran smoothly and reliably and made up for the shortcomings of traditional detection technology [29]. Secondly, the interpolation algorithm made the image edge of log internal defects smooth and clear and the edge detection algorithm was used to accurately locate the defects in logs. The ultrasonic B-scan technology was used to detect the internal defects of logs, the cross-section scanning images were obtained according to the received transmission wave amplitude, and the detection and visual analysis of the internal defects of logs were realized through the log specimen test. Finally, the data obtained by ultrasonic B-scan is used for imaging and image defect recognition, and the accuracy and reliability of log internal defect detection are verified by comparing the defect locations inside the tested logs [30]. This method is very suitable for detecting wood internal defects; At the same time, it has obvious advantages such as fast detection, accuracy, reliability, no pollution, and harm, and is suitable for operations in forest areas.
A section of log specimen of Larch (Larix gmelinii (Rupr.) Kuzen), the average diameter class is 250 mm, the height is 105 mm, the average density is 0.45 g/cm3, and the average moisture content is 26%, produced in Heilongjiang Province, China. Set point A on the radial section of the log specimen as the point with defects, and point B on the cross-section as the point without defects, as shown in Fig. 1.
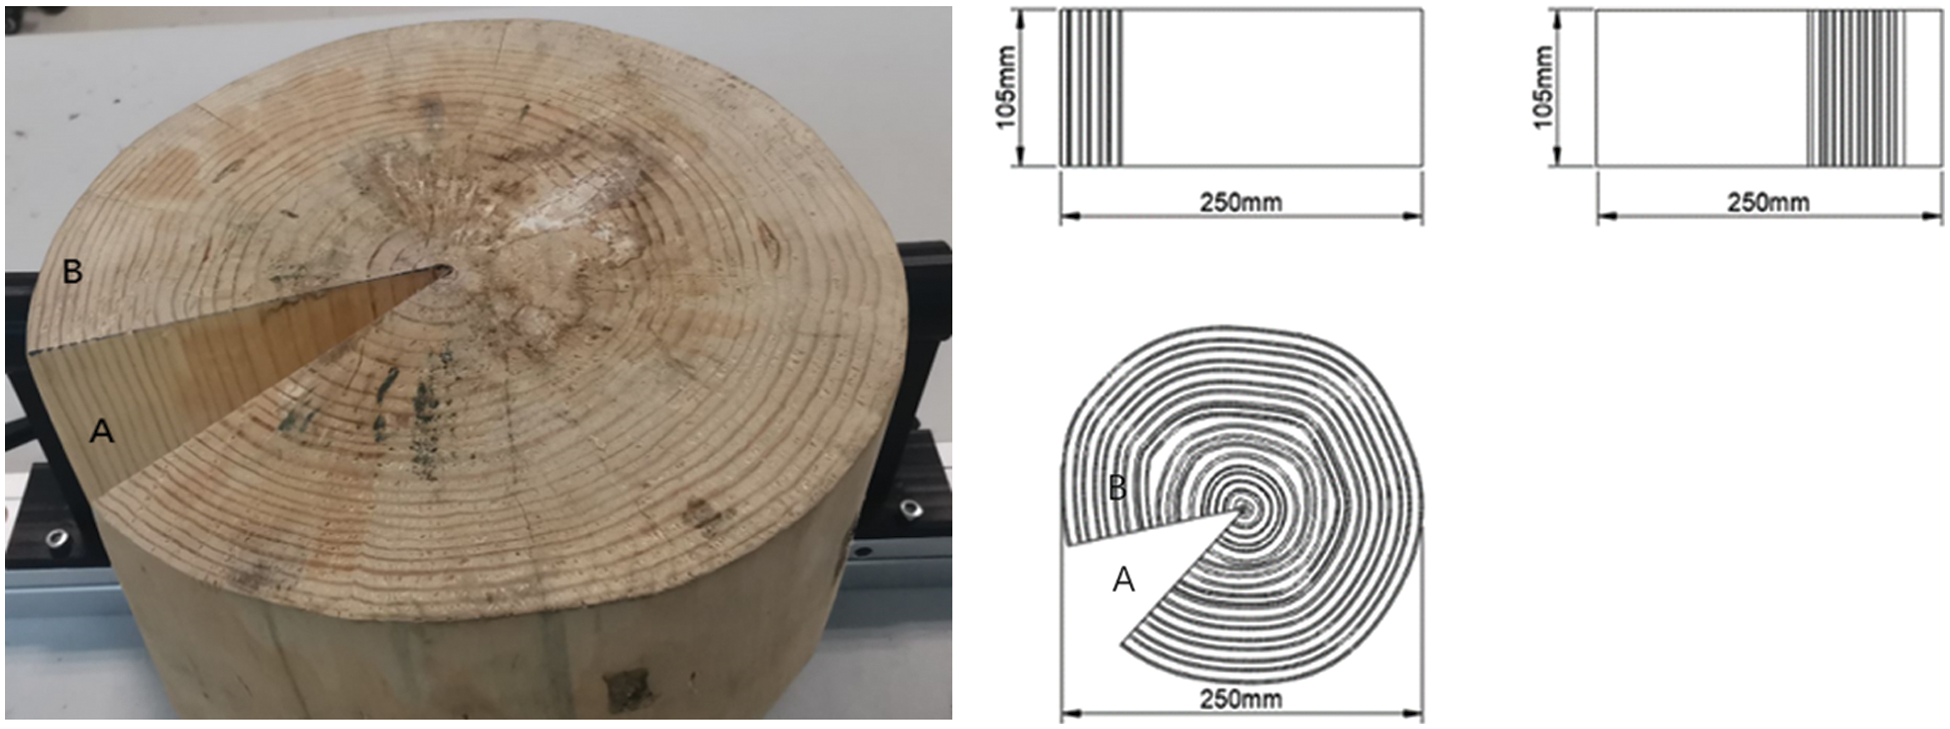
Figure 1: Larch log specimen
A set of wood defects detection and visualization system based on the dry coupling ultrasonic method developed in this paper is composed of hardware circuit, software program, and system client interface, mainly including cantilever scanning components, ultrasonic probe, stepper motor, core controller STM32, digital oscillograph, and PC. The hardware circuit design of the system includes the overall hardware framework design, which can complete the comparison and selection of the main chips of the module according to the energy consumption of the circuit. The system software program can realize the environment setting of each software, including the main control flow block design, motor drive, excitation signal output, receiver signal processing, and other program designs. The system client interface program design is the interface design of the client’s upper computer [31]. By connecting the upper computer with the lower computer, setting the baud rate, and checking the bit and other parameters, the corresponding function debugging and recording of transmission results can be realized. The main components and functions of the system are shown in Table 1.
In this paper, the ultrasonic B-scan pulse transmission method was used to identify the internal defects of logs by receiving the amplitude and location of internal signals of logs through the testing of log specimens [32]. Among them, the bilinear image interpolation algorithm and edge detection algorithm were used in the test system invented by the author, which can accurately determine the size and location of the internal defects of logs and improve the visualization effect of images, respectively.
3.1 Bilinear Image Interpolation Algorithm
Image interpolation algorithm is an important research content in image processing, machine vision, and other fields. The basic principle is to obtain high-resolution pixel values by interpolating the low-resolution pixel values in the image, which is a method of image data regeneration [33]. The nearest neighbor interpolation algorithm and bilinear interpolation algorithm can satisfy people’s basic requirements for image quality, which are widely used.
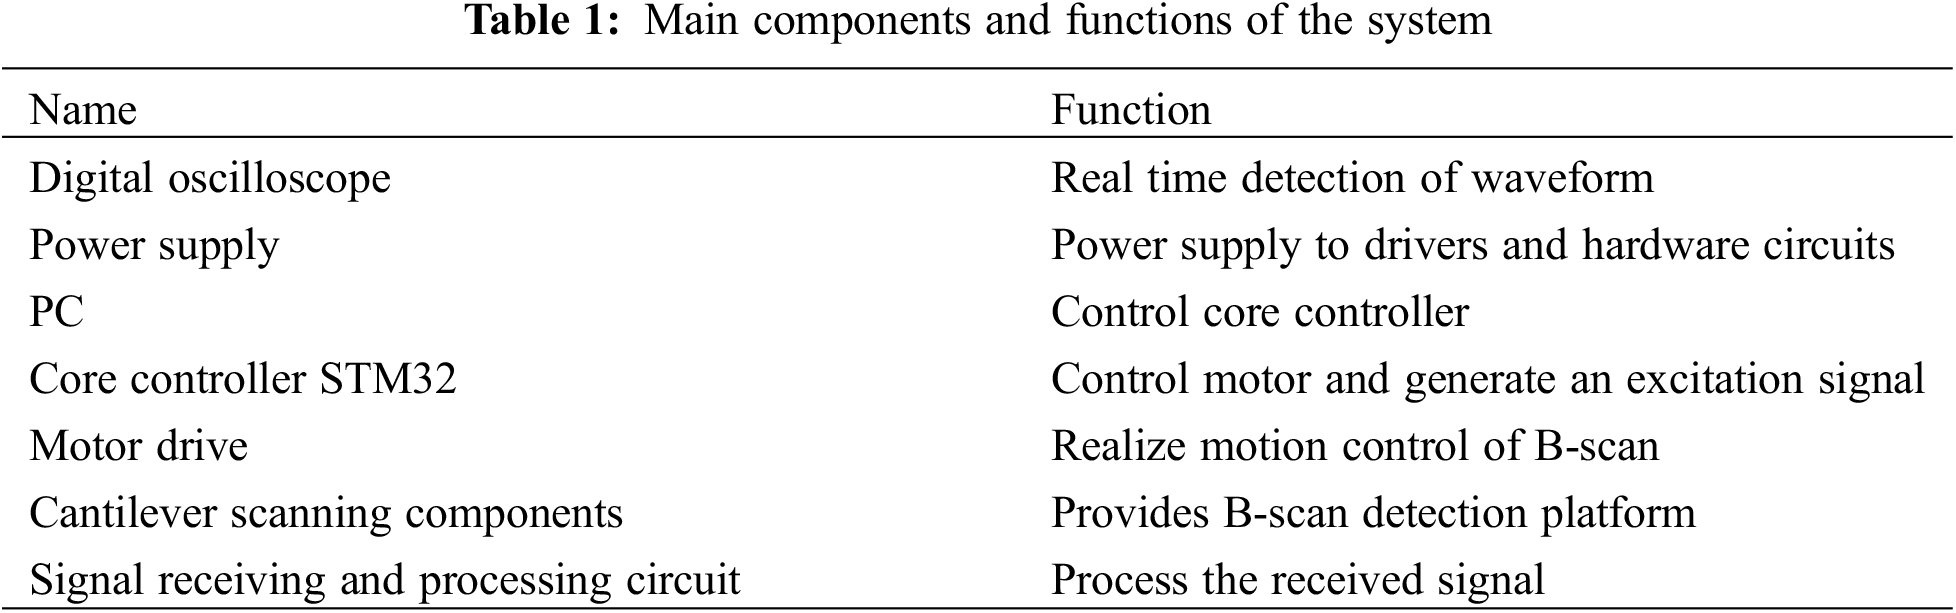
According to Franke. B experiment, a linear relationship between adjacent pixels in the same picture was proved. Bilinear interpolation is an improved algorithm for nearest neighbor interpolation, which considers both horizontal and vertical pixel changes. The interpolation kernel functions in the horizontal and vertical directions are approximated as piecewise functions symmetric about the Y axis. The function expression is shown in formula (1).
The function graph of the interpolation kernel function is shown in Fig. 2.
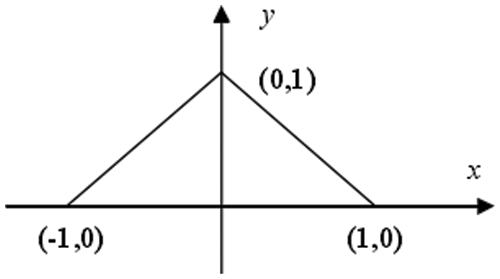
Figure 2: Kernel function graph of the bilinear interpolation algorithm
The basic principle of the bilinear interpolation algorithm is as follows in Fig. 2, (i, j), (i, j + l), (i + 1, j), and (i + 1, j + l) are four-neighborhood in the original image, and the four values are f(i, j), f(i, j + l), f(i + l ,j) and f(i + 1, j + 1). Now we need to solve for the value of the pixel at a point (i + s, j + t), which is in the middle of these four pixels. The schematic diagram of bilinear image interpolation is shown in Fig. 3. The values of the pixel points (i, j), (i, j + l) in the horizontal direction can be used to calculate the value of the pixel point (i, j + t). The values of the pixel points (i + 1, j), (i + l, j + l) can be used to calculate the value of the pixel point (i + 1, j + t). Finally, the values of the pixel points (i, j + t), (i + l, j + t) can be used to calculate the value of the pixel point (i + s, j + t) in the vertical direction [34].
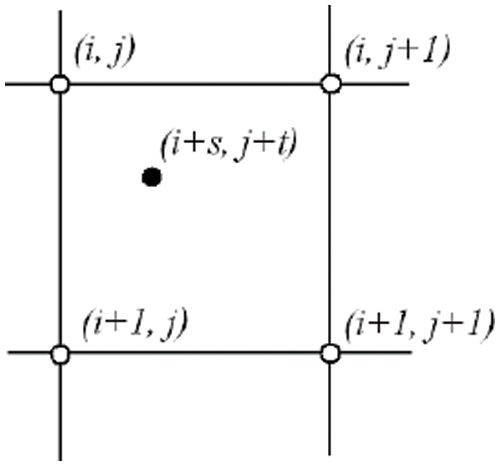
Figure 3: Schematic diagram of bilinear image interpolation
The value of pixel (i + s, j + t) is shown in formula (2).
Among them: k, l, m, and n are undetermined constants, and their four values can be obtained according to formula (3).
The value of the pixel to be interpolated (i + s, j + t) can be expressed in formula (4).
Obviously, the bilinear interpolation algorithm takes into account the influence of the pixel values of the adjacent four points on the interpolation as a whole and has a low-pass filtering effect, which can effectively improve the overall visual effect of the image. In programming, the functions of one-dimensional and two-dimensional spline interpolation algorithms are most commonly used. Among them, zero and nearest are 0-order interpolation algorithms and nearest-neighbor interpolation algorithms respectively, which are often applied to first-order interpolation algorithms. Quadratic is a second-order linear interpolation, and the second-order linear interpolation algorithm is used with a high frequency. However, great differences existed in the above interpolation methods. For example, in a function y = sin(x), the above interpolation functions are used to interpolate the sine function [35]. The result is shown in Fig. 4.
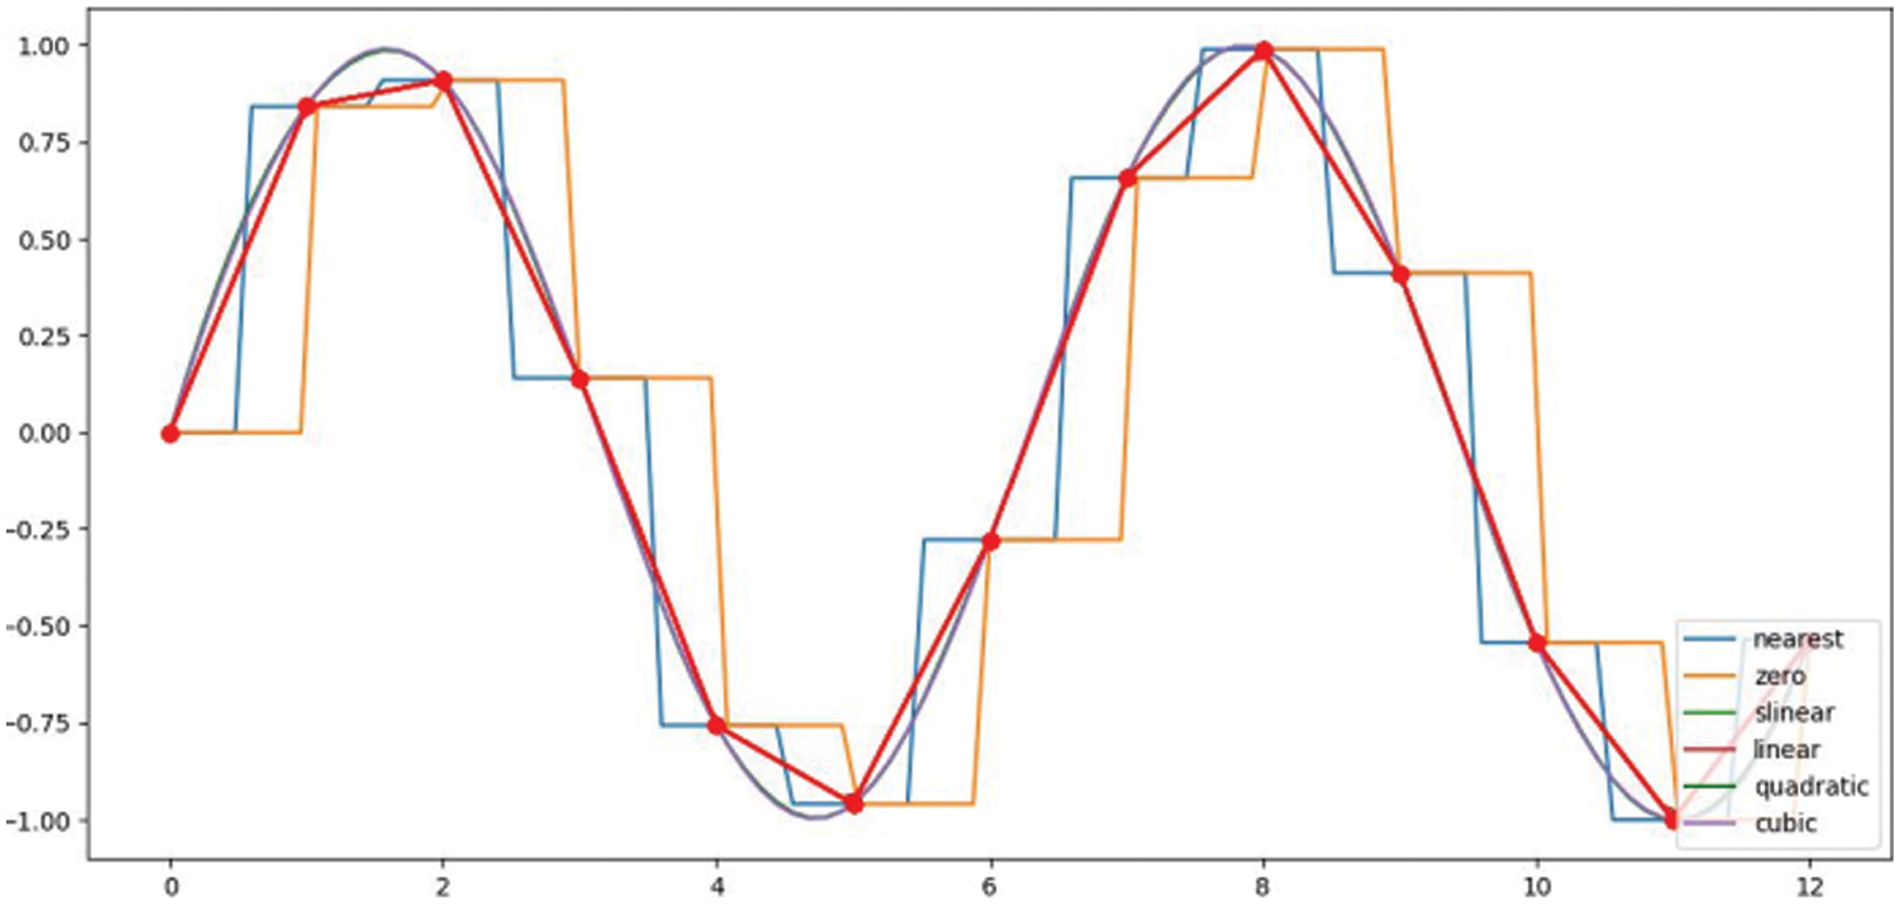
Figure 4: Comparison of different interpolation algorithms
The bilinear interpolation algorithm uses two straight lines parallel to the coordinate axis to decompose the decimal coordinate into four adjacent integer coordinate points, and the weight of the pixel value is inversely proportional to the distance. Obviously, this method can make the image smooth.
The edge detection algorithm of the image is generated by gray-scale mutation, which is a feature of the image and one of the important measures of target detection and recognition. The edge detection algorithm separates the boundaries of different regions in an image. The edge detection algorithm must meet the conditions of noise suppression and accurate edge location determination. Among them, the most used edge detection algorithms are the Sobel algorithm and the Canny algorithm.
The Sobel algorithm is a discrete differential operator used for edge detection. The Sobel operator combines Gaussian smoothing and differential derivation to calculate the approximate gradient value of the gray-scale image. The basic principle of the Sobel algorithm is as follows:
Supposing the applied image is I, and then performing the following operations: first, taking the derivative in the X and Y directions and convolving I with an odd number sized kernel Gx in the X direction. For example, when the kernel size is 3:
Then convolving I with an odd number sized kernel Gy in vertical variation, and the calculation result is:
The approximate gradient of each point in the image is:
Part of the code is shown in Fig. 5.
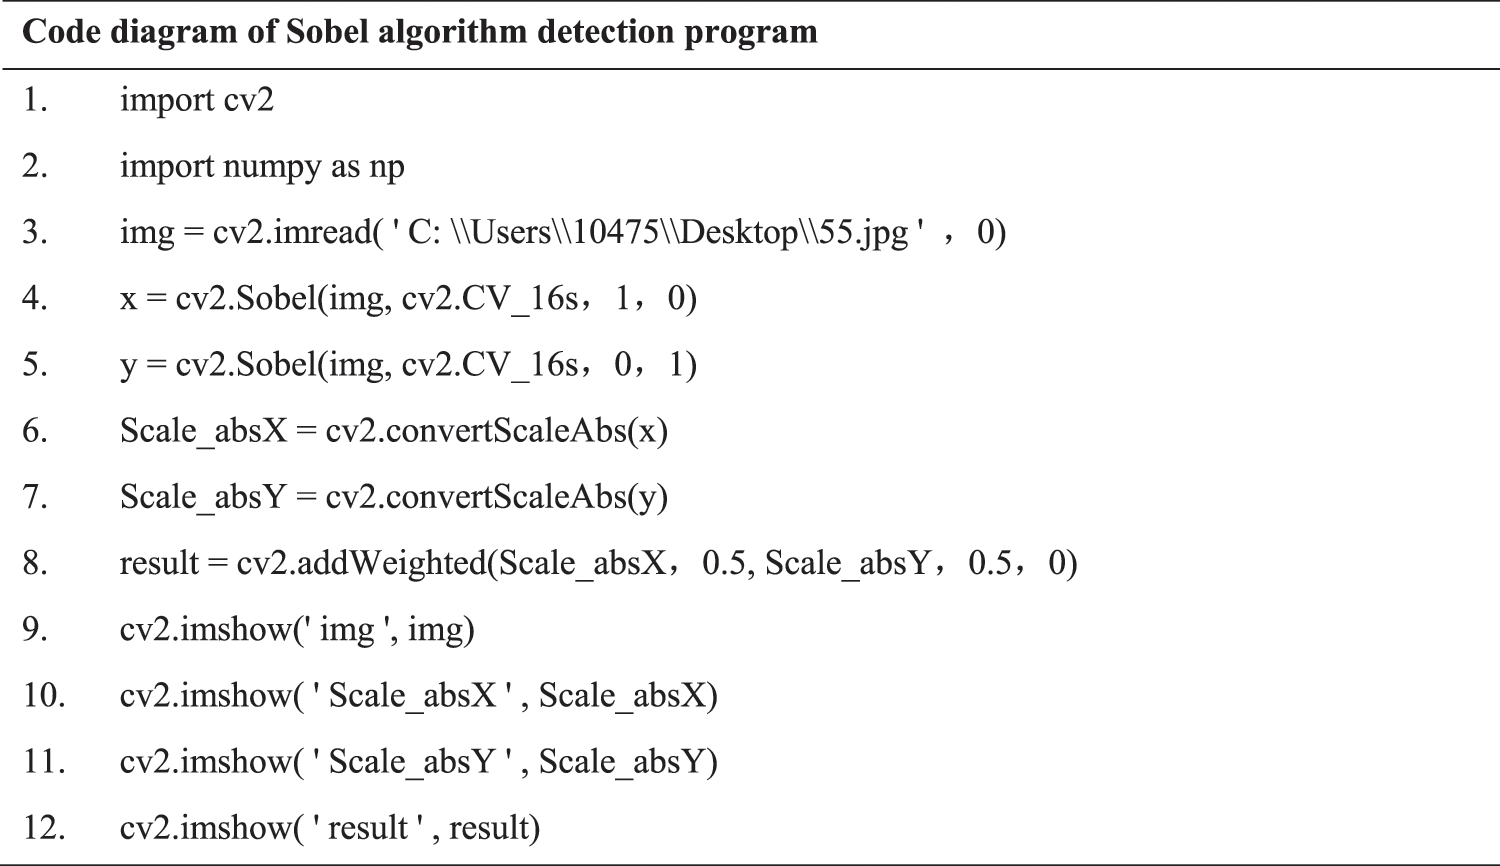
Figure 5: Code diagram of Sobel algorithm detection program
Part of the Canny algorithm code is shown in Fig. 6.
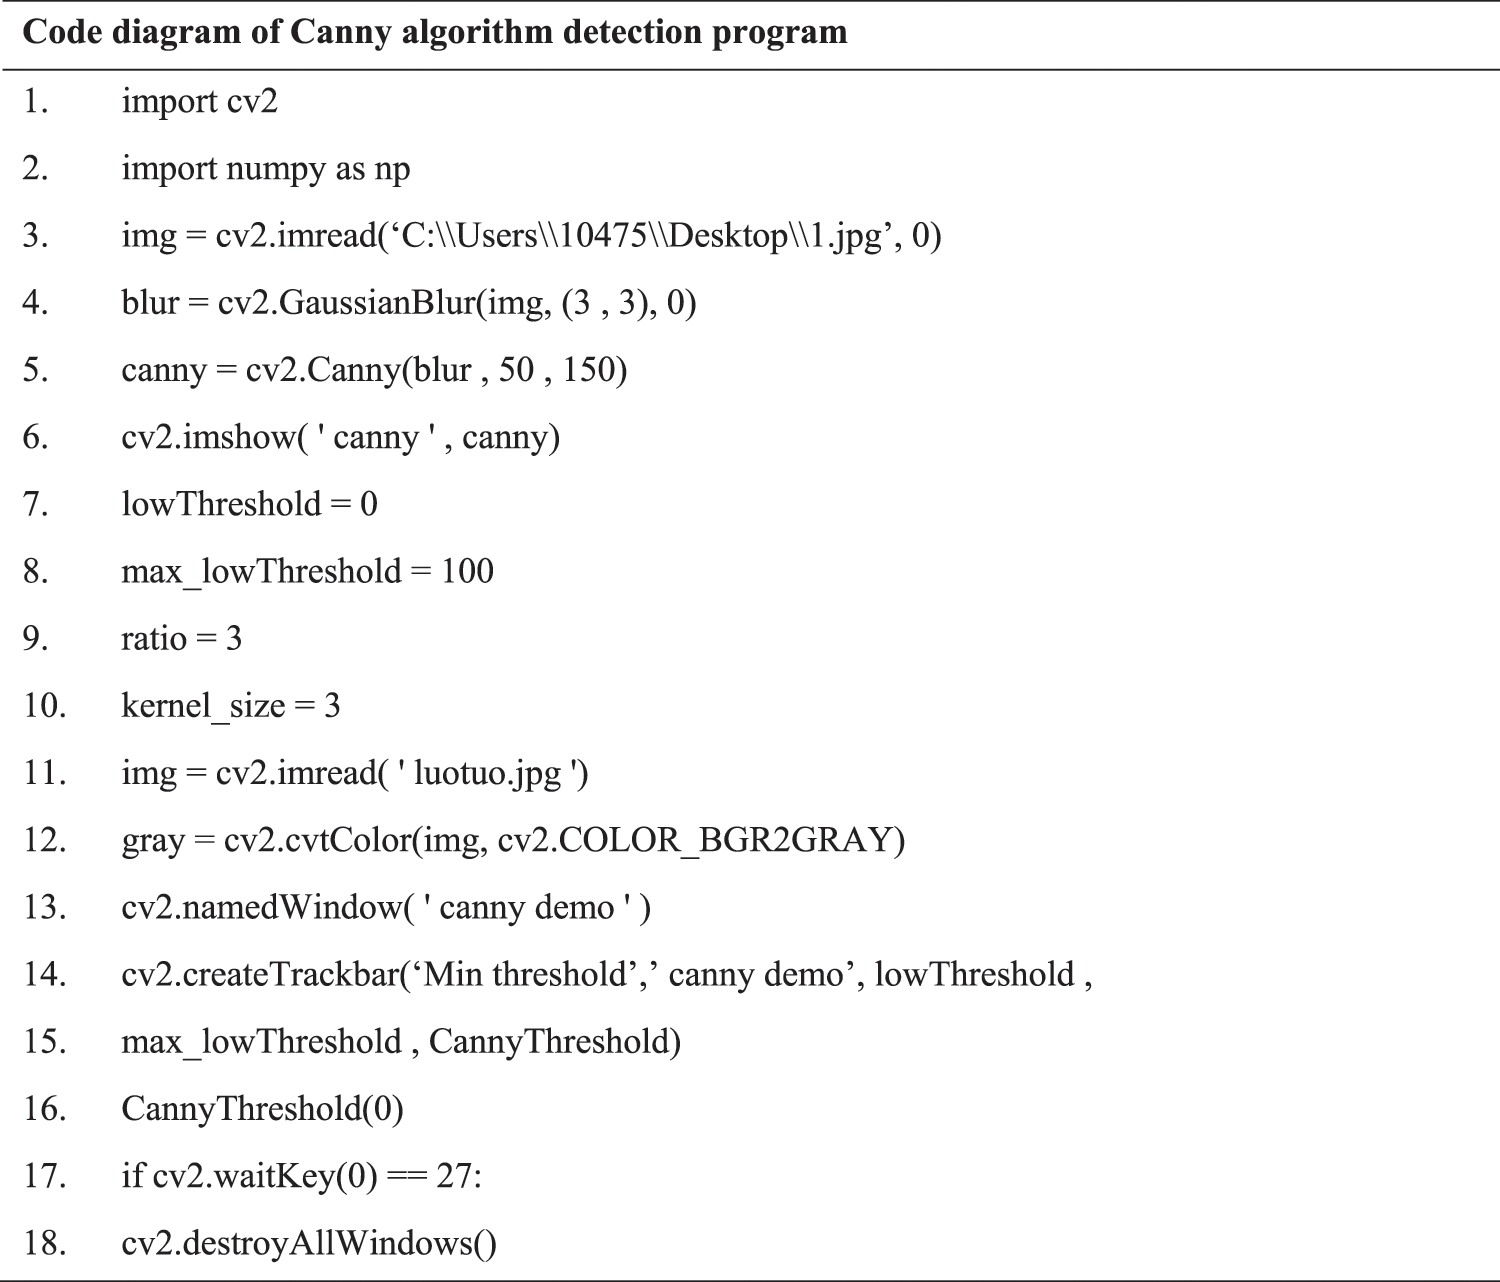
Figure 6: Code diagram of Canny algorithm detection program
The basic principle of the Canny algorithm is that the signal-to-noise ratio and localization product is used to calculate, and the optimal approximation operator will be obtained.
canny = cv2.Canny (image,threshold1,threshold2,edges,apertureSize,L2gradient). Among them, the image refers to a single channel gray-scale image, and the parameters threshold1 and threshold2 are threshold values, where threshold2 is greater than threshold1. Threshold2 is used to detect obvious contours. In actual detection, the edges are not consistent, and threshold1 is used to connect the irregular edges. Among the optional parameters, the aper-apertureSize parameter is the size of the convolution kernel. The first derivative of edge detection usually produces thicker edges in the image, while the second derivative has a stronger detection effect on isolated points and noise. The second derivative gray-scale edge produces a second-order response, which can determine whether the transition of the edge is from light to dark or from dark to light. Canny is an improved algorithm of Sobel. Compared with the Sobel algorithm, Canny has a lower error rate, better locating of edge points, and single-edge response.
Based on the advantages of the Canny algorithm, this topic used two algorithms to compare, binarized the defect image, and then found out the contour of the defect. Through experiments, it was found that the Canny algorithm has stronger applicability than Sobel.
3.3 Ultrasonic Detection Method
In this study, the ultrasonic B-scan pulse transmission method was used to identify the internal defects of logs by receiving the amplitude of the internal signals of the tested logs. As shown in Fig. 7, the test principle is that a piezoelectric transducer is installed at both ends of the tested wood, and the two ends are the transmitter and receiver, respectively. The transmitter transmits the high-frequency vibration wave generated by the piezoelectric patch to the wood to be detected. The acoustic wave will generate reflection, scattering, and attenuation in different media propagation, and the other end collects the received acoustic wave. Due to cracks, internal defects, and structural decay of wood, ultrasonic parameters (propagation time, propagation speed, energy peak, frequency) will be affected. According to the change of ultrasonic at the receiver, the internal structure and physical characteristics of wood can be detected. According to the amplitude and time of the received ultrasonic, the internal defects of the log can be analyzed, the amplitude is formed into a data array, and the data is converted into a color map for display, and then the defective part is identified by image processing technology and presented to the upper computer.
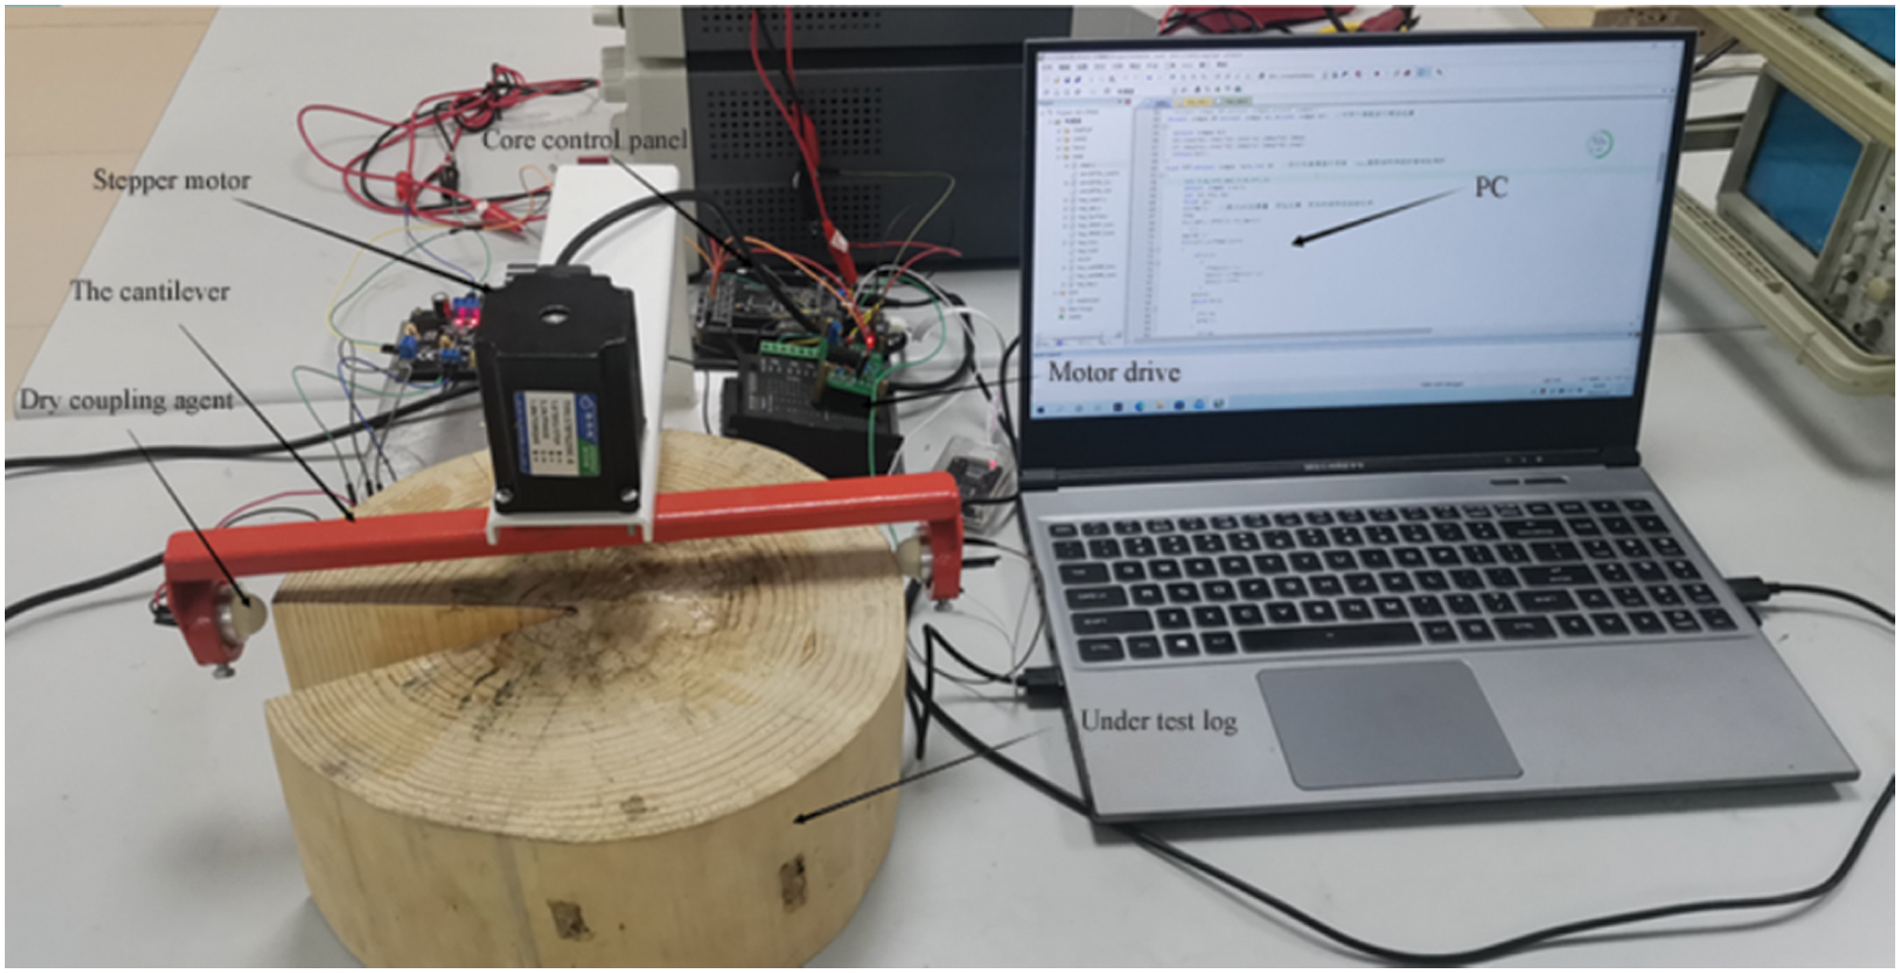
Figure 7: Log internal defect test site
The main steps are as follows: fixing the instrument and pressing the key to start the single-chip microcomputer. The motor will rotate along the log, and each time it rotates by a certain angle, the single-chip microcomputer will emit a 40 kHz signal to stimulate the ultrasonic probe to work. The ultrasonic signal will pass through the log, and the signal will be collected to the single-chip microcomputer for AD conversion. Then the converted data will be transmitted to the upper computer for ultrasonic imaging. Two algorithms are respectively used to interpolate the image, compare the imaging resolution, and process the defective image. The edge detection algorithm is used to distinguish the defective part from the non-defective part.
The core controller STM32 transmits a step signal to drive the stepper motor, which operates the ultrasonic probe on the cantilever to rotate. Whenever a step is rotated, STM32 will transmit a continuous 40 kHz sinusoidal signal as the excitation signal of the ultrasonic probe and collect the signal after penetrating the log. Due to the received signal being weak and a lot of interference signals being carried, the signal to noise ratio is usually very small, which will lead to the low reliability of the signal. The peak signal at the defect is shown in Fig. 8. Therefore, it is necessary to collect and preprocess the ultrasonic reception signal and send the signal processed by the circuit to the ADC module integrated into the main controller for A/D conversion.
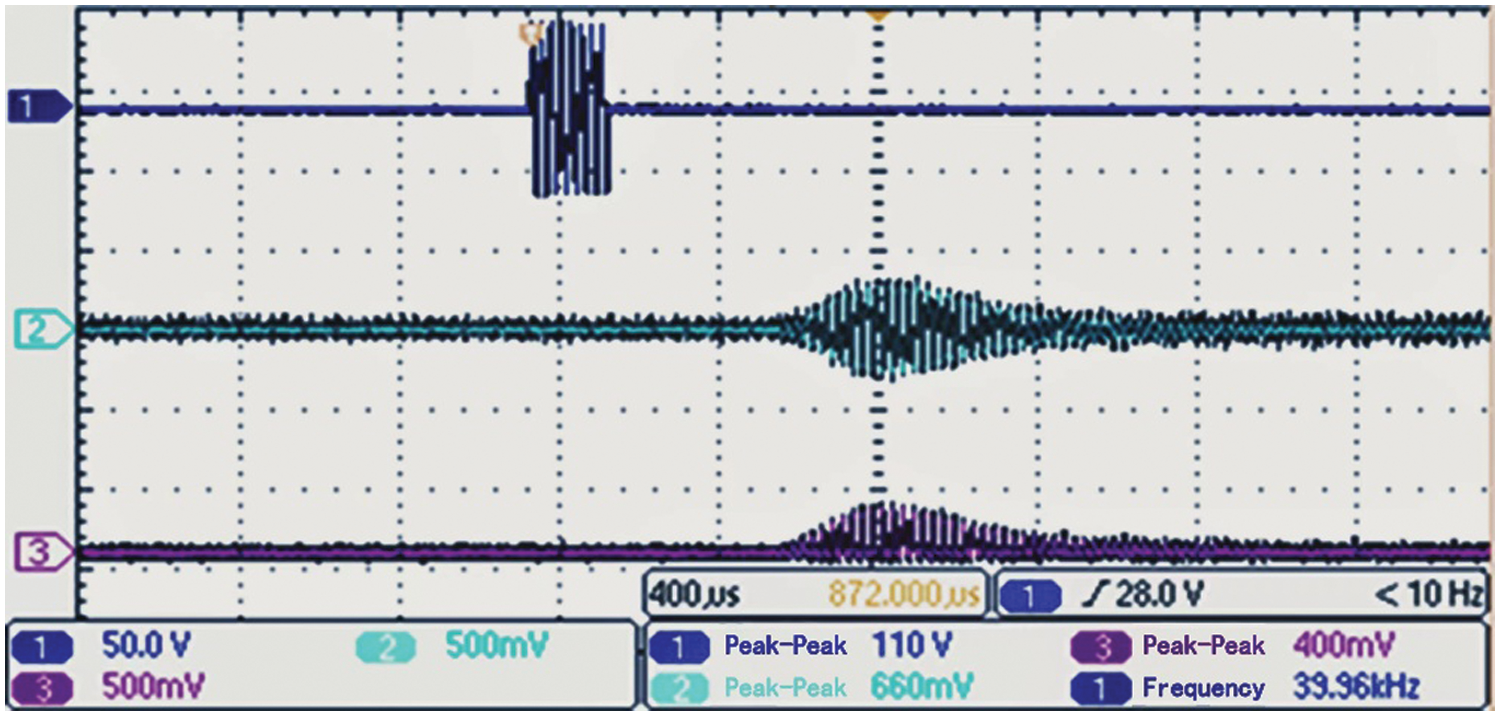
Figure 8: Peak signal at defect
The detected analog quantity is converted into digital quantity, and the peak value at point A is acquired by AD acquisition and then uploaded to the upper computer and imported into the imaging system to convert the analog quantity into a visual image.
The digital quantities transferred from B-scan to the upper computer are put into an array and imported into the imaging system. According to analysis, it was knowable that the array was rare. The value of the defect will be significantly different from that of the non-defect. Thus, the analog quantity could be converted into a visualized image, as shown in Fig. 9. Due to insufficient scanning accuracy and data loss in data transmission, and there are certain errors in imaging results. Therefore, the interpolation algorithm can be used to supplement the data and make the imaging smoother.
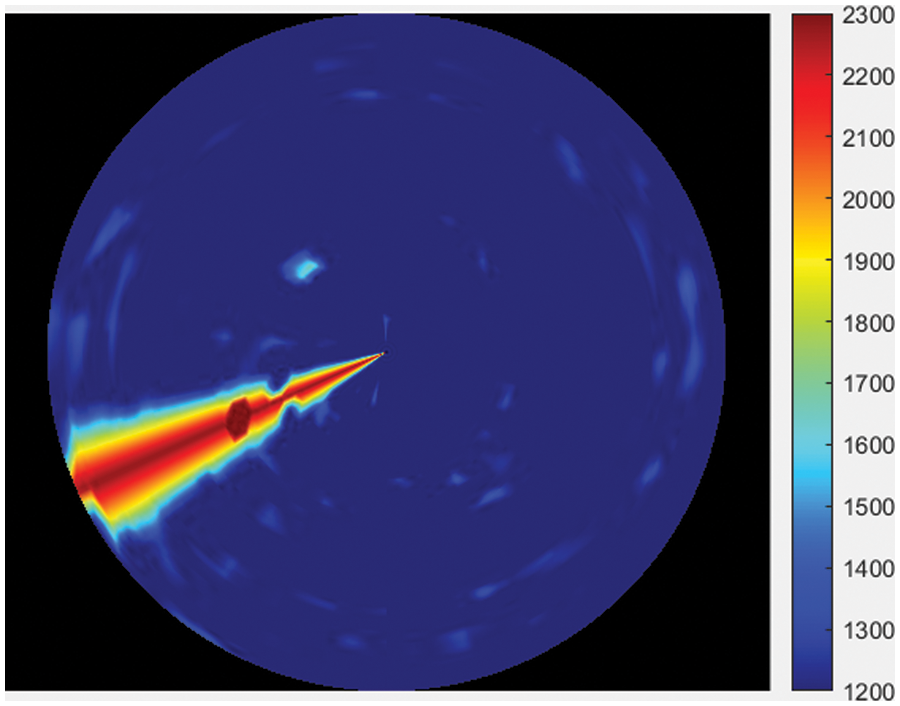
Figure 9: Crack image
As shown in Fig. 10, the defects location system can also be used to locate the defect placing at the log center. Fig. 11 shows the threshold segmentation map of the central defect.
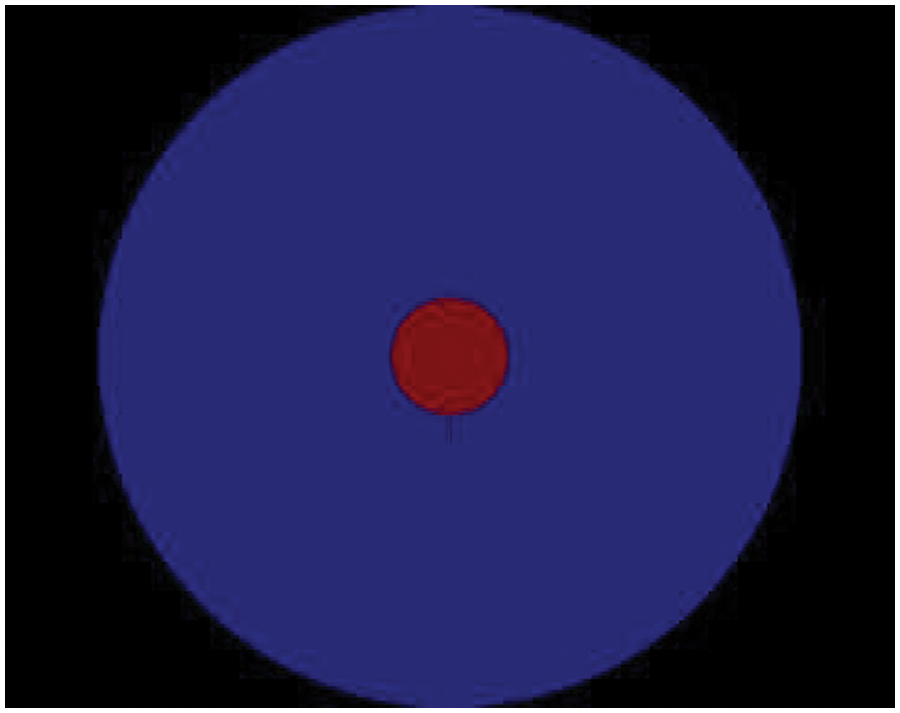
Figure 10: Original image of central defect
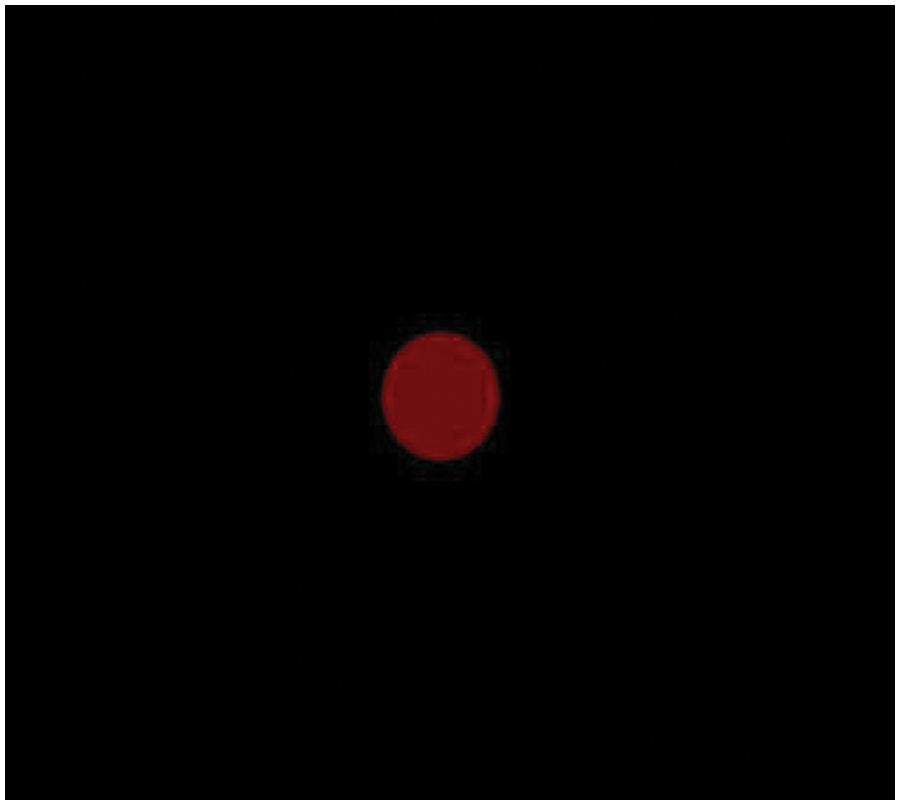
Figure 11: Central defect map
As shown in Figs. 12–14, first, the defective part in the center of the log can be cut; Then, the contour detection algorithm can be used to find the contour; Finally, the rectangular box is used to identify the contour and display it on the upper computer.
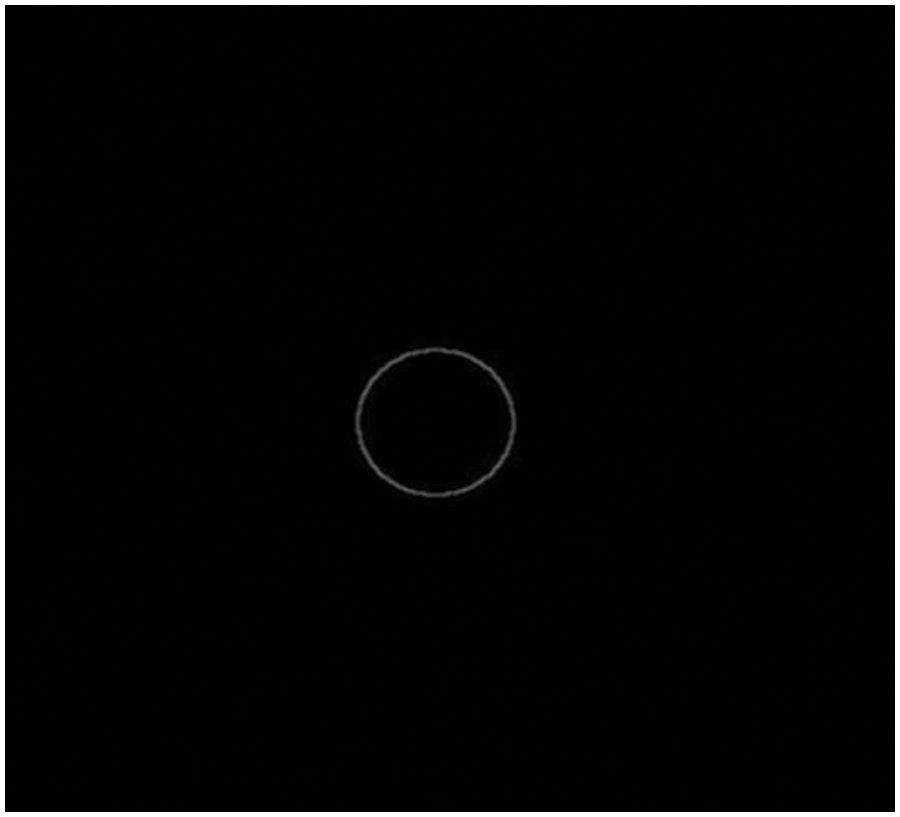
Figure 12: Sobel contour detection diagram
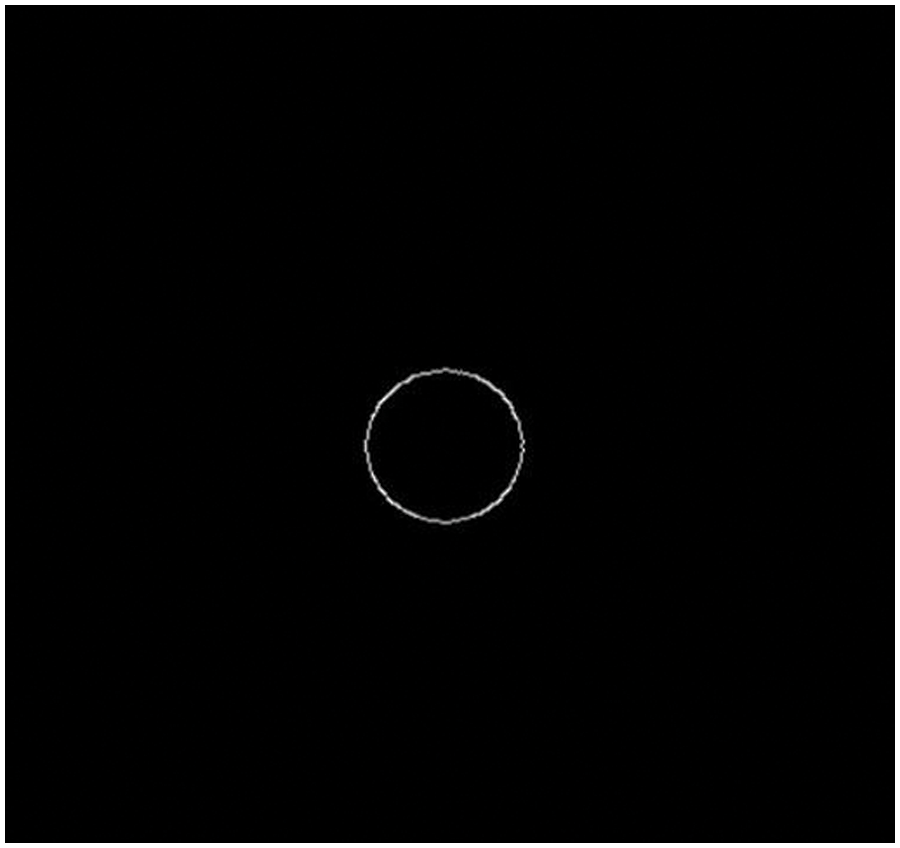
Figure 13: Canny contour detection diagram
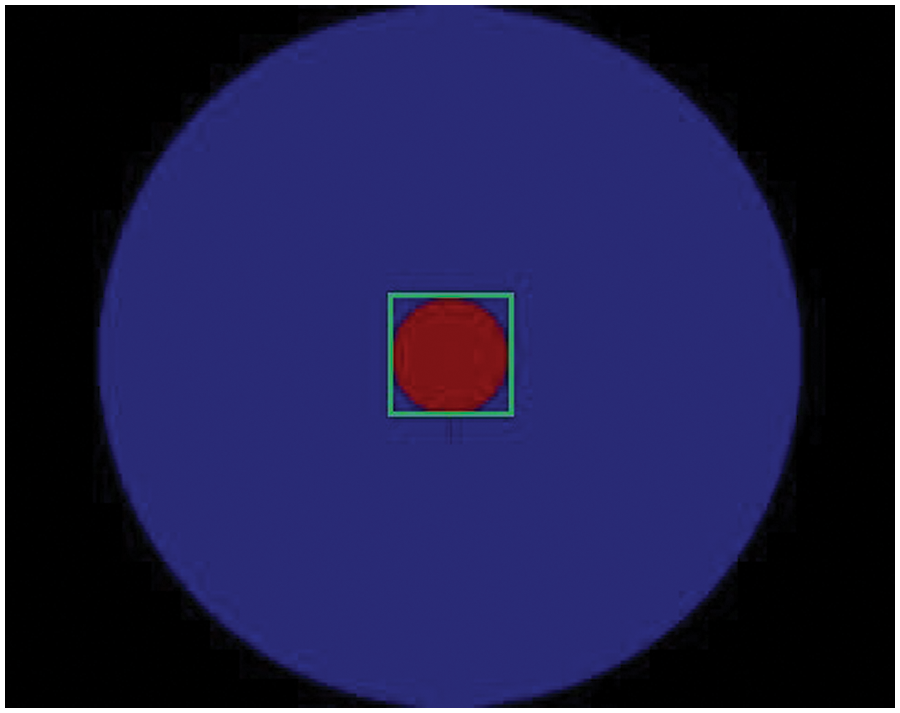
Figure 14: Defect identification diagram
The above test results show that the defect location system designed in this paper uses image processing technology to threshold segment the defect image of logs and find out the defective parts, then grays the defective parts, uses Sobel contour detection and Canny contour detection to locate the contour of defects and find out the contour of defects, and finally uses rectangular boxes to circle the defective parts and display them on the upper computer.
The imaging system can visualize the defects inside the log specimen through ultrasonic detection data. Due to the ultrasonic signal’s attenuation and the sampling frequency setting, the data will be lost, and the generated image will be blurred. In this paper, the nearest interpolation algorithm and the second-order linear interpolation algorithm were used to interpolate the original image (As shown in Figs. 15 and 16). By interpolating the defective and non-defective parts, the overall imaging effect of the image was better.
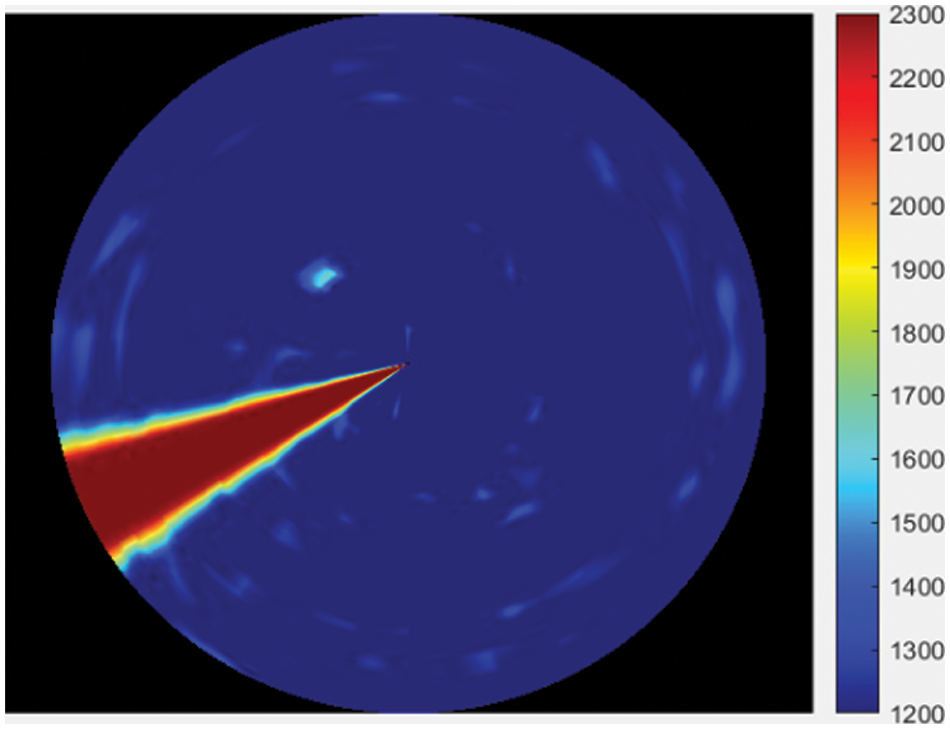
Figure 15: Interpolated image of the nearest neighbor of the crack
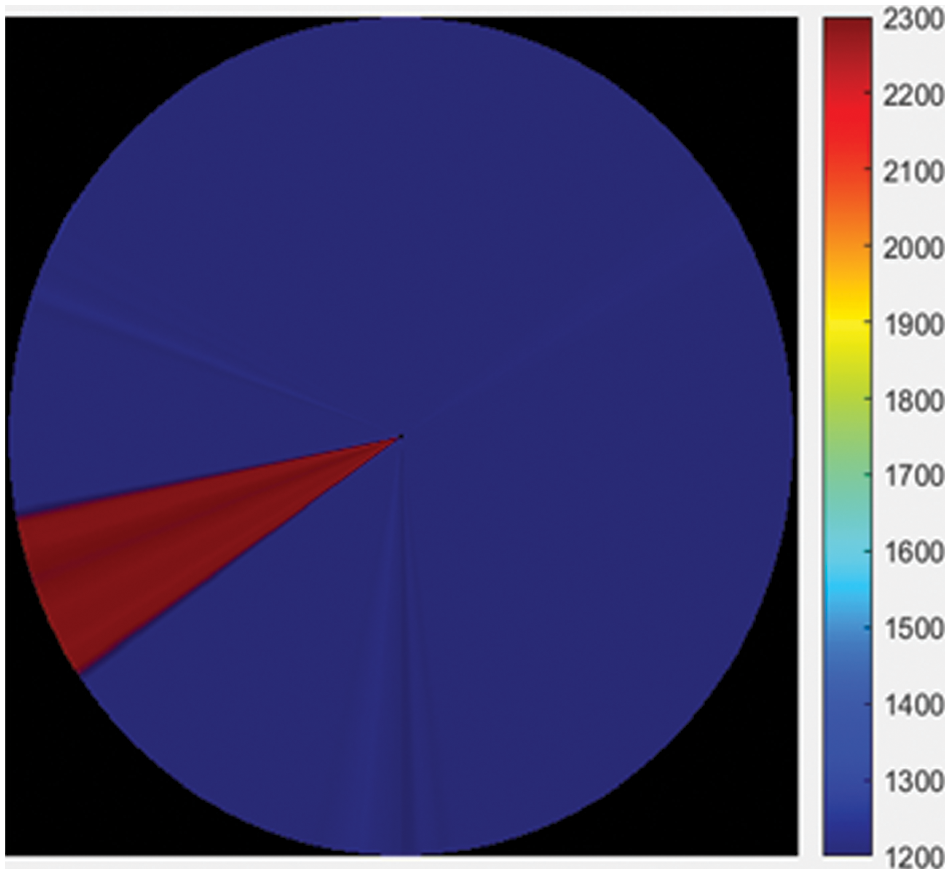
Figure 16: Interpolation image of the second-order linear of the crack
The test results need to analyze the error rate of the image, verify the reconstruction quality of the defective image (As shown in Fig. 17), and verify the correctness of the image. The relative error (Z) is calculated by formula (8).
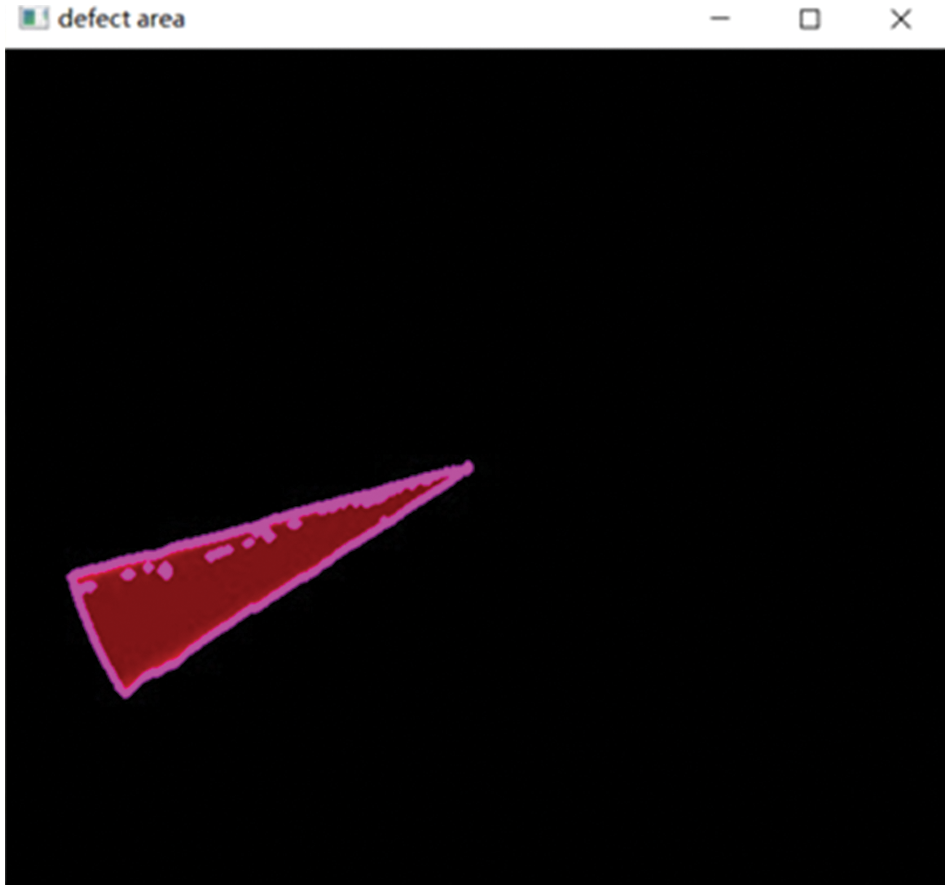
Figure 17: Defect calculation analysis diagram
In formula (8), S is the actual defect area of the log, and SF is the wood defect area detected by the test image.
Relative error of crack:
Obviously, the relative error of the crack defect of the log specimen is 4%, and the log defect’s area is close to the actual defect area of the wood as a whole. Therefore, after measurement, this instrument has certain practicality, and the accuracy is high.
On the one hand, the hardware system of the log defect detection and visualization system based on the dry coupling ultrasonic method developed in this study includes the construction of the circular scanning platform, the selection of the core controller, the ultrasonic excitation module, the signal processing module, and the motor motion module, etc. The software system mainly includes the design of the upper computer interface, the algorithm control of the motor, the output of the excitation signal, the ADC acquisition module, the serial communication, the ultrasonic imaging, the interpolation algorithm, and the image edge detection algorithm. Among them, the edge of the detected image can be made smooth by the interpolation algorithm. The edge detection algorithm can be used to accurately detect and reflect the location of internal defects in logs. On the other hand, the system’s correctness, reliability, and practicability are verified by the test of the internal defects of log specimens. To sum up, the system has good application value in meeting the increasing demand of the market for wood resources, improving the automation level of wood non-destructive testing instruments, and the comprehensive utilization rate of wood.
Funding Statement: The authors received no specific funding for this study.
Conflicts of Interest: The authors declare that they have no conflicts of interest to report regarding the present study.
References
1. Xu, Q. B., Wang, L. H., Wang, X. L., Yue, X. Q., Liu, Z. X. (2016). Effects of uneven distribution on the sensor within the ERT defect detection logs. Journal of Northeast Forestry University, 44(10), 73–78 (In Chinese). https://doi.org/10.13759/j.cnki.dlxb.2016.10.015 [Google Scholar] [CrossRef]
2. Liu, Y. Y., Li, A., Cao, J. X., Yu, D., Zhang, J. L. (2022). Mechanical properties of timber-concrete connections with steel tube connectors. Sustainable Structures, 2(2), 000017. https://doi.org/10.54113/j.sust.2022.000017 [Google Scholar] [CrossRef]
3. Zhou, Y. H., Huang, Y. J., Usama, S., Wang, Z. (2021). Research on dynamic characteristics test of wooden floor structure for gymnasium. Sustainable Structures, 1(1), 000005. https://doi.org/10.54113/j.sust.2021.000005 [Google Scholar] [CrossRef]
4. Fang, Y. M., Lin, L. J., Feng, H. L., Lu, Z. X., Emms, G. W. (2017). Review of the use of air-coupled ultrasonic technologies for non-destructive testing of wood and wood products. Computers and Electroonics in Agriculture, 137, 79–87. https://doi.org/10.1016/j.compag.2017.03.015 [Google Scholar] [CrossRef]
5. Mousavi, M., Gandomi, A. H. (2021). Wood hole-damage detection and classification via contact ultrasonic testing. Construction and Building Materials, 307(1), 124999. https://doi.org/10.1016/j.conbuildmat.2021.124999 [Google Scholar] [CrossRef]
6. Meng, X. M., Zhang, D. B., Feng, P., Hu, N. (2021). Review on mechanical behavior of solar cells for building integrated photovoltaics. Sustainable Structures, 1(2), 00009. https://doi.org/10.54113/j.sust.2021.000009 [Google Scholar] [CrossRef]
7. Felice, C. P., Di, C. A., Lamarucciola, N., Domenico, N. (2021). Experimental estimation of energy dissipated by multistorey post-tensioned timber framed buildings with anti-seismic dissipative devices. Sustainable Structures, 1(2), 00007. https://doi.org/10.54113/j.sust.2021.000007 [Google Scholar] [CrossRef]
8. Wang, Z., Xie, W. B., Wang, Z. H., Cao, Y. (2018). Strain method for synchronous dynamic measurement of elastic, shear modulus and Poisson’s ratio of wood and wood composites. Construction and Building Materials, 182, 608–619. https://doi.org/10.1016/j.conbuildmat.2018.06.139 [Google Scholar] [CrossRef]
9. Wang, Z. H., Gao, Z. Z., Wang, Y. L., Cao, Y., Wang, G. G. et al. (2015). A new dynamic testing method for elastic, shear modulus and Poisson’s ratio of concrete. Construction and Building Materials, 100, 129–135. https://doi.org/10.1016/j.conbuildmat.2015.09.060 [Google Scholar] [CrossRef]
10. Wang, Z., Xie, W. B., Lu, Y., Li, H. T., Wang, Z. H. et al. (2019). Dynamic and static testing methods for shear modulus of oriented strand board. Construction and Building Materials, 216(4), 542–551. https://doi.org/10.1016/j.conbuildmat.2019.05.004 [Google Scholar] [CrossRef]
11. Wang, Z. H., Wang, Y. L., Cao, Y., Wang, Z. (2016). Measurement of shear modulus of materials based on the torsional mode of cantilever plate. Construction and Building Materials, 124(1), 1059–1071. https://doi.org/10.1016/j.conbuildmat.2016.08.104 [Google Scholar] [CrossRef]
12. Massimi, L., Buchanan, I., Astolfo, A., Endrizzi, M., Olivo, A. (2020). Fast, non-iterative algorithm for quantitative integration of X-ray differential phase-contrast images. Optics Express, 28(26), 39677–39687. https://doi.org/10.1364/OE.405755 [Google Scholar] [PubMed] [CrossRef]
13. van den Bulcke, J., Boone, M. A., Dhaene, J., van Loo, D., van Hoorebeke, L. et al. (2020). Advanced X-ray CT scanning can boost tree ring research for earth system sciences. Annals of Botany, 124(5), 837–847. https://doi.org/10.1093/aob/mcz126 [Google Scholar] [PubMed] [CrossRef]
14. Lopez, G., Basterra, L. A., Ramon-Cueto, G., de Diego, A. (2014). Detection of singularities and subsurface defects in wood by infrared thermography. International Journal of Architectural Heritage, 8(4), 517–536. https://doi.org/10.1080/15583058.2012.702369 [Google Scholar] [CrossRef]
15. Chulkov, A. O., Pradere, C., Puiggali, J. R., Batsale, I. C., Vavilov, V. P. (2017). Estimating the humidity of wood by terahertz infrared thermography. Russian Journal of Non-Destructive Testing, 52(12), 753–757. https://doi.org/10.1134/S1061830916120044 [Google Scholar] [CrossRef]
16. Wang, Z. H., Roger, G. (2022). A functional global sensitivity measure and efficient reliability sensitivity analysis with respect to statistical parameters. Computer Methods in Applied Mechanics and Engineering, 402(1–3), 115175. https://doi.org/10.1016/j.cma.2022.115175 [Google Scholar] [CrossRef]
17. Wang, Z. H., Ghanem, R. (2021). An extended polynomial chaos expansion for PDF characterization and variation with aleatory and epistemic uncertainties. Computer Methods in Applied Mechanics and Engineering, 382(1–4), 113854. https://doi.org/10.1016/j.cma.2021.113854 [Google Scholar] [CrossRef]
18. Wang Z., Hawi P., Masri S., Aitharaju V., Ghanem R. (2023). Stochastic multiscale modeling for quantifying statistical and model errors with application to composite materials. Reliability Engineering & System Safety, 235(6), 109213. https://doi.org/10.1016/j.ress.2023.109213 [Google Scholar] [CrossRef]
19. Peng, Y. B., Wang, Z. H., Ai, X. Q. (2018). Wind-induced fragility assessment of urban trees with structural uncertainties. Wind & Structures, 26(1), 45–56. https://doi.org/10.12989/was.2018.26.1.045 [Google Scholar] [CrossRef]
20. Bandara, S., Rajeev, P., Gad, E., Sriskantharajah, B., Flatley, I. (2021). Health monitoring of timber poles using time-frequency analysis techniques and stress wave propagation. Journal of Civil Structural Health Monitoring, 11(1), 85–103. https://doi.org/10.1007/s13349-020-00440-1 [Google Scholar] [CrossRef]
21. Jurek, M. (2018). Non-contact excitation and focusing of guided waves in cfrp composite plate by air-coupled transducers for application in damage detection. Procedia Structural Integrity, 13, 2089–2094. https://doi.org/10.1016/jprostr.2018.12.203 [Google Scholar] [CrossRef]
22. Aydin, T. Y., Kucukkose, A. (2020). Ultrasonic testing and evaluation of moisture-dependent elastic properties of fir wood. Materials Testing, 63(10), 1059–1064. https://doi.org/10.3139/120.111585 [Google Scholar] [CrossRef]
23. Voessing, K. J. (2018). Air-coupled ferroelectret ultrasonic transducers for non-destructive testing of wood-based materials. Wood Science and Technology, 52(6), 1527–1538. https://doi.org/10.1007/s00226-018-1052-8 [Google Scholar] [CrossRef]
24. Zhang, L., Tiemann, A., Zhang, T. H. (2021). Non-destructive assessment of cross-laminated timber using non-contact transverse vibration and ultrasonic testing. European Journal of Wood and Wood Products, 79(2), 335–347. https://doi.org/10.1007/s00107-020-01644-4 [Google Scholar] [CrossRef]
25. Zhang, D. Y., Shen, L. M., Zhu, X. D., Zhang, S. J., Gong, M. (2021). The influence of the opening size on the shear performance of the cross-laminated timber (CLT) walls. BioResources, 16(4), 7070–7084. https://doi.org/10.15376/biores.16.4.7071-7085 [Google Scholar] [CrossRef]
26. Vilela, R., Mascia, N. T. (2021). Evaluation of the mechanical properties of pinus taeda wood from cross laminated timber plates avaliação de propriedades mecânicas da madeira de pinustaeda provenientes de placas de cross laminated timber. Ambiente Construído, 21(4), 89–110. https://doi.org/10.1590/s1678-86212021000400560 [Google Scholar] [CrossRef]
27. Ahmad, J. (2019). Barker-coded thermal wave imaging for non-destructive testing and evaluation of steel material. IEEE Sensors Journal, 19(2), 735–742. https://doi.org/10.1109/JSEN.2018.2877726 [Google Scholar] [CrossRef]
28. Myndyuk, V. D., Chaban, N. I., Rybitskyi, I. V., Karpash, O. M. (2020). Relationship between the parameters of acoustic structural noise and the mechanical properties of structural steels. Materials Science, 56(3), 333–339. https://doi.org/10.1007/s11003-020-00434-w [Google Scholar] [CrossRef]
29. Kang, T., Han, S., Moon, S., Han, S., Jeon, J. Y. et al. (2021). Measurement of defects in a plate using dry-coupled interdigital transducer-based scanning laser doppler vibrometer. Structural Health Monitoring, 20(2), 596–603. https://doi.org/10.1177/1475921720960240 [Google Scholar] [CrossRef]
30. Huang, Q. H., Deng, Q. F., Li, L., Yang, J. L., Li, X. L. (2019). Scoliotic imaging with a novel double-sweep 2.5-dimensional extended field-of-view ultrasound. IEEE Transactions on Ultrasonics, Ferroelectrics, and Frequency Control, 66(8), 1304–1315. https://doi.org/10.1109/TUFFC.2019.2920422 [Google Scholar] [PubMed] [CrossRef]
31. Zou, C., Sun, Z. G., Cai, D., Zhang, W. Z., Chen, Q. (2018). Crack detection using serrated columnar phased array transducers. Insight, 60(4), 212–218. https://doi.org/10.1784/insi.2018.60.4.212 [Google Scholar] [CrossRef]
32. Sharma, G. K., Bhagi, S., Thirunavukkarasu, S., Rao, B. P. (2017). Wavelet transform-based approach for processing ultrasonic B-scan images. Insight, 59(2), 93–99. https://doi.org/10.1784/insi.2017.59.2.93 [Google Scholar] [CrossRef]
33. Wu, Q., Zeng, H. F., Zhang, J., Xia, H. J. (2023). Multi-image hybrid super-resolution reconstruction via interpolation and multi-scale residual networks. Measurement Science and Technology, 34(7), 075403. https://doi.org/10.1088/1361-6501/accbdd [Google Scholar] [CrossRef]
34. Huang, H. H., Ge, P. (2020). Depth extraction in computational integral imaging based on bilinear interpolation. Optica Applicata, 50(4), 497–509. https://doi.org/10.37190/oa200401 [Google Scholar] [CrossRef]
35. Wei, X. Y., Wu, Y. R., Dong, F. M., Zhang, J., Sun, S. F. (2019). Developing an image manipulation detection algorithm based on edge detection and faster R-CNN. Symmetry, 11(10), 1223. https://doi.org/10.3390/sym11101223 [Google Scholar] [CrossRef]
Cite This Article
 Copyright © 2023 The Author(s). Published by Tech Science Press.
This work is licensed under a Creative Commons Attribution 4.0 International License , which permits unrestricted use, distribution, and reproduction in any medium, provided the original work is properly cited.
 Downloads
 Citation Tools