
 Submit a Paper
 Propose a Special lssue
 Open Access
ARTICLE
Fine Characterization and Analysis of Drying Strain of the ELM Board via DIC Technology
Key Laboratory of Bio-Based Material Science and Technology (Ministry of Education), College of Material Science and Engineering, Northeast Forestry University, Harbin, 150040, China
* Corresponding Authors: Yingchun Cai. Email: ; Jingyao Zhao. Email:
(This article belongs to the Special Issue: Computational Tools for Renewable Materials)
Journal of Renewable Materials 2023, 11(2), 567-580. https://doi.org/10.32604/jrm.2022.023037
Received 07 April 2022; Accepted 18 May 2022; Issue published 22 September 2022
 View Full Text
 Download PDF
Abstract
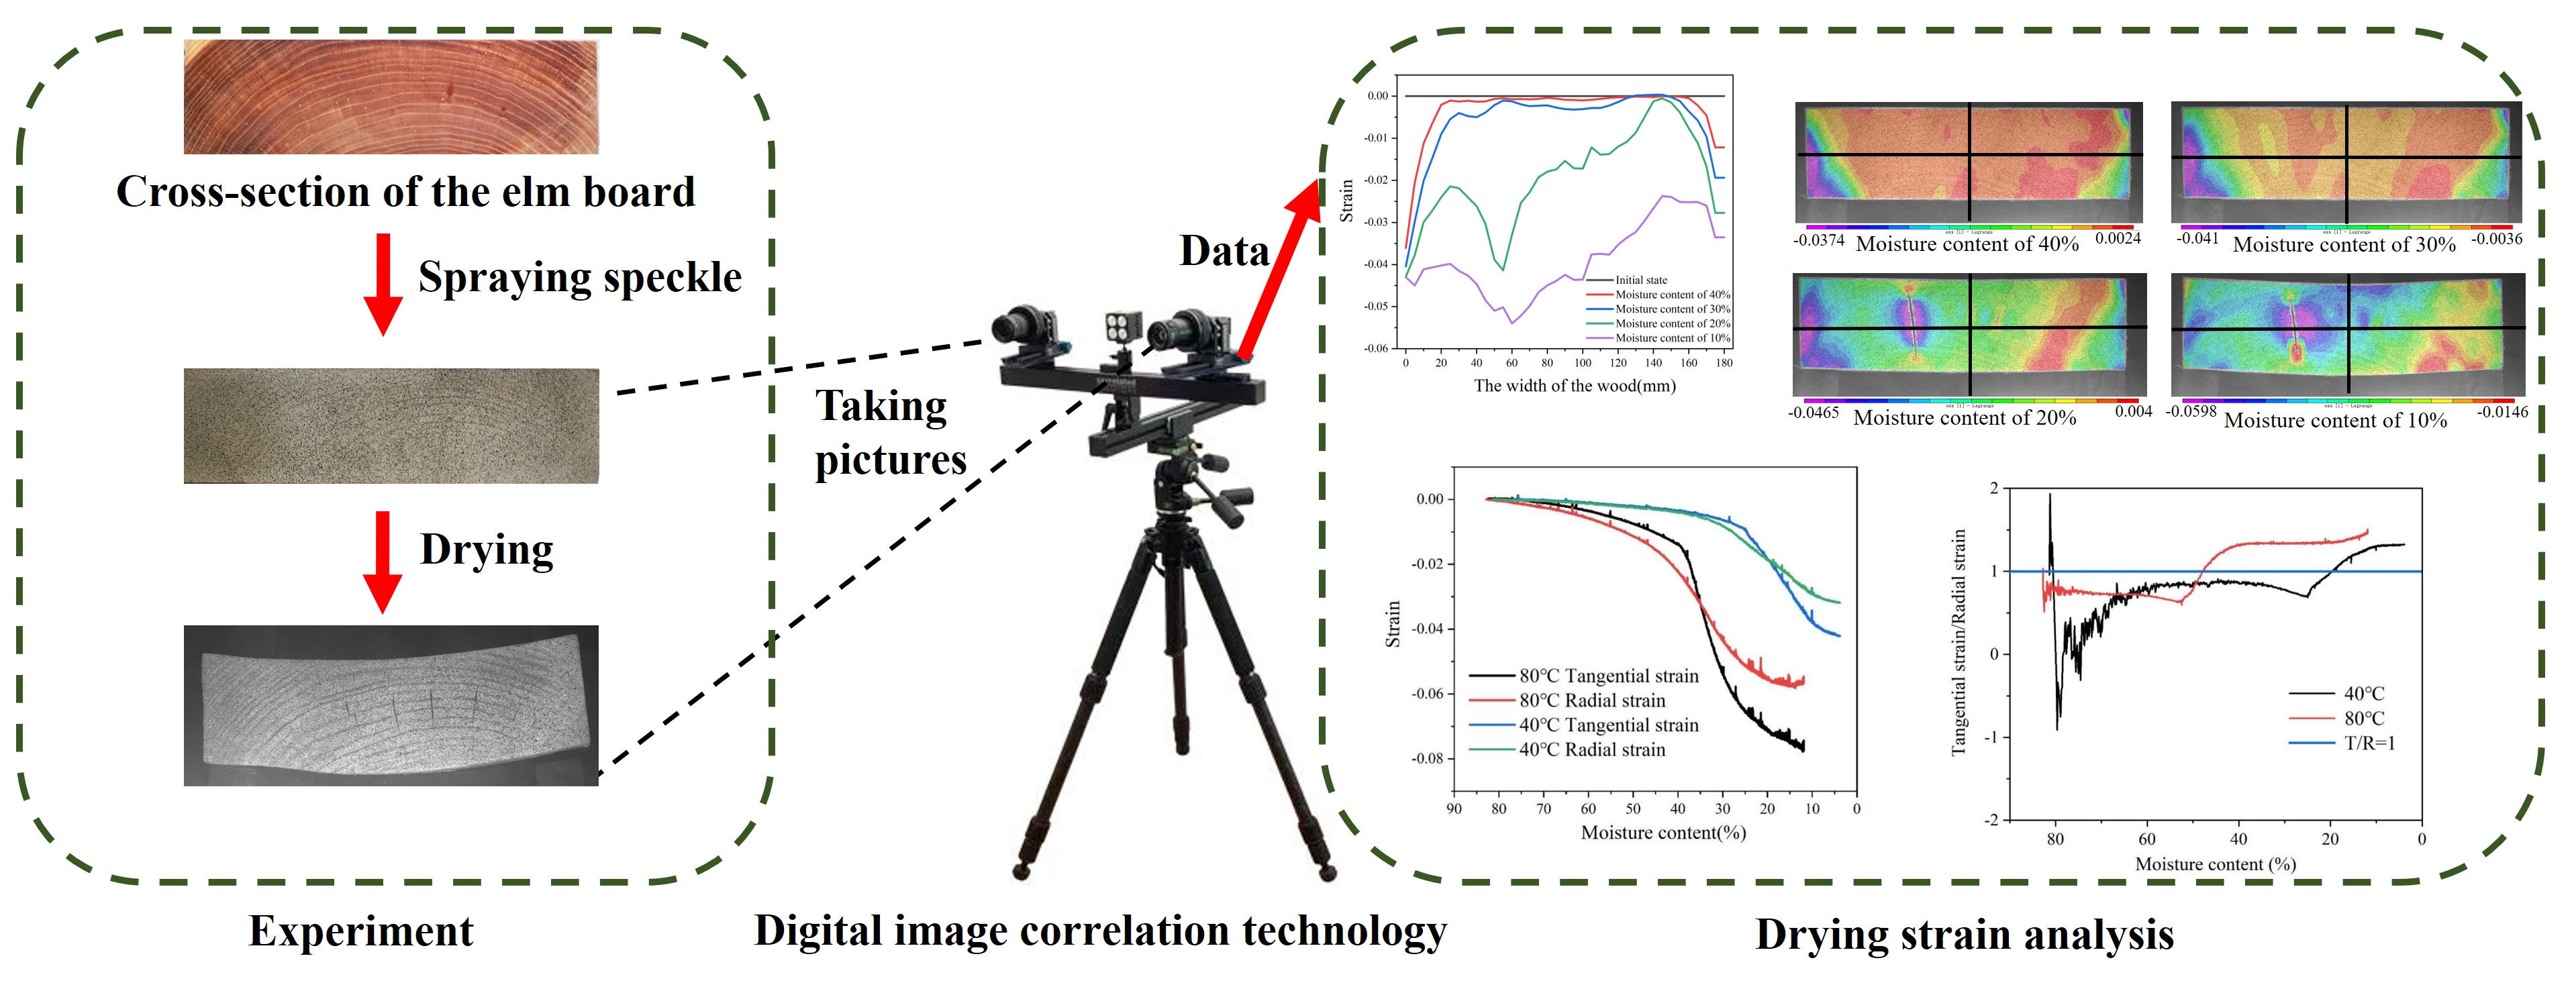
In this paper, the occurrence and development mechanism of strain on the cross-section during the wood drying is explored. Therefore, strain regularity on the cross-section of 50 mm thickness elm (Ulmus rubra) board at the temperature of 40°C and 80°C is detected via digital image correlation technology. Hence, the difference between tangential and radial strain at surface and core layers was denoted. The results showed that strain distribution in the width direction of the board is uneven. Moreover, a large drying shrinkage strain occurs at the near-core layer, while the maximum strain difference reaches 4.08%. Hence, the surface of the board is cracked along the thickness direction. The radial strain of the board is higher than the tangential strain in the early stage of drying, while these strains are reversed in the later stage of drying. The temperature is related to the difference between the tangential and radial strains of the elm board. These differences at the core layer are larger than those of the surface layer. The conducted research results provide a theoretical basis for process optimization.Graphic Abstract
Keywords
Wood drying is one of the necessary processes in wood processing and utilization. The anisotropy of structure and shrinkage difference caused by an uneven distribution of moisture content (MC) during drying are the main reasons for the occurrence of drying strain. Larger strains cause drying defects such as wood deformation, cracking, and warping. Therefore, accurate detection of drying strain is particularly important for drying quality [1,2]. In recent years, due to its toughness, clear texture, moderate strength, hardness, and strong bending resistance, elm has become one of the main materials in the Chinese furniture market. However, due to the high initial MC of elm, larger structural heterogeneity, and shrinkage, it is prone to deformation and cracking, which seriously affects the quality of the product. Few research reports on the drying strain regularity of elm can be found in the existing literature.
Currently, traditional strain detection methods include the fork tine method and the slicing method [3–6]. However, these methods can only be used for fuzzy detection of wood strain after drying and cannot be employed to obtain strain information of the entire drying process. As a non-contact detection method, digital image correlation technology (DIC), can achieve real-time images of objects during deformation. Furthermore, image analysis can be performed on the deformation field to provide strain information of the entire field. It is currently one of the most promising experimental technology for strain detection [7,8]. In recent years, DIC technology has been widely used in wood products and was proven practical in many fields of wood research [9–12], such as mechanical property testing and drying of the wood. Bjurhager et al. [13] used DIC technology to compare the elastic moduli of juvenile European aspen and hybrid aspen. Kuo et al. [14] used the DIC technology to analyze Poisson’s ratio of earlywood and latewood. Li et al. [15] employed the DIC technology to measure the modulus of elasticity, shear modulus, and Poisson’s ratio of dense balsam fir wood. Moreover, the author measured the strain field of the specimen under compressive loading. Gauvin et al. [16] used the DIC technology to evaluate the effect of hygrothermal loading on wood. Rosero-Alvarado et al. [17] utilized the 3D-DIC technology to evaluate local swelling strains and Z-displacement of unvarnished and varnished wood veneer surfaces. Garcia et al. [18] used 3D-DIC technology to evaluate the full-field moisture-induced strain and Z-displacement of different tissues of tamarind and red oak. Keunecke et al. [19] combined DIC technology with X-ray technology to analyze moisture-induced strain in wood. In the field of performance testing of other wood-based materials, Konnerth et al. [20] used DIC technology to obtain high-quality distribution maps of axial, transverse, and shear strains of timber finger joints. van Beerschoten et al. [21] employed DIC technology to determine the Poisson’s ratio and stiffness of laminated veneer lumber. In the field of wood drying, Kang et al. [22] adopted DIC technology to visualize and measure the wood strain under kiln drying conditions. Kang et al. [23] utilized DIC technology to determine the appropriate drying schedule by measuring the tangential strain of red oak. Han et al. [24] investigated the shrinkage and drying stress of red pine wood during drying. Moreover, the author used digital image analysis and near-infrared spectroscopy to explore transverse shrinkage and moisture changes of thin specimens, respectively. Fu et al. [25] used DIC technology to perform full-field tracking analysis of growth ring shrinkage strain. However, the drying deformation is very complicated due to heterogeneity and anisotropy of wood. Therefore, quantitative and refined characterization of wood drying strain is required. In other words, based on traditional characterization of the overall strain behavior, detailed research on the tangential strain, radial strain, and anisotropy at different positions cross-section has to be conducted, and the change law of its influence by temperature has to be explored. The above studies are almost unreported.
In this paper, drying experiments are conducted and DIC technology is employed to detect the overall deformation of the cross-section of the elm board at different temperatures. Therefore, tangential and radial strain, their difference, as well as their positions on cross-section are extracted and stain regularity is studied in detail. The purpose of this study is to reveal the strain law of elm board during conventional drying, as well as to provide a theoretical basis for inhibiting drying cracking.
As shown in Fig. 1, 70-year-old elm in the Greater Khingan Range forest area in China was processed into a board with a size of 1200 mm × 180 mm × 50 mm (length × width × thickness). The board with straight texture and no obvious defects was sawed along the longitudinal direction (fiber direction) and cut into 12 experimental specimens with dimensions of 400 mm × 180 mm × 50 mm (longitudinal × tangential × radial). The initial MC of the specimen was approximately 80%, while the basic density was 0.68 g/cm3.

Figure 1: Preparation of the specimen: (a) Cross-section of the specimen, (b) Specimen after spraying speckle, and (c) Cross-section of the elm
As shown in Fig. 2, the experimental equipment includes a digital image correlation system and a constant temperature and humidity drying chamber. The experimental system mainly consists of two digital cameras, two LED light sources, three tripods, and a computer. During the measurement, two LED lights were placed in appropriate positions, and the angle was adjusted several times to avoid reflections from the glass window of the drying chamber while uniformly illuminating the specimen [26]. Two digital cameras were mounted on a horizontal rod and focused on the test surface of the specimen at appropriate angles and distances [27]. The cross-section of the specimen is parallel to the target surface of the camera. The drying chamber is 500 mm long, 600 mm wide, and 750 mm tall. Two sets of experimental conditions were set in the constant temperature and humidity drying chamber. The conditions were performed according to the schedule denoted in Table 1. For each set of schedules, parallel experiments were performed twice to ensure data reliability.

Figure 2: Experimental equipment: (a) Computer, (b) LED, (c) Cameras, (d) Specimen, and (e) Drying chamber

During strain testing, the measurement object should not move to avoid affecting the accuracy and reliability of the experimental data. In this study, three specimens with the same texture and similar initial MCs were selected under the same set of experimental conditions. They are used for strain, MC, and distribution detection.
The DIC technology tracks the speckle image on the surface of the specimen via two digital cameras and calculates the displacement and strain at the cross-section of the specimen based on the change of the speckle position on the image. Therefore, it is necessary to polish the section of the specimen and paint it with black and white speckles of suitable size (as shown in Fig. 1b) before the experiment. A very thin primer is made by quickly sweeping the matte white spray paint across the cross-section of the board and repeating the procedure 3–10 times to ensure full coverage. Matte black spray paint is uniformly swept across the cross-section of the specimen to produce speckles. Since the paint layer is relatively thin, it has a negligible effect on moisture transmission during the drying process. The VIC-3D 9 full-field strain measurement system was used for strain measurement, while two digital cameras were used to track the speckle image on the specimen surface. Specimen displacement and strain were calculated according to the DIC principle [25]. The DIC system determines specimen surface displacement and strain by comparing the locations of subsets of the speckle patterns. The specific process is shown in Fig. 3.

Figure 3: DIC system operation process
2.3 Moisture Content and Distribution Detection
In this paper, the MC is detected by the weighing method. The MC of the specimen was estimated according to Eq. (1):
where MC is the moisture content, m is the weight of the specimen during the drying process, and md is the dry weight of the specimen.
The specimen end for MC distribution detection is coated with high temperature resistant and impermeable coating to prevent moisture from evaporating. The size of the wooden block is 18 mm × 10 mm × 5 mm (length × width × thickness), as shown in Fig. 4. The MC of each wooden block is measured by the weighing method to form a matrix distribution. After slicing, the slicing position is filled with specimens of the same material to reduce the influence of water loss due to slicing [28–30].

Figure 4: Test method for MC distribution
3.1 Moisture Content Curve and Distribution
MC curves are shown in Fig. 5. For the temperature of 40°C, the MC of the specimen decreased from 83.05% to 8.40%, which took 156 h with an average drying rate of 0.48%/h. The drying rate above the fiber saturation point (FSP) was 1.06%/h, while the drying rate in the later stage of drying was 0.21%/h. For the temperature of 80°C, the MC of the wood decreased 83.17% to 11.98% within 83 h. When the MC is above the FSP, the initial drying rate is 1.28%/h and 0.44%/h in the later stage of drying. The specimen drying rate when the MC is higher than the FSP is much greater than that when the MC is below the FSP. Moreover, it can be observed that the drying rate increases with temperature. This can be attributed to the following phenomenon. For the same temperature conditions, when the MC of the specimen is lower than the FSP, the lateral diffusion coefficient of the internal bound water decreases, thereby decreasing the drying rate. Rapid flow and diffusion of moisture in the wood are promoted due to high temperature, high water vapor pressure, and low viscosity of free water in the wood [28]. Therefore, the drying rate at 80°C is significantly faster than the one at 40°C.

Figure 5: MC curves
According to the MC curves, the functional relationship between the MC and drying time of specimens for the temperature conditions of 40°C and 80°C can be obtained. The relationship between the MC and drying time of the specimens is highly correlated. Therefore, according to Eqs. (2) and (3), the relationship between the strain at different times and the corresponding MC for 40°C and 80°C can be obtained, respectively:
where MCt represents the moisture content of the specimen at time t, t is the drying time of the specimen.
The distribution of the MC at the cross-section of the specimens in the initial state and MC of 30%, 20%, and 10% at 80°C and 40°C during the drying process is shown in Fig. 6. The moisture distribution is relatively complicated due to the instability of the drying environment and structural heterogeneity. However, as the drying progresses, the cross-sectional MC distribution is mainly high at the core and low at the surface of the specimen. A relatively large difference in the MC between the core layer and the surface layer is observable. For the temperature of 40°C and specimen MC of 30%, the highest MC at the core of the cross-section is 34.80%, while the MC at the edge is 11.90%. For the temperature of 80°C and specimen MC of 30%, the MC reaches 36.20% at the core and 10.90% at the edge of the specimen. The color distribution of the cross-section is more uniform for the temperature of 40°C. Moreover, the MC gradient of the specimen is smaller and drying is more uniform.

Figure 6: MC distribution
3.2 Overall Strain Behavior and Its Anisotropy Analysis
The overall strain distribution of the specimen cross-section at different temperatures is shown in Fig. 7. The black coordinate system represents the center datum. In the width direction, the shrinkage strain represents shrinkage towards the central vertical line. In the thickness direction, the shrinkage strain represents shrinkage towards the central transverse line.

Figure 7: Strain distribution at two temperatures and directions: (a) 40°C width direction, (b) 40°C thickness direction, (c) 80°C width direction, and (d) 80°C thickness direction
The tangential strain in the width direction at 40°C is shown in Fig. 7a. Above the FSP, the surface strain reaches −3.61%, while the core layer still maintains the original state with the strain being relatively close to zero. When the MC is 20%, a large shrinkage strain occurs at the near-core layer (at 50 mm), as indicated by the arrow in Fig. 7a. Moreover, the strain reaches −4.14%, while the strain at the surface layer (at 150 mm) is still relatively small, i.e., −0.054%.
According to the presented data, the surface layer first produces a large strain with the loss of moisture around the specimen, while strain in the core layer remains constant. As drying progresses, due to uneven distribution of moisture and structural heterogeneity, a relatively large strain occurs at the near-core layer. The strain at the near-surface layer is smaller and close to zero, while the maximum strain difference reaches 4.08%. Hence, the specimen cracked at 50 mm in the width direction. Observing the strain distribution in the width direction provides a theoretical basis for reasonably implementing the drying process and suppressing the occurrence of cracks.
Radial strain in the thickness direction at 40°C is shown in Fig. 7b. The strain distribution in the thickness direction is more uniform than the one in the width direction, while higher shrinkage strain occurs at the bottom of the specimen. When the MC is under 40%, 30%, 20%, and 10%, the difference between the maximum and minimum strain is 1.14%, 1.45%, 1.11%, and 0.63%, respectively. This phenomenon is consistent with the one obtained by Kang et al. [22], who employed the DIC technology to detect the strain distribution in the thickness direction of a 25 mm thick white oak specimen. In other words, the radial strain at the bottom of the specimens is larger at the beginning of drying, and then gradually stabilizes. This is related to moisture distribution in the thickness direction as well as structural heterogeneity. According to Figs. 7a and 7b, the strain difference in the width direction of the specimen is increased, which is more likely to cause radial cracking.
The tangential strain in the width direction at 80°C is shown in Fig. 7c. Due to the excessively hard drying schedule, the board is severely cracked. Hence, it is harder to explore the timing of cracking caused by strain differences.
Radial strain in the thickness direction at 80°C is shown in Fig. 7d. The difference between the maximum and minimum strains for the MC of 40%, 30%, 20%, and 10% is 5.21%, 5.08%, 4.13%, and 3.80%, respectively. The maximum difference of radial shrinkage strain decreases with the MC. Theoretically, the internal stress generated by a large radial strain difference deteriorates the cohesion of the specimen tissue, resulting in cracking along the width direction. However, since the wood has a certain plasticity, the warpage of the entire specimen will offset part of the internal stress. Consequently, no cracking in the width direction occurs.
The relationship between tangential strain, radial strain, and the MC for different temperatures is shown in Fig. 8. The radial strain in the early drying stage is greater than the tangential strain at both temperatures. When the MC is approximately equal to 20% and 35%, the tangential and radial strains are nearly equal, i.e., −1.89% and −3.24%, respectively. Furthermore, tangential and radial strains start to reverse. Once the drying is completed, the tangential strain is −4.19% and the radial strain is −3.19% for the temperature of 40°C. On the other hand, for the temperature of 80°C, the tangential strain is −7.68% and the radial strain is −5.73%.This phenomenon is consistent with the conclusion obtained by Fu et al. [25], who utilized DIC technology to observe the tangential and radial strain of the wood disc.

Figure 8: Tangential and radial strains with respect to the MC
Theoretically, with a decrease in the MC, the specimen starts to shrink inwards along with the tangential and radial directions. Due to the unevenness of the moisture drop rate and different properties of the wood, the drying strain unevenly changes. The specimen thickness is smaller than its width and the moisture migration rate in the radial direction is higher than that in the tangential direction. Therefore, the radial strain is higher than the tangential strain during the early drying stage. As the MC continues to decrease, the moisture inside the wood will inevitably decrease further along the tangential direction of the width, while the tangential shrinkage strain will be higher than the radial strain. Therefore, in later drying stages, the tangential direction strain is significantly higher than the radial one. According to different drying temperatures, the timing of the intersection of the two is different. In other words, the higher the temperature, the earlier the intersection occurs, and the overall strain behavior is larger. In summary, specific attention should be paid to this strain transition point. The timing of its occurrence is closely related to the timing of cracking. As shown in Fig. 7a, cracks occur when the MC is 20%, which is consistent with the timing of the intersection.
The relationship between the ratio of tangential to radial shrinkage (T/R) and the MC of the specimen for different temperatures is extracted from Fig. 8 and shown in Fig. 9. The distance from the straight line T/R = 1 represents the size of the tangential and radial differences. The intersections of 40°C and 80°C curves with the straight line T/R = 1 are shown in Fig. 8. When the MC is in the range of 60%–80%, the value of T/R violently fluctuates at the two temperatures, showing irregular changes. When the MC is in the range of 20%–60%, the T/R first decreases for the temperature of 80°C. The curve reaches its inflection point when the MC is 52.63%. The ratio at the inflection point is 0.63, after which the T/R starts to increase continuously. For the temperature of 40°C, the T/R first decreases. The curve reaches the inflection point for the MC of 24.91%. The ratio at this inflection point is 0.69, after which the T/R starts to increase continuously. Once the drying is complete, the T/R at 40°C is 1.3, while the T/R at 80°C is 1.51. This is also the maximum value.

Figure 9: Relationship between the T/R and the MC for two temperatures
Radial and tangential strains of the specimen are small and the specimen itself hardly shrinks in the early stage of drying [23]. Therefore, a relatively small dimensional change is observed, which leads to higher and irregularly changing T/R values. During the mid-drying period, since the effect of moisture migration in the width direction on the tangential strain is greater than the effect of moisture migration in the thickness direction on the radial strain, the two curves have an inflection point. Depending on the drying temperature, the timing between the appearance of the two is different. In other words, the higher the temperature, the earlier the inflection point will appear. Once the drying process is completed, the T/R ratio at 80°C is greater than the T/R ratio at 40°C. This indicates that the temperature is related to the tangential-radial strain difference, i.e., the higher the temperature, the greater the final tangential-radial strain difference.
3.3 Strain Behavior and Anisotropy Analysis of the Core Layer and the Surface Layer
To finely analyze the drying strain behavior, the board core, surface strains, and their anisotropy at different temperatures are discussed in this section. According to Fig. 10, the section of the specimen is divided into five regions: top surface layer, bottom surface layer, left surface layer, right surface layer, and core.

Figure 10: Core layer and surface layer division of the specimen section
Note: *Symbols Ts, Bs, Ls, Rs, and C represent the top surface layer, bottom surface layer, left surface layer, right surface layer, and the core layer, respectively.
The relationship between the tangential strain and the MC in different layers for the temperature of 40°C is shown in Fig. 11a. In the early stages of drying, the strain at the core layer is nearly zero. The surface layer is in the presence of a relatively large strain, while the average strain of Ls and Rs is higher than the average strain of Ts and Bs. Below the FSP, the average strains of C, Ls, Rs, Ts, and Bs are all significantly affected. The strain change of C is higher than the one of the surface layer. When the strain of C exceeds Ts and Bs average strain, the MC is 24.01% and the strain is −1.07%. When the C strain exceeds Ls and Rs average strain, the MC is 19.95% and the strain is −1.94%. At the end of the drying process, the strain of the core layer reaches a maximum value of −4.65%. The average strain of Ts and Bs is −4.05%, while the average strain of Ls and Rs is −3.75%.

Figure 11: Relationship between tangential strain, radial strain, and the MC of core and surface layers
The aforementioned can be attributed to the MC of the surface firstly dropping below the FSP during the early stages of drying, which results in shrinkage [31]. As the wet area in the cross-section shrinks, C begins to shrink as well, while the surface layer has a slower rate of strain change due to a lower MC gradient. At the end of the drying process, the tangential strain of C is greater than the one of the surface layer. This is due to the long stress time on the surface layer, which results in plasticization and fixation.
The relationship between the radial strain and the MC in different layers at 40°C and 80°C is shown in Figs. 11b and 11d, respectively. Similarly, during the early stages of drying, the strain of C is nearly zero, the surface layer begins to shrink, and the average strain of the Ls and Rs is greater than the average strain of Ts and Bs. For the temperature of 40°C, C begins to shrink when the MC is 35%. For the temperature of 80°C, C begins to shrink when the MC is 50%. At the end of drying, the average radial strain of Ts and Bs is greater than the average radial strain of Ls and Rs, which are in turn greater than the radial strain of C.
The relationship between the tangential strain and the MC in different layers for the temperature of 80°C is shown in Fig. 11c. The curve trend at 80°C is consistent with the one at 40°C. For both curves, the surface strain is greater than the strain at C during the early drying stages. Moreover, the final tangential strain of C is greater than the surface strain. At the end of drying, the tangential strain of C decreases and is 1.04% different from the maximum value. This may be caused by the cracked C section absorbing moisture in the drying medium and reducing the cracks.
To further investigate the difference of tangential-radial shrinkage strain, the relationship between the T/R and the MC of the specimen at different positions was extracted from Fig. 11. As shown in Fig. 12a, for the temperature of 40°C, when the MC is in the range of 40%–80%, the T/R of the C layer fluctuates violently. While the T/R of Ls and Rs is less than 1, the radial strain is greater than the tangential strain. When the MC is in the range of 10%–40%, the T/R of C continuously decreases. The value of T/R is 1.62 at the end of the drying. The T/R of Ts and Bs keeps increasing, while the one of Ls and Rs is close to 1. At the end of the drying process, the T/R of Ts and Bs is 1.24, and the T/R of Ls and Rs is 1.04. As shown in Fig. 12b, for the temperature of 80°C, T/R of C fluctuates violently when the MC is in the range of 40%–80%. On the other hand, the T/R of Ls and Rs is lower than 1. When the MC is in the range of 10%–40%, the T/R of C continuously increases. T/R of C is 2.05 at the end of drying. T/R of the Ts and Bs keeps increasing, while the T/R of Ls and Rs is close to 1. Once the drying is complete, the T/R of Ts and Bs is 1.50, and the T/R of Ls and Rs is 0.97.

Figure 12: Relationship between T/R curves and the MC at three positions
Due to high MC of C in the early stage of drying, radial and tangential strains are small and the specimen hardly shrinks. This leads to higher T/R values that change irregularly. When the MC is in the range of 10%–40%, the tangential-radial texture structures of C, Ts and Bs are quite different. Hence, the T/R at the end of drying is larger. Moreover, the higher the temperature, the larger the ratio. Since the difference in the tangential-radial texture structure of Ls and Rs is small, the value of T/R of the test material is close to 1 at the end of drying.
Due to the influence of the moisture content (MC) and the structure, strain distribution in the width direction of the elm board is uneven. A large shrinkage strain occurs at the near-core layer, and the maximum strain difference reaches 4.08%. Therefore, the surface of the board is cracked along the thickness direction at the near-core layer (at 50 mm). Strain distribution in the thickness direction is relatively uniform, while the maximum strain difference is smaller than that in the width direction.
The radial strain of the board is greater than the tangential strain in the early stage of drying. On the other hand, this effect is reversed in the later drying stages. For the temperature of 40°C, when the MC is 20%, the tangential and radial strains are equal to −1.89%. For the temperature of 80°C, when the MC is 35%, the tangential and radial strains are equal to −3.24%. Afterward, the tangential and radial strains begin to reverse. After drying, the T/R at 40°C is 1.32 and 1.51 at 80°C. The temperature is related to the difference between tangential and radial strains of the elm board, i.e., the higher the temperature, the greater the difference.
The tangential strain of the surface layer is greater than the tangential strain of the core layer in the early stage of drying. This effect is reversed in later drying stages. The radial strain of the surface layer is always greater than the radial strain of the core layer. The tangential and radial differences of the core layer are larger than those of the surface layer. Lastly, it was observed that this difference increases with temperature.
Funding Statement: The project was supported by the National Natural Science Foundation of China (No. 31901242); Heilongjiang Science Foundation Project (No. LH2020C038); National Undergraduate Training Programs for Innovations (No. 202110225074)
Conflicts of Interest: The authors declare that they have no conflicts of interest to report regarding the present study.
References
1. Fu, Z., Zhao, J., Yang, Y., Cai, Y. (2016). Variation of drying strains between tangential and radial directions in asian white birch. Forests, 7(12). DOI 10.3390/f7030059. [Google Scholar] [CrossRef]
2. Florisson, S., Vessby, J., Mmari, W., Ormarsson, S. (2020). Three-dimensional orthotropic nonlinear transient moisture simulation for wood: Analysis on the effect of scanning curves and nonlinearity. Wood Science and Technology, 54(5), 1197–1222. DOI 10.1007/s00226-020-01210-4. [Google Scholar] [CrossRef]
3. Li, H., Zhang, H., Qiu, Z., Su, J., Wei, D. et al. (2020). Mechanical properties and stress strain relationship models for bamboo scrimber. Journal of Renewable Materials, 8(1), 13–27. DOI 10.32604/jrm.2020.09341. [Google Scholar] [CrossRef]
4. Sun, G., Wang, C., Wang, L. (2022). Study on the fire behavior of sandwich wall panels with GFRP skins and a wood-web core. Journal of Renewable Materials, 10(6), 1537–1553. DOI 10.32604/jrm.2022.018598. [Google Scholar] [CrossRef]
5. Zhu, X., Zhao, J., Gao, W., Qian, C., Duan, Y. et al. (2021). Laws governing free and actual drying shrinkage of 50 mm thick mongolian scotch pine timber. Forests, 12(11). DOI 10.3390/f12111500. [Google Scholar] [CrossRef]
6. Chang, Y. S., Han, Y., Shin, H. K., Kim, M. J. (2020). Evaluation of drying and anatomical characteristics of Mongolian oak lumber by kiln drying with respect to storage time after sawing. European Journal of Wood and Wood Products, 78(5), 1017–1022. DOI 10.1007/s00107-020-01579-w. [Google Scholar] [CrossRef]
7. Muszynski, L. (2006). Empirical data for modeling: Methodological aspects in experimentation involving hygromechanical characteristics of wood. Drying Technology, 24(9), 1115–1120. DOI 10.1080/07373930600778254. [Google Scholar] [CrossRef]
8. Peng, M., Ho, Y. C., Wang, W. C., Chui, Y. H., Gong, M. (2012). Measurement of wood shrinkage in jack pine using three dimensional digital image correlation (DIC). Holzforschung, 66(5), 639–643. DOI 10.1515/hf-2011-0124. [Google Scholar] [CrossRef]
9. Benabou, L., Tao, Q. B. (2017). Development and first assessment of a DIC system for a micro-tensile tester used for solder characterization. Experimental Techniques, 41(3), 317–326. DOI 10.1007/s40799-017-0175-4. [Google Scholar] [CrossRef]
10. Tu, J., Zhao, D., Zhao, J., Zhao, Q. (2021). Experimental study on crack initiation and propagation of wood with LT-type crack using digital image correlation (DIC) technique and acoustic emission (AE). Wood Science and Technology, 55(6), 1577–1591. DOI 10.1007/s00226-020-01252-8. [Google Scholar] [CrossRef]
11. van Blokland, J., Olsson, A., Oscarsson, J., Daniel, G., Adamopoulos, S. (2020). Crack formation, strain distribution and fracture surfaces around knots in thermally modified timber loaded in static bending. Wood Science and Technology, 54(4), 1001–1028. DOI 10.1007/s00226-020-01190-5. [Google Scholar] [CrossRef]
12. Zhao, J., Cai, Y. (2015). Digital image correlation technology and its application to wood science. Wood Forestry Research, 28(6), 53–57. DOI 10.13348/j.cnki.sjlyyj.2015.06.006. [Google Scholar] [CrossRef]
13. Bjurhager, I., Berglund, L. A., Bardage, S. L., Sundberg, B. (2008). Mechanical characterization of juvenile European aspen (Populus tremula) and hybrid aspen (Populus tremula × Populus tremuloides) using full-field strain measurements. Journal of Wood Science, 54(5), 349–355. DOI 10.1007/s10086-008-0960-x. [Google Scholar] [CrossRef]
14. Kuo, T. Y., Wang, W. C. (2019). Determination of elastic properties of latewood and earlywood by digital image analysis technique. Wood Science and Technology, 53(3), 559–577. DOI 10.1007/s00226-019-01096-x. [Google Scholar] [CrossRef]
15. Li, L., Gong, M., Chui, Y. H., Schneider, M., Li, D. (2013). Measurement of the elastic parameters of densified balsam fir wood in the radial-tangential plane using a digital image correlation (DIC) method. Journal of Materials Science, 48(21), 7728–7735. DOI 10.1007/s10853-013-7593-1. [Google Scholar] [CrossRef]
16. Gauvin, C., Jullien, D., Doumalin, P., Dupre, J. C., Gril, J. (2014). Image correlation to evaluate the influence of hygrothermal loading on wood. Strain, 50(5), 428–435. DOI 10.1111/str.12090. [Google Scholar] [CrossRef]
17. Rosero Alvarado, J., Hernández, R. E., Riedl, B. (2018). Surface deformation of walnut burl veneer on aircraft sandwich panels assessed by three-dimensional digital image correlation. Wood Science and Technology, 52(6), 1511–1525. DOI 10.1007/s00226-018-1040-z. [Google Scholar] [CrossRef]
18. Garcia, R. A., Rosero Alvarado, J., Hernández, R. E. (2019). Full-field moisture-induced strains of the different tissues of tamarack and red oak woods assessed by 3D digital image correlation. Wood Science and Technology, 54(1), 139–159. DOI 10.1007/s00226-019-01145-5. [Google Scholar] [CrossRef]
19. Keunecke, D., Novosseletz, K., Lanvermann, C., Mannes, D., Niemz, P. (2011). Combination of X-ray and digital image correlation for the analysis of moisture-induced strain in wood: Opportunities and challenges. European Journal of Wood and Wood Products, 70(4), 407–413. DOI 10.1007/s00107-011-0573-8. [Google Scholar] [CrossRef]
20. Konnerth, J., Valla, A., Gindl, W., Müller, U. (2006). Measurement of strain distribution in timber finger joints. Wood Science and Technology, 40(8), 631–636. DOI 10.1007/s00226-006-0090-9. [Google Scholar] [CrossRef]
21. van Beerschoten, W. A., Carradine, D. M., Carr, A. (2014). Development of constitutive model for laminated veneer lumber using digital image correlation technique. Wood Science and Technology, 48(4), 755–772. DOI 10.1007/s00226-014-0638-z. [Google Scholar] [CrossRef]
22. Kang, H. Y., Muszyński, L., Milota, M. R. (2011). Optical measurement of deformations in drying lumber. Drying Technology, 29(2), 127–134. DOI 10.1080/07373937.2010.482725. [Google Scholar] [CrossRef]
23. Kang, C. W., Muszyński, L., Hong, S. H., Kang, H. Y. (2015). Preliminary tests for the application of an optical measurement system for the development of a kiln-drying schedule. Drying Technology, 34(4), 483–490. DOI 10.1080/07373937.2015.1060604. [Google Scholar] [CrossRef]
24. Han, Y., Park, Y., Park, J. H., Yang, S. Y., Eom, C. D. et al. (2016). The shrinkage properties of red pine wood assessed by image analysis and near-infrared spectroscopy. Drying Technology, 34(13), 1613–1620. DOI 10.1080/07373937.2016.1138964. [Google Scholar] [CrossRef]
25. Fu, Z., Weng, X., Gao, Y., Zhou, Y. (2021). Full-field tracking and analysis of shrinkage strain during moisture content loss in wood. Holzforschung, 75(5), 436–443. DOI 10.1515/hf-2020-0086. [Google Scholar] [CrossRef]
26. Khoo, S. W., Karuppanan, S., Tan, C. S. (2016). A review of surface deformation and strain measurement using two-dimensional digital image correlation. Metrology and Measurement Systems, 23(3), 461–480. DOI 10.1515/mms-2016-0028. [Google Scholar] [CrossRef]
27. Sutton, M. A., Yan, J. H., Tiwari, V., Schreier, H. W., Orteu, J. J. (2008). The effect of out-of-plane motion on 2D and 3D digital image correlation measurements. Optics and Lasers in Engineering, 46(10), 746–757. DOI 10.1016/j.optlaseng.2008.05.005. [Google Scholar] [CrossRef]
28. Baranski, J. (2017). Moisture content during and after high-and normal-temperature drying processes of wood. Drying Technology, 36(6), 751–761. DOI 10.1080/07373937.2017.1355319. [Google Scholar] [CrossRef]
29. Xu, K., Lu, J., Gao, Y., Wu, Y., Li, X. (2017). Determination of moisture content and moisture content profiles in wood during drying by low-field nuclear magnetic resonance. Drying Technology, 35(15), 1909–1918. DOI 10.1080/07373937.2017.1291519. [Google Scholar] [CrossRef]
30. Florisson, S., Vessby, J., Mmari, W., Ormarsson, S. (2020). Three-dimensional orthotropic nonlinear transient moisture simulation for wood: Analysis on the effect of scanning curves and nonlinearity. Wood Science and Technology, 54(5), 1197–1222. DOI 10.1007/s00226-020-01210-4. [Google Scholar] [CrossRef]
31. Yang, L., Tian, G., Yang, S., Shang, L., Liu, X. et al. (2020). Determination of fiber saturation point of rattan (Calamus simplicifolius) using the LF-NMR and two conventional methods. Wood Science and Technology, 54(3), 667–682. DOI 10.1007/s00226-020-01177-2. [Google Scholar] [CrossRef]
Cite This Article
 Copyright © 2023 The Author(s). Published by Tech Science Press.
This work is licensed under a Creative Commons Attribution 4.0 International License , which permits unrestricted use, distribution, and reproduction in any medium, provided the original work is properly cited.
 Downloads
 Citation Tools