
 Submit a Paper
 Propose a Special lssue
 Open Access
ARTICLE
Stiffness and Shear Stress Distribution of Glulam Beams in Elastic-Plastic Stage: Theory, Experiments and Numerical Modelling
1
Department of Civil Engineering, College of Civil Engineering and Architecture, Hainan University, Haikou, China
2
Department of Wooden Structure Construction, College of Materials Science and Engineering, Nanjing Forestry University,
Nanjing, China
* Corresponding Author: Lisheng Luo. Email:
(This article belongs to the Special Issue: Advanced Wood Composites from Renewable Materials)
Journal of Renewable Materials 2023, 11(2), 791-809. https://doi.org/10.32604/jrm.2022.022539
Received 15 March 2022; Accepted 05 May 2022; Issue published 22 September 2022
 View Full Text
 Download PDF
Abstract
Traditional methods focus on the ultimate bending moment of glulam beams and the fracture failure of materials with defects, which usually depends on empirical parameters. There is no systematic theoretical method to predict the stiffness and shear distribution of glulam beams in elastic-plastic stage, and consequently, the failure of such glulam beams cannot be predicted effectively. To address these issues, an analytical method considering material nonlinearity was proposed for glulam beams, and the calculating equations of deflection and shear stress distribution for different failure modes were established. The proposed method was verified by experiments and numerical models under the corresponding conditions. Results showed that the theoretical calculations were in good agreement with experimental and numerical results, indicating that the equations proposed in this paper were reliable and accurate for such glulam beams with wood material in the elastic-plastic stage ignoring the influence of mechanic properties in radial and tangential directions of wood. Furthermore, the experimental results reported by the previous studies indicated that the method was applicable and could be used as a theoretical reference for predicting the failure of glulam beams.Graphic Abstract
Keywords
Wood is a lightweight but high-strength material with excellent acoustic and thermal insulation performance. The popularity of wood, especially engineered timber, has opened new potential for full utilization of wood and resources conservation for its sustainable characteristic. Compared with solid wood, glulam comes in various sizes and displays high stability and excellent mechanical performance [1–5]. This type of timber improves the wood utilization rate with extensive applications in the engineering field due to its advantaged mechanical performance [6–9]. The mechanical performance of glulam components manufactured under different conditions (e.g., temperature and humidity) [10–14] and the development of load-carrying features with varying section forms [15–19] have been studied by many researchers. Moreover, reinforcing materials such as steel bars, carbon fiber reinforced polymer (CFRP) and basalt fiber reinforced polymer (BFRP) have further improved mechanical performance of the components, such as enhancing the bearing capacity and ductility of the elements [20–23]. However, the natural defects in raw materials (e.g., nodes and cracks) cannot be ignored [24–26], and due to the anisotropy of the raw materials, a theoretical approach is needed to predict the failure of glulam beams more accurately.
Scholars have adopted varying methods to predict the mechanical performance of glulam beams [24]. Murphy [27] introduced fracture mechanics and considered the inherent defects of components, such as cracks and nodes. However, the actual development direction of defects did not consistently follow the initial crack direction for glulam. Foschi et al. [28,29] proposed a limit state analysis method based on probability with the empirically and statistically determined safety factor. Moses et al. [30–36] applied numerical analysis simulation, considering the anisotropy and non-linearity of the material, which had high accuracy and agreed well with the actual situation. Yang et al. [37–41] assumed that the component underwent failure to reach the limit strain of the material. Their proposed method had slight difference with actual situation, but the calculation procedure is simplified and the adaptability is good. The method has been proved suitable for theoretical analysis of design and calculation.
Since the glulam beams in elastic-plastic stage have undergone a certain degree of plastic deformation, it is inept for calculating the deflection and shear stress based on elastic theory [42]. In this paper, an appropriate stress-strain relationship model for ideally elastic-plastic timber was developed, and the deflection equations and shear stress distribution under different failure modes were derived, applying the theories of material mechanics, elastic-plastic mechanics, and limit strain analysis. Bending tests were conducted and innovative nonlinear elastic-plastic finite element models were then developed and validated by the experimental results. Furthermore, some experiments were selected from references for comparison, including different cross-sectional dimensions, span lengths and materials, to verify the accuracy and universality of the proposed theory.
The following assumptions are made for the theoretical analysis:
(1) The strain distribution over the beam section satisfied the plane-section assumption [24].
(2) The beam specimens under bending have equal bending elastic modulus as compressive and tensile elastic modulus [43].
(3) The glulam beam is in elastic stage under initial loading. As the load increases, the beam reaches the maximum elastic bending moment, after which the beam entered the elastic-plastic stage. At this moment, the compressive zone is considered as an ideal elastic-plastic body and the tensile zone as a perfectly elastic body [44].
(4) The bonding between the laminates is intact without relative slip [45].
(5) As shown in Fig. 1, the wood is treated as a linear elastic material under tension, while the constitutive relationship of wood parallel to grain suggested by Chen [46] is used when compressed. Eqs. (1) and (2) defined the stress-strain relationship of wood.
where: εc and εt are the strains in compressive and tensile zones of the glulam beam, respectively; εce and εcu are the maximum elastic compressive strain and the ultimate compressive strain in compressive zone, respectively; εte is the maximum elastic tensile strain in the compressive zone of the beam; σc and σt are the stresses in compressive and tensile zones, respectively; σce and σte are the stresses of the glulam beam after reaching the ultimate elastic compressive strain (εce) and tensile strain (εte), respectively.
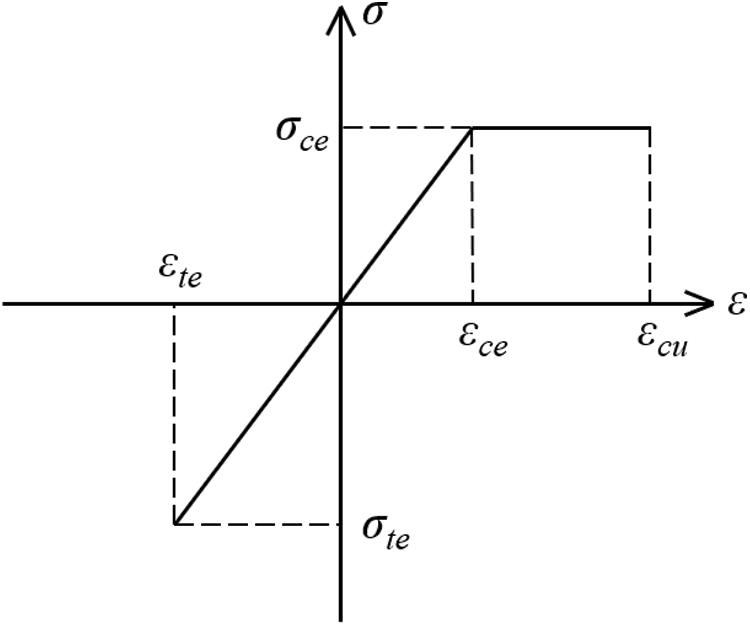
Figure 1: The assumed stress-strain curve of wood
The stresses in compressive and tensile zones of the beam are assumed equal, that is σc = σt. In accordance with the mechanical property and the phenomenon of tests [44], the compressive zone enters elastic-plastic stage at the ultimate elastic strain state while the tensile zone is still in elasticity, and the section is in three zones along the height dimension. The top zone is a plastic zone; there are two elastic zones (elastic zones under compression and tension) between the plastic zone and the bottom with σte = k0σce. Fig. 2 illustrates the rectangular section form and the stress diagram of the beam.
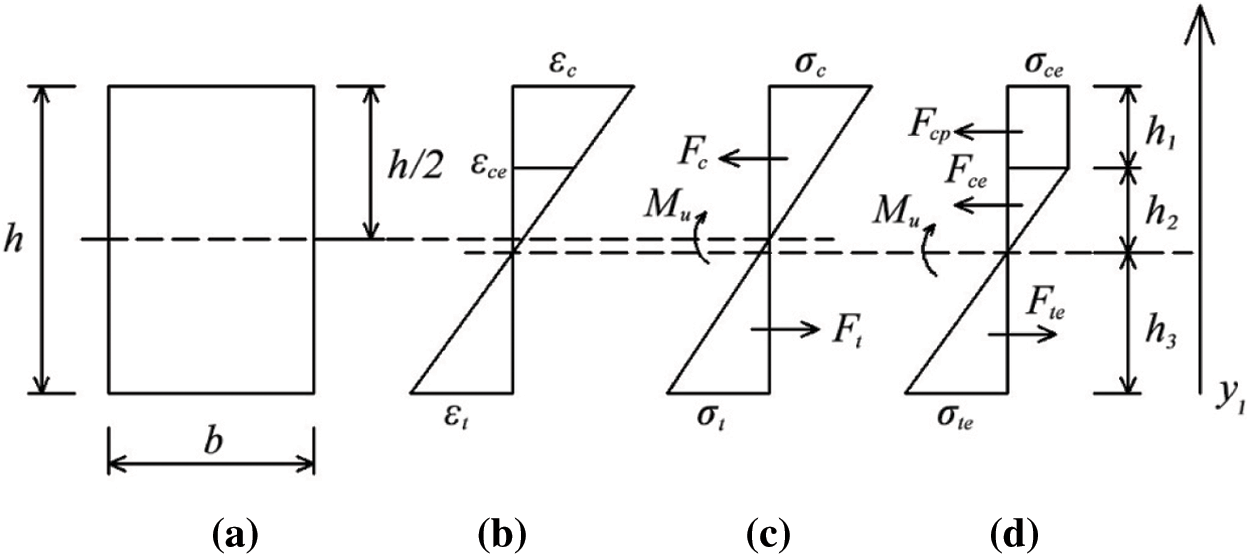
Figure 2: Stress and strain distribution of specimen section in tensile and compressive zones (a) The mid-span section (b) Strain distribution (c) εc ≤ εce (d) εce≤ εc ≤ εu
where: b is the width of the rectangular beam-section and h is the height; Fc and Ft are the respective resultant forces of compressive and tensile stresses before the beam enters elastic-plastic stage; Fce and Fcp are the individual forces of compressive stresses in elastic and plastic zones after the beam enters elastic-plastic stage; Fte is the resulting force of the tensile stresses in elastic zone after the beam enters elastic-plastic stage; h1 and h2 are the heights of plastic and elastic zones under compression, respectively; h3 is the height of the elastic zone under tension; y1 is the height of any position on the section with the beam base as the benchmark; k0 the proportional relationship between ultimate elastic tensile stress and ultimate elastic compressive stress.
According to the static equilibrium equation of the section,
From
where: Mu is the maximum bending moment of the glulam beam.
Fig. 3 shows bending moment diagrams for the integral beam member. Me and Mp are bending moments of the beam upon reaching the ultimate compressive elastic strain and ultimate compressive strain respectively, that is the maximum elastic bending moment and the maximum plastic bending moment. x is any position of the beam along the length direction for the deflection to be estimated. x0 is the dividing point where the beam achieved the bending moment Me when entering elastic-plastic stage. Since symmetry exists about the axis defined by x = l0/2, the discussion of force analysis for the case l0/2 ≤ x ≤ l0 is omitted. Thus, under the action of the mid-span concentrated load, the force analysis of the integral beam shows that:
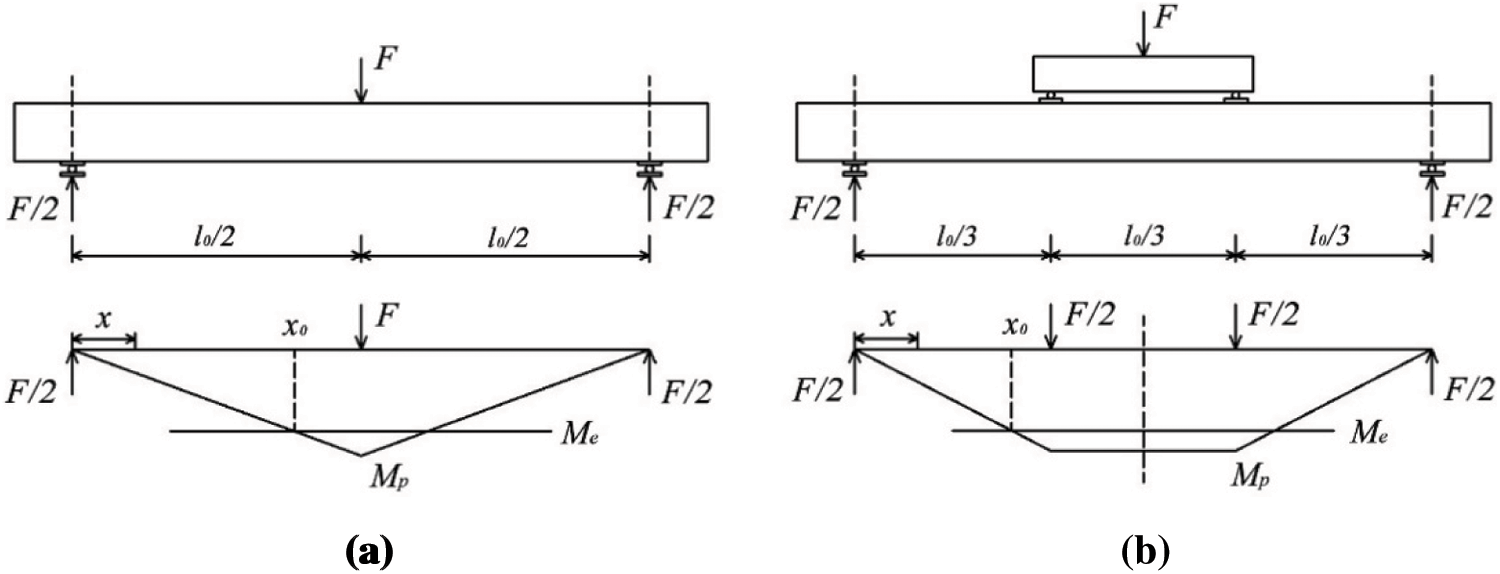
Figure 3: Bending moment diagrams of the integral beam member (a) Three-point bending (b) Four-point bending
The bending moment at any position along the length M is
The proportional relationship in ultimate state k0 is extended to any state when the compressive zone enters plasticity, as shown in Eq. (6), k can be obtained by inserting Eq. (5) into Eq. (4).
where: k is the proportional relationship between the height of the elastic zone under tension h3 and the height of elastic zone under compression h2.
According to the theory of mechanics of materials [47], an element body is taken for force analysis, as shown in Fig. 4.
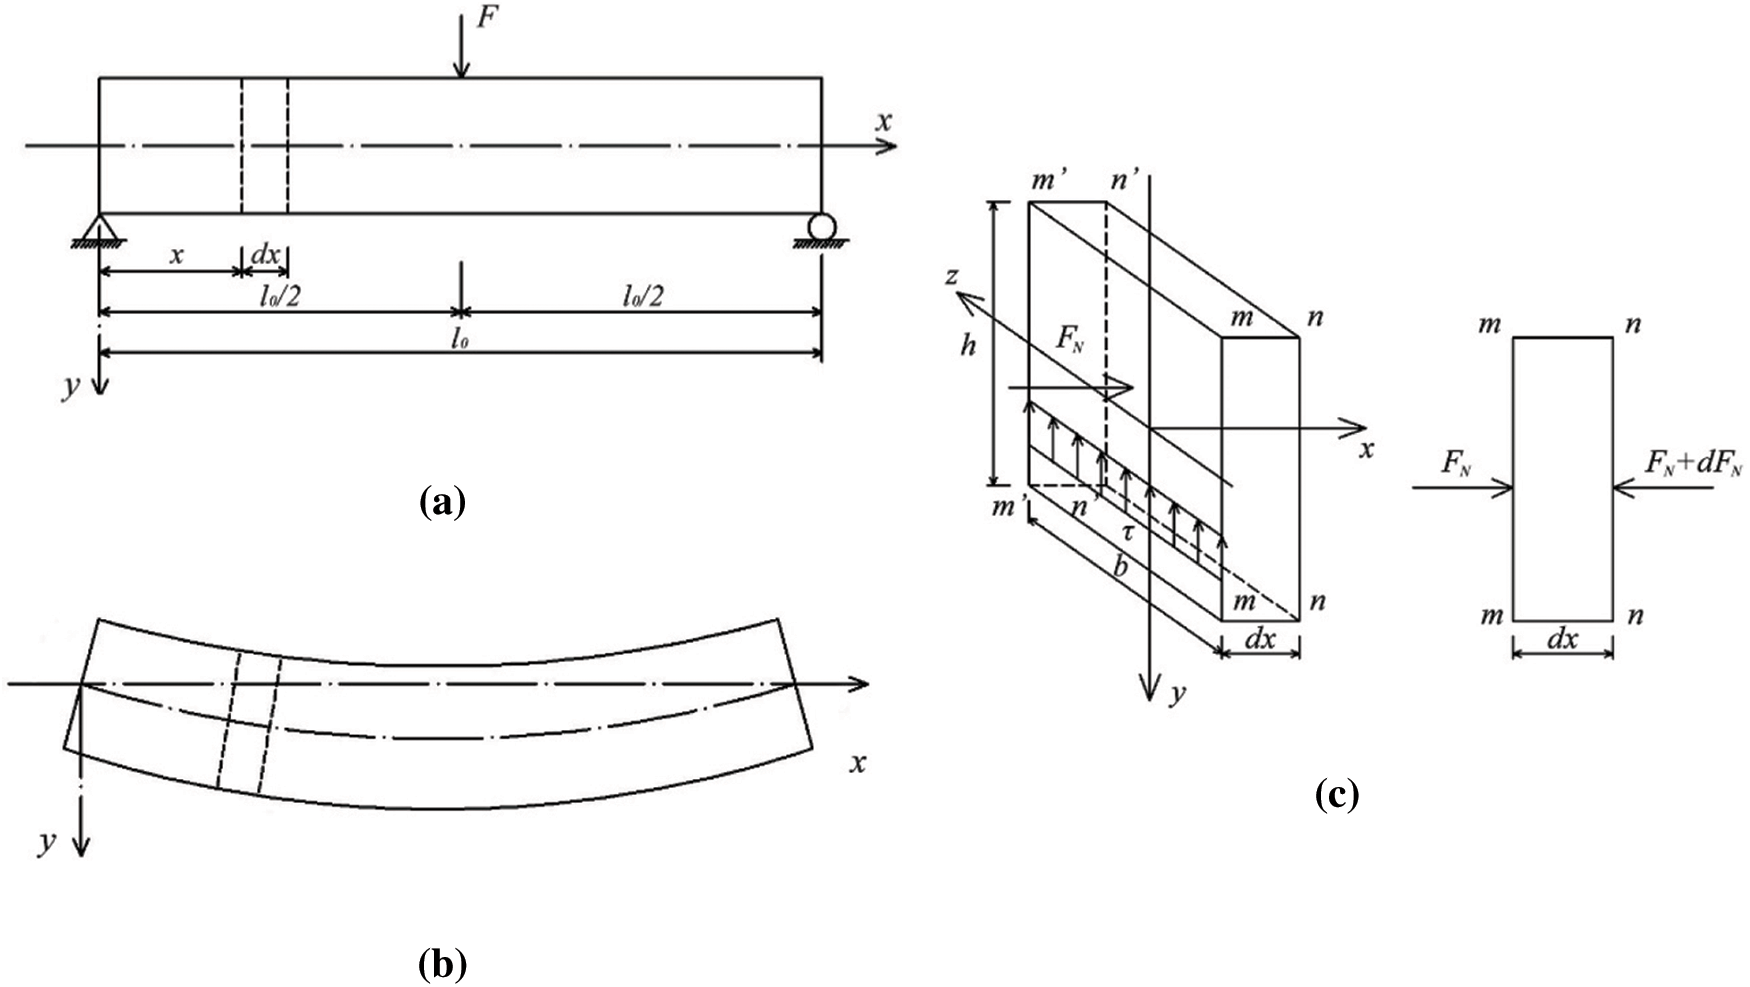
Figure 4: Force analysis of element body (a) Integral beam member (b) Micro-deformation of beam member (c) Force analysis of element body
The shear stress in the element body is
The shear stress calculation is in two parts by the section height y1:
a) When h2 + h3 ≤ y1 ≤ h, FN = bσce(h − y1). In this case, the shear stress is
b) When 0 ≤ y1 ≤ h2 + h3,
When
(1) Three-point bending mode
Fig. 3a shows the bending moment of the integral beam diagram under the action of the mid-span concentrated load, where: the maximum elastic bending moment is
The load-deflection relationship is in the following two situations depending on the load F:
a) When
According to the diagram multiplication method, it can be known
(b) When
Taken together,
(2) Four-point bending mode
Fig. 3b illustrates the bending moment diagram of the integral beam under two-point loading. The load-deflection relationship is in the following two situations depending on the load F:
a) When
According to the diagram multiplication method, it can be known that
(b) When
2.2.3 Section Height-Strain Curve
The section height-strain curve is divided into two stages, namely elastic stage and elastic-plastic stage. At the elastic stage, the height of the neutral axis remains constant. However, the neutral axis drops gradually at the elastic-plastic stage and the extent of the decrease is related to the yield strength σte in tensile zone.
a) Elastic stage
The slope of the curve is
At this moment, the neutral axis is located at h/2 and remains constant with the load.
b) Elastic-plastic stage
The slope of the curve is
As the load increases, the neutral axis moves downwards from the h/2 by an extent of:
To verify the accuracy of the theoretical derivation, test of the beams was performed under the four-point bending test.
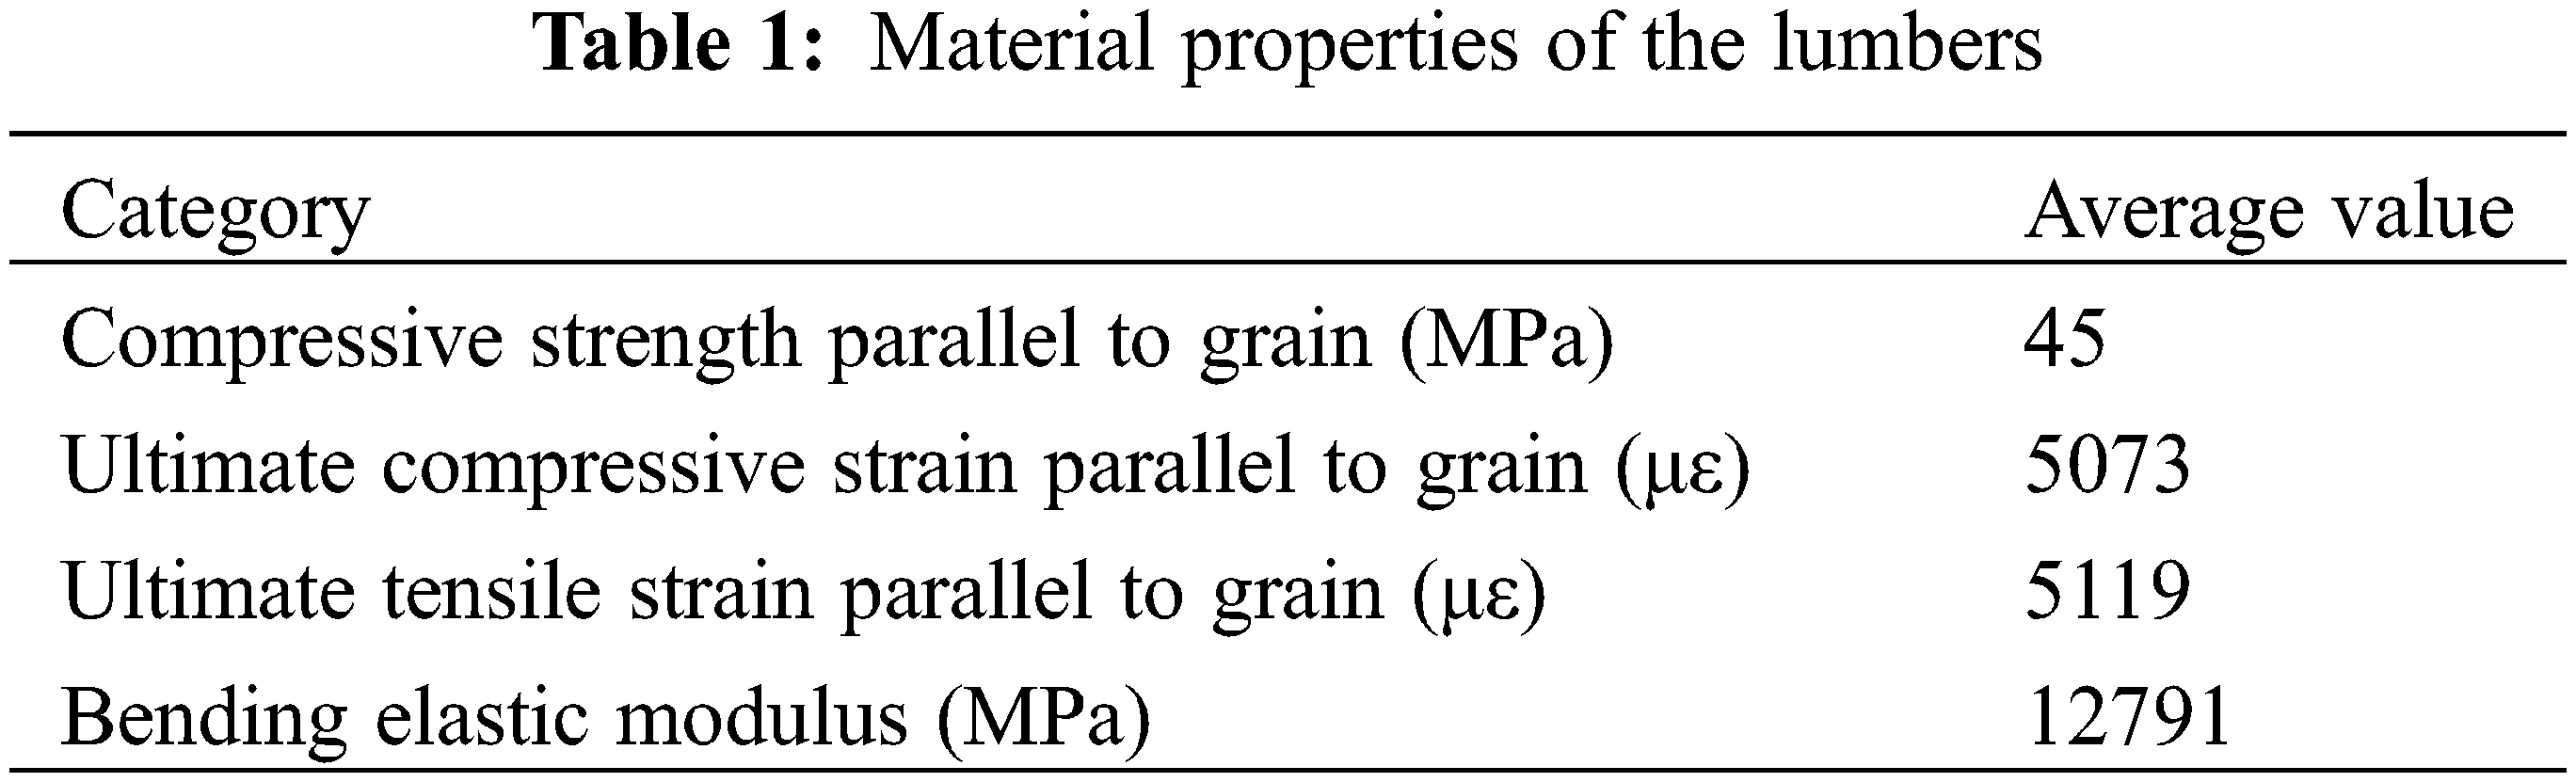
Larix olgensis Henry lumber was adopted as the raw material for glulam beam with a density of 0.67 g/cm3 and a moisture content of 11.23%. Lumber grade was determined as IIa, in accordance with the visually stress-graded method in the Chinese Standard for Design of Timber Structures (GB 50005-2017) [48]. The material property test of the Larix olgensis Henry lumber was conducted in accordance with Standard Test Methods of Static Tests of Lumber in Structural Sizes (ASTM D198-15) [49], Method of Testing in Compressive Strength Parallel to Grain of Wood (GB/T 1935-2009) [50], Method of Testing in Bending Strength of Wood (GB/T 1936.1-2009) [51], and Method for Determination of the Modulus of Elasticity in Static Bending of Wood (GB/T 1936.2-2009) [52]. The average material parameters obtained from the material property tests are summarized in Table 1.
Three glulam beams were designed as rectangular sections, which constituted one specimen group named EXP. The outer sections of all specimens were of the exact dimensions: beam length l of 2900 mm, span length l0 of 2700 mm, height h of 150 mm and width b of 100 mm. Fig. 5 shows the section of the specimens.
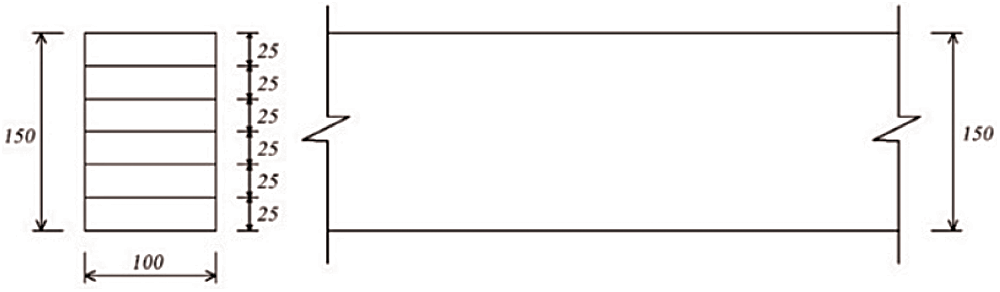
Figure 5: Specimen section (mm)
Specimens were manufactured by Anhui Golden Pastoral Wood Manufacturing Co., Ltd. at a controlled indoor temperature of 25°C–27°C and humidity of 53%–57%. The raw materials were firstly dried to a moisture content below 12% and then sawn, shaped, glued, and subjected to cold-press adhesion and maintenance. The glue used was one-component polyurethane, with glue spread of 200 g/m2. The glue line thickness was less than 0.2 mm and the continuous glue line was left exposed for only less than 20 min. Then the glued lumbers were pressed under 1–1.5 MPa. After gluing and pressing, the glulam lumbers were stacked and stabilized for at least 7 days before cutting to the tested beams.
3.3 Testing Scheme and Loading Scheme
The simply supported glulam beam was tested as shown in Fig. 6. A four-point bending experiment was conducted using an electronic universal testing machine. The beams were positioned horizontally on the loading test equipment parallel to the grain. In order to detect the strain change at the mid-span position of the specimen during the whole process of loading, five strain gauges were attached equal intervals at the midspan of the beam along the height direction. These gauges were numbered as 1 to 5 from top to bottom respectively with the length direction parallel to the grain. The deformation of the beam was recorded by seven LVDTs (linear voltage displacement transducers) with a precision of 0.001 mm. LVDT1 and LVDT7 were used to measure the deformation of the support ends, and LVDT4 was used to measure the deformation of the middle of the span. All LVDTs were uniformly arranged. The hydraulic jack and all the displacement sensors were calibrated before formal loading to ensure the reliability and authenticity of the test data. The hydraulic jack applied the load with a maximum load of 100 kN. All test data was acquired by Donghua static data acquisition system. A steel plate with a dimension of 160 mm × 160 mm × 15 mm was placed at the support below the bottom surface of the glulam beam to prevent transversal compression failure of the wood [53].
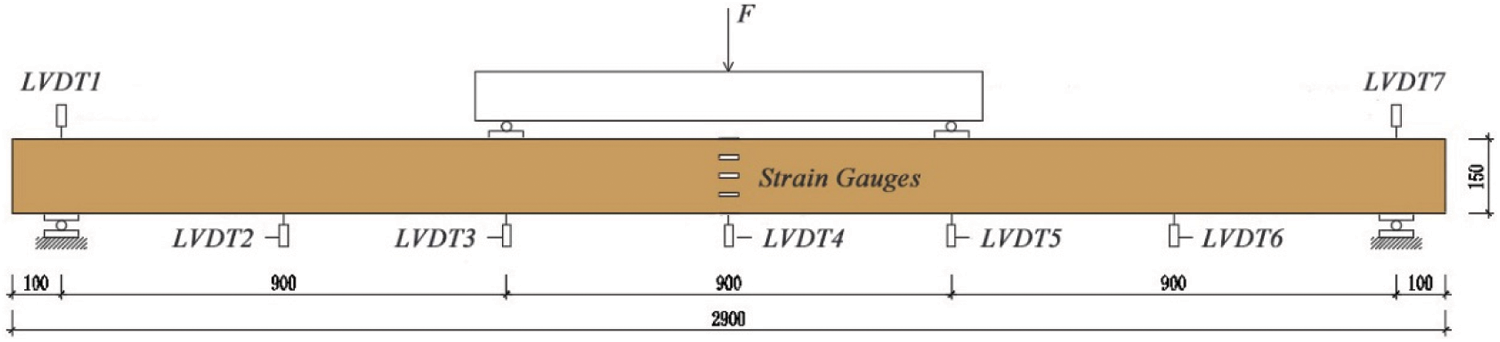
Figure 6: Loading device and test point arrangement of EXP (mm)
Loading procedure was designed in accordance with Standard Test Methods of Static Tests of Lumber in Structural Sizes (ASTM D198-15) [49]. Firstly, pre-loading of 1 kN was conducted on the specimens before the loading formally commenced to check whether the equipment could operate normally and minimize errors. During formal loading, each initial load increment was 0.1 kN and then 0.5 kN. After entering nonlinear stage, each load increment was 0.1 kN until the specimens failed. Then the test stopped when the specimen appeared obvious damage. The displacement readings from LVDT3 and LVDT5 were carefully observed at the pure bending section of the glulam beams during the loading process, monitoring whether the forces were balanced in real time to avoid the occurrence of tilting phenomenon. The failure and expansion at the sites of displacement sensors arranged in LVDT2, LVDT6, LVDT3 and LVDT5 were recorded in the meantime.
3.4 Experimental Result and Analysis
All the specimens underwent brittle failure as shown in Fig. 7. At the initial stage of loading, glulam beams were within elastic range. As the load increased, the specimens gradually appeared slight deformation. After the load reached about 70% of the ultimate load, the deflection developed rapidly and mild cracks were observed in the tensile zone with the sound of wood fiber tearing. When the applied load reached the ultimate load, the specimens underwent brittle failure, accompanied by a loud bang. The failure zone was a fracture at the specimen bottom and in the mid-span of the beams.
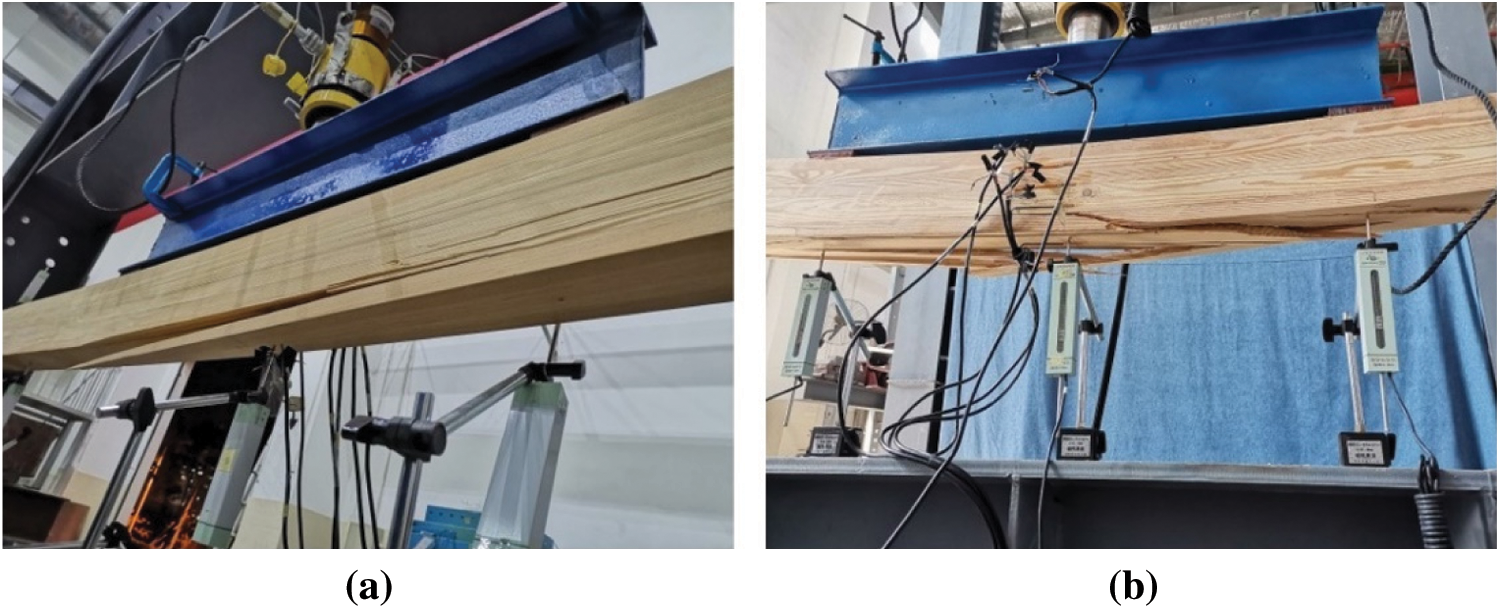
Figure 7: Failure modes of the test specimens (a) Fracture at the bottom of EXP-A (b) Fracture at the bottom of EXP-C
3.4.2 Load-Deflection Curve and Main Parameters of the Test
Since the dispersion of the test results is small, the three specimens are sufficient to respond to the relevant laws. Fig. 8 and Table 2 compare the experimental curves with the theoretical results. The ultimate deflection yu is obtained from Eq. (11) and the ultimate bearing capacity of the beam Fu is obtained from Eq. (15):
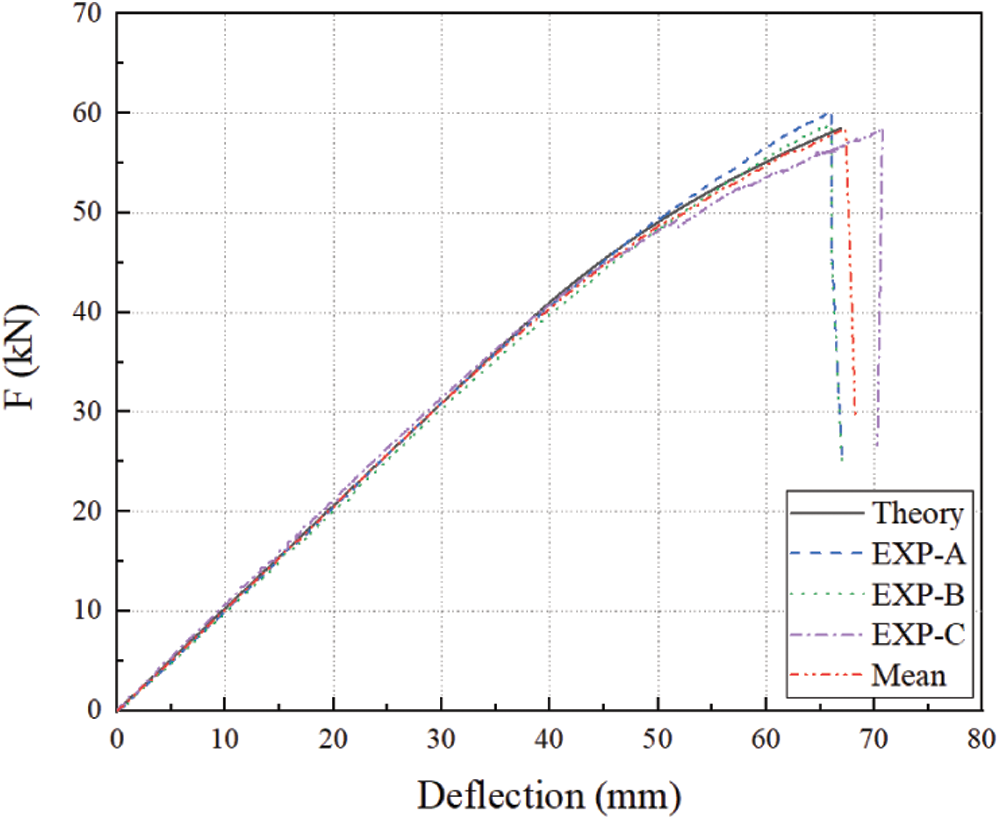
Figure 8: Load-deflection curves of tested specimens
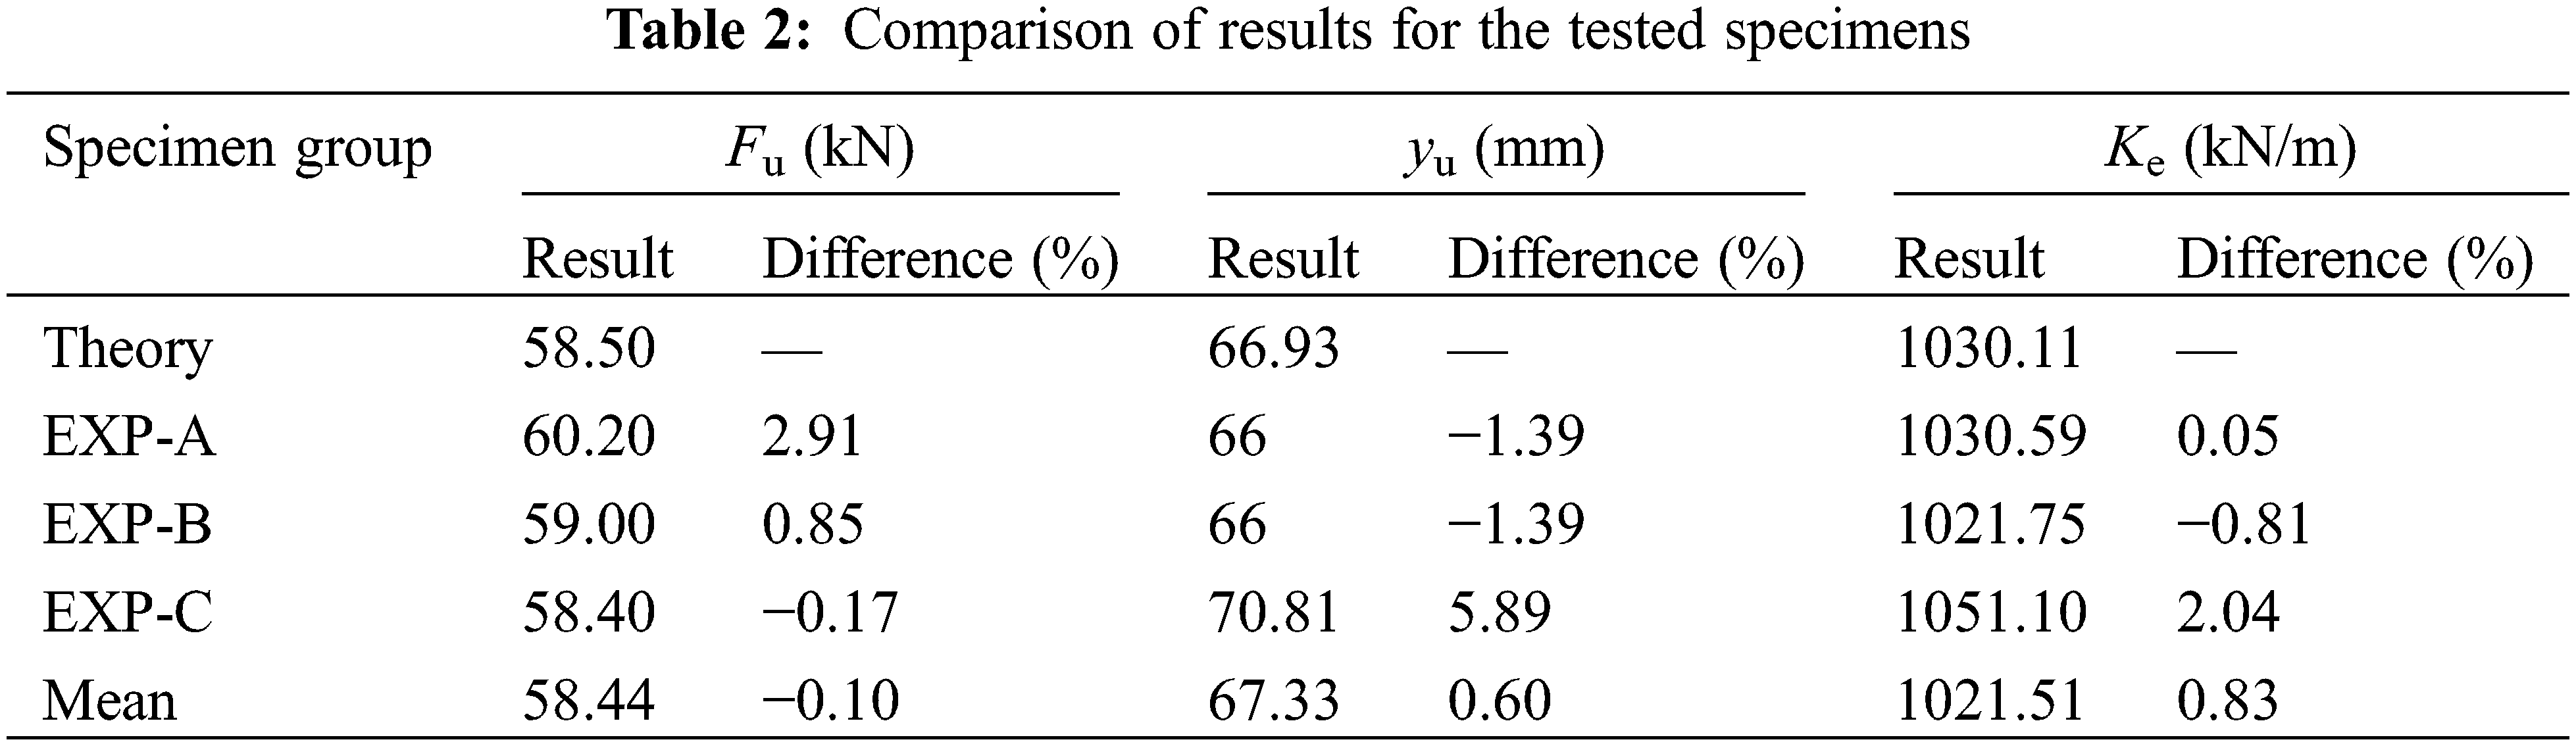
EXP specimens have similar load-deflection curve shapes: At the initial loading stage, the curves show linear changes, and the slopes of the linear portions are identical. Then the curves show a nonlinear increase as the load increases, with the deflection rising progressively at an accelerated rate. On reaching the ultimate load, the specimen fails, and the deflection decreases suddenly. In accordance with Table 2, the main parameters agree well with those from experimental results. Due to differences in material properties, there are differences of less than 6%, indicating that the proposed theory accurately reflects the actual situation.
3.4.3 Variation of the Strain at Different Section Height
Fig. 9a shows the load-strain curves obtained from tests at each measuring point. Taking EXP-C as an example, the load-strain curves show a linear change at the initial loading stage, while the strains change non-linearly after the applied load reaches about 70% of the ultimate load.
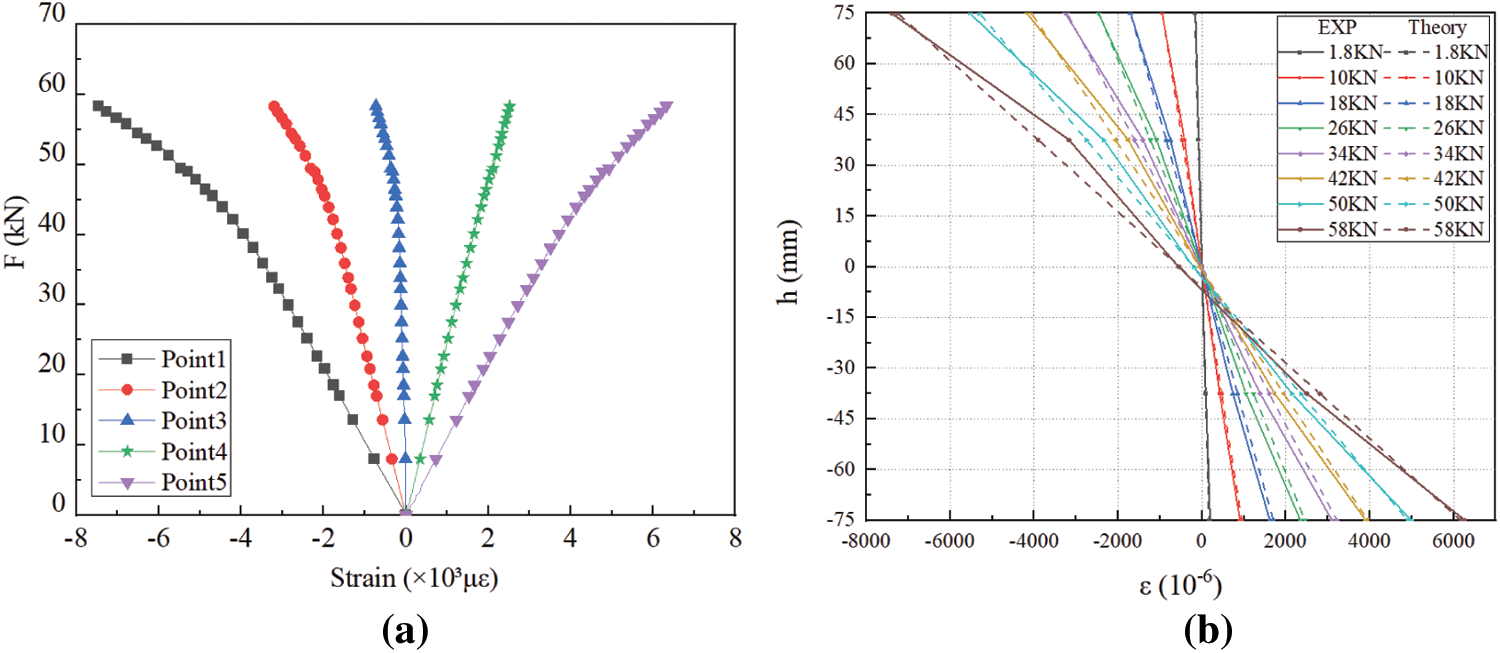
Figure 9: Strain curves from EXP-C testing (a) Load-strain curve (b) Section height-strain curve of the test specimen
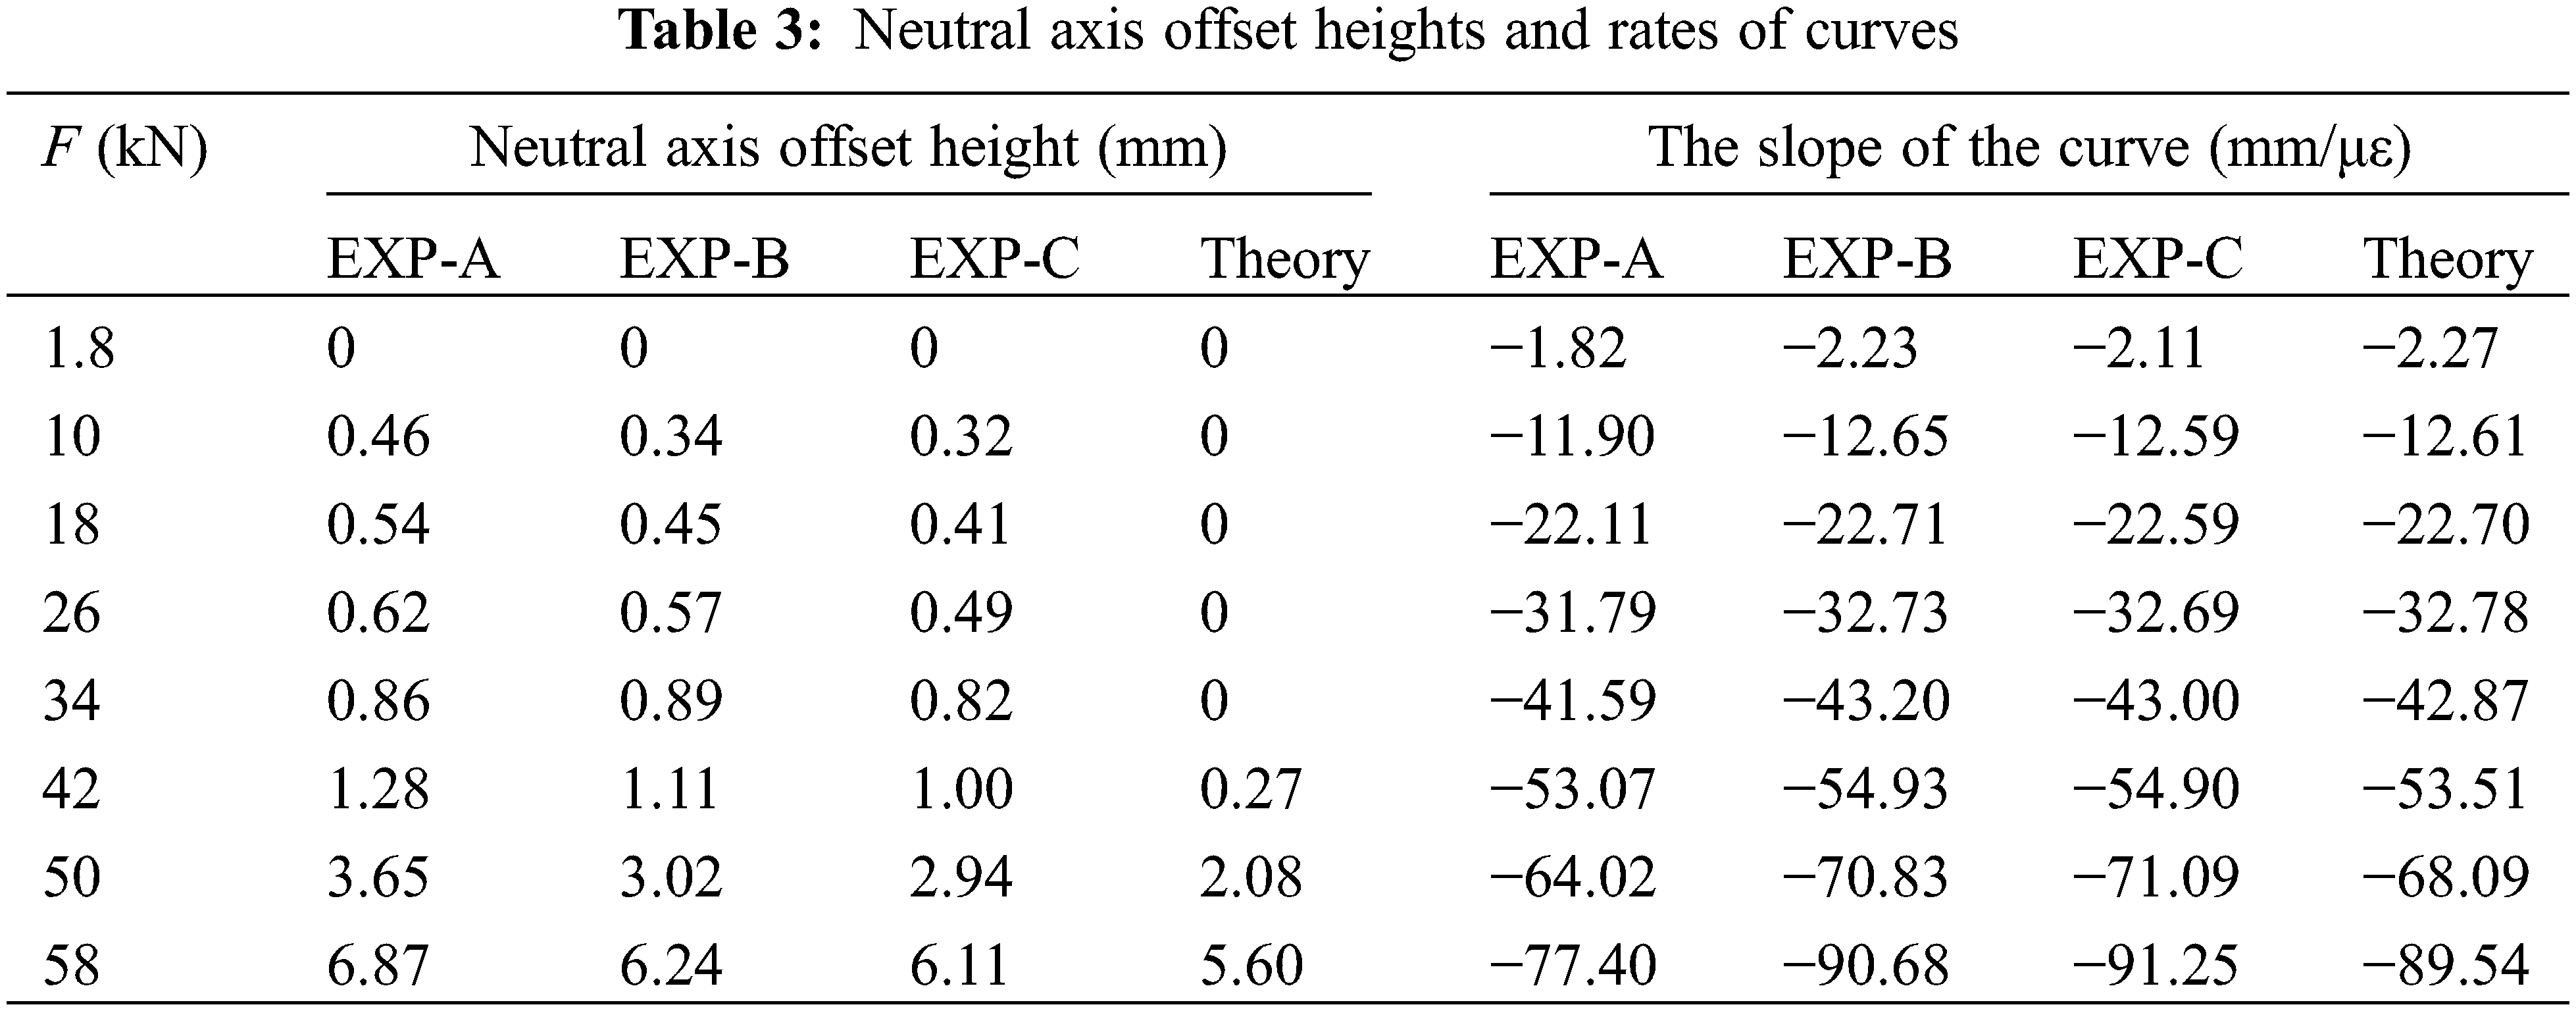
The comparison of the mid-span section height-strain curves at the five measuring points and the corresponding curves obtained from calculation using Eqs. (13)–(15) are shown in Fig. 9b. Taking the group EXP-C as an example, the experimental curves showed a linear change and agree with the calculations, with a nearly straight line under the same load. However, as the applied load approaches the ultimate load, the experimental curve deviated slightly because of appearance of cracks. It is still assumed that the strain distribution in the specimen under loading satisfies the plane-section assumption. The theoretical values of the neutral axis offset height and the slope of curve are compared against the corresponding experimental values, as shown in Table 3. A good agreement exists between such values. The neutral axis is at h/2 in elastic stage, and the neutral axis begins to move downwards as the specimen enters the elastic-plastic stage until failure, which is consistent with proposed assumptions.
3.4.4 Comparison with Other Experiments
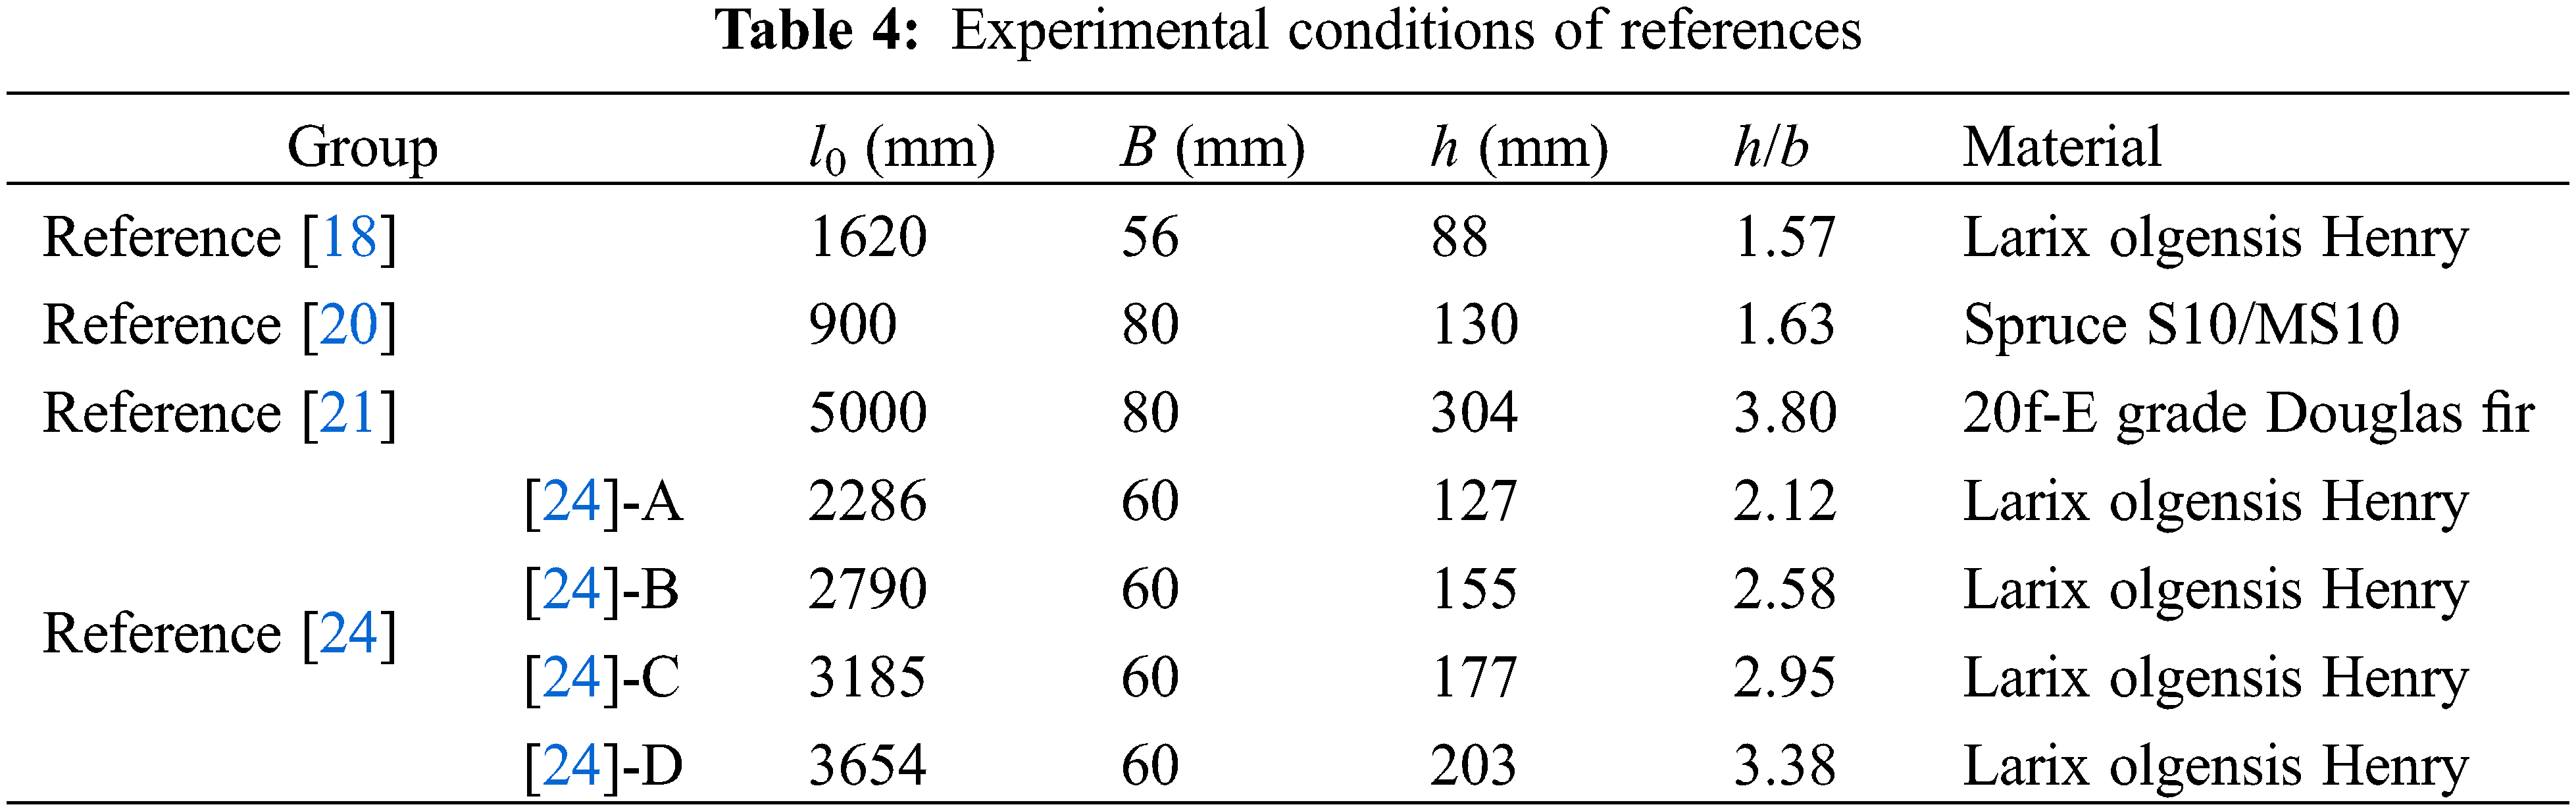
In order to further verify the accuracy of the theoretical equations, the experimental results reported by previous studies [18,20,21,24] were theoretically analyzed under corresponding conditions. The experimental conditions are shown in Table 4, including different section sizes, span lengths and different materials.
The bending performance parameters of the above specimens are obtained from theoretical calculation. The ultimate load Fu and its corresponding maximum deflection yu are compared as shown in Fig. 10, and the load-deflection curves are compared as shown in Fig. 11. It can be found that the theoretical curves agree well with experimental results. Due to the size effect of glulam, there exist differences within 20% in the value, which is acceptable completely. In particular, the load-deflection curves of groups with large aspect ratio are highly consistent, which have differences of less than 5%. It can be concluded that the proposed theoretical equations can accurately predict the failure of glulam beam in elastic-plastic stage, and are suitable for glulam beams with different section sizes and materials.
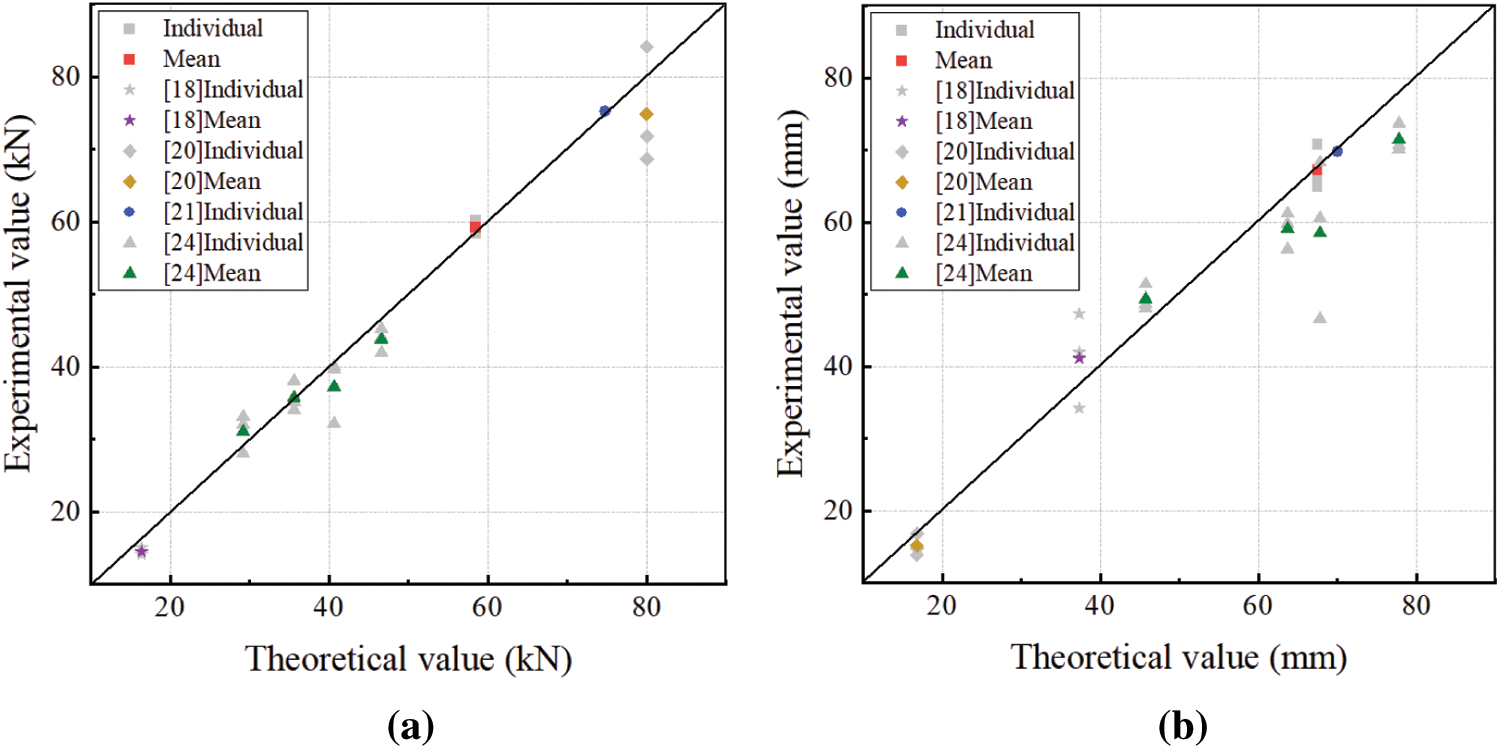
Figure 10: Comparison of bending performance parameters (a) Comparison of ultimate bearing capacity (b) Comparison of ultimate deflection
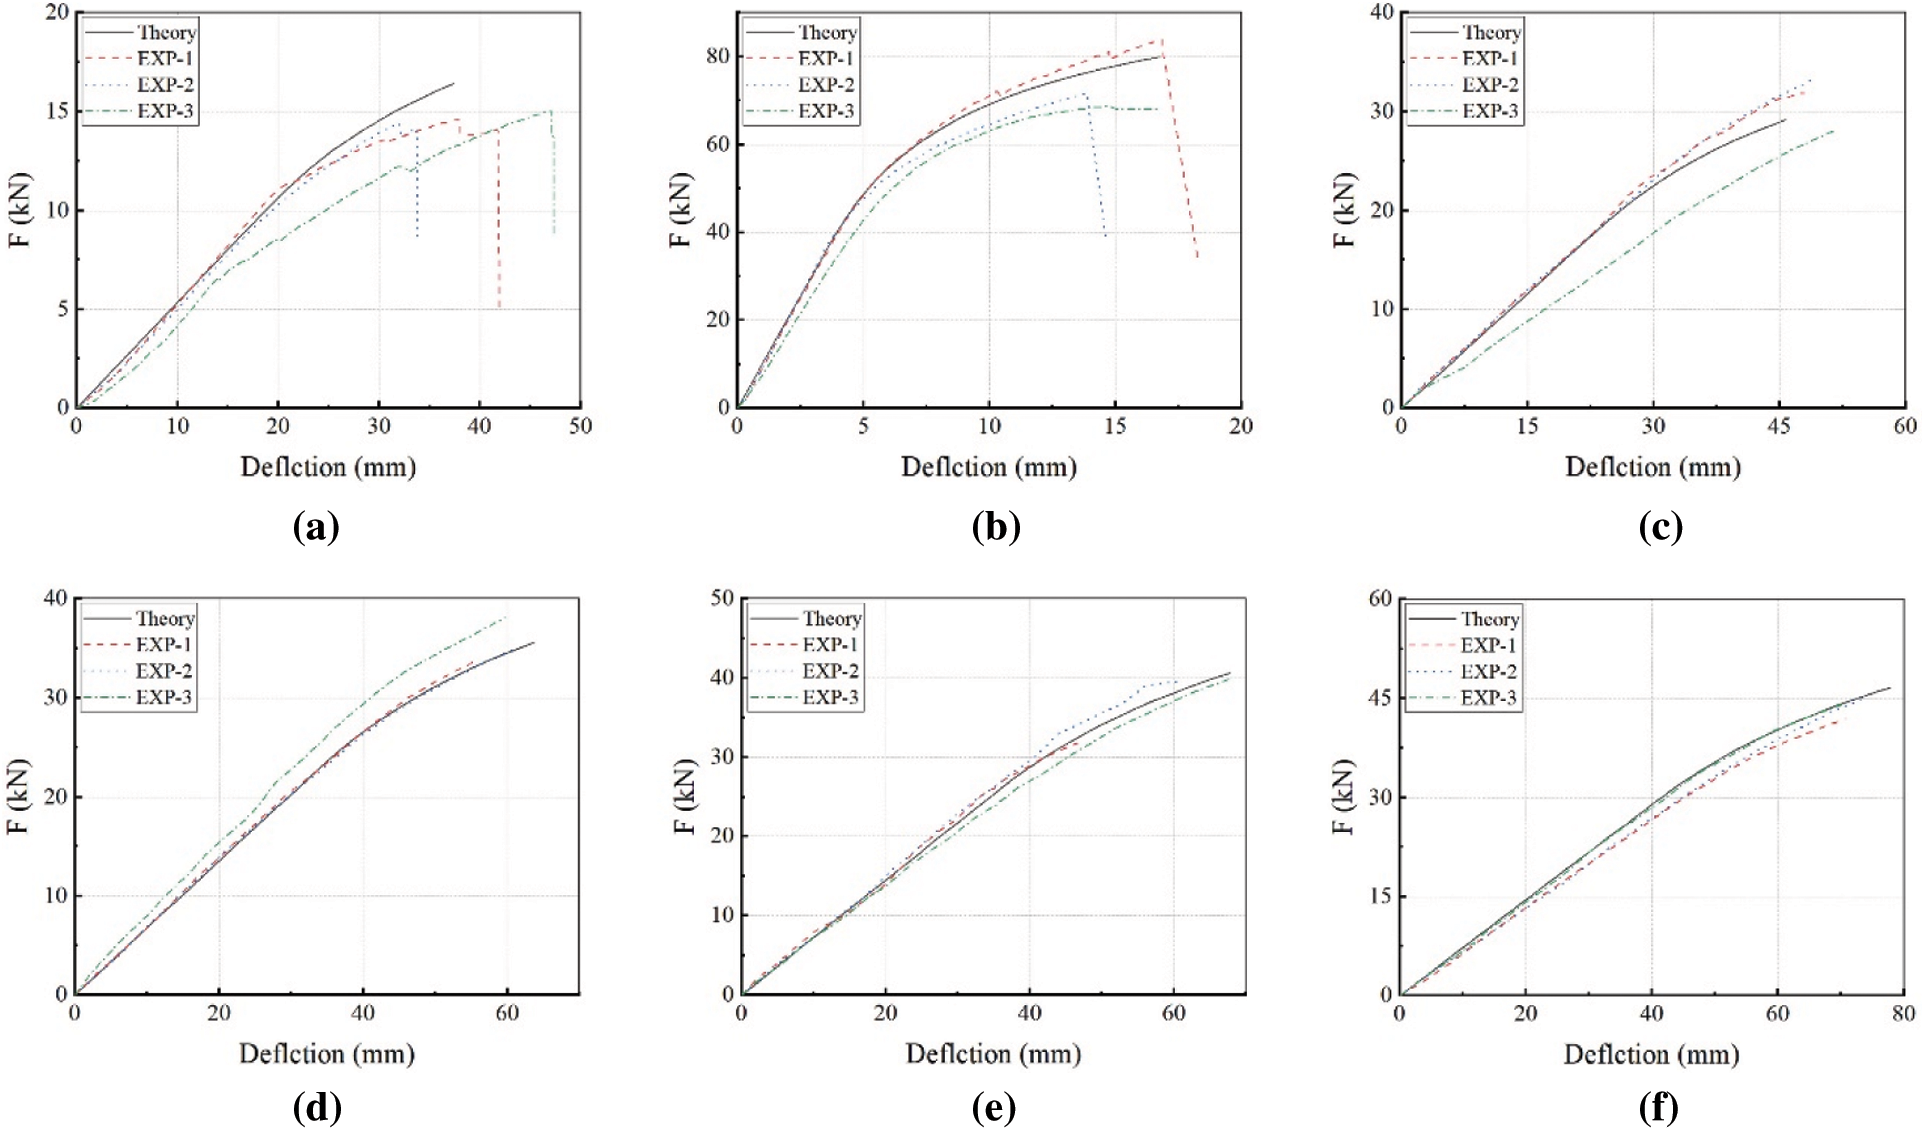
Figure 11: Comparison of load-deflection curves (a) Reference [18] (b) Reference [20] (c) Reference [24]-A (d) Reference [24]-B (e) Reference [24]-C (f) Reference [24]-D
4.1 Development of Finite Element Models
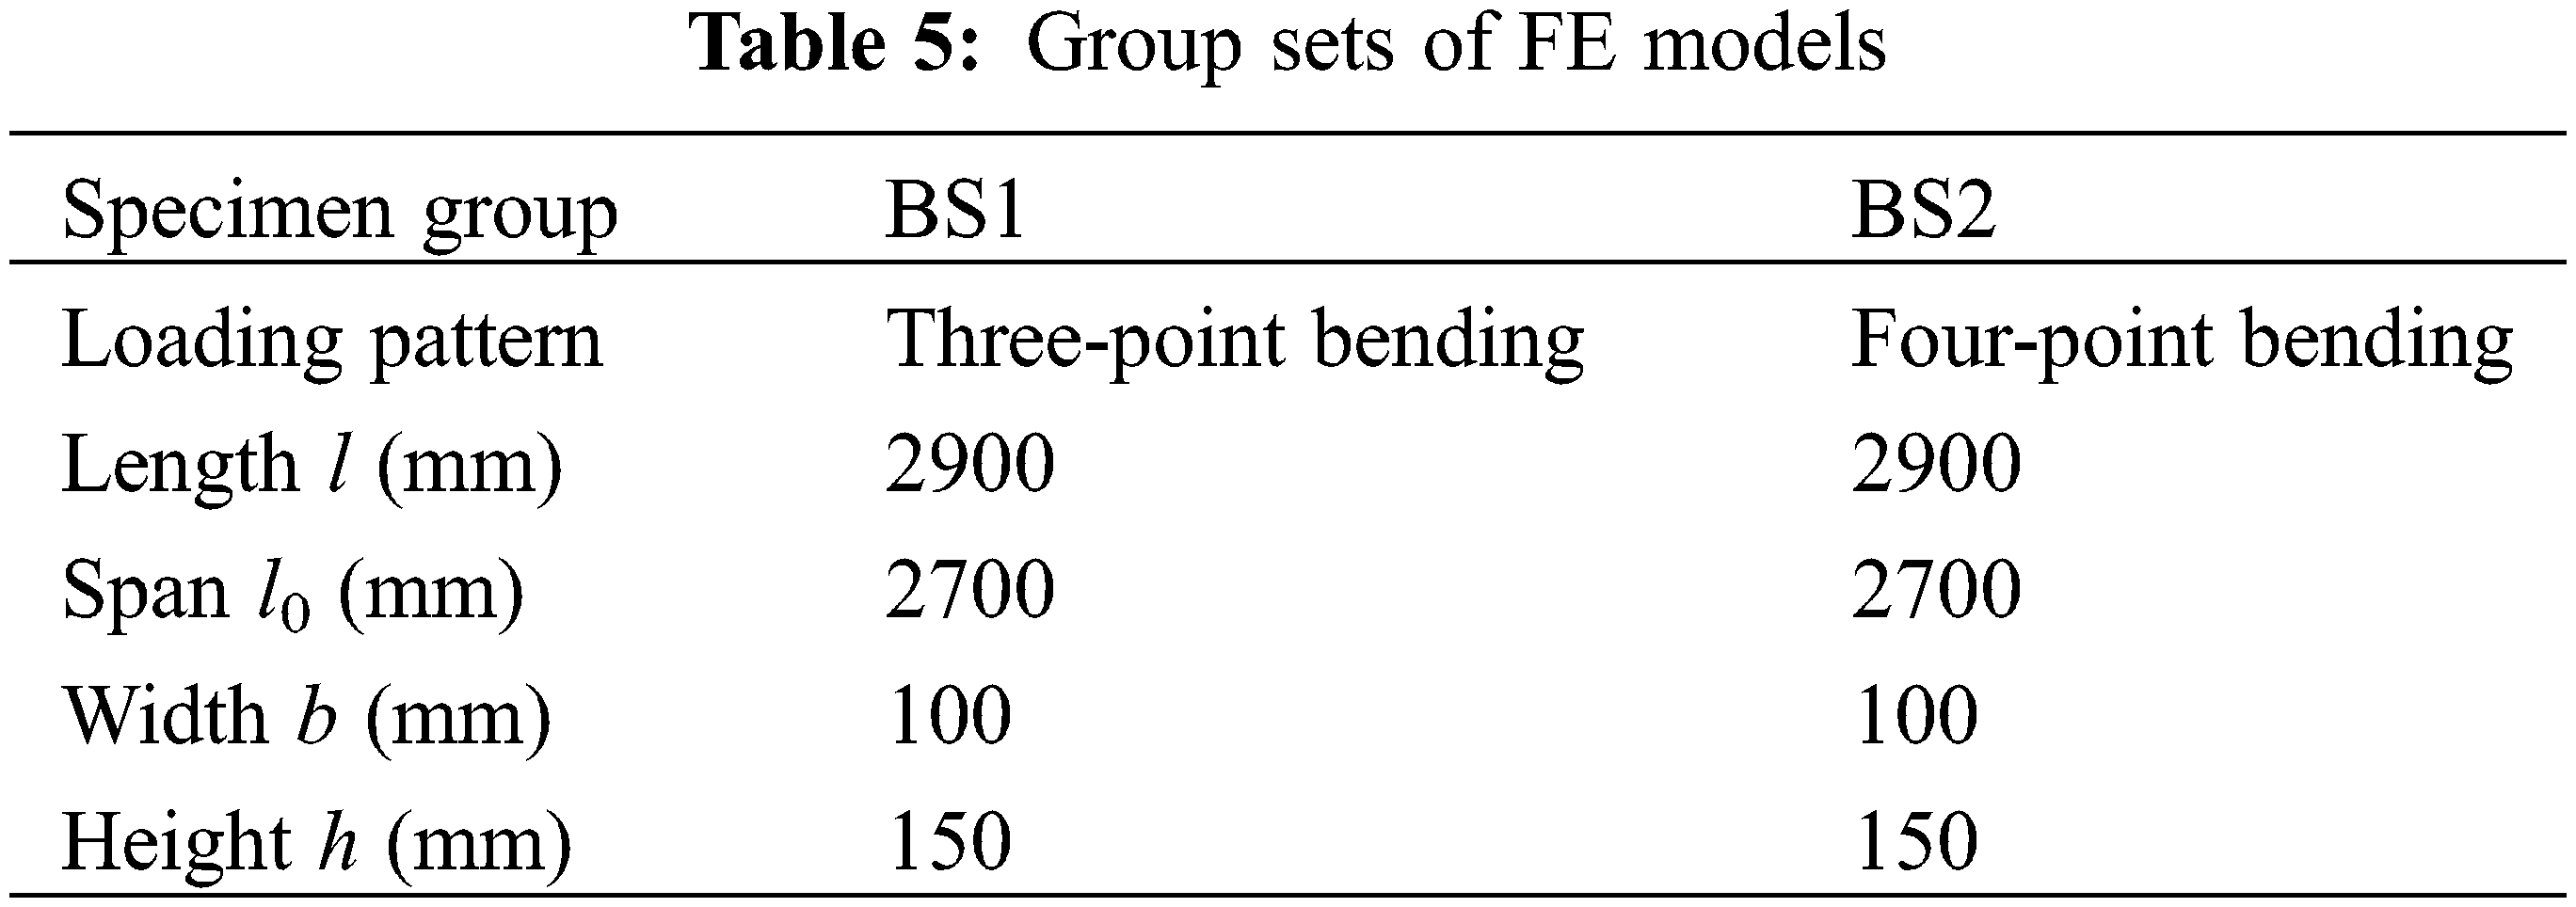
3D finite element models (FEM) of the specimens were established using the simulation software ABAQUS. Depending on the tensile and compressive stress-strain relationship and the loading mode, innovative nonlinear elastic-plastic FE models were established and named BS1-BS2, respectively. Specimen groups BS1-2 were configured conform to the theoretical assumption (3): A dividing plane was set up at h/3 from the bottom to analyze the constitutive relation under compression and tension, considering both the position of neutral axis and convenience of calculation. Above this dividing plane was the elastic-plastic zone (subdivided into elastic and plastic stages) while the below was the elastic zone (elastic stage only). The different material parameters were assigned to those two regions. Table 5 summarizes the details of such FE models developed in this paper with material of Larix olgensis Henry lumber. The material of FE models was fixed to be anisotropic and the parameters were determined in accordance with the results obtained from the material property tests from Section 3.1. The Hill yield criterion was used to consider the plasticity of the timber [54] and Table 6 summarizes the details of mechanical properties of glulam. Part of such values were estimated by following equations [41] and Poisson’s ratios in different directions were obtained in accordance with reference [55]:
where: EL is elastic modulus presented from the test and G is shear modulus; L, R and T represent longitudinal, radial and tangential directions, respectively.
The boundary condition at the end of the beam model was set as simply support and the loading mode is two-point loading, as shown in Fig. 12. In accordance with the constraint condition of bending test, one of contact points at the bottom of the beam was fixed with constraints in x, y and z directions, and the other was y and z directions. The mesh size was fixed as 10 mm after the sensitive analysis. Load was applied to the top of the beam as the same load location in the theory and the load-deflection curves were calculated based on the arc-length method in ABAQUS.
Figure 12: Modeling details
4.2 Results of the Finite Element Analysis
The finite element analysis (FEA) results of two specimen groups are compared against the theoretical values, as shown in Fig. 13. The simulated load-deflection curves agree well with those calculated by the theoretical approach. The curves have a linear change at initial stage. As the load increased to about 70% of the ultimate load, the beams enter elastic-plastic stage accompanied by a reduction in stiffness and the change is nonlinear on the curves.
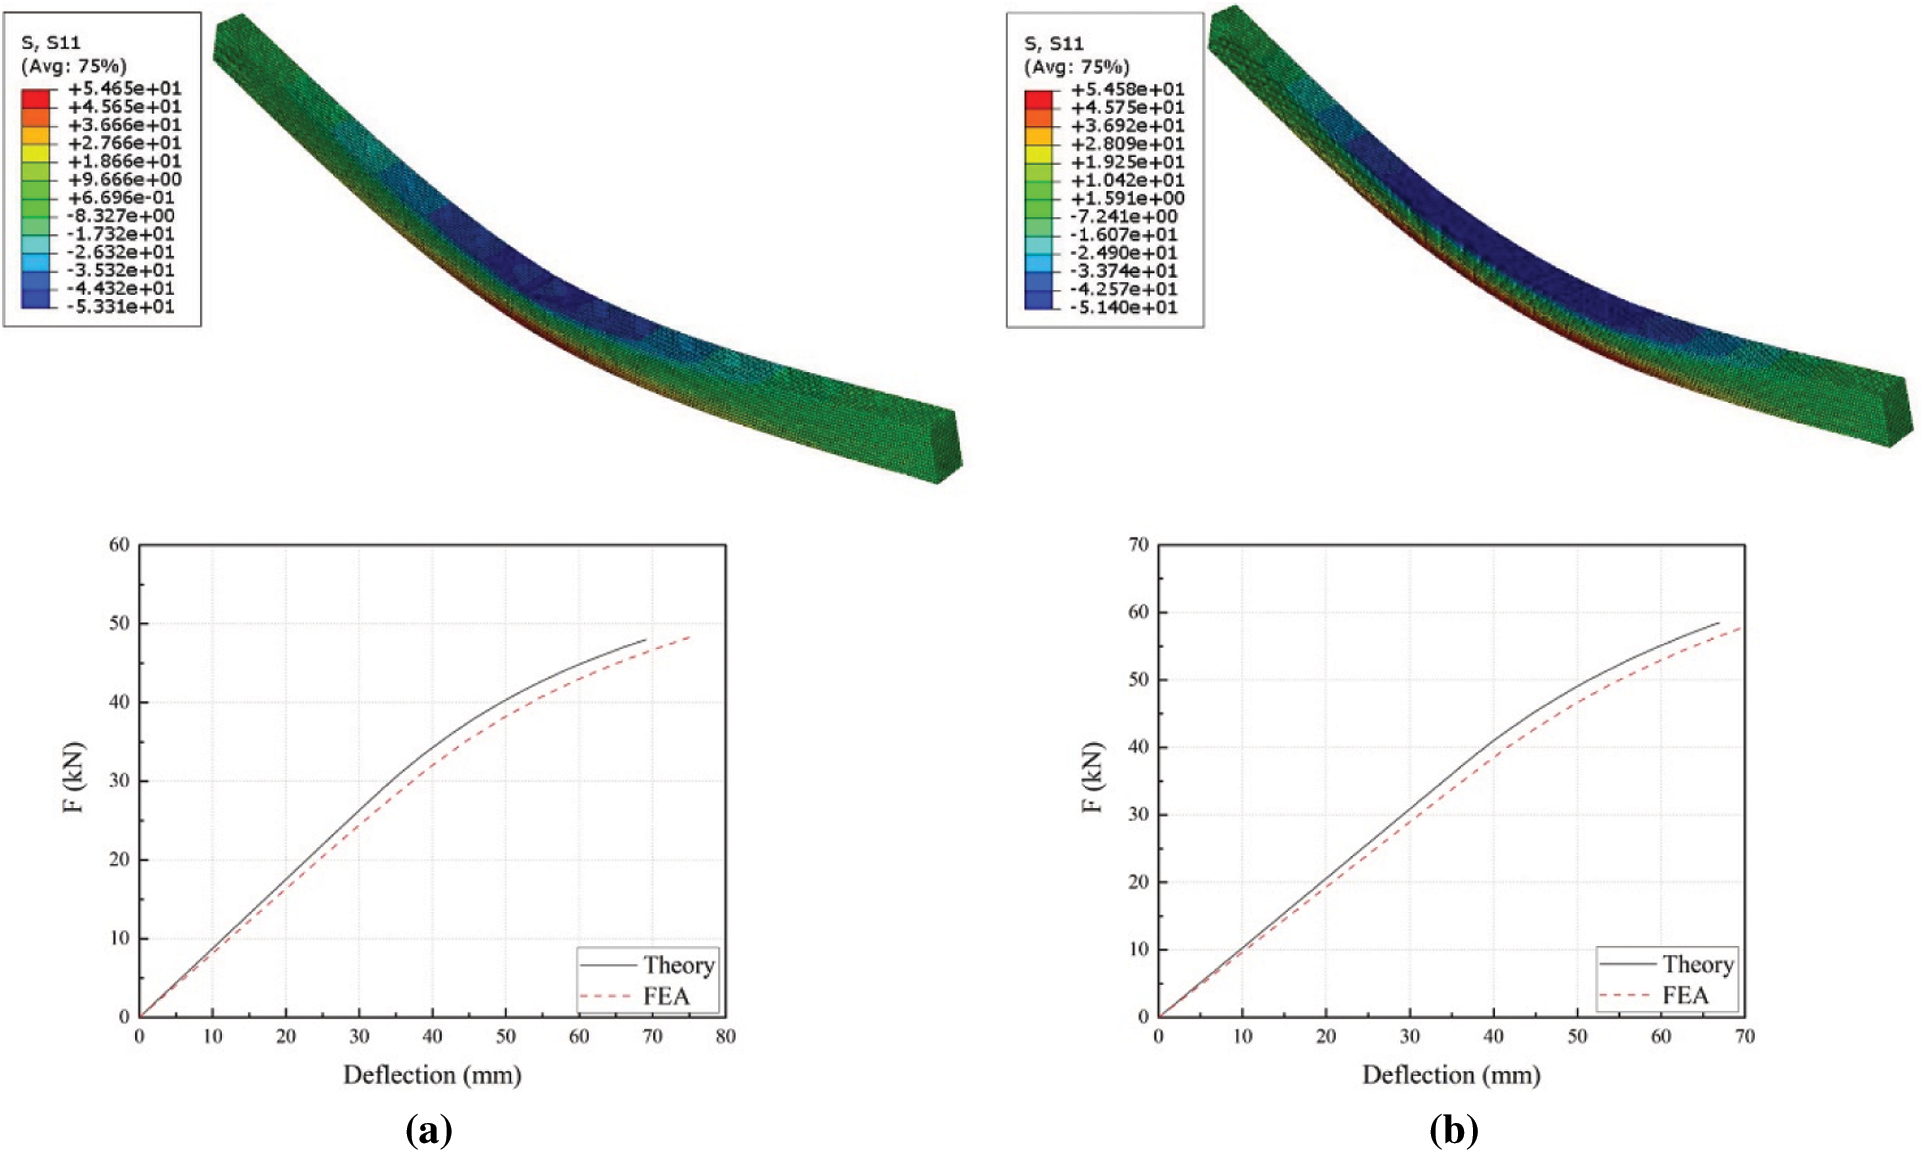
Figure 13: Stress distributions and simulated load-deflection curves (a) BS1 (b) BS2
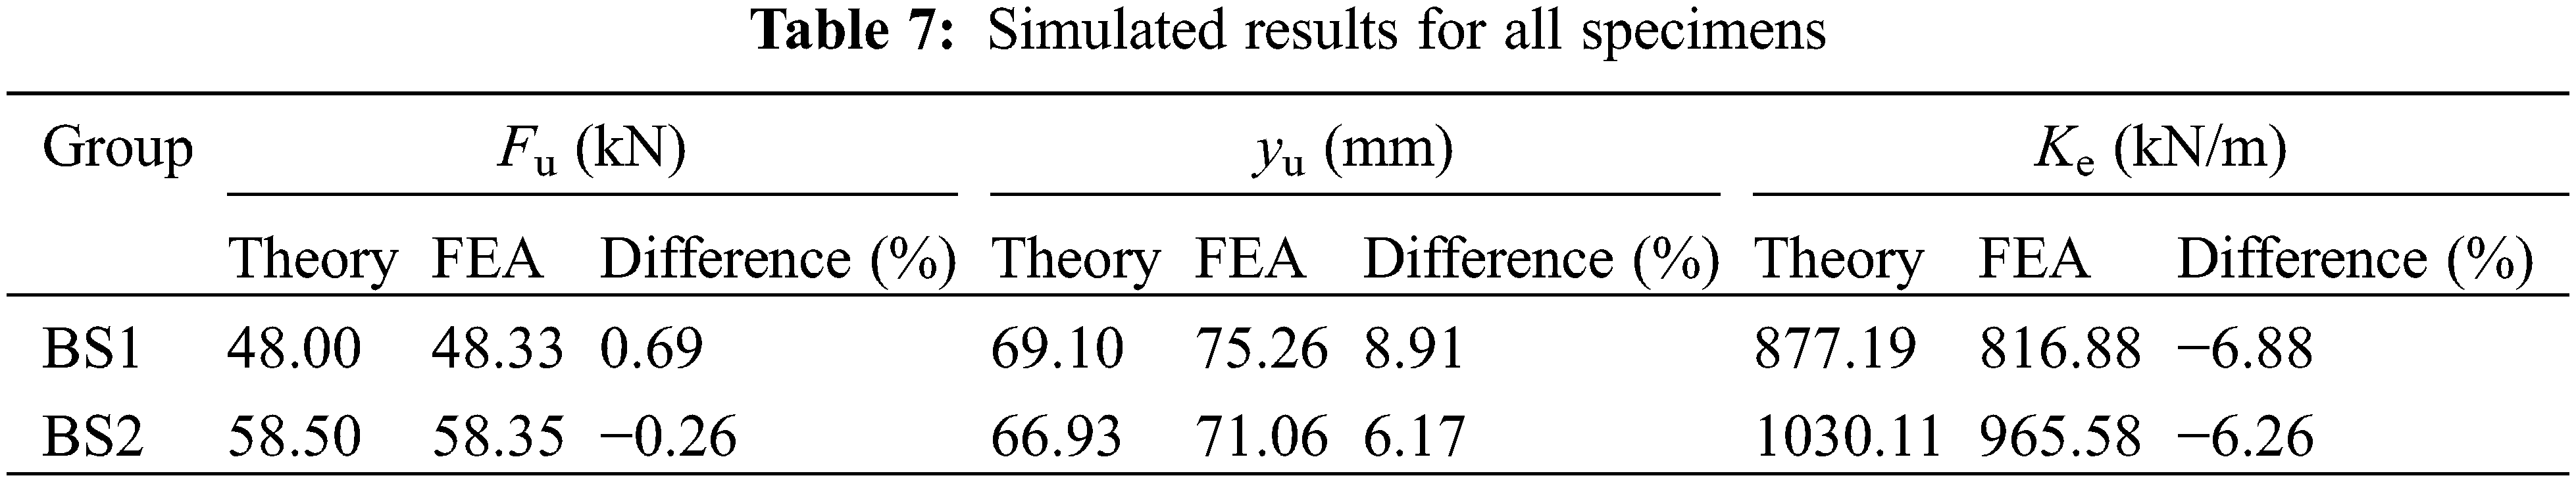
Table 7 compares the ultimate load Fu and the elastic stiffness Ke obtained from numerical simulation and theoretical calculation in the two groups of specimens. Based on theoretical analysis and the actual situation, the ultimate tensile strength of specimens is fixed as 80 MPa. In the simulation, the dividing plane is set up at h/3 from the bottom while the position of the neutral axis is changing all the time in practice so only the results before reaching the maximum deflection as estimated by theoretical calculation are compared. Combining with the experimental results shown in Table 2, it can be concluded that the FEA results agree well with the theoretically calculated results and the experimental results with a difference of below 10%. Therefore, the theoretical derivations are plausible for numerical simulation under the corresponding situations ignoring the influence of mechanic properties in radial and tangential directions.
4.2.2 Shear Stress Distribution
After the beams entered elastic-plastic stage, the shear stress can be calculated from Eq. (8). Fig. 14 shows the shear stress distribution in the midspan section and the shear stress-load curve of BS1. For the full elastic specimens, the shear stress increases linearly with the load. For the BS1, the curves coincided with those of the fully elastic specimens at elastic stage. After entering elastic-plastic stage, the shear stress curves show a nonlinear increase. Comparison of shear stress vs. height curves in elastic-plastic stage is shown in Fig. 14. The numerical simulation agrees well with theoretical calculation results, which exists acceptable differences. Moreover, the maximum shear stress occurs slightly below the neutral axis and the maximum position moves downwards continuously with the increasing load, which agrees with the assumptions. Based on the above, it is noted that the calculations using equations established in the present study agree with the FEA results and the equations have high accuracy.
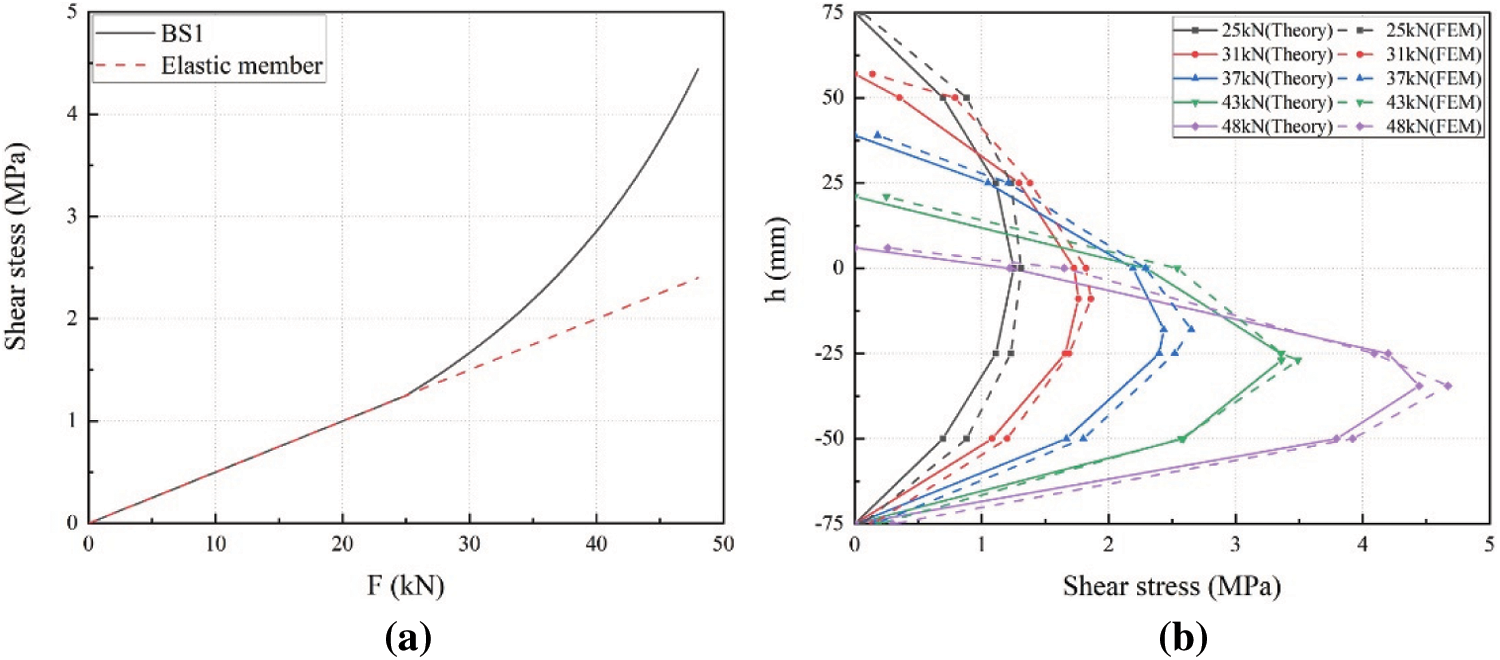
Figure 14: Shear stress distribution curves (a) Shear stress-load curve (b) Shear stress distribution of the midspan section
This paper presents theoretical and numerical study of stiffness and shear stress distribution of glulam beams in elastic-plastic stage, and the main conclusions are as follows:
(1) Combined with a suitable stress-strain relationship model of wood, the bending failure modes of the glulam beams in elastic-plastic stage were divided into two situations. The deflection and shear stress calculation equations of different failure modes were established, and the movement of the neutral axis was estimated, which can predict the failure of glulam beams in elastic-plastic stage closely ignoring the influence of mechanic properties in radial and tangential directions.
(2) Finite element models were established for each of the two failure modes, comparing the load-deflection relationship and shear stress distribution. Results show that the calculations obtained from the proposed equations have a good agreement with the numerical results.
(3) Four-point bending tests were conducted investigating the stiffness and shear stress distribution of glulam beams in elastic-plastic stage under assumed conditions, and main parameters corresponding to the failure modes were calculated by applying the theoretical equations. Theoretical results are in good agreement with experimental results, indicating that the equations have high precision and conform to actual situations. Furthermore, the theoretical analysis of the corresponding conditions for different reference tests is carried out and compared with the experimental results. It can be concluded that the proposed method can accurately predict the failure of glulam beams in elastic-plastic stage, and are suitable for specimens with different section sizes and materials.
Funding Statement: The authors would like to acknowledge the support from High-Level Natural Science Foundation of Hainan Province of China (Grant No. 2019RC055), National Natural Science Foundation of China (Grant No. 51808176) and the Project Funded by the National First-Class Disciplines (PNFD).
Conflicts of Interest: The authors declare that they have no conflicts of interest to report regarding the present study.
References
1. Sun, X. F., He, M. J., Li, Z. (2020). Novel engineered wood and bamboo composites for structural applications: State-of-art of manufacturing technology and mechanical performance evaluation. Construction and Building Materials, 249, 118751. DOI 10.1016/j.conbuildmat.2020.118751. [Google Scholar] [CrossRef]
2. Bigot, D., Ott, C., Guichard, S., Damour, B. M. (2019). Feasibility of using wood chips to regulate relative humidity inside a building: A numerical study. Journal of Renewable Materials, 7(6), 505–516. DOI 10.32604/jrm.2019.04019. [Google Scholar] [CrossRef]
3. Jian, B. Y., Cheng, K., Li, H. T., Ashraf, M., Zheng, X. Y. et al. (2022). A review on strengthening of timber beams using fiber reinforced polymers. Journal of Renewable Materials, 10(8), 2073–2098. DOI 10.32604/jrm.2022.021983. [Google Scholar] [CrossRef]
4. Corradi, M., Mouli, V. C., Edmondson, V., Poologanathan, K., Nagaratnam, B. (2021). Local FRP reinforcement of existing timber beams. Composite Structures, 258, 113363. DOI 10.1016/j.compstruct.2020.113363. [Google Scholar] [CrossRef]
5. Cao, L., Chen, B. W. (2018). Research review on shear behavior of glulam. Engineering Mechanics, 35(6), 1–5, 14. [Google Scholar]
6. Asdrubali, F., Ferracuti, B., Lombardi, L., Guattari, C., Evangelisti, L. et al. (2017). A review of structural, thermo-physical, acoustical, and environmental properties of wooden materials for building applications. Building and Environment, 114, 307–332. DOI 10.1016/j.buildenv.2016.12.033. [Google Scholar] [CrossRef]
7. Shu, B. Q., Hong, L., Li, S. X., Tao, Y. P., Cui, J. X. et al. (2022). Study on the tangential tensile mechanical properties of moso bamboo. Journal of Renewable Materials, 10(8), 2203–2216. DOI 10.32604/jrm.2022.019882. [Google Scholar] [CrossRef]
8. Hurmekoski, E., Jonsson, R., Korhonen, J., Jänis, J., Mäkinen, M. et al. (2018). Diversification of the forest industries: Role of new wood-based products. Canadian Journal of Forest Research, 48(12), 1417–1432. DOI 10.1139/cjfr-2018-0116. [Google Scholar] [CrossRef]
9. Chanhoun, M., Padonou, S., Adjovi, E. C., Olodo, E., Doko, V. (2018). Study of the implementation of waste wood, plastics and polystyrenes for various applications in the building industry. Construction and Building Materials, 167, 936–941. DOI 10.1016/j.conbuildmat.2018.02.080. [Google Scholar] [CrossRef]
10. Liu, W. Q., Yang, H. F. (2019). Research progress on modern timber structures. Journal of Building Structures, 40(2), 16–43. [Google Scholar]
11. Wu, Y., Zhang, H. Q., Zhang, Y., Wang, S. Q., Wang, X. Z. et al. (2019). Effects of thermal treatment on the mechanical properties of larch (Larix gmelinii) and Red Oak (Quercus rubra) wood cell walls via nanoindentation. BioResources, 14(4), 8048–8057. [Google Scholar]
12. Yue, K., Cheng, X. C., Jia, C., Liu, W. Q., Lu, W. D. (2019). The influence of elevated temperatures on wood-adhesive joints by Fourier infrared spectrum analysis. Spectroscopy and Spectral Analysis, 39(10), 3179–3183. [Google Scholar]
13. Mirzaei, G., Mohebby, B., Ebrahimi, G. (2017). Glulam beam made from hydrothermally treated poplar wood with reduced moisture-induced stresses. Construction and Building Materials, 135, 386–393. DOI 10.1016/j.conbuildmat.2016.12.178. [Google Scholar] [CrossRef]
14. Yue, K., Song, X. L., Jiao, X. K., Wang, L., Jia, C. et al. (2020). An experimental study on flexural behavior of glulam beams made out of thermally treated fast-growing poplar laminae. Wood and Fiber Science, 52(2), 152–164. DOI 10.22382/wfs. [Google Scholar] [CrossRef]
15. Wang, X. R., Zhou, A. P., Zhao, L. L., Chui, Y. H. (2019). Mechanical properties of wood columns with rectangular hollow cross section. Construction and Building Materials, 214, 133–142. DOI 10.1016/j.conbuildmat.2019.04.119. [Google Scholar] [CrossRef]
16. Yang, R. Y., Hong, C. K., Zhang, X. F., Yuan, Q., Sun, Y. F. (2020). Experimental research on structural behaviors of glulam I-beam with a special-shaped section. Journal of Renewable Materials, 8(2), 113–132. DOI 10.32604/jrm.2020.08190. [Google Scholar] [CrossRef]
17. Zheng, T. T., Zou, L. X., Hu, Y. C. (2021). Short beam shear properties and failure modes of the wood-based X-type lattice sandwich structure. Journal of Forestry Research, 32(2), 877–887. DOI 10.1007/s11676-020-01137-3. [Google Scholar] [CrossRef]
18. Zhang, X. F., Luo, L. S., Fu, H. Y. (2019). Experimental investigation into the flexural behavior of hollow, full, and intermittently stiffened (bamboo-like) glulam beams from larch woods. Bioresources, 14(1), 2171–2185. [Google Scholar]
19. Shang, P., Sun, Y. F., Zhou, D. G., Qin, K., Yang, X. L. (2018). Experimental study of the bending performance of hollow glulam beams. Wood and Fiber Science, 50 (1), 3–19. DOI 10.22382/wfs. [Google Scholar] [CrossRef]
20. Jiang, J., Li, P., Nistico, N. (2019). Local and global prediction on stress-strain behavior of FRP-confined square concrete sections. Composite Structures, 226, 111205. DOI 10.1016/j.compstruct.2019.111205. [Google Scholar] [CrossRef]
21. Hoseinpou, R. H., Valluzzi, M., Garbin, E., Panizza, M. (2018). Analytical investigation of timber beams strengthened with composite materials. Construction and Building Materials, 161, 1242–1251. [Google Scholar]
22. Wang, Y. Z., Hou, Q., Xu, T. G., Qu, S. (2021). The bending-shear behaviors of steel-reinforced fast-growing poplar glulam beams with different shear-span ratios. Construction and Building Materials, 300, 124008. DOI 10.1016/j.conbuildmat.2021.124008. [Google Scholar] [CrossRef]
23. Zhao, X. B., Zhang, F. L., Xue, J. Y., Ma, L. L. (2019). Shaking table tests on seismic behavior of ancient timber structure reinforced with CFRP sheet. Engineering Structures, 197, 109405. DOI 10.1016/j.engstruct.2019.109405. [Google Scholar] [CrossRef]
24. Cao, L. (2017). The research on mechanical properties of larch glulam beams (Ph.D. Thesis). Central South University of Forestry and Technology, China. [Google Scholar]
25. Zhou, A. P., Huang, D. S., Li, H. T., Su, Y. (2012). A hybrid approach to determine the mechanical parameters of fibers and matrixes of bamboo. Construction and Building Materials, 35, 191–196. DOI 10.1016/j.conbuildmat.2012.03.011. [Google Scholar] [CrossRef]
26. Lam, F., Craig, B. A. (2000). Shear strength in structural composite lumber. Journal of Materials in Civil Engineering, 12(3), 196–204. DOI 10.1061/(ASCE)0899-1561(2000)12:3(196). [Google Scholar] [CrossRef]
27. Murphy, J. F. (1979). Using fracture mechanics to predict failure of notched wood beams. Reprints-United States, Forest Service. [Google Scholar]
28. Foschi, R. O., Barrett, J. D. (1980). Glued-laminated beam strength: A model. Journal of the Structural Division, 106(8), 1735–1754. DOI 10.1061/JSDEAG.0005496. [Google Scholar] [CrossRef]
29. Hendrickson, E. M., Ellingwood, B., Murphy, J. (1988). Limit state probabilities for structural wood members. Journal of Structural Engineering, 114(1), 88–106. DOI 10.1061/(ASCE)0733-9445(1987)113:1(88). [Google Scholar] [CrossRef]
30. Moses, D. M., Prion, H. G. L. (2004). Stress and failure analysis of wood composites: A new model. Composites: Part B, 35, 251–261. DOI 10.1016/j.compositesb.2003.10.002. [Google Scholar] [CrossRef]
31. Tabiei, A., Jin, W. (2000). Three-dimensional nonlinear orthotropic finite element material model for wood. Composite Structures, 50(2), 143–149. DOI 10.1016/S0263-8223(00)00089-1. [Google Scholar] [CrossRef]
32. Anshari, B., Guan, Z. W., Wang, Q. Y. (2017). Modeling of glulam beams pre-stressed by compressed wood. Composite Structures, 164, 160–170. [Google Scholar]
33. Tsalkatidis, T. (2014). Numerical simulation and analytical study of glulam timber beams. International Journal of Engineering and Technology, 3(2), 129. DOI 10.14419/ijet.v3i2.2140. [Google Scholar] [CrossRef]
34. Xu, B. H., Taazount, M., Bouchaïr, A., Racher, P. (2009). Numerical 3D finite element modeling and experimental tests for dowel-type timber joints. Construction and Building Materials, 23, 3043–3052. DOI 10.1016/j.conbuildmat.2009.04.006. [Google Scholar] [CrossRef]
35. Moses, D. M., Prion, H. G. L. (2003). A three-dimensional model for bolted connections in the wood. Canadian Journal of Civil Engineering, 30, 555–567. DOI 10.1139/l03-009. [Google Scholar] [CrossRef]
36. Zhang, J., He, M. J., Li, Z. (2018). Numerical analysis on the tensile performance of bolted glulam joints with initial local cracks. Journal of Wood Science, 64(4), 364–376. DOI 10.1007/s10086-018-1709-9. [Google Scholar] [CrossRef]
37. Yang, H. F., Liu, W. Q. (2010). Study on flexural behavior of a novel wood composite beam. Building Structure, 40(1), 97–99. [Google Scholar]
38. Fiorelli, J., Dias, A. A. (2011). Glulam beams reinforced with FRP externally-bonded: Theoretical and experimental evaluation. Materials and Structures, 44(8), 1431–1440. DOI 10.1617/s11527-011-9708-y. [Google Scholar] [CrossRef]
39. Fiorelli, J., Dias, A. A. (2003). Analysis of the strength and stiffness of timber beams reinforced with carbon fiber and glass fiber. Materials Research, 6(2), 193–202. DOI 10.1590/S1516-14392003000200014. [Google Scholar] [CrossRef]
40. Yang, H. F., Liu, W. Q. (2007). Study on flexural behavior of FRP reinforced glulam beams. Journal of Building Structure, 28(1), 64–71. [Google Scholar]
41. Shang, P. (2017). Research and design on hollow post-beam system of glulam timber architecture (Ph.D. Thesis). Nanjing Forestry University, China. [Google Scholar]
42. Xie, Q. F., Zhao, H. T., Xue, J. Y., Wu, Z. H. (2008). Calculation of flexural capacity for timber beams reinforced with CFRP sheets. Building Structure, 38(5), 76–79. [Google Scholar]
43. Wang, Y. Z., Ma, Y. P., Wang, L. Q., Li, F. T. (2021). Flexural behavior of fast-growing poplar glulam beams reinforced by carbon fiber. Journal of Civil and Environmental Engineering, 1–13. [Google Scholar]
44. Bazan, I. M. M. (1980). Ultimate bending strength of timber beams (Ph.D. Thesis). Nova Scotia Technical College, Canada. [Google Scholar]
45. Gaspar, F., Cruz, H., Gomes, A. (2015). Modeling the influence of delamination on the mechanical performance of straight glued laminated timber beams. Construction and Building Materials, 98(15), 447–455. DOI 10.1016/j.conbuildmat.2015.08.011. [Google Scholar] [CrossRef]
46. Chen, Y. X. (2003). Flexural analysis and design of timber strengthened with high strength composites (Ph.D. Thesis). New Brunswick Rutgers, USA. [Google Scholar]
47. Sun, X. F., Fang, X. S., Guan, L. T. (2009). Mechanics of materials. Beijing: Higher Education Press. [Google Scholar]
48. Standards Press of China (2017). Standard for design of timber structures (GB/T 50005-2017). Beijing. [Google Scholar]
49. ASTM International (2015). Standard test methods of static tests of lumber static tests of lumber in structural sizes (D198-5). Philadelphia. [Google Scholar]
50. Standards Press of China (2009). Method of testing in compressive strength parallel to grain of wood (GB/T 1935-2009Beijing. [Google Scholar]
51. Standards Press of China (2009). Method of testing in bending strength of wood (GB/T 1936.1-2009). Beijing. [Google Scholar]
52. Standards Press of China (2009). Method for determination of the modulus of elasticity in static bending of wood (GB/T 1936.2-2009). Beijing. [Google Scholar]
53. Standards Press of China (2012). Standard for test methods of timber structures (GB/T 50329-2012). Beijing. [Google Scholar]
54. Hill, R. (1950). The mathematical theory of plasticity. Oxford (NYOxford University Press. [Google Scholar]
55. Green, D. W. (1999). Wood hand book-wood as an engineering material. In: Agriculture handbook. U.S. Department of Agriculture. DOI 10.2737/FPL-GTR-113. [Google Scholar] [CrossRef]
Cite This Article
 Copyright © 2023 The Author(s). Published by Tech Science Press.
This work is licensed under a Creative Commons Attribution 4.0 International License , which permits unrestricted use, distribution, and reproduction in any medium, provided the original work is properly cited.
 Downloads
 Citation Tools