
 Submit a Paper
 Propose a Special lssue
 Open Access
ARTICLE

Mechanical and Permeability Analysis and Optimization of Recycled Aggregate Pervious Concrete Based on Response Surface Method
1
College of Water Conservancy and Hydropower Engineering, Hohai University, Nanjing, 210000, China
2
College of Mechanics and Materials, Hohai University, Nanjing, 210000, China
3
China Three Gorges Corporation, Beijing, 100000, China
* Corresponding Authors: Yanan Zhang. Email: ; Xingwen Guo. Email:
# Fan Li and Xin Cai contributed equally to this work
Journal of Renewable Materials 2023, 11(4), 1745-1762. https://doi.org/10.32604/jrm.2022.024380
Received 31 May 2022; Accepted 21 July 2022; Issue published 01 December 2022
 View Full Text
 Download PDF
Abstract
In this paper, the effects of different influencing factors and factor interaction on the compressive strength and permeability of recycled aggregate pervious concrete (RAPC) were studied based on the response surface method (RSM). By selecting the maximum aggregate size, water cement ratio and target porosity as design variables, combined with laboratory tests and numerical analysis, the influences of three factors on the compressive strength and permeability coefficient of RAPC were revealed. The regression equation of compressive strength and permeability coefficient of recycled aggregate pervious concrete were established based on RSM, and the response surface model was optimized to determine the optimal ratio of RAPC under the conditions of meeting the mechanical and permeability properties. The results show that the mismatch item of the model is not significant, the model is credible, and the accuracy and reliability of the test are high, but the degree of uncorrelation between the test data and the model is not obvious. The sensitivity of the three factors to the compressive strength is water cement ratio > maximum coarse aggregate particle size > target porosity, and the sensitivity to the permeability coefficient is target porosity > maximum coarse aggregate particle size > water cement ratio. The absolute errors of the model prediction results and the model optimization results are 1.28 MPa and 0.19 mm/s, and the relative errors are 5.06% and 4.19%, respectively. With high accuracy, RSM can match the measured results of compressive strength and permeability coefficient of RAPC.Keywords
In recent years, urban rainstorm and floods have occurred frequently in cities. Experts have pointed out that impermeability and water logging of urban pavements and easy accumulation of water are some of the main causes of this situation. In this context, pervious concrete, as an important material basis for realizing the ‘sponge city’, has become the focus of researchers’ attention [1]. It is a porous concrete with a continuous pore structure made of a certain gradation of coarse aggregate, little or no fine aggregate, cementitious materials, water reducer, admixture and water in a certain proportion through a specific process [2]. The porous structure and high water permeability greatly improve the drainage performance of the pavement, making the drainage direction of the pavement more divergent, limiting the runoff volume and minimizing the erosion damage of rainwater. At the same time, the traditional pervious concrete uses ordinary natural aggregate, and the sand and gravel resources are rapidly drying up. It has proved its feasibility and economy by extracting and reusing waste building materials into recycled aggregates. It is popularized and applied in many construction fields. Therefore, it is of great significance to promote the development of the “sponge city” to study the use of recycled aggregate to replace natural aggregate with RAPC [3].
For conventional bearing concrete, people tend to pursue its small porosity in order to meet the strength requirements. However, for pervious concrete, due to the need to meet the requirements of water permeability, its porosity must be maintained within a certain range, and its strength and structural stability must also be ensured. From the perspective of pore structure, closed pores, semi-connected pores and connected pores are three types of pervious concrete pores [4]. Among them, semi-connected pores and connected pores are effective pores to ensure water permeability. Connected pores form the channels for air and water to flow through the concrete, while semi-connected pores function as a buffer for water flow. The number of effective pores directly affects the permeability of pervious concrete. In addition, pervious concrete uses a single gradation of aggregates as coarse aggregates, and the coarse aggregates are only bonded by cement, admixture and other binders near the direct contact point to form a skeleton-pore structure [5]. The pores of this structure are often very large. Most of the apertures are more than 1 mm, and mainly connected pores. When the porosity is high, the connected porosity increases and the permeability increases, but the relative interface area between aggregates decreases and the overall strength decreases. On the contrary, when the porosity is low, the overall strength will increase [6]. Therefore, the strength and porosity of concrete are inversely proportional in most cases, and seeking the optimal solution to this contradiction is the key to the mix design of permeable concrete. In the study of pervious concrete, mix design has always been a hot research field, such as the influence of different admixtures, aggregate, mixing method, water-cement ratio and other factors on its mechanical properties, permeability and porosity [7].
The mix proportion design methods of pervious concrete mainly include specific surface area method, mass method, calculation formula method and volume method. Nguyen et al. [8] proposed an improved permeable concrete design method based on aggregate surface area and cement mortar layer thickness. The compressive strength of pervious concrete designed by this method is 28.6 MPa, and the permeability coefficient is 1 mm/s. Compressive strength is higher than other literature reported compressive strength. Kayhanian et al. [9] studied the permeability of permeable concrete pavement in the parking lot, and the results showed that the service life was the most important factor affecting the permeability. Chandrappa et al. [10] made 18 groups of pervious concrete specimens with different aggregate sizes, analyzed the influence of pore size, connectivity and pore distribution on permeability by scanning electron microscopy, and established the relationship between hydraulic gradient, flow rate and pore distribution. Li et al. [11,12] investigated the paste properties, aggregate bulking, water film thickness and paste film thickness play major roles and thus are the key factors to be considered in the design of pervious concrete. Lastly, a 3-step mix design method for pervious concrete is proposed. Zhong et al. [13] studied the influence of porosity curvature on the permeability coefficient of pervious concrete, and proposed the relative pore size and porosity tortuosity index. In the Kozeny-Carman model, the relative pore size and pore tortuosity are introduced to evaluate the permeability. At the same time, the influence of slurry workability, aggregate particle size and cementitious ratio on permeability was tested. The test results show that the workability of pervious concrete affects porosity, the aggregate size affects pore connectivity, and the bone-binder ratio is directly related to the effective porosity. Gaedicke et al. [14] studied the relationship between splitting tensile strength and compressive strength of pervious concrete by using the specimens made in the laboratory and the actual road drilling core specimens. The results showed that the aggregate type had a great influence on the strength of concrete. According to the experimental data, the relationship between splitting tensile strength and compressive strength was proposed. Zhong et al. [15] analyzed the effects of aggregate size, cementitious material strength, total porosity, average pore size and bone-binder ratio on compressive strength. The results show that the strength decreases with the increase of aggregate particle size, and the bone-binder ratio affects the strength by affecting the porosity, and the semi-empirical prediction equation of the compressive strength of pervious concrete is established. Akand et al. [16] studied the relationship between microstructure and macroscopic properties of pervious concrete by scanning technique and finite element method. The pore size, distribution and shape were obtained by making concrete samples with 20% porosity. Based on the scanning image, the finite element model of pervious concrete was established. The strength and elastic modulus calculated by the finite element model are compared with the measured values, and the results show that the established model can accurately predict the macroscopic performance parameters of pervious concrete. Pieralisi et al. [17] established the discrete element constitutive equation of pervious concrete based on the cementation of aggregate and cement paste, and verified the effectiveness of this method through the tests of different aggregate types, gradation curves and the ratio of aggregate and binder. Based on the mathematical method and finite element method, Samuel et al. [18] established the permeability coefficient prediction model by using the microstructure parameters of pervious concrete, and the predicted value of the model was in good agreement with the measured value. Aneel et al. [19] studied the compressive strength and permeability of pervious concrete under different sand ratios. The results showed that with the increase of sand ratio, the compressive strength of pervious concrete gradually increased, and the permeability gradually decreased. Ma et al. [20,21] investigated the uniaxial compressive behaviors of ecological concrete using experimental and numerical methods. Results showed Both the void content and the compressive strength of eco-logical concrete show an overall upward and downward trend with the increase of A/C. When the A/C value exceeds 6, both the void content and compressive strength present a stable trend. The void content of ecological concrete gradually decreases as the W/C increases. The compressive strength of ecological concrete shows an increasing trend as the W/C value varies from 0.26 to 0.28, but decreases when the W/C is within 0.28∼0.30.
In general, the current research on RAPC is mostly about the influence of single variable on its performance, while the influence of multi-factor interaction on its performance is rarely studied, and the research focus is more on the influence of coupling effect on its performance. Therefore, the response surface methodology (RSM) [22] can be used in the study of the multi-factor influence on similar performance. Through the response surface model established based on the test results, the influence of multi-factor interaction on its performance can be intuitively obtained, and the response results can be effectively predicted [23]. Compared with the orthogonal test, the clear relationship between the influencing factors and the response objects cannot be obtained in the complete area. Despite the shortcomings of functional relational expressions and the inability to display intuitive graphics, RSM has the advantages of less test volume, short time, high precision, and good applicability, so it plays a pivotal role in solving practical application problems [24]. In addition, RSM, as a classical approximate model, is widely used in multidisciplinary design optimization. Scholars have studied it more, which is a method that combines experimental design and mathematical modeling effectively and optimizes the results. Through the experiments of representative local experimental points, the data are obtained, and the regression fitting of representative data is used to obtain the functional relationship between the factors and the results in the global range. The optimal level value of each factor to the response results can be obtained by optimization [25]. Therefore, the goal of this paper is to optimize the mix design of RAPC, balance and improve its mechanical properties and permeability, and achieve the effect of popularization and application in engineering.
2.1 Materials and Mix Proportion
The raw materials for the test: (1) Mixing water: tap water; (2) Recycled coarse aggregate: the removal components of the concrete frame structure are artificially broken to remove steel bars. After crushing by jaw crusher and artificial screening, the basic performance indicators of coarse aggregate are shown in Table 1; (3) Cement: P. O. 42.5 ordinary Portland cement was selected.

Due to the difference in structure and composition, pervious concrete and ordinary concrete have very different proportions and design processes. From the design results, porosity and strength are the two main indicators that need to be considered for both ordinary concrete and porous concrete. For ordinary concrete, the principle of porosity is that the smaller the better. However, for permeable concrete, due to the need to meet the requirements of water permeability, its porosity must be maintained within a certain range, and its strength and structural stability must be ensured [26]. In this paper, the volume method is selected, and the ‘eight-step’ method for mix design of pervious concrete is proposed according to ACI in the standard (ACI 522R-10) [27]. Firstly, the water-cement ratio, the target porosity and the dry density of coarse aggregate are input, and then the content of cement and water is determined by the relationship between porosity and slurry volume. However, this method is only used for matching the first batch of test batches, and the proportion of the mixture needs to be further modified to meet the required performance requirements. The specific process is as follows:
In the Eq. (1),
(1) The amount of coarse aggregate per unit volume.

In the formula, α is the correction coefficient of coarse aggregate dosage, which is 0.98.
(2) Cement paste volume.
In the formula,
(3) Water-cement ratio
(4) Cement consumption per unit volume.
(5) Water consumption per unit volume.
(6) The amount of additive per unit volume.
In the formula a is the dosage of additive (%).
The manufacture and maintenance of specimens are carried out indoors. Artificial mixing concrete was used in the test, and the size of specimens was 150 mm × 150 mm × 150 mm. The specimen production process is shown in the figure. After the specimen was formed for 1 d, it was put into the standard curing room for 28 d. The specific process is shown in Fig. 1.
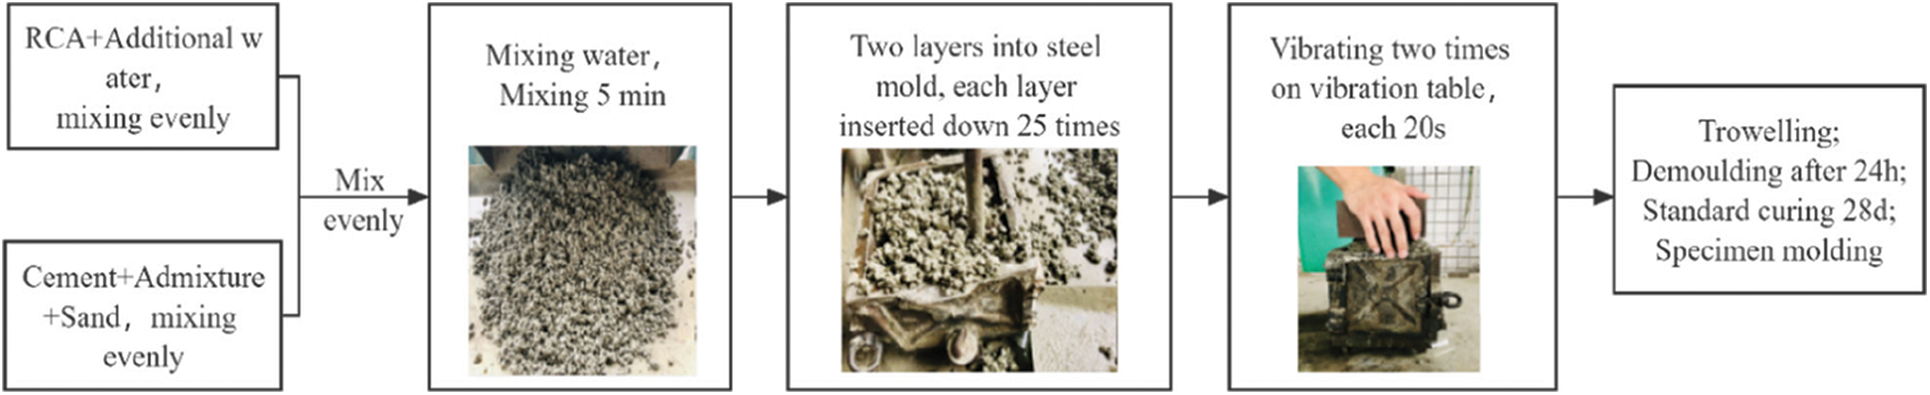
Figure 1: Flow chart of making specimen
The bearing area of the pervious concrete specimen is different from that of ordinary concrete. The bearing area of ordinary concrete is the size of the specimen, and pervious concrete indicates that there are many pores, and the pore part does not bear pressure. Therefore, the bearing area of pervious concrete should be the area occupied by removing the pore part [28]. The determination of pressure area can be expressed by the product of specimen shape area and surface density. In the standard ‘Permeable concrete test method’ of China Construction Engineering Corporation, the failure load of the specimen is divided into the result city obtained by the actual bearing area as the ‘compressive strength of the solid material’, and its value is calculated according to the public. The test device is shown in Fig. 2.
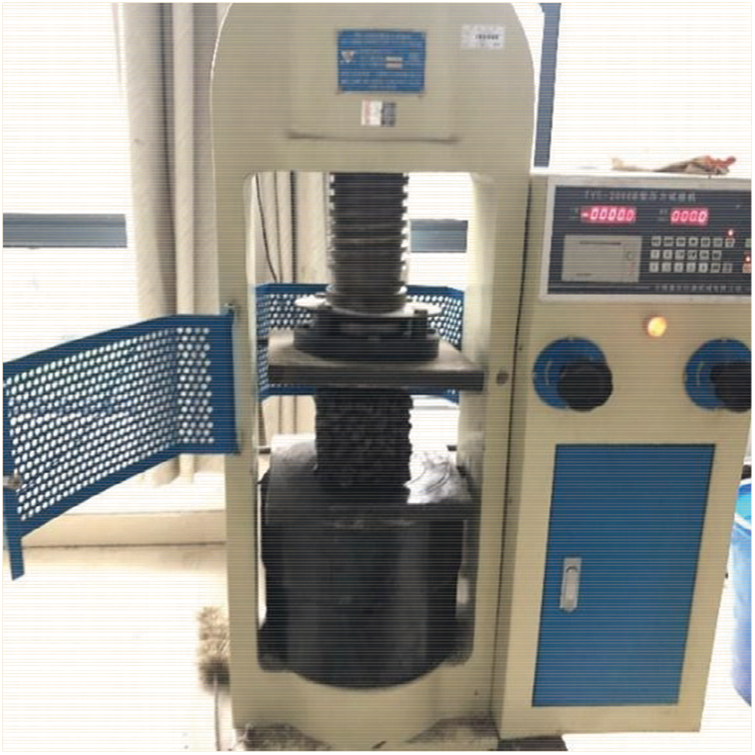
Figure 2: Compressive strength test device
The permeability coefficient is one of the most important indicators of permeable concrete. At present, the determination method of permeability coefficient is roughly divided into two categories: fixed head method and falling head method. The difference between the two methods is shown in Fig. 3 [29]. In this experiment, the fixed head method was used to determine the amount of water per unit area of permeable concrete per unit time.
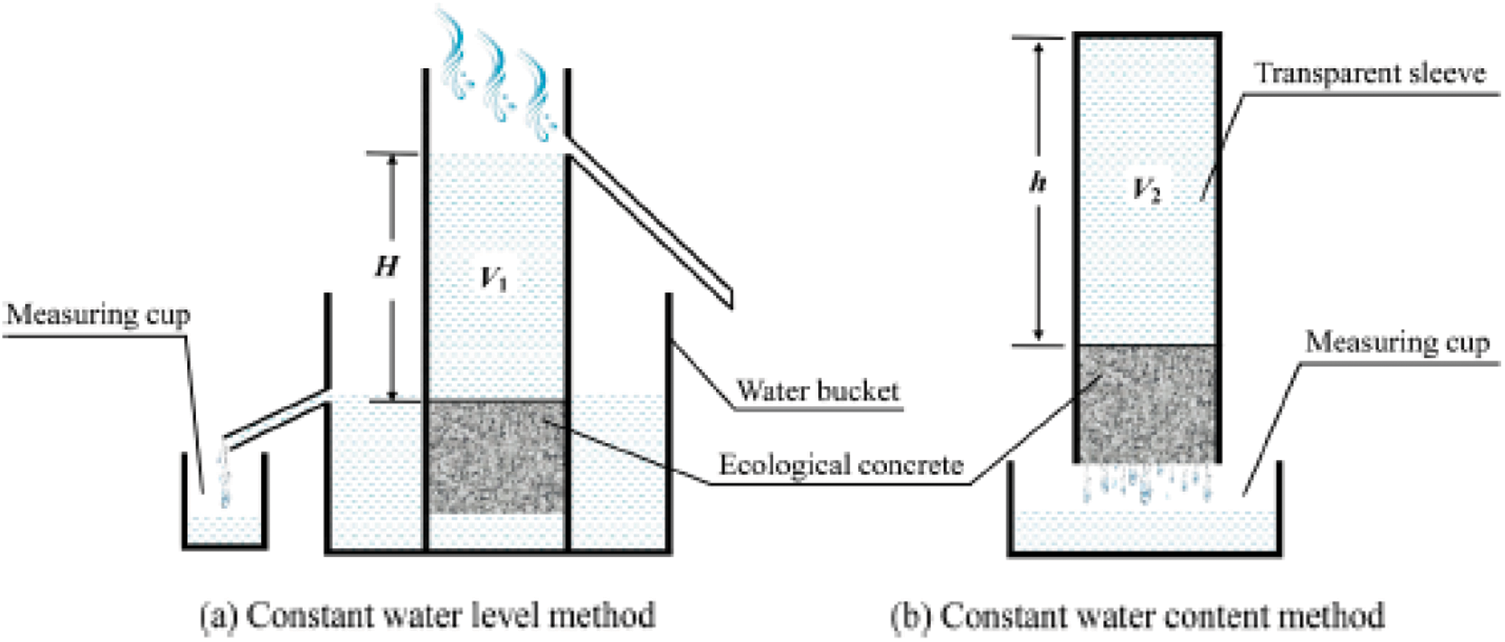
Figure 3: Two methods for measuring water permeability coefficient of ecological concrete
2.3 Design of Response Surface Test
In this paper, the maximum aggregate particle size, water cement ratio and target porosity are set as response factors, and three factors and three levels are set. The 28 d compressive strength and permeability coefficient are taken as response values. The response surface design analysis is carried out by Design-Expert software. The specific test factors and level values are shown in Table 3. The experimental design and results of the response surface method are shown in Table 4.


3.1 Construction and Analysis of Response Surface Model
According to the best approximation theorem of Weierstrass polynomial, most functions can be approximated by polynomials. Therefore, in practical applications, regardless of the relationship between the influencing factors and the response target value, the polynomial approximation model can be studied and discussed [30]. This polynomial approximation model can solve various nonlinear problems.
The compressive strength and permeability coefficient of RAPC were analyzed by multiple regression fitting, and the multiple regression equations of the coded value and the actual value were obtained as shown in Eqs. (7) and (8):
In formula:
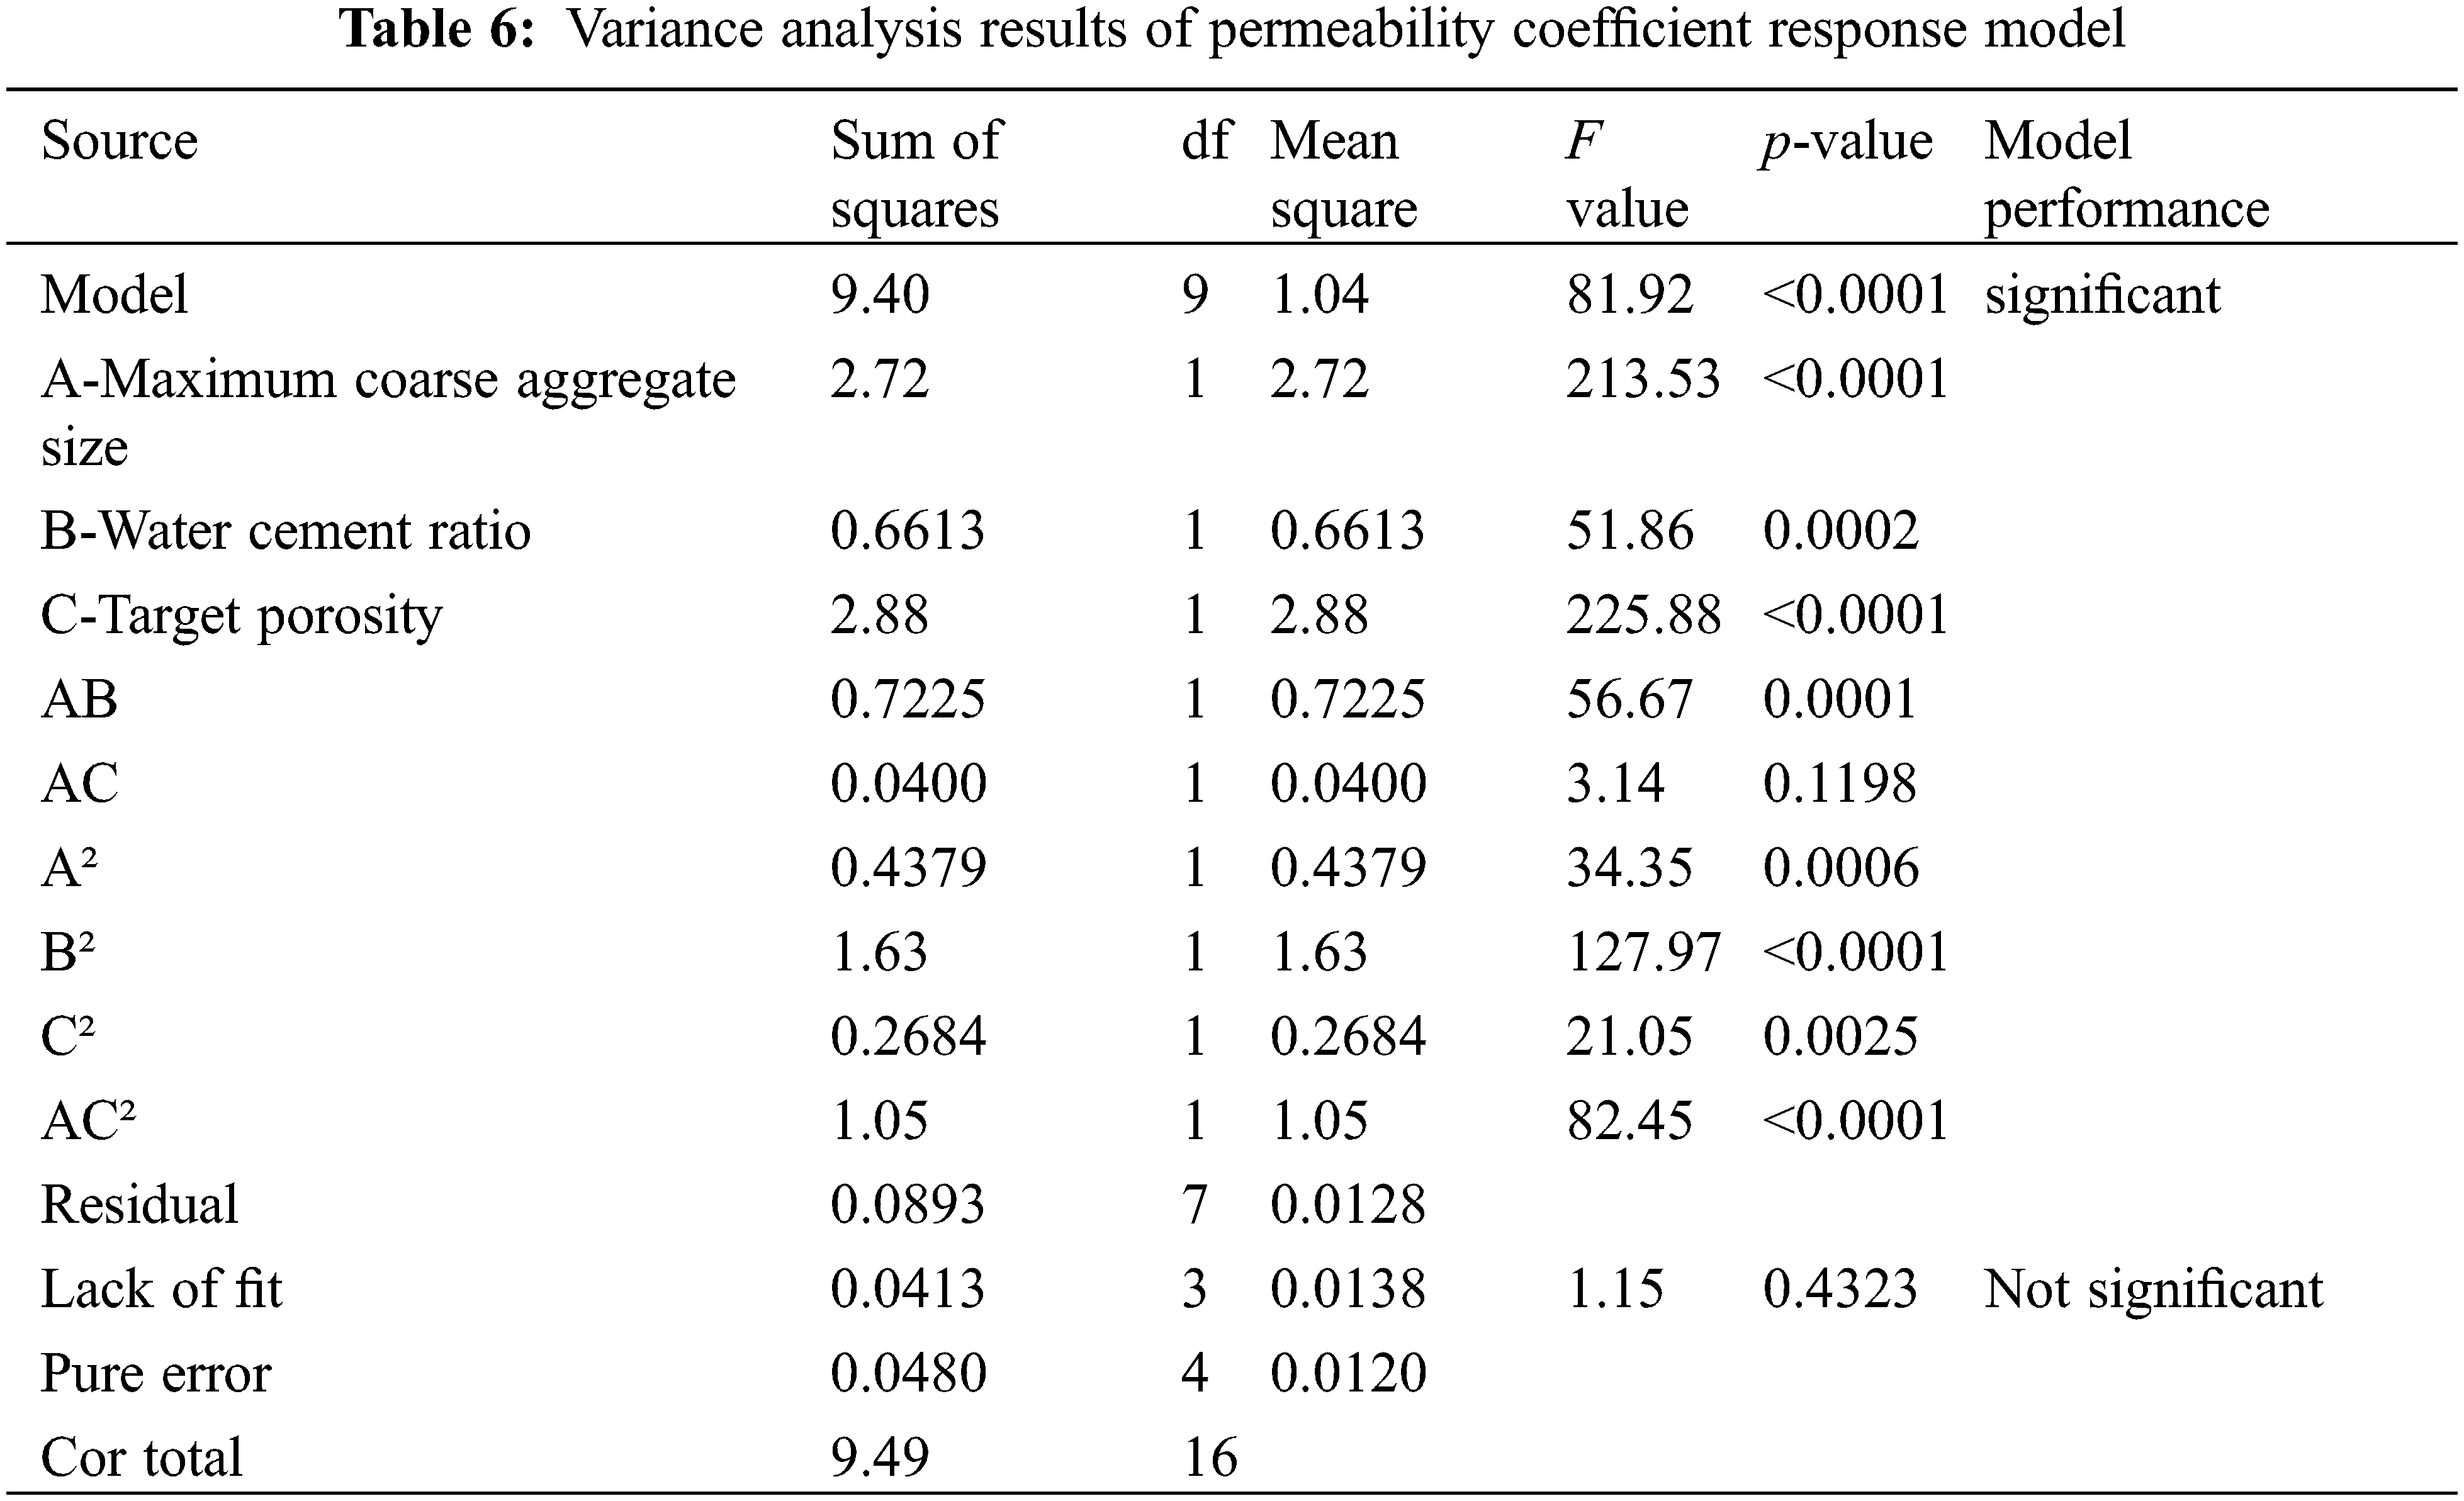
Analysis of variance and significance test were performed on the above regression equations, as shown in Tables 5 and 6. According to the F value, the influence degree of influencing factors on the compressive strength of RAPC from large to small is: water-cement ratio > maximum coarse aggregate size > target porosity; the influence degree of RAPC permeability coefficient from large to small is: target porosity > maximum coarse aggregate particle size > water cement ratio. This rule is consistent with the opposite relationship between RAPC strength and permeability [31].

The p value of the above model is less than 0.05, so the model is obvious and can be used for subsequent optimization design. The mismatch term is the fitting degree between the model and the test, namely the difference between the two. The p-values of the missing items of the model were greater than 0.05, indicating that the difference between the model and the test was not significant, that is, the correlation between the test data and the model was not significant, and the model was credible [32].
The statistical analysis results of the RAPC compressive strength and water permeability regression equation errors are shown in Table 7. The determination coefficients R2 of the model were 0.9990 and 0.9906, respectively, indicating that the predicted values of the model were in good agreement with the measured values. The model calibration coefficient of determination Adj R2 were 0.9968 and 0.9785, that is, the model regression equation can simulate the response value changes of 99.68% and 97.85%, respectively. The absolute values of the difference between the model calibration coefficient of determination Adj R2 and the model prediction coefficient of determination Pred R2 were 0.0356 and 0.1026, respectively, which were less than 0.2, indicating that the regression model can fully explain the process problems. The precisions (Adeq precision) were 68.3752 and 37.0948, respectively, and greater than 4 was reasonable. In addition, the coefficient of variation C.V. of the model is 1.64% and 4.51%, respectively, less than 10%, indicating that the accuracy and reliability of the test are high [33].

Therefore, the regression equation of the model can replace the true value of the test and analyze the test results. From Figs. 4 and 5 is the statistical analysis diagram of the compressive strength and permeability coefficient model. The data points of the normal probability of the residual error of the response model are distributed near a straight line. The distribution of the residual error and the predicted value is irregular. The corresponding point between the measured value and the predicted value is near the straight line y = x. That is, the predicted value of the response model is close to the measured value and has good adaptability [34].
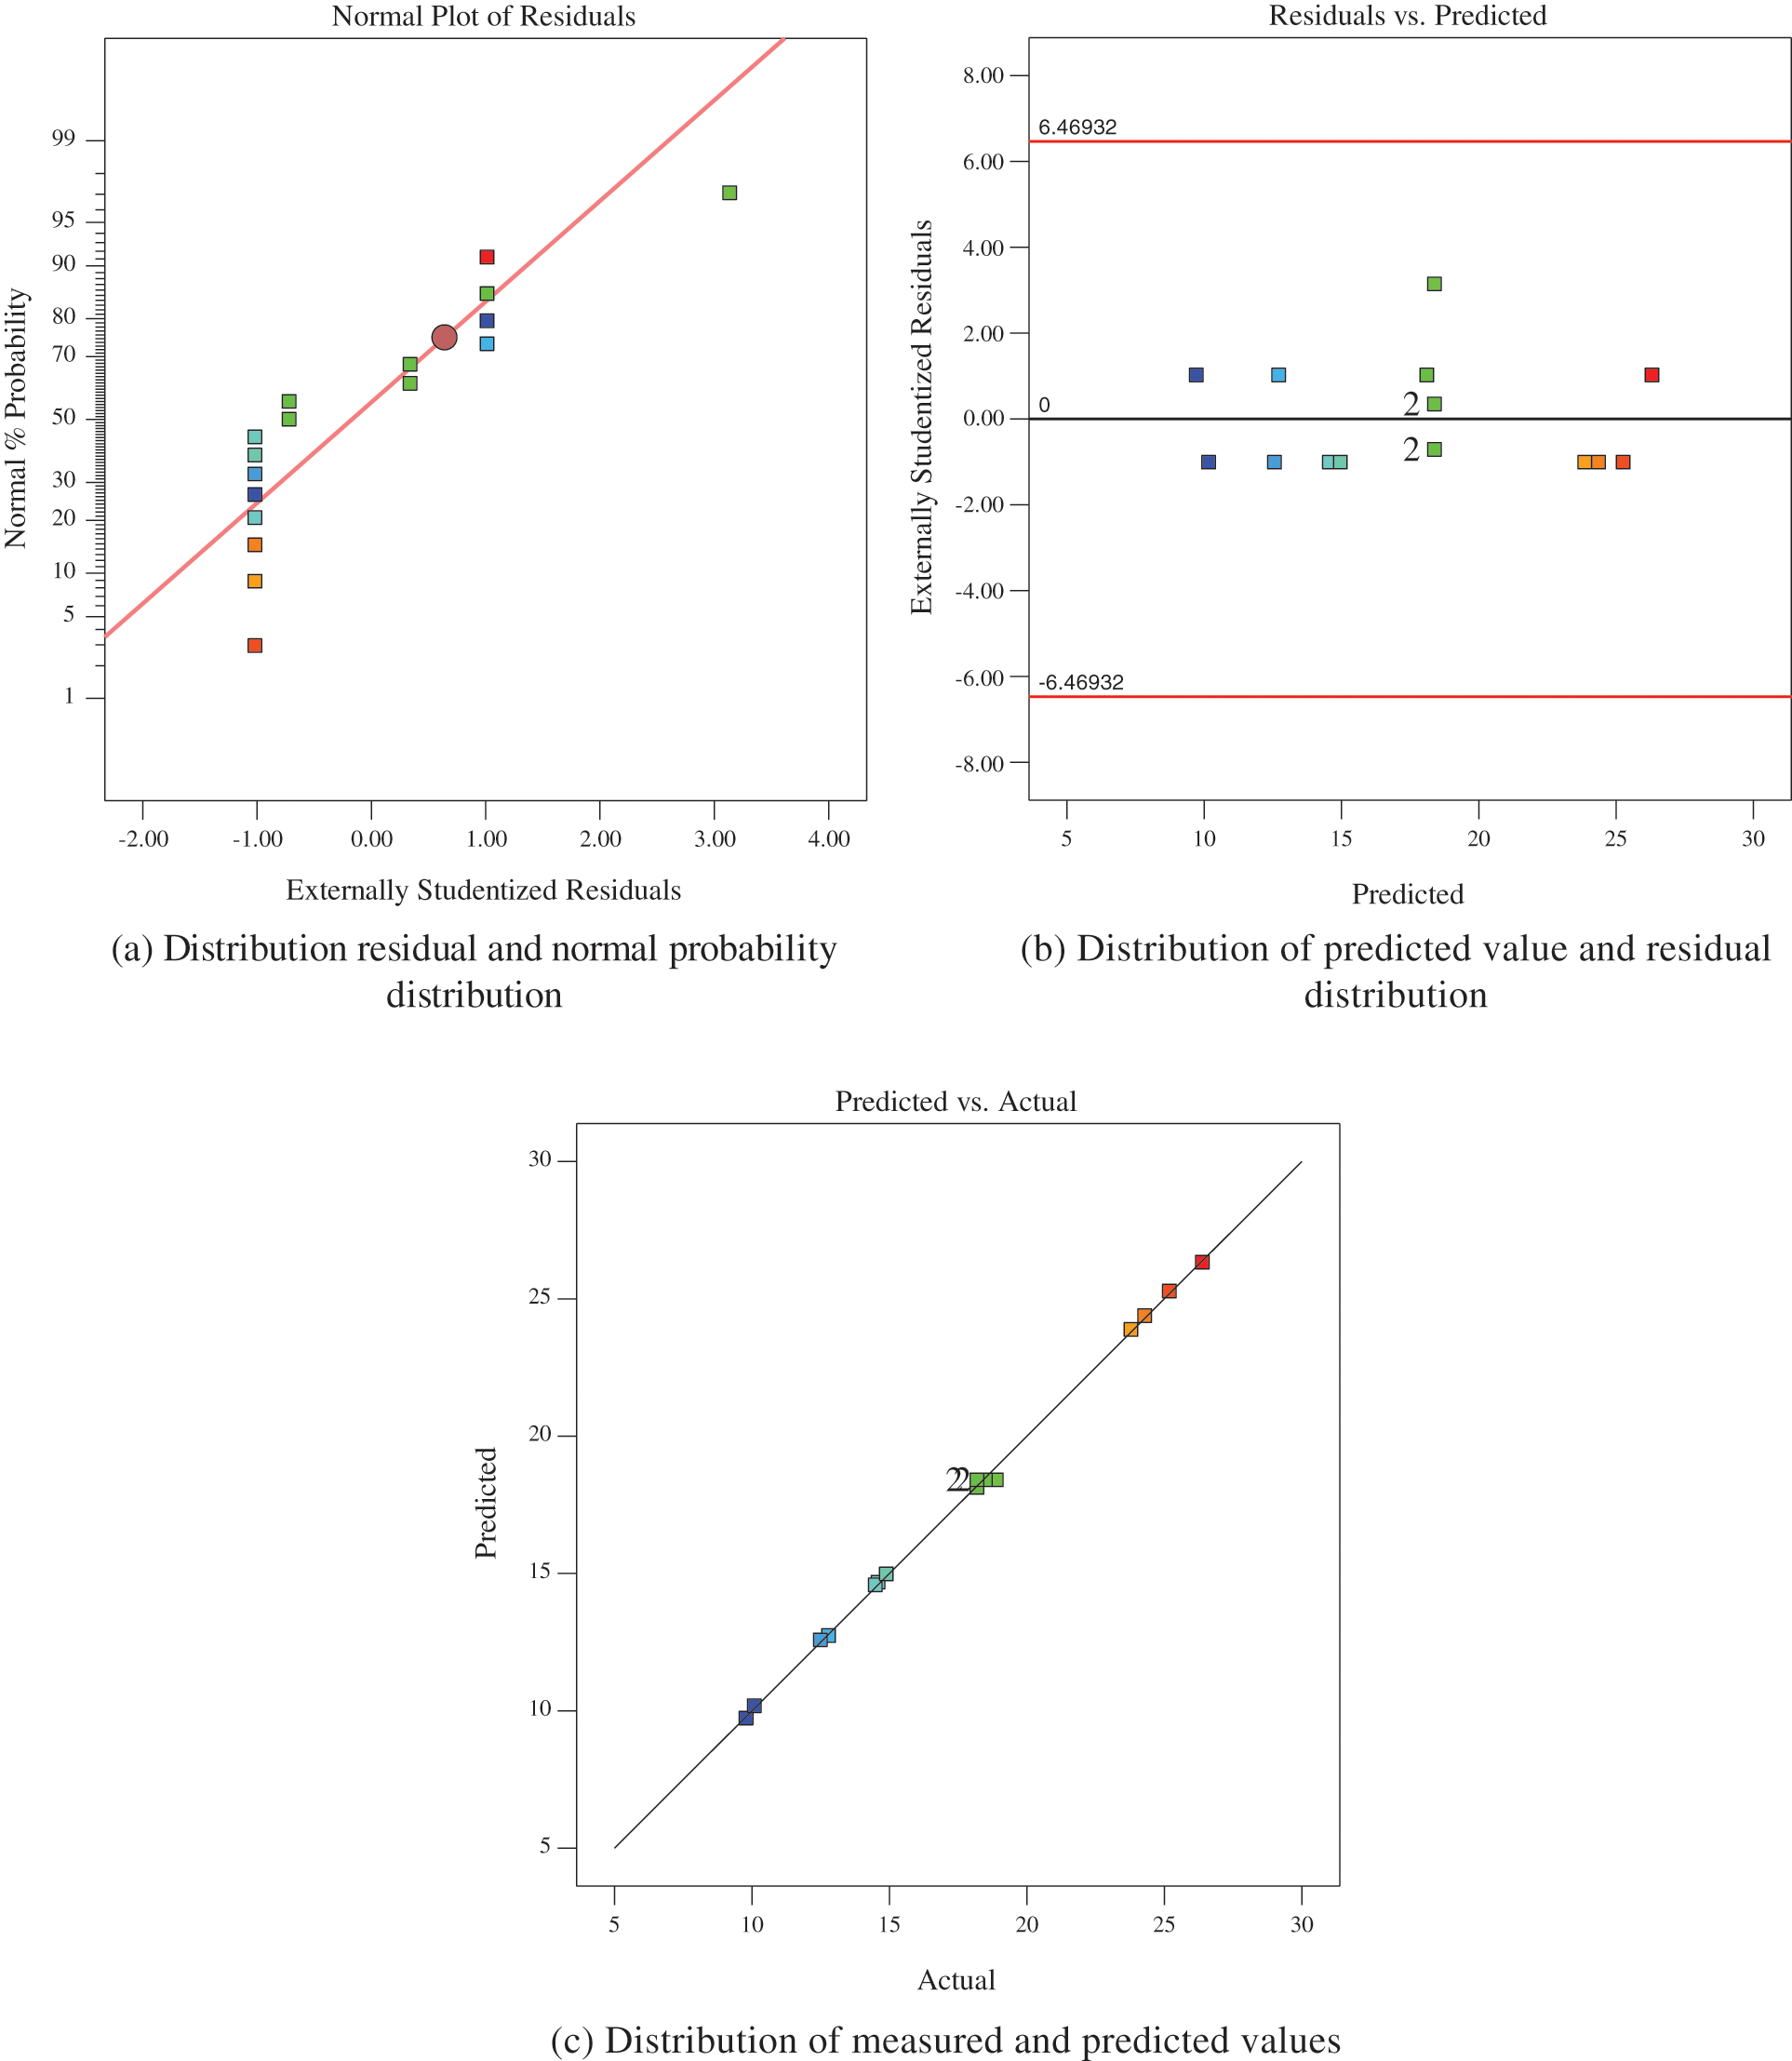
Figure 4: Statistical analysis of compressive strength model
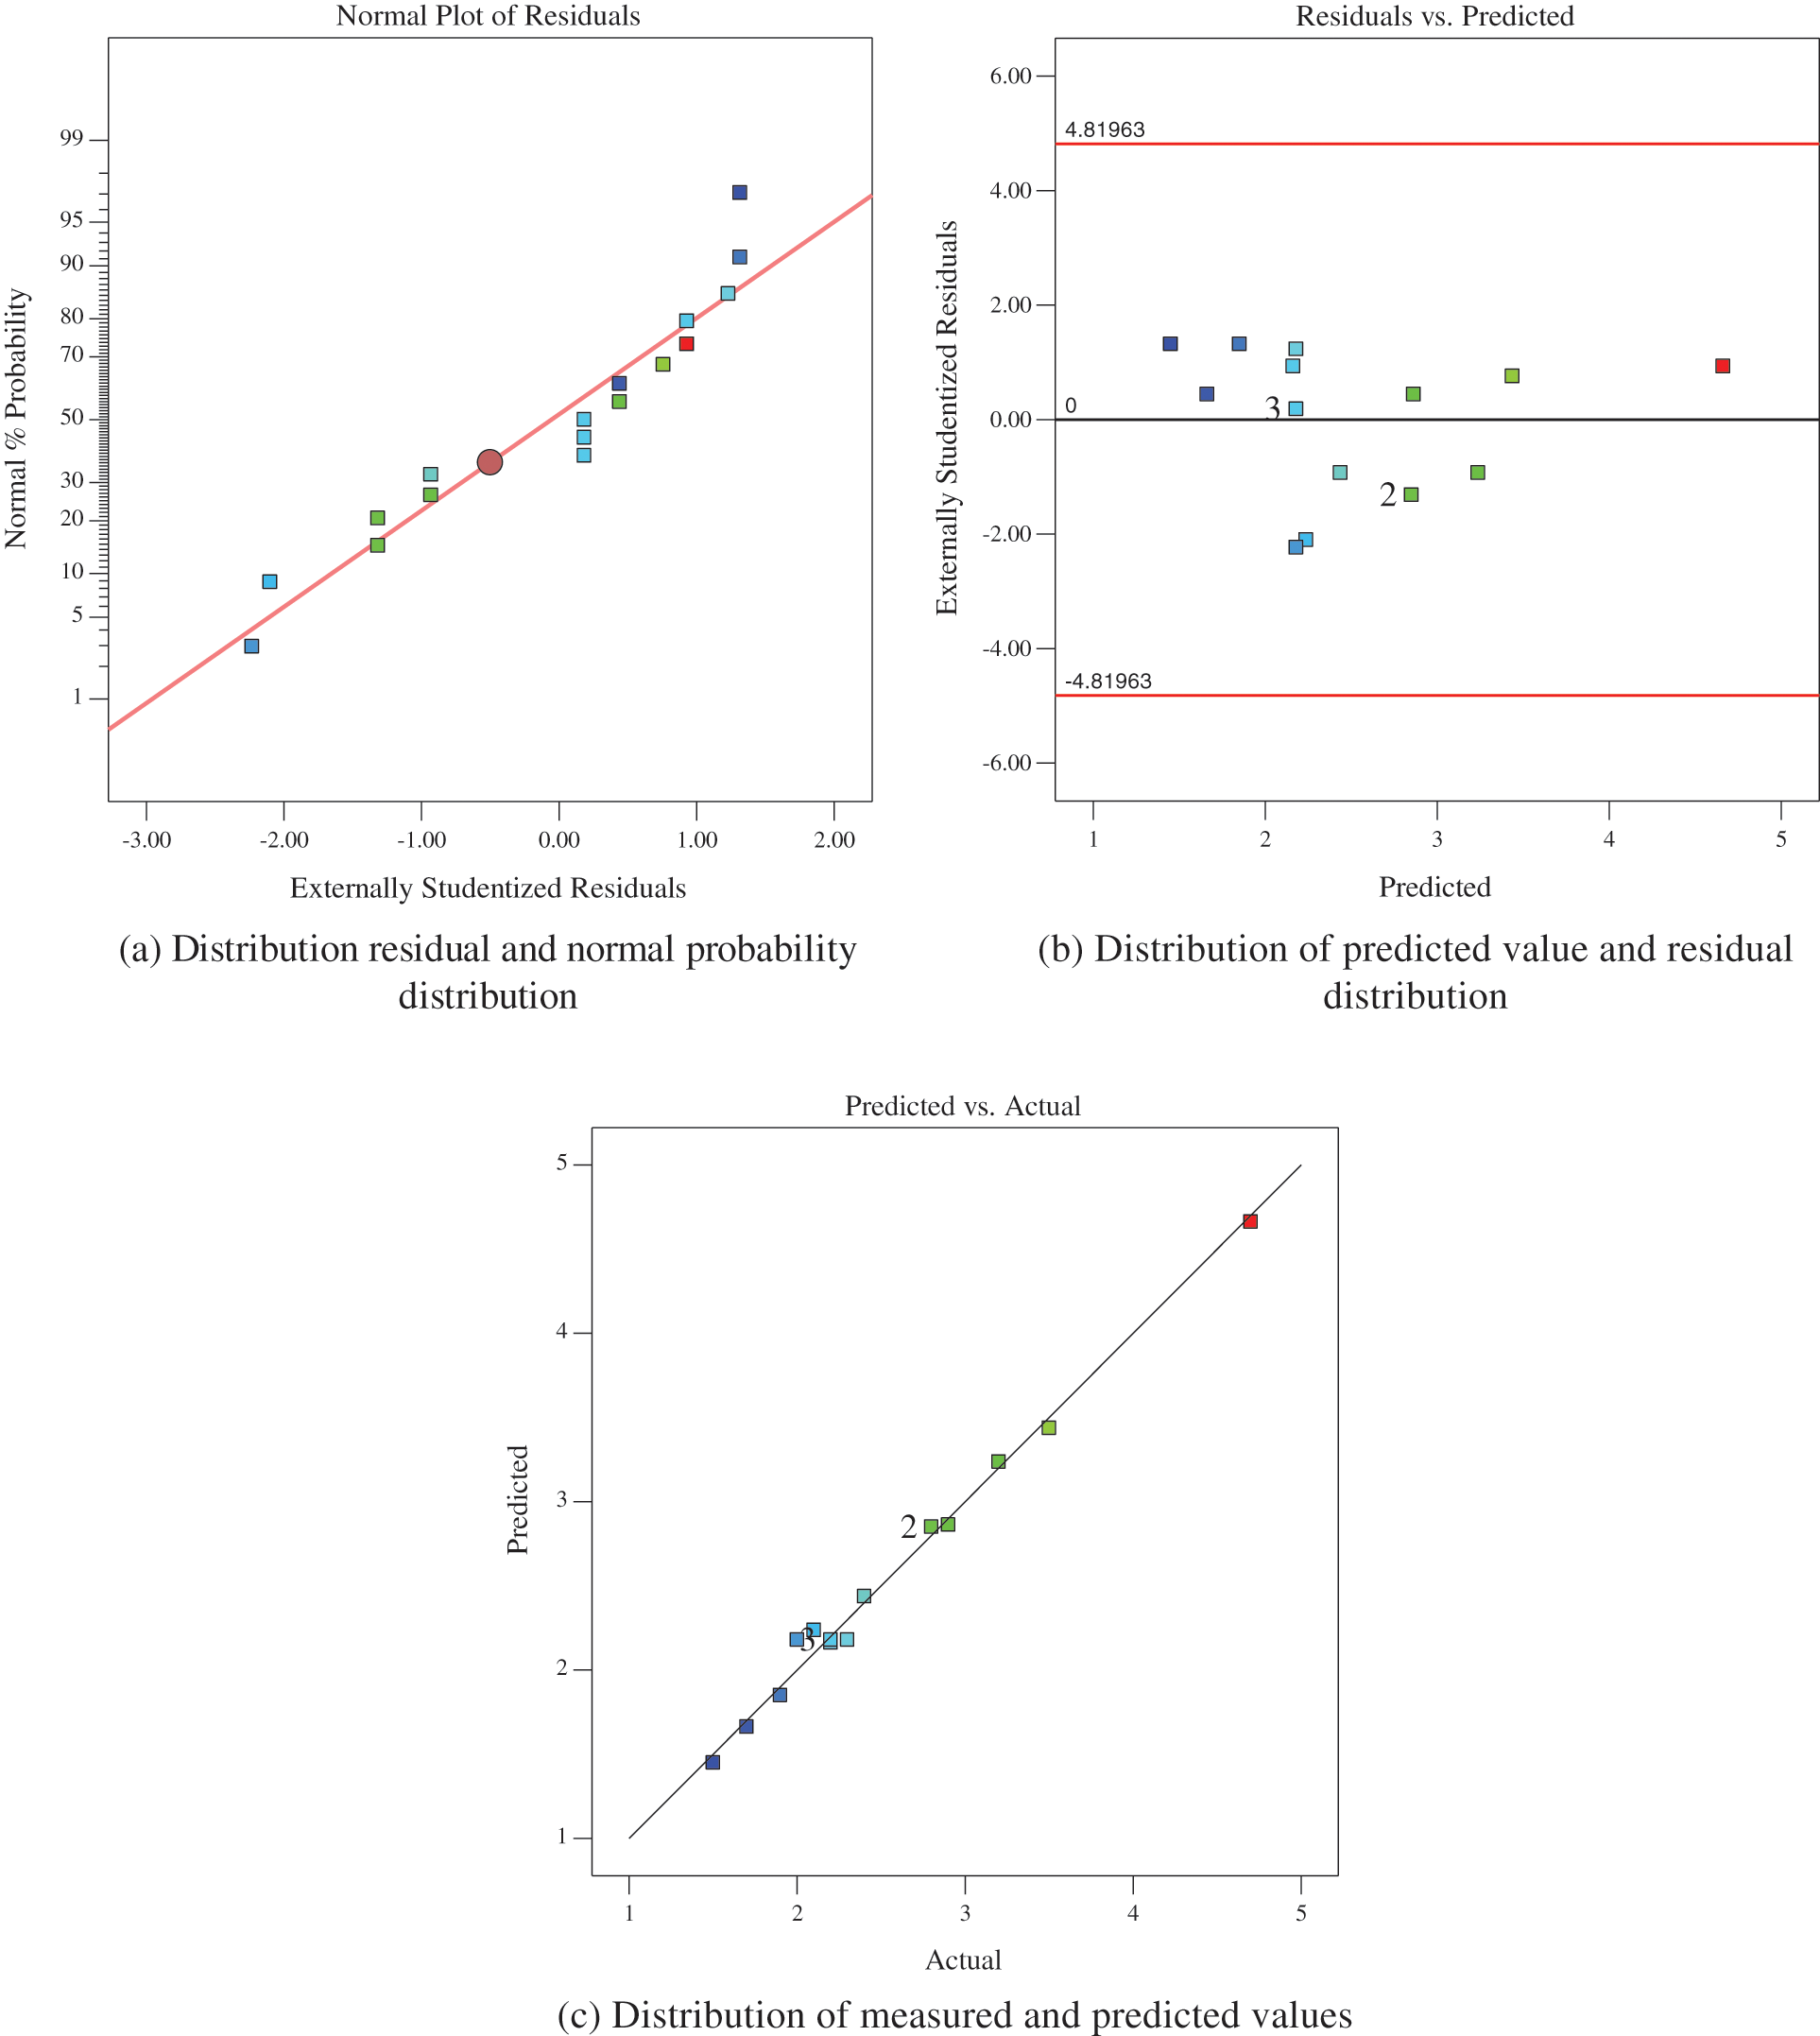
Figure 5: Statistical analysis of permeability coefficient model
3.2 Response Surface and Contour Map
The three-dimensional response surface and contour map established by the response surface analysis method can intuitively reflect the influence of the interaction between experimental factors on the response target (compressive strength and permeability coefficient), that is, when a certain factor is a certain value, the influence of the interaction between the other two factors on the response value. The contour shape can reflect the strength of the interaction effect. The elliptic shape indicates that the interaction between the two factors is obvious, while the circular shape is the opposite. The level selection of the third factor in this paper is determined by the optimal condition of the response target.
Figs. 6–8 are the results of the interaction of different influencing factors on the compressive strength of RAPC It is shown that the compressive strength of RAPC has an extreme value in the area below the response surface, that is, the maximum coarse aggregate particle size, the smaller the water cement ratio and the smaller the target porosity, the greater the compressive strength of RAPC, which is consistent with the law of current research [35].
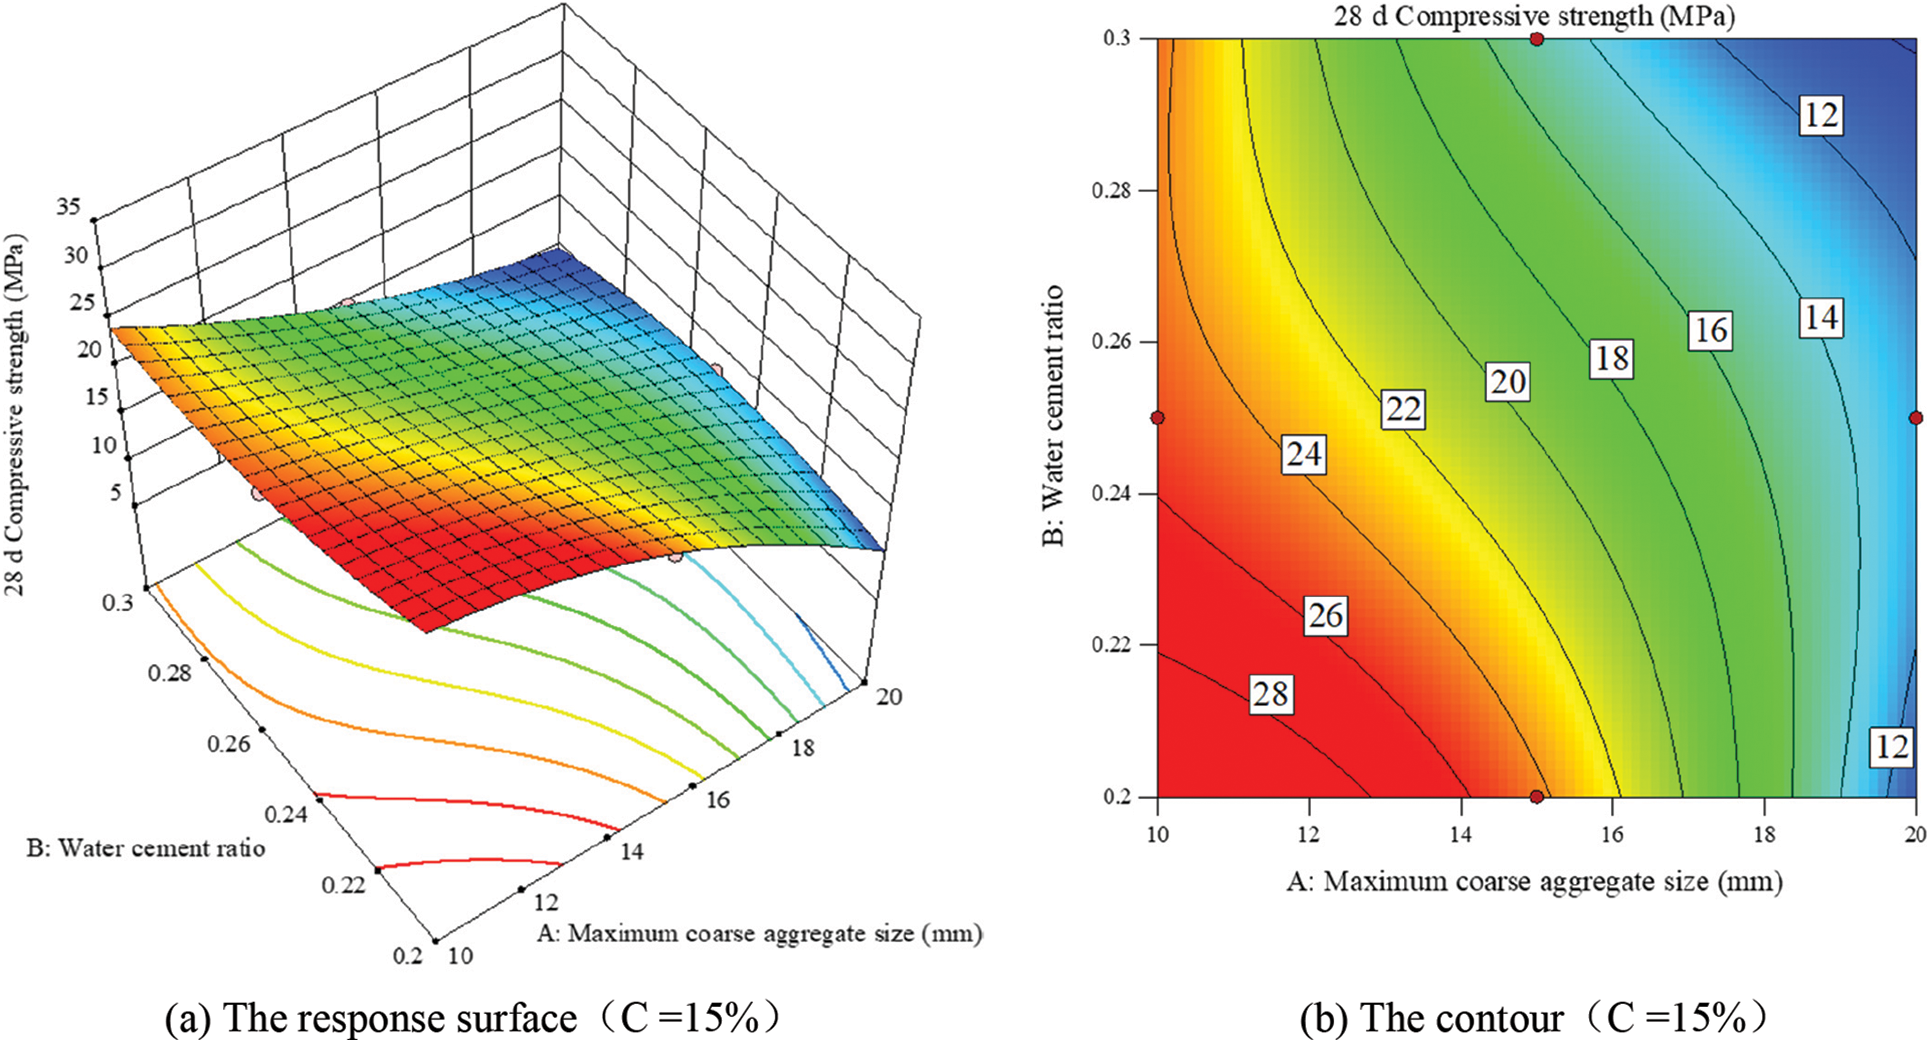
Figure 6: Interaction of maximum coarse aggregate diameter and water cement ratio on compressive strength of RAPC (C = 15%)
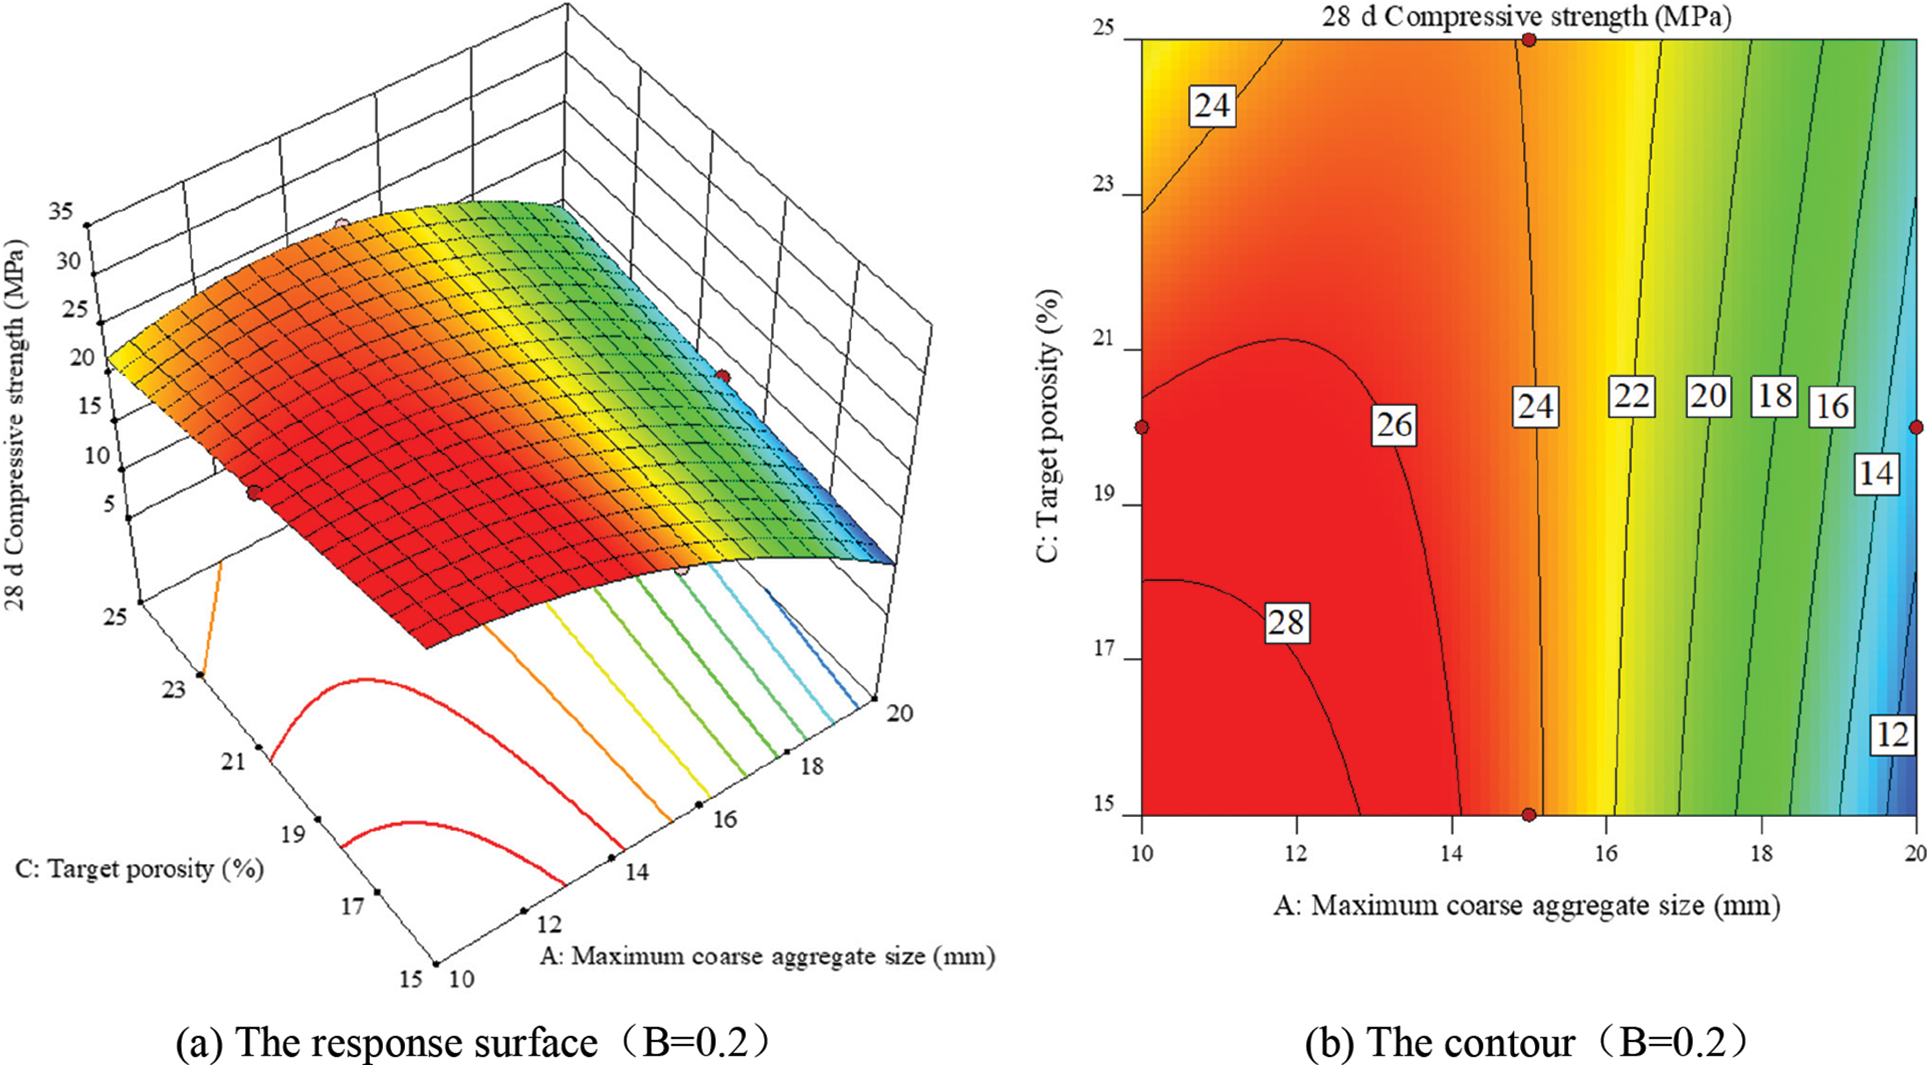
Figure 7: Interaction of maximum coarse aggregate diameter and target porosity on compressive strength of RAPC (B = 0.2)

Figure 8: Interaction of water cement ratio and target porosity on compressive strength of RAPC (A = 10)
Figs. 9–11 are the results of the interaction of different influencing factors on the permeability coefficient of RAPC. The interaction between the water cement ratio and the maximum coarse aggregate particle size is obvious. There is a maximum permeability coefficient in the area where the water cement ratio is the largest and the maximum coarse aggregate particle size is the largest. In addition, for the interaction between the maximum coarse aggregate particle size and the target porosity, when the maximum coarse aggregate particle size is small, the permeability coefficient of RAPC increases with the increase of the target porosity. When the maximum coarse aggregate particle size is large, there is an extreme value of the permeability coefficient in the area near the target porosity of 22%. In the interaction between the water cement ratio and the target porosity, there is also an extreme value in the area near the target porosity of 21%–22%.
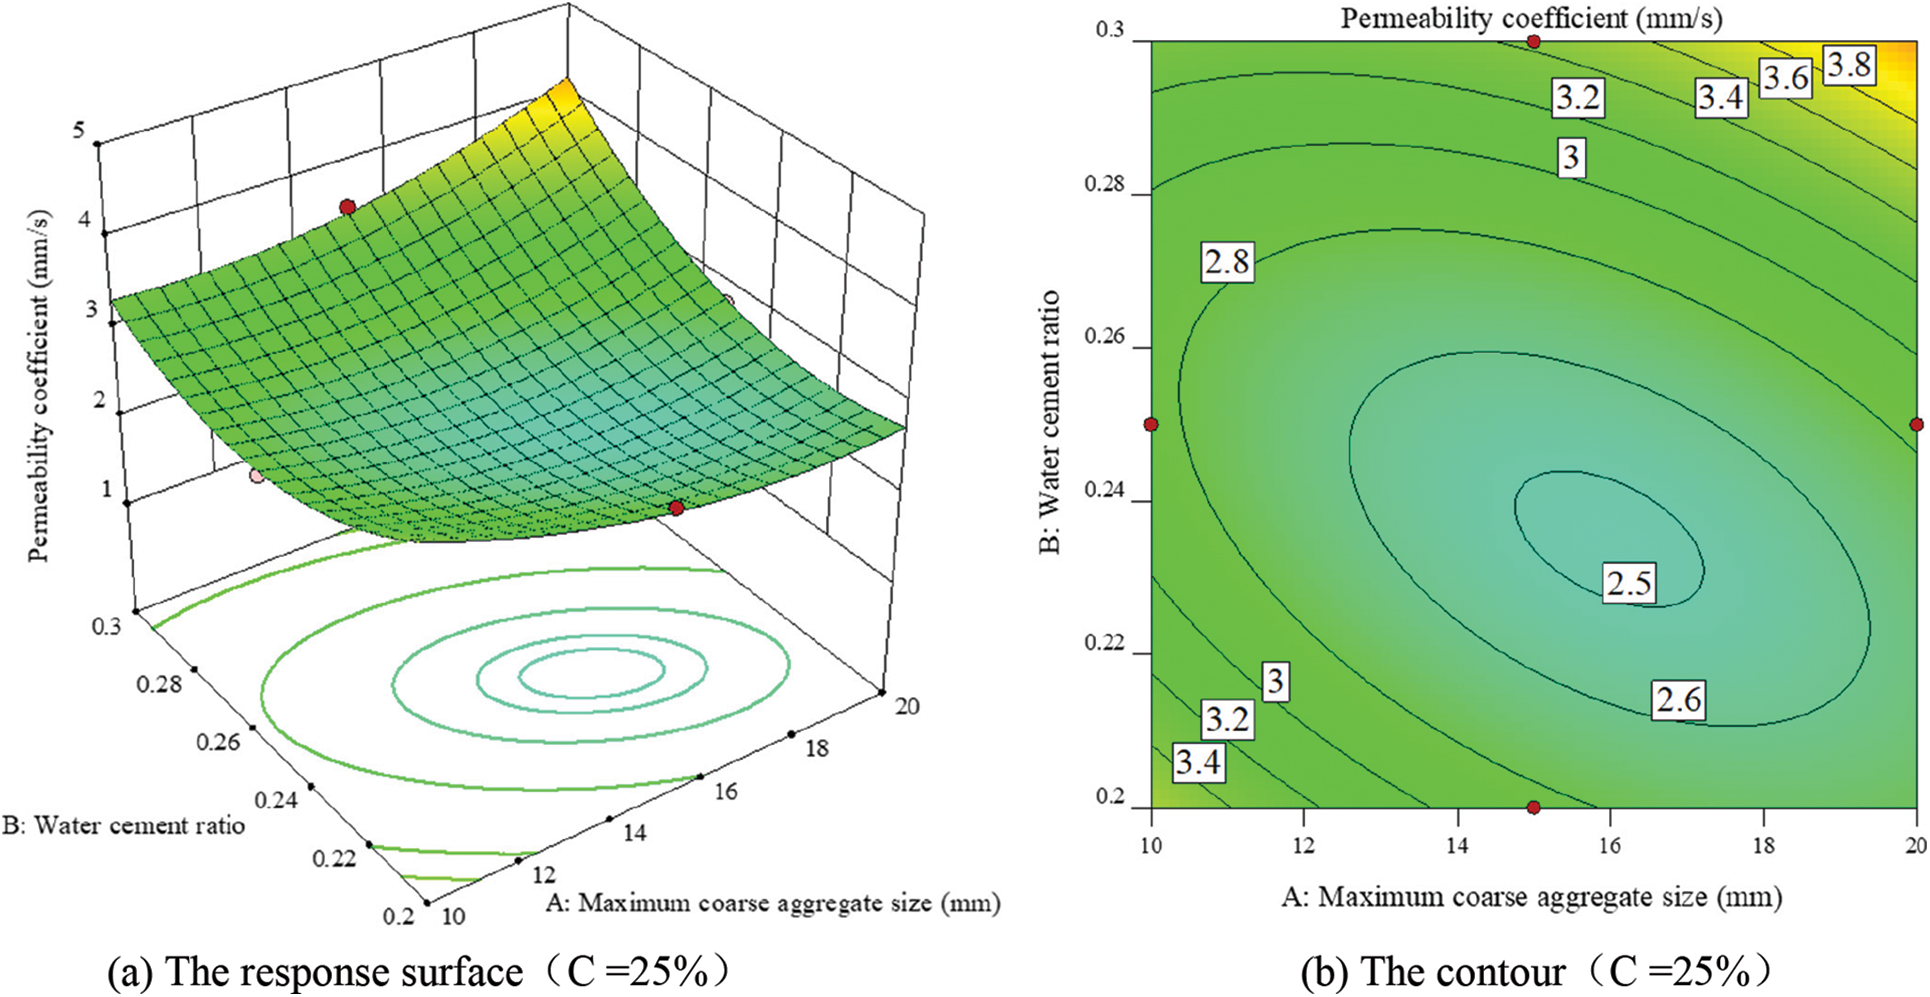
Figure 9: Interaction of maximum coarse aggregate diameter and water cement ratio on permeability coefficient of RAPC (C = 25%)
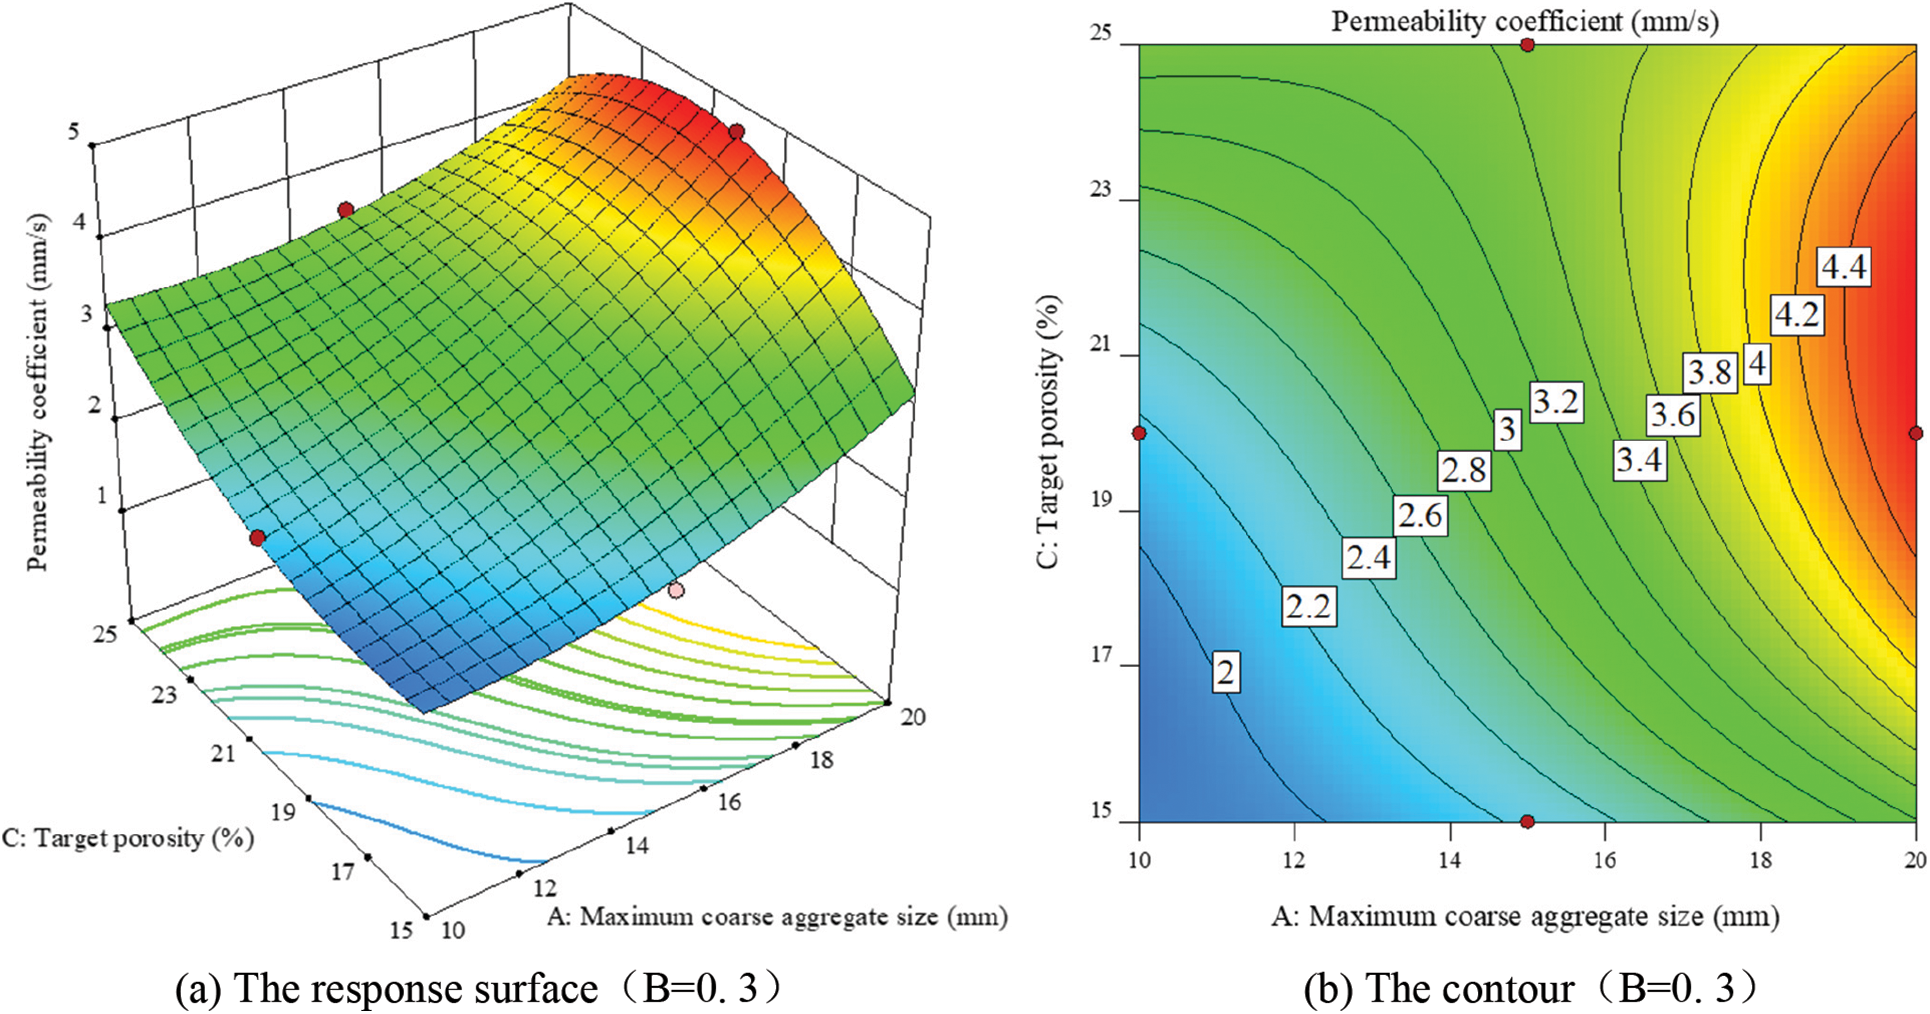
Figure 10: Interaction of maximum coarse aggregate diameter and target porosity on permeability coefficient of RAPC (B = 0.3)
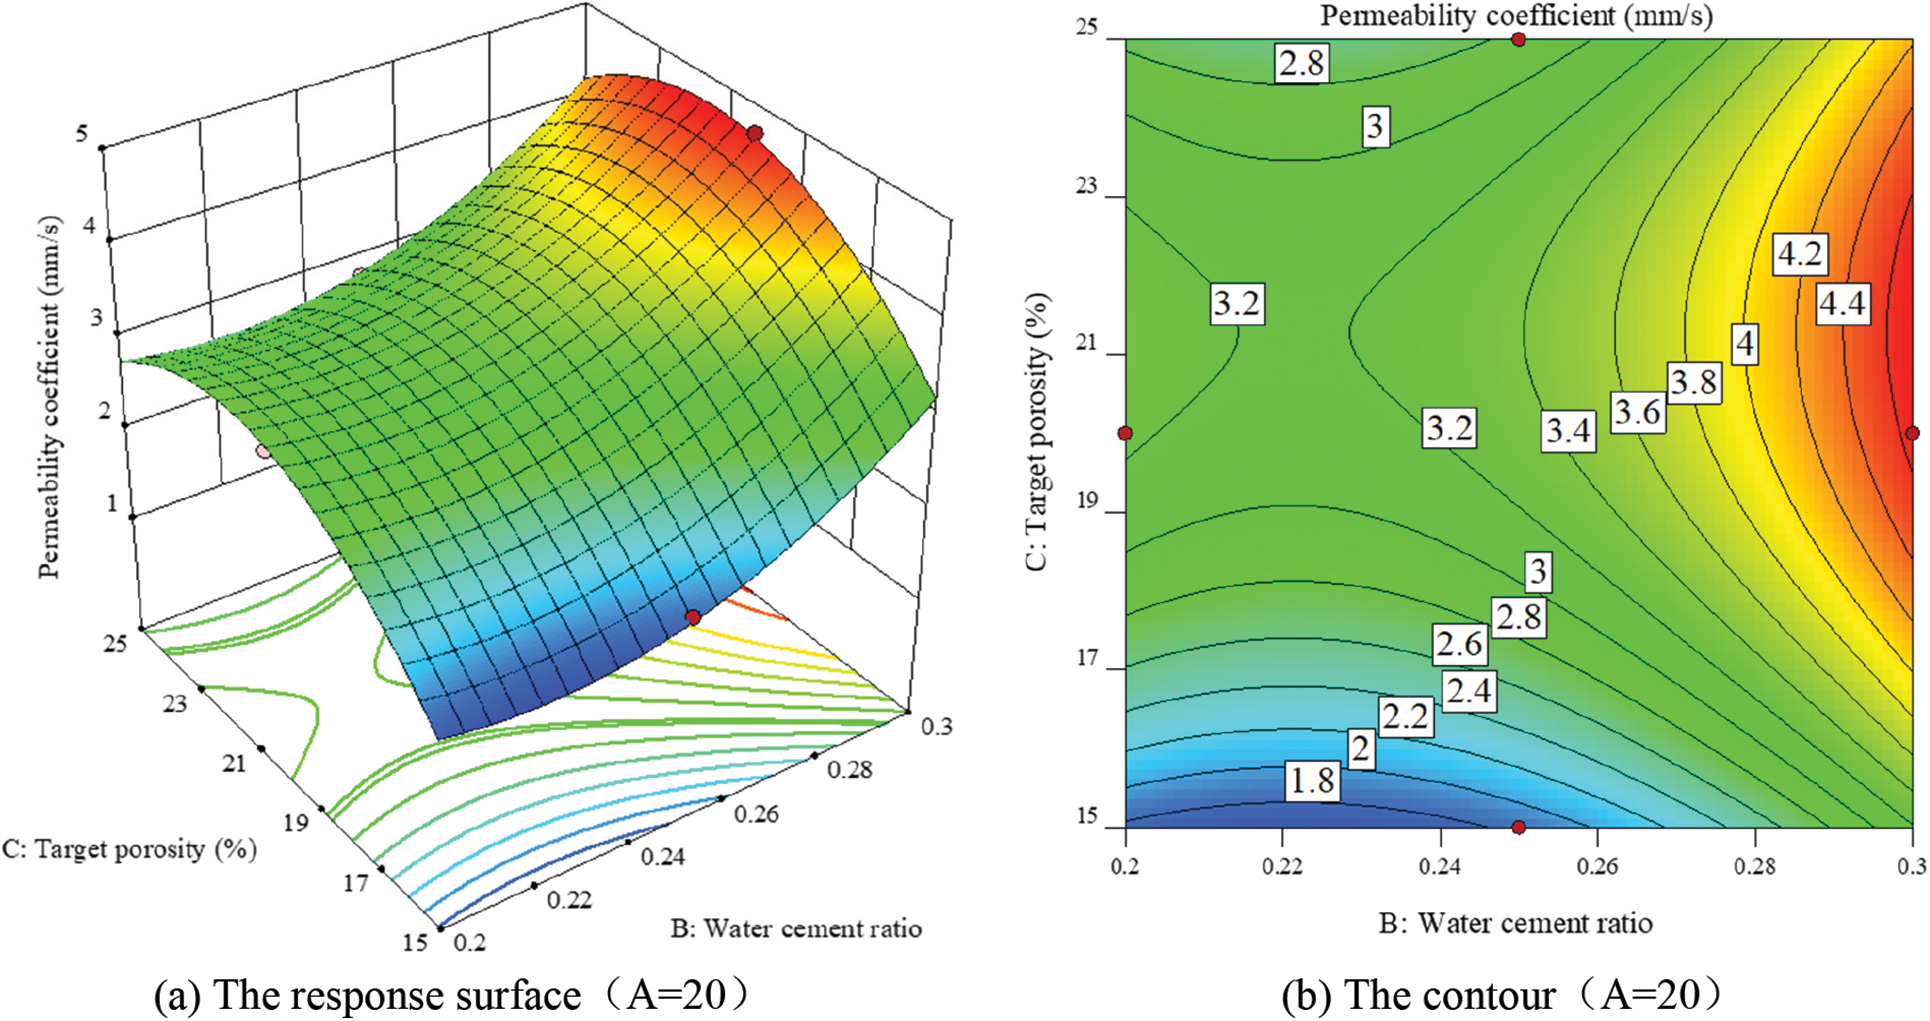
Figure 11: Interaction of water-cement ratio and target porosity on permeability coefficient of RAPC (A = 20)
Therefore, in the comprehensive selection of RAPC mix proportion, according to its demand for physical performance indicators, that is, to meet the strength and permeability requirements of RAPC application scenarios, the region where the required performance is determined according to the response surface, and the fine test can be carried out, so as to avoid blind test without understanding the change of law, and reduce unnecessary material, financial and human losses.
3.3 Model Optimization Prediction and Verification
With the use of the optimization options in Design-Expert software, the input conditions (maximum coarse aggregate particle size, water cement ratio, target porosity) are set in the range of low value to high value of the factor level, and the response target value is solved to obtain the target response results and their suitability. The error between the model optimization prediction results and the measured results is shown in Table 8.
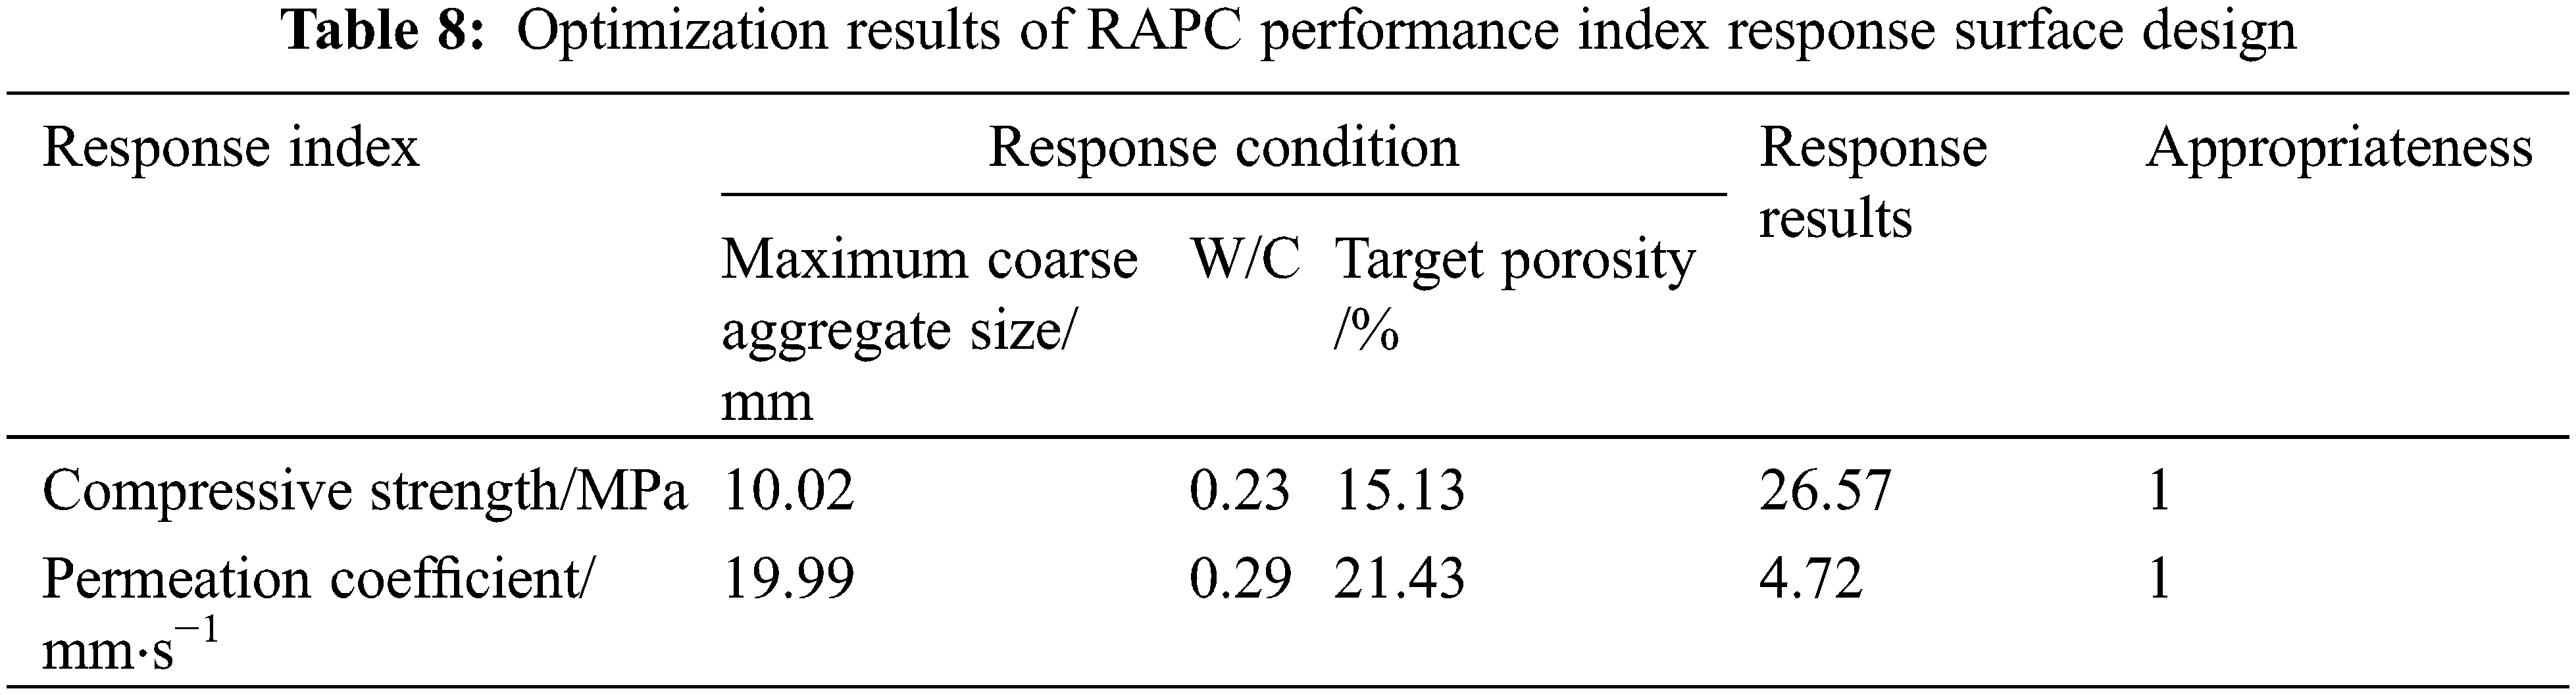
Make RAPC under the following test conditions and obtain performance indicators: Compressive strength: the maximum coarse aggregate particle size is10 mm, water cement ratio is 0.2, the target porosity is 15%; permeability coefficient: the maximum coarse aggregate particle size is 20 mm, water cement ratio is 0.3, the target porosity is 20%. The conditions in the above optimization results are used for experimental verification, and the results are shown in Table 9.
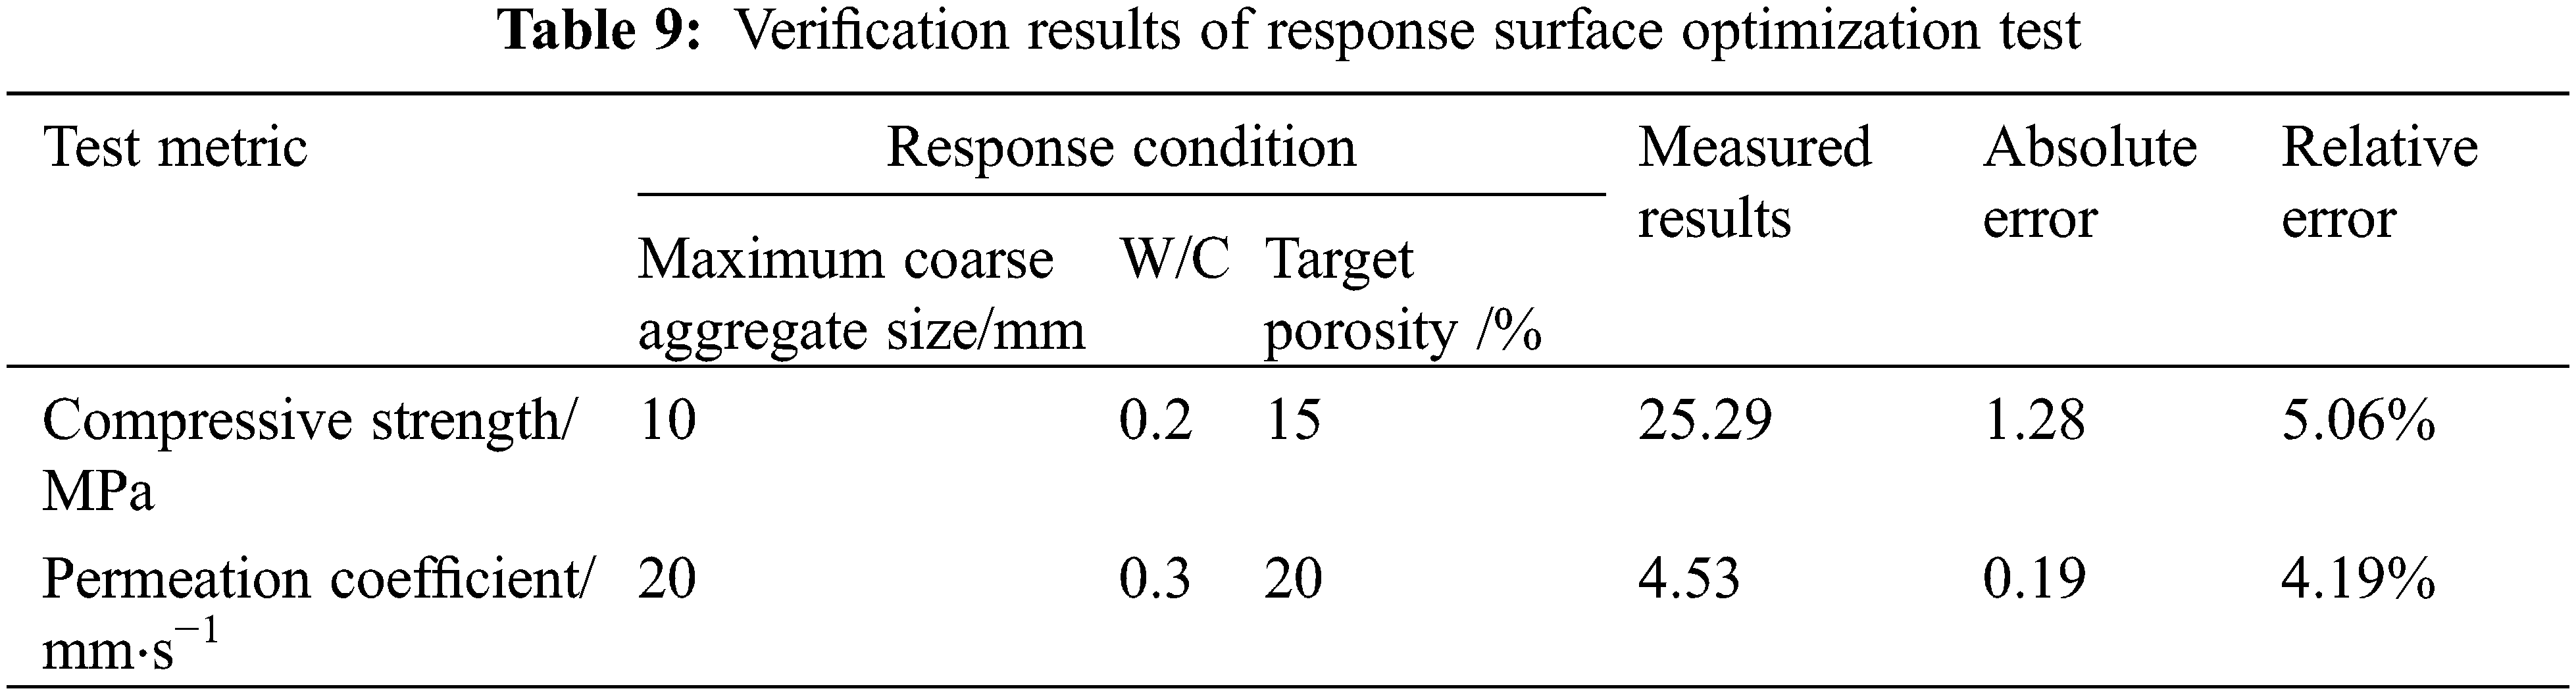
In the optimization results, the optimization results of compressive strength and permeability coefficient of RAPC are 26.57 MPa and 4.72 mm/s, respectively, and the corresponding measured compressive strength and permeability coefficient are 25.29 MPa and 4.53 mm/s, respectively. The absolute errors with the model optimization results are 1.28 MPa and 0.19 mm/s, and the relative errors are 5.06% and 4.19%, respectively, with high accuracy. The experimental results are close to the prediction results of model optimization, indicating that the response surface analysis method is of practical significance for experimental design, analysis and target prediction.
Based on RSM, an optimization model with RAC compressive strength and permeability coefficient as response values and maximum aggregate particle size, water cement ratio and target porosity as corresponding factors was established. The model was considered to have a certain degree of credibility fitted by multiple regression approximation equations, variance analysis and error statistical analysis. On this basis, the corresponding surface and contour plots were drawn and it was found that the influence of water cement ratio on the compressive strength of RAC exceeds the maximum coarse aggregate particle size and target porosity, while the significance of porosity on the permeability coefficient of RAC exceeds the maximum coarse aggregate particle size and water cement ratio. In addition, under the multi-factor interaction of RAC, the optimal result of the strength model was obtained when the maximum aggregate size was 10 mm, the water-cement ratio was 0.2, and the target porosity was 15%, at which time the 28 d compressive strength of RAC was 25.29 MPa. It is the optimal result of the permeability model when the maximum aggregate size was 20 mm, the water-cement ratio was 0.3, and the target porosity was 20%. at which time the permeability coefficient of RAC was 4.53 mm/s, and the relative errors were 5.06% and 4.19% respectively compared with the measured data.
Acknowledgement: Thanks to the help provided by Teacher Cai Xin of the College of Mechanics and Materials from Hohai University.
Funding Statement: This work was supported by the Jiangsu Water Conservancy Science and Technology Project of China (2016036).
Conflicts of Interest: The authors declare that they have no conflicts of interest to report regarding the present study.
References
1. Sambito, M., Severino, A., Freni, G., Neduzha, L. (2021). A systematic review of the hydrological, environmental and durability performance of permeable pavement systems. Sustainability, 13(8), 4509. DOI 10.3390/su13084509. [Google Scholar] [CrossRef]
2. Chen, L. M., Chen, J. W., Lecher, T., Chen, T. H., Davidson, P. (2020). Assessment of clogging of permeable pavements by measuring change in permeability. Science of the Total Environment, 749, 141352. DOI 10.1016/j.scitotenv.2020.141352. [Google Scholar] [CrossRef]
3. Anwar, F. H., EL-Hassan, H., Hamouda, M., Hinge, G., Mo, K. H. (2022). Meta-analysis of the pervious concrete with cement and aggregate replacements. Buildings, 12(4), 461. DOI 10.3390/buildings12040461. [Google Scholar] [CrossRef]
4. Wen, F. S., Fan, H. F., Zhai, S. T., Zhang, K. Q., Liu, F. S. (2020). Pore characteristics and numerical seepage simulation of antifreeze permeable concrete. Construction and Building Materials, 255, 119310. DOI 10.1016/j.conbuidmat.2020.119310. [Google Scholar] [CrossRef]
5. Xie, X. G., Zhang, T. S., Wang, C., Yang, Y. M., Bogush, A. et al. (2020). Mixture proportion design of pervious concrete based on the relationships between fundamental properties and skeleton structures. Cement & Concrete Composites, 113, 103693. DOI 10.1016/j.cemconcomp.2020.103693. [Google Scholar] [CrossRef]
6. Kaplan, G., Gulcan, A., Cagdas, B., Bayraktar, O. Y. (2021). The impact of recycles coarse aggregates obtained from waste concretes on lightweight pervious concrete properties. Environmental Science and Pollution Research, 28(14), 17369–17394. DOI 10.1007/s11356-020-11881-y. [Google Scholar] [CrossRef]
7. Alshareedah, O., Nassiri, S. (2021). Pervious concrete mixture optimization, physical, and mechanical properties and pavement and pavement design: A review. Journal of Cleaner Prodution, 288, 125095. DOI 10.1016/j.jclepro.2020.125095. [Google Scholar] [CrossRef]
8. Nguyen, D. H., Sebaibi, N., Boutouil, M., Leleyter, L., Baraud, F. (2014). A modified method for the design of pervious concrete mix. Construction and Building Materials, 73, 271–282. DOI 10.1016/j.conbuildmat.2014.09.088. [Google Scholar] [CrossRef]
9. Kayhanian, M., Anderson, D., Harvey, J. T., Jones, D., Muhunthan, B. (2012). Permeability measurement and scan imaging to assess clogging of pervious concrete pavements in parking lots. Journal of Environmental Management, 95, 114–123. DOI 10.1016/j.jenvman.2011.09.021. [Google Scholar] [CrossRef]
10. Chandrappa, A. K., Biligiri, K. P. (2016). Comprehensive investigation of permeability characteristics of pervious concrete: A hydrodynamic approach. Construction and Building Materials, 123, 627–637. DOI 10.1016/j.conbuildmat.2016.07.035. [Google Scholar] [CrossRef]
11. Li, L. G., Feng, J. J., Lu, Z. C., Xie, H. Z., Xiao, B. F. et al. (2022). Effects of aggregate bulking and film thicknesses on water permeability and strength of pervious concrete. Powder Technology, 396, 743–753. DOI 10.1016/j.powtec.2021.11.019. [Google Scholar] [CrossRef]
12. Wu, F., Yu, Q. L., Brouwers, H. J. J. (2022). Mechanical, absorptive and freeze-thaw properties of pervious concrete appling a bimodal aggregate packing model. Construction and Building Materials, 333, 127445. DOI 10.1016/j.conbuildmat.2022.127445. [Google Scholar] [CrossRef]
13. Zhong, R., Xu, M., Netto, R. V., Wille, K. (2016). Influence of pore tortuosity on hydraulic conductivity of pervious concrete: Characterization and modeling. Construction and Building Materials, 125, 1158–1168. DOI 10.1016/j.conbuildmat.2016.08.060. [Google Scholar] [CrossRef]
14. Gaedicke, C., Torres, A., Huynh, K. C. T., Marines, A. (2016). A method to correlate splitting tensile strength and compressive strength of pervious concrete cylinders and cores. Construction and Building Materials, 125, 271–278. DOI 10.1016/j.conbuildmat.2016.08.031. [Google Scholar] [CrossRef]
15. Zhong, R., Wille, K. (2016). Compression response of normal and high strength pervious concrete. Construction and Building Materials, 109, 177–187. DOI 10.1016/j.conbuildmat.2016.01.051. [Google Scholar] [CrossRef]
16. Akand, L., Yang, M. J., Gao, Z. L. (2016). Characterization of pervious concrete through image based micromechanical modeling. Construction and Building Materials, 114, 547–555. DOI 10.1016/j.conbuildmat.2016.04.005. [Google Scholar] [CrossRef]
17. Pieralisi, R., Cavalaro, S. H. P., Aguado, A. (2016). Discrete element modelling of the fresh state behavior of pervious concrete. Cement and Concrete Research, 90, 6–18. DOI 10.1016/j.cemconres.2016.09.010. [Google Scholar] [CrossRef]
18. Samuel, M., Eric, S., Fabien, P. (2011). Impact of pervious concrete porosity on permeability by 3D image analysis. Proceedings of the Conference on Pervious Concrete, Tampa, FL, USA. [Google Scholar]
19. Aneel, M., Mushtaq, A., Fawad, A., Abdul, B., Muhammad, N. A. K. (2018). Experimental investigation of compressive strength and infiltration rate of pervious concrete by fully reduction of sand. Civil Engineering Journal, 4(4), 724–731. DOI 10.28991/cej-0309127. [Google Scholar] [CrossRef]
20. Ma, H. Y., Wu, Z. Y., Zhang, J. H., Yu, H. F., Liang, L. M. (2021). Uniaxial compressive properties of ecological concrete: Experimental and three-dimensional (3D) mesoscopic investigation. Construction and Building Materials, 278, 121034. DOI 10.1016/J.CONBUILDMAT.2020.121034. [Google Scholar] [CrossRef]
21. Wu, Z. Y., Zhang, J. H., Yu, H. F., Ma, H. Y., Wang, H. et al. (2022). Experiment and mesoscopic modelling on the dynamic compressive behaviors of a new carbon fiber-reinforced cement-based composite. Cement & Concrete Composites, 130. DOI 10.1016/j.cemconcomp.2022.104519. [Google Scholar] [CrossRef]
22. Zhang, Q. Y., Feng, X. J., Chen, X. D., Lu, K. (2020). Mix design for recycled aggregate pervious concrete based on response surface methodology. Construction and Building Materials, 259, 119776. DOI 10.1016/j.conbuildmat.2020.119776. [Google Scholar] [CrossRef]
23. Poorarbabi, A., Ghasemi, M., Moghaddam, M. A. (2020). Concrete compressive strength prediction using networks based on non-destructive tests and a self-calibrated response surface methodology. Journal of Nondestructive Evaluation, 39(4), 1–11. DOI 10.1007/s10921-020-00718-w. [Google Scholar] [CrossRef]
24. Adamu, M., Ayeni, K. O., Haruna, S. I., Mansour, Y. E. H. L., Haruna, S. (2021). Durability performance of pervious concrete containing rice husk ash and calcium: A response surface methodology approach. Case Studies in Construction Materials, 14, e00547. DOI 10.1016/j.cscm.2021.e00547. [Google Scholar] [CrossRef]
25. Siamardi, K. (2022). Optimization of fresh and hardened properties of structural light weight self-compacting concrete mix design using response surface methodology. Construction and Building Materials, 317, 125928. DOI 10.1016/j.conbuildmat.2021.125928. [Google Scholar] [CrossRef]
26. Chen, X. D., Wang, H. (2021). Life-cycle assessment and multi-criteria performance evaluation of pervious concrete pavement with fly ash. Resources Conservation and Recycling, 177. DOI 10.1016/j.resconrec.2021.105969. [Google Scholar] [CrossRef]
27. ACI Committee 522 (2010). Report on pervious concrete. USA: American Concrete Institute. [Google Scholar]
28. Shi, Z. X., Song, Z. N., Jiang, L. H. (2016). Porous concrete and pervious pavement. China: China Architecture & Building Press. [Google Scholar]
29. Sun, R., Wang, D. M., Cao, H. M., Wang, Y. R., Lu, Z. H. et al. (2021). Ecological pervious concrete in revetment and restoration of coastal wetlands: A review. Construction and Building Materials, 303, 124590. [Google Scholar]
30. Ma, H., Sun, Z. J., Ma, G. G. (2022). Research on compressive strength of manufactured sand concrete based on response surface methodology. Applied Sciences, 12(7), 3506. DOI 10.3390/app12073506. [Google Scholar] [CrossRef]
31. Rooholamini, H., Hassani, A., Aliha, M. R. M. (2018). Evaluating the effect of macro-synthetic fibre on the mechanical properties of roller-compacted concrete pavement using response surface methodology. Construction and Building Materials, 159, 517–529. DOI 10.1016/j.conbuildmat.2017.11.002. [Google Scholar] [CrossRef]
32. Mosaberpanah, M. A., Eren, O., Tarassoly, A. R. (2019). The effect of nano-silica and waste glass powder on mechanical, rheological, and shrinkage properties of UHPC using response surface methodology. Journal of Materials Research and Technology, 8(1), 804–811. DOI 10.1016/J.JMRT.2018.06.011. [Google Scholar] [CrossRef]
33. Liu, C. Y., Yang, H. B. (2021). Multi-objective optimization of a concrete thermal energy storage system based on response surface methodology. Applied Thermal Engineering, 202, 117847. DOI 10.1016/j.applthermaleng.2021.117847. [Google Scholar] [CrossRef]
34. Li, Z. P., Lu, D. G., Gao, X. J. (2021). Optimization of mixture proportions by statistical experimental design using response surface method-A review. Journal of Building Engineering, 36, 102101. DOI 10.1016/J.JOBE.2020.102101. [Google Scholar] [CrossRef]
35. Pakshir, M., Haghbin, A., Haghbin, M. (2020). Using the response surface method to optimize weight loss of steel Bar in concrete exposed to chloride. Iranian Journal of Science and Technology-Transaction of Civil Engineering, 45(2), 561–571. DOI 10.1007/s40996-020-00501-x. [Google Scholar] [CrossRef]
Cite This Article
 Copyright © 2023 The Author(s). Published by Tech Science Press.
This work is licensed under a Creative Commons Attribution 4.0 International License , which permits unrestricted use, distribution, and reproduction in any medium, provided the original work is properly cited.
 Downloads
 Citation Tools