
 Submit a Paper
 Propose a Special lssue
 Open Access
ARTICLE

Two-Step Preparation of Hierarchical Porous Carbon Materials Derived from Tannin for Use as an Electrode Material for Supercapacitors
1
College of Material Engineering, Fujian Agriculture and Forestry University, Fuzhou, 350002, China
2
Maritime College, Zhejiang Ocean University, Zhoushan, 316022, China
* Corresponding Authors: Lu Luo. Email: ; Weigang Zhao. Email:
(This article belongs to the Special Issue: Advanced Renewable Energy Storage Materials and Their Composite: Preparation, Characterization and Applications)
Journal of Renewable Materials 2023, 11(6), 2631-2646. https://doi.org/10.32604/jrm.2023.027163
Received 17 October 2022; Accepted 02 December 2022; Issue published 27 April 2023
 View Full Text
 Download PDF
Abstract
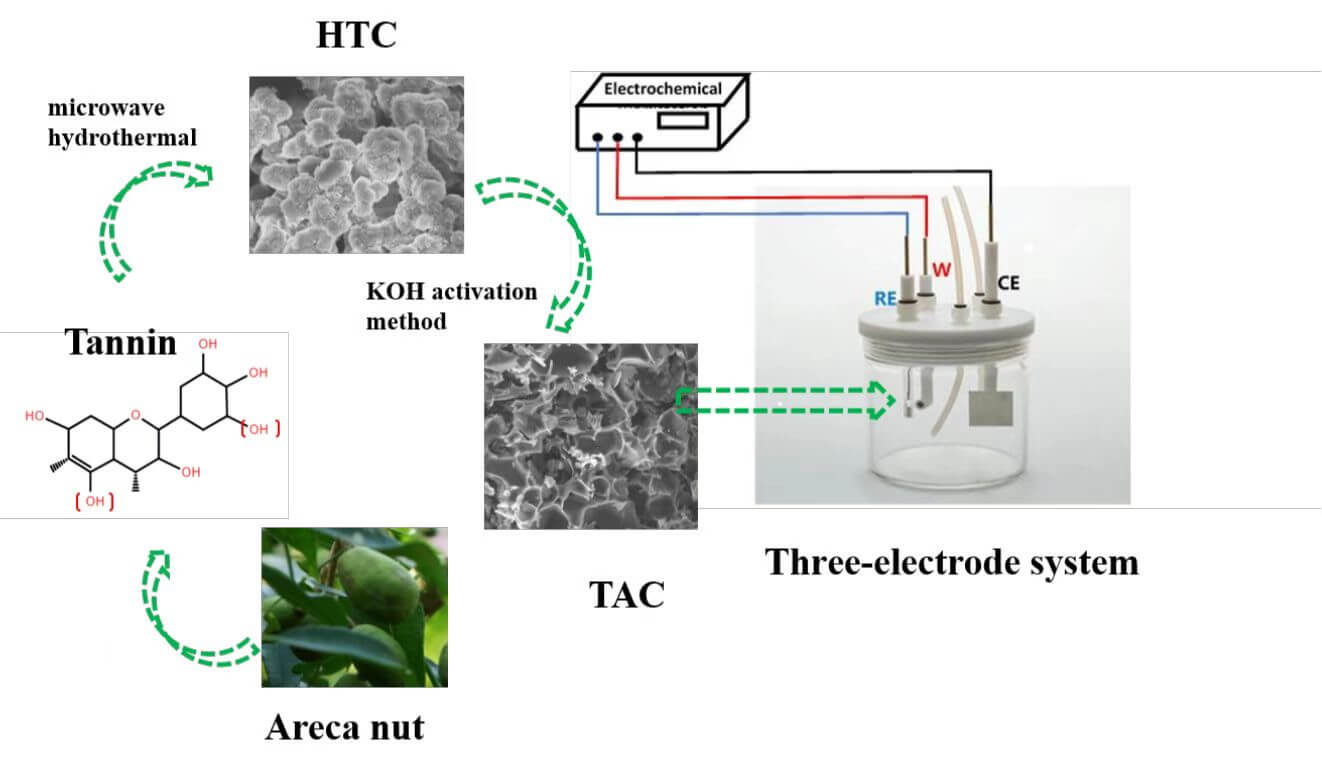
The development and utilization of biomass and agroforestry processing byproducts for high-value applications have been an important topic in the field of renewable materials research. Based on this, a two-step microwave hydrothermal pre-carbonization and KOH activation method was proposed to synthesize tannin-based activated carbons with a high specific surface area, hierarchical pore structure, and good electrochemical performance. The microstructure, texture properties, and physicochemical characteristics were investigated. The results show that the prepared tannin-based activated carbons presented a hierarchical pore structure (micro- and mesopores) with a specific surface area as high as 997.46 m3 g−1 . The electrochemical analysis shows that the tannin-based activated carbons have good wettability and charge transfer rates. Under the three-electrode system with 6 M KOH as the electrolyte, the active material TAC600-4 had a maximum specific capacitance of 171 F g−1 at 0.5 A g−1 . As the current density increases to 10 A g−1 , the specific capacitance can still be maintained at 149 F g−1 , indicating a good rate capability. Therefore, the specific surface area and pore size of tannin-based activated carbons can be effectively adjusted by the alkali/carbon ratio, making it a promising supercapacitor electrode material and providing a new method for the high-value development of tannins in the field of electrochemical energy storage.Graphic Abstract
Keywords
Taking a new approach to energy storage, electrochemical technology plays a crucial role in modern society, especially for the efficient conversion and utilization of new renewable energy, such as solar energy [1] and wind energy [2]. Carbon materials, such as graphene [3], carbon nanotubes [4], carbon fibers [5], and activated carbons (ACs) [6,7], have played an essential role in the field of energy storage. Among them, ACs have been widely used and studied for applications in lithium-ion batteries [8], sodium-ion batteries [9], supercapacitors [10], and other fields due to their large specific surface area (SSA), good chemical stability, and considerable porosity [11]. Several precursors can be used to make ACs, including coal, pitch, polymers, biomass materials, and so on. Under the increasingly prominent contradiction between energy and the environment, how to use cheap biomass or agricultural and forestry wastes to produce sustainable AC materials is an important research method to achieve the requirements of green and sustainable development, which is of great significance for the development of energy storage devices [12].
There are tannins in most advanced plants, and their primary function is to protect against insect gnawing and fungal erosion. There are more than 600 kinds of tannin-rich plants in the world that can be used to produce tannin extract. In China, there are more than 70 kinds of plants with high tannin content. Larch, cortex myricae, mimosa, and quebracho wood are the most common tannin sources. In terms of their chemical structure and properties, tannins can generally be divided into two categories [13]. One is hydrolytic tannins, which can be hydrolyzed into carbohydrates and polyphenols, such as gallic acid. The other type is condensed tannins. Condensed tannin extract is composed of flavonoid oligomers with different average degrees of polymerization. In addition, there are a small number of flavonoid analogs and carbohydrates (such as hemicellulose, amino acids, and imine acids), which are not hydrolyzed [14]. It has been demonstrated that condensed tannins exhibit high reactivity and self-condensation at high temperatures [15]. The use of condensed tannins is currently being investigated in various fields, such as thermal insulation foam [16,17], aerogel, and wood adhesive [18,19]. As known, tannin is the most abundant compound extracted from biomass materials, except cellulose, hemicellulose, and lignin, which makes tannin a low-cost (0.6 € kg−1), nontoxicity, green and renewable source for producing carbon materials. Moreover, tannin is a natural phenolic biomolecule containing aromatic rings bearing hydroxyl groups (see Fig. 1), which makes tannin a higher carbon content material, and thus a promising precursor for carbon materials preparation.
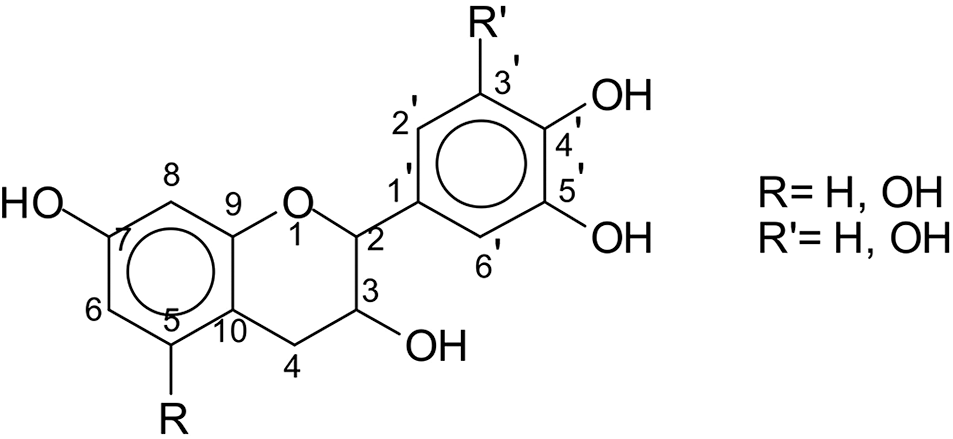
Figure 1: Flavonoid unit structure
Hydrothermal carbonization (HTC) is a low-cost and large-scale carbonization method. During hydrothermal carbonization, the surface of carbon materials can be given rich oxygen-containing functional groups as a result of the appropriate temperature and pressure conditions, without the need to add additional reagents. Furthermore, as a result of hydrothermal treatment, biomass materials will form abundant carbon microspheres, resulting in a substantial increase in the SSA of the carbon materials [20,21]. There is, however, a drawback to the traditional hydrothermal synthetic method, which is that it takes a long time, resulting in low efficiency. Additionally, during the heating process, the material could be heated unevenly, leading to poor product performance. The microwave hydrothermal method has been developed to combine the advantages of hydrothermal carbonization with those of the microwave heating method. Compared with the traditional hydrothermal method, microwave-assisted heating is introduced to cause vibration heating of molecules inside the material itself, that is, heating from inside to outside, to make the heating more uniform and avoid agglomeration during the process of carbonization [20,22]. There is no doubt that the most important advantages associated with microwave hydrothermal synthesis are the short heating time, rapid reaction, and high efficiency. These features make microwave hydrothermal synthesis a very promising method for carbon material synthesis. However, compared with common activated carbons (ACs), the SSA of hydrothermal carbon prepared by the microwave hydrothermal method is relatively low [14]. It is well known that the activation methods include physical activation (CO2/steam) and chemical activation (KOH/NaOH/H3PO4/ZnCl2) [23–27]. KOH activation is a widely used chemical activation method. It has been shown that KOH activation can give materials a greater porosity in comparison to physical and other chemical methods and a more developed pore structure. The reaction of KOH and its transformation products (K2CO3, K2O, K) with C forms a large number of micropores and mesopores. By adjusting the alkali/carbon ratio as well as the activation temperature, the SSA, pore size, and pore size distribution (PSD) of the material can be well adjusted to meet the demands of different applications [28–31].
In this work, low cost, nontoxicity, green and renewable biomass materials of areca tannin were used as precursors due to the natural properties of phenolic biomolecules. The activated carbons were prepared by a two-step microwave hydrothermal carbonization and then the KOH activation process under different preparation conditions. The microstructure and pore structures, chemical properties, and further electrochemical performance were explored and evaluated. This work provides a new method for the preparation of tannin-based carbon materials and a new application for tannin-based activated carbon, which can greatly increase the application of agricultural and forestry waste and has a good effect on preventing resource waste and environmental pollution.
Areca tannin (condensed tannin, mass fraction is 70 ± 2.0%, the moisture content is 4–5%) was purchased from Xinhua Co., Ltd., China. Potassium hydroxide (purity 85%) and hydrochloric acid (mass fraction 36%–38%) were purchased from Shanghai Aladdin Biochemical Co., Ltd., China and PVDF (polyvinylidene fluoride), nickel foam, and acetylene black were purchased from Cyber Electrochemical Materials Network, China. N-Methyl-2-pyrrolidone (NMP, N-methylpyrrolidone) was purchased from Tianjin Zhiyuan Chemical Reagent Co., Ltd., China.
2.2 Preparation of Tannin-Based Activated Carbons
The mixture of 10 g tannin and 40 g water was evenly mixed and then transferred to a 100 mL Teflon microwave hydrothermal reactor, which was raised to 180°C at a heating rate of 3 °C min−1. After 1 h, the mixture was cooled to room temperature. Then, the samples were filtered and washed with deionized water for 3 times. The samples were dried for 12 h to obtain a brown solid carbon (hydrothermal carbon, HTC). 2 g of HTC was then placed in a nickel crucible. The HTC and KOH were physically mixed according to an alkali/carbon (KOH/HTC) mass ratio of 0, 2, and 4. The activation temperature, heating rate, flow rate of nitrogen atmosphere, and activation time were 600°C, 5 °C min−1, 1000 mL min−1, and 1 h, respectively. After cooling to room temperature, it was washed three times with 1 mol L−1 hydrochloric acid, followed by deionized water several times. The washed tannin-based activated carbon (TAC) was dried in an air-dry oven at 105°C for 24 h to obtain TAC powder samples, as shown in Fig. 2. The resulting TAC product is denoted as TAC600-Y, where Y is the alkali/carbon (KOH/HTC) mass ratio.
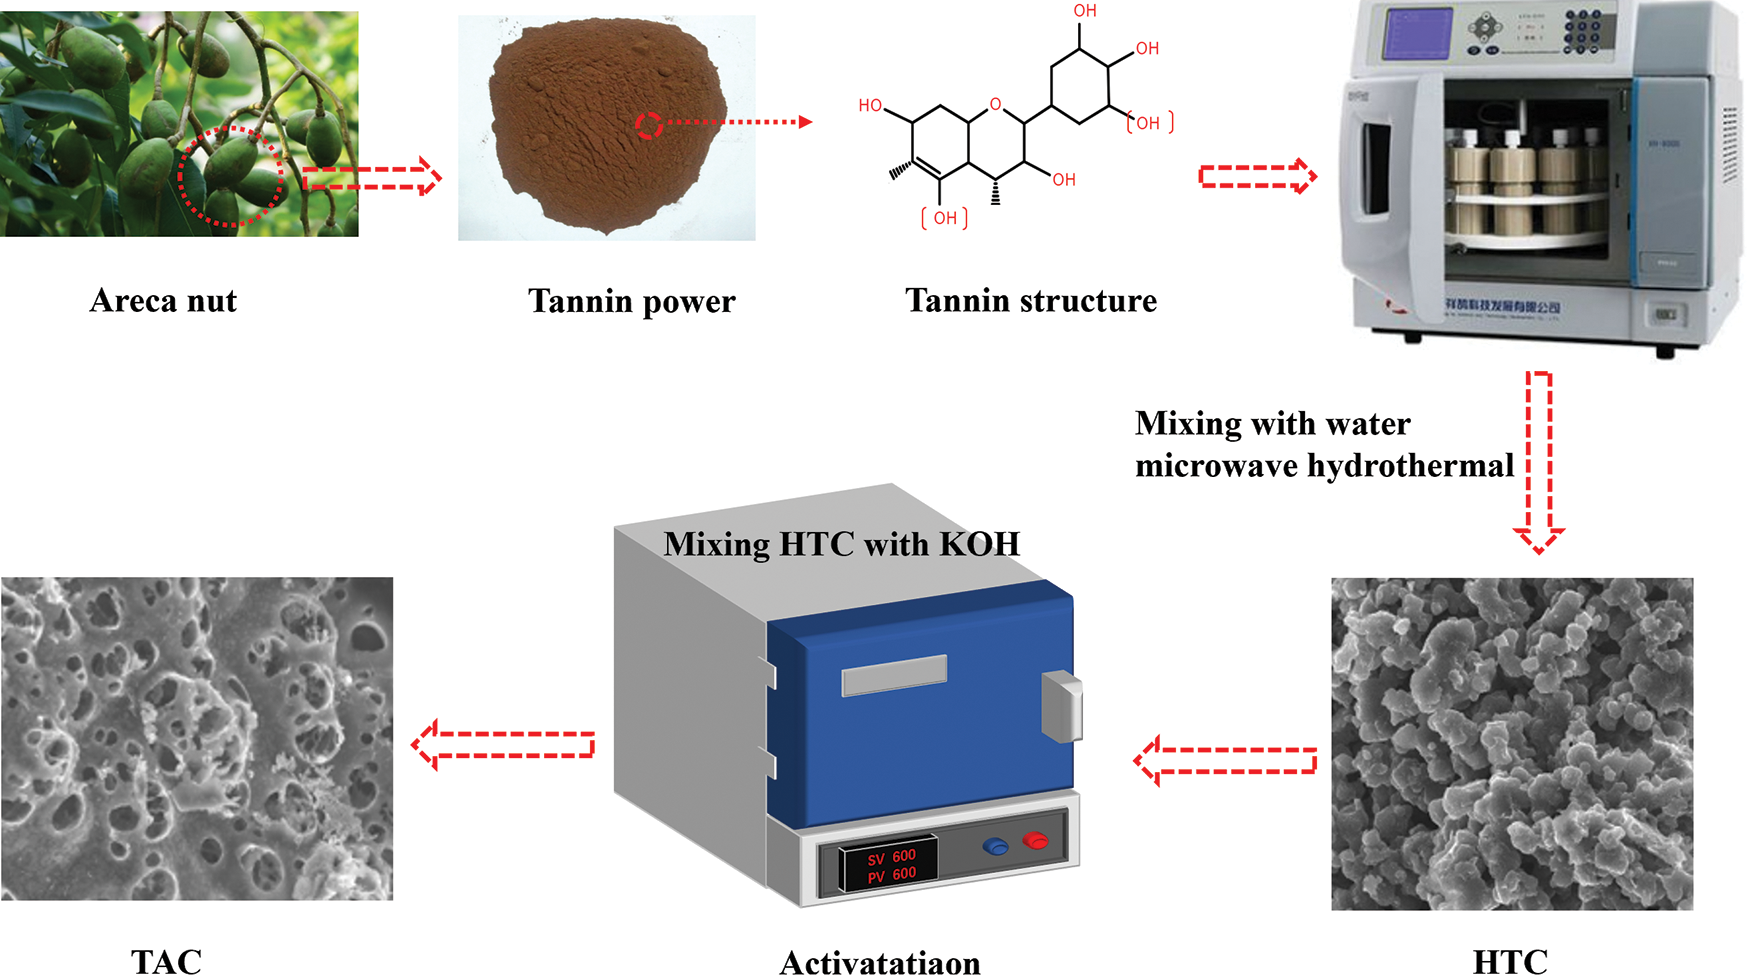
Figure 2: Schematic diagram of the preparation process of TAC samples
The apparent morphology of the samples was observed by using scanning electron microscopy (SEM, FEG Hitachi S3400, Japan). The pore and texture structure were characterized using nitrogen adsorption-desorption analysis performed at −196°C (ASAP 2020, Micromeritics, USA). The SSA and PSD was calculated according to the BET and DFT equations [26,32]. X-ray diffraction analysis (Type D8 ADVANCE, Germany) was performed using Cu-Kα as the radiation source. The Raman spectra were used to identify chemical characteristics within the range of 500 and 2500 cm−1 (WITec alpha300R, Germany). The chemical elements in the sample were calculated from X-ray photoelectron spectroscopy analysis (XPS, Thermo Scientific K-Alpha, USA). The surface functional groups were characterized by Fourier transform infrared spectrometer (FTIR, Nicolet iS10, USA).
2.4 Electrochemical Performance
The electrochemical performance was evaluated by a three-electrode (3E) system and a two-electrode system (2E, symmetric supercapacitor) with an electrochemical workstation (Zennium pro, Germany). TAC, acetylene black and PVDF were mixed and ground evenly according to a mass ratio of 8:1:1, and a proper amount of N-methyl-2-pyrrolidenone was added to form a uniform slurry and then evenly applied on the surface of nickel foam (1 * 1 cm). The working electrode was obtained by placing the mixture of nickel foam in an 85°C oven and then drying it for 8 h. The load of the active substance (TAC) per electrode was approximately 3 mg. For the three-electrode system, Hg/HgO and platinum electrodes were used as the reference electrode and counter electrode, respectively. KOH (6 mol/L) was used as the electrolyte for both the 3E and the 2E systems. More details about device assembly, specific capacitance, energy density calculation and other issues can be found in our previous works [27].
3.1 Microstructure and Pore Structures
By using scanning electron microscopy, the microscopic morphologies of tannin precursor, HTC, and TAC600-4 were examined, as shown in Fig. 3. The results showed that the tannin (Fig. 3a) is a powder-like solid with a smooth surface. By using microwave assisted hydrothermal treatment, the hydrothermal carbon has been obtained as a carbon unit made up of stacked microspheres (Fig. 3b), thus increasing its SSA remarkably, but it has a relatively smooth surface, similar to other biomass-based hydrothermal carbons [33]. As a result of the further KOH activation treatment (Figs. 3c and 3d), the surface of TAC600-4 is no longer smooth, and many pore structures are visible, which has significant implications for improving the electrochemical performance [34,35]. The EDX analysis results from TAC600-4 showed that only carbon and oxygen elements were present, and the contents were 81.8% and 18.2%, respectively.
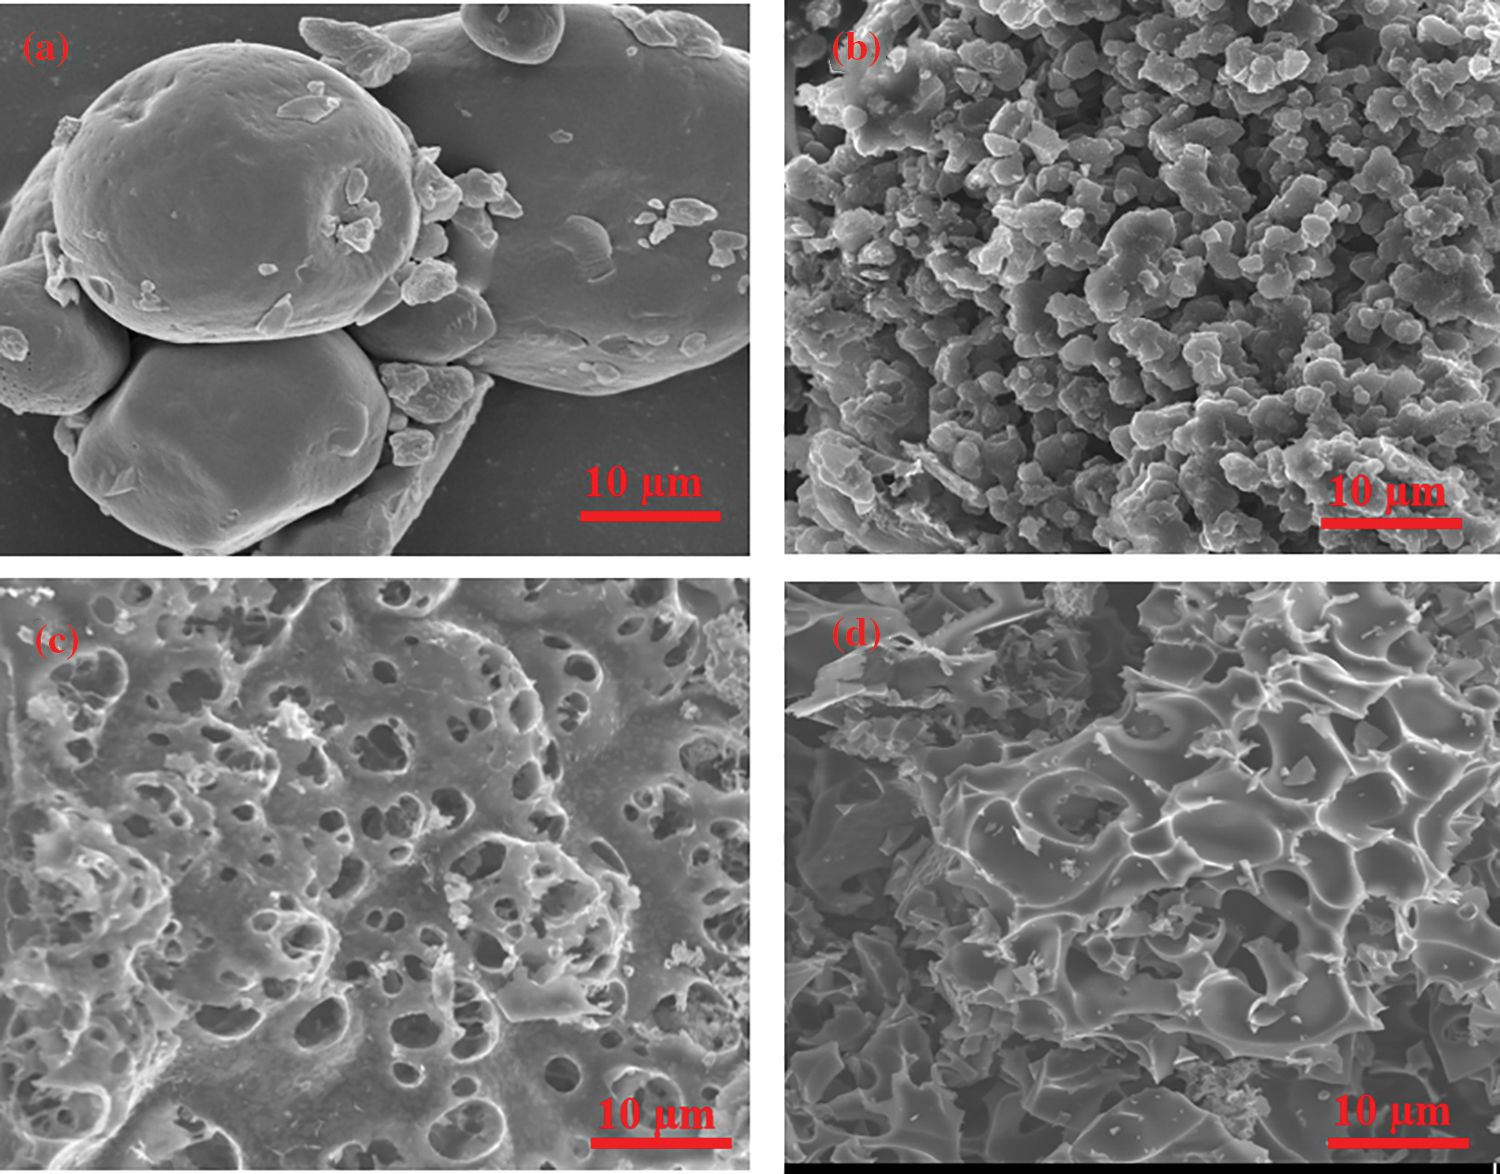
Figure 3: SEM images of (a) tannin; (b) HTC; and (c–d) TAC600-4
The texture structure of all samples was further investigated by N2 adsorption/desorption analysis at −196°C. Fig. 4a clearly indicates that all the isotherms correspond to type I as defined by the IUPAC classification [28], which indicates that TAC samples are predominantly microporous. Additionally, it can be observed that there is a small hysteresis loop near saturation pressure, indicating that the materials may also contain partial mesopores [36]. The PSD curves in Fig. 4b further confirm the above conclusions. Additionally, it is important to note that when the alkali/carbon ratio increases, both the total pore volume and the micropore volume of the material will gradually increase. Upon reaching a ratio of 4 alkalies to carbon, KOH reacts with carbon, increasing not only the micropore volume, but also the mesopore volume. There are two ways in which pores develop during the KOH activation process: either new pores are formed or existing pores are expanded. In the case of an increase in the alkali/carbon ratio of 4 as compared to 1, pore expansion becomes more dominant. A coexistence of micropores and mesopores within ACs can ensure that electrolyte ions can diffuse and circulate within the pores, which can have a positive effect on the electrochemical properties of activated carbon [37].
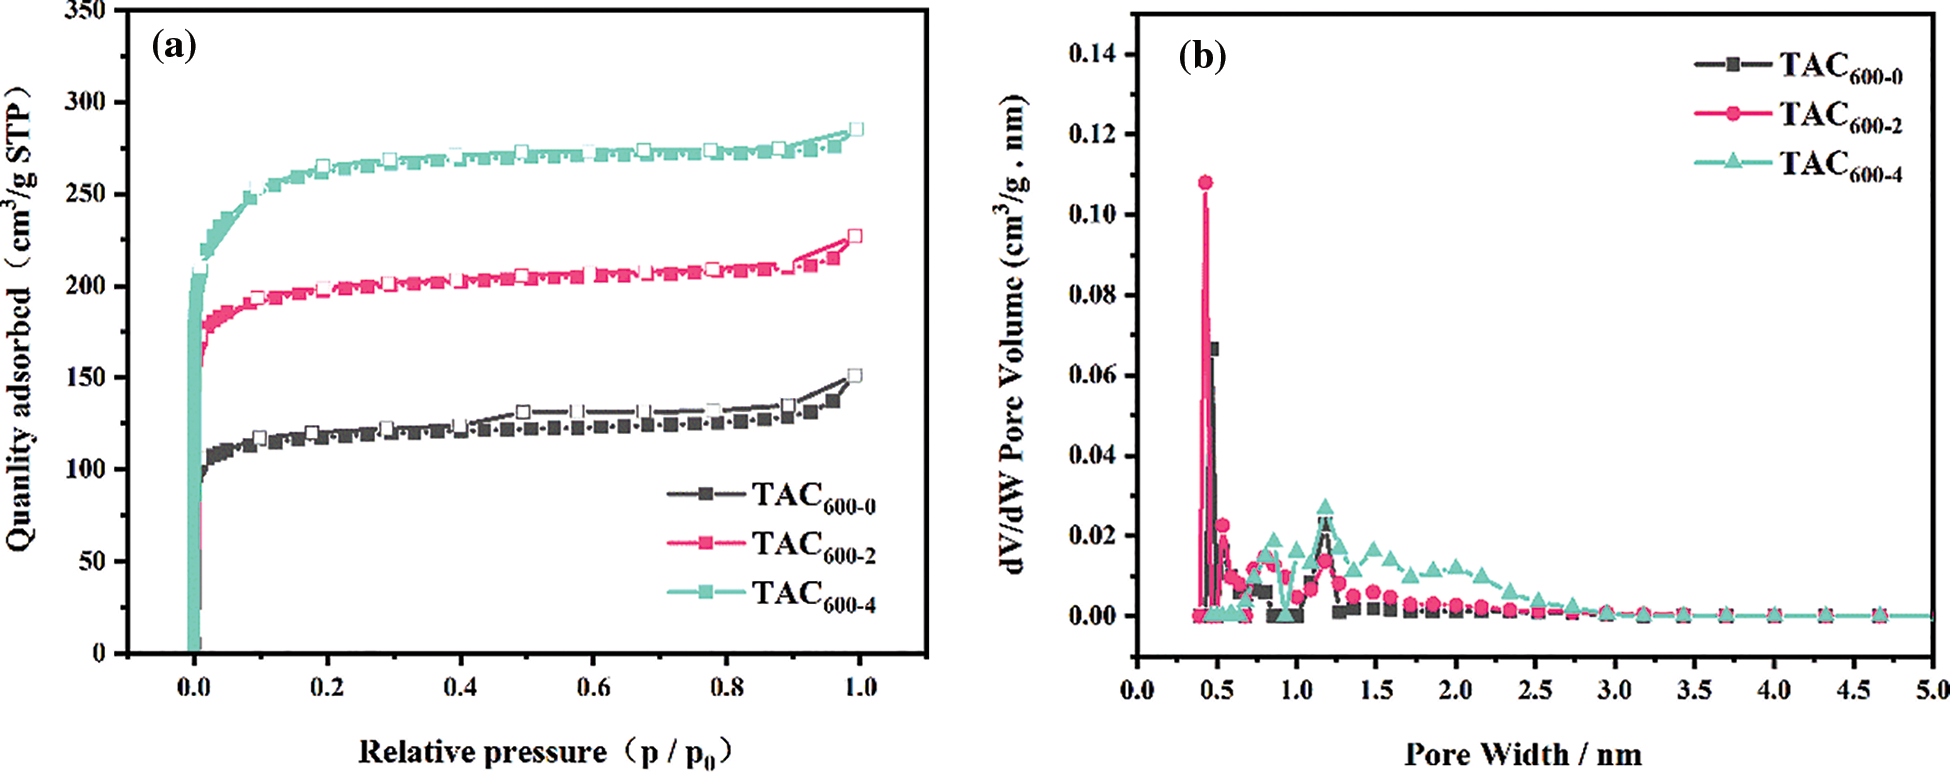
Figure 4: (a) N2 adsorption/desorption isotherms; (b) PSD curves of TACs
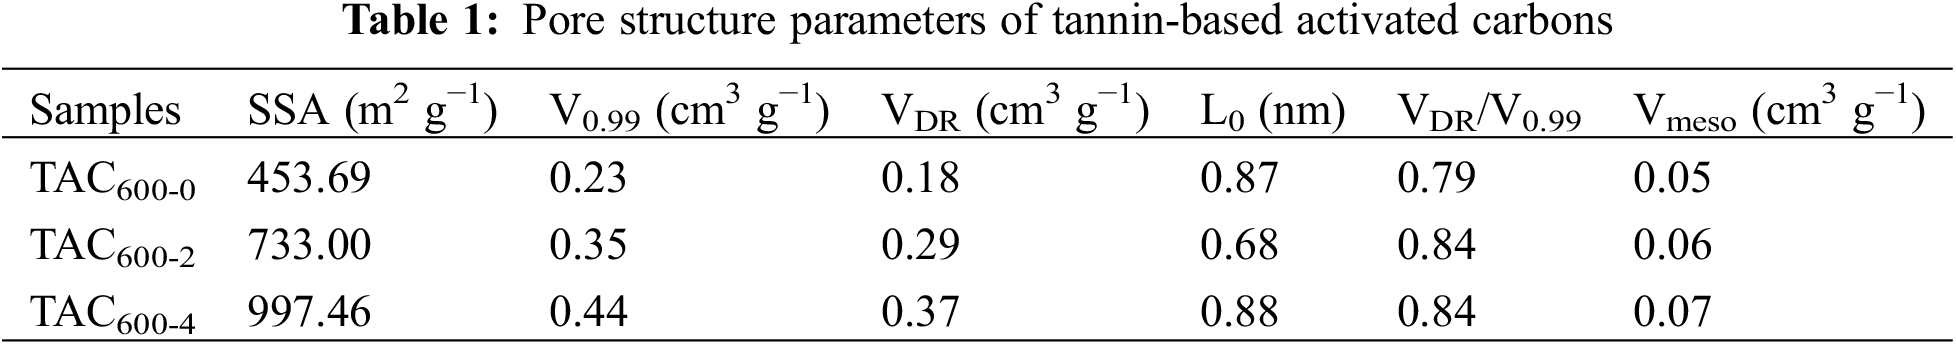
Table 1 summarizes the texture parameters of the TAC samples. As the alkali/carbon ratio increased, the SSA, the total pore volume, the micropore volume, and the mesopore volume all increased significantly. Sample TAC600-4 presents an SSA of up to 997.46 m2 g−1. It also has the highest total pore volume (0.44 cm3 g−1), micropore volume (0.37 cm3 g−1), and mesopore volume (0.07 cm3 g−1), compared with other samples. VDR/V0.99 is in the range of 0.79 to 0.84, further confirming that all the TAC samples are mainly micropores, which is consistent with the conclusion from Fig. 4.
In Fig. 5, the results of XRD and Raman spectroscopy analyses are presented. The XRD patterns of the TAC samples present two broad peaks at approximately 24° and 43°, which are crystal plane reflections of classical graphite carbons (002) and (101), indicating the amorphous nature of the samples (Fig. 5a). The Raman spectra are shown in Fig. 5b. The D band at 1350 cm−1 corresponds to the defect sites and disordered SP2 hybrid carbon atoms of graphite, which is a typical sign of graphene carbon [38]. The G band at 1580 cm−1 corresponds to SP2 bonded carbon atoms, which is a typical characteristic of graphene [39]. The intensity ratio of the D-band to the G-band (ID/IG) is utilized to determine the degree of graphitization or disorder of carbon materials [40]. The graphitization degree of HTC is much higher than that of TACs, indicating that the subsequent KOH activation process greatly increases the defects and disorder of carbon materials. The ID/IG value of the TAC samples shows an increasing trend with an increasing alkali/carbon ratio, indicating that the degree of graphitization is decreasing, which is caused by the excessive etching and destruction of the ACs caused by the excessive KOH used. Both the pore structure and electrical conductivity determine the electrochemical characteristics of the carbon electrode. Previous studies have shown that a certain graphitization structure of the material is beneficial to the conductivity, so the selection of an appropriate alkali/carbon ratio is crucial for its electrochemical performance [27].
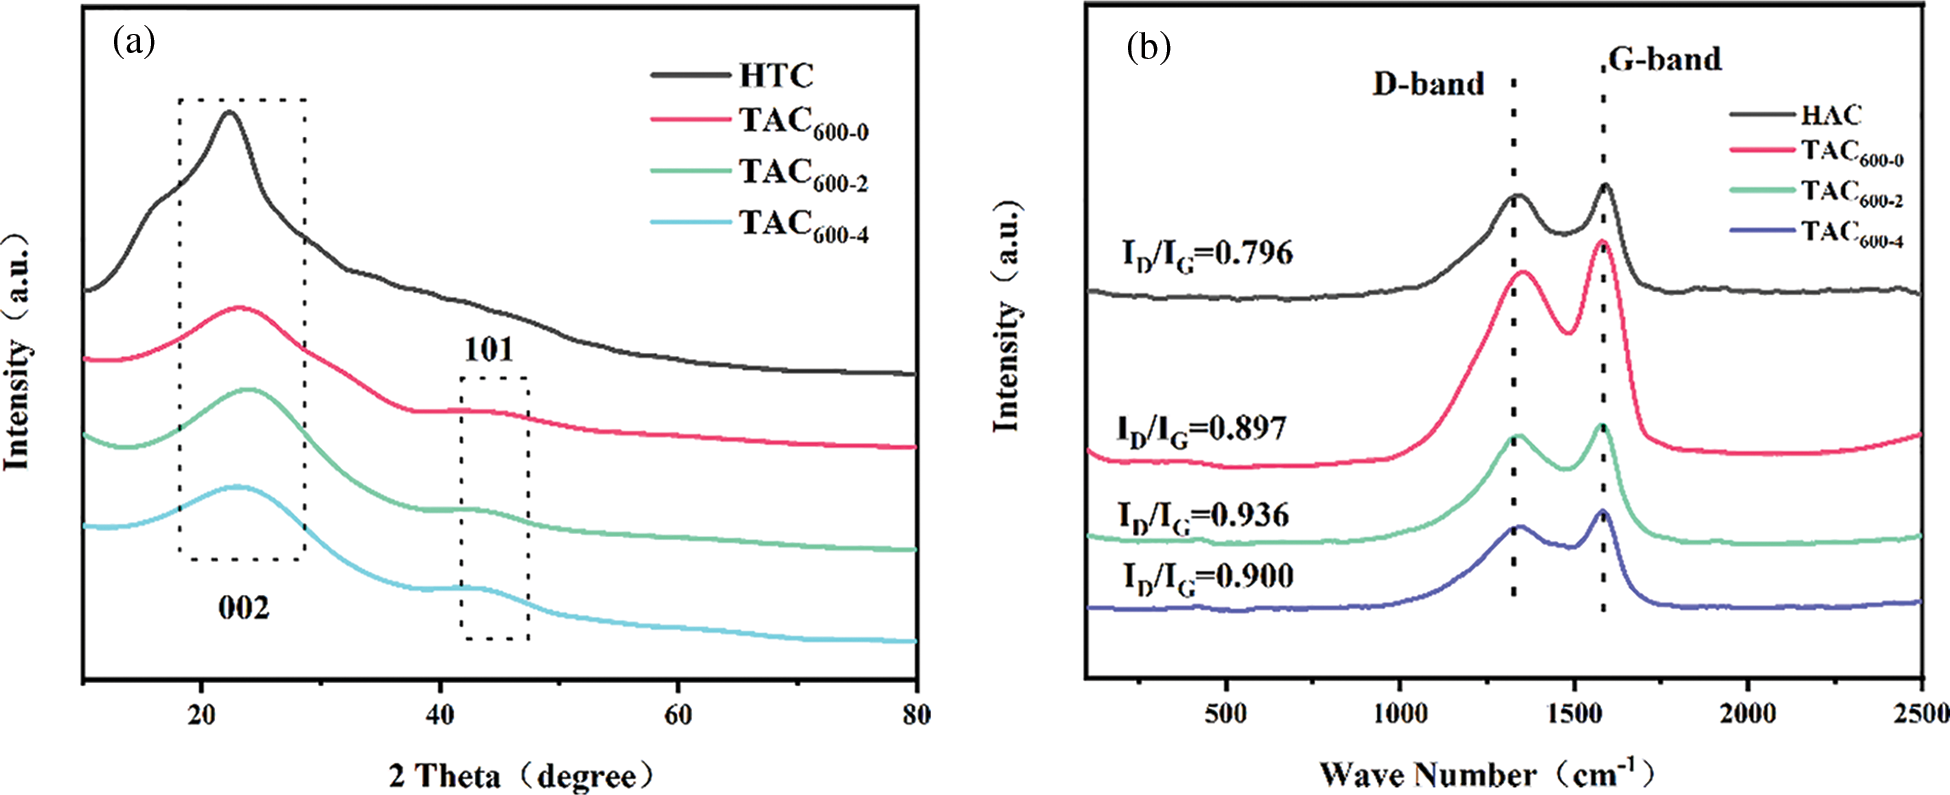
Figure 5: (a) XRD pattern; (b) Raman spectra of TACs
3.3 Characterization of the Chemical Structures
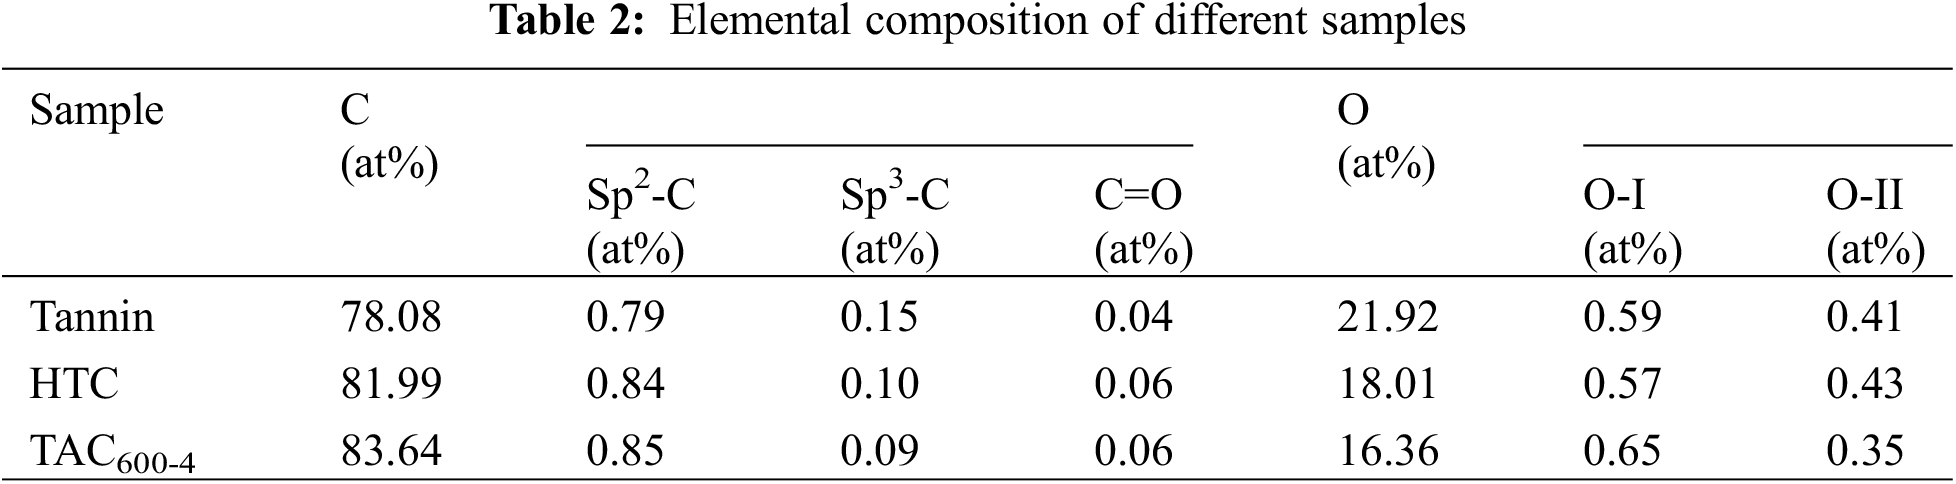
The chemical compositions of the tannin precursor, hydrothermal carbon HTC, and TAC600−4 were determined by XPS, see Fig. 6. The XPS spectra in Fig. 6a show two peaks at 284.60 and 532.74 eV, which belong to C1 s and O1 s, respectively. The C1 s peak can be divided into three independent peaks (Fig. 6b), corresponding to SP2-C (284.26 eV), SP3-C/C-O-C (285.8 eV), and C=O (288.45 eV) [41]. The high-resolution spectrum of O1 s shows two states (Fig. 6c). O-I (531.7 eV) is attributed to C=O double bonds, which belong to quinones, carbonyl groups and carboxylic acid groups [42]. O-II (532.8 eV) is related to -OH, ether bonds and ester groups in phenols and C=O in anhydrides [43]. The quantitative XPS results are shown in Table 2. By comparing the element content and chemical composition of tannin, HTC and TAC600-4, it is apparent that there are only two elements, C and O, in the sample. The C and O contents for these three samples are 78.08% and 21.92%, 81.99% and 18.01%, 83.64% and 16.36%, respectively. It can be seen that both the microwave hydrothermal carbonization and activation process can increase the C content and decrease the O content. The FTIR results in Fig. 6d further confirm the above XPS results; that is, both hydrothermal and activation processes will lead to the reduction and weakening of heteroatom functional groups, thus increasing C content [44].

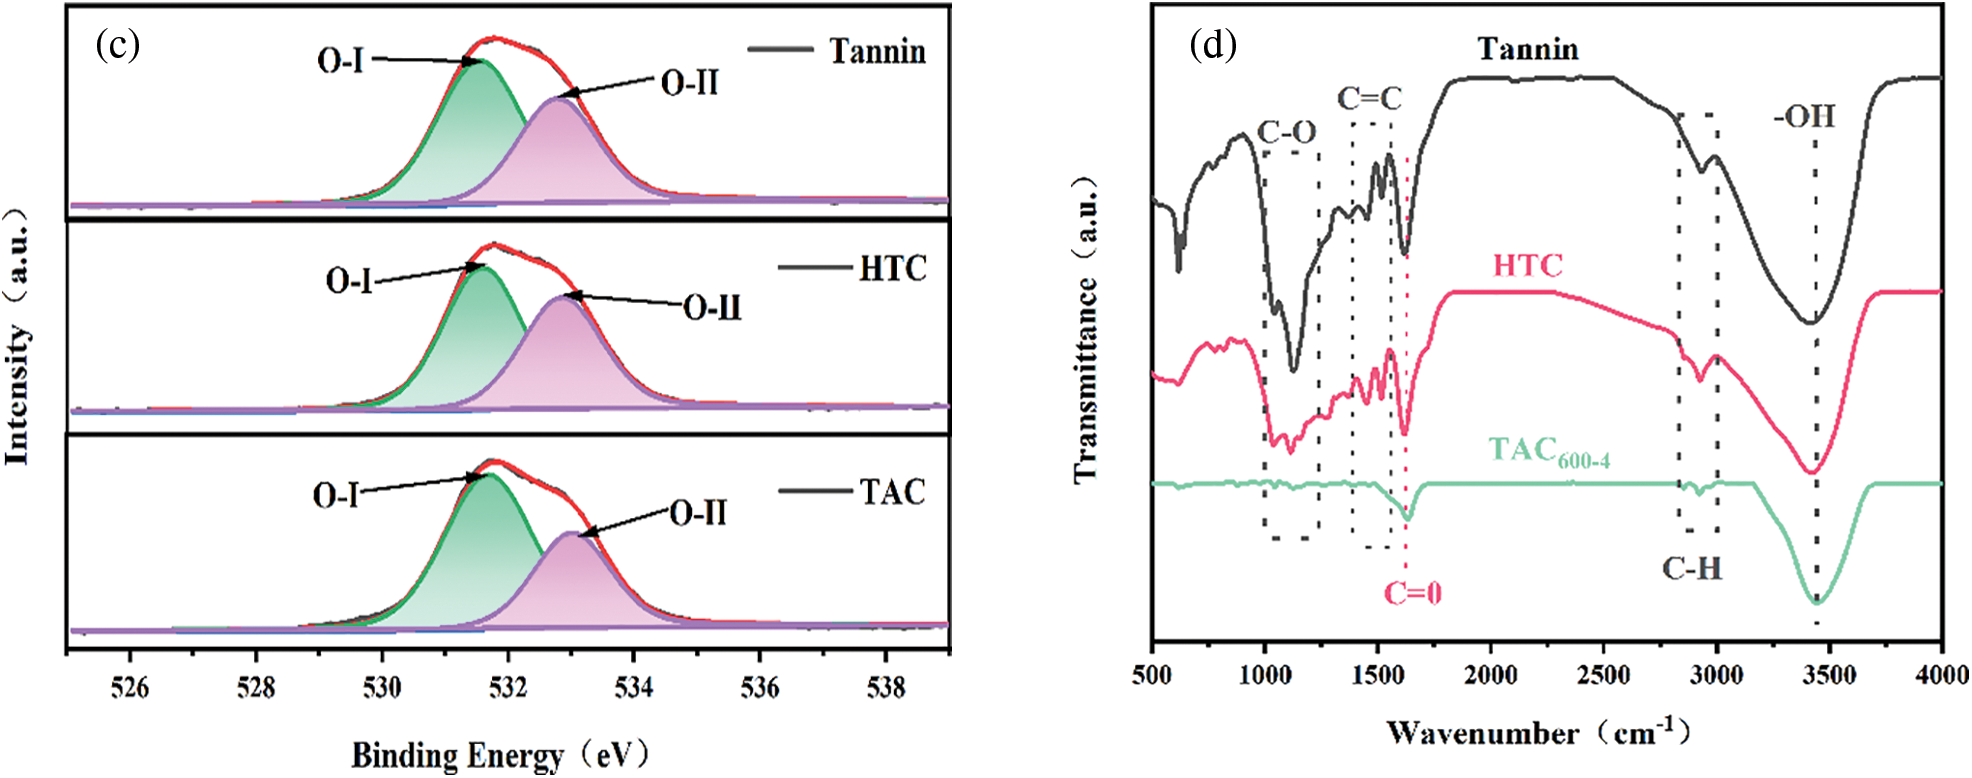
Figure 6: (a) XPS survey; (b) C 1s; (c) O 1s; (d) FT-IR spectra of tannin, HTC and TAC600-4
3.4 Electrochemical Properties
The electrochemical performance of all TAC samples was investigated by cyclic voltammetry (CV), constant current charge/discharge (GCD), and electrochemical impedance spectroscopy (EIS) in a 3E system, as illustrated in Fig. 7. Based on the CV curves in Fig. 7a, under the potential window of 0 to −1 V and a scan rate of 5 mV s−1, all the samples show a standard rectangular shape, showing that it is dominated by an electric double layer capacitor. Furthermore, there is a broad redox peak in the range of 0.4 to 0.9 V, indicating that a small amount of capacitance is contributed by the Faraday pseudocapacitance due to the heteroatom of O [45]. The CV curve shows that sample TAC600-4 has the largest specific capacitance. As shown in Fig. 7b, for sample TAC600-4, when the scan rate increases from 5 to 200 mV s−1, it can still maintain the rectangular shape, indicating that the material has excellent electrical double layer capacitance characteristics [46]. To further analyze the performance of TACs as supercapacitor electrodes, the GCD analysis was performed with 1 A g−1 under the 3E system. It is clear that all the samples maintained a relatively standard curve with isosceles triangle shape, as shown in Fig. 7c. Further analysis revealed that TAC600-4 has the longest discharge time and exhibited the highest specific capacitance of 171 F g−1, which is much higher than TAC600-2 and TAC600-0. TAC600-0 showes the lowest specific capacitance due to the lowest surface area and pore volumes. Although there is no definite linear relationship between the electrochemical performance of supercapacitors and the special surface area and pore size distribution. However, the higher surface area and pore volume due to the KOH activation can give the more active site and ion path channels, thus can improve the electrochemical performance of supercapacitors. As shown in Fig. 7d, for sample TAC600-4, when the current density increased from 0.5 to 10 A g−1, the GCD curve still shows good linearity and symmetry, indicating good reversibility for this material. Fig. 7e shows that with increasing current density, the specific capacitance decreases to a certain extent. Firstly, when the current density increases, the charging and discharging time becomes shorter, the activated carbon utilization rate becomes lower, the specific capacitance decreases, and the reduction rate becomes smaller [47,48]. At low current density, the ions in the electrolyte can fully enter the electrode interior and move in it, which improves the utilization rate of the electrode. With the increase of current density, charging and discharging can only be carried out on part of the electrode surface, and there is no time to fully charge and discharge, resulting in the decrease of active substance utilization and the decrease of specific capacitance. Furthermore, due to the increase of current density, a large number of electrolyte ions will be adsorbed at the interface of the electrode electrolyte, resulting in a rapid decrease in the concentration of electrolyte ions at the interface, thus the concentration polarization will inevitably increase. While maintaining a high current density must require a higher excitation voltage, but the number of interface charges does not increase, so the specific capacitance will decrease with the increase in current density. As a result of the increase in current density from 0.5 to 10 A g−1, the specific capacitance of TAC600-4 decreases from 171 to 149 F g−1. The GCD results demonstrated that a rate performance as high as 87% could be obtained. Compared with the results from the open literature, the lab-made TAC samples have comparable or even higher specific capacitance [49,50]. This can be attributed to the suitable hierarchical porous structure [26]. The interface dynamics between the carbon material and electrolyte were further explored by EIS, as shown in Fig. 7f. A typical Nyquist curve contains a semicircle in the high-frequency region and an almost vertical curve in the low-frequency region [51]. The intercept of the semicircle along the X-axis in the high-frequency region represents the internal resistance of the material, and the diameter of the semicircle in the middle-frequency region represents the charge transfer resistance. TAC600-4 shows a low internal resistance (approximately 0.5 Ω), and the diameter of the semicircle is small, indicating that the electrode shows a low charge transfer resistance, which is related to the easy diffusion of electrolyte ions into the pores due to the hierarchical micropores and mesopores structures [52]. Furthermore, in the low-frequency region, the high-frequency straight line segment is almost a vertical straight line, indicating that the material has good wettability and a fast ion transfer rate and thus has better capacitance performance.

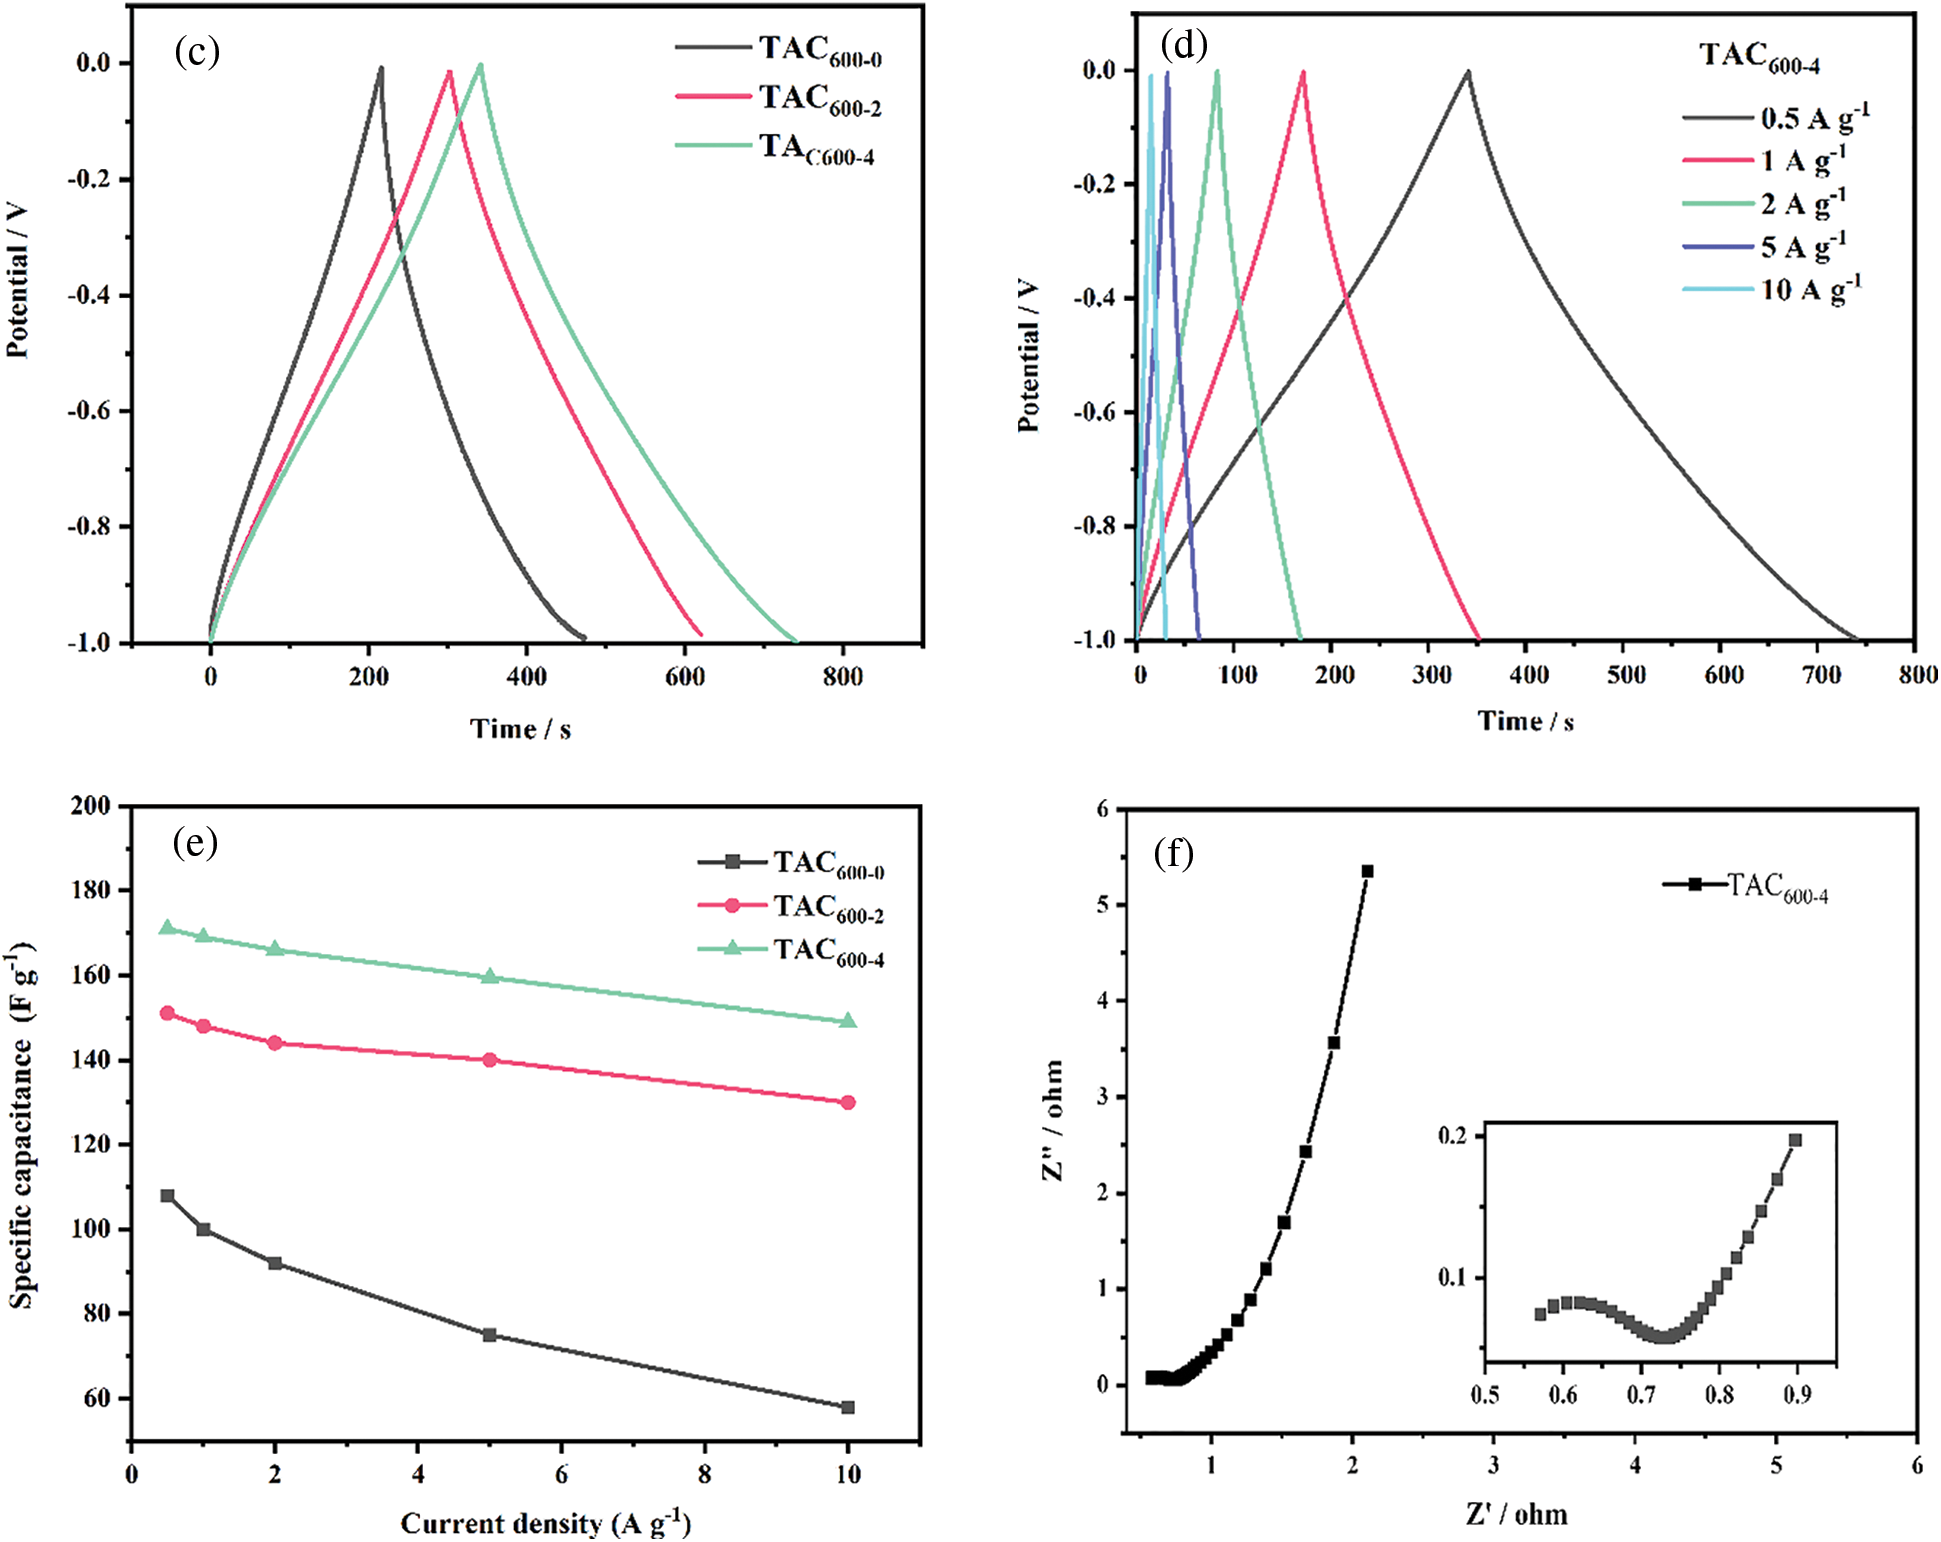
Figure 7: (a) CV curve of all TACs at 5 mV s–1; (b) CV curve of TAC600-4 electrode at different scan rates; (c) GCD curves of all TACs at 1 A g–1; (d) GCD curves of TAC600-4 electrodes at different current densities; (e) The relationship between TACs and specific capacitance at different current densities; (f) EIS of TAC600-4 electrode
The electrochemical performance of the TAC600-4 sample was further evaluated by assembling it into a symmetric capacitor. Figs. 8a and 8b show the results of CV and GCD under different potential windows at a scan rate of 5 mV s−1 and a current density of 0.5 A g−1, respectively. Results indicate that, with increasing working voltages, the CV curve and GCD curve gradually deform away from the rectangular shape and the symmetrical inverted triangle shape, respectively. Upon reaching 1.6 V, the CV curve deforms substantially, whereas the GCD curve appears to have a long platform stage and is no longer triangle-like. As a result, 1.5 V is the maximum working potential of the electrode material. Subsequently, under the working potential of 1.5 V, CV analysis was performed on the carbon electrodes at different scanning rates, the results are shown in Fig. 8c. Under a scanning rate of 5 mV s−1, the CV curve has an obvious rectangular form in the range of 0.2–1.4 V, indicating that it is dominated by the capacitance of the double electrical layer. However, with the increase in the scan rate, the curve gradually began to distort, but it can essentially maintain its original shape, indicating that the electrode material has a good rate performance, which can contribute to the excellent pore structure of the carbon material for the electrolyte ions [53]. Furthermore, oxygen atoms in the carbon skeleton can enhance the wettability of the electrode material, which is also conducive to improving its rate performance [54]. The electrochemical performance of activated carbon was further evaluated at a working potential of 1.5 V by GCD. When the current density was increased from 0.5 to 5 A g−1, the curve still maintained a symmetrical triangular shape (Fig. 8d), which demonstrated the good reversibility of the material. The capacitance of the symmetric supercapacitor device is 42 F g−1 at 0.5 A g−1. Using symmetric supercapacitors prepared from TAC600-4, 5000 cycles of charge/discharge were conducted using a current density of 10 A g−1 and an operating potential of 1.5 V, as shown in Fig. 8e. After 5000 charge and discharge cycles, the capacitance retention rate is 59%. Compared with ACs prepared in the open literature, this value is not the best. As claimed, TAC600-4 has a high SSA and specific capacitance. As a result, in the high-strength charging and discharging test, the material structure will be damaged, leading to an increase in the internal resistance of the sample [7,55]. Further study of its energy density shows that the energy density of the symmetrical supercapacitor prepared by TAC600-4 is 6.5 Wh kg−1 at a power density of 375 W, in accordance with the reported carbon materials (Fig. 8f) [55].

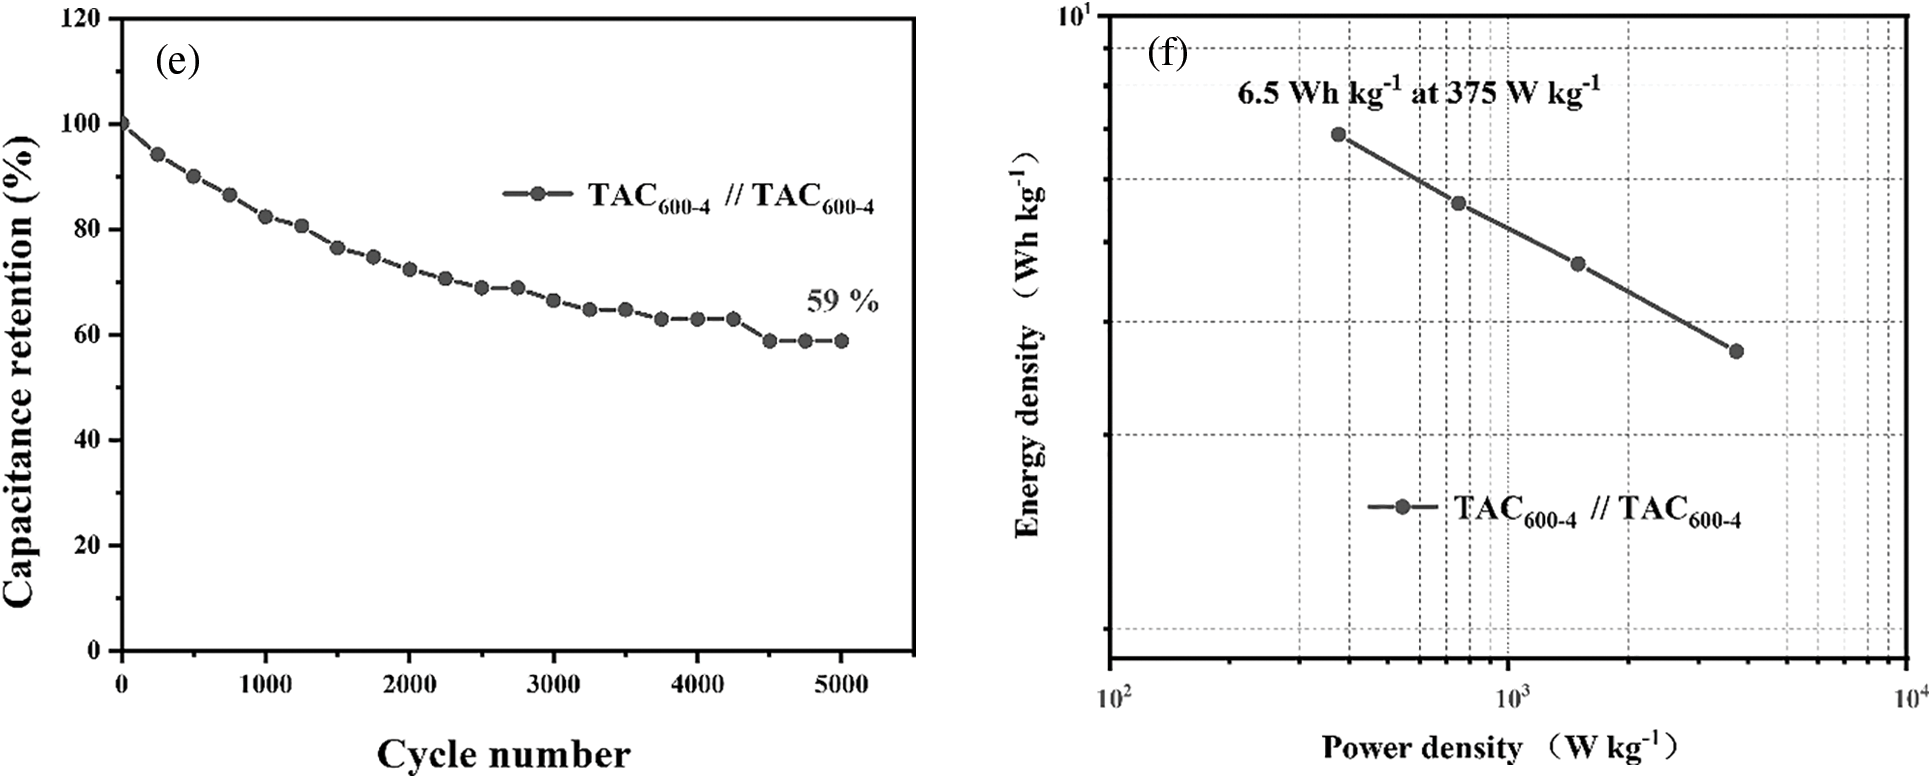
Figure 8: Symmetric supercapacitor prepared from TAC600-4: (a) CV curves under different potential windows at 5 mV s–1; (b) GCD curves with different potential windows at 0.5 A g–1; (c) CV curve at different scan rates; (d) GCD curves at different current densities; (e) cycling stability; and (f) Ragone diagram
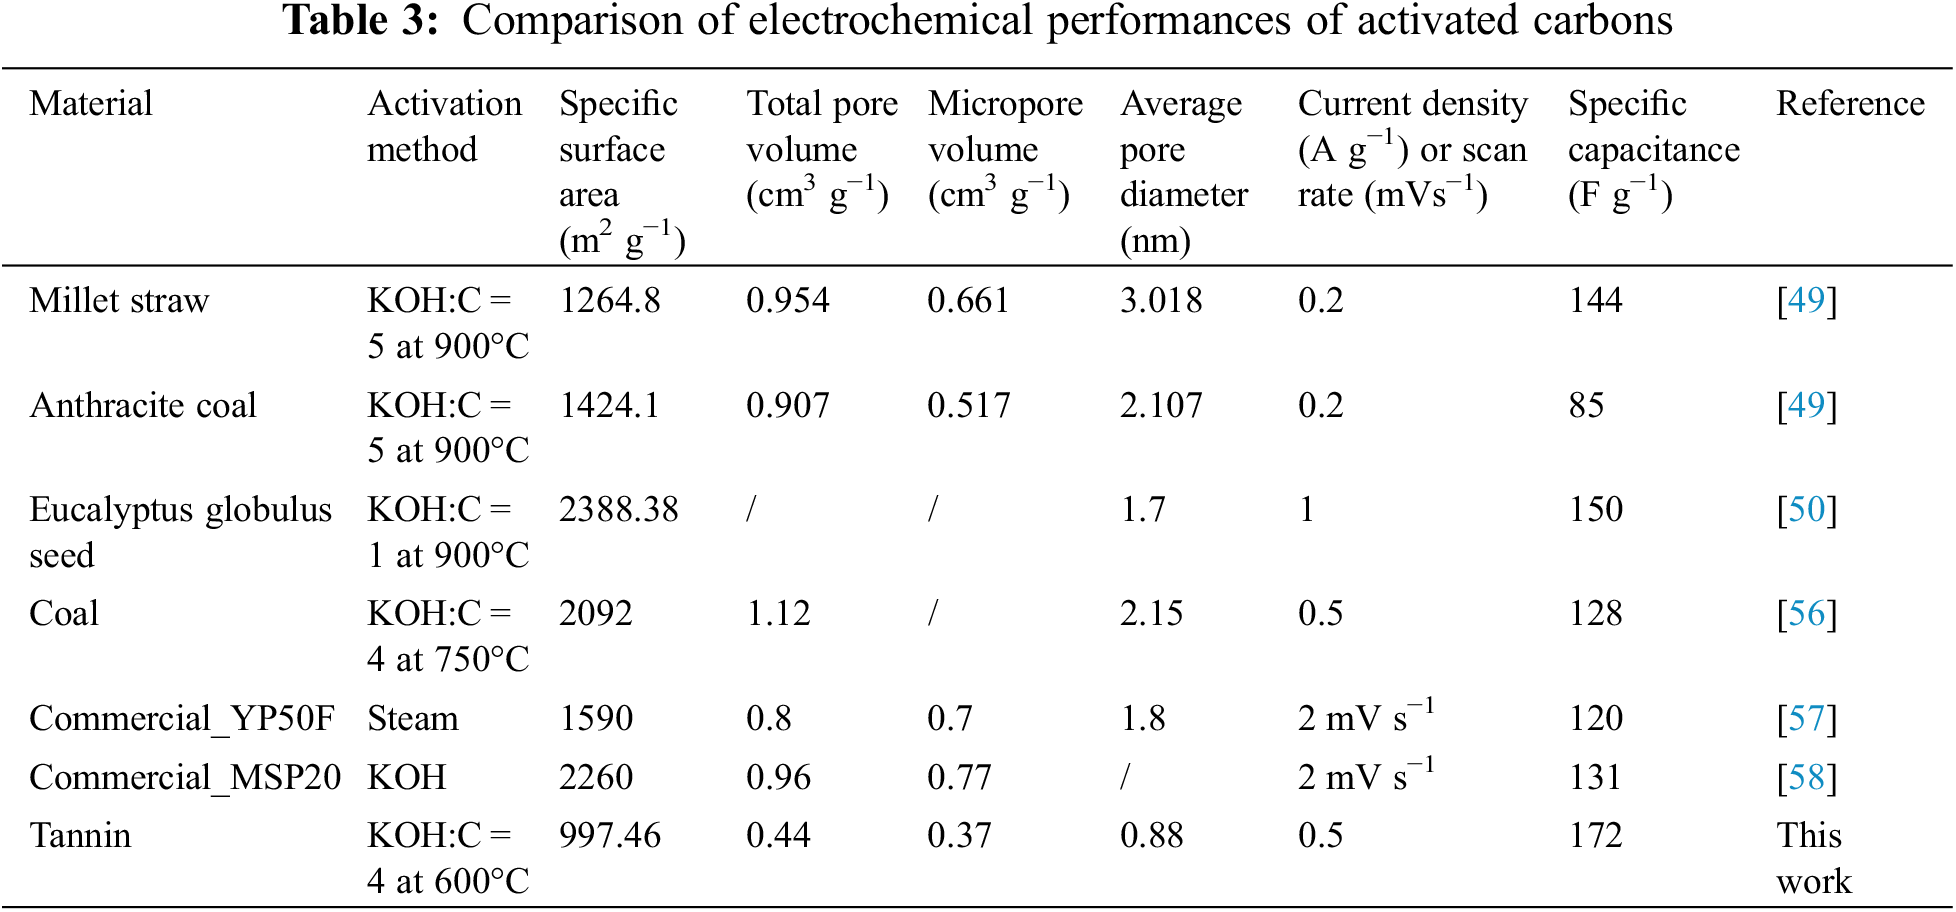
As a result of comparing the supercapacitor performance of tannin-based activated carbon materials prepared by two-step method of microwave hydrothermal and KOH activation, the specific capacitance of the material is found to be similar to or even higher than the results reported in the literature or the commercial activated carbons (in Table 3). Consequently, it provides a new method for the preparation of tannin-based carbon materials and a new application for tannin-based activated carbon. In addition, after examining a variety of ACs in Table 3, there is no definite linear relationship between the electrochemical performance of supercapacitors and the specific surface area and pore volumes.
Using areca extract as a precursor, activated carbon with a high specific surface area and rich pore structure can be successfully prepared by the two-step method of microwave hydrothermal precarbonization and KOH activation. Furthermore, the microstructure, multistage pore structure and physicochemical properties of carbon materials can be adjusted by changing the alkali/carbon ratio. TAC600-4 prepared at 600°C and an alkali/carbon ratio of 4 has the highest specific surface area (997.46 m3 g−1) compared with other samples and has a certain oxygen content and wettability, showing good charge transfer performance. Under the three-electrode test system of 6 M KOH as the electrolyte, when the current density was 0.5 A g−1, the maximum specific current was 171 F g−1, which has excellent electrochemical performance and good application prospects in supercapacitors. The results show that tannins can be applied to supercapacitor electrode materials and are an effective way to improve the application value of tannins. Other biomass and derivative preparations of electrode materials or carbon materials have a certain role in guiding, and the microwave hydrothermal method is a large-scale method used in an effective way in the process of carbonized biomass materials. It also has a modification effect on the surface chemical properties of materials, which can greatly increase the application of agricultural and forestry waste and has a good effect on preventing resource waste and environmental pollution.
Funding Statement: The authors are grateful for the financial support from the National Natural Science Foundation of China (31971593), National College Students’ Innovation and Entrepreneurship Training Program (111ZC22017), and the Natural Science Foundation of Fujian Province Department of Science and Technology (2019J01386). The authors would like to thank the Shiyanjia Lab (www.shiyanjia.com) for the Raman and XRD tests.
Conflicts of Interest: The authors declare that they have no conflicts of interest to report regarding the present study.
References
1. Prabhakaran, V., Romo, J. E., Bhattarai, A., George, K. S., Norberg, Z. M. et al. (2022). Integrated photoelectrochemical energy storage cells prepared by benchtop ion soft landing. Chemical Communications, 58(65), 9060–9063. https://doi.org/10.1039/D2CC02595G [Google Scholar] [PubMed] [CrossRef]
2. Maddukuri, S., Malka, D., Chae, M. S., Elias, Y., Aurbach, D. et al. (2020). On the challenge of large energy storage by electrochemical devices. Electrochimica Acta, 354(10), 136771. https://doi.org/10.1016/j.electacta.2020.136771 [Google Scholar] [CrossRef]
3. Wang, C., Muni, M., Strauss, V., Borenstein, A., Chang, X. et al. (2021). Graphene’s role in emerging trends of capacitive energy storage. Small, 17(48), 2006875. https://doi.org/10.1002/smll.202006875 [Google Scholar] [PubMed] [CrossRef]
4. Sun, N., Yin, B., Dong, D., Hu, X., Huan, Y. et al. (2022). Revealing the intrinsic effects of introduced carbon nanotubes for Bi2O3 energy storage materials. Electrochimica Acta, 409(20), 139948. https://doi.org/10.1016/j.electacta.2022.139948 [Google Scholar] [CrossRef]
5. Han, Q., Sheng, Y., Liu, X., Zhang, X., Chen, X. et al. (2022). Carbon fiber reinforced epoxy composite combining superior electrochemical energy storage and mechanical performance. Chemical Engineering Journal, 437, 135228. https://doi.org/10.1016/j.cej.2022.135228 [Google Scholar] [CrossRef]
6. Cai, X., Xiao, Y., Sun, W. (2022). Pore-size effect of activated carbons on the electrochemical performances of symmetric supercapacitors under compression. Journal of Energy Storage, 55, 105438. https://doi.org/10.1016/j.est.2022.105438 [Google Scholar] [CrossRef]
7. Ouyang, Y., Xing, T., Chen, Y., Zheng, L., Peng, J. et al. (2020). Hierarchically structured spherical nickel cobalt layered double hydroxides particles grown on biomass porous carbon as an advanced electrode for high specific energy asymmetric supercapacitor. Journal of Energy Storage, 30, 101454. https://doi.org/10.1016/j.est.2020.101454 [Google Scholar] [CrossRef]
8. Yang, S., Ozdogru, B., Ketelsleger, C., Gregory, D., Çapraz, Ö. Ö. et al. (2021). Recycling diesel soot nanoparticles for use as activated carbon in Li ion batteries. Resources, Conservation and Recycling, 169, 105485. https://doi.org/10.1016/j.resconrec.2021.105485 [Google Scholar] [CrossRef]
9. Bhattarai, R. M., Chhetri, K., Natarajan, S., Saud, S., Kim, S. J. et al. (2022). Activated carbon derived from cherry flower biowaste with a self-doped heteroatom and large specific surface area for supercapacitor and sodium-ion battery applications. Chemosphere, 303, 135290. https://doi.org/10.1016/j.chemosphere.2022.135290 [Google Scholar] [PubMed] [CrossRef]
10. Ponce, M. F., Mamani, A., Jerez, F., Castilla, J., Ramos, P. B. et al. (2022). Activated carbon from olive tree pruning residue for symmetric solid-state supercapacitor. Energy, 260, 125092. https://doi.org/10.1016/j.energy.2022.125092 [Google Scholar] [CrossRef]
11. Erradi, A., Touhtouh, S., El Fallah, J., El Ballouti, A., Hajjaji, A. (2021). Performance evaluation of supercapacitors based on activated carbons and investigation of the impact of aging on the electrodes. Journal of Energy Storage, 40, 102836. https://doi.org/10.1016/j.est.2021.102836 [Google Scholar] [CrossRef]
12. Rashidi, N. A., Chai, Y. H., Ismail, I. S., Othman, M. F. H., Yusup, S. (2022). Biomass as activated carbon precursor and potential in supercapacitor applications. Biomass Conversion and Biorefinery. https://doi.org/10.1007/s13399-022-02351-1 [Google Scholar] [CrossRef]
13. Pizzi, A. (2019). Tannins: Prospectives and actual industrial applications. Biomolecules, 9(8), 344. https://doi.org/10.3390/biom9080344 [Google Scholar] [PubMed] [CrossRef]
14. Shirmohammadli, Y., Efhamisisi, D., Pizzi, A. (2018). Tannins as a sustainable raw material for green chemistry: A review. Industrial Crops and Products, 126, 316–332. https://doi.org/10.1016/j.indcrop.2018.10.034 [Google Scholar] [CrossRef]
15. Sanchez-Sanchez, A., Braghiroli, F. L., Izquierdo, M. T., Parmentier, J., Celzard, A. et al. (2020). Synthesis and properties of carbon microspheres based on tannin–sucrose mixtures treated in hydrothermal conditions. Industrial Crops and Products, 154, 112564. https://doi.org/10.1016/j.indcrop.2020.112564 [Google Scholar] [CrossRef]
16. Letellier, M., Macutkevic, J., Paddubskaya, A., Plyushch, A., Kuzhir, P. et al. (2015). Tannin-based carbon foams for electromagnetic applications. IEEE Transactions on Electromagnetic Compatibility, 57(5), 989–995. https://doi.org/10.1109/TEMC.2015.2430370 [Google Scholar] [CrossRef]
17. Wu, X., Yan, W., Zhou, Y., Luo, L., Yu, X. et al. (2020). Thermal, morphological, and mechanical characteristics of sustainable tannin bio-based foams reinforced with wood cellulosic fibers. Industrial Crops and Products, 158, 113029. https://doi.org/10.1016/j.indcrop.2020.113029 [Google Scholar] [CrossRef]
18. Amaral-Labat, G., Szczurek, A., Fierro, V., Pizzi, A., Celzard, A. (2013). Systematic studies of tannin-formaldehyde aerogels: Preparation and properties. Science and Technology of Advanced Materials, 14(1), 015001. https://doi.org/10.1088/1468-6996/14/1/015001 [Google Scholar] [PubMed] [CrossRef]
19. Grishechko, L. I., Amaral-Labat, G., Szczurek, A., Fierro, V., Kuznetsov, B. N. et al. (2013). New tannin–lignin aerogels. Industrial Crops and Products, 41, 347–355. https://doi.org/10.1016/j.indcrop.2012.04.052 [Google Scholar] [CrossRef]
20. Liu, D., Wang, Y., Jia, B., Wei, J., Liu, C. et al. (2020). Microwave-assisted hydrothermal preparation of corn straw hydrochar as supercapacitor electrode materials. ACS Omega, 5(40), 26084–26093. https://doi.org/10.1021/acsomega.0c03605 [Google Scholar] [PubMed] [CrossRef]
21. Zhang, X. Y., Qin, Q. Y., Liu, X., Wang, W. L. (2020). Effects of stepwise microwave synergistic process water recirculation during hydrothermal carbonization on properties of wheat straw. Frontiers in Energy Research, 10, 846752. https://doi.org/10.3389/fenrg.2022.846752 [Google Scholar] [CrossRef]
22. Luo, L., Wang, S., Zhou, Y., Yan, W., Gao, H. et al. (2022). Microwave-assisted synthesis of hybrid supercapacitors consisting of Ni, Co-layered double hydroxide shell assembled around wood-derived activated carbon fiber core. Electrochimica Acta, 412, 140148. https://doi.org/10.1016/j.electacta.2022.140148 [Google Scholar] [CrossRef]
23. Świątkowski, A., Kuśmierek, E., Chrześcijańska, E., Kuśmierek, K., Albiniak, A. (2022). Electrochemical and catalytic properties of carbon dioxide-activated graphite felt. Molecules, 27(19), 6298. https://doi.org/10.3390/molecules27196298 [Google Scholar] [PubMed] [CrossRef]
24. Liu, X., Zuo, S., Cui, N., Wang, S. (2022). Investigation of ammonia/steam activation for the scalable production of high-surface area nitrogen-containing activated carbons. Carbon, 191, 581–592. https://doi.org/10.1016/j.carbon.2022.02.014 [Google Scholar] [CrossRef]
25. Samiyammal, P., Kokila, A., Pragasan, L. A., Rajagopal, R., Sathya, R. et al. (2022). Adsorption of brilliant green dye onto activated carbon prepared from cashew nut shell by KOH activation: Studies on equilibrium isotherm. Environmental Research, 212, 113497. https://doi.org/10.1016/j.envres.2022.113497 [Google Scholar] [PubMed] [CrossRef]
26. Zamiri, M. A., Niu, C. H. (2022). Development and characterization of novel activated carbons based on reed canary grass. Industrial Crops and Products, 187, 115316. https://doi.org/10.1016/j.indcrop.2022.115316 [Google Scholar] [CrossRef]
27. Heidarinejad, Z., Dehghani, M. H., Heidari, M., Javedan, G., Ali, I. et al. (2020). Methods for preparation and activation of activated carbon: A review. Environmental Chemistry Letters, 18(2), 393–415. https://doi.org/10.1007/s10311-019-00955-0 [Google Scholar] [CrossRef]
28. Guo, Y., Wang, Q. (2022). Fabrication and characterization of activated carbon from phyllostachys edulis using single-step KOH activation with different temperatures. Processes, 10(9), 1712. https://doi.org/10.3390/pr10091712 [Google Scholar] [CrossRef]
29. Zhou, Y., Luo, L., Yan, W., Li, Z., Fan, M. et al. (2022). Controlled preparation of nitrogen-doped hierarchical carbon cryogels derived from phenolic-based resin and their CO2 adsorption properties. Energy, 246, 123367. https://doi.org/10.1016/j.energy.2022.123367 [Google Scholar] [CrossRef]
30. Li, Z., Zhou, Y., Yan, W., Luo, L., Su, Z. et al. (2020). Cost-effective monolithic hierarchical carbon cryogels with nitrogen doping and high-performance mechanical properties for CO2 capture. ACS Applied Materials & Interfaces, 12(19), 21748–21760. https://doi.org/10.1021/acsami.0c04015 [Google Scholar] [PubMed] [CrossRef]
31. Bag, O., Tekin, K., Karagoz, S. (2020). Microporous activated carbons from lignocellulosic biomass by KOH activation. Fullerenes, Nanotubes and Carbon Nanostructures, 28, 1030–1037. https://doi.org/10.1080/1536383X.2020.1794850 [Google Scholar] [CrossRef]
32. Greco, G., Canevesi, R. L. S., Stasi, C. D., Celzard, A., Fierro, V. et al. (2022). Biomass-derived carbons physically activated in one or two steps for CH4/CO2 separation. Renewable Energy, 191, 122–133. https://doi.org/10.1016/j.renene.2022.04.035 [Google Scholar] [CrossRef]
33. Luo, L., Zhou, Y., Yan, W., Wu, X., Wang, S. et al. (2020). Two-step synthesis of B and N co-doped porous carbon composites by microwave-assisted hydrothermal and pyrolysis process for supercapacitor application. Electrochimica Acta, 360, 137010. https://doi.org/10.1016/j.electacta.2020.137010 [Google Scholar] [CrossRef]
34. Chen, T., Luo, L., Luo, L., Deng, J., Wu, X. et al. (2021). High energy density supercapacitors with hierarchical nitrogen-doped porous carbon as active material obtained from bio-waste. Renewable Energy, 175, 760–769. https://doi.org/10.1016/j.renene.2021.05.006 [Google Scholar] [CrossRef]
35. Deng, Q., Abbas, S. C., Li, Z., Lv, J., Ma, X. et al. (2020). Chemically modified self-doped biocarbon via novel sulfonation assisted sacrificial template method for high performance flexible all solid-state supercapacitor. Journal of Colloid and Interface Science, 574, 33–42. https://doi.org/10.1016/j.jcis.2020.04.029 [Google Scholar] [PubMed] [CrossRef]
36. Choi, S. W., Tang, J., Pol, V. G., Lee, K. B. (2019). Pollen-derived porous carbon by KOH activation: Effect of physicochemical structure on CO2 adsorption. Journal of CO2 Utilization, 29, 146–155. https://doi.org/10.1016/j.jcou.2018.12.005 [Google Scholar] [CrossRef]
37. Kim, M., Xu, X., Xin, R., Earnshaw, J., Ashok, A. et al. (2021). KOH-Activated hollow ZIF-8 derived porous carbon: Nanoarchitectured control for upgraded capacitive deionization and supercapacitor. ACS Applied Materials & Interfaces, 13(44), 52034–52043. https://doi.org/10.1021/acsami.1c09107 [Google Scholar] [PubMed] [CrossRef]
38. Jiménez-Martín, G., Castillo, J., Judez, X., Gómez-Urbano, J. L., Moreno-Fernández, G. et al. (2022). Graphene-based activated carbon composites for high performance lithium-sulfur batteries. Batteries & Supercaps, 5(9), e202200167. https://doi.org/10.1002/batt.202200167 [Google Scholar] [CrossRef]
39. Wu, Y., Zhu, L., Chen, R., Gu, L., Cao, X. et al. (2020). Self-assembled activated carbon sandwiched graphene film for symmetrical supercapacitors. Journal of Central South University, 27(12), 3603–3614. https://doi.org/10.1007/s11771-020-4505-9 [Google Scholar] [CrossRef]
40. Gong, Y., Li, D., Luo, C., Fu, Q., Pan, C. (2017). Highly porous graphitic biomass carbon as advanced electrode materials for supercapacitors. Green Chemistry, 19(17), 4132–4140. https://doi.org/10.1039/C7GC01681F [Google Scholar] [CrossRef]
41. Yuan, Y., Chen, Z., Yu, H., Zhang, X., Liu, T. et al. (2020). Heteroatom-doped carbon-based materials for lithium and sodium ion batteries. Energy Storage Materials, 32, 65–90. https://doi.org/10.1016/j.ensm.2020.07.027 [Google Scholar] [CrossRef]
42. Minugu, O. P., Gujjala, R., Shakuntala, O., Manoj, P., Chowdary, M. S. (2021). Effect of biomass derived biochar materials on mechanical properties of biochar epoxy composites. Proceedings of the Institution of Mechanical Engineers, Part C: Journal of Mechanical Engineering Science, 235(21), 5626–5638. [Google Scholar]
43. Tian, N., Gao, M., Liu, X. H., Liu, X., Yang, T. et al. (2022). Activated carbon derived from walnut green peel as an electrode material for high-performance supercapacitors. Biomass Conversion and Biorefinery. https://doi.org/10.1007/s13399-021-02103-7 [Google Scholar] [CrossRef]
44. Chen, W., Gong, M., Li, K., Xia, M., Chen, Z. et al. (2020). Insight into KOH activation mechanism during biomass pyrolysis: Chemical reactions between O-containing groups and KOH. Applied Energy, 278, 115730. https://doi.org/10.1016/j.apenergy.2020.115730 [Google Scholar] [CrossRef]
45. Ghosh, S., Barg, S., Jeong, S. M., Ostrikov, K. (2020). Heteroatom-doped and oxygen-functionalized nanocarbons for high-performance supercapacitors. Advanced Energy Materials, 10(32), 2001239. https://doi.org/10.1002/aenm.202001239 [Google Scholar] [CrossRef]
46. Pandey, L., Sarkar, S., Arya, A., Sharma, A. L., Panwar, A. et al. (2021). Fabrication of activated carbon electrodes derived from peanut shell for high-performance supercapacitors. Biomass Conversion and Biorefinery. https://doi.org/10.1007/s13399-021-01701-9 [Google Scholar] [CrossRef]
47. Ortiz-Olivares, R. D., Lobato-Peralta, D. R., Ariasb, D. M., Okolie, J. A., Cuentas-Gallegos, A. K. et al. (2022). Production of nanoarchitectonics corncob activated carbon as electrode material for enhanced supercapacitor performance. Journal of Energy Storage, 55, 105447. https://doi.org/10.1016/j.est.2022.105447 [Google Scholar] [CrossRef]
48. Lobato-Peralta, D. R., Ayala-Cortés, A., Longoria, A., Pacheco-Catalánc, D. E., Okoyea, P. U. et al. (2022). Activated carbons obtained by environmentally friendly activation using solar energy for their use in neutral electrolyte supercapacitors. Journal of Energy Storage, 52, 104888. https://doi.org/10.1016/j.est.2022.104888 [Google Scholar] [CrossRef]
49. Ding, Y., Wang, T., Dong, D., Zhang, Y. (2020). Using biochar and coal as the electrode material for supercapacitor applications. Frontiers in Energy Research, 7, 159. https://doi.org/10.3389/fenrg.2019.00159 [Google Scholar] [CrossRef]
50. Rajasekaran, S. J., Raghavan, V. (2020). Facile synthesis of activated carbon derived from eucalyptus globulus seed as efficient electrode material for supercapacitors. Diamond and Related Materials, 109, 108038. https://doi.org/10.1016/j.diamond.2020.108038 [Google Scholar] [CrossRef]
51. Jiang, Y., Li, J., Jiang, Z., Shi, M., Sheng, R. et al. (2021). Large-surface-area activated carbon with high density by electrostatic densification for supercapacitor electrodes. Carbon, 175, 281–288. https://doi.org/10.1016/j.carbon.2021.01.016 [Google Scholar] [CrossRef]
52. Perez-Rodriguez, S., Pinto, O., Izquierdo, M. T., Segura, C., Poon, P. S. et al. (2021). Upgrading of pine tannin biochars as electrochemical capacitor electrodes. Journal of Colloid and Interface Science, 601, 863–876. https://doi.org/10.1016/j.jcis.2021.05.162 [Google Scholar] [PubMed] [CrossRef]
53. Ye, R., Cai, J., Pan, Y., Qiao, X., Sun, W. (2020). Microporous carbon from malva nut for supercapacitors: Effects of primary carbonizations on structures and performances. Diamond and Related Materials, 105, 107816. https://doi.org/10.1016/j.diamond.2020.107816 [Google Scholar] [CrossRef]
54. Kyaw, H., Al-Mashaikhi, S., Myint, M., Al-Harthi, S., El-Shafey, E. et al. (2021). Activated carbon derived from the date palm leaflets as multifunctional electrodes in capacitive deionization system. Chemical Engineering and Processing-Process Intensification, 161, 108311. https://doi.org/10.1016/j.cep.2021.108311 [Google Scholar] [CrossRef]
55. Liu, X., Shanbhag, S., Natesakhawat, S., Whitacre, J. F., Mauter, M. S. (2020). Performance loss of activated carbon electrodes in capacitive deionization: Mechanisms and material property predictors. Environmental Science & Technology, 54(23), 15516–15526. https://doi.org/10.1021/acs.est.0c06549 [Google Scholar] [PubMed] [CrossRef]
56. Guo, S., Guo, B., Ma, R., Zhu, Y., Wang, J. (2020). KOH activation of coal-derived microporous carbons for oxygen reduction and supercapacitors. RSC Advances, 10, 15707–15714. https://doi.org/10.1039/D0RA01705A [Google Scholar] [PubMed] [CrossRef]
57. Zhang, C., Hatzell, K. B., Boota, M., Dyatkin, B., Beidaghi, M. et al. (2014). Highly porous carbon spheres for electrochemical capacitors and capacitive flowable suspension electrodes. Carbon, 77, 155–164. https://doi.org/10.1016/j.carbon.2014.05.017 [Google Scholar] [CrossRef]
58. Kim, T., Yoon, J. (2013). Relationship between capacitance of activated carbon composite electrodes measured at a low electrolyte concentration and their desalination performance in capacitive deionization. Journal of Electroanalytical Chemistry, 704, 169–174. https://doi.org/10.1016/j.jelechem.2013.07.003 [Google Scholar] [CrossRef]
Cite This Article
 Copyright © 2023 The Author(s). Published by Tech Science Press.
This work is licensed under a Creative Commons Attribution 4.0 International License , which permits unrestricted use, distribution, and reproduction in any medium, provided the original work is properly cited.
 Downloads
 Citation Tools