
 Submit a Paper
 Propose a Special lssue
 Open Access
ARTICLE

Effect of PEG Incorporation on Physicochemical and in vitro Degradation of PLLA/PDLLA Blends: Application in Biodegradable Implants
1
Department of Metallurgical and Material Engineering, Faculty of Engineering, University of Indonesia, Depok City, 16424,
Indonesia
2
Department of Mechanical Engineering, Faculty of Engineering, University of Indonesia, Depok City, 16424, Indonesia
* Corresponding Author: Mochamad Chalid. Email:
Journal of Renewable Materials 2023, 11(7), 3043-3056. https://doi.org/10.32604/jrm.2023.026788
Received 25 September 2022; Accepted 06 February 2023; Issue published 05 June 2023
 View Full Text
 Download PDF
Abstract
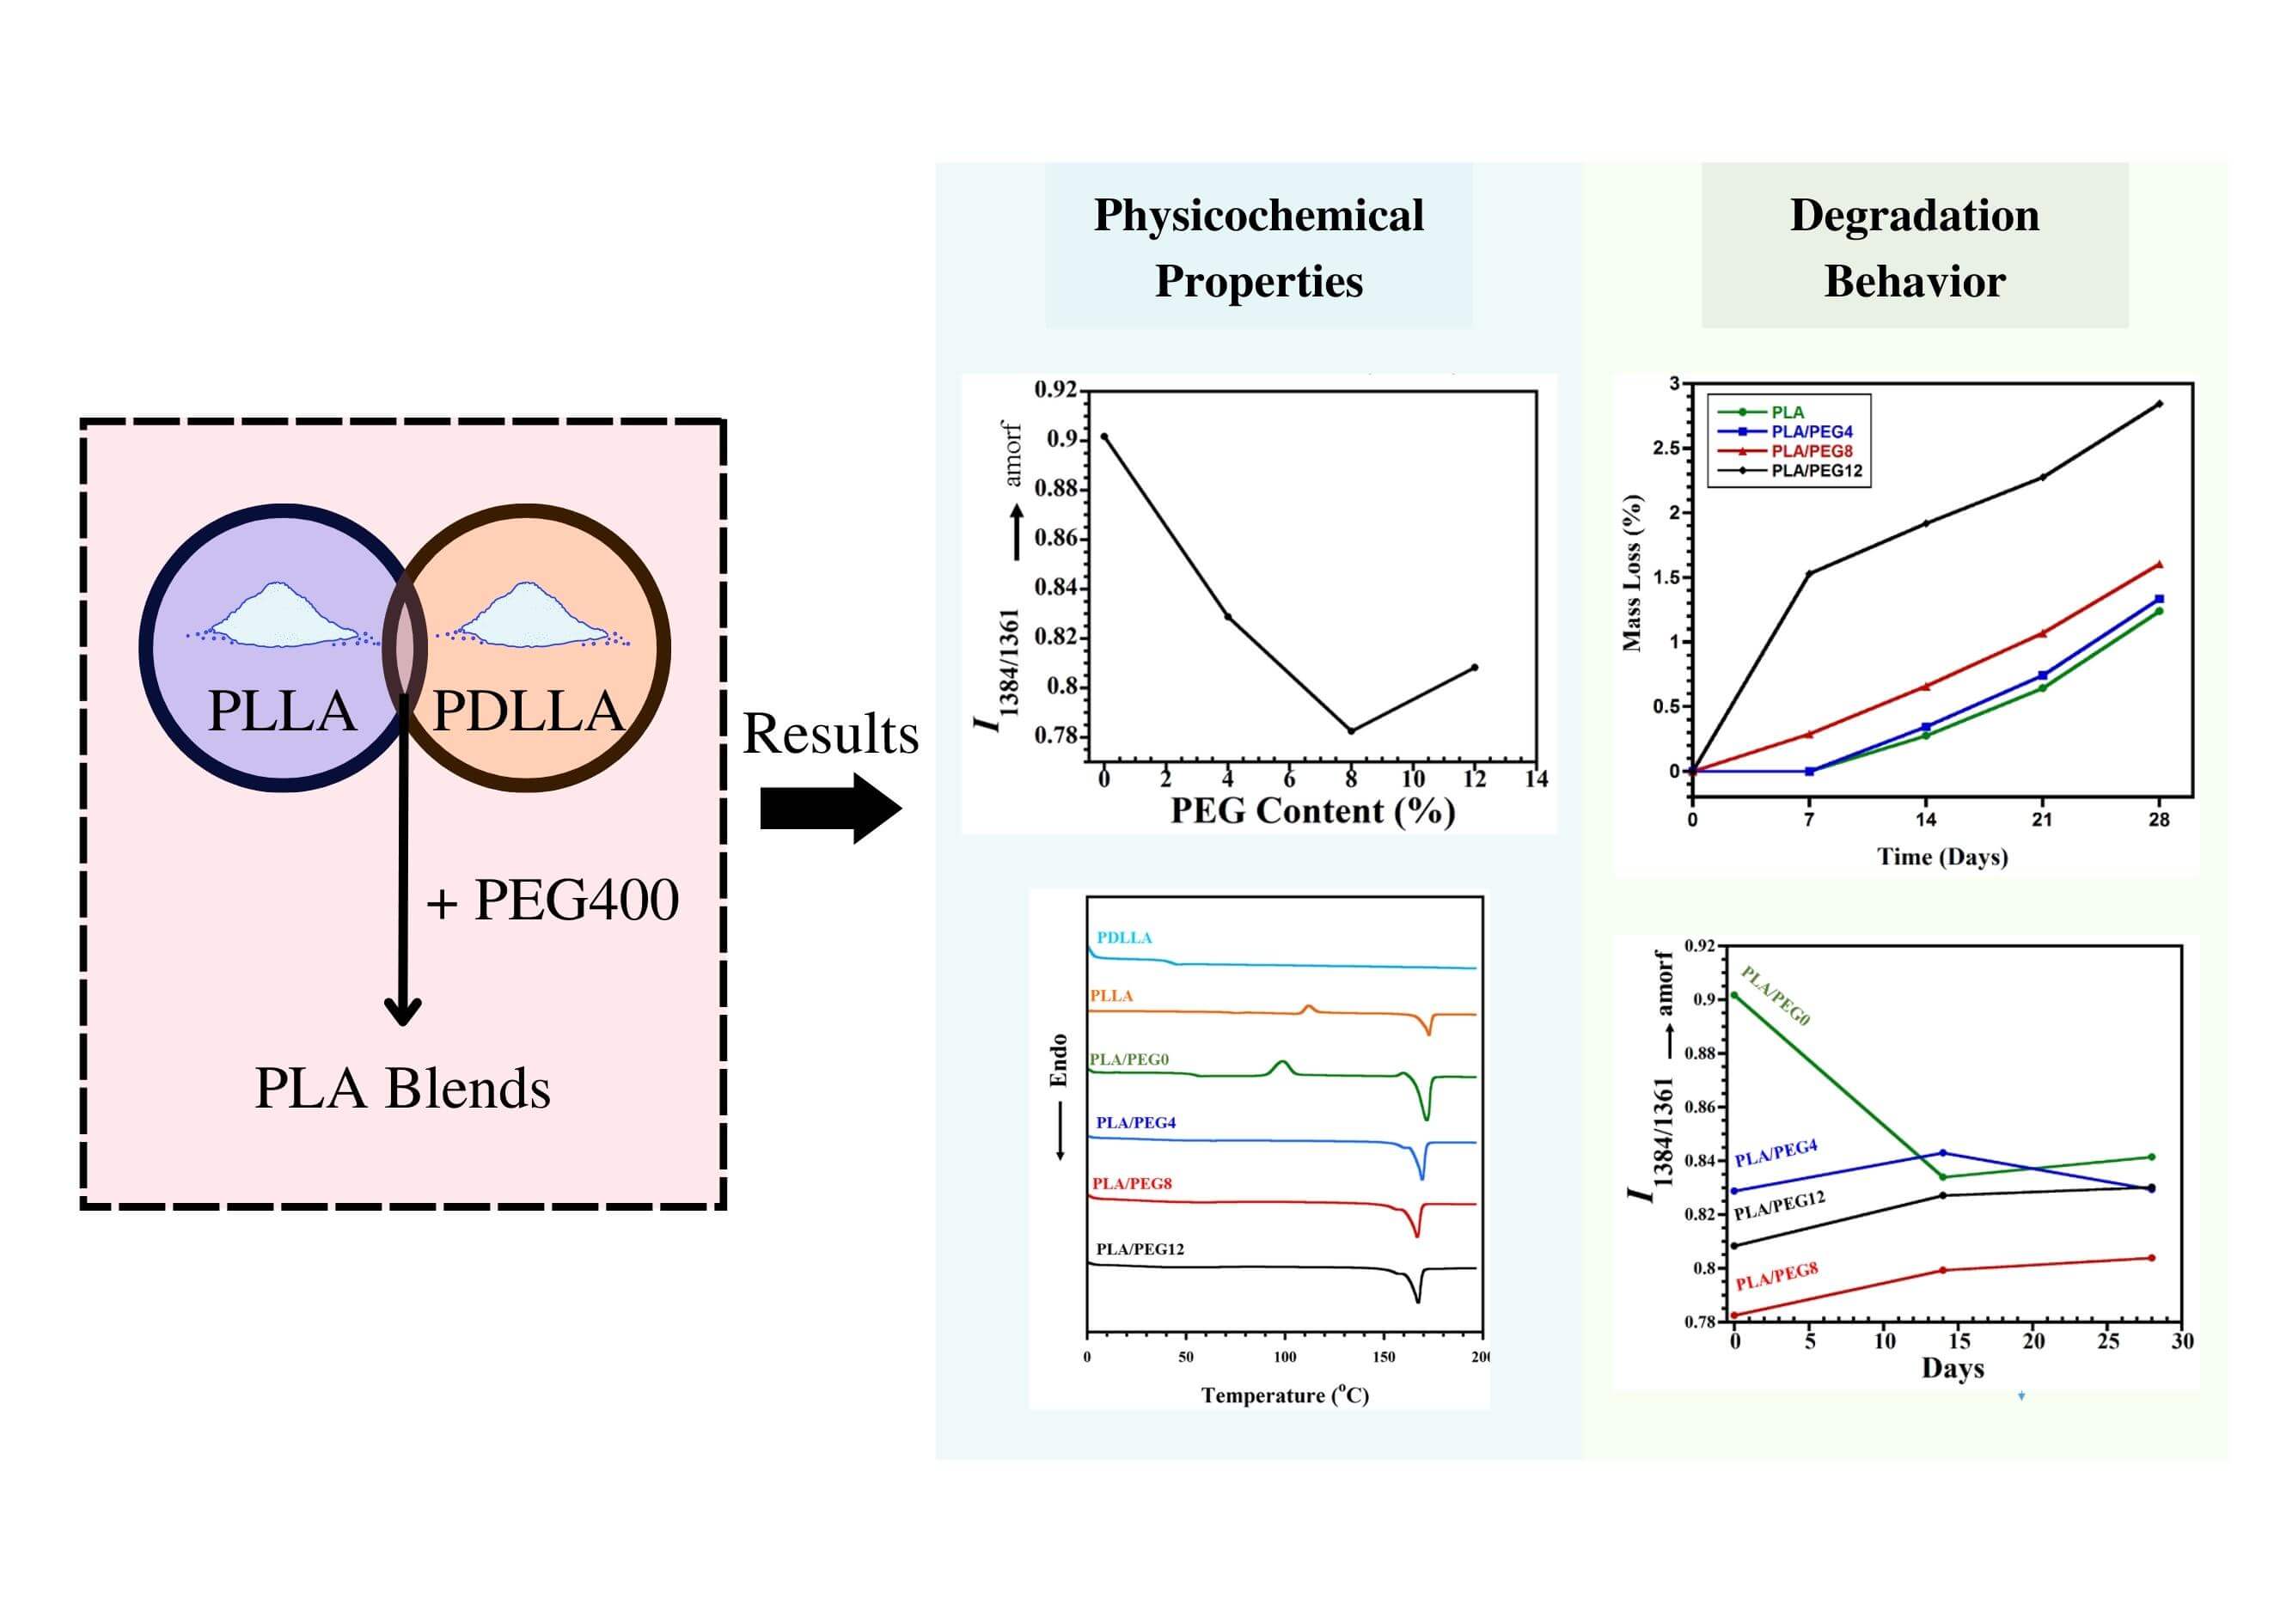
Polyethylene glycol (PEG) was added at different concentrations to the blend of poly(L-lactic acid) (PLLA) and poly(D,L-lactic acid)(PDLLA) to tailor the properties. The differential scanning calorimetry (DSC) measurement showed that all blends were miscible due to shifting a single glass transition temperature into a lower temperature for increasing PEG content. The DSC, FTIR, and XRD results implied the crystallinity enhancement for PEG content until 8 wt%, then decreased at 12 wt% PEG. The XRD result indicated the homo crystalline phase formation in all blends and no stereocomplex crystal. The in vitro degradation study indicated that PEG content is proportional to the degradation rate. The highest weight loss after 28 days was achieved at 12 wt% PEG. The FTIR analysis showed a structural evolution overview during hydrolytic degradation, viz. increasing and decreasing crystallinity during 14 days for the blend without and with PEG, respectively. In conclusion, the PEG addition increased crystallinity and degradation rate of the PLLA/PDLLA mixture, but PEG higher amounts led to a decrease in crystallinity, and the weight loss was intensified. This can be useful for tuning PLA-based biomaterials with the desired physicochemical properties and appropriate degradation rates for applications in drug delivery/ tissue engineering.Graphic Abstract
Keywords
The use of poly (L-lactic acid) (PLLA) in biomedical applications has been increasing over the past few decades, such as for tissue engineering scaffolds [1,2], drug carriers [3,4], dental niches [5,6], and orthopedic fixation [7,8]. PLLA is biocompatible and biodegradable because the degradation product is safe and non-toxic to humans [9–11]. Its use for bio-absorbable implants also provides a distinct advantage because it eliminates the need for implant removal.
The isotactic structure of PLLA provides beneficial mechanical properties because of the ease of forming a crystalline structure. However, the high crystallinity and slow degradation time [12–14] of PLLA hinder the technical handling. For the intended application of bone fixation, the flexibility and malleability of the materials must suit the clinical requirements.
To overcome this limitation, several methods are used to enhance the ductility of brittle poly (lactic acid) (PLA). Blending with flexible polymers, e.g., poly (caprolactone) (PCL) [15–18] and poly (glycolic acid) (PGA) [19,20], is commonly used to reduce the rigidity of PLA. However, both PCL and PGA are immiscible with PLLA [21–23]. Therefore mixing the two causes phase separation, which will potentially lead to early implant failure. The brittleness of PLLA can also be altered by blending with amorphous poly (D, L-lactic acid) PDLLA [24]. PDLLA has a random distribution of PLLA and poly (D, lactic acid) (PDLA), which disrupts its stereoregularity [25]. Since both PLLA and PDLLA have similar chemical structures, it is interesting to study the miscibility of the two. PLLA alone degrades very slowly [26], but it is reported that slow degradation is associated with an increased chance of infection [27]. Therefore, the mixture of PLLA and PDLLA was investigated, which is reported to have more rapid degradation [24] within 1 to 3 years [27].
Additionally, plasticizers can be added to improve the malleability by lowering the glass transition temperature (Tg) and controlling the degradation rate in the drug delivery application. Several plasticizers, such as lactic acid oligomer (LAO) [15], citrate esters [28], and PEG [29], have been used for PLA-based mixtures. The latter has been extensively studied because of its vast range of molecular weights [30], biocompatibility [29], and high miscibility with PLA [31], owing to the interaction between the end hydroxyl group of PEG and the carbonyl group of PLA. The addition of PEG into the PLA matrix gives several advantages, such as improving the hydrophilicity of PLA [29], increasing the flexibility and impact toughness [30], and enhancing the crystallization rate [31]. Nevertheless, the influence of PEG on the degradation process of PDLLA and PLLA blends remains poorly understood. In biomedical applications, the degradation process needs to be completely understood because it determines tissue healing and regeneration.
The purpose of this study was to scrutinize the effect of PEG incorporation as a plasticizing agent into the PLLA/PDLLA blend. Moreover, this study aimed to analyze the morphological evolution, thermal characteristics alteration, chemical structure, crystal formation, and degradation behavior using the addition of PEG with various concentrations. PEG was used as the main plasticizing agent, and the PLLA/PDLLA blend ratio was kept constant at 70:30 wt%. Scanning electron microscopy (SEM), differential scanning calorimetry (DSC), x-ray diffraction (XRD), and Fourier transform infrared (FTIR) spectroscopy were conducted to evaluate the changes that occurred to the plasticized polymer blends. Hydrolytic degradation was also performed in vitro using phosphate-buffered saline (PBS) media to analyze the mass loss and structural changes.
PLLA (average Mn 30,000), (Sigma-Aldrich, Missouri, USA) and PDLLA (Mn 75,000) (P1691, Sigma-Aldrich, Missouri, USA) with a composition ratio of 70:30 by weight were dissolved in dichloromethane (DCM) (Merck, Darmstadt, Germany) (hereafter denoted as PLA blend). The choice of PLLA and PDLLA compositions was based on research showing that 70:30 is widely used for PLA implant applications because adequate mechanical strength is obtained with appropriate degradation rates at this ratio [27,32]. A polymer/solvent ratio of 1:5 g/ml was used in this study. PEG400 (Merck, Darmstadt, Germany) was added into the blends with a varying degree of content, specifically 0%, 4%, 8%, and 12% by total weight (hereafter denoted as PLA/PEG0, PLA/PEG4, PLA/PEG8, and PLA/PEG12, respectively). The solution blending process was conducted using a magnetic stirrer (C-MAG HS 7, IKA, Malaysia) at room temperature with a mixing speed of 60 rpm. The blending reactor was fluxed with a vacuum suction machine, and nitrogen was continuously streamed into the reactor at a pressure of 3 bar. The stirring process took place for 1 h until the solution became clear. After 1 h of stirring, the solution was cast into a silicone mold with a dimension of 1 cm2 × 1 cm2. The obtained samples were then stored in a vacuum oven at 40°C for 24 h to vaporize the DCM solution from the samples, where they would be trapped inside a liquid-nitrogen-atmosphere chamber. Before characterization, a hot press was used on the samples at a temperature of 200°C for 10 min to obtain a plate shape.
2.2.1 Fourier Transform Infrared (FTIR) Spectroscopy
Chemical structures and functional groups of the samples were characterized using direct measurement by FTIR spectroscopy (Perkin Elmer UATR Two) using the attenuated total reflection method. The solid sample was directly scanned without prior preparation. All samples were scanned using IR spectra of 4000 to 400 cm−1 with a resolution of 4 cm−1 and 37 scans per sample. FTIR was employed to analyze the structure alteration to examine the intensity ratio from the two band pairs (I1384/1361). The I1384/1361 value of the blends at 14 and 28 days of degradation was calculated according to the following formula [33]:
with
2.2.2 Differential Scanning Calorimetry (DSC)
The characterization of thermal properties was performed by DSC (Research Center for Biomaterial, Indonesia Institute of Sciences, Indonesia). The sample, approximately 5 mg in weight, was crimped into an aluminum pan with a cover. An empty pan was used as a reference. The first heating was conducted from 0°C to 200°C with a heating rate of 10°C/min and kept at 200°C for 3 min. The samples were then cooled down to 0°C at a cooling rate of 10°C/min and reheated for the second run to 200°C with the same heating rate as before. The process was kept under a nitrogen atmosphere throughout the experiment. The degree of crystallinity (Xc) was calculated using the following Eq. (1) [34].
where
Crystal structures and orientation of the samples were analyzed by XRD (Research Center for Physics, Indonesia Institute of Sciences, Indonesia). The diffraction angle 2θ was scanned in the range of 10°–30° with a scanning speed of 5°/min at room temperature. Further analysis of the peak diffraction profile identification and index of crystallinity (Ic) calculation was conducted using Match! (Version 3.12, Crystal Impact, Bonn, Germany).
Micro Vickers hardness testing was used to examine mechanical properties (Research Center for Physics, Indonesia Institute of Sciences, Indonesia). The experiment was conducted five times for each specimen at different locations, with each indentation approximately 3 mm away from the previous one. The force applied in this experiment was 0.03 N for 12 s. Diamond was used as the indenter with an indentation degree of 120°.
2.2.5 Scanning Electron Microscopy (SEM)
Polymer blend samples were fractured into two sections to study the cross-sectional fracture morphology. Gold was sputter-coated on the surface of the fracture with a thickness of 10–20 nm to improve the conductivity of the sample surface. SEM (Inspect F50, FEI Company, Hillsboro, USA) was utilized to visualize the surface morphology.
2.2.6 Weight Loss in Phosphate-Buffered Saline
The degradation behavior of PLA/PEG blends was assessed in vitro using PBS. The process was conducted in an incubator to protect the environment from impurities and maintain the temperature at 37°C to imitate the human body condition. All samples were immersed inside a petri dish that was covered with aluminum foil. Mass loss was measured at 0, 7, 14, 21, and 28 days. Every 7 days the PBS solution was changed to maintain a pH of 7.
3.1 Physicochemical Properties of PLA/PEG Blends
3.1.1 Structural Evolution in the Blending System
Functional group alteration upon PEG addition into the blend was studied by FTIR analysis, as shown in Fig. 1A. Pure PLLA exhibited a sharp peak at 1751 cm−1, which corresponds to C=O stretching of the carbonyl group. Meanwhile, the same functional group displayed a slight shift to 1748 cm−1 in the pure PDLLA sample. The miscibility between PLA and PEG can be observed through intensity evolutions of specific peaks, particularly at 1750 cm−1 (indicative of carbonyl groups [14]). With the higher content of PEG, stronger intermolecular hydrogen bonding occurred because of the rise of terminal hydroxyl fraction in the matrix, as observed with the increase in I1750, as shown in Fig. 1B.
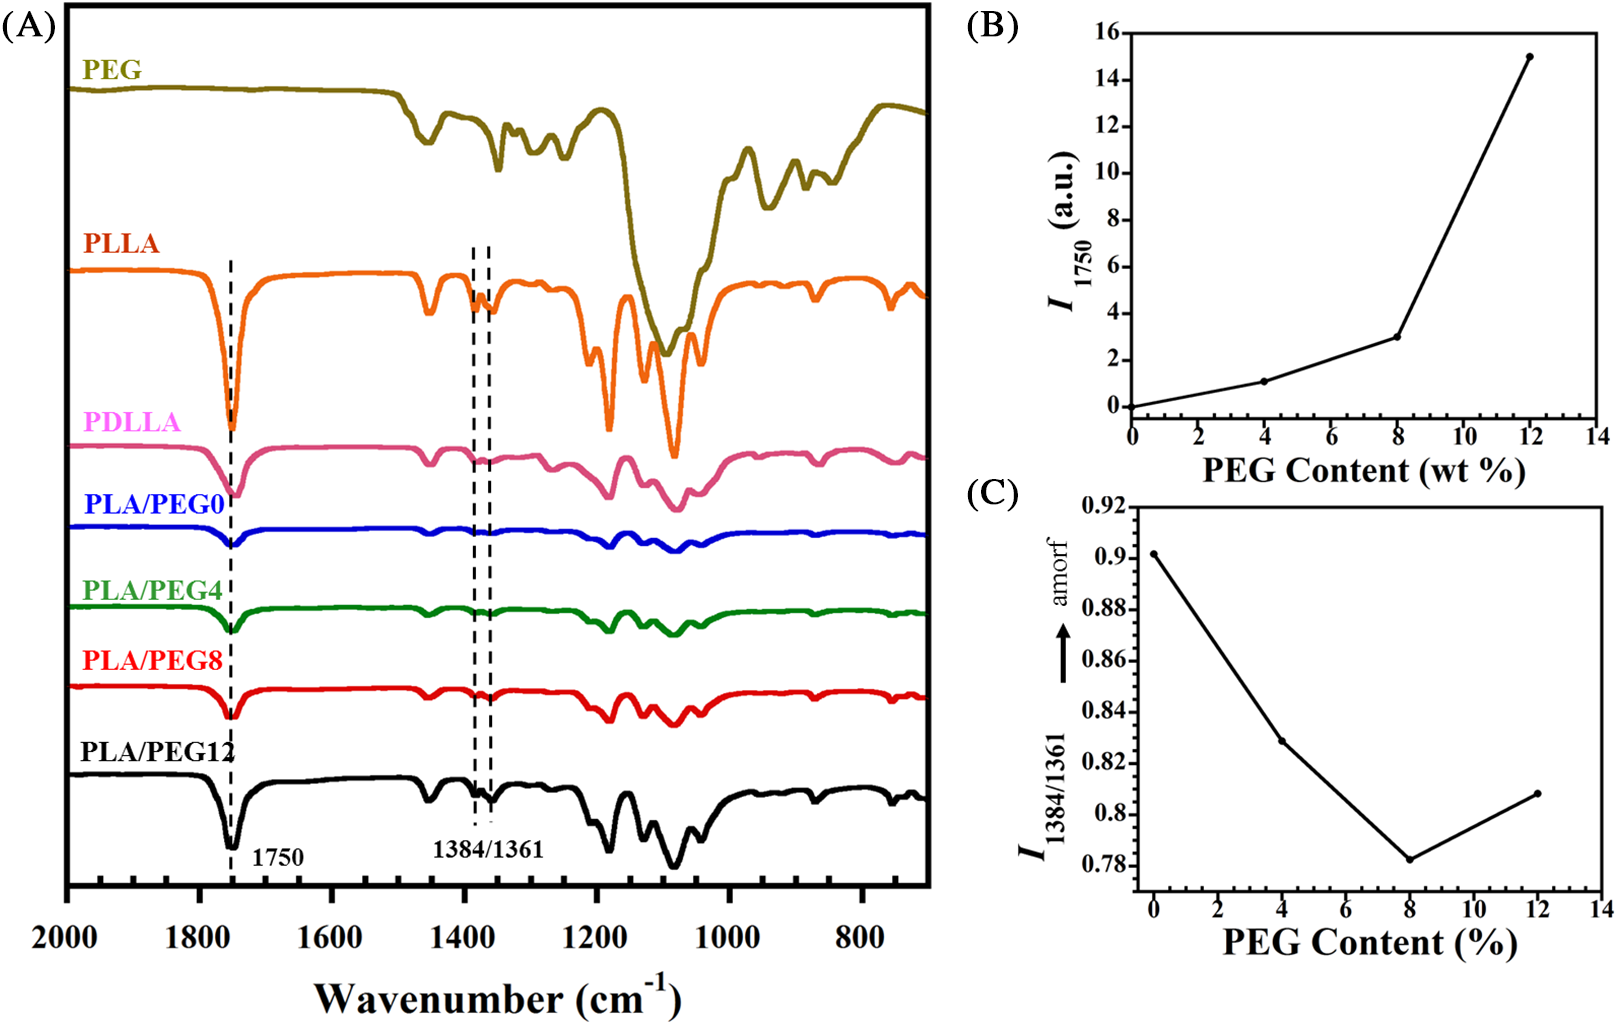
Figure 1: (A) FTIR spectra of PLA/PEG blends. (B) Intensity at the band of 1750 cm−1 (I1750) and (C) I1384/1361
Furthermore, the structural evolution due to the PEG incorporation was investigated. Dou et al. [33] reported that the absorbance ratio of the band pairs (I1384/1361) changes to a significantly larger value with the increase of amorphous PLLA structures. In this study, we found that the value of I1384/1361 also evolves with the increase of PEG content, as seen in Fig. 1C. Compared to that of PLA/PEG0, the I1384/1361 greatly decreased with 4% incorporation of PEG. This indicated that the PEG significantly accelerated the crystallization by improving the mobility of PLA chains [31]. The intensity ratio achieved the lowest value of 0.82 for PLA/PEG8. However, when the content of PEG increased to 12%, I1384/1361 slightly increased. This rise represented a decrease in crystallinity, which was confirmed by DSC and XRD.
3.1.2 Crystallinity of the Blends
Further observation of PEG plasticization in the PLA matrix was conducted by evaluating the crystal formation by XRD (Fig. 2). The diffraction peaks at 2θ = 12.5°, 14.8°, 16.7°, 19.1°, and 22.4° corresponded to the (103), (010), (200)/(110), (203), and (210) planes of the PLA homo α-crystalline, respectively [35,36]. No diffraction peak at 2θ = 11.9°, corresponding to the stereocomplex (SC) crystal, was detected in the PLA or PEG-plasticized blends. This result is almost similar to that reported by Tsuji et al. [37,38], where only α-form crystallites of PLLA were detected in the PLLA-b-PDLLA polymers, regardless of the PLLA fraction.
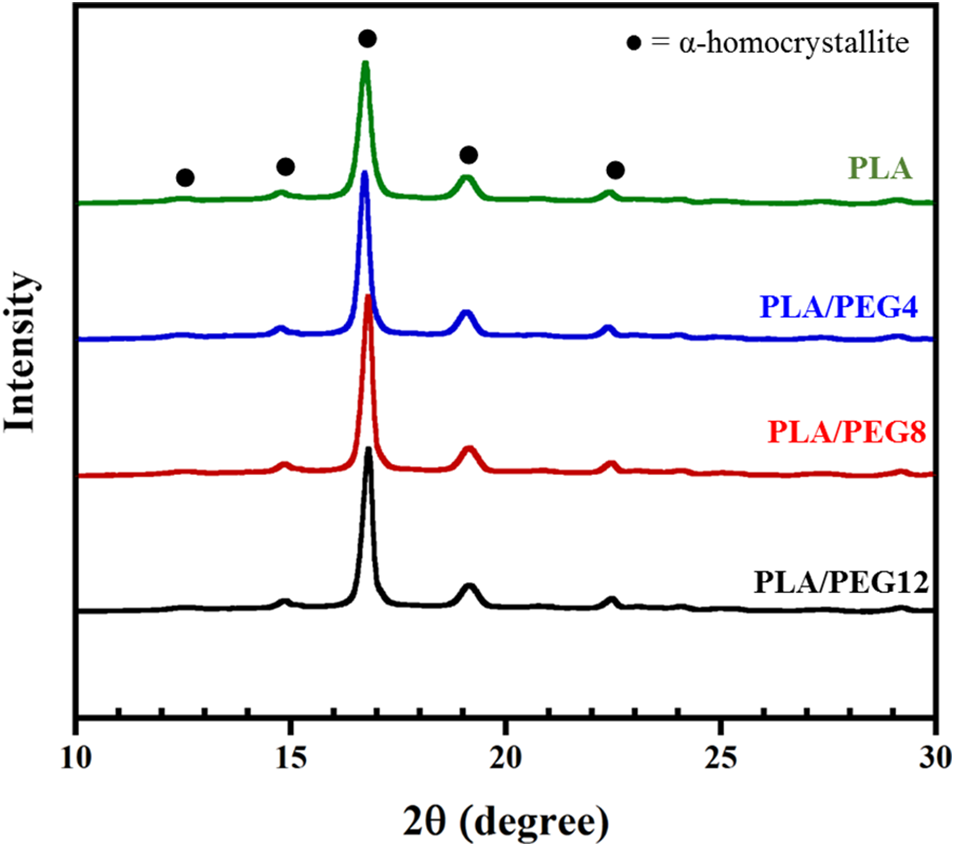
Figure 2: XRD diffractogram of PLA/PEG blends
In addition, the amount of PEG in our study does not affect SC formation. In contrast, a study [39] showed that the PEG in the PLLA/PDLA blends not only facilitates the crystallization of the PLLA matrix but also promotes SC crystal formation. Although PEG can act as a diluting agent in PLA blends, such that the interaction among PLA chains is reduced and the Tg is decreased, the content of D-lactic acid in our PDLLA may be too low.
From the XRD results, the crystallinity index was also quantified. Fig. 3 reveals that the increase of crystallinity index for 0 to 8 wt% PEG blends occurred stably from 36.71% to 40.18%. This suggests that PEG plasticized the PLA chains based on the lubrication theory. PEG caused the PLA chains to move more easily by reducing the friction between intermolecular polymer chains [40]. As a result, after going through the formation of crystal nuclei in the solidification process, PLA chains were more prone to undergo a chain folding process, which consequently increased the index of crystallinity [41,42]. This evidence supports the decrease of I1384/1361 (as shown in Fig. 1C) that was observed when PEG was added up to 8 wt%.
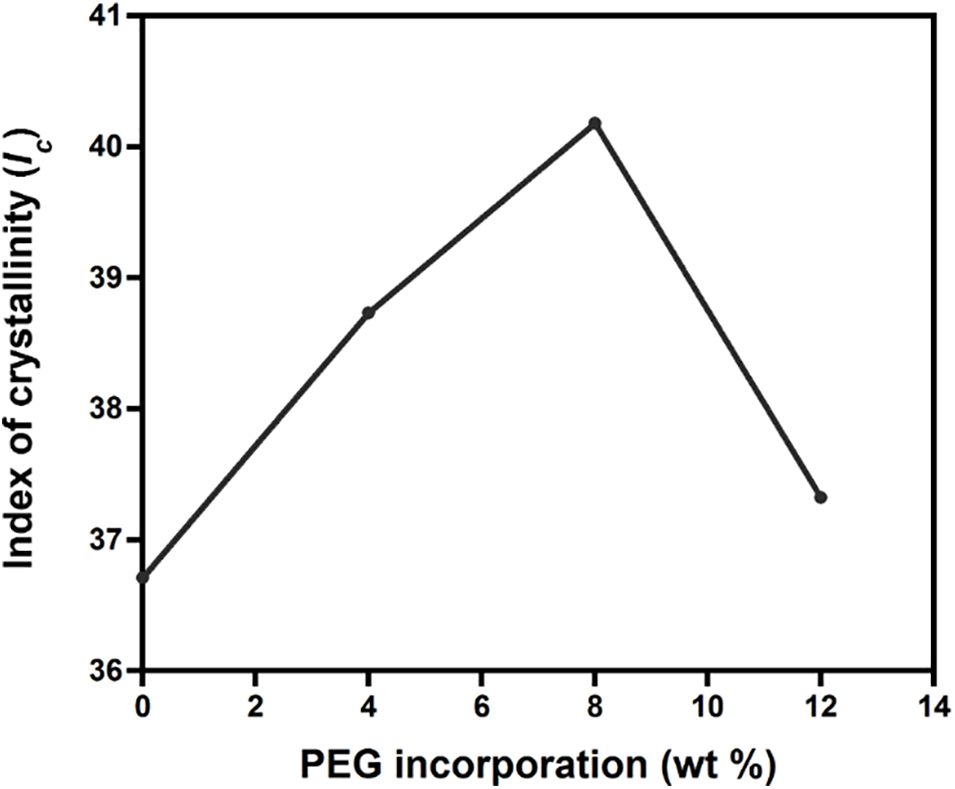
Figure 3: Effect of PEG incorporation to the index of crystallinity (Ic) of PLA/PEG blends
Interestingly, the crystallinity decreased to 37.32% for PLA/PEG12. The decrease of crystallinity is in accordance with the increased I1384/1361, suggesting an increase in the amount of amorphous chain regions.
Fig. 4 shows DSC thermograms of pure PLLA, PDLLA, PLA blends, and PEG-plasticized PLA blends, and Table 1 summarizes their thermal parameters. Pure PDLLA exhibited completely amorphous behavior [43] in which the Tg is observed at 45.1°C, and neither the melting temperature (Tm) nor crystallization temperature (Tc) nor cold crystallization temperature (Tcc) were detected. Pure PLLA showed a relatively high Tg at 74.9°C, which may be due to its low molecular weight. Upon blending with PDLLA, a single Tg is observed, and the value decreases to 51.9°C. This result agrees with Pan et al. [44], who reported that mixing PLLA with PDLLA (XPDLLA = 0.25) lowered the Tg. This is attributed to the effect of stereoregularity on the helical conformation of PLA blends, which depends on the content of L-lactic acid units. For the PLLA/PDLLA blends (e.g., the fraction of D-lactic acid decreases), as the stereoregularity decreases, the Tg value decreases [44,45].
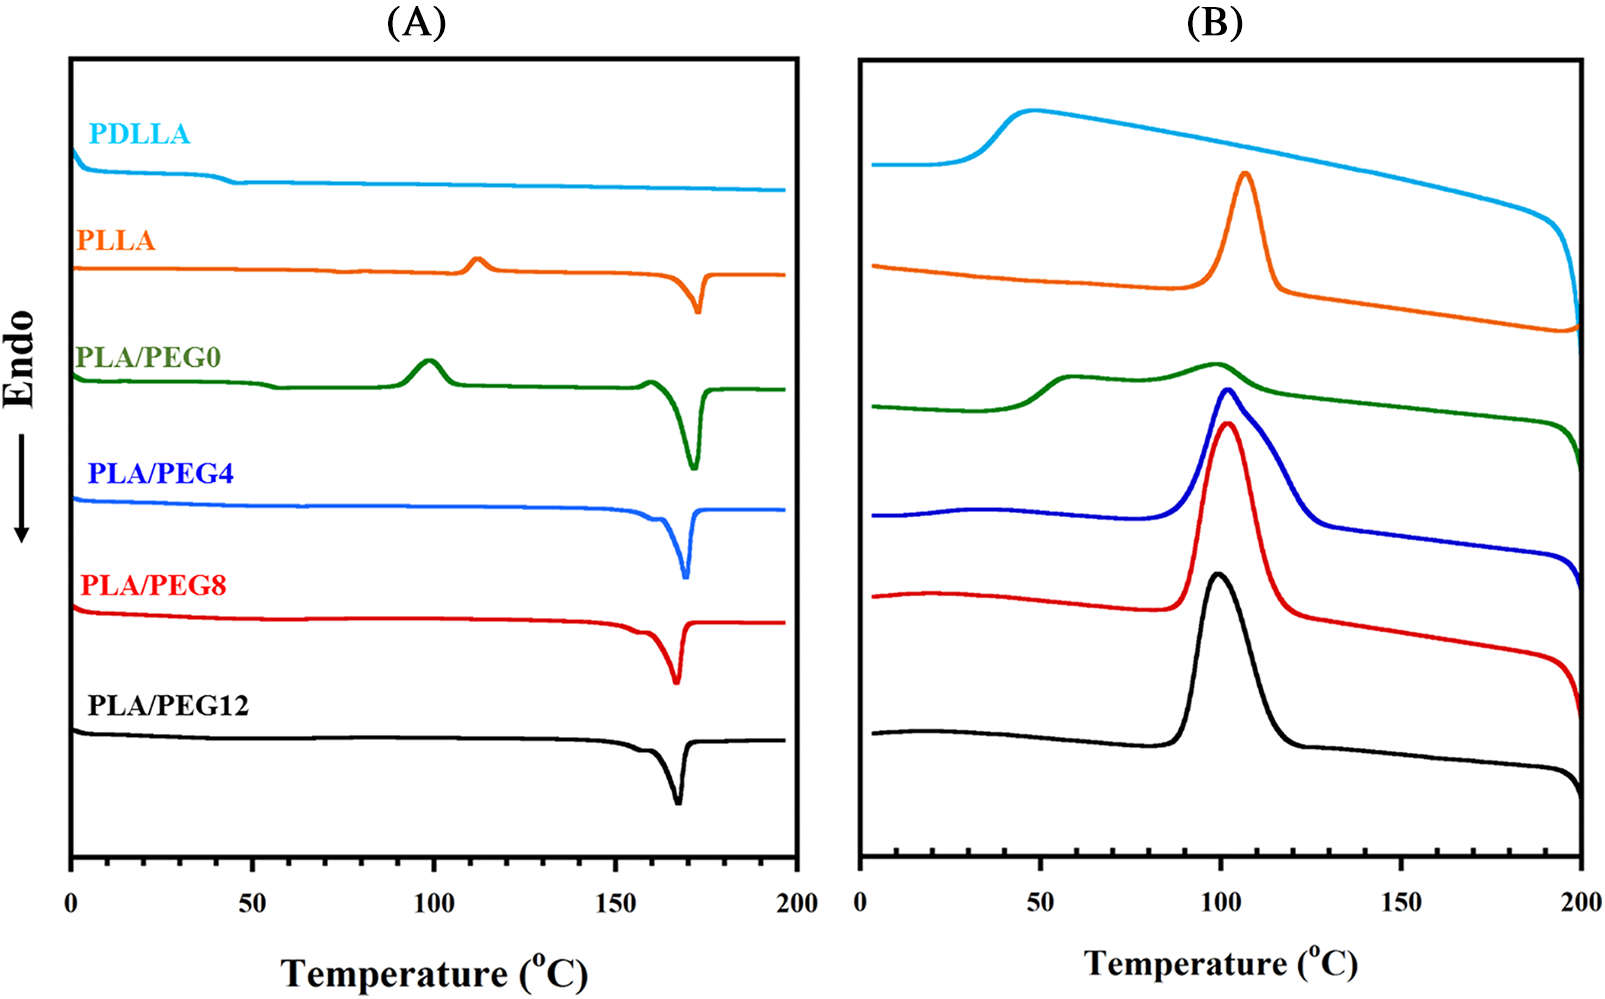
Figure 4: DSC thermograms of pure PDLLA, pure PLLA, PLA blends, and plasticized PLA blends during heating (A) and cooling (B)
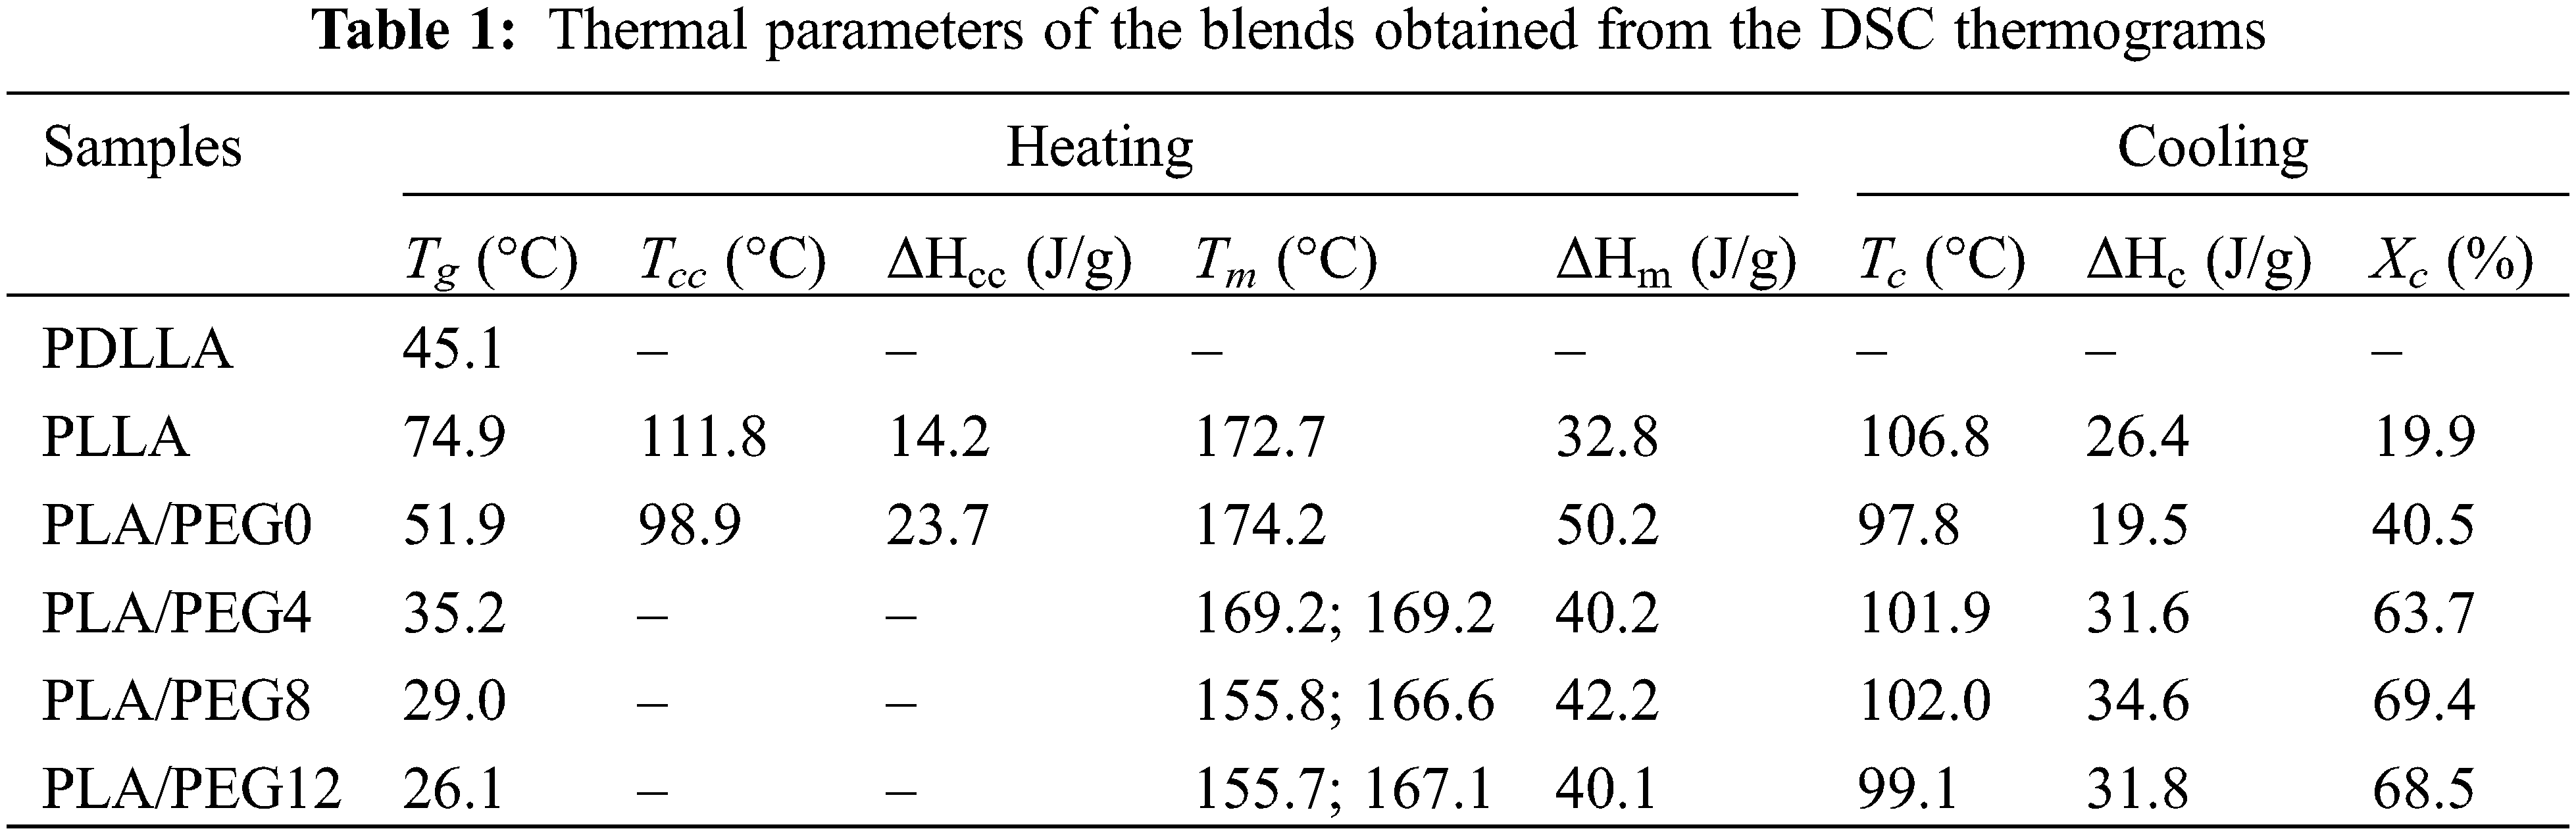
As seen in Table 1, all the blends with increasing fractions of PEG exhibited a single Tg peak that shifted to a low temperature. Plasticization using 4 wt% of PEG drastically reduced the Tg to 35.19°C, and an increase in PEG concentration proportionately reduced the Tg. The lowest Tg was achieved by PLA/PEG12 at 26.09°C, just below the ambient temperature. A similar trend was reported by Hu et al. [46], showing that the addition of PEG into PLA blends significantly decreased the Tg, and the content of 30% PEG yielded a Tg below the ambient temperature. These results indicate effective plasticizing by PEG and that the three components in the blend systems are miscible.
The incorporation of PEG up to 8% also led to an increase in Tc and crystallinity (Xc). This result suggested that PEG enhances the crystallization rate, thus increasing Xc, as shown in Table 1. However, the Xc decreased for PLA/PEG12. Higher contents of PEG may interfere with the crystallization process by disrupting PLA chains, which in turn leads to a decrease in crystallinity. Moradkhannejhad et al. [47] reported the same phenomenon for PEG in the PLA/curcumin blend, where the crystallinity decreased. The degree of crystallinity generated from the DSC data has a trend similar to that produced from FTIR (Fig. 1C) and XRD (Fig. 3), in which the crystallinity showed an increase up to 8% PEG and then decreased at 12% PEG. The difference in value between Ic and Xc was mainly related to the different characterization methods. In addition, double melting peaks appeared upon PEG incorporation, revealing the polymorphic structures of δ and α crystals [30,48].
3.1.4 Microstructure Morphology of PLA/PEG Blends
SEM micrographs of the plasticized blends are presented in Fig. 5. Smooth ductile morphology was observed in PLA blends (Fig. 5A) and plasticized blends (Figs. 5B–5D), indicating that PEG is mixed homogeneously in the PLA matrix. PLA/PEG8 showed a smooth surface with some micro cracks (denoted by a blue arrow). On PLA/PEG12, a wider crack formation was visible, as seen in Fig. 5D. This microcrack may have developed upon quenching the specimen in liquid nitrogen for sample preparation of SEM. The cryo-fracture may have caused the phase separation between PLA and PEG, generating the observed microcracks.
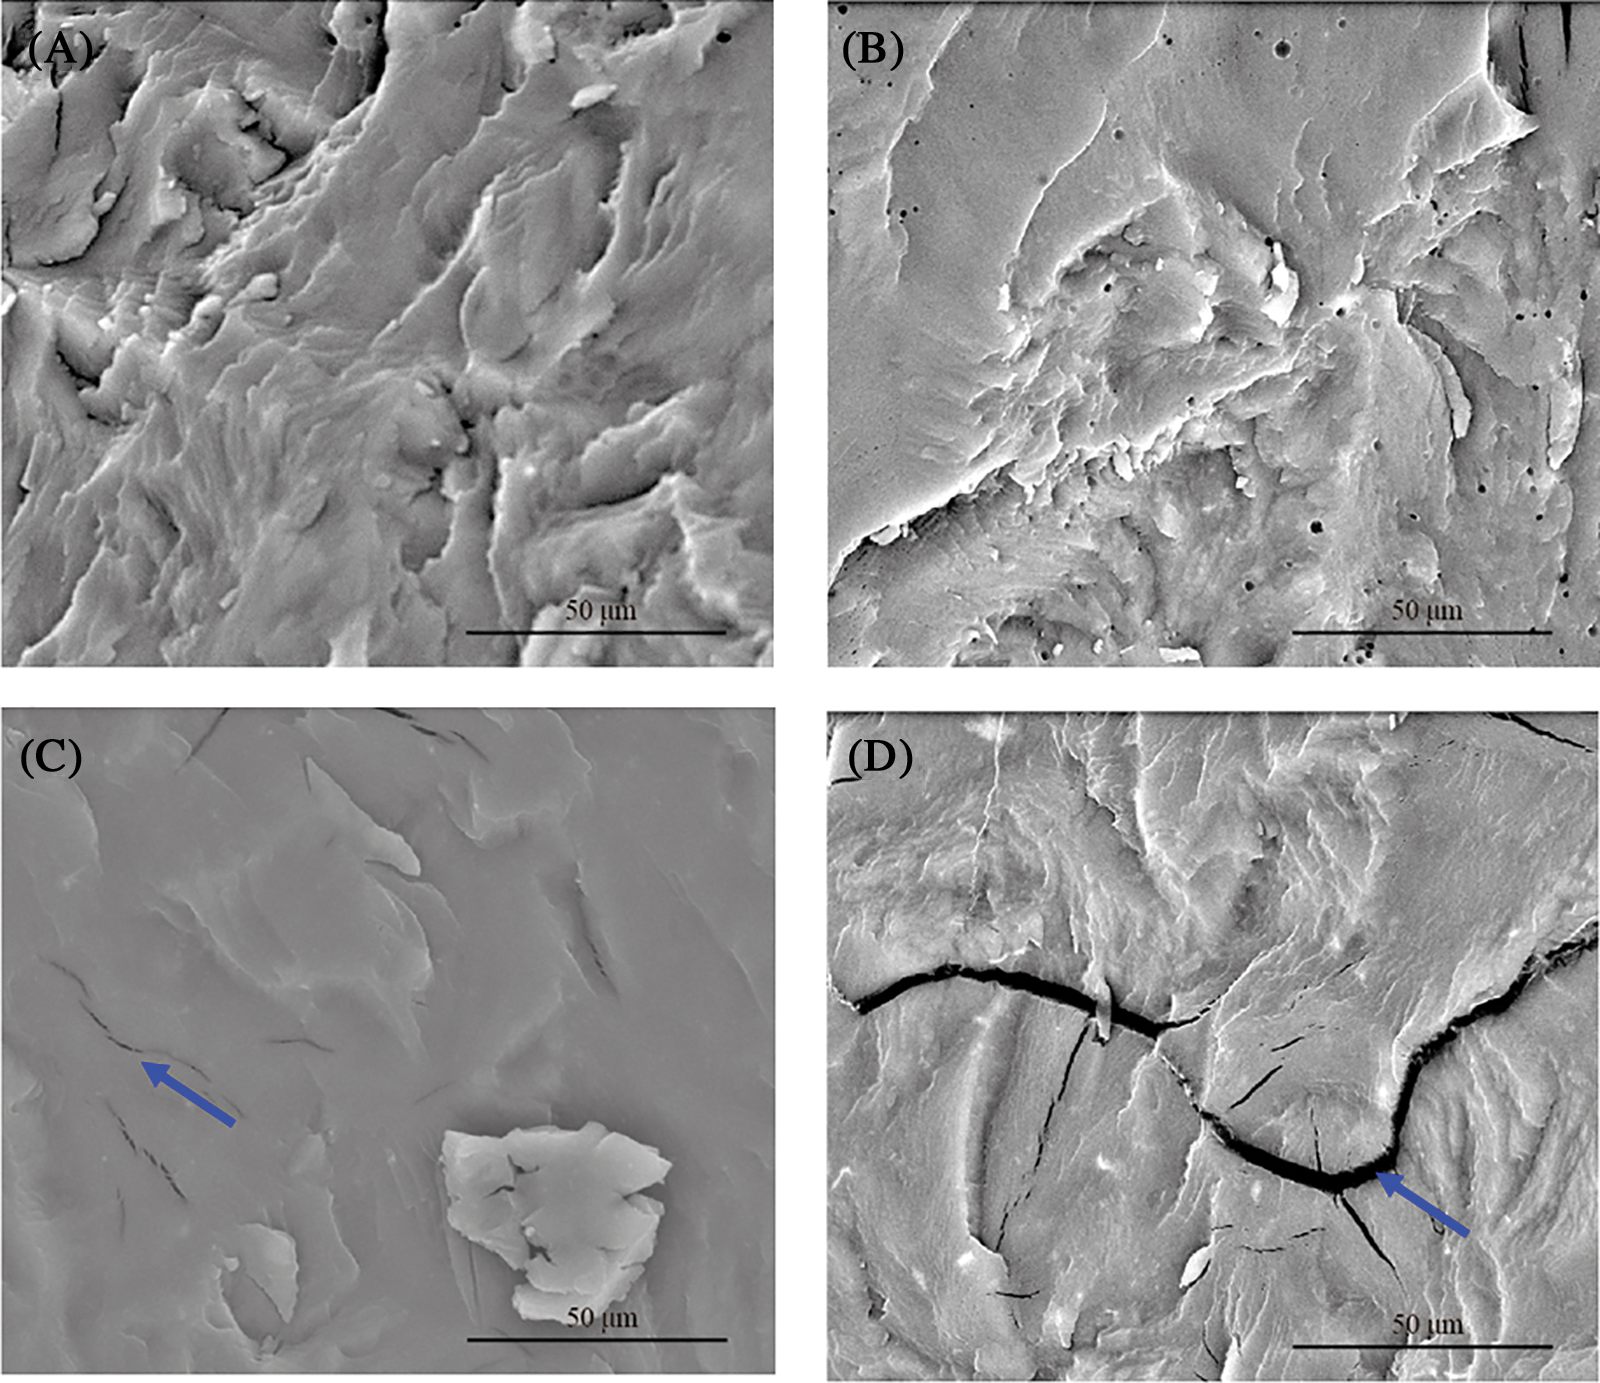
Figure 5: SEM micrographs of (A) PLA, (B) PLA/PEG4, (C) PLA/PEG8, and (D) PLA/PEG12
3.1.5 Hardness Properties of PLA/PEG Blends
Chain lubrication on the surface was further confirmed by the hardness of the blends (Fig. 6). The incorporation of PEG (4 wt%) significantly reduced the hardness from 24 HV to 10 HV. This is due to the lubricating ability of PEG, which is consistent with a significant reduction of Tg upon the addition of PEG (Table 1). PLA/PEG8 possessed a slightly lower hardness value of 7.88 HV. Further addition of PEG at 12 wt% reduced the hardness on the surface to 4.76 HV. This phenomenon occurred because the interaction of the polymer chain is weakened by the insertion of the PEG as a plasticizer [49].
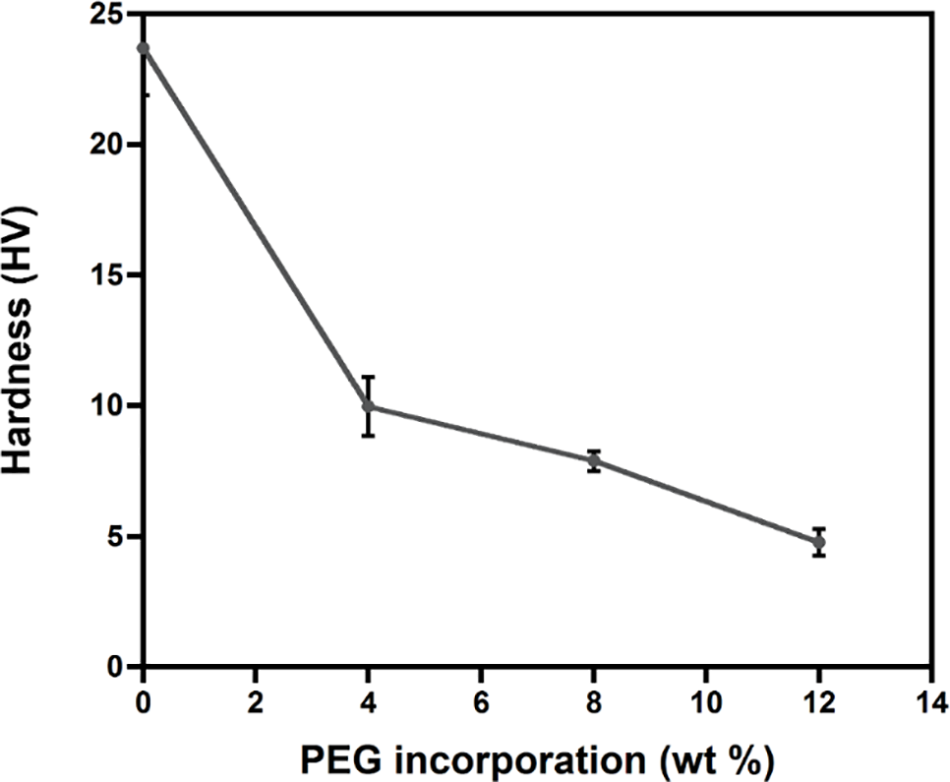
Figure 6: Effect of PEG incorporation on the hardness of PLA blends
3.2 In vitro Degradation Behavior of PLA/PEG Blends
The hydrolytic degradation was evaluated by immersion of the specimens in PBS and incubating at 37°C, which resembles the physiological temperature of the human body. As seen in Fig. 7, the weight loss generally increased as the content of PEG increased. For the PLA and PLA/PEG4 blends, the weight loss was not observable in the first 7 days. In contrast, PLA/PEG8 lost weight by approximately 0.28%, and PLA/PEG12 experienced the highest mass loss, around 1.5%, on day 7. Then, the hydrolytic degradation of all blends progressed further, as indicated by the increasing weight loss from time to time, with PLA/PEG12 showing the most significant mass reduction. The blends with a high content of PEG are more hydrophilic than those with lower contents [47]. This is because PEG is easily dissolved in water, especially PEG with low molecular weight. Therefore, PLA/PEG12 can easily lose PEG content during immersion in PBS. This result is in accordance with Kim et al. [50], reporting that the degradation rate rose with increasing the PEG content in PLLA.
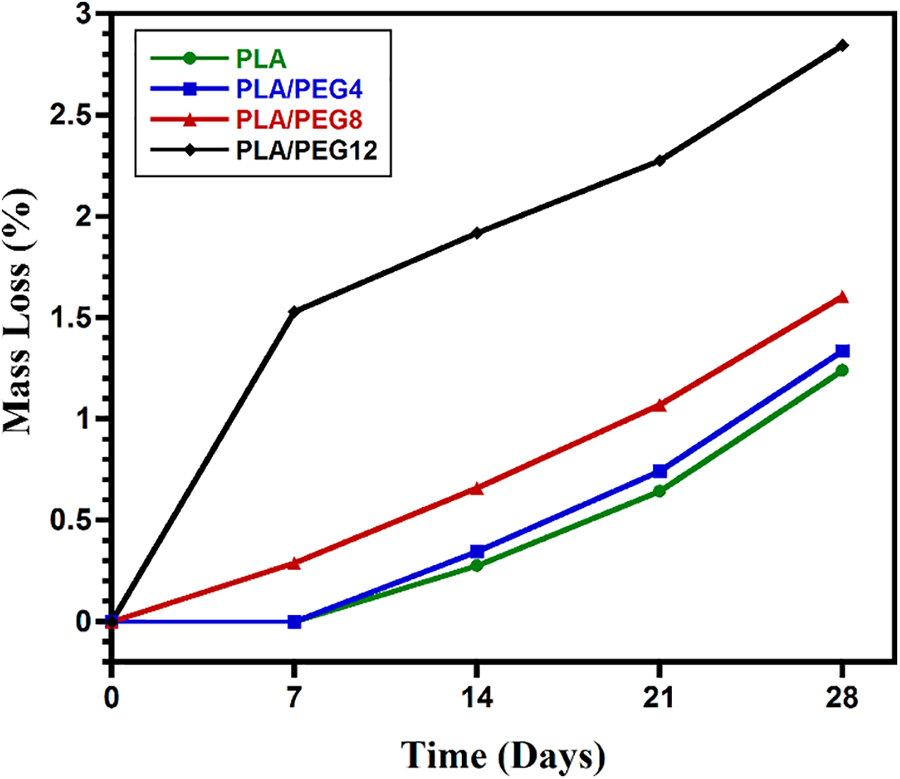
Figure 7: In vitro degradation of PLA/PEG blends for 28 days
3.2.2 Evolution of PLA Blends States of Order during in Vitro Degradation
The evolution of PLA blends state of order during in vitro degradation is evaluated using FTIR, particularly at the bands of 1384 and 1361 cm−1, where the increase in the intensity ratio I1384/1361 represents the increase of amorphous segments according to Dou et al. [33]. For the PLA blend without plasticizer, the weight loss in the first 14 days may indicate the degradation of amorphous PDLLA segments, leaving the crystalline PLLA chains. Thus, the decrease in I1384/1361 is observed, as seen in Fig. 8. Tsuji et al. [51] studied the hydrolytic degradation of PDLLA/PLLA blends and found that PDLLA was largely degraded and removed from the blends, and thus the degradation rate of blends was elevated by the addition of PDLLA. The intensity ratio then rose again at 28 days, indicating the increase of amorphous segments due to the swelling of the crystalline PLLA chains by water penetration.
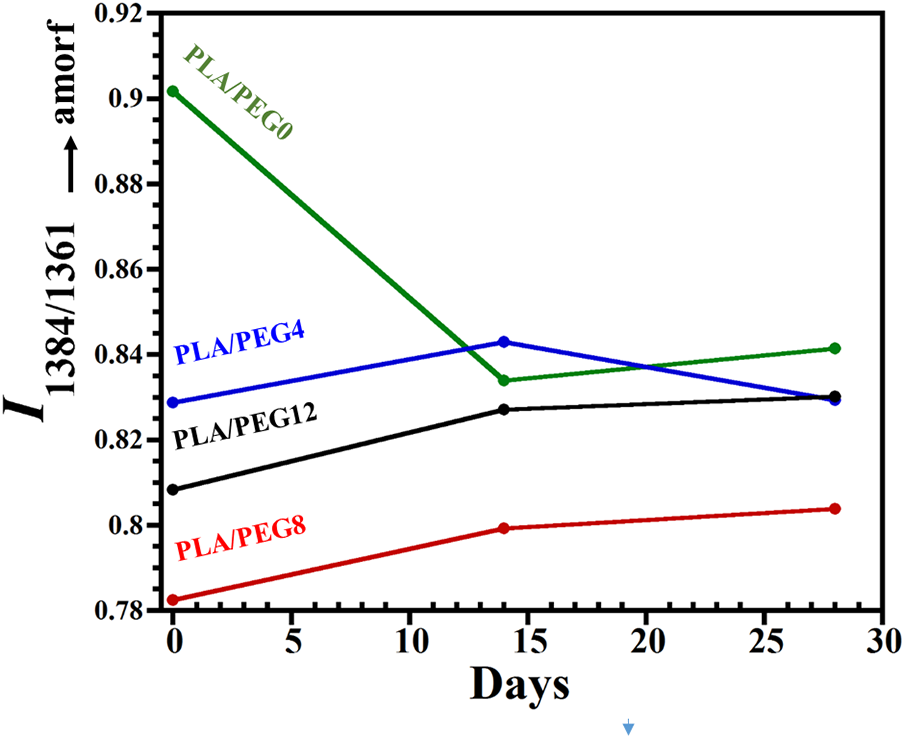
Figure 8: The variation of the intensity ratios I1384/1361 for PLA and PLA/PEG blends during in vitro degradation
In contrast, for all plasticized PLA blends, the I1384/1361 increased gradually in the first 14 days, which indicated the increase of amorphous segments. The presence of PEG assisted the mobility of the molecular chains of PLLA through swelling, increasing the free volume between the molecular chains and thus leading to the increase of amorphous PLLA. For PLA/PEG8 and PLA/PEG12, I1384/1361 kept rising from 14 to 28 days, suggesting a further increase in the amorphous area, which was probably caused by re-swelling of the crystalline chains.
Meanwhile, for PLA/PEG4, a slight decrease of I1384/1361 was observed at 28 days. This suggested that the PEG had completely dissolved in the water, inducing the decomposition of the amorphous chain and thereby increasing the crystalline segments.
In several reports, the hydrolytic degradation of PLA tended to increase the degree of crystallinity [52]. However, our results showed that all the plasticized blends experienced a decrease in crystallinity during the first 14 days of hydrolytic degradation. The analysis of I1384/1361 may be more sensitive to the changes in PLLA chain ordering [33].
This study evaluated the effects of PEG incorporation on the physicochemical and degradation behavior of PLA blends. The conclusions can be expressed as follows:
1. The addition of PEG up to 8 wt% into PLA blends increased the crystallinity because of the plasticization effect of PEG. At 12 wt% PEG, the crystallinity decreased, which was attributed to the increase in amorphous segments. The DSC data indicated that PLA/PEG blends were miscible up to 12 wt% PEG. The XRD data revealed that no stereocomplex crystallites were observed, only homocrystallites. The increase of PEG content progressively decreased the hardness of the blends.
2. The in vitro degradation behavior showed that the increase in PEG content generally enhanced the degradation rate. In this case, PLA/PEG12 experienced the highest weight loss during 28 days of immersion.
3. The analysis of I1384/1361 from the FTIR study provided an overview of structural evolution during hydrolytic degradation. Without PEG, the blends exhibited an increase in crystallinity during the first 14 days of degradation. In contrast, PEG-plasticized blends experienced a decrease in crystallinity during the first 14 days of degradation, owing to the effective plasticization by PEG.
Funding Statement: This work was supported by Universitas Indonesia under Grant PUTI 2020 (No. NKB-4325/UN2.RST/HKP.05.00/2020).
Conflicts of Interest: The authors declare that they have no conflicts of interest to report regarding the present study.
References
1. Liu, S., Qin, S., He, M., Zhou, D., Qin, Q. et al. (2020). Current applications of poly(lactic acid) composites in tissue engineering and drug delivery. Composites Part B: Engineering, 199, 108238. https://doi.org/10.1016/j.compositesb.2020.108238 [Google Scholar] [CrossRef]
2. Ju, J., Peng, X., Huang, K., Li, L., Liu, X. et al. (2019). High-performance porous PLLA-based scaffolds for bone tissue engineering: Preparation, characterization, and in vitro and in vivo evaluation. Polymer, 180, 121707. https://doi.org/10.1016/j.polymer.2019.121707 [Google Scholar] [CrossRef]
3. Singhvi, M. S., Zinjarde, S. S., Gokhale, D. V. (2019). Polylactic acid: Synthesis and biomedical applications. Journal of Applied Microbiology, 127(6), 1612–1626. https://doi.org/10.1111/jam.14290 [Google Scholar] [PubMed] [CrossRef]
4. Huang, W. Y., Hibino, T., Suye, S., Fujita, S. (2021). Electrospun collagen core/poly-l-lactic acid shell nanofibers for prolonged release of hydrophilic drug. RSC Advances, 11(10), 5703–5711. https://doi.org/10.1039/D0RA08353D [Google Scholar] [PubMed] [CrossRef]
5. DeStefano, V., Khan, S., Tabada, A. (2020). Applications of PLA in modern medicine. Engineered Regeneration, 1, 76–87. https://doi.org/10.1016/j.engreg.2020.08.002 [Google Scholar] [CrossRef]
6. Dhanvantri, V., Ramya, R., Cherian, K. M., Ramesh, B. (2019). Evaluation of human dental stem cell growth characteristics and cellular morphological changes in response to extracellular matrix nanotopography. Clinical and Laboratorial Research in Dentistry, 1–15. https://doi.org/10.11606/issn.2357-8041.clrd.2019.160296 [Google Scholar] [CrossRef]
7. Ikuta, Y., Nakasa, T., Sumii, J., Nekomoto, A., Adachi, N. (2021). Histopathological and radiographic features of osteolysis after fixation of osteochondral fragments using poly-l-lactic acid pins for osteochondral lesions of the talus. The American Journal of Sports Medicine, 49(6), 1589–1595. https://doi.org/10.1177/03635465211001758 [Google Scholar] [PubMed] [CrossRef]
8. Bockmann, B., Jaeger, E., Dankl, L., Nebelung, W., Frey, S. et al. (2022). A biomechanical comparison of steel screws versus PLLA and magnesium screws for the Latarjet procedure. Archives of Orthopaedic and Trauma Surgery, 142(6), 1091–1098. https://doi.org/10.1007/s00402-021-03898-w [Google Scholar] [PubMed] [CrossRef]
9. Feng, P., Jia, J., Liu, M., Peng, S., Zhao, Z. et al. (2021). Degradation mechanisms and acceleration strategies of poly (lactic acid) scaffold for bone regeneration. Materials & Design, 210, 110066. https://doi.org/10.1016/j.matdes.2021.110066 [Google Scholar] [CrossRef]
10. Golan, O., Shalom, H., Kaplan-Ashiri, I., Cohen, S. R., Feldman, Y. et al. (2021). Poly(L-lactic acid) reinforced with hydroxyapatite and tungsten disulfide nanotubes. Polymers, 13(21), 3851. https://doi.org/10.3390/polym13213851 [Google Scholar] [PubMed] [CrossRef]
11. Li, B., Xiong, F., Yao, B., Du, Q., Cao, J. et al. (2020). Preparation and characterization of antibacterial dopamine-functionalized reduced graphene oxide/PLLA composite nanofibers. RSC Advances, 10(32), 18614–18623. https://doi.org/10.1039/D0RA03224G [Google Scholar] [PubMed] [CrossRef]
12. Adeosun, S. O., Lawal, G. I., Gbenebor, O. P. (2014). Characteristics of biodegradable implants. Journal of Minerals and Materials Characterization and Engineering, 2(2), 88–106. https://doi.org/10.4236/jmmce.2014.22013 [Google Scholar] [CrossRef]
13. Rasselet, D., Caro-Bretelle, A. S., Taguet, A., Lopez-Cuesta, J. M. (2019). Reactive compatibilization of PLA/PA11 blends and their application in additive manufacturing. Materials, 12(3), 485. https://doi.org/10.3390/ma12030485 [Google Scholar] [PubMed] [CrossRef]
14. Leonés, A., Peponi, L., Lieblich, M., Benavente, R., Fiori, S. (2020). In vitro degradation of plasticized PLA electrospun fiber mats: Morphological, thermal and crystalline evolution. Polymers, 12(12), 2975. https://doi.org/10.3390/polym12122975 [Google Scholar] [PubMed] [CrossRef]
15. Lascano, D., Moraga, G., Ivorra-Martinez, J., Rojas-Lema, S., Torres-Giner, S. et al. (2019). Development of injection-molded polylactide pieces with high toughness by the addition of lactic acid oligomer and characterization of their shape memory behavior. Polymers, 11(12), 2099. https://doi.org/10.3390/polym11122099 [Google Scholar] [PubMed] [CrossRef]
16. Takayama, T., Todo, M. (2006). Improvement of impact fracture properties of PLA/PCL polymer blend due to LTI addition. Journal of Materials Science, 41(15), 4989–4992. https://doi.org/10.1007/s10853-006-0137-1 [Google Scholar] [CrossRef]
17. Vieira, A. C., Vieira, J. C., Ferra, J. M., Magalhães, F. D., Guedes, R. M. et al. (2011). Mechanical study of PLA-PCL fibers during in vitro degradation. Journal of the Mechanical Behavior of Biomedical Materials, 4(3), 451–460. https://doi.org/10.1016/j.jmbbm.2010.12.006 [Google Scholar] [PubMed] [CrossRef]
18. Fortelny, I., Ujcic, A., Fambri, L., Slouf, M. (2019). Phase structure, compatibility, and toughness of PLA/PCL blends: A review. Frontiers in Materials, 6, 206. https://doi.org/10.3389/fmats.2019.00206 [Google Scholar] [CrossRef]
19. Eppley, B. L., Morales, L., Wood, R., Pensler, J., Goldstein, J. et al. (2004). Resorbable PLLA-PGA plate and screw fixation in pediatric craniofacial surgery: Clinical experience in 1883 patients. Plastic and Reconstructive Surgery, 114(4), 850–856. https://doi.org/10.1097/01.PRS.0000132856.69391.43 [Google Scholar] [PubMed] [CrossRef]
20. Yoon, S. K., Yang, J. H., Lim, H. T., Chang, Y. W., Ayyoob, M. et al. (2020). In vitro and in vivo biosafety analysis of resorbable polyglycolic acid-polylactic acid block copolymer composites for spinal fixation. Polymers, 13(1), 29. https://doi.org/10.3390/polym13010029 [Google Scholar] [PubMed] [CrossRef]
21. Dell’Erba, R., Groeninckx, G., Maglio, G., Malinconico, M., Migliozzi, A. (2001). Immiscible polymer blends of semicrystalline biocompatible components: Thermal properties and phase morphology analysis of PLLA/PCL blends. Polymer, 42(18), 7831–7840. https://doi.org/10.1016/S0032-3861(01)00269-5 [Google Scholar] [CrossRef]
22. Patrício, T., Bártolo, P. (2013). Thermal stability of PCL/PLA blends produced by physical blending process. Procedia Engineering, 59, 292–297. https://doi.org/10.1016/j.proeng.2013.05.124 [Google Scholar] [CrossRef]
23. Sakai, F., Nishikawa, K., Inoue, Y., Yazawa, K. (2009). Nucleation enhancement effect in poly(l-lactide) (PLLA)/poly(ε-caprolactone) (PCL) blend induced by locally activated chain mobility resulting from limited miscibility. Macromolecules, 42(21), 8335–8342. https://doi.org/10.1021/ma901547a [Google Scholar] [CrossRef]
24. Casalini, T., Rossi, F., Castrovinci, A., Perale, G. (2019). A perspective on polylactic acid-based polymers use for nanoparticles synthesis and applications. Frontiers in Bioengineering and Biotechnology, 7, 259. https://doi.org/10.3389/fbioe.2019.00259 [Google Scholar] [PubMed] [CrossRef]
25. Tsuji, H. (2005). Poly(lactide) stereocomplexes: Formation, structure, properties, degradation, and applications. Macromolecular Bioscience, 5(7), 569–597. https://doi.org/10.1002/(ISSN)1616-5195 [Google Scholar] [CrossRef]
26. Chen, C. C., Chueh, J. Y., Tseng, H., Huang, H. M., Lee, S. Y. (2003). Preparation and characterization of biodegradable PLA polymeric blends. Biomaterials, 24(7), 1167–1173. https://doi.org/10.1016/S0142-9612(02)00466-0 [Google Scholar] [PubMed] [CrossRef]
27. Choi, S. H., Lee, J. H. (2016). Absorbable plate-related infection after facial bone fracture reduction. Archives of Craniofacial Surgery, 17(1), 1–4. https://doi.org/10.7181/acfs.2016.17.1.1 [Google Scholar] [PubMed] [CrossRef]
28. Kang, H., Li, Y., Gong, M., Guo, Y., Guo, Z. et al. (2018). An environmentally sustainable plasticizer toughened polylactide. RSC Advances, 8(21), 11643–11651. https://doi.org/10.1039/C7RA13448G [Google Scholar] [PubMed] [CrossRef]
29. Nashchekina, Y., Nikonov, P., Nashchekin, A., Mikhailova, N. (2020). Functional polylactide blend films for controlling mesenchymal stem cell behaviour. Polymers, 12(9), 1969. https://doi.org/10.3390/polym12091969 [Google Scholar] [PubMed] [CrossRef]
30. Yu, Y., Cheng, Y., Ren, J., Cao, E., Fu, X. et al. (2015). Plasticizing effect of poly(ethylene glycol)s with different molecular weights in poly(lactic acid)/starch blends. Journal of Applied Polymer Science, 132(16), 41808. https://doi.org/10.1002/app.41808 [Google Scholar] [CrossRef]
31. Li, F. J., Zhang, S. D., Liang, J. Z., Wang, J. Z. (2015). Effect of polyethylene glycol on the crystallization and impact properties of polylactide-based blends. Polymers for Advanced Technologies, 26(5), 465–475. https://doi.org/10.1002/pat.3475 [Google Scholar] [CrossRef]
32. Al-Sukhun, J., Törnwall, J., Lindqvist, C., Kontio, R. (2006). Bioresorbable poly-l/dl-lactide (P[L/DL]LA 70/30) plates are reliable for repairing large inferior orbital wall bony defects: A pilot study. Journal of Oral and Maxillofacial Surgery, 64(1), 47–55. https://doi.org/10.1016/j.joms.2005.09.013 [Google Scholar] [PubMed] [CrossRef]
33. Dou, T., Zhou, B., Hu, S., Zhang, P. (2021). Evolution of the structural polymorphs of poly(l-lactic acid) during the in vitro mineralization of its hydroxyapatite nanocomposites by attenuated total reflection fourier transform infrared mapping coupled with principal component analysis. Polymer, 236, 124318. https://doi.org/10.1016/j.polymer.2021.124318 [Google Scholar] [CrossRef]
34. Chen, H., Du, X., Yang, A., Yang, J., Huang, T. et al. (2014). Effect of graphene oxides on thermal degradation and crystallization behavior of poly(l-lactide). RSC Advances, 4(7), 3443–3456. https://doi.org/10.1039/C3RA45480K [Google Scholar] [CrossRef]
35. Dai, S., Wang, M., Zhuang, Z., Ning, Z. (2020). Crystallization and alkaline degradation behaviors of poly(l-lactide)/4-armed poly(ε-caprolactone)-block-poly(d-lactide) blends with different poly(d-lactide) block lengths. Polymers, 12(10), 2195. https://doi.org/10.3390/polym12102195 [Google Scholar] [PubMed] [CrossRef]
36. Shao, J., Xiang, S., Bian, X., Sun, J., Li, G. et al. (2015). Remarkable melting behavior of PLA stereocomplex in linear PLLA/PDLA blends. Industrial & Engineering Chemistry Research, 54(7), 2246–2253. https://doi.org/10.1021/ie504484b [Google Scholar] [CrossRef]
37. Tsuji, H., Iguchi, K., Tashiro, K., Arakawa, Y. (2020). Crystallization behavior, structure, morphology, and thermal properties of crystalline and amorphous stereo diblock copolymers, poly(L-lactide)-b-poly(DL-lactide). Polymer Chemistry, 11(36), 5711–5724. https://doi.org/10.1039/D0PY01115K [Google Scholar] [CrossRef]
38. Tsuji, H., Iguchi, K., Arakawa, Y. (2021). Stereocomplex- and homo-crystallization behavior, structure, morphology, and thermal properties of crystalline and amorphous stereo diblock copolymers, enantiomeric poly(l-lactide)-b-poly(dl-lactide) and poly(d-lactide)-b-poly(dl-lactide). Polymer, 213, 123226. https://doi.org/10.1016/j.polymer.2020.123226 [Google Scholar] [CrossRef]
39. Song, Y., Wang, D., Jiang, N., Gan, Z. (2015). Role of PEG segment in stereocomplex crystallization for PLLA/PDLA-b-PEG-b-PDLA blends. ACS Sustainable Chemistry and Engineering, 3(7). https://doi.org/10.1021/acssuschemeng.5b00214 [Google Scholar] [CrossRef]
40. Marcilla, A., Beltrán, M. (2017). Mechanisms of plasticizers action. In: Wypych, G. (Ed.Handbook of plasticizers, 2nd edition, vol. 3, pp. 119–134. Amsterdam: Elsevier. https://doi.org/10.1016/B978-1-895198-97-3.50007-X [Google Scholar] [CrossRef]
41. Ma, Z., Yang, P., Zhang, X., Jiang, K., Song, Y. et al. (2019). Quantifying the chain folding in polymer single crystals by single-molecule force spectroscopy. ACS Macro Letters, 8(9), 1194–1199. https://doi.org/10.1021/acsmacrolett.9b00607 [Google Scholar] [PubMed] [CrossRef]
42. Xu, H., Yang, X., Xie, L., Hakkarainen, M. (2016). Conformational footprint in hydrolysis-induced nanofibrillation and crystallization of poly(lactic acid). Biomacromolecules, 17(3), 985–995. https://doi.org/10.1021/acs.biomac.5b01636 [Google Scholar] [PubMed] [CrossRef]
43. El-Hadi, A. M. (2019). Miscibility of crystalline/amorphous/crystalline biopolymer blends from PLLA/PDLLA/PHB with additives. Polymer-Plastics Technology and Materials, 58(1), 31–39. https://doi.org/10.1080/03602559.2018.1455863 [Google Scholar] [CrossRef]
44. Pan, P., Liang, Z., Zhu, B., Dong, T., Inoue, Y. (2009). Blending effects on polymorphic crystallization of poly(l-lactide). Macromolecules, 42(9), 3374–3380. https://doi.org/10.1021/ma8024943 [Google Scholar] [CrossRef]
45. Urayama, H., Moon, S. I., Kimura, Y. (2003). Microstructure and thermal properties of polylactides with different L- and D-unit sequences: Importance of the helical nature of the L-sequenced segments. Macromolecular Materials and Engineering, 288(2), 137–143. https://doi.org/10.1002/mame.200390006 [Google Scholar] [CrossRef]
46. Hu, Y., Rogunova, M., Topolkaraev, V., Hiltner, A., Baer, E. (2003). Aging of poly(lactide)/poly(ethylene glycol) blends. Part 1. Poly(lactide) with low stereoregularity. Polymer, 44(19), 5701–5710. https://doi.org/10.1016/S0032-3861(03)00614-1 [Google Scholar] [CrossRef]
47. Moradkhannejhad, L., Abdouss, M., Nikfarjam, N., Shahriari, M. H., Heidary, V. (2020). The effect of molecular weight and content of PEG on in vitro drug release of electrospun curcumin loaded PLA/PEG nanofibers. Journal of Drug Delivery Science and Technology, 56, 101554. https://doi.org/10.1016/j.jddst.2020.101554 [Google Scholar] [CrossRef]
48. Cheng, L., Hu, C., Li, J., Huang, S., Jiang, S. (2019). Stereocomplex-affected crystallization behaviour of PDLA in PDLA/PLDLA blends. CrystEngComm, 21(2), 329–338. https://doi.org/10.1039/C8CE01934G [Google Scholar] [CrossRef]
49. Norazlina, H., Kamal, Y. (2021). Elucidating the plasticizing effect on mechanical and thermal properties of poly(lactic acid)/carbon nanotubes nanocomposites. Polymer Bulletin, 78(12), 6911–6933. https://doi.org/10.1007/s00289-020-03471-2 [Google Scholar] [CrossRef]
50. Kim, Y., Son, S., Chun, C., Kim, J. T., Lee, D. Y. et al. (2016). Effect of PEG addition on pore morphology and biocompatibility of PLLA scaffolds prepared by freeze drying. Biomedical Engineering Letters, 6(4), 287–295. https://doi.org/10.1007/s13534-016-0241-3 [Google Scholar] [CrossRef]
51. Tsuji, H., Ikada, Y. (1997). Blends of crystalline and amorphous poly(lactide). III. Hydrolysis of solution-cast blend films. Journal of Applied Polymer Science, 63(7), 855–863. https://doi.org/10.1002/(ISSN)1097-4628 [Google Scholar] [CrossRef]
52. Elsawy, M. A., Kim, K. H., Park, J. W., Deep, A. (2017). Hydrolytic degradation of polylactic acid (PLA) and its composites. Renewable and Sustainable Energy Reviews, 79, 1346–1352. https://doi.org/10.1016/j.rser.2017.05.143 [Google Scholar] [CrossRef]
Cite This Article
 Copyright © 2023 The Author(s). Published by Tech Science Press.
This work is licensed under a Creative Commons Attribution 4.0 International License , which permits unrestricted use, distribution, and reproduction in any medium, provided the original work is properly cited.
 Downloads
 Citation Tools