
 Submit a Paper
 Propose a Special lssue
 Open Access
ARTICLE

Investigation of the Thermal Decomposition Behavior of Oleuropein with Many Pharmacological Activities from Olive by Thermogravimetry
1 School of Business and Trade, Dongguan Polytechnic, Dongguan, 523808, China
2 School of Chemical Engineering and Energy Technology, Dongguan University of Technology, Dongguan, 523808, China
* Corresponding Author: Junling Tu. Email:
(This article belongs to the Special Issue: Renewable Biomass as a Platform for Preparing Green Chemistry)
Journal of Renewable Materials 2023, 11(8), 3371-3385. https://doi.org/10.32604/jrm.2023.028046
Received 28 November 2022; Accepted 30 January 2023; Issue published 26 June 2023
 View Full Text
 Download PDF
Abstract
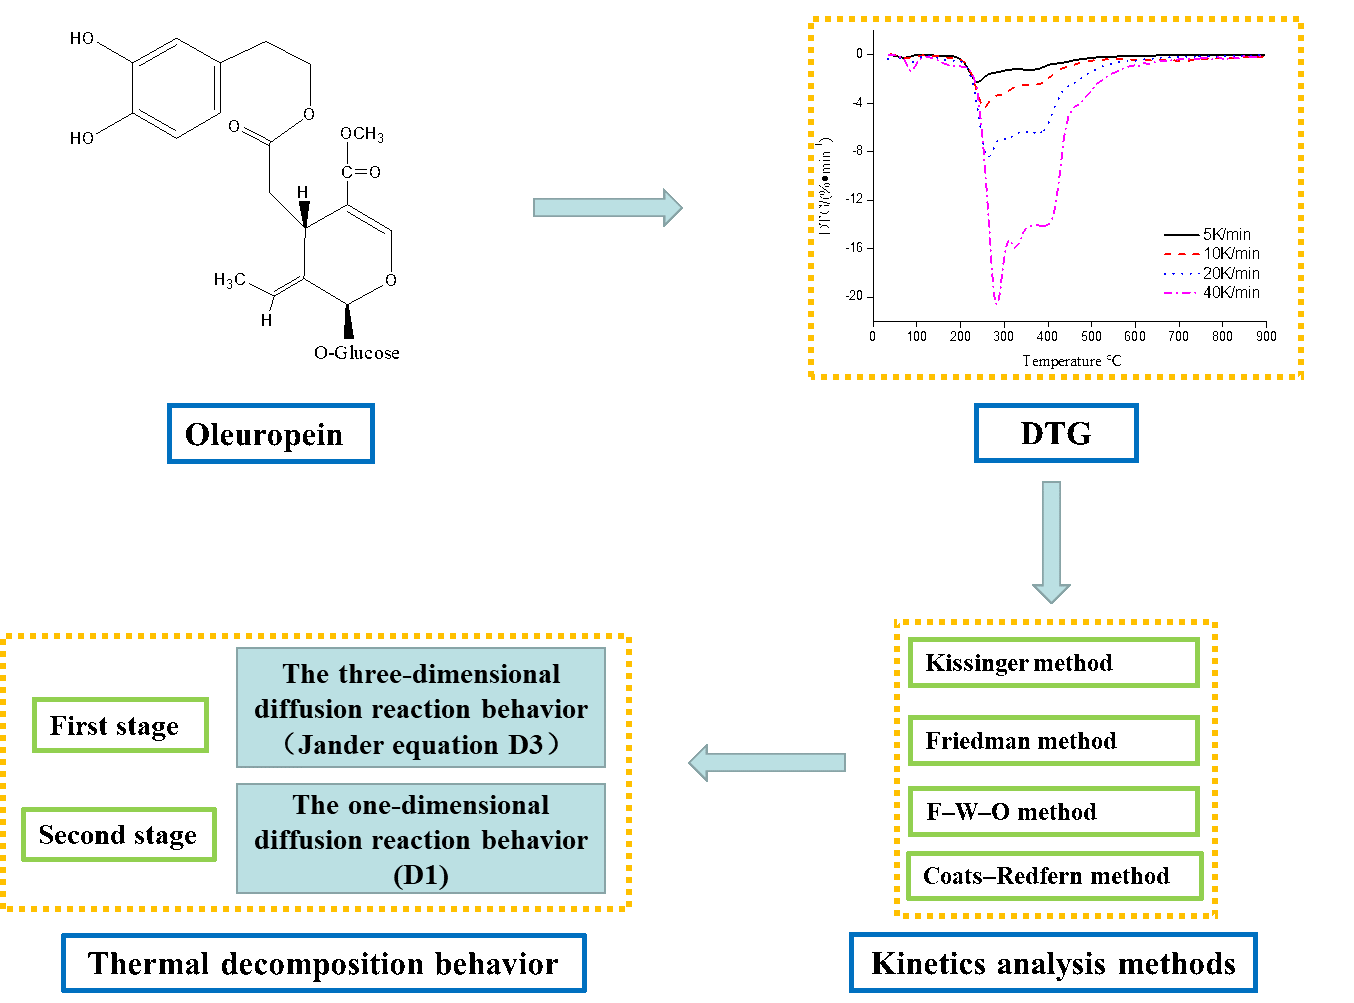
Due to the existence of poly-hydroxyl structures, the temperature may have an effect on the thermal stability of oleuropein for its applications. In the current study, the thermal decomposition process and kinetics behavior of oleuropein from the olive resource were researched by thermogravimetric theoretical analysis methods and non-isothermal kinetics simulation. The results of thermogravimetry analysis showed the whole thermal decomposition process of oleuropein involved two stages, with 21.22% of residue. It was also revealed that high heating rates of more than 20 K min−1 led to significant thermal hysteresis and inhibited the whole thermal decomposition behavior of oleuropein. Moreover, an investigation of the thermal decomposition kinetics indicated that the non-isothermal decomposition behavior followed a D3 model during the first stage (three-dimensional diffusion, Jander equation) and a D1 model in the second stage (one-dimensional diffusion). For the first and second thermal decomposition stages, the Kissinger, Friedman, Flynn-Wall-Ozawa, and Coats–Redfern four methods were applied to determine the activation energy (E = 143.72 and 247.01 kJ mol−1) and Arrhenius preexponential factor (ln A = 26.34 and 42.45 min−1), respectively. Therefore, the study will provide good theoretical guidance for thermal stability and thermal transformation application of oleuropein. It will be suitable for low-temperature applications in the cosmetic, food supplement and pharmaceutical industries.
Graphic Abstract
Keywords
Nomenclature
| dx/dt | A rate of conversion; |
| x | Conversion of the reaction, which is defined as x = (w0 –wt)/(w0 −wf), where w0 and wf stand for the initial and final masses of the sample at each stage of decomposition (mg), respectively, and wt stands for the mass of the sample at time t (mg); |
| f(x) | Differential mathematical model function of kinetics, which depends on the reaction type and behavior; |
| g(x) | Integral mathematical model function of kinetics, which depends on the reaction type and behavior; |
| k(T) | Temperature-dependent rate constant, which can be described by the Arrhenius equation; |
| A | Preexponential factor (min−1); |
| R | Gas constant 8.314 J mol−1 K−1; |
| E | Apparent activation energy (kJ mol−1); |
| T | Absolute temperature (K); |
| B | Heating rate (K min−1); |
| Tp | Absolute thermodynamic temperature at which the mass loss rate reaches to a maximum value (K). |
As a cooking oil, the widespread use of olive oil has relations with low rates of cardiovascular disease in Mediterranean countries. Due to its high levels of polyphenols, olive oil has presented cardiovascular disease-preventing function. Oleuropein and hydroxytyrosol are the most representative polyphenols. Oleuropein, which is a natural secoiridoid glycoside [1], is the primary active compound of olive resources [2] and the chemical structural formula is presented in Fig. 1. Owing to hydroxyl active functional groups in chemical structure, oleuropein exhibits a variety of pharmacological activities. Based on the angle of the structure–activity relationship, its main pharmacological activities are closely related to its hydroxyl and aglycone structures. Extensive research efforts in the fields of medicine, food industry, and cosmetics have recently unveiled new pharmacological activities and mechanisms of action of oleuropein, mainly including antitumor [3,4], antioxidation [5], antimicrobial [6], antibacterial [7,8], hypoglycemic [9], and antihypertension activities, and coronary heart disease and atherosclerosis prevention function [10], among other biological activities. Used in cosmetics, food supplements and pharmaceuticals, olive leaf extract contains 15% to 30% oleuropein generally.

Figure 1: The chemical structural formula of oleuropein
Temperature and other processing conditions of olive leaves, such as drying treatment, extraction process, and storage after extraction, are known to affect the oleuropein stability on account of its multiple hydroxyl groups. Malik et al. [11] found that the original oleuropein level was preserved during the natural drying process of fresh olive leaves at 25°C, whereas drying at 60°C reduced. The active component of the oleuropein aqueous extract remained relatively stable for 7 days at room temperature; however, the degradation rate accelerated after 17 days. In addition, Xie et al. [12] discussed the effects of the temperature factor on oleuropein stability, finding that the degradation rate of oleuropein increased gradually with time. After 27 days, the degradation rate of oleuropein was 95.24% at 25°C and 38.1% at 4°C. This degradation was found to be related to the β-glucosidase contained in oleuropein.
Considering the important factors affecting the thermal stability of oleuropein for its related applications, gaining a deeper understanding of the specific degradation mechanisms is very significant. At present, the thermal analysis method has emerged as a promising technology to study drug thermal stability characteristics and kinetics decomposition behavior [13,14]. Furthermore, as determined by theoretical experimental studies, decomposition kinetics characteristic factors analysis has attracted much attention [15–18], mainly emphasizing on predicting material lifetimes and describing the thermodynamic properties in practical applications. The dynamic change of material weight with temperature can be determined using thermogravimetry (TG), and decomposition behavior and kinetics characteristic parameters are examined by different heating rates. Thus, the thermal decomposition stability and kinetics process of oleuropein could be investigated. According to a previously reported TG analysis [12], the decomposition of oleuropein began at 232.3°C. However, the specific thermal decomposition behavior and kinetics process remained unexplored.
In this current study, the oleuropein thermal stability was investigated by the thermal analysis method that involved weight change with temperature and the decomposition process. The effect of different heating rates on the oleuropein degradation kinetics behavior was examined, and the kinetics reaction behavior was simulated, and the relevant characteristic parameters were obtained to evaluate the degradation process. The current study would provide a systematic method for the analysis of the decomposition behavior and kinetics mechanism of oleuropein, and a theoretical basis to unveil its stability, quality control, and thermal processing as a drug.
Oleuropein (standard substance, purity > 98%, molecular weight 540) was purchased from Sigma Chemicals (St Louis, MO, USA).
The thermogravimetric analyzer (NETZSCH TG 449C; Selb, Germany) was performed to investigate the oleuropein thermal stability, and the TG measurements were completed using about 10 mg sample in a nitrogen atmosphere of 313 to 1173 K (35 mL min−1) at different heating rates (5, 10, 20, and 40 K min−1). The kinetics decomposition behavior was studied by obtained data.
2.3 Kinetics Theoretical Analysis Methods of Thermal Decomposition
Eq. (1) is usually used to analyze the thermal decomposition kinetics theory.
where k(T) is rate constant, which is dependent only on the temperature, and it is usually calculated by the Arrhenius Eq. (2) as follows:
where E is the activation energy and A is the Arrhenius preexponential factor.
When the heating rate (β) is dT/dt under non-isothermal condition, the mathematical expression of the thermal decomposition kinetics parameters can be expressed by Eq. (3) with substituting Eqs. (1) into (2) [19], and the corresponding kinetics parameters can be obtained on the basis of the TG result.
By integrating the above equation, it is expressed by Eq. (4):
and when
The mathematical theoretical expression of Kissinger method [20] is described as follows by Eq. (6):
By fitting (Tp2/β) against 1/Tp, two constants of the slope (E/R) and intercept ln (E/AR) of the line can be obtained. Then, E and A can be calculated according to the binary first-order equation.
The mathematical theoretical expression of the Flynn-Wall-Ozawa (F-W-O) method is expressed as follows by Eq. (7) [21]:
When the conversion rate (x) value is fixed, the value of ln (AE/R g(x)) can be regarded as a constant, and there is a linear relationship between ln β and 1/T. Thus, with a given conversion rate, E can be calculated by the slope (−1.052 E/R) of the line between ln β and 1/T.
The mathematical theoretical expression of the Friedman method [22] is represented as follows by Eq. (8):
By plotting ln(dx/dt) against 1/T, the slope (−E/R) of line is obtained, and E can be calculated.
2.4 The Most Probable Kinetics Reaction Behavior Model
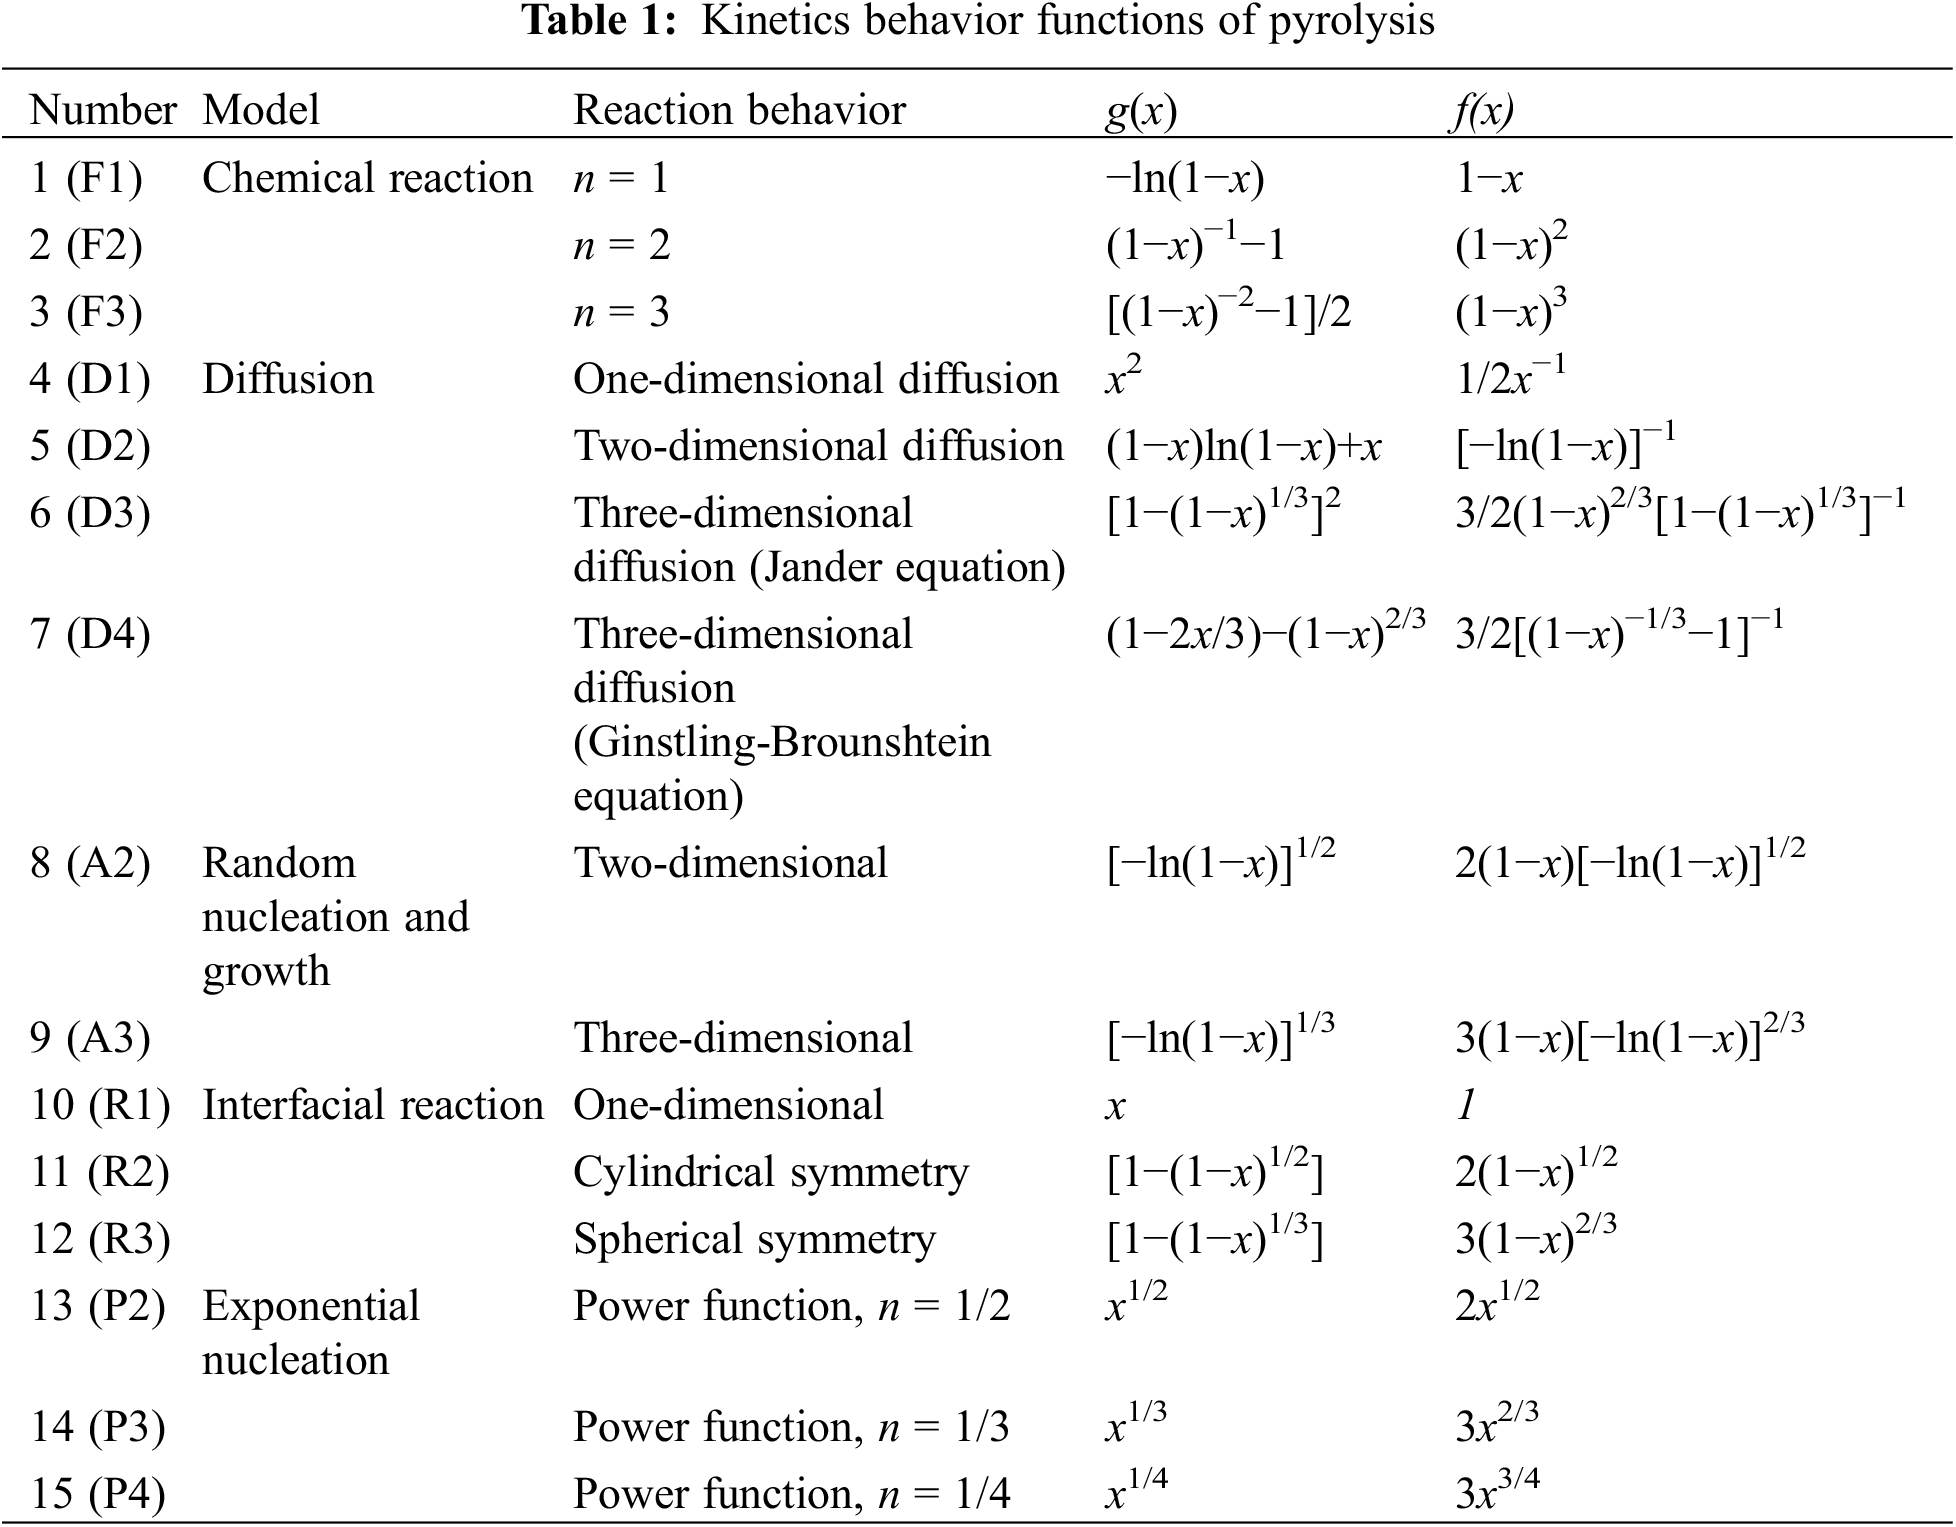
In the study for a thermal decomposition behavior, choosing the probable kinetics reaction behavior model is important to reduce the difference between the mathematical models of theoretical kinetics reaction behavior and the actual kinetics reaction behavior. In order to select the most possible mathematical model of oleuropein dynamic behavior, the specific method is to combine the above four methods. Firstly, the integral forms of the 15 theoretical dynamic kinetics behavior functions [23] are respectively substituted into Eq. (9) (seen in Table 1), and the Coats-Redfern function is used to calculate the corresponding E value. Then, the range of E values closest to those calculated by Kissinger, F-W-O and Friedman methods is selected, and the corresponding theoretical mathematical model and reaction behavior is considered as the most possible kinetics behavior analysis of oleuropein.
The mathematical theoretical expression of the Coats-Redfern method [24] is represented as follows by Eq. (9):
The integral expressions g(x) of different reaction models are respectively substituted into Eq. (9), and two constants of the slope (−E/R) and intercept (ln (AR/βE)) of the fitting line are obtained by fitting ln[g(x)/T2] and 1/T. Thus, according to the two equations, E and ln A of corresponding models are calculated.
The A is largely related only to the reactant (oleuropein) properties, not to the temperature parameters. Therefore, the calculation of A value is very important to determine the kinetics characteristic of oleuropein. Since E and ln A exist compensation effect, ln A is calculated usually by Eq. (10):
Firstly, the slope (a) and intercept (b) of the fitting line are obtained by fitting E and ln A under different β according to the data of the most suitable kinetics degradation reaction model. Then, the average E is substituted into Eq. (10) to calculate ln A.
3.1 Thermal Stability of Oleuropein
The thermogravimetry and differential thermogravimetry (TG/DTG) results for the oleuropein thermal decomposition were presented at 5, 10, 20, and 40 K min−1 heating rates in Figs. 2 and 3. As shown in Figs. 2, 3 and Table 2, the thermal decomposition process of oleuropein was comprised of two stages based on the data of 10 K min−1 heating rate. From Fig. 2 we can see that oleuropein was stable with little mass loss below 230.7°C, however, it started to decompose severely above this temperature. This result agreed with that reported by Xie et al. [12]. At approximately 339.2°C, the first stage of oleuropein decomposition was almost finished with 59.18% of residue. The second stage occurred from 339.2°C to 504.7°C, with 21.22% of residue. From Fig. 3 we can conclude that the first peak of the DTG curve appeared at 254.2°C with −4.36% min−1 maximum loss ratio. Furthermore, the second peak of the DTG curve and the maximum loss were 368.5°C and −3.27% min−1, respectively.

Figure 2: TG curve of oleuropein at different heating rates
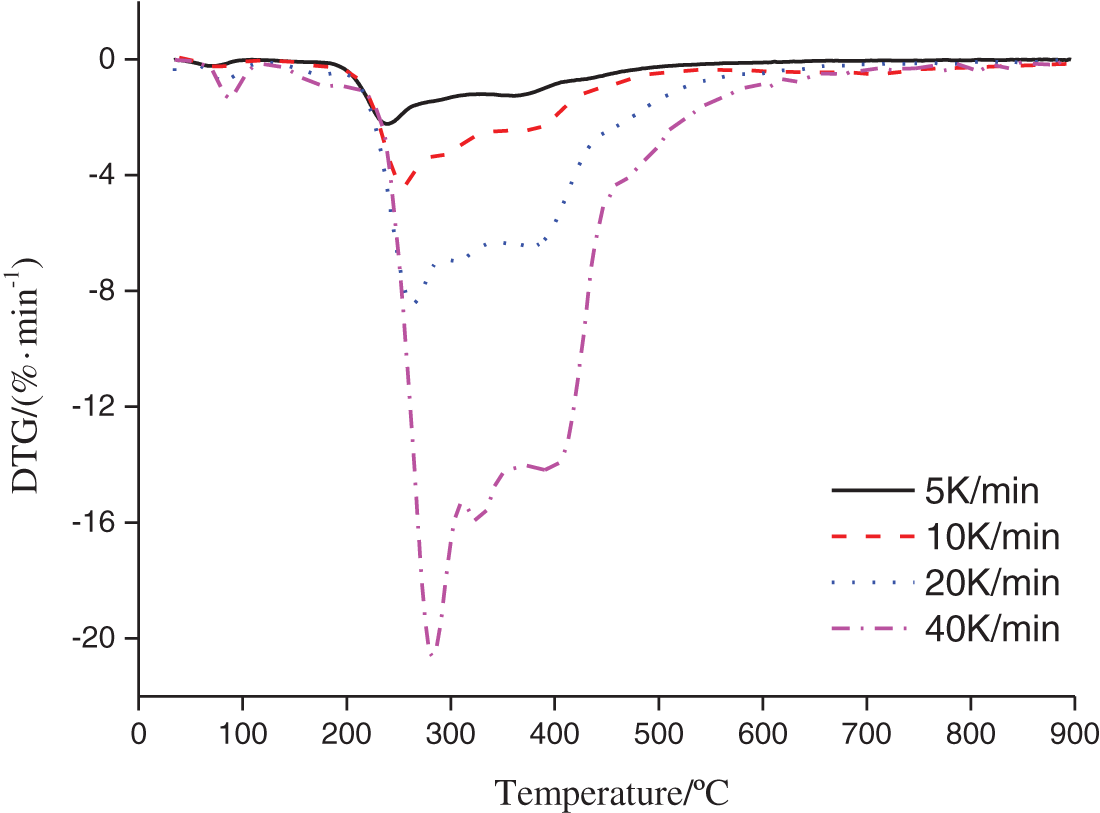
Figure 3: DTG curve of oleuropein at different heating rates
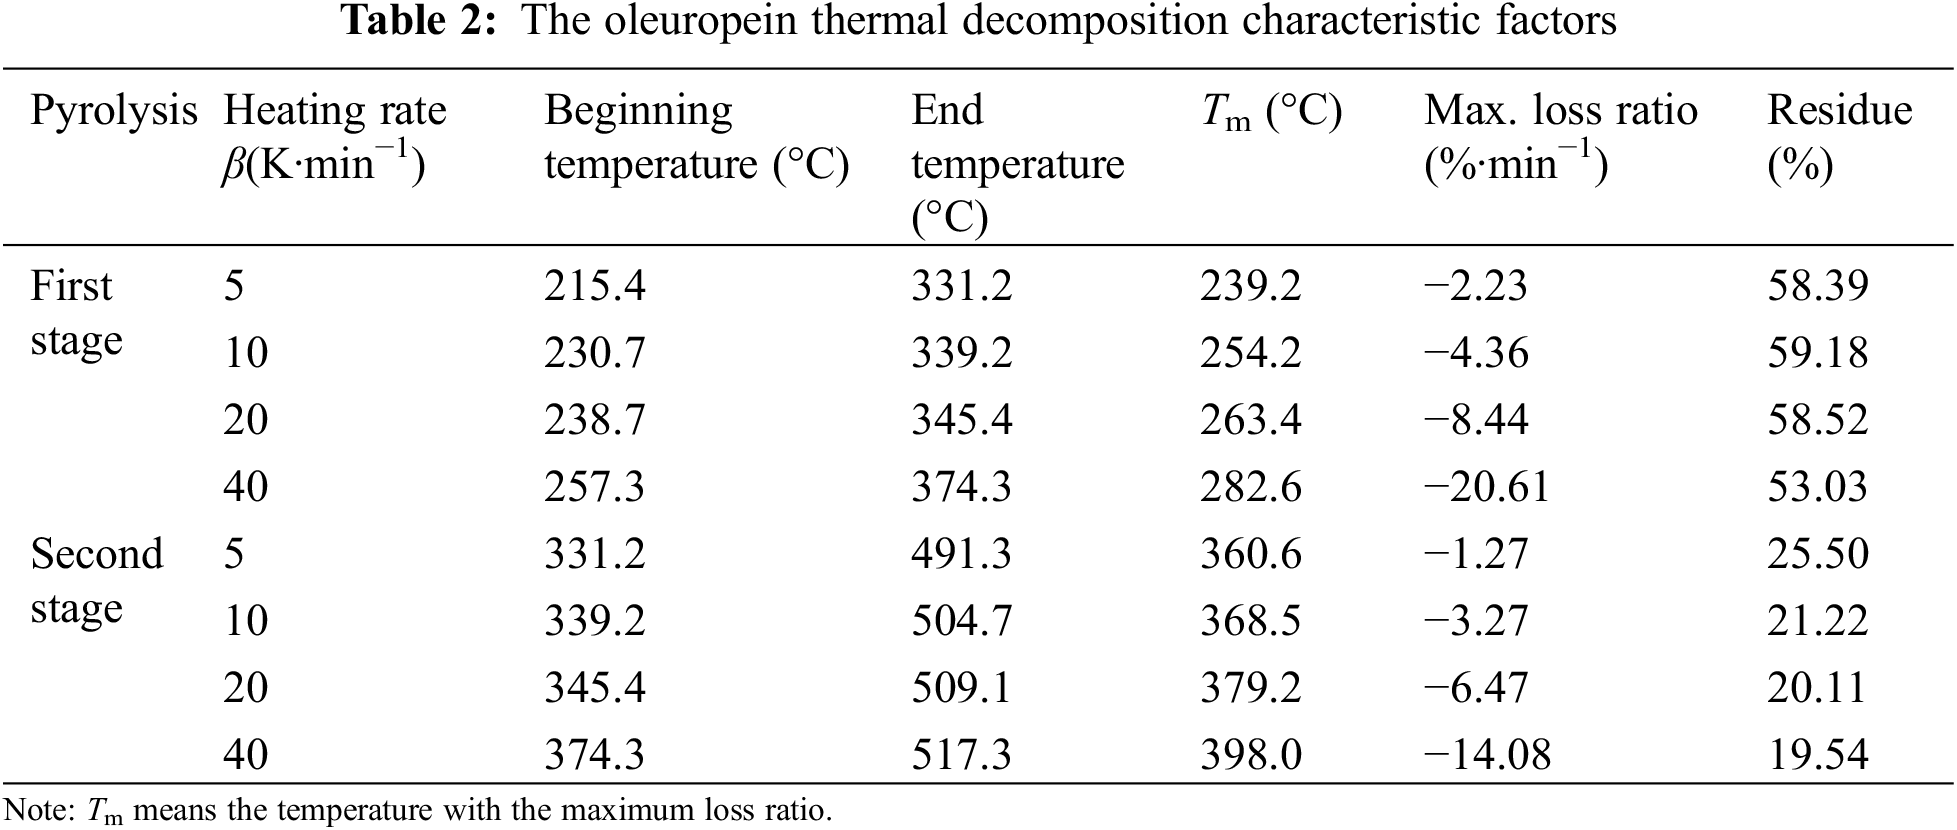
Furthermore, the TG and DTG curves were presented basically at the same tendency with different heating rates of the oleuropein thermal decomposition. With the increase of heating rate, the thermal hysteresis phenomenon became more and more obvious, and the beginning and end decomposition temperature also increased, and the temperature peak corresponding to the maximum weight loss rate also shifted to a higher temperature region. This tendency was reported to agree with previous research [25]. Especially in the DTG curve, the temperature with the maximum loss ratio moved obviously to the right, which meant that the pyrolysis temperature required would be higher under the condition of the same weight loss rate. From a kinetics point of view, the thermal decomposition behavior had no connection with the heating rate, and it just depended on the temperature [26]. Too high heating rates would lead to an incomplete spectrum of part intermediate products, which had not enough time to separate each other. The effects of heating rates on thermal decomposition were mainly as follows: (1) With the heating rate increased, the time to obtain pyrolysis temperature was shortened, but the stopping time of volatiles was insufficient. In order to achieve full thermal decomposition, a higher temperature was needed. (2) Too high a heating rate would lead to the increase of temperature ladder inside and outside the raw material particles, and reduce the heat transfer efficiency of the thermal decomposition process. However, the heating rate was too low, which would lead to spectral discontinuity of the separated products and even serious trailing phenomenon. By fitting the data of Tm and β [27], the equations were obtained as follows: Tm = 1.1426β + 511.58 (R2 = 0.9493) for the first stage and Tm = 1.0419β + 630.19 (R2 = 0.9923) for the second stage, which showed that Tm were both closely related to β with a good positive correlation.
3.2 Non-Isothermal Kinetics Analysis of Oleuropein
The oleuropein non-isothermal thermal decomposition kinetics was calculated by the Kissinger, Friedman, F-W-O, and Coats–Redfern four theoretical analysis methods.
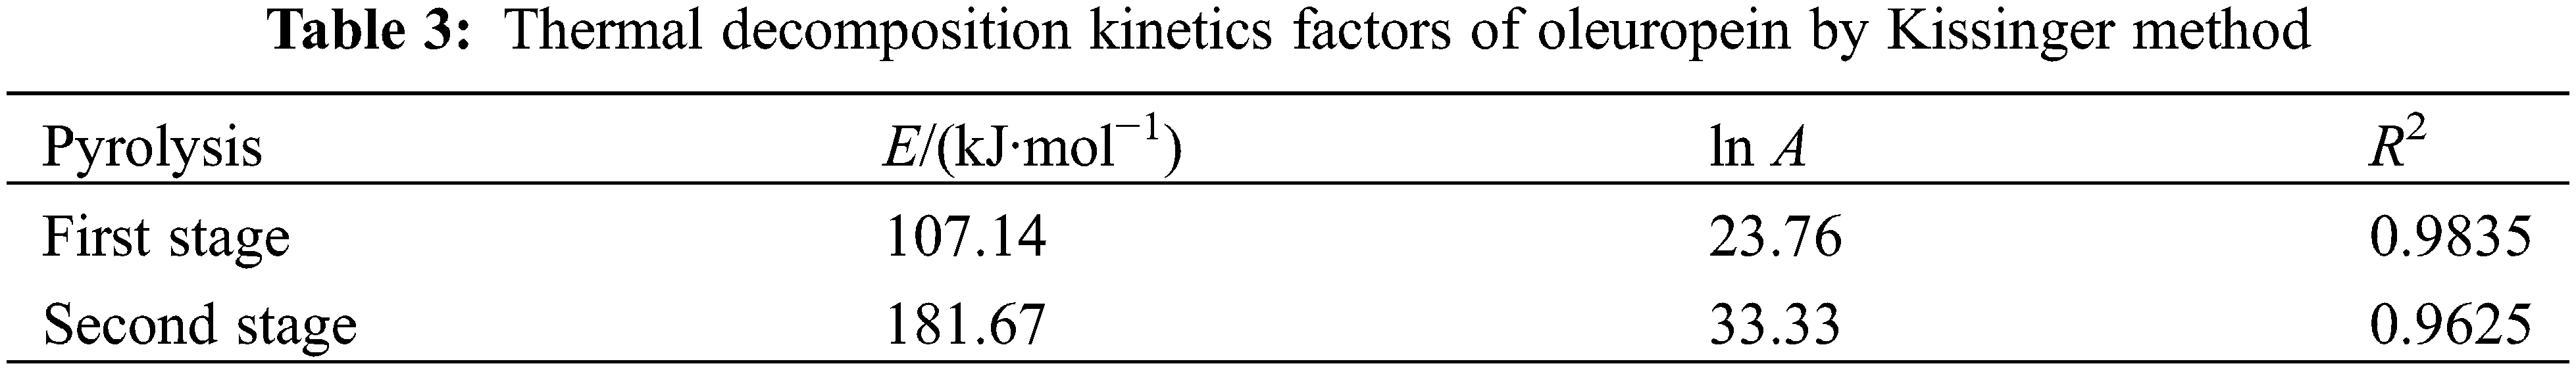
The kinetic factors of oleuropein thermal decomposition, calculated by Kissinger method, were presented in Table 3. According to Eq. (6), E and ln A of the first stage pyrolysis were 107.14 kJ mol−1 and 23.76 min−1, respectively, and the linear correlation coefficient (R2) was 0.9835. Furthermore, those of the second stage pyrolysis were 181.67 kJ mol−1 and 33.33 min−1, with R2 value of 0.9625. According to the obtained E values, the first stage of oleuropein decomposition was more favored than the second stage.
3.2.2 Flynn-Wall-Ozawa Method and Friedman Method
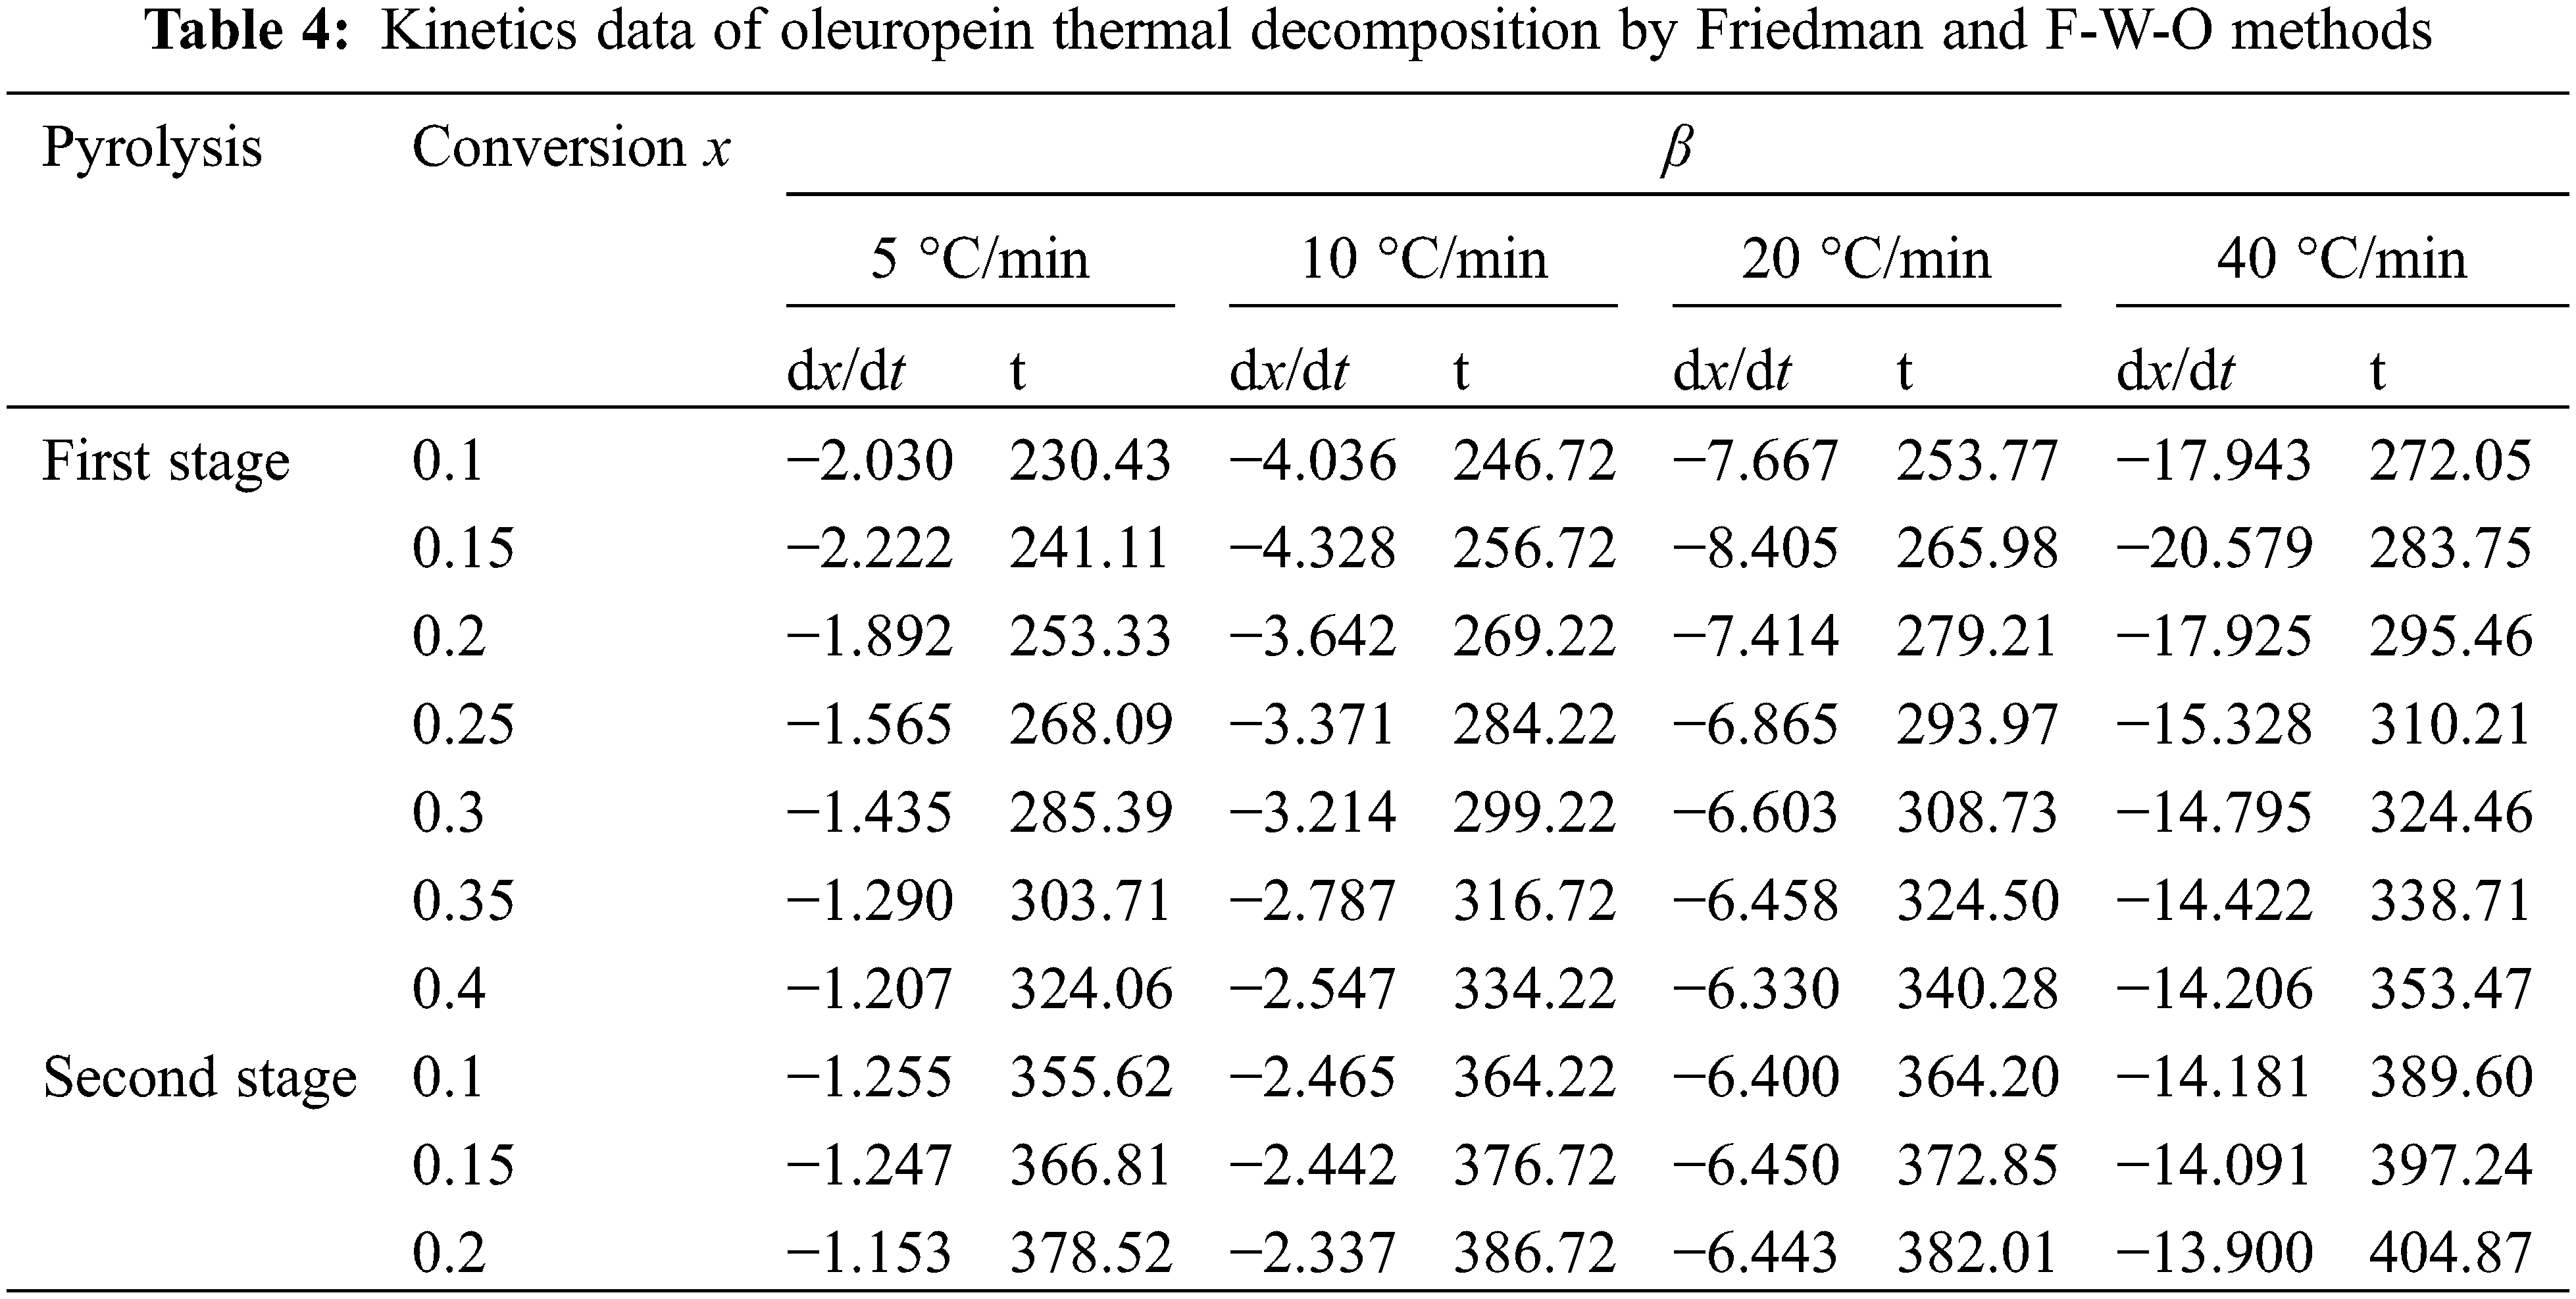
Based on the Friedman and F-W-O methods, Es were obtained by Eqs. (6) and (7), and the corresponding kinetics decomposition data were presented in Tables 4 and 5. It was found that good R2 values were obtained in all cases, and the E value increased with the conversion ratio from the kinetics data, which suggested that oleuropein decomposition was more difficult. As the conversion rate increased, the reaction activities of the products were more sensitive to temperature. The initial activation energy was lower, mainly because there were a large number of weak bonds (hydroxyl, hydrocarbon chain or carboxyl groups) in oleuropein during the initial pyrolysis, which were prone to fracture. With the increase in conversion rate, it was mainly the thermal decomposition of the benzene ring or glycosidic bond, in which the fracture of strong bonds needed more energy consumption, manifested by higher activation energy. Therefore, the E mean values were needed to calculate, and were 168.98 and 142.30 kJ mol−1 in the first stage and 299.06 and 236.38 kJ mol−1 in the second stage using Friedman and F-W-O methods, respectively.
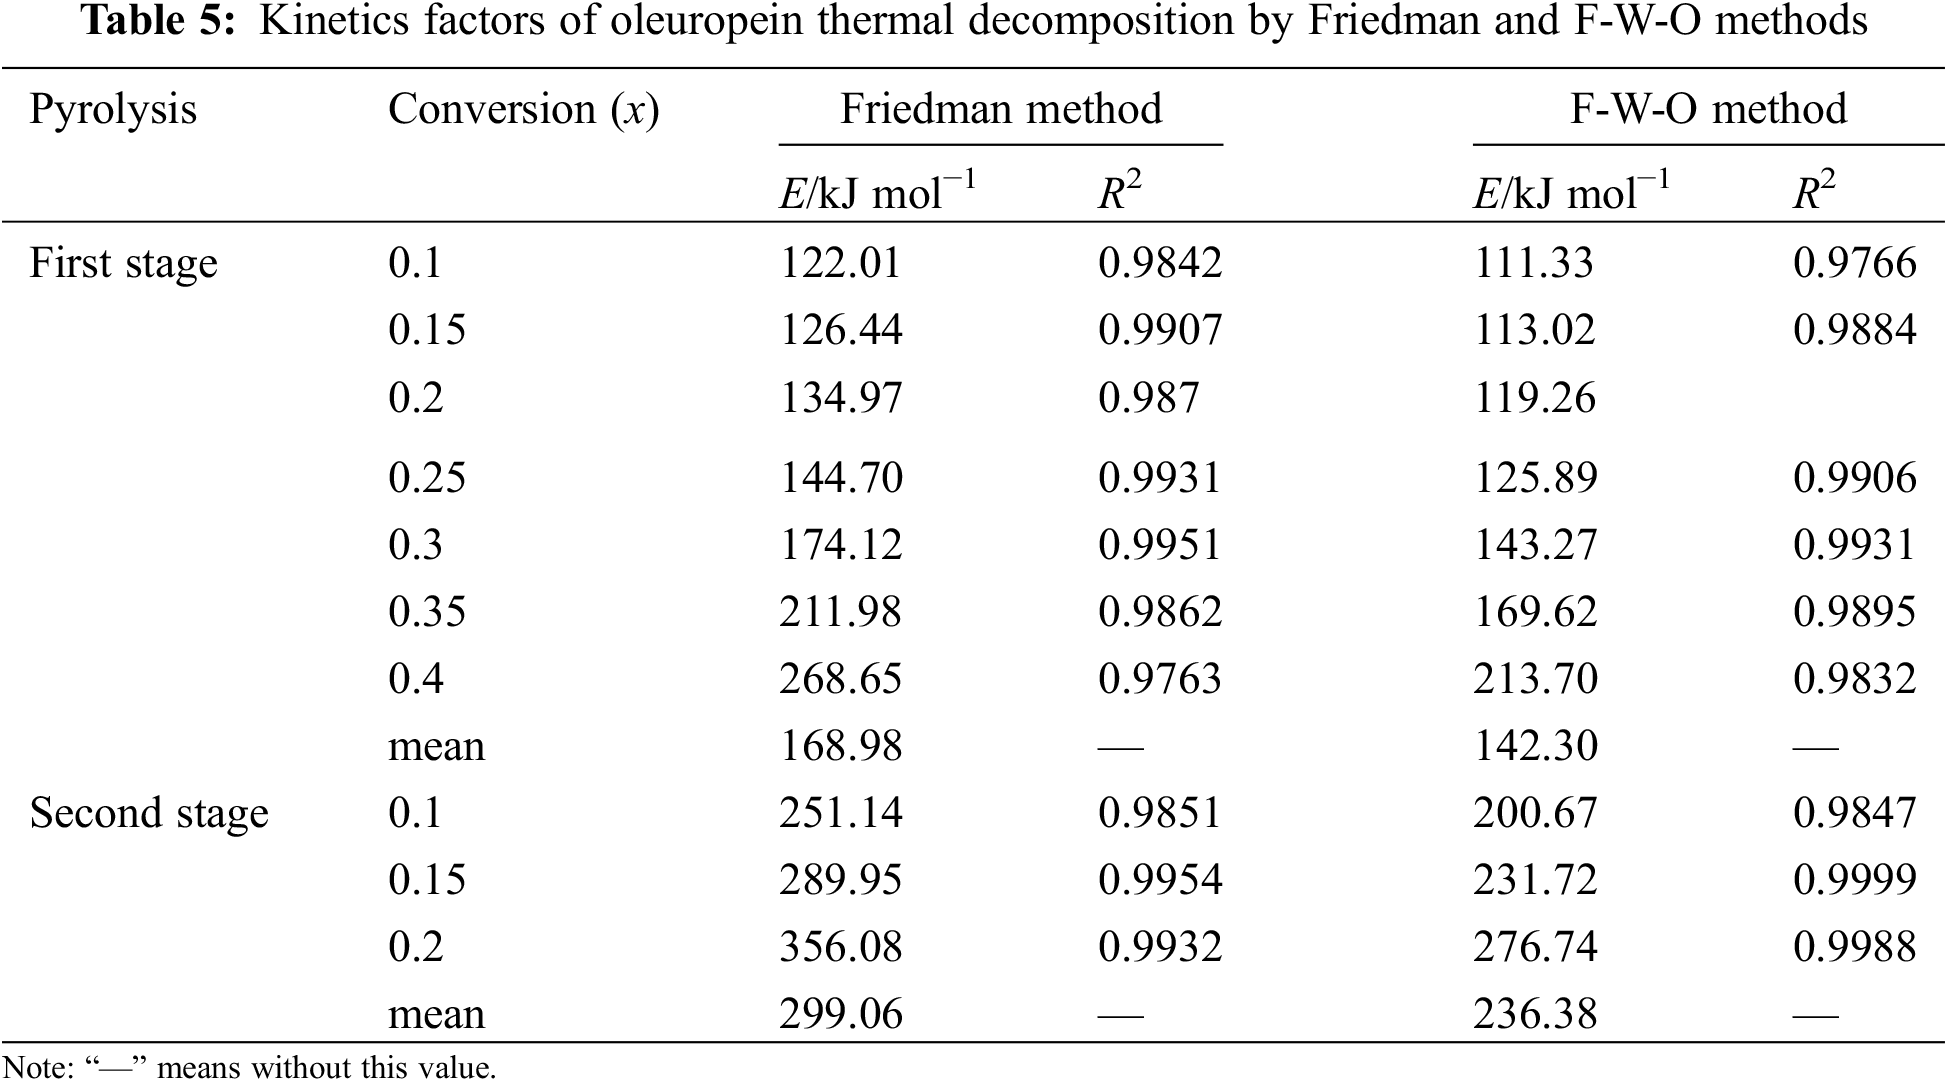
The average E values for the first and second stages obtained by the Friedman method were a litter higher than those obtained by the F-W-O method in Table 5. Furthermore, combined Table 3, it was shown that the Kissinger method was the lowest value among the three methods. The significant difference was due to the fact that the equation of the Kissinger method assumed that the kinetic factors of temperature and E were independent of the conversion degree [28,29]. In conclusion, it could be concluded that the E calculation results of these three methods, with oleuropein thermal decomposition in the first and second stages, were in the range of 107.14–168.98 and 181.67–299.06 kJ mol−1, respectively.
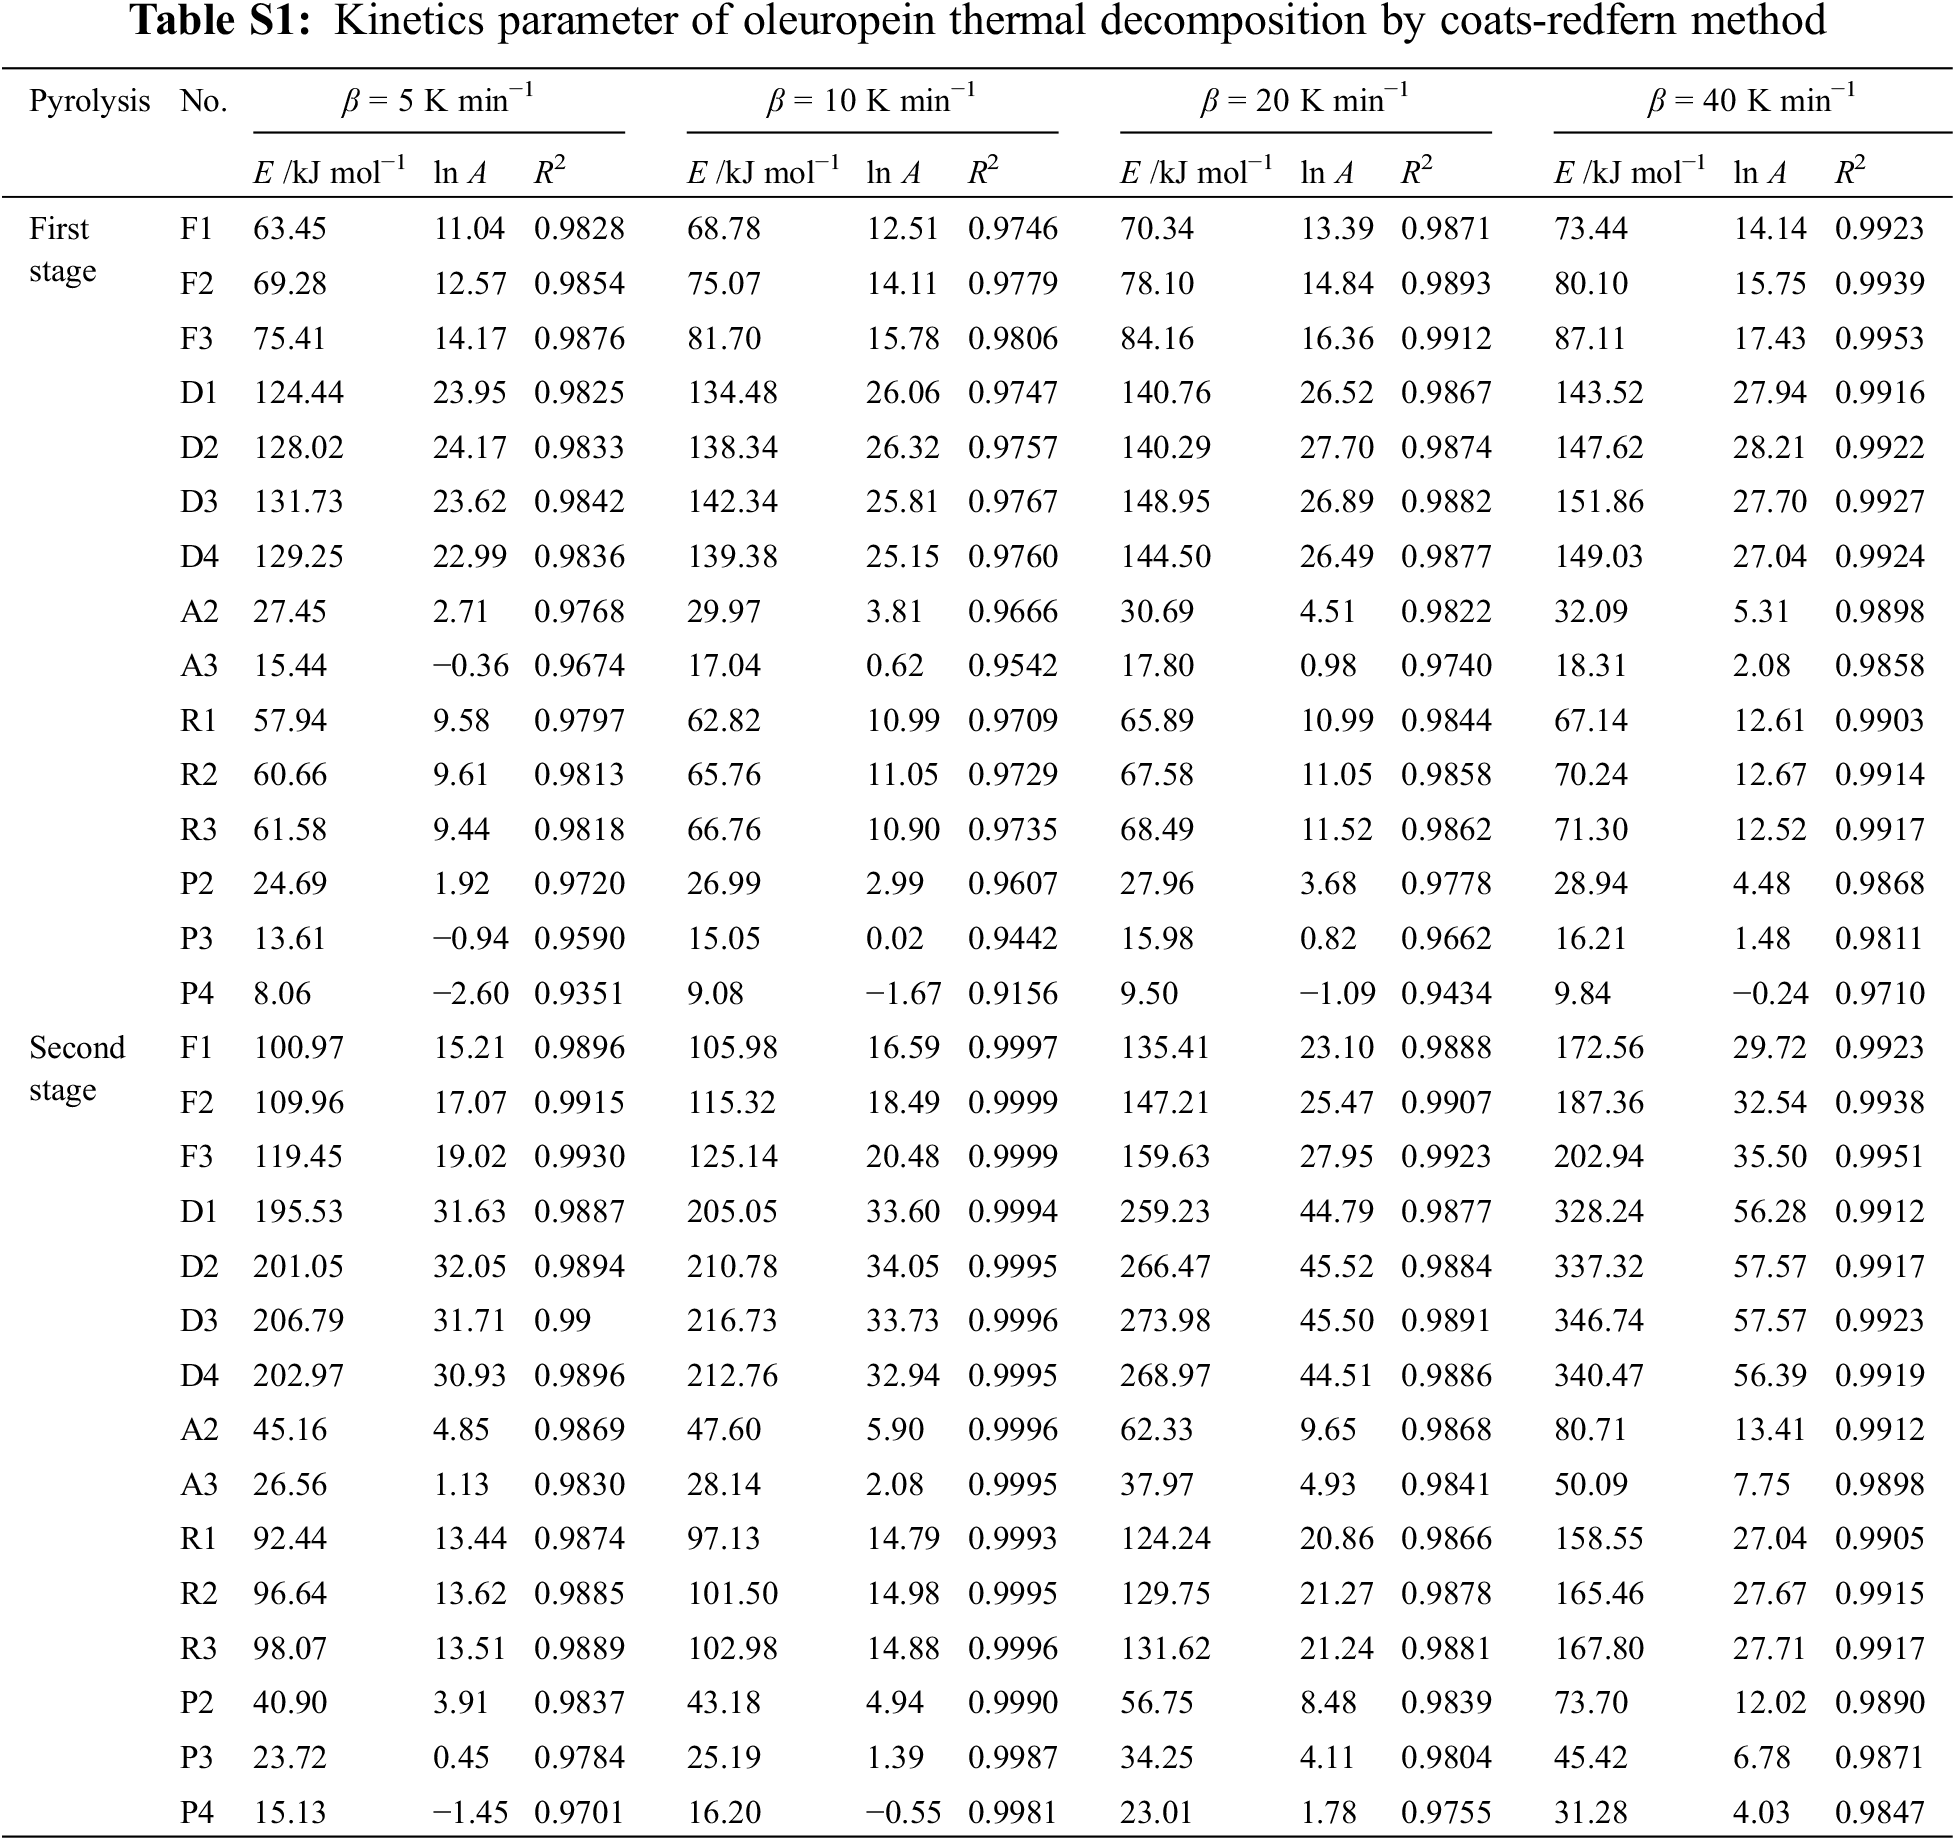
In Table S1, the main kinetics factors of oleuropein thermal decomposition by the Coats–Redfern method were presented with the heating rates (5–40 K min−1), and it was concluded that E values increased with 5–40 K min−1, because more energy was required to decompose oleuropein at higher heating rates. Moreover, except for the P3 and P4 models, the fitting results of 13 models had good linear correlation, and E and ln A all showed clear differences. Therefore, a good linear dependence was not sufficient to select the most appropriate reaction model. The current study combined the Kissinger method, Friedman method, F-W-O method, and Coats-Redfern method, the four methods were used to screen and verify the E value and the most suitable kinetics degradation reaction model for the thermal decomposition process of oleuropein [30].
The E values, obtained using the above-mentioned three methods for the first stage, ranged between 107.14 and 168.98 kJ mol−1. Considering the linear dependence of the fitting results, D3 was the best model, which afforded E values of 131.73–151.86 kJ mol−1. In consequence, the diffusion model and three-dimensional diffusion Jander equation reaction behavior (D3) could describe exactly the first stage of oleuropein thermal decomposition. The integral function for the reaction model was g(x) =
As shown in Fig. 4, ln A = 0.20E − 2.4 was obtained by fitting the data calculated from the D3 model, and it was used to resolve the kinetics compensation effect for the first stage of oleuropein pyrolysis. Firstly, corresponding E0 was calculated as the mean of E with different heating rates in model D3, and was obtained for 143.72 kJ mol−1. Secondly, ln A was 26.34 min−1 through E0 based on the above-mentioned compensation effect fitting the linear equation. Finally, The differential form f(x) =
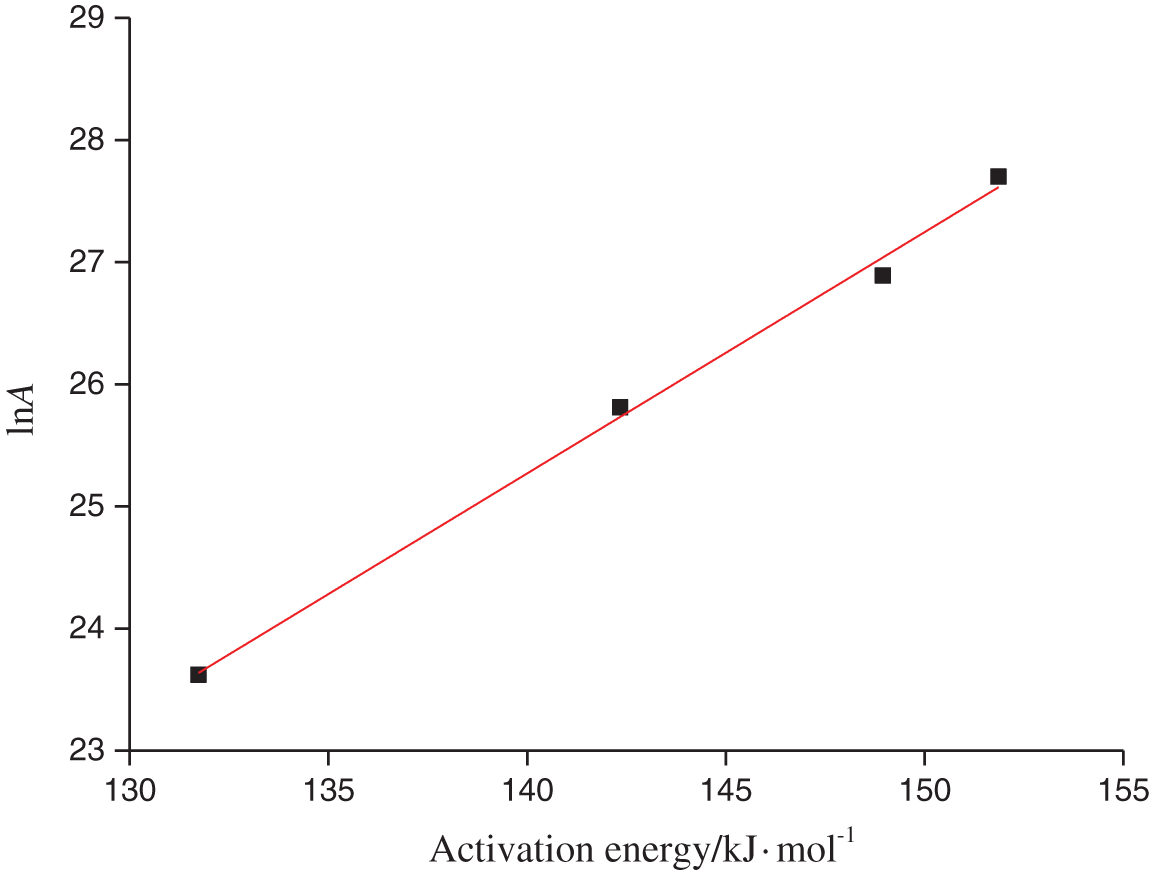
Figure 4: Kinetics compensation effect of the first stage of oleuropein pyrolysis by different heating rates
In the second stage of oleuropein pyrolysis, the kinetics characteristic factors, which were summarized in Table S1, were calculated by the Coats–Redfern method. The above-mentioned three methods afforded a range of E values for the second stage of 181.67–299.06 kJ mol−1, and model D1 was the closest with the range of E (195.53–328.24 kJ mol−1). Therefore, the one-dimensional diffusion reaction behavior (D1 model) could describe exactly the second stage of the oleuropein thermal decomposition process. The integral function for the reaction model was g(x) = x2, and the differential function was f(x) = 1/2x−1.
By fitting the data of E and ln A calculated from the D1 model, ln A = 0.19E − 4.48 was obtained. For the second stage of oleuropein pyrolysis, the kinetics compensation effect at different heating rates was presented in Fig. 5. Then, according to the E calculated by model D1 at different heating rates, the mean E0 value was 247.01 kJ mol−1, and ln A was calculated to 42.45 min−1 by the above-mentioned fitting linear equation. Finally, the kinetics function was obtained by substituting f(x) = 1/(2x), E0, and A into Eq. (3), and the final equation for the second stage of oleuropein thermal decomposition was expressed as follows:

Figure 5: Kinetics compensation effect of the second stage of oleuropein pyrolysis by different heating rates
3.2.5 Proposed Mechanism of Oleuropein Thermal Decomposition
From the TG/DTG results for the oleuropein thermal decomposition (the rate was 10 K/min), we could see that oleuropein was degraded from 230.7°C to 339.2°C firstly, with 59.18% of residue. The second stage occurred at 339.2°C, and was almost finished with 21.22% of residue at approximately 504.7°C. Due to multiple hydroxy groups, it produced water at the beginning. According to the oleuropein acidic and enzymatic hydrolysis processes and products, the main chemical bond ruptures existed at the ester bond and glycosidic bond in the chemical structure, presented in Fig. 6.

Figure 6: Oleuropein thermal decomposition
From the reference [25], we could conclude that the main decomposition process of hydroxytyrosol started at 262.8°C, and ended at 409.7°C. A solid residue of 2.68% was observed, and the final products were CO2, water, and 2.68% solid char. According to the TG diagram of hydroxytyrosol pyrolysis, the residual weight was about 13% at 339.2°C. As reported in reference [31], the glucose was decomposed from 190°C, and the weight loss rate gradually decreased from about 379°C until the end of the pyrolysis process. At the end of the 600°C pyrolysis reaction, the total weight loss of the sample was 85% of the initial weight. The primary products of glucose pyrolysis were water, furfural, CO2 and other products. According to the TG diagram of glucose pyrolysis, the residual weight was about 34% at 339.2°C. Therefore, at the end temperature of the first stage of oleuropein decomposition (339.2°C), the weights of volatile substances were calculated by hydroxytyrosol molecular weight multiply (1%–13%) and glucose molecular weight multiply (1%–34%), and the result (253) was close to oleuropein experimental value (221). Moreover, at the end temperature of the second stage of oleuropein decomposition (504.7°C), the hydroxytyrosol had 2.68% residue and glucose had 18% residue. In the experimental result, the second stage of oleuropein was with 21.22% of residue, and it could be inferred that elenolic acid was nearly decomposed completely in this stage. So, oleuropein was firstly decomposed for hydroxytyrosol, elenolic acid and glucose, and these substances were further degraded. In summary, the pyrolysis products of oleuropein mainly consisted of solid char, water, CO2 and furfural, according to pyrolysis products of hydroxytyrosol and glucose.
The thermal decomposition stability and kinetics behavior of oleuropein from olive plants were studied by TG analysis and non-isothermal theoretical method. The TG-DTG results revealed that oleuropein decomposition consisted of two stages, the first of which started at 230.7°C and the second at 339.2°C. The oleuropein decomposition process of the first stage followed a non-isothermal kinetics behavior described with a D3 model (three-dimensional diffusion, Jander equation), and the second stage with a D1 model (one-dimensional diffusion). In addition, by combining the abovementioned four methods, E and ln A were both calculated. It was inferred that the pyrolysis products of oleuropein mainly consisted of solid char, water, CO2 and furfural. Therefore, this present research would provide new theoretical information on the thermal decomposition behavior of oleuropein, and suggests its suitability for low-temperature applications in cosmetic, food supplement and pharmaceutical industries.
Funding Statement: This work was funded by Guangdong Basic and Applied Basic Research Foundation (No. 2019A1515111159), Characteristic Innovative Projects for Education Department of Guangdong Province 2021 Year (No. 2021KTSCX302).
Conflicts of Interest: The authors declared that they had no conflicts of interest to report regarding the present study.
References
1. Zhang, Y. G., Zhang, X. J., Xin, E. D. et al. (2019). Research statue on pharmacological action of Oleuropein. The Chinese Journal of Clinical Pharmacology, 35(24), 3265–3268. [Google Scholar]
2. Wang, H., Li, M. S., Zhu, L. Y., Zhou, L. P. (2018). Research progress on the oleuropein-a natural antioxidants from Oleaceae. Northern Horticulture, 42(5), 170–177. [Google Scholar]
3. Kimura, Y., Wu, N. (2019). Olive leaf extract and its main component oleuropein prevent chronic ultraviolet B radiation-induced skin damage and carcinogenesis in hairless mice. Journal of Nutrition, 139(11), 2079–2086. [Google Scholar]
4. Sherif, I. O., Al-Gayyar, M. M. H. (2018). Oleuropein potentiates anti-tumor activity of cisplatin against HepG2 through affecting proNGF/NGF balance. Life Sciences, 198, 87–93. [Google Scholar] [PubMed]
5. Wang, B., Shen, S., Qu, J., Xu, Z., Feng, S. et al. (2021). Optimizing total phenolic and oleuropein of Chinese olive (Olea europaea) leaves for enhancement of the phenols content and antioxidant activity. Agronomy, 11(4), 686. https://doi.org/10.3390/agronomy11040686 [Google Scholar] [CrossRef]
6. Topuz, S., Bayram, M. (2021). Oleuropein extraction from leaves of three olive varieties (Olea europaea L.Antioxidant and antimicrobial properties of purified oleuropein and oleuropein extracts. Journal of Food Processing and Preservation, 46(6), e15697. [Google Scholar]
7. Yuan, J. J., Tu, J. L., Qin, F. G., Xu, Y. J., Li, B. (2018). Phenolic composition of oleuropein extract after enzymatic process by HPLC-MS and their antioxidant and antibacterial activities. Journal of Food Biochemistry, 42(3), e12517. https://doi.org/10.1111/jfbc.12517 [Google Scholar] [CrossRef]
8. Munekata, P. E., Nieto, G., Pateiro, M., Lorenzo, J. M. (2020). Phenolic compounds obtained from Olea europaea by-products and their use to improve the quality and shelf life of meat and meat products–A review. Antioxidants, 9(11), 1061. https://doi.org/10.3390/antiox9111061 [Google Scholar] [PubMed] [CrossRef]
9. Mohamed, N. A., Abdou, H. M., Marzouk, M. M. (2018). Antidiabetic and immunomodulatory effects of oleuropein and vitamin C in diabetic male rats. Journal of Advances in Biology, 11, 2250–2268. [Google Scholar]
10. Menezes, R. C. R., Peres, K. K., Costa-Valle, M. T., Faccioli, L. S., Dallegrave, E. et al. (2022). Oral administration of oleuropein and olive leaf extract has cardioprotective effects in rodents: A systematic review. Revista Portuguesa de Cardiologia, 41(2), 167–175. [Google Scholar] [PubMed]
11. Malik, N. S. A., Bradford, J. M. (2008). Recovery and stability of oleuropein and other phenolic compounds during extraction and processing of olive (Olea europaeaL.) leaves. Journal of Food Agriculture and Environment, 6(2), 1–8. [Google Scholar]
12. Xie, P. J., Huang, L. X., Zhang, C. H. (2013). Stability of oleuropein in olive leaves extracts and its chelating action to ferrous ions. Science and Technology of Food Industry, 4, 133–136. [Google Scholar]
13. Ma, Y. Y., Chen, J. H., Wang, H. X., Chen, Q., Zhang, M. (2019). Stability and degradation kinetics of anthocyanins from Dendrobium officinale. Science and Technology of Food Industry, 40(16), 50–57. [Google Scholar]
14. Campostrini, R., Grigiante, M., Brighenti, M. (2021). Potentialities of mass spectrometry on activation energy and secondary reactions determination of calcium oxalate thermal decomposition. International Journal of Chemical Kinetics, 53(10), 1082–1100. [Google Scholar]
15. Pan, Y., Liang, Y., Ma, R., Ruan, L., Wang, S. L. (2021). Stability and degradation kinetics of anthocyanins from red cabbage. Science and Technology of Food Industry, 42(5), 51–59. [Google Scholar]
16. Bao, Y. H., Cao, W. H., Fu, Q., Zhang, H. T., Lu, W. H. et al. (2020). Antimicrobial activity and thermal degradation kinetics of total alkaloids from Berberis poireti. Modern Food Science and Technology, 36(3), 39. [Google Scholar]
17. Barbosa, H. F., Francisco, D. S., Ferreira, A. P., Cavalheiro, É. T. (2019). A new look towards the thermal decomposition of chitins and chitosans with different degrees of deacetylation by coupled TG-FTIR. Carbohydrate Polymers, 225, 115232. [Google Scholar] [PubMed]
18. Wang, Z. H., Wang, C. Z., Peng, M. (2019). Thermal decomposition kinetics of raw and treated olive waste. Thermal Science, 23(6A), 3501–3512. [Google Scholar]
19. Lu, C. W., Xi, T. G. (2002). Thermal analysis mass spectrometry. Shanghai, China: Shanghai Science and Technology Literature Press. [Google Scholar]
20. Rotaru, A., Moanţă, A., Rotaru, P., Segal, E. (2009). Thermal decomposition kinetics of some aromatic azomonoethers. Journal of Thermal Analysis and Calorimetry, 92, 233–238. [Google Scholar]
21. Venkatesh, M., Ravi, P., Tewari, S. P. (2013). Isoconversional kinetic analysis of decomposition of nitroimidazoles: Friedman method vs. Flynn-Wall-Ozawa method. Journal of Physical Chemistry A, 117(40), 10162–10169. [Google Scholar] [PubMed]
22. Corradini, E., Teixeira, E. M., Paladin, P. D., Agnelli, J. A., Silva, O. R. R. F. et al. (2009). Thermal stability and degradation kinetic study of white and colored cotton fibers by thermogravimetric analysis. Journal of Thermal Analysis and Calorimetry, 97(2), 415–419. https://doi.org/10.1007/s10973-008-9693-8 [Google Scholar] [CrossRef]
23. Hao, Y. R. (2012). Study on pyrolysis kinetic of biomass residue (Master Thesis). Nanjing University of Science and Technology, Nanjing, China. [Google Scholar]
24. Naqvi, S. R., Uemura, Y., Osman, N., Yusup, S. (2015). Kinetic study of the catalytic pyrolysis of paddy husk by use of thermogravimetric data and the Coats-Redfern model. Research on Chemical Intermediates, 41(12), 1–13. https://doi.org/10.1007/s11164-015-1962-0 [Google Scholar] [CrossRef]
25. Tu, J. L., Yuan, J. J. (2018). Thermal decompositionbehavior of hydroxytyrosol (HT) in nitrogen atmosphere based on TG-FTIR methods. Molecules, 23(2), 404. https://doi.org/10.3390/molecules23020404 [Google Scholar] [PubMed] [CrossRef]
26. Lopez-Velazquez, M. A., Santes, V., Balmaseda, J., Torres-Garcia, E. (2013). Pyrolysis of orange waste: A thermo-kinetic study. Journal of Analytical and Applied Pyrolysis, 99(1), 170–177. https://doi.org/10.1016/j.jaap.2012.09.016 [Google Scholar] [CrossRef]
27. Liu, J. L. (2011). Study on directed pyrolysis of lignocellulosic biomass (Doctor Thesis). Chinese Academy of Forestry, Beijing, China. [Google Scholar]
28. Salehi, M., Clemens, F., Graule, T., Grobéty, B. (2012). Kinetic analysis of the polymer burnout in ceramic thermoplastic processing of the YSZ thin electrolyte structures using model free method. Applied Energy, 95(2), 147–155. https://doi.org/10.1016/j.apenergy.2012.02.025 [Google Scholar] [CrossRef]
29. Aburto, J., Moran, M., Galano, A., Torres-García, E. (2015). Non-isothermal pyrolysis of pectin: A thermochemical and kinetic approach. Journal of Analytical and Applied Pyrolysis, 112(3), 94–104. https://doi.org/10.1016/j.jaap.2015.02.012 [Google Scholar] [CrossRef]
30. Yuan, J. J., Tu, J. L., Xu, Y. J., Qin, F. G., Li, B. et al. (2018). Thermal stability and products chemical analysis of olive leaf extract after enzymolysis based on TG-FTIR and Py-GC–MS. Journal of Thermal Analysis & Calorimetry, 132(3), 1729–1740. https://doi.org/10.1007/s10973-018-7083-4 [Google Scholar] [CrossRef]
31. Deng, C. (2015). Experimental study on Pyrolysis of glucose and its derivatives based on TGA-GC-MS (Master Thesis). Huazhong University of Science and Technology, China. [Google Scholar]
Supplementary Materials
Cite This Article
 Copyright © 2023 The Author(s). Published by Tech Science Press.
This work is licensed under a Creative Commons Attribution 4.0 International License , which permits unrestricted use, distribution, and reproduction in any medium, provided the original work is properly cited.
 Downloads
 Citation Tools