
 Submit a Paper
 Propose a Special lssue
 Open Access
ARTICLE

The Influence of Tartaric Acid in the Silver Nanoparticle Synthesis Using Response Surface Methodology
1 Chemistry Department, Faculty of Science and Data Analytics, Institut Teknologi Sepuluh Nopember, Surabaya, Indonesia
2 Chemistry Department, Faculty of Science and Technology, Airlangga University, Surabaya, Indonesia
3 Department Clinical Microbiology, Faculty of Medicine, Brawijaya University, Malang, Indonesia
* Corresponding Author: Suprapto Suprapto. Email:
(This article belongs to the Special Issue: Special Issue in Celebration of JRM 10 Years)
Journal of Renewable Materials 2024, 12(2), 245-258. https://doi.org/10.32604/jrm.2023.045514
Received 29 August 2023; Accepted 11 December 2023; Issue published 11 March 2024
 View Full Text
 Download PDF
Abstract
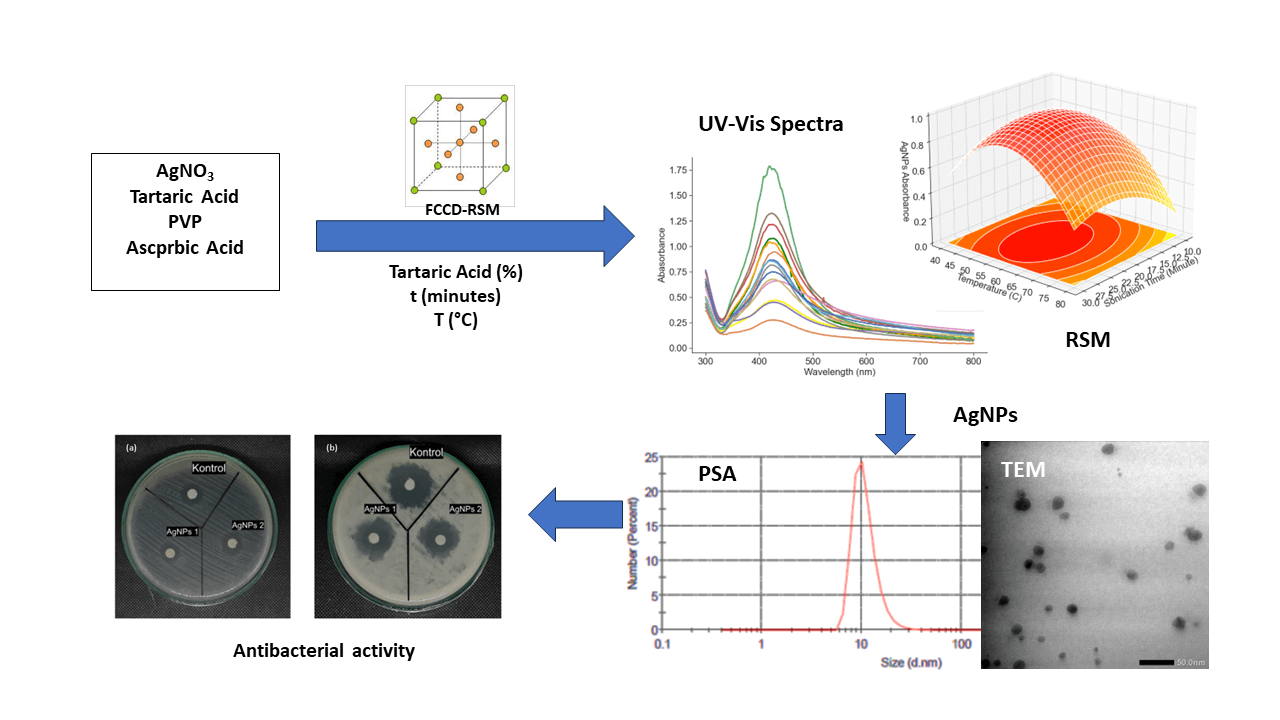
Silver nanoparticles (AgNPs) synthesized using tartaric acid as a capping agent have a great impact on the reaction kinetics and contribute significantly to the stability of AgNPs. The protective layer formed by tartaric acid is an important factor that protects the silver surface and reduces potential cytotoxicity problems. These attributes are critical for assessing the compatibility of AgNPs with biological systems and making them suitable for drug delivery applications. The aim of this research is to conduct a comprehensive study of the effect of tartaric acid concentration, sonication time and temperature on the formation of silver nanoparticles. Using Response Surface Methodology (RSM) with Face-Centered Central Composite Design (FCCD), the optimization process identifies the most favorable synthesis conditions. UV-Vis spectrum regression analysis shows that AgNPs stabilized with tartaric acid are more stable than AgNPs without tartaric acid. This highlights the increased stability that tartaric acid provides in AgNP ssssynthesis. Particle size distribution analysis showed a multimodal distribution for AgNPs with tartaric acid and showed the smallest size peak with an average size of 20.53 nm. The second peak with increasing intensity shows a dominant average size of 108.8 nm accompanied by one standard deviation of 4.225 nm and a zeta potential of −11.08 mV. In contrast, AgNPs synthesized with polyvinylpyrrolidone (PVP) showed a unimodal particle distribution with an average particle size of 81.62 nm and a zeta potential of −2.96 mV. The more negative zeta potential of AgNP-tartaric acid indicates its increased stability. Evaluation of antibacterial activity showed that AgNPs stabilized with tartaric acid showed better performance against E. coli and B. subtilis bacteria compared with AgNPs-PVP. In summary, this study highlights the potential of tartaric acid in AgNP synthesis and suggests an avenue for the development of stable AgNPs with versatile applications.Graphic Abstract
Keywords
The field of nanotechnology continues to develop, generating great interest and driving innovation in various fields. Nanoparticles are materials characterized by special properties resulting from their dimensions at the nanoscale. Among the widely studied nanoparticles, silver nanoparticles (AgNPs) have gained importance due to their prominent optical, electrical, and antimicrobial properties. These properties make AgNPs important entities with applications in electronics, catalysis, antimicrobials, and even biomedicine [1–3].
In an effort to utilize AgNPs according to their applications, controlled synthesis of AgNPs has become the focus of much research. The synthesis procedure to manipulate the properties such as size, shape, and stability has opened up innovation opportunities to improve usability. The focus of this research is a conventional synthesis approach, in which silver salt precursors, specifically silver nitrate (AgNO3), are reduced in the presence of reducing and capping agents. The choice of reducing agent and capping agent can significantly influence the size, shape, and stability of silver nanoparticles (AgNPs) in the synthesis process. Reducing agents are responsible for reducing silver ions to silver atoms, which then assemble into nanoparticles. Different reducing agents can cause variations in reaction kinetics, resulting in different sizes and shapes of AgNPs. Strong reducing agents can accelerate the formation of small nanoparticles, while weaker reducing agents can cause larger particles to grow. The capping agent used is usually a ligand or surfactant which functions to stabilize the AgNPs formed. Capping agents surround AgNPs and prevent them from clumping or aggregating. The choice of the capping agent can affect the stability of nanoparticles in the solution. Some capping materials can produce well-dispersed and stable AgNPs, whereas other capping materials can cause aggregation or precipitation [4]. Additionally, certain capping agents can influence the shape of the nanoparticles and help maintain a particular morphology. Thus, the choice of the type of reducing agent and capping agent is an important consideration in the synthesis of nanoparticles for specific applications [5–7].
Ascorbic acid is a reducing agent that is widely known for controlling the conversion of silver ions into silver metal nanoparticles and plays an important role in the conversion process [8]. At the same time, the capping agent provides stability by preventing nanoparticle agglomeration. However, apart from size and shape considerations, the long-term stability of nanoparticles remains important, especially in drug delivery systems [9–11].
Silver nanoparticles (AgNPs), which are synthesized using tartaric acid as a capping agent, have a prospective role in drug delivery systems. The tartaric acid capping agent serves several important functions in the design and performance of these drug delivery systems. One of the main roles of tartaric acid as a capping agent is to stabilize and control the growth of AgNPs during the synthesis process. The capping agent forms a protective layer around the AgNPs, preventing them from aggregating and maintaining the desired size and shape. This controlled growth is critical because the size of the nanoparticles can significantly influence their interactions with drugs and biological systems [12,13].
Efforts to achieve robust, enduring stability have led to the exploration of complexing agents in AgNP synthesis. These agents interact with metal ions, shaping the synthesis process and influencing the stability of the resulting nanoparticles. In this context, tartaric acid, an organic compound with chelating properties, emerges as a compelling candidate. Its ability to engage in intricate interactions with silver ions holds the potential to impact reaction kinetics and contribute to the lasting stability of AgNPs [14]. In addition, the use of tartaric acid as a capping agent can increase the biocompatibility of AgNPs. The protective layer formed by tartaric acid prevents direct exposure of the silver surface, thereby reducing the potential for cytotoxicity [15]. This is an important aspect when considering the compatibility of AgNPs with biological systems, making them more suitable for drug delivery applications. In drug delivery, AgNPs synthesized with tartaric acid can be used to deliver therapeutic agents such as drugs or biomolecules. The presence of capping agents allows for increased drug loading efficiency and ensures that the therapeutic payload is securely attached to the nanoparticle surface [16]. These functionalized AgNPs can also be designed to produce controlled drug release, enabling gradual and sustained release of the encapsulated drug over a long period. This feature is very beneficial for achieving a prolonged therapeutic effect and reducing the frequency of drug administration. Additionally, tartaric acid-treated AgNPs can be tailored for targeted drug delivery. By functionalizing the nanoparticle surface with targeting ligands such as antibodies or specific molecules, drug-loaded AgNPs can be directed to specific cells or tissues, thereby increasing the precision of drug delivery and minimizing off-target side effects. This targeted approach can increase the effectiveness of therapy and reduce the possibility of side effects [17,18].
This research was carried out to uncover the role of tartaric acid as a capping agent in AgNP synthesis. A specific focus is placed on its influence on nanoparticle stability—a crucial factor with wide-ranging implications. The overarching objective is to refine AgNP synthesis by systematically exploring tartaric acid concentration, sonication duration, and temperature. The UV-Vis absorbance of AgNPs at 420 nm emerges as a critical response parameter, offering insights into both stability and quality [19].
The optimization employs the Response Surface Methodology (RSM), a statistical approach proficient at probing interactions between variables and responses. The central composite design, a basis of RSM, forms the framework for systematically directing the optimization landscape. This design encapsulates the essence of variables—tartaric acid concentration, sonication time, and temperature—paving the way for optimal conditions that yield desired responses [20]. In the end, this Response Surface Methodology was used to unravel the interplay between tartaric acid concentration, sonication time, and temperature in AgNP synthesis.
2.1 The Synthesis of Silver Nanoparticles
The materials employed in this study include polyvinylpyrrolidone (PVP), ascorbic acid (AA), silver nitrate (AgNO3), and demineralized water. The solutions of 1% PVP solution, AA solution (0.025 M), and AgNO3 solution (0.5 M) were prepared. The FCCD was optimized using three parameters, namely tartaric acid concentration (0.5, 1.0, and 1.5 M), sonication time (10, 20, and 30 min), and temperature (40°C, 60°C, 80°C), with the response variable being the highest absorbance at 300–800 nm wavelength of UV-Vis spectra. The values of the variables used in the experiment are presented in Table 1.

The silver nanoparticles were synthesized by reacting 50 mL of 1% PVP solution with 30 mL of AgNO3 solution in an Erlenmeyer flask, followed by stirring at 350 rpm. The mixture was then added with 0.025 mL of AA solution. The resulting silver nanoparticles were tested for their absorbance using a UV-Vis spectrophotometer and their particle size distribution using a particle size analyzer (PSA) and Tunnelling Electron Microscopy (TEM) [21].
2.2 Particle Size Analysis of Silver Nanoparticles Using Particle Size Analyzer (PSA)
For the evaluation of silver nanoparticle dimensions, a sample volume of 5 mL was introduced into a cuvette, which was subsequently positioned within the designated sample holder and securely sealed. The Zetasizer Nano (Malvern Panalytical) provided specifications regarding the refractive index, absorbance, dispersant, and cuvette type. The analysis encompassed five replicates, effectively capturing the essence of the particle size distribution. The applied temperature (°C) was 25°C, and the dispersant used was water with a refractive index of 1.35, dispersant viscosity (cP) of 0.887, and dielectric constant of 78.5.
2.3 Characterization of Silver Nanoparticles Using Transmission Electron Microscopy (TEM)
Tunneling Electron Microscopy (TEM) JEM-1400Flash with 120 acceleration voltage was carried out to undertake the characterization of synthesized silver nanoparticles. The prepared sample was deposited onto a carbon-coated grid. This grid was then inserted into a holder, oriented to expose both sides to the stream of electrolyte jet flow, serving as the cathode. Through this mechanism, the electrolyte jet methodically polished both sides of the specimen until the desired light transparency was discerned by a light detector, enabling a comprehensive assessment of nanoparticle attributes. The measurement was carried out with 40000, 80000, and 150000 magnification.
3.1 Synthesis and UV-Vis Spectrophotometric Analysis of Silver Nanoparticles
Silver nitrate, PVP, ascorbic acid, and tartaric acid solutions exhibited a colorless solution, Fig. 1. However, a subtle elevation in absorbance was detected, with varying values aligning with the introduced silver nitrate concentration. This initial interaction between PVP and silver nitrate paved the way for the formation of the complex compound Ag(PVP)+, which underwent reduction upon the introduction of the reducing agent, yielding silver nanoparticles, as shown in Experiment 1 (orange line) in Fig. 1 [22].
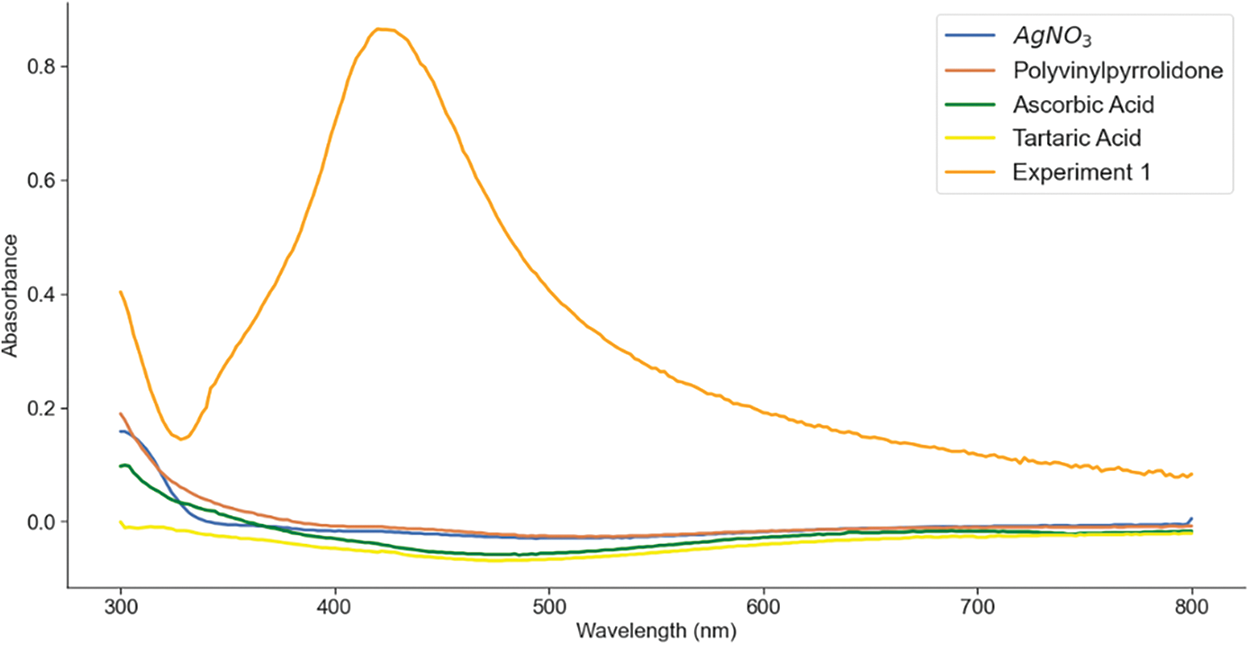
Figure 1: The spectra of each solution and the prominent spectra of AgNPs that appear at around 420 nm
The role of PVP materialized in its function as a stabilizing agent, arranging the formation of a protective layer on the nanoparticle surface. This encapsulating layer, structured through hydrophilic carbonyl (C = O) groups and hydrophobic pyrrolidone rings, effectively hinders the tendencies of aggregation. The binding of PVP to silver emerged via the interaction of carbonyl groups and nitrogen atoms present in the pyrrolidone ring. This interaction was fortified by both steric hindrance and electrostatic stability.
The reduction of the PVP-silver nitrate solution with ascorbic acid was accompanied by a transformative shift in color, displaying a distinct tea-brown hue—a characteristic marker of the reduction of Ag+ to Ag0 and the consequential formation of silver nanoparticles [23]. The complicated mechanistic process leading to silver nanoparticle genesis unfolds from Ag+ ions, carrying positive charges, being drawn towards the negatively charged carbonyl and pyrrolidone groups via electrostatic forces. Within this dynamic context, ascorbic acid assumes the role of an electron donor, terminating in the formation of stable interactions. This transformation led to the emergence of radical ions—semidehydroascorbic acid and dehydroascorbic acid. The semidehydroascorbic acid radical ion is particularly potent in its reducing ability. The interplay between ascorbic acid and semidehydroascorbic acid forms a robust framework for the reduction of Ag+ ions into Ag0 nanoparticles. These initial silver seeding particles function as the nuclei, laying the foundation for subsequent silver nanoparticle growth. The extent to which Ag+ ions are attracted to the PVP surface directly influences the number of Ag nanoparticles deposited on this surface. The overall chemical reactions governing the silver-stabilizing agent, prominently involving ascorbic acid, are illustrated by Eq. (1) [24,25].
The experimental examination included the acquisition of fifteen UV-Vis spectra, each corresponding to the diverse variations summarized within the FCCD design. These spectra were recorded across wavelengths ranging from 350 to 600 nm, as presented in Fig. 2a. The UV-Vis spectra exhibited distinctive maximum wavelengths in the range of 415–482 nm, associated with a range of absorbance values spanning 0.106–1.950, as presented in Fig. 2b. The highest absorbance was obtained from the 6th experiment. The 6th experiment was carried out with tartaric acid concentration, sonication time, and temperature of 0.5 M, 30 min, and 40°C, respectively.

Figure 2: The UV-Vis spectra (a) and maximum absorbances (b) obtained from 15 CCD input variations
AgNPs have a maximum absorbance at around 420 nm due to the surface plasmon resonance (SPR) phenomenon. Surface plasmon resonance is the collective oscillation of conduction electrons in metal nanoparticles in response to incident electromagnetic radiation, usually in the visible or ultraviolet (UV) region of the electromagnetic spectrum. The size and shape of the nanoparticles significantly influence the position of the absorption peak. In the case of AgNPs, nanometer-sized particles have absorption peaks in the visible region of the spectrum, with larger particles generally having longer absorption wavelengths. AgNPs resonance is strongest when the size and shape of the nanoparticles support SPR excitation at around 420 nm [26].
3.2 Optimization of Silver Nanoparticle Synthesis Using Response Surface Methodology (RSM)
The experimental dataset employed for the analysis using Response Surface Methodology (RSM), specifically within the framework of the Face-Centered Central Composite Design (FCCD), was founded upon the maximum absorbance values derived from the 15 distinct sample variations. The adoption of the FCCD design was strategically chosen to unearth the most significant interactions among the parameters integral to the synthesis of silver nanoparticles. The overarching objective was to streamline the experimental process while concurrently subjecting the response surfaces and plots to rigorous statistical scrutiny, ultimately leading to the identification of optimal synthesis conditions [27].
To encapsulate the intricate relationships within the dataset, a second-order polynomial equation was harnessed. This equation, acting as the cornerstone of the model, adeptly captures the multifaceted interactions between the response variable (absorbance) and the variables inherent to the FCCD. Its mathematical embodiment is elegantly represented by Eq. (2).
The triad of independent variables is succinctly represented as x0 (tartaric acid concentration, %), x1 (sonication time, minutes), and x2 (temperature), while the absorbance (Z) assumes its role as the response variable. Within this framework, the second-order polynomial equation assumes a pivotal role. When thoughtfully calibrated using experimental data, this equation assumes the responsibility of forecasting the response variable’s value for each reduction of independent variables. This process culminates in the construction of a robust RSM curvature model, adeptly equipped to facilitate intricate and multifaceted analyses [28].
The regression curve, as depicted in Fig. 3, illustrated a noticeable divergence between the majority of the experimental data and the predicted values. Such substantial disparities between predicted and observed values may potentially signify the existence of prediction errors. However, it is essential to note that a dispersion of points on the plot does not necessarily denote an inherently flawed model. The model’s r-value amounted to 0.778, accompanied by a p-value of 0.00064, a stderr of 0.1356, and an intercept standard error of 0.129. The r-value above 0.70% or 70% indicated that there was a strong correlation between input variables and the response variable. The significance of a p-value below 0.05 is indicative of notable distinctions between the experimental and predicted data. This phenomenon is also distinctly observable in the RSM plot presented in Figs. 4a and 4b, which provides a telling insight: the presence of tartaric acid seemingly did not significantly contribute to the formation of AgNPs. This inference arises from the observation that the addition of tartaric acid corresponded with a reduction in AgNPs’ absorbance around the 420 nm mark. The “saddle” shape of the RSM surface further suggests that tartaric acid with a concentration higher than 0.8 M reduces the absorbance of AgNPs. Consequently, the presence of tartaric acid emerged as a low-correlated feature. On the other hand, Fig. 4c indicated that the optimization of sonication time and temperature demonstrated effective convergence within the studied ranges.

Figure 3: The regression curve between predicted and experimental data of silver nanoparticle synthesis

Figure 4: 3D response surface plots between (a) tartaric acid concentrations and sonication time, (b) tartaric acid concentration and temperature, and (c) sonication time and temperature
Following the optimization process using Response Surface Methodology (RSM), a specific point was strategically chosen from the predefined range to serve as the representative optimal conditions for the synthesis of silver nanoparticles. This selection procedure involves substituting the range of values into Eq. (2) to identify the highest response (Z) value, which corresponds to the optimal condition for silver nanoparticle synthesis. Based on the conducted optimization process, the optimal conditions for the synthesis of silver nanoparticles were determined as follows: a maximum tartaric acid concentration of 0.8 M, a sonication time ranging from 15 to 30 min, and a temperature within the range of 45°C to 65°C. These determined optimal conditions will subsequently undergo further exploration through particle size characterization utilizing Particle Size Analyzer (PSA) and Transmission Electron Microscopy (TEM).
3.3 The AgNPs Stability Measurement
The stability of AgNPs was investigated by absorbance measurements over 13 days with a measurement interval of 24 h. The spectra of the measurement results for each day for AgNPs-tartrate and AgNPs without tartarate are shown in Fig. 5.

Figure 5: The spectra of AgNP-tartarate (a) and AgNP-without tartarate (b) over 13 days
The change in maximum absorbances for AgNPs with and without tartarate are shown in Fig. 6a. Both the absorption of AgNPs-tartrate and AgNPs without tartarate showed an increase on the second day. From the second to the 13th day, the two synthesized AgNPs showed a decrease in absorbance. The absorbance decay of AgNPs without tartarate was faster than that of AgNPs-tartrate, Fig. 6b. Regression analysis of the absorption of the two AgNPs from the second day can provide information about the decreased rate of the absorption of the two AgNPs.

Figure 6: The maximum absorbance and regression curve of AgNP without and with tartarate were measured from days 1 to 13
The AgNPs-tartrate regression analysis produces a linear equation with a slope of −0.0459, an intercept of 1.0817, and an r-value of −0.9381. Regression analysis of AgNPs without tartarate absorption as a function of the day yielded a linear equation with a slope of −0.0692, an intercept of 1.1583, and an r-value of −0.9738. Based on the regression equation, AgNPs with tartarate reach an absorbance of 0.0 on day 24, while AgNPs without tartarate reach an absorbance of 0.0 on day 17.
3.4 Characterization Using Particle Size Analyzer (PSA)
The assessment of nanoparticle dimensions initiates with measurements using a dynamic light scattering (DLS) particle size analyzer (PSA). This analytical technique is widely employed to determine the size of nanoparticles, leveraging the principle of laser light scattering fluctuations induced by nanoparticles undergoing Brownian motion. As depicted in Fig. 7a, the histogram of AgNPs-tartaric acid has a multimodal distribution. The resulting particle distribution at the lower peak has an average size of 20.53 nm. The second peak shows high intensity indicating that the majority of the particle has an average size of 108.8 nm with a standard deviation of 4.225 nm. The zeta potential measured was −11.08 mV with a zeta deviation (mV) of 7.037 and conductivity of 1.4 mS/cm [23].

Figure 7: Histogram of AgNPs-tartaric acid (a) and AgNPs-PVP (b)
Fig. 7b shows the histogram of the size distribution of silver nanoparticles synthesized using PVP at the optimal point of RSM. More than 25% of the particles have a size of ~14.04 nm, with the particle size distribution having a mean of 81.62 nm and a standard deviation of 3.775 nm. The PSA AgNPs-PVP histogram shows a single peak which indicates that the resulting nanoparticles have a uniform shape or what is usually called monodisperse. The results of the zeta potential analysis of AgNPs-PVP show a zeta potential value of −2.96 mV. A negative value of zeta potential indicates that the silver nanoparticles have a positive charge and the surrounding stabilizer has a negative charge. In term of zeta potential AgNPs synthesized using tartaric acid has more negative value indicating that the obtained AgNPs are more stable. Thus it was concluded that the presence of tartaric acid could divert the AgNPs size distribution as well as zeta potential. In certain applications such as nanomedicine or catalysis, a smaller size is often preferred because of its high surface area. Conversely, other applications might benefit from a broader range of particle sizes [29].
3.5 Characterization Using Transmission Electron Microscopy (TEM)
Fig. 8 showcases Transmission Electron Microscopy (TEM) micrographs, each accompanied by a 100, 50, and 20 nm scale bar, offering a visual representation of the synthesized silver nanoparticles. The average diameter of these silver nanoparticles is determined to be 18.34 ± 21.243 nm, and they exhibit a distinctive spherical morphology, with the smallest observed particle size measuring 9.463 nm. Figs. 8a–8c indicate that the nanoparticles maintain a notable separation from each other. This distinct spatial distribution can be attributed to the repulsive forces operating between the negatively charged stabilizing agents—PVP in particular—which play a protective role for the nanoparticles within this study.

Figure 8: TEM micrographs of silver nanoparticles synthesized in this study (a) 40000 (b) 80000, and (c) 150000 magnification
The relatively modest zeta potential value contributes to the maintenance of a moderate distance between the nanoparticles. This balance in electrostatic repulsion forces prevents an overly strong interparticle attraction. It is noteworthy that the nanoparticle sizes determined through TEM measurements are found to be smaller in comparison to the sizes obtained through PSA. This discrepancy arises due to the distinct principles governing the two measurement techniques. While TEM captures a subset of the entire AgNP population, PSA measurements present a histogram representing the entire nanoparticle population [30,31].
3.6 Antibacterial Activity of AgNPs/PVP-Tartarate
The synthesized silver nanoparticles under optimal conditions were tested for their antibacterial activity. This test was carried out using two types of bacterial isolates, namely the gram-positive bacteria: Bacillus subtilis and the gram-negative bacteria: Escherichia coli, using the disk diffusion method. The calculation of antibacterial activity is based on the area of the inhibition zone around the disc.
The inhibitory potential of AgNPs/PVP tested on E. coli bacteria is shown in Fig. 9a, while the inhibitory effect on B. subtilis bacteria is shown in Fig. 9b. Furthermore, the inhibitory potential of AgNPs/PVP-tartarate tested on E. coli bacteria is shown in Fig. 10a, while the inhibitory potential on B. subtilis bacteria is shown in Fig. 10b. The results of antibacterial activity can be seen in Table 2.

Figure 9: Antibacterial activity of AgNPs/PVP on (a) E. coli and (b) B. subtilis

Figure 10: Antibacterial activity of AgNPs/PVP-tartarate against (a) E. coli and (b) B. subtilis

The control, ampicillin, has greater inhibitory activity against all bacteria because ampicillin is a proven antibiotic that has antibacterial properties and can inhibit both gram-positive and gram-negative bacteria. Inhibition of bacteria by AgNP solutions was due to the strong interactions between silver and bacterial cells thereby disrupting cell wall permeability, damaging DNA and proteins, and directly binding to phosphate and sulfur groups of bacteria. Another AgNP activity is to disrupt cell metabolism, inhibit microbial cell synthesis, and produce reactive oxygen species (ROS), which are highly reactive molecules that cause toxic effects to the bacteria. In addition, the bacterial growth pathway is disrupted, causing bacterial cells to lose their ability to replicate and bacterial cell death.
Based on the research results, AgNPs synthesized using ascorbic acid as a reducing agent and modified with tartaric acid (AgNPs-tartaric acid) had higher inhibitory activity against Escherichia coli. An inhibition area of 6.31 mm2 is categorized as a moderate inhibition category. The AgNPs/PVP-tartarate has an average inhibition of 7.765 mm on Bacillus subtilis bacteria, which also falls into the moderate inhibition category. The size, shape, crystallinity, and type of AgNP capping agent likely play an important role and may cause variations in antibacterial activity [32].
The antibacterial activity of AgNPs-tartaric acid showed better activity against E. coli bacteria and B. subtilis bacteria compared to AgNPs/PVP. This proves that the addition of tartaric acid provides better antibacterial activity against gram-negative and gram-positive bacteria. Tartaric acid may act as an antibacterial agent through several potential mechanisms related to its structure. Possible mechanisms include changes in pH. Some bacteria are sensitive to significant changes in pH because they disrupt the acid-base balance in bacterial cells and bacterial cell membranes can be damaged in acidic conditions. Tartaric acid is a weak acid. When dissolved in water, the carboxylic group (-COOH) releases hydrogen ions (H+) and can acidify the environment. Apart from that, the hydroxyl group (OH) of tartaric acid also plays a role in inhibiting cellular metabolic processes such as damaging cell walls and membranes and disrupting the transport of nutrients into cells by interacting with the cell surface through hydrogen bonds or ionic bonds.
Based on these results, the AgNPs/PVP-tartarate had better inhibitory activity against gram-positive bacteria than gram-negative bacteria. This is due to the electrostatic interaction between integral membrane protein residues which are positively charged on the surface of B. subtilis bacteria as Gram-positive bacteria and AgNPs/PVP tartarate which is negatively charged due to the influence of the carboxyl group (-COOH) [33,34].
Optimization of key factors influencing the synthesis of silver nanoparticles (AgNPs) was carried out carefully using Response Surface Methodology (RSM) using Face-Centered Central Composite Design (FCCD). The optimal synthesis conditions identified included tartaric acid concentration, sonication time, and temperature. UV-Vis spectrum analysis using regression provides insight that AgNPs stabilized with tartaric acid show longer stability than AgNPs synthesized without tartaric acid. This observation highlights the positive influence of tartaric acid in enhancing the stability of AgNPs.
Particle size distribution analysis revealed a distinct multimodal distribution for AgNPs with tartaric acid. In contrast, AgNPs synthesized with polyvinylpyrrolidone (PVP) showed unimodal particle distribution. The most important is the more negative zeta potential of the AgNPs synthesized with tartaric acid, which contributes to their increased stability. Antibacterial activity evaluation further highlighted the superior performance of tartaric acid-stabilized AgNPs against E. coli and B. subtilis bacteria compared with AgNPs/PVP.
Transmission electron microscope (TEM) characterization confirmed the spherical morphology of AgNPs-tartaric acid with well-separated particles caused by repulsive forces between stabilizers. The results highlight the potential of tartaric acid in AgNP synthesis and pave the way for the creation of stable AgNPs with wide applications.
Acknowledgement: The authors thank the Directorate of Research and Community Service (DRPM, Direktorat Riset dan Pengabdian Kepada Masyarakat) ITS for their support.
Funding Statement: This research was funded by the Directorate of Research and Community Service (DRPM, Direktorat Riset dan Pengabdian Kepada Masyarakat) ITS through the ITS Research Local Grant (No: 1665/PKS/ITS/2023).
Author Contributions: The authors confirm the contribution to the paper as follows: study conception and design: Yatim Lailun Ni’mah and Suprapto Suprapto; data collection: Afaf Baktir; analysis and interpretation of results: Yatim Lailun Ni’mah and Suprapto Suprapto; draft manuscript preparation: Dewi Santosaningsih. All authors reviewed the results and approved the final version of the manuscript.
Availability of Data and Materials: The authors confirm that the data supporting the findings of this study are available within the article.
Conflicts of Interest: The authors declare that they have no conflicts of interest to report regarding the present study.
References
1. Khafaga, A. F., Abu-Ahmed, H. M., El-Khamary, A. N., Elmehasseb, I. M., Shaheen, H. M. (2018). Enhancement of equid distal limb wounds healing by topical application of silver nanoparticles. Journal of Equine Veterinary Science, 61, 76–87. [Google Scholar]
2. Kumar, S. S. D., Rajendran, N. K., Houreld, N. N., Abrahamse, H. (2018). Recent advances on silver nanoparticle and biopolymer-based biomaterials for wound healing applications. International Journal of Biological Macromolecules, 115, 165–175. [Google Scholar] [PubMed]
3. Balwe, S. G., Shinde, V. V., Rokade, A. A., Park, S. S., Jeong, Y. T. (2017). Green synthesis and characterization of silver nanoparticles (Ag NPs) from extract of plant Radix Puerariae: An efficient and recyclable catalyst for the construction of pyrimido[1,2-b]indazole derivatives under solvent-free conditions. Catalysis Communications, 99, 121–126. [Google Scholar]
4. Khodashenas, B., Ghorbani, H. R. (2019). Synthesis of silver nanoparticles with different shapes. Arabian Journal of Chemistry, 12(8), 1823–1838. [Google Scholar]
5. Khan, Md. R., Urmi, M. A., Kamaraj, C., Malafaia, G., Ragavendran, C. et al. (2023). Green synthesis of silver nanoparticles with its bioactivity, toxicity and environmental applications: A comprehensive literature review. Environmental Nanotechnology, Monitoring & Management, 20, 100872. [Google Scholar]
6. Dhaka, A., Mali, S. C., Sharma, S., Trivedi, R. (2023). A review on biological synthesis of silver nanoparticles and their potential applications. Results in Chemistry, 6, 101108. [Google Scholar]
7. Githala, C. K., Trivedi, R. (2023). Review on synthesis method, biomolecules involved, size affecting factors and potential applications of silver nanoparticles. Biocatalysis and Agricultural Biotechnology, 54, 102912. https://doi.org/10.1016/j.bcab.2023.102912 [Google Scholar] [CrossRef]
8. Hashemnia, S., Zarei, H., Mokhtari, Z., Mokhtari, M. H. (2021). An investigation of the effect of PVP-coated silver nanoparticles on the interaction between clonazepam and bovine serum albumin based on molecular dynamics simulations and molecular docking. Journal of Molecular Liquids, 323, 114915. [Google Scholar]
9. Kyrychenko, A., Korsun, O. M., Gubin, I. I., Kovalenko, S. M., Kalugin, O. N. (2015). Atomistic simulations of coating of silver nanoparticles with poly(vinylpyrrolidone) oligomers: Effect of oligomer chain length. The Journal of Physical Chemistry, 119(14), 7888–7899. [Google Scholar]
10. Yang, T. H., Ahn, J., Shi, S., Qin, D. (2021). Understanding the role of poly(vinylpyrrolidone) in stabilizing and capping colloidal silver nanocrystals. ACS Nano, 15(9), 14242–14252. [Google Scholar] [PubMed]
11. Cholula-Díaz, J. L., Lomelí-Marroquín, D., Pramanick, B., Nieto-Argüello, A., Cantú-Castillo, L. A. et al. (2018). Synthesis of colloidal silver nanoparticle clusters and their application in ascorbic acid detection by SERS. Colloids and Surfaces B: Biointerfaces, 163, 329–335. [Google Scholar]
12. Pareek, S., Omray, A., Koli, A. R. (2019). InstaSpheres TA (Tartaric acid) as functional starter core for extended release formulations. Journal of Drug Delivery Science and Technology, 54, 101262. [Google Scholar]
13. Sohn, J. S., Choi, J. S. (2021). Solubilization of tadalafil using a tartaric acid and chitosan-based multi-system. International Journal of Biological Macromolecules, 168, 866–874. [Google Scholar] [PubMed]
14. Ganea, I. V., Nan, A., Ciorîţă, A., Turcu, R., Baciu, C. (2021). Responsiveness assessment of cell cultures exposed to poly(tartaric acid) and its corresponding magnetic nanostructures. Journal of Molecular Structure, 1248, 131459. [Google Scholar]
15. Özel, F., Karaagac, O., Tokay, E., Köçkar, F., Köçkar, H. (2019). A simple way to synthesize tartaric acid, ascorbic acid and their mixture coated superparamagnetic iron oxide nanoparticles with high saturation magnetisation and high stability against oxidation: Characterizations and their biocompatibility studies. Journal of Magnetism and Magnetic Materials, 474, 654–660. [Google Scholar]
16. Hashemi, Z., Shirzadi-Ahodashti, M., Mortazavi-Derazkola, S., Ebrahimzadeh, M. A. (2022). Sustainable biosynthesis of metallic silver nanoparticles using barberry phenolic extract: Optimization and evaluation of photocatalytic, in vitro cytotoxicity, and antibacterial activities against multidrug-resistant bacteria. Inorganic Chemistry Communications, 139, 109320. [Google Scholar]
17. Rajawat, S., Koutu, V., Saha, S., Malik, M. M. (2023). Biopolymers as silver nanoparticle carriers for targeted drug delivery. Materials Today: Proceedings. https://doi.org/10.1016/j.matpr.2022.12.226 [Google Scholar] [CrossRef]
18. Azadpour, A., Hajrasouliha, S., Khaleghi, S. (2022). Green synthesized-silver nanoparticles coated with targeted chitosan nanoparticles for smart drug delivery. Journal of Drug Delivery Science and Technology, 74, 103554. [Google Scholar]
19. Padhi, S., Behera, A. (2022). Chapter 17–Biosynthesis of silver nanoparticles: Synthesis, mechanism, and characterization. In: Agri-waste and microbes for production of sustainable nanomaterials, nanobiotechnology for plant protection, pp. 397–440. Amsterdam: Elsevier. [Google Scholar]
20. Jayakodi, S., Kumar, V. (2020). Statistical optimization of copper oxide nanoparticles using response surface methodology and box-behnken design towards in vitro and in vivo toxicity assessment. Biointerface Research in Applied Chemistry, 11, 10027–10039. [Google Scholar]
21. Adibah, N., Firdianti, B. E., Suprapto, S. (2023). Synthesis of silver nanoparticles using response surface methodology. Journal of Nano- and Electron Physics, 15(3), 03001-1-03001-4. [Google Scholar]
22. Mulfinger, L., Solomon, S. D., Bahadory, M., Jeyarajasingam, A. V., Rutkowsky, S. A. et al. (2007). Synthesis and study of silver nanoparticles. Journal of Chemical Education, 84(2), 322. [Google Scholar]
23. Mendieta-Jiménez, A. L., Carpio-Martínez, P., Cortés-Guzmán, F., Gómez-Espinosa, R. M. (2018). Design of growing points for silver nanoparticles on polypropylene membranes. Chemical Physics Letters, 693, 159–164. [Google Scholar]
24. Koczkur, K. M., Mourdikoudis, S., Polavarapu, L., Skrabalak, S. E. (2015). Polyvinylpyrrolidone (PVP) in nanoparticle synthesis. Dalton Transactions, 44(41), 17883–17905. [Google Scholar] [PubMed]
25. Restrepo, C. V., Villa, C. C. (2021). Synthesis of silver nanoparticles, influence of capping agents, and dependence on size and shape: A review. Environmental Nanotechnology, Monitoring & Management, 15, 100428. [Google Scholar]
26. Ijaz, I., Bukhari, A., Gilani, E., Nazir, A., Zain, H. et al. (2022). Green synthesis of silver nanoparticles using different plants parts and biological organisms, characterization and antibacterial activity. Environmental Nanotechnology, Monitoring & Management, 18, 100704. [Google Scholar]
27. Musabeygi, T., Goudarzi, N., Mirzaee, M., Arab-Chamjangali, M. (2023). Design of a ternary magnetic composite based on a covalent organic framework and Ag nanoparticles for simultaneous photodegradation of organic pollutants under LED light irradiation: Application of BBD-RSM modeling and resolution of spectral overlap of analytes. Journal of Alloys and Compounds, 964, 171249. [Google Scholar]
28. Ni’mah, Y. L., Suprapto, S., Subandi, A. P. K., Yuningsih, N. E., Pertiwi, A. C. (2022). The optimization of silica gel synthesis from chemical bottle waste using response surface methodology. Arabian Journal of Chemistry, 15(12), 104329. [Google Scholar]
29. Rajesh, K. M., Ajitha, B., Reddy, Y. A. K., Suneetha, Y., Reddy, P. S. (2018). Assisted green synthesis of copper nanoparticles using syzygium aromaticum bud extract: Physical, optical and antimicrobial properties. Optik-International Journal for Light and Electron Optics, 154, 593–600. [Google Scholar]
30. Rajeshkumar, S., Bharath, L. V. (2017). Mechanism of plant-mediated synthesis of silver nanoparticles–A review on biomolecules involved, characterisation and antibacterial activity. Chemico-Biological Interactions, 273, 219–227. [Google Scholar] [PubMed]
31. Rajeshkumar, S., Rinitha, G. (2018). Nanostructural characterization of antimicrobial and antioxidant copper nanoparticles synthesized using novel Persea Americana seeds. OpenNano, 3, 18–27. [Google Scholar]
32. Lok, C. N., Ho, C. M., Chen, R., He, Q. Y., Yu, W. Y. et al. (2007). Silver nanoparticles: Partial oxidation and antibacterial activities. Journal of Biological Inorganic Chemistry, 12(4), 527–534. [Google Scholar] [PubMed]
33. Begum, I., Shamim, S., Ameen, F., Hussain, Z., Bhat, S. A. et al. (2022). A combinatorial approach towards antibacterial and antioxidant activity using tartaric acid capped silver nanoparticles. Processes, 10(4), 716. [Google Scholar]
34. Agnihotri, S., Mukherji, S., Mukherji, S. (2013). Size-controlled silver nanoparticles synthesized over the range 5–100 nm using the same protocol and their antibacterial efficacy. RSC Advances, 4(8), 3974–3983. [Google Scholar]
Cite This Article
 Copyright © 2024 The Author(s). Published by Tech Science Press.
This work is licensed under a Creative Commons Attribution 4.0 International License , which permits unrestricted use, distribution, and reproduction in any medium, provided the original work is properly cited.
 Downloads
 Citation Tools