
 Submit a Paper
 Propose a Special lssue
 Open Access
REVIEW

A Review on Sources, Extractions and Analysis Methods of a Sustainable Biomaterial: Tannins
1 LERMAB, University of Lorraine, Faculty of Sciences, Blvd des Aiguillettes, Nancy, 54000, France
2 Chair of Forest Biomaterials, Institute of Earth and Environmental Sciences, University of Freiburg, Freiburg, Germany
3 Freiburg Materials Research Center, Alberst Ludwig University of Freiburg, Freiburg, 79104, Germany
4 Department of Forest Products Engineering, Faculty of Forestry, Istanbul University, Sariyer, Istanbul, 34473, Turkey
* Corresponding Author: Antonio Pizzi. Email:
(This article belongs to the Special Issue: Renewable and Biosourced Adhesives-2023)
Journal of Renewable Materials 2024, 12(3), 397-425. https://doi.org/10.32604/jrm.2023.046074
Received 18 September 2023; Accepted 30 November 2023; Issue published 11 April 2024
 View Full Text
 Download PDF
Abstract
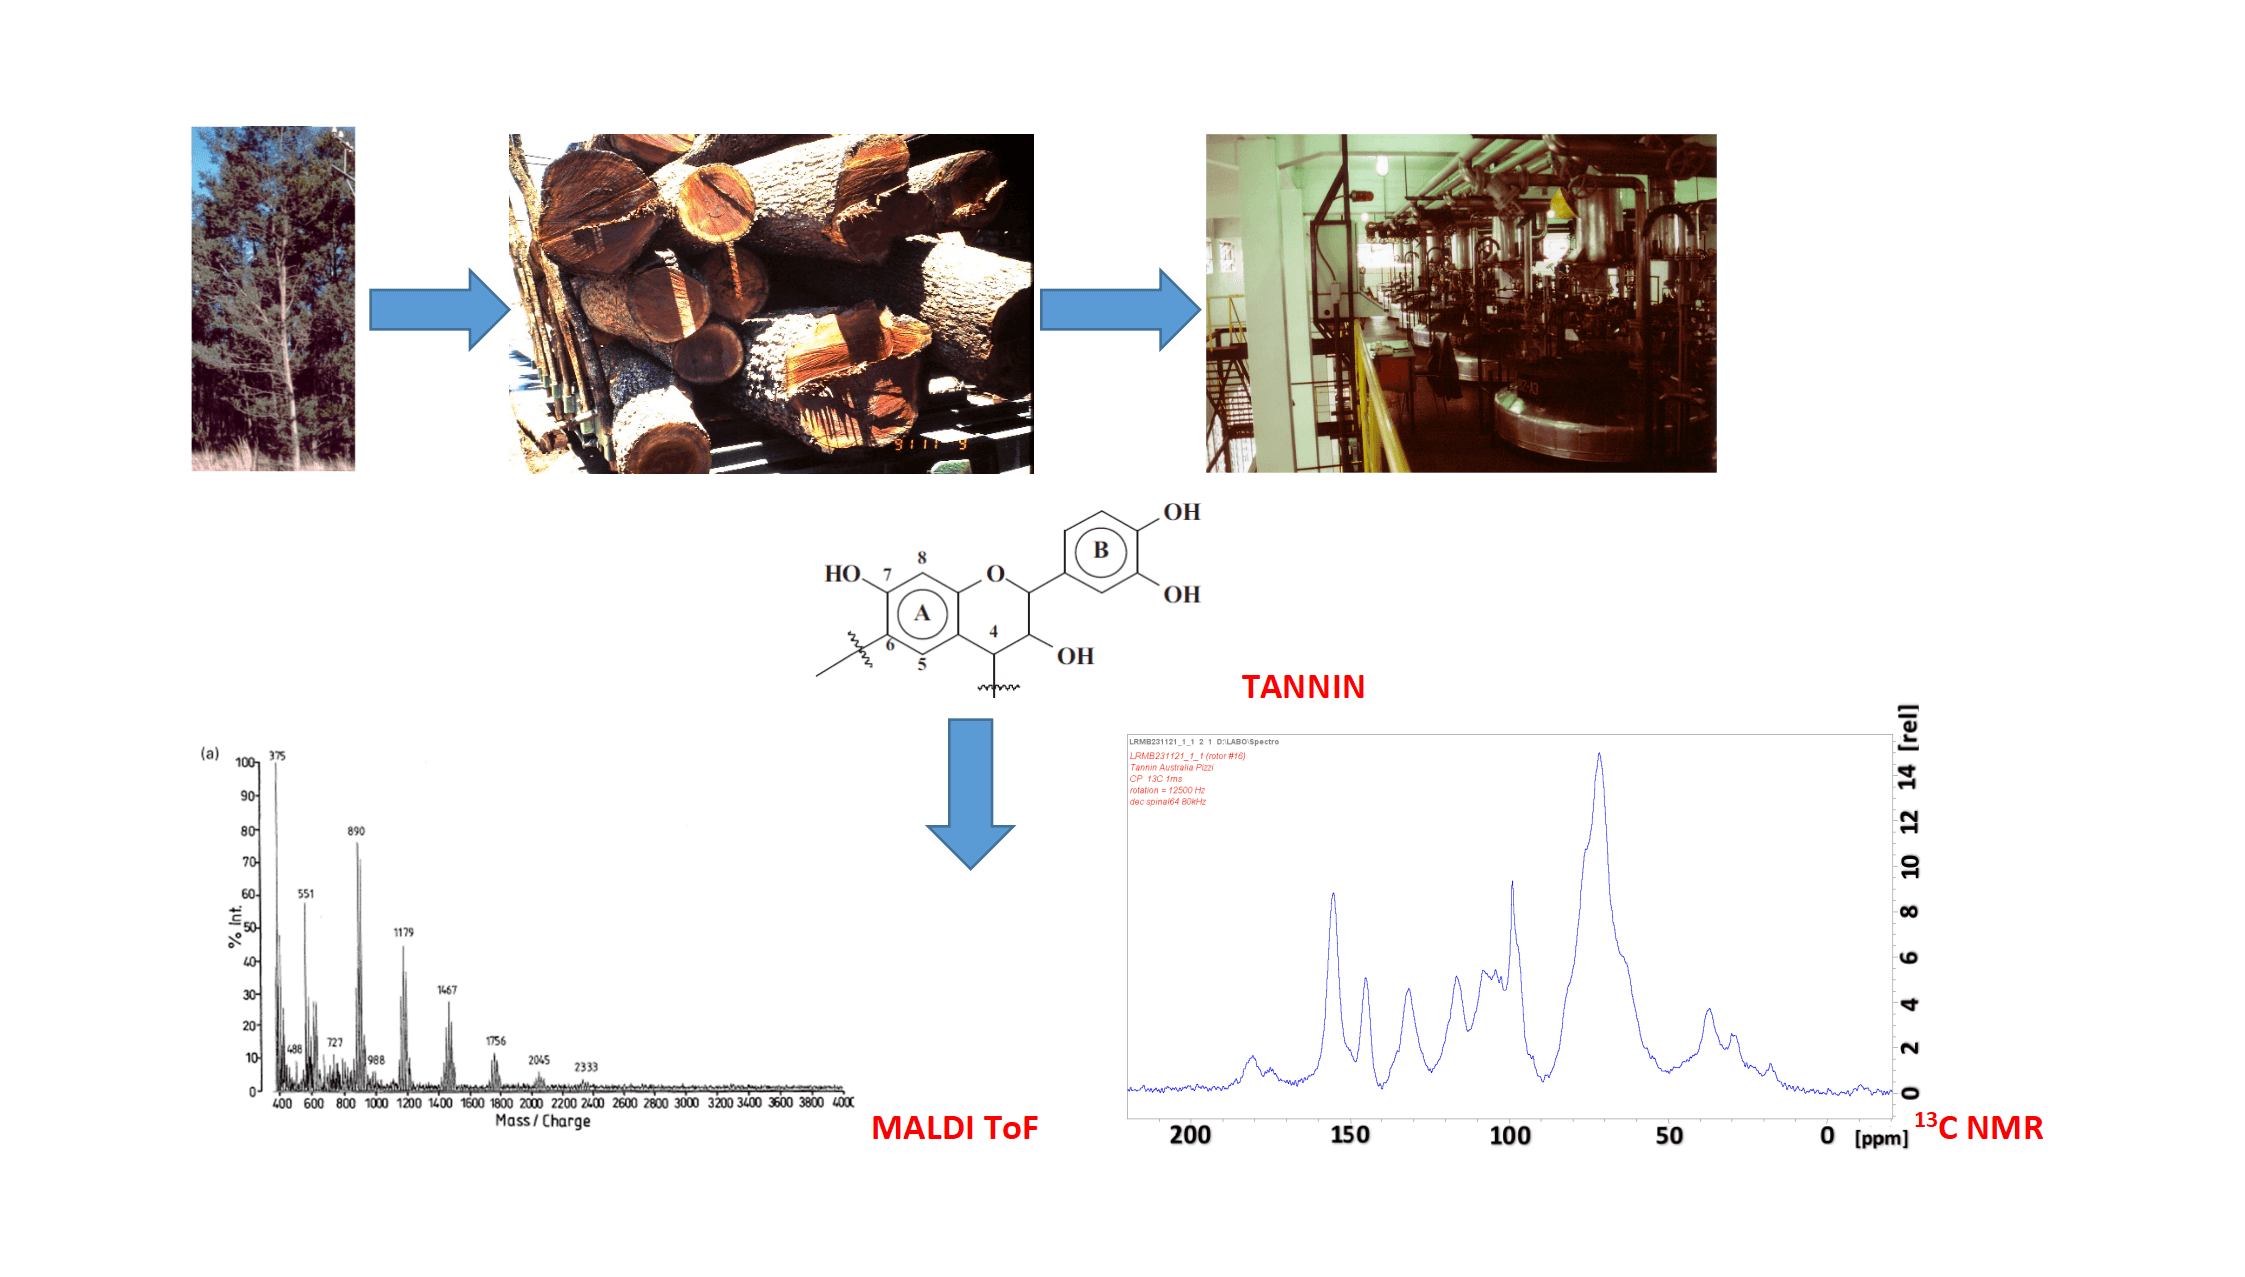
Condensed and hydrolysable tannins are non-toxic natural polyphenols that are a commercial commodity industrialized for tanning hides to obtain leather and for a growing number of other industrial applications mainly to substitute petroleum-based products. They are a definite class of sustainable materials of the forestry industry. They have been in operation for hundreds of years to manufacture leather and now for a growing number of applications in a variety of other industries, such as wood adhesives, metal coating, pharmaceutical/medical applications and several others. This review presents the main sources, either already or potentially commercial of this forestry by-materials, their industrial and laboratory extraction systems, their systems of analysis with their advantages and drawbacks, be these methods so simple to even appear primitive but nonetheless of proven effectiveness, or very modern and instrumental. It constitutes a basic but essential summary of what is necessary to know of these sustainable materials. In doing so, the review highlights some of the main challenges that remain to be addressed to deliver the quality and economics of tannin supply necessary to fulfill the industrial production requirements for some materials-based uses.Graphic Abstract
Keywords
Tannins are one class of the forest industry sustainable materials which have been long-time used, and are used still for tanning animal hides to manufacture leather. Since before 1850 when they started to be extracted industrially exclusively for tanning leather, in the last 75 years they have increasingly acquired further importance to prepare new, biosourced materials to substitute petroleum-sourced products [1–7] as well as for pharmaceutical [8], nutritional, and several other commercially potential applications. Thus, since the early 1970’s, they have been used industrially to manufacture biosourced adhesives for exterior grade wood panels and other wood products in several countries, among these South Africa, Australia, Brazil, Chile, Germany and others [1,2,9]. Today many tannin-based materials are already applied in formulations used in a number of different industries [3,4,8,10].
Numerous extensive reviews on their applications and on their chemistry do exist the content of which is not worth to again repeat here. The reader is then addressed to these more in depth reviews on their chemistry and different applications [1–4,6–8,10,11].
This review instead concentrates on their origins, extraction techniques, and systems of analysis of both their structures, and of their physical characteristics, thus basic knowledge useful to anyone who wants to tackle these materials and start investigating possibly even more uses for them than the already established ones.
Tannins are found commonly in the bark of trees, wood, leaves, buds, stems, fruits, seeds, roots, and plant galls. They are a plant defense mechanism. In all of these plant structures, tannins help to protect the individual plant species. Tannins that become stored in the bark of trees protect the tree from being infected by bacteria or fungi. The sources of tannins are very varied. There are a multitude of trees and shrubs which contain tannins. For both hydrolysable and condensed tannins the species rich in tannins are many. Notable for either their present or past economic and/or industrial importance are quebracho (Schinopsis lorentzii or balansae) wood tannin, wattle or black mimosa (Acacia mearnsii, de Wildt) bark tannin, chestnut (Castanea sativa) wood tannin, Oak (Quercus spp.) bark tannin, mangrove wood tannin, Acacia catechu and Uncaria gambir tannins commercially known as Cube Gambier tannin, sumach (Rhus coriaria), myrabolans (Terminalia and Phyllantus species), divi-divi (Caesalpina coriaria), Algarobilla chilena (Balsamocarpon brevifolium and Caesalpinia brevifolia), Tara (Caesalpinia spinosa), and the bark of several species of pines and firs among them Pinus radiata and Pinus nigra. And even more plants with extractable tannins do exist. Among the tree species, good yields of condensed tannins are also obtained from Douglas fir bark (Pseudotsuga menziesii) [12], Hemlock bark (Conium maculatum) [13] Acacia mangium [14], Spruce (Picea spp.) [13]. Excellent tannins, with high yields and very low carbohydrates residues content, have been extracted commercially from the pith (the inner kernel separation membranes) within pecan (Carya illinoensis) nuts [15–17] and used for resins. Unfortunately the small factory producing this last in Memphis, USA, does not operate anymore. It is however a non-negligible source to keep in mind as large quantities of the waste source raw materials are generated by the industry producing commercially shelled kernels in packets for food consumption.
As regards commercial tannin origin by location, areas of strong industrial production to-day are Brazil, South Africa, India, Zimbabwe, Tanzania for mimosa tannin. Argentina for quebracho tannin. Indonesia for mangrove and for Cube Gambier tannins. Italy and Slovenia for chestnut tannin, Turkey, New Zealand, France and Chile for pine tannins. Moreover, several smaller producers are dispersed in other locations. Thus, small pine tannin extraction facilities exist in Turkey and in Chile, an oak tannin extraction facility in Poland and a grape seeds one in France.
There are many sources of tannins that either have not been exploited commercially, notwithstanding that large quantities are potentially available, or the extraction of which has been done on fairly uncommon species for extracting and testing tannins for medical or pharmaceutical applications. Among these, common grape vine (Vitis vinifera) tannin extract (from grape skins and grape seeds) [18] is known for being among others, an anti-obesity agent [19]. Unusual species are also used for the extraction of tannins. For example, really large quantities of tannin can be extracted from the very large amount of the spent grape skin residues after the juice has been pressed from the raisins in the production of wine. A project on this source led to the preparation of wood adhesives from the tannins extracted [20], the only drawback experienced to instead bring this source to industrial exploitation being the large range of raisins varieties containing very different percentages of tannins rendering rather random and irreproducible the percentage yield [20]. Another one is pomegranate (Punica granatum) peel tannin extract [21] which is re-ported to have antiviral (hepatitis B and herpes simplex) activity as well as being antidiabetic. Hydrolysable and condensed tannins, from Oak (Quercus robur), are also extracted on a smaller scale in Turkey and Poland. The tannin from Japanese persimmon (Diospyros kaki) has been extracted and its effect on diabetes studied [22].
Tannin extract from walnuts (Juglans regia) has been shown to be an antioxidant [23]. This extract has been shown to limit the severity of myocardial infarctus [24]. Red raspberry (Rubus idaeus) tannin extract was found to decrease the expression of the glycoprotein involved in the reception of fibrinogen and platelet activation with a decrease of almost 50% of platelet aggregation [25]. Equally the procyanidin-type condensed tannin extracted from Acacia senegal was shown in vivo to have anti-artherosclerosis and cardioprotective action, and reducing cholesterol [26]. Tannins extracted from thornless wild blackberry (Rubus ulmifolius) appears to inhibit the bacterial ion pumps in their effect against Helicobacter pylori [27]. Tannin from the european common barberry (Berberis vulgaris) [28] is a known veterinary antidiarrhoic. Tamarind (Tamarindus indica) seed husks also contain a high percentage (39%) of condensed tannins, used for nutritional and pharmacological uses. A considerable list of tannin-yielding plants in the Indian subcontinent can be found in the review of Kotia et al. [29]. There are in depth reviews of the effectiveness of tannins in the pharmaceutical and medical field [8]. However some of these reviews point out that notwithstanding the extensive test work of many researchers on the utility and effectiveness of tannins towards viruses and bacteria, not only the minimum inhibitory concentration (MIC) against the patogens, or other similar measures should be considered but also the minimum citotoxic concentration (MCC) of the tannin must be considered as there is no point to eliminate the attacking pathogen but damage also the patient if the MCC is not also determined or is shown to be too high [8,30], a measure that very few of the studies which have been undertaken have taken into account.
Thus, there is an almost infinite number of plants as sources from which tannins can be extracted. The more used commercial extracts such as mimosa bark tannin extract, quebracho wood tannin extract and chestnut wood tannin extract are produced in large yearly quantities, namely many thousands of tons of dry material. There is then a gradation of the quantities extracted, from a few thousand tons of more specific tannin extracts, such as cube Gambier, which is produced artisanally, down to very small quantities extracted when these tannins are for nutritional, medical and pharmaceutical applications. As regards the potential amounts of tannin that can be extracted yearly these run into millions of tons. This large potential is not realized, at least not as yet, as the number of extraction factories in the world is limited to satisfy tannins more traditional uses, such as leather making. However, new extraction factories have seen the light, but at a slow rate, in the last few years, supporting the hope that tannins may improve their range of industrial applications.
2.2 Localization in Plant Structures
Tannins are found in leaf, bud, seed, root, and stem tissues. An example of the location of the tannins in stem tissue is that they are often found in the growth areas of trees, such as the secondary phloem and xylem and the layer between the cortex and epidermis. Tannins may help regulate the growth of these tissues.
In all vascular plants studied so far, tannins are manufactured by a chloroplast-derived organelle, the tannosome [31]. Tannins are mainly physically located in the vacuoles or surface wax of plants. These storage sites keep tannins active against plant predators, but also keep some tannins from affecting plant metabolism while the plant tissue is alive; it is only after cell breakdown and death that the tannins are active in metabolic effects.
Tannins are classified as ergastic substances, i.e., non-protoplasm materials found in cells. Tannins, by definition, precipitate proteins. In this condition, they must be stored in organelles able to withstand the protein precipitation process. Idioblasts are isolated plant cells which differ from neighboring tissues and contain non-living substances. They have various functions such as storage of reserves, excretory materials, pigments, and minerals. They could contain oil, latex, gum, resin or pigments, etc. They also can contain tannins. In Japanese persimmon (Diospyros kaki) fruits, tannin is accumulated in the vacuole of tannin cells, which are idioblasts of parenchyma cells in the flesh [32].
3 Industrial and Laboratory Extraction Methods
Condensed flavonoid tannins are generally obtained from crushed bark or wood chips through countercurrent industrial hot water extraction (70°C–90°C) (Figs. 1 and 2), but not under any pressure. Small percentages of sodium sulfite or metabisulfite can be added, sometimes with even lower proportions of sodium bicarbonate to improve solubility of tannin oligomers of higher molecular weight and thus concomitantly increase percentage extraction yield. The sulfitation of tannins during their extraction, or after extraction, is one of the oldest and most useful reactions in the chemistry of condensed tannins. This process may be useful, but harmful if done excessively, depending on the end use for which the tannin extract is intended. Sulfitation allows the preparation of tannins of lower viscosity and increased solubility, which are therefore easier to handle [33]. After having passed through stainless steel tanks, a fine aqueous solution of tannin at very low concentration is first obtained, then concentrated to about 35% solids and spray-dried, or concentrated under vacuum to 86% concentration and bagged at 80°C at which temperature it flows as a very high viscosity mass to form a solid mass on cooling, the so-called “cast” tannin extract [34].
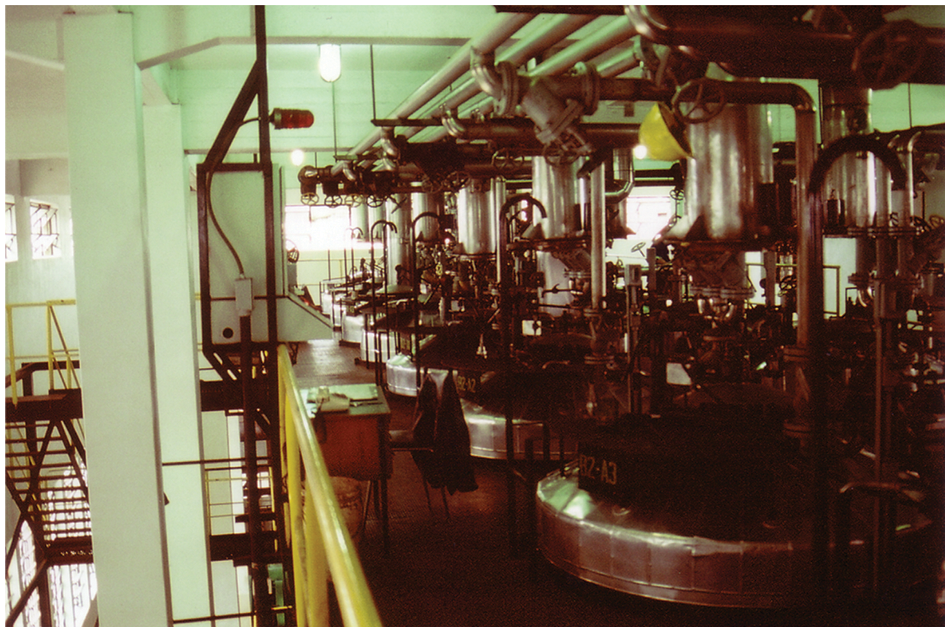
Figure 1: Example of an industrial tannin extraction factory of eight autoclaves (Courtesy of Tanac, Brazil)
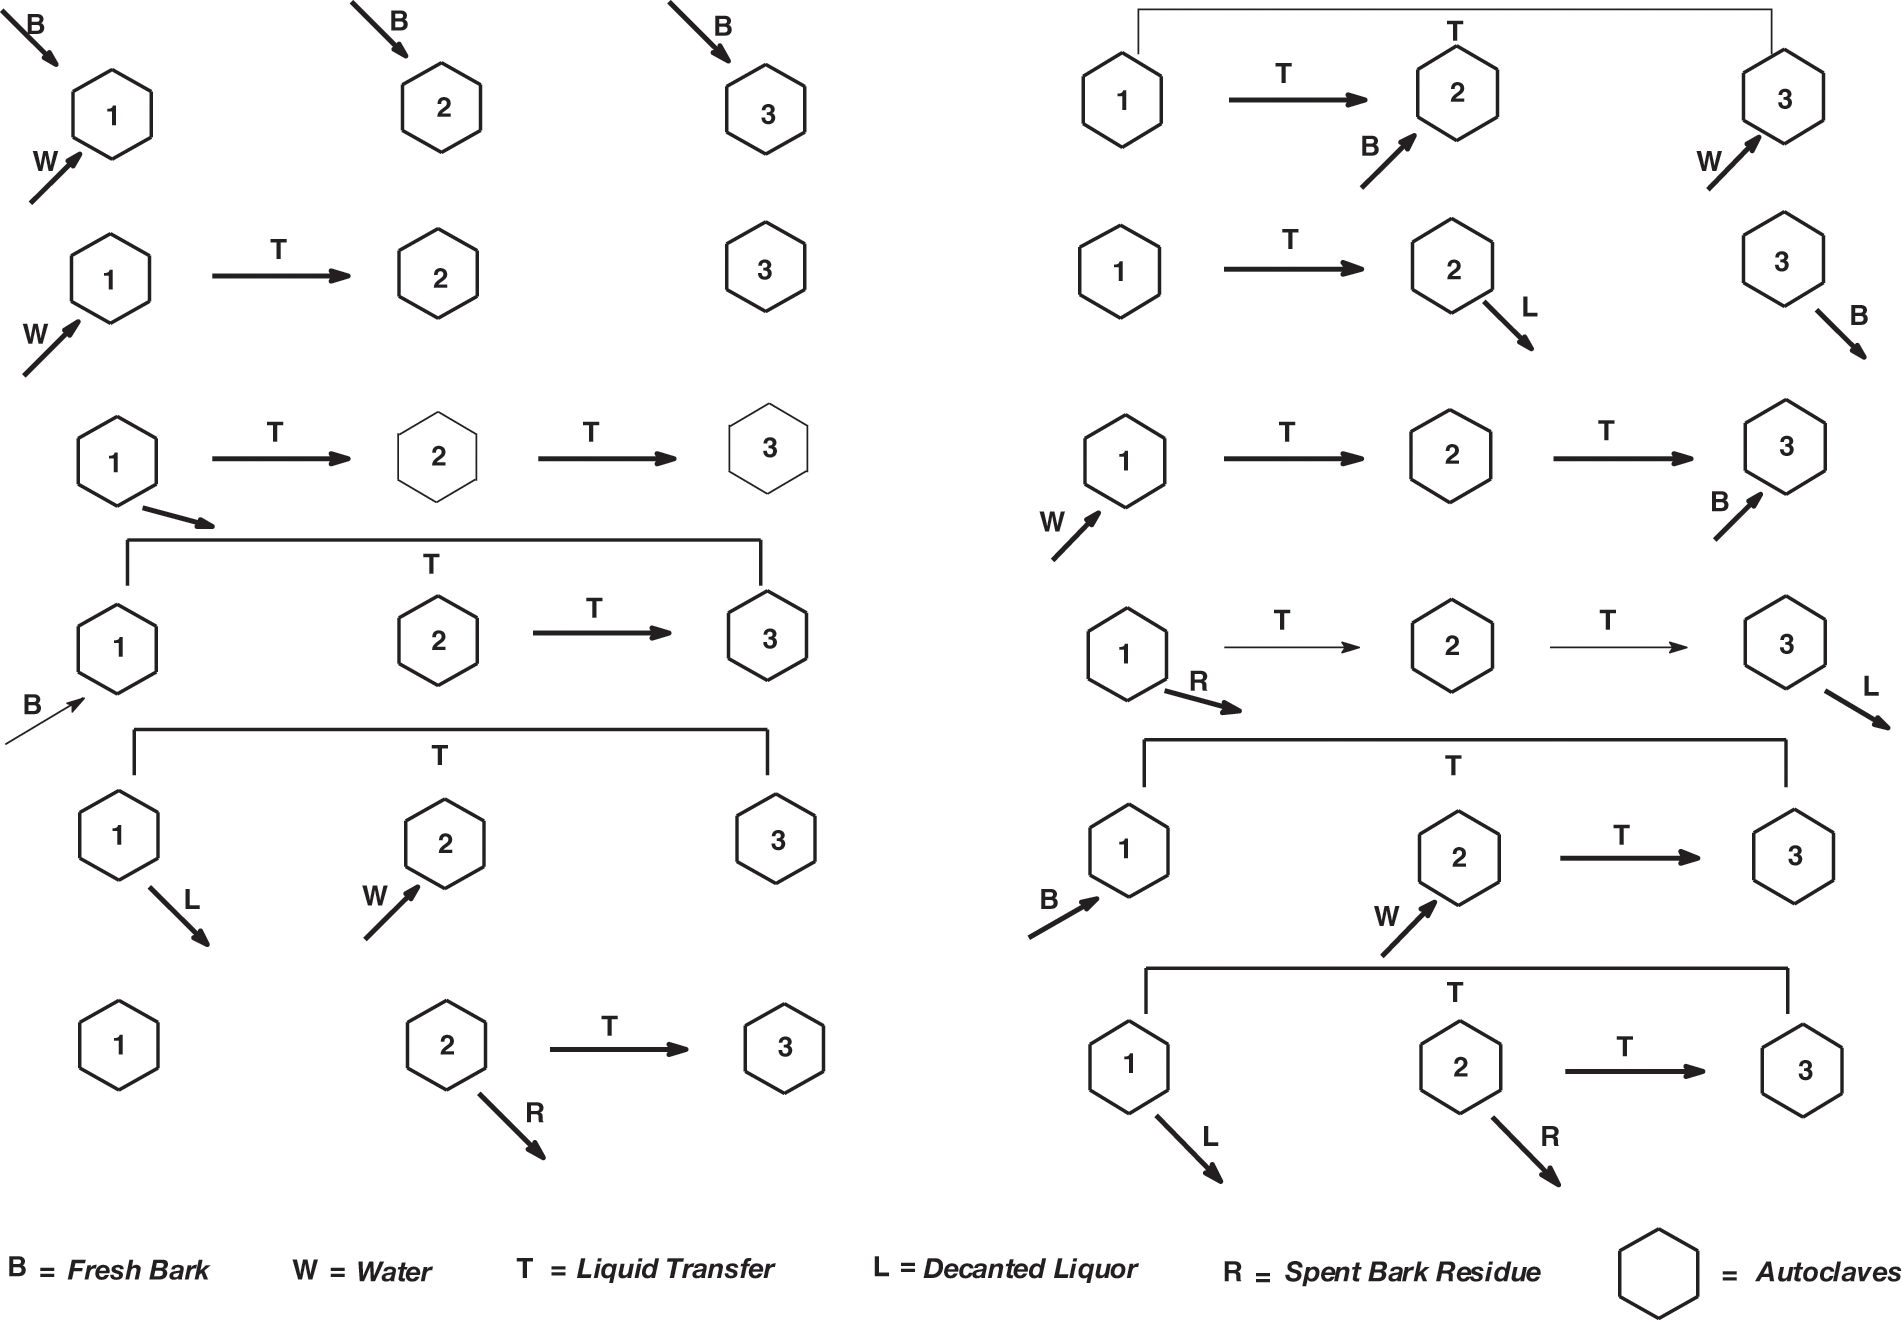
Figure 2: Industrial extraction flow diagram and materials movement in a three autoclaves tannin extraction factory
It is worth to examine Fig. 2 and discuss it in more depth. It describes the movement of materials in a three extraction tanks factory (that has existed) indicated as 1, 2 and 3, to simplify the understanding of the succession of steps used in an industrial countercurrent tannin extraction facility. In the first column on the left of Fig. 1 fresh bark chips (or wood chips, depending on which tannin) (B) is introduced in autoclaves 1, 2 and 3, and hot water (W) just in autoclave 1. After a definite period of time the solution of tannin obtained in Autoclave 1 is transferred (T) to Autoclave 2 and new fresh hot water is introduced in Autoclave 1 (W). On line three the liquid tannin solution in Autoclave 2 is transferred to Autoclave 3 and the liquid tannin solution in Autoclave 1 is transferred to Autoclave 2 while the spent bark chips in Tank 1 are discharged and sent to a filter press to recover the last solution of tannin from the wet chips. The solids left are recovered and used for different applications (read later). On line 4, the now empty Autoclave 1 is refilled with bark chips and the enriched tannin solution in Autoclave 2 is transferred to Autoclave 3. On line 5 the enriched tannin solution in Autoclave 3 is transferred to Autoclave 1 that now contains fresh new bark chips for further enrichment, followed by decanting the extracted solution from Autoclave 1 while adding fresh hot water in Autoclave 2. On line 6 the tannin solution in Autoclave 2 is transferred to Autoclave 3 for further enrichment while the spent bark chips (R) are discharged from Autoclave 2 and sent to a filter press to recover the last solution of tannin from the wet chips. The solids left are recovered and used for different applications (read later). The cycle then starts again.
In general the tannin solutions obtained with such a system are diluted, at between 1.5% and 2.5% extract solids concentration in water. They are then sent to evaporators that increase the concentration up to around 35% solids content. It is this final tannin solution that is generally spray-dried to obtain the tannin as a soluble powder then bagged in 25 kg bags.
The type of extraction process defined above has been used since the beginning of the 20th century for extracts of mimosa (Acacia mearnsii) and quebracho (Schinopsis sp.), which are the world’s two largest sources of commercial condensed tannin extracts. Today, the great majority of the tannin is spray-dried and delivered in 25 kg bags as an easily water soluble powder ready for use. The percentage yield of tannin extract is about 28%–33% of the original weight of the bark or wood for these two species, which makes the extraction very profitable. Procyanidin or prodelphinidin tannins present generally higher molecular weight fractions and can undergo internal rearrangements, resulting in lower extraction yields of about 12%–15%. Addition of a small percentage of urea to conventional solutions used for extraction has led to a higher yield level of 18%–25%, and thus increased their economic interest [34]. Such an approach has also led to higher extraction yield in quebracho tannin extract [35].
One of the points that has only been realized in the last 20 years or so, and only applied industrially even more recently, is that the commercial utilization of tannins for many applications rests on the economic aspects of their percentage extraction yield. Many approaches have been tried to improve extraction percentage yields. It must be considered that different yields for other tannins can still satisfy the economic equation. A good example of this is the hydrolysable tannin extract from Chestnut wood: their percentage yield is only of 5%–6% but this tannin giving very light colored leather is very valuable and the extraction becomes perfectly viable economically if the wood residue is used for producing panels such as hardboard [36] as it is in fact the case.
Most important is what to do with the wood and bark residues after the tannin extraction. Different industrial approaches have been taken, all equally valid and adapted, and still in industrial use. Mimosa bark in South Africa is generally squeezed in a filter press to recover the last amounts of tannin water solution and then the bark fiber is mixed 90:10 by weight with coal and burned to produce energy for the factory contributing to further extraction by generating electricity. In the case of pine bark in Chile originally the spent pine bark sold better than the tannin extract. This was so as the region where the tannin factory was located was a forestry area with numerous industrial tree nurseries, and spent bark makes an excellent mulch and soil cover for saplings, as instead the presence of tannin in the bark would have inhibited/slowed down the growth of the sapling. After tannin extraction spent quebracho wood in Argentina is instead used to produce furfural and ultimately furfuryl alcohol, very valuable materials [36]. All this is related to show the economical stakes in tannins extraction.
Apart the established industrial extraction routes there are many other works advocating different systems of tannin extraction. None of these is used industrially, however they are useful laboratory extraction methods especially where a proper countercurrent extraction equipment does not exist. Thus, placing comminuted bark in water containing sodium sulfite or metabisulfite, with small amounts of NaHCO3 and urea and heating this suspension at 70°C–80°C under vigorous mechanical stirring for a couple of hours yields a diluted solution of tannin extract that can be easily concentrated, thus imitating in a rather simple manner the industrial extraction methods and allowing some correlation of the laboratory result to the foreseeable industrial one [34].
Laboratory methods based on the same approach but rather using a diluted NaOH solution have also been presented with apparently good percentages extraction yields [36,37]. As interesting as these results may appear the potential drawback of this approach is that if temperature and conditions are not strictly controlled then while the percentage yield of extract is high, its composition is lower than expected in polyphenolic material, the NaOH having extracted a considerable proportion of carbohydrate oligomers, generally fragments of hemicelluloses.
It must be kept in mind that, at least in industrial scale extractions, there is a real balance between the extraction conditions and the percentage yield of extract but also of tannin in the extract. Thus the harsher the extraction conditions the higher is the yield of total extract, but over a certain temperature the lower is the percentage of tannin within the extract as the relative proportion of carbohydrates is higher and hence the percentage of polyphenolics in the extract is lower. At 70°C–75°C the total extract percentage yield is lower but the proportion of polyphenols is much higher, thus the tannin extract is of much better quality for certain applications such as wood adhesives, these latter set of conditions being a good compromise for tannin extraction. In the past extraction factories where the tannin extraction was carried out a lower, even ambient temperature existed, one of the authors has seen one of these in South Africa. They gave an extract of really exceptional quality with very little carbohydrates and very high in percentage of polyphenols, but the percentage yield in total extract was very much lower. Such factories do not exist anymore as uneconomical. It must also be pointed out that the industrial extraction process outlined above for condensed tannin is the same also for the main commercial hydrolysable tannins, and the conditions are mainly the same in the case of commercial chestnut wood tannin extract.
Equally, methods in which the extraction is performed by microwave heating of bark in suspension in water have been proposed. These types of extraction are effective, however, they are only adapt to laboratory practices [38]. The level of heating the solution is not properly controllable with the possible drawback that some tannin cannot be extracted due to internal rearrangements, self-condensation and other side reactions leading partly to insoluble precipitates and to such increase in molecular weight to render part of these insoluble in the extraction medium.
For extraction of tannins from medicinal plants the simplest techniques still used, quite effectively, are maceration and infusion [38]. Maceration is one of the primary techniques used for tannin extraction from medicinal plants.
Several other methods than the one described above do exist, again, mainly of interest at laboratory level. An excellent comparative review of their effectiveness, etc. of these with that of traditional extraction methods does exist [39] and the main ones are listed below.
3.2 Tannins Extraction by Ionic Liquids
The extraction with ionic liquids, preferably imidazolium-based, relies on their unusual properties combinations (negligible vapor pressure, high thermal stability and dis-solving capacity of a large range of plant chemicals [40]). The content of tannins in the extracts is reported to be high [41] but the solvent type used appears to be determinant for the percentage yield, this increasing with the solvent polarity [42]. A drawback is that when using water as solvent rather than organic solvents this method leads to rather acid pHs [43] with rearrangements leading to self-condensation to too high molecular weights and even to formation of insoluble phlobaphene precipitates limiting extraction effectiveness [34]. The addition of certain percentage of NaOH has been proposed as an alternative but this leads to the problems of extraction of hemicelluloses fragment as already outlined above. As the rate of extraction depends on the concentration of ionic liquids, the higher this is, the higher is the extraction yield, with the warning that over a certain ionic liquid proportion not further improvement appears to be obtained [44,45]. Ionic liquids are expensive, thus this method tends to be rather expensive for mass production.
3.3 Tannins Extraction by Supercritical Fluids
The principle of this method is based on the concept of critical point, which is defined as the highest temperature and pressure at which a pure substance can exist in a vapor-liquid equilibrium [46]. Above this point a fluid shares properties between a gas and a liquid, such as the typical weight of liquids with the penetration power of gases [47]. The most widely employed solvent is carbon dioxide (CO2). This is due to its desirable properties such as non-toxicity, non-flammability, non-corrosive nature, availability and low critical temperature and pressure (31°C and 7.28 MPa) [48,49]. The range of pressures and temperatures used for this fluid ranges between 10–65.5 MPa and 40°C–88°C. The use of a co-solvent is necessary as the percentage yield is poor if only CO2 is used [50,51]. This is due to the non-polar nature of CO2 as a solvent and the polar nature of most of tannins structures. The main advantages are the mild temperatures needed and the nontoxic solvent (CO2), moreover easily removed and avoiding oxidation. Conversely, the main drawback is the high cost of investment for the high pressures necessary [52].
3.4 Tannins Extraction by Ultrasound
The extraction of tannins by this technique is based on the formation, growth and collapse of micro bubbles inside a liquid phase submitted to ultrasonic cavitation [53]. The bubbles are induced by sound waves, with frequencies above 20 kHz, which cause mechanical vibrations into the plant matrix. These mechanical vibrations, can rupture cell wall tissues ameliorating the penetration of the solvent into the matrix and achieving higher amounts of tannin extracted [53,54]. No long extraction times are needed to achieve good extraction yields (below 1 h, this being an advantage). The increment of this parameter can lead to higher extraction yields and a higher proportion of tannin in the extract [55]. However, when the extraction time is increased above relatively high values, the extraction efficiency tends to decrease. There are works indicating that sonication after 30 min decreases the tannin extraction efficiency. This result was attributed to the possible degradation of the proanthocyanidins due to the increased temperature of the water bath, provided by the prolonged sonication time [56]. The main drawback is the lack of uniformity in the intensity of the ultrasounds.
3.5 Tannin Purification by Organic Solvents
Extraction by organic solvents, either industrially or in the laboratory, although giving higher yields, has proved to be expensive and unacceptable at the simple technological level of plant extraction. In addition, there are regularly percentages of other materials in the extracts, thus posing the problem of further purification of the tannin extract. In cases in which tannins are used for nutritional or pharmaceutical purposes, a secondary extraction, a purification with organic solvents is necessary and has for long-time been industrially used to remove the carbohydrates and simple sugars fractions and other impurities present in the extract, allowing the use of purified tannins for nutritional, pharmaceutical and medical purposes [31,57].
3.6 Some General Remarks on Tannin Extraction Methods
While all of the extraction approaches reviewed above yield reasonable amounts of tannins, the tannin extracts remain often contaminated with non-cellulosic sugars [58], the nature and amount of which are highly dependent on the tannin source and on the extraction process. Tannin impurities thus always need to be accounted for in the utilization of the tannin extracts as these will raise concerns for some applications, in particular in the pharmaceutical industry but also for some polymeric resin applications. In resin synthesis, sugar impurities alter the physical and rheological properties of the tannin extracts significantly. Namely, residual sugars largely increase the viscosity of the initial reaction mixture, thus limiting the possible extent of molecular weight build up under homogeneous polymerization conditions for the preparation of stage-B resins and adhesives. While purification methods do exist [58], a recent techno-economical study [59] of the industrial production of Norway spruce bark tannins has hinted to the preclusive cost increase of purification. In tannin extracts, sugar impurities are easily determined with acidic methanolysis, which consists of hydrolyzing the ester bonds that link flavonoids or simple phenols to sugars as in hydrolysable tannins, typically with anhydrous methanol at 85°C for 20 h [60]. The interflavan bonds are also broken by acidic methanolysis. Following acidic methanolysis, HPLC is conducted on the degradation products enabling the determination of sugars and phenolic units. Thyolisis can further provide finer details of the flavanol structures and completes acidic methanolysis [61]. Further research is thus needed to determine the minimum suitable purity requirement on a per application basis, to maintain both the environmental and economical interest of tannins as biomaterial sources.
The impact of tannins natural variability on the final tannin structure and purity is another major challenge to foster further industrial use of tannin in the materials industry. While some general trends are known–for example extracting tannins from barks generated from either dry or wet debarking–will lead to distinct extracts. To date, there remains a large gap of knowledge on the relationships between tannin extract structure, natural variability in the plant, harvesting and extraction technology and parameters. Surely a better grasp of this natural and process induced variability will go in favor of technology transfer to industry, which needs to rely on a consistent raw material supply.
A number of methods exist to determine tannin molecular mass and to characterize their structure and other characteristics once the tannin has been isolated, but some of these methods can also be used on raw tannin extracts to give information of interest. These range from simple and even rather primitive tests such as the gel time, to traditional colorimetric methods such as the Folin-Ciocalteu method, to more sophisticated instrumental analyses such as NMR and MALDI ToF spectrometries.
Solubility of tannin extracts is essential to the utilization of tannins in material synthesis, in particular for polymeric materials such as adhesives and foams. Indeed, tannin propensity to reactions will also hinge upon its solubility in the reaction medium. Solubility can be simply gravimetrically computed from the maximum amount that can be added to a solvent without causing precipitation. While tannins are typically water soluble [1,2], tannin derivatization can be used to tune their solubility in a variety of protic and aprotic solvents other than water [62,63]. For a more precise understanding of tannin solubility, Hansen solubility parameter can be computed by performing a series of solubility tests in solvents to determine the polar, dispersive, and H-bonding components of the total Hansen solubility parameters [64]. This information is particularly relevant for the production of tannin blends and for their use as macromonomers for reactions.
The gel time of a condensed tannin extract in presence of formaldehyde is a very simple test, used in industry and in research laboratories, to determine the reactivity of condensed flavonoid tannins and tannin extracts to make resins. It is a kinetic test that while rather simple and primitive allows to determine what type of condensed tannin one has to do with, when the extract composition is unknown as not analyzed already by more sophisticated techniques. It is a very quick test and can be done either at the natural pH of the tannin, or with the pH corrected to a defined value (generally 7). It is based on the very marked difference of reaction between tannins in which the very predominant A-ring is of resorcinol type such as for proribinetinidin/profisetinidin tannins (such as Acacia mearnsii and Quebracho types) and tannins in which instead phloroglucinol A-rings are greatly predominant such procyanidin/prodelphinidin tannins (such as pine bark tannin). It consists to test the time it takes to gel at 100°C a tannin 45%–50% water solution with addition of 8% paraformaldehyde fine powder.
For many resins this test is an essential measure of reactivity. Extensively used in industry and in research laboratories it is particularly simple to use and gives results easy to analyze [1]. It is the simplest test to distinguish between a more reactive procyanidin tannin extract and a less reactive profisetinidin-prorobinetidin one. Thus, it is not just useful for resins and wood adhesives, where reactivity is a paramount parameter, but is also the simplest test to distinguish the type and predominant structure of a condensed tannin. It uses very simple equipment, present in any laboratory and it can be carried out even in a kitchen. All is needed is a source of heat (electric plate or Bunsen burner), a beaker of 500 ml, a test tube, a spiral of thin metal wire and a stopwatch. The piece of wire must be of about 30 cm long and of very small diameter so that it is easily pliable to form a short spiral by winding it around a pencil so as to be able to fit it in the test tube. Water is placed in the beaker and brought to lively boiling. The tannin in a 45%–50% solution concentration in water is adjusted by addition of a 33% NaOH water solution to pH 7. About 10 grams of this tannin water solution, quite thick, is placed in the test tube, 8% paraformaldehyde fine powder is added to the tannin solution in the test tube. The wire spiral is then immersed in the test tube, but leaving a longish straight wire tail protruding from the test tube of about 15 cm. After 5–10 s of up and down movement to mix at ambient temperature the paraformaldehyde powder with the tannin solution, the test tube is placed in the boiling water simultaneously starting a stop watch. The wire spiral is moved fairly rapidly up and down in the tube. At first a decrease of viscosity of the solution is noticed due to the increase of temperature of the solution, but the condensation reaction has started and after between 1 and 4 min the solution gel solids. The gelling is sudden and very easy to perceive. As the solution gels the stop watch must be stopped and the time taken. The test is repeated 3 times, for very experienced operators twice is already enough and the time taken to gel is averaged. Profisetinidin/prorobinetinidin type tannins present at pH7 gel times of between 110 and 150 s. Procyanidin tannins instead, at the same pH gel in 35 to 50 s, allowing to distinguish well between the two types of condensed tannins.
Viscosity is an important physical characteristic of tannin extract solutions, as in some applications, such as in wood adhesives, determines both the wetting performance of the substrate as well as the capability of spraying the tannin solution. Viscosity depends from both the molecular weight of the tannin, of the hydrocolloid gums (fragments of hemicelluloses) present in the extract and the concentration of the solution. It is usually measured by synchronous rotating viscometers, such as the Brookfield type. In general the viscosity of tannin extracts in their native state is rather high for industrial application. Thus 50% water solutions of industrial mimosa tannin extract present a viscosity between 1200 and 1800 mPa.s while equivalent non-sulfited quebracho tannin extract presents viscosity in the 5000 to 6000 mPa.s. It is clear that under this condition systems to decrease the viscosity of the extract have been looked for. For quebracho a moderate level of sulfitation between 5% and 10% will decrease his viscosity to around 1500 mPa.s, while application of an acid plus alkaline hydrolysis system for mimosa tannin decreases its viscosity down to 300 mPa.s [65]. It is clear from these values that sulfited quebracho will need to be used at 45% solids content to be capable to be handled by the spraying gluing blenders in a wood particleboard factory while mimosa can be used with ease at 50% solids content, an advantage in wood particleboard. Procyanidin tannins have in general high viscosity, with pine tannin around 3000 to 4000 mPa.s, and thus needing to be sulfited to some moderate level (5% or lower).
A chemical test designed by Stiasny at the beginning of the 20th century to determine the type of vegetable tannin [66]. It consists of boiling the specimen in a solution of formaldehyde and hydrochloric acid, which causes any condensed tannins present to be completely precipitated while hydrolysable tannins and their fragments remain in solution. The test solution is obtained by extracting a fragment of the sample (a piece 4 by 4 mm) by refluxing, for 4 h, first in a 50% aqueous solution and then equal volumes of 6N hydrochloric acid, acetone and water.
The Stiasny number [66] is determined by using 0.2 g (oven-dry-mass) of tannin, 5 mL of 37% formaldehyde and 5 mL of 10 M hydrochloric acid solution which are mixed and heated under reflux for 30 min. The tannin extracts are recovered after precipitation and dried to a constant weight in an oven at 105°C. The Stiasny number is calculated and determined as follows:
Even under the best of conditions this test is difficult to use. Since most vegetable tannins contain both hydrolysable gallic/ellagic and condensed tannins, it is frequently impossible to judge the colors and precipitates with any degree of certainty. It is generally used in condensed tannins to determine how many sites reactive with formaldehyde are free to react. The higher is the Stiasny number the more suitable to make resins is the tannin. The test is very unreliable, and even though the Stiasny precipitation number has been commonly used to estimate the amount of reactive tannin towards formaldehyde, particularly in adhesive applications, this estimation alone is insufficient. Tannins with a high Stiasny number values in the 80 and 90 s while indicating a high phenolic content and being generally good for resins preparation are not always performing well for resins preparation, while some with a medium value of the Stiasny number may still be sometime be suitable for resins preparation.
Thermogravimetric analysis (TGA) and its derivative (DTG) are used to observe the variation of sample’s mass corresponding to temperature or time. It is used to determine the thermal stability and degradation of tannin extracts. The temperature range used is generally 25°C–700°C at a heating rate of 20°C/min. Description of tannin results for this technique, although not widely used in this field, do exist [67]. In general in DTG of condensed tannins two peaks are observed, a sharp one at around 95°C–110°C and a second one, wider but less high, at around 250°C–270°C. The peak in the 95°C–110°C range indicates often that thermal stability is general larger for sapwood tannins than for bark or heartwood tannins, for the latter two of which this peak is present towards the lower values of this range. This suggest that bark tannins may be slightly more susceptible to thermal degradation, possibly due to their low average molecular weight and degree of polymerization. The wide peak at the higher temperature, stating in general around 200°C–210°C are due to the decomposition of the intramolecular C-O bond of the cyclic ester in the flavonoid C ring or to the break-down of interflavonoid C-C bonds. The trend in tannin extracts is that the greater the purity of the tannin, hence the lower the proportion of carbohydrates in the extract, the higher is its thermal stability [68] with raw tannin extracts with high carbohydrate proportions starting to degrade at around 150°C while highly purified one with less than 5% carbohydrates starts to degrade towards 200°C.
Differential scanning calorimetry (DSC) analysis is used to determine the thermal behavior of polymers. Glass transition temperature (Tg) of the tannins is obtained in this method. Cure characteristics of tannins with formaldehyde can be acquired by the technique. The temperature range used is generally from room temperature (between 20°C and 30°C) to 250°C at a heating rate of 10°C/min. Gaugler and Grigsby (2009) compared the DSC results of a number of different tannins, namely quebracho tannin, crude and highly purified radiata pine bark tannin [68]. Initially on heating through to 100°C all samples show a broad endotherm attributable to loss of adsorbed water. On further heating the processes of degradation become apparent with all tannin types showing a general exothermal increase upon heating above the onset temperatures for degradation established by TGA. Analysis using DSC did not appear to distinguish differences in exothermal behavior for initial degradation between crudes and purified extracts.
Dynamic mechanical thermal analysis (DMTA) is used to determine the viscoelastic properties of materials. Curing performance of tannin adhesives can be revealed in this analysis. The temperature range used is generally from room temperature (between 20°C and 30°C) to 200°C at a heating rate of 10°C/min. This technique is now used to very good effect to determine the rate of curing of a tannin adhesive by the more shifted is the slope of the curve towards lower temperatures, its gel point and the highest strength achievable in comparison to other adhesive formulations by obtaining the maximum value of its Modulus of Elasticity (MOE). The first use of these techniques in such a manner was in 1997 [69] to compare synthetic adhesives with tannin-based adhesives as regards cross-linking, the theoretical basis being established for this use. Expected behaviour of elastic modulus (G’) and loss modulus (G”) is a function of a variable, applied oscillatory strain frequency, or variable temperature at fixed frequency. The position of the cross-over point of the G’ and G” curves will determine the apparent shape of the total MOE modulus curve [70]. The techniques have been used for innumerable other articles on tannins formulations and types for the last 20 years. Such a technique has also been used to greatly simplify the determination of the TTT and CHT diagrams for synthetic as well as for tannin adhesives [71].
4.8 Size Exclusion Chromatography (SEC) and Gel Permeation Chromatography
Size-exclusion chromatography (SEC) and Gel permeation chromathography (GPC) are good methods for tannin analysis for the identification of the tannin-containing fractions and to help determine their average molecular weights and molecular weight distribution [72]. However, recent findings in mass spectrometry of natural plant polyphenols, have demonstrated that this methodology is more adapt to tannins structural analysis than SEC [17,73]. However, SEC and GPC are technologies more easily available in laboratories and have been used even in the recent past [74].
4.9 Folin-Denis (FD) and Folin-Ciocalteu (FC) Methods
These methods (FD [75] and FC [76]) rely on phenolics interacting with phosphomolybdic/phosphotungstic acid (PMoW11O40)4−). A complex blue-colored is thus formed which absorbs around λ = 760 nm. The addition of lithium sulfate constitutes the FC improvement on the FD method by avoiding all undesirable precipitates [77]. The side reaction with several oxidable chemicals such as carbohydrates, ascorbic acid and even with some amino acids, is the drawback of these methods, especially when carbohydrates are present in the extract in fairly high proportions. This is the case for raw industrial extracts, where such side reactions interfere on tannin determination [54]. Proteins interference is minimized by precipitating them by pretreating the tannin samples with a trichloroacetic acid/acetone solution [78]. Several other non-phenolic compounds also occurs that are capable of affecting the measurements. Polyvinylpolypyrrolidone addition is the best way for eliminating the interference of the great variety of non-phenolic species capable of interfering with these analysis methods. This is the case because polyvinylpolypyrrolidone precipitates polyphenols by binding to them. Comparing a FC test before and after polyvinylpyrrolidone addition allows the determination of the extract polyphenols content [79].
4.10 Alternative Tests by: Rhodanine, Potassium Iodate, Sodium Nitrite, Butanol-HCl, Vanillin
Many other less used tests, some with some drawbacks, to test tannin structures do exist. Quantification of the gallic acid released by hydrolysis of gallotannins can allow determination of the tannin proportion either by (I) rhodanine test [80,81] by enzymatic anaerobic total hydrolysis of the tannin [81] and UV absorption of the complex formed, or (ii) by a potassium iodate test [82] by reacting with the methyl gallate formed by methanolysis in acids being present and UV absorption determination of the colored complexes so formed [83]. An equivalent test, the nitrous acid test, to analyse the ellagitannins proportion by colorimetry of the free ellagic acid blue colored complex with sodium nitrite it is also used [83]. For flavonoid condensed tannins a test based on the oxidation and cleavage of all inter-flavonoid linkages obtained by treating the tannin with butanol in concentrated HCl and measuring the flavonoid monomers formed by absorbance does exist [84]. This test has the unfortunate drawback of underestimating the proportion of some low color proanthocyanidins [84]. The vanillin test is based on its aldehyde group reaction with condensed tannins. The colored products formed are measured by absorbance. The difference in reactivity of different flavonoid sites causes some underestimating [85,86] and some further grave drawbacks under different testing conditions causing that the results obtained vary as they are depending from the structure of the tannin under examination [85,86]. The majority of these methods do present some drawback or other causing them to be less used than the other methods presented in this review.
5 Instrumental Structure Determination Methods
13C NMR spectroscopy is an excellent method for the characterization of tannins. It does allow to identify with a certain ease the type of condensed tannins B-rings (catechol and pyrogallol) [87,88]. The analytical ease of using 13C NMR is due to the fact that well definite shifts represent characteristic groups of the flavonoid tannin units [89–91]. A number of commercial tannin structures have been determined using this technique with clear results about their differences [88]. Such a technique has shown for a long time already to be capable to determine and differentiate tannin reactions and rearrangements and their extent both in solution and in colloidal state [89–91].
It must be pointed out that as regards NMR the best approach is to use CP MAS 13C NMR of the solid state of the tannin extract as this is reasonably rapid. This is advisable as the 13C NMR of the tannin in solution is feasible but takes a long time and many thousands transients, at least 10 thousand transients, to obtain a decent spectrum, in general an overnight scan of 10 h is sufficient but for some tannins even longer scans are necessary.
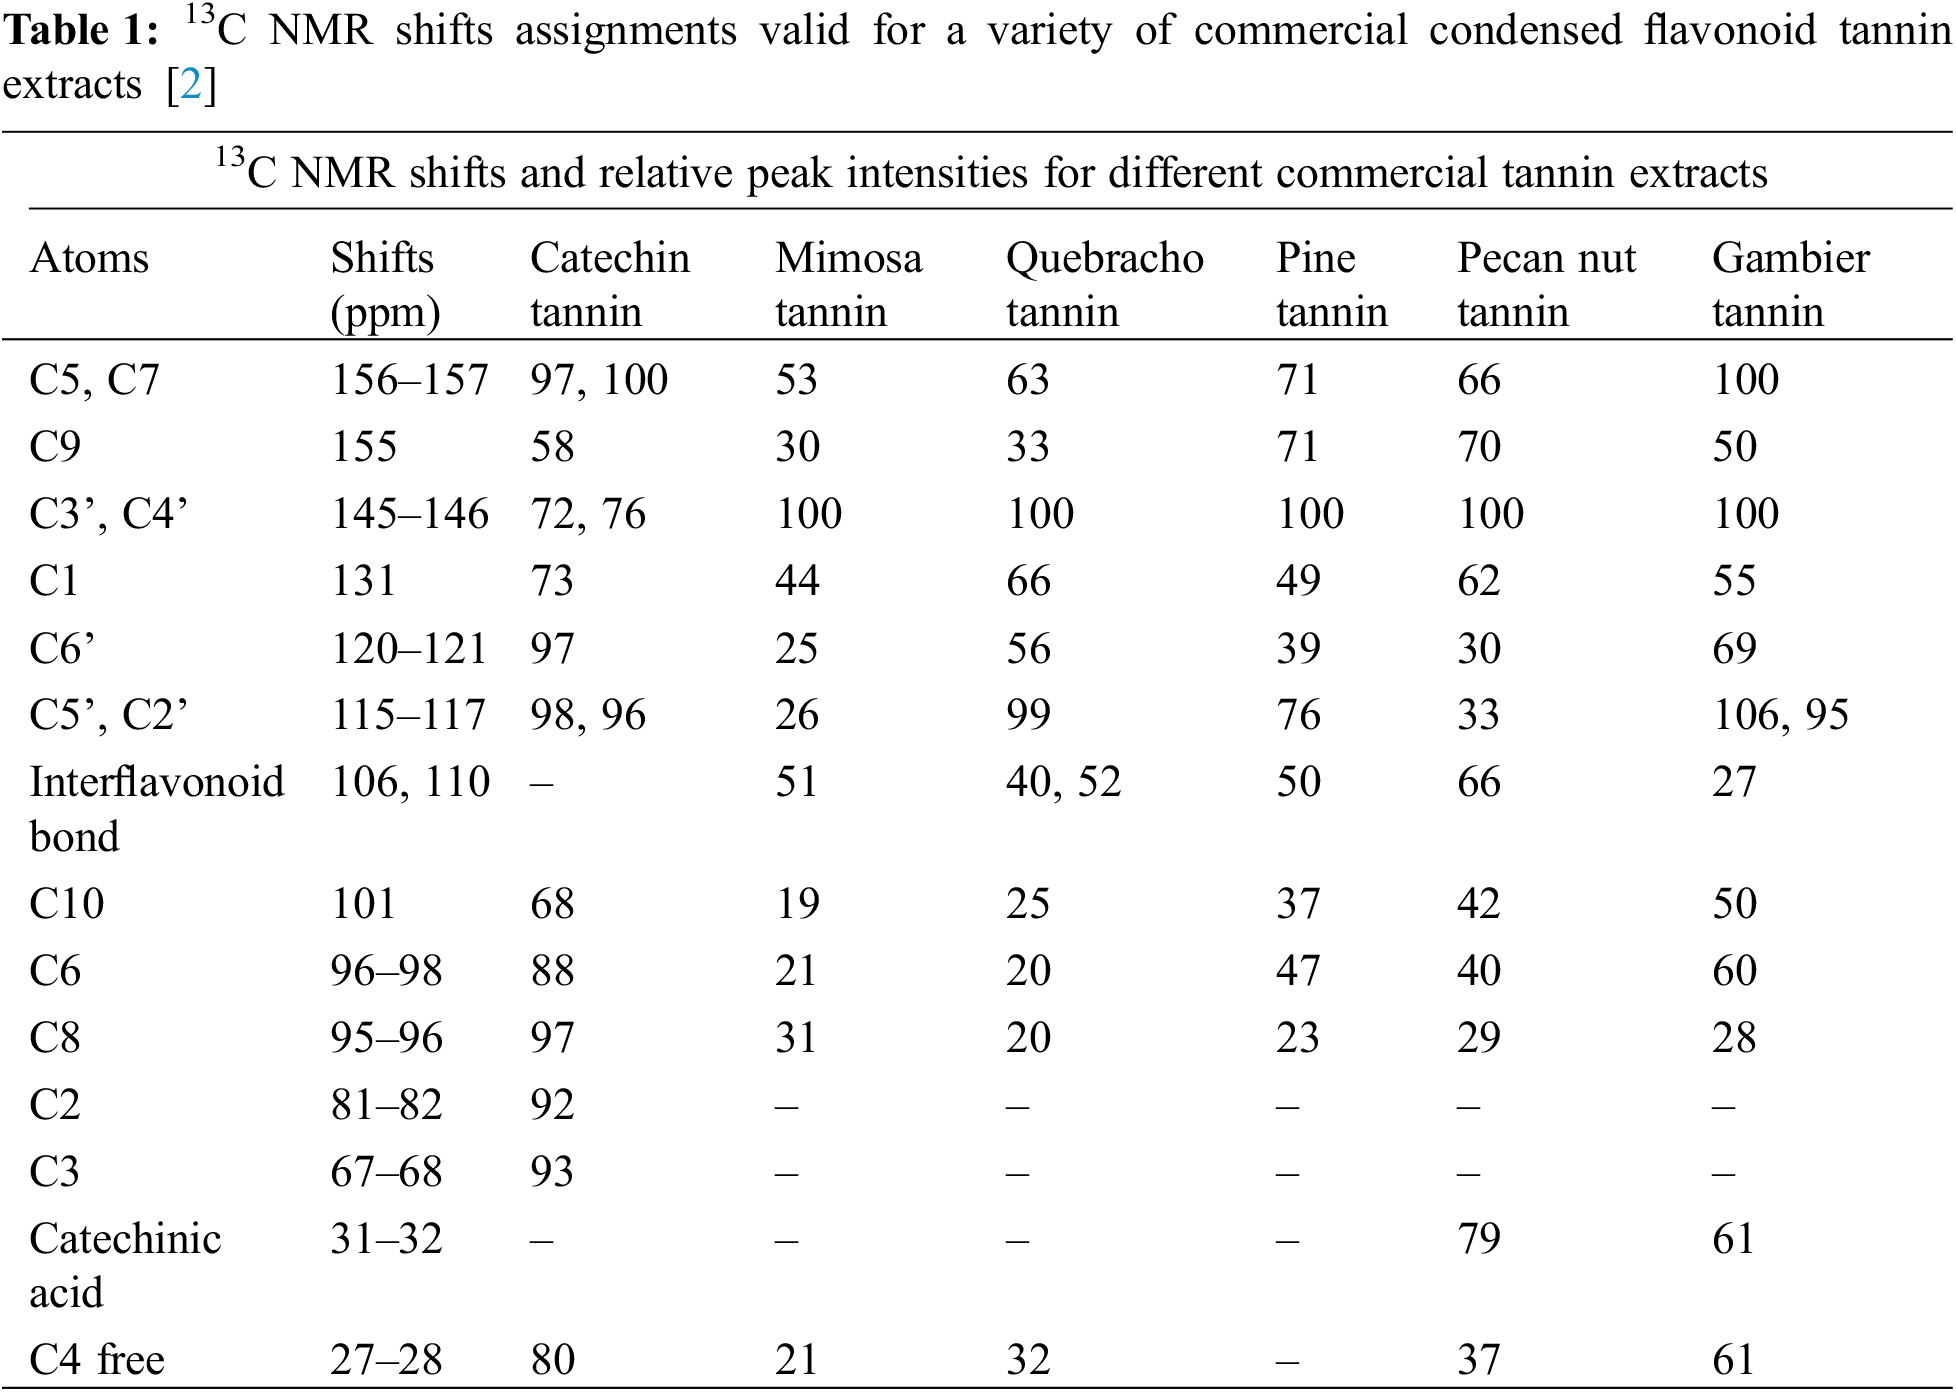
This is probably the instrumental analysis method most used and adapt for tannins structural determination. A considerable amount of literature on this technique applied to tannins has been published, within several reviews on the subject [2,92–94]. In this review only a short, simplified overview of this technique possibilities are given. This instrumental analytical approach does show quickly and directly the important structures and characteristics of condensed flavonoid tannins even when in concentrated solutions [2,92–94] or in solid phase. Relevant properties are quite different from condensed tannin to condensed tannin such the (1) the robinetinidin-fisetinidin units relative proportions vs. the catechin-epicatechin units, (2) the tannins different number average degree of polymerization (DPn), (3) the tannin proportion of open heterocycle units, (4) the tannin level of branching, (5) the flavonoid repeating units pyrogallol/catechol B-rings ratio. All these are of fundamental importance to understand each condensed tannin characteristics to determine for what applications it is suitable. First, the relative 13C NMR peak intensities trend which characterize polyflavonoids different carbons which does permit the identification of the differences among various tannin extracts that are of significance. Very sensitive shifts which indicate directly the A-rings reactivity and moreover indirectly the tannin degree of polymerization as well are the flavonoids A-rings C6 and C8 free un-reacted sites which present respectively shifts at 96 to 98 ppm and 95 to 96 ppm (Fig. 3, Table 1). The NMR distinguishes two main classes of condensed tannins: (1) tannins where these two shifts present a lower intensity, mimosa and quebracho tannins being examples, and (2) tannins where these two peaks present a much greater intensity, characteristic of procyanidin type tannins, these being an example. In these latter ones as the A-ring has two –OH groups, its reactivity is much greater, pine bark, pecan nut and cube Gambier tannins being relevant examples of this class. For example, mimosa tannin presents a total free C6 and C8 sites shifts of much higher intensity than quebracho tannin, indicating a lower degree of polymerization, viscosity studies confirming this observation. Moreover, the intensity of the free C8 shift is much higher inferring that the proportion of C4-C8 interflavonoid bonds is lower than for quebracho, confirming a degree of polymerization which is lower [95] (Fig. 3, Table 1). Thus, mimosa flavonoids are mainly linked C4-C6, while presenting only 13%–15% of C4-C8 interflavonoid linkages, while quebracho still presents flavonoid units mainly linked C4-C6 but also possess a greater C4-C8 linkages (20% or higher) proportion [96]. Quebracho higher degree of polymerization and higher proportion of C4-C8 linkages might also indicate more branched tannin structure than in mimosa, although in this latter the confirmed presence of the so-called “angular tannins” may contradict such a deduction.
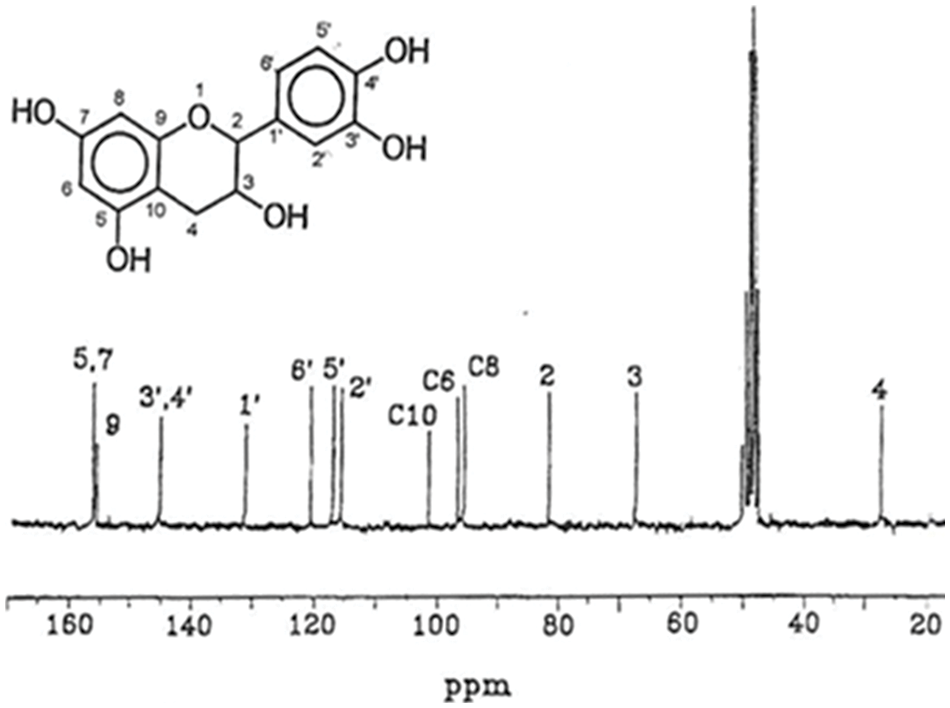
Figure 3: 13C NMR shifts distribution of a pure catechin flavonoid monomer from a condensed tannin [2]
C4-C8 interflanoid bonds are the predominant interflavonoid linkages in procyanidin-type tannins as shown by the higher intensity of the free C6 site shifts. A lower degree of polymerization is indicated by the higher intensity of the free, unreacted C6 and C8 sites shifts. An example of this is Gambier tannin where roughly 50% of its composition is just catechin monomer, where the high intensity of the free C8 site shift confirms this tannin lower average degree of polymerization. The lower sensitivity of the 110 ppm shift confirms this, indicating that in procyanidins both C4-C6 and C4-C8 occurs as interflavonoid linkages. The lower degree of polymerization of gambier tannin is also confirmed by this peak rather low intensity. Conversely, pine bark and pecan nut tannins present a higher intensity of this same shift confirming that their degree of polymerization is much higher. Moreover, its lower intensity in predominantly fisetinidin-robinetidin type tannins, such as mimosa and quebracho, indicates that their number average degree of polymerization (DPn) is lower, at least through linkages through their A-ring sites, as they present a much lower proportion of this type of A-rings. The intensity of the 27–28 ppm free, unreacted C4 site shift is also in line with the above. What presented above is in line with the respective viscosities of these tannins, also inferring their lower or higher linearity and branching.
The relative intensities of the C5 and C7 site shifts at 156–157 ppm assigned to the aromatic C-OH are also linked with what discussed above. The 156–157 ppm peak is rather sensitive as regards its intensity. It allows a qualitative appreciation of the proportion of phloroglucinol-type A-rings present, hence also of procyanidin-type units within the tannin (Fig. 3, Table 1). The higher is the proportion of catechins in the tannin the higher this peak is. For example, it is much higher in gambier tannin contributing to confirm this tannin low degree of polymerization.
Thus, 13C NMR analysis can predict several characteristics of a tannin, such as its re-activity with aldehydes, as the higher is the proportion of free sites on phloroglucinol-type A-rings the higher is the tannin reactivity, confirmed also by the gel times of the two different types of condensed tannins, although their respective degrees of polymerization must also be taken into account as they also influence reactivity.
A worthwhile insight into the characteristics of procyanidin tannins flavonoid units B-rings can also be gathered by 13C NMR [92]. The 120–121 ppm (C6’) and at 115–117 ppm (C5’ and C2’) sites shifts allow to determine the proportion of pyrogallol-type B-rings. The sum of the shift intensities of these peaks and of the C5’-C2’ peak indicate that in gambier and quebracho a lower proportion of pyrogallol B-rings occurs. Conversely, in pecan nut tannin pyrogallol-type B-rings are in much higher proportion, while pine bark tannin is an intermediate case. The interpretation of the C6’ and C5’-C2’ peaks is nonetheless complicated by the peaks of the C4-C6 and C4-C8 interflavonoid linkages because the C6 and C8 belonging to fisetinidin and robinetinidin occur in the same region of the spectrum. Consequently, this type of C4-C6 linkage can be observed as a low intensity peak at a shift of 121 to 123 ppm, while the C5’-C2’ signal is superimposed to the C4-C8 peak which then appears to be more intense.
There are two other regions of the spectrum that give some information of interest. The first one of these is the flavonoid C9 site peak at around a 155 ppm shift value: the higher is this peak intensity, the higher is the proportion of the closed form of flavonoid heterocyclic rings (Fig. 3, Table 1). This peak is relatively higher in procyanidin tannins where cleavage of the interflavonoid linkage by any mean is easier, while it is relatively smaller for fisetinidin-robinetinidin type tannins where the interflavonoid linkage is instead rather difficult to cleave, or it is not cleaved at all, but where conversely it is easier to achieve heterocyclic ring opening. As in tannin extraction heterocycle opening is not extensive this band is very sensitive to detect heterocycle opening.
Between 60 to 90 ppm the carbohydrates, monomers, dimers and oligomers in the tannin extract transmit. These signals are superimposed and often mask the C2 and C3 tannin flavonoid signals which instead can be observed clearly in the spectrum of pure catechin.
A 13C NMR study of tannin resin intermediates detecting the modifications introduced to prepare them has also been published [2,89,90].
Following the successful use of this newer spectroscopy to clarify lignin structures 31P NMR spectroscopy has also been applied to tannins analysis [97–101]. This approach has allowed to determine details of gallotannins, and ellagitannins, and condensed tannins structural details have been determined and clarified by this technique both qualitatively and quantitatively [99–101]. Phosphorylation of all the tannin free –OH groups with 2-Chloro-4,4,5,5-tetramethyl-1,3,2-dioxaphospholane is first carried out. The signal assignments pertaining to different hydroxyl groups are dependent on predetermining each of their particular surroundings gleaned from analysis on model compounds, and by adopting a suitable internal standard that does not overlap with other groups signals of the tannins. The tannin structure is then determined when the signals assigned to the model compounds have been confirmed. This method is particularly useful to quantify the amount of aliphatic, aromatic and total OH groups, which can be instrumental in synthesis when tannins are considered as reactive macromoners for the preparation of higher molecular weight polymers or simply tannin derivatives. The monitoring of OH groups thus enables the determination of degree of substitution/per flavonoid structure enable some degree of stoichiometric control over desirable synthetic reactions.
A UV spectrophotometric method for the determination of the total phenolic content of both polyflavonoid and hydrolysable tannins has also been presented [102]. This method when compared with the standard methods used today for the determination of tanning material in tanning extracts for leather manufacture gave good results. This because in narrow concentration ranges the correlation between optical density and phenolic concentration was found to be linear. Conversely, in wider concentration ranges exponential correlations satisfactorily fitted the experimental data. This method was first developed by Roux in 1951 by measuring the tannins phenolic chromophores optical density at 280 nm where UV spectra show a clear peak. It is a method based on the establishment of a prior calibration curve [96] (Fig. 4). Commercial tannin extract powders of mimosa (Acacia mearnsii, de Wildt) bark were used to develop the method. Three solutions were prepared a follows:
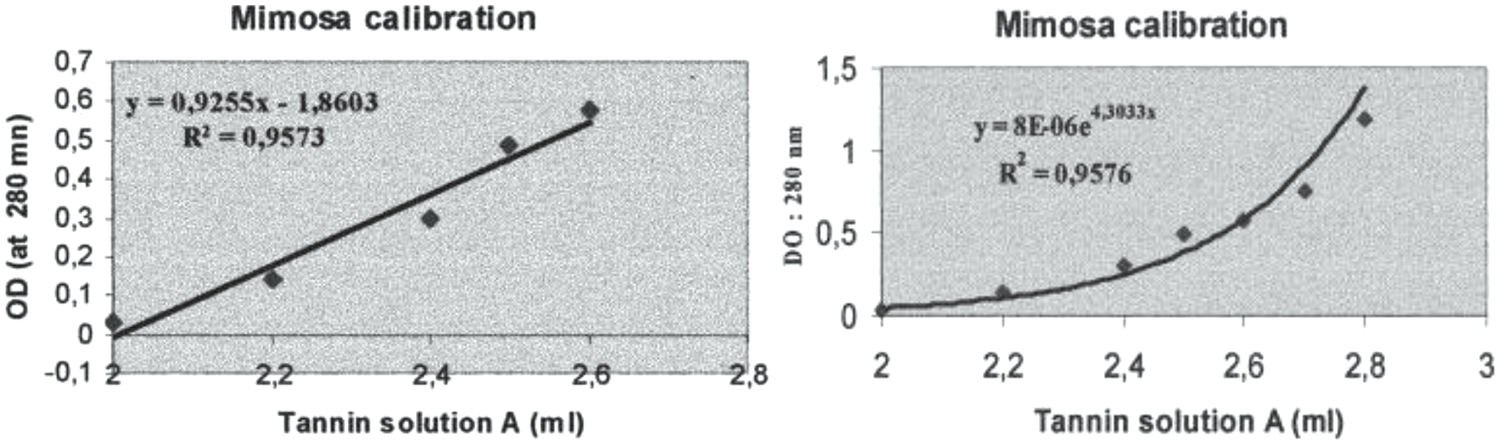
Figure 4: Linear regression analysis of the UV optical density (OD) at 280 nm of water solutions of polyflavonoid mimosa tannin extract as a function of (Left) tannin concentration in a narrower range of concentrations, and (Right) in a large range of concentrations [96]
1. Zeroing/standardization: 0.042 g benzoic acid in 100 ml distilled water. This solution is then diluted: 2 ml solution to 10 ml water.
2. Preparation of a base solution of tannin (solution A): 1 gr commercial mimosa tannin extract of known composition is brought into solution in 1000 ml of distilled water in a glass measuring flask.
3. Preparation of a 0.2% solution of sodium bisulfite: 0.2 g sodium bisulfite are brought into solution and the solution brought up with distilled water to 100 ml volume in a glass measuring flask. This solution is used for stabilizing to air oxidation tannin solution A.
After this the calibration curve is established by taking between 2 ml and 2.8 ml of the tannin solution A diluted with 50 ml of the 0.2% sodium bisulfite solution added of 50 ml of distilled water. This mix is then put in a 1 cm thickness quartz cell against the zero point standard solution put in an equivalent quartz cell. The optical density (OD) is then measured in absorbance at 280 nm on a UV spectrophotometer. The type of results that can be expected are shown as an example in Fig. 4 for commercial mimosa tannin extract.
Matrix-Assisted Laser Desorption/Ionization Time-of-Flight (MALDI±TOF) mass spectrometry is a method particularly adapted to examine polyflavonoid tannin oligomers. An example of such spectra is shown in Fig. 3. It can determine aspects of the distribution, structure and characteristics of condensed tannins otherwise too difficult to determine by other techniques. The application of mass spectrometry to large molecular weight oligomers has been much expanded by this technique and has shown itself to be a good method to characterize both natural and synthetic polymers [103–107]. Molecular fragmentation of samples by laser irradiation is moreover greatly reduced by embedding the samples in a light absorbing matrix. Consequently, intact molecules of a mixed sample are desorbed and ionized together with the matrix and are analyzed in a mass spectrometer. The technique is paired with time-of-flight (TOF) mass analyzers. Thus, the advantage of TOF+MS is that it is able to provide a complete mass spectrum of mass separated molecules per spectrum, for an unlimited mass range detection, and for the small amount of sample needed.
By MALDI ToF the distribution and type of condensed tannin oligomers in their native extract can be determined with relative ease [17]. The two main commercial tannins, namely quebracho wood tannin extract and mimosa bark tannin extract (Fig. 5) have been analyzed by this technique, as well as some of their modifications introduced for a number of different applications. MALDI analysis of quebracho tannin extract, for example, shows the degree of polymerization of its oligomers series separated by repeating mass units of 272.3 (linked fisetinidin) and 288.3 Da (linked robinetinidin or linked catechin) clearly showing that it is a predominantly profisetinidin-prorobinetinidin tannin. Furthermore, quebracho tannin flavonoid monomers up to ten linked flavonoid unit oligomers have in this way been detected and some idea of their relative distribution gleaned [17]. Equally, mimosa tannin extract has been examined in the same manner and the predominant repeating unit was found to be of 288 Da. This shows that mimosa is a robinetinidin tannin predominantly. From the finer structure of the spectrum repeating units of 273 Da (fisetinidin), 288–289 Da (robinetinidin and/or catechin) and of 305 Da (gallocatechin) were also shown to occur, but in lower proportions.
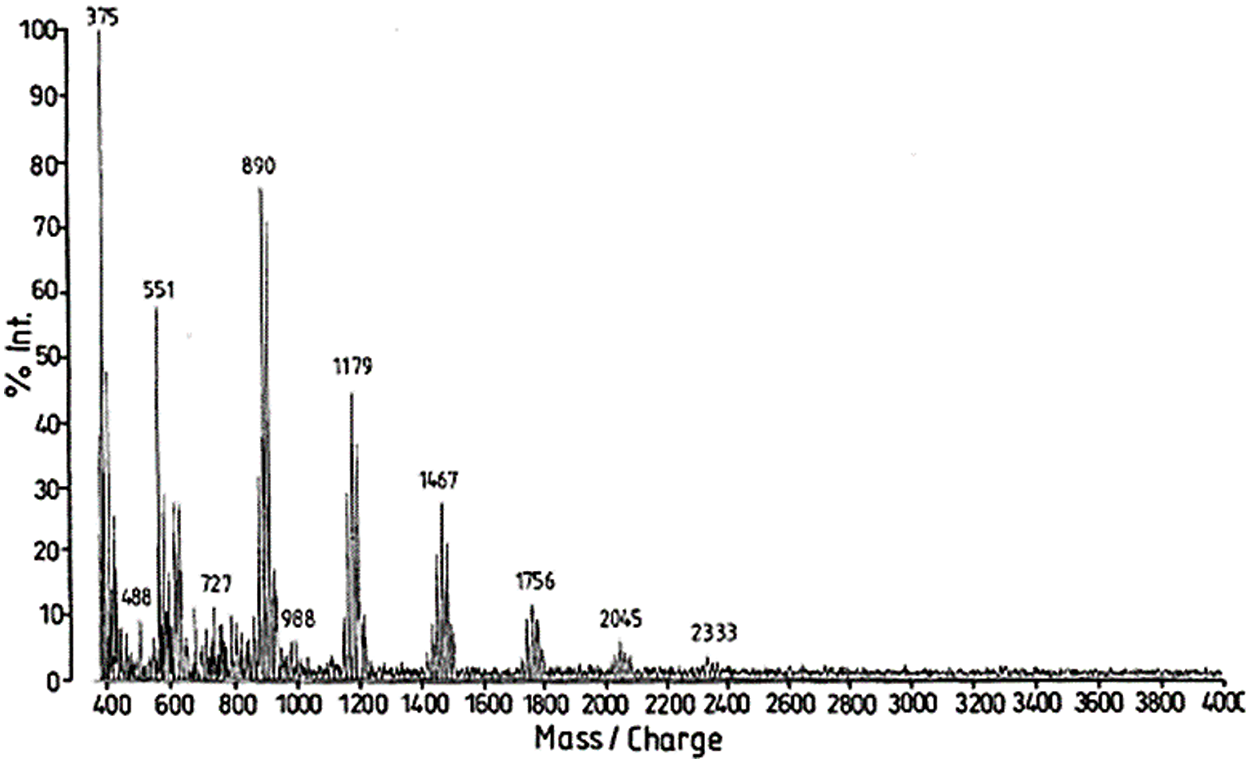
Figure 5: MALDI ToF spectrum of mimosa tannin extract with the peak groups representing a dimer (602 Da in Fig. 2b), a trimer (890 Da), a tetrameter (1179 Da), a pentamer (1467 Da), a hexamer (1756 Da), a heptamer (2045 Da), and an octamer (2333 Da). Within each of these groups of peaks one can observe details of the fine structure of the spectrum showing that repeating units of 273, 289 and 305 Da are present in the oligomers of the tannin indicating that all four types of unit (fisetinidin, robinetinidin and/or catechin, gallocatechin/delphinidin) participate to this tannin oligomers [17]
This technique hence showed that: (i) mimosa tannin is predominantly composed of prorobinetinidins while quebracho is predominantly composed of profisetinidins, that (ii) mimosa tannin is more branched due to the presence of a high proportion of ‘angular’ tannin structures while quebracho tannin is almost completely linear. The differences in the water solution viscosity of these two tannins are also partially due to the contribution of such structural differences. (iii) The interflavonoid link is more easily hydrolysable, and does appear to sometime hydrolyze in quebracho tannin and profisetinidins, as a consequence in part of its more linear structure, this being a confirmation of NMR findings that quebracho may be subjected to polymerisation/depolymerisation equilibria. The decrease in viscosity of quebracho tannin when subjected to acid/base treatments to prepare tannin adhesive intermediates of lower viscosity appears then to depend not only on the partial hydrolysis of the carbohydrates in the extract but also from some degree of hydrolysis of the tannin itself. This does not appear to occur in mimosa tannin due to the stability of its interflavonoid link. (IV) The distribution of tannin oligomers, and the number average degree of polymerization determined by MALDI ToF compares favorably with the same determined by other techniques. Since this initial work [59] many others on the structure of a number of different tannins have been carried out. Thus, the oligomers sequence and distribution of several condensed flavonoid pine bark tannins and pecan nut membranes tannin [17,108–112], and the structures of a number of hydrolysable tannins such as chestnut, tara, sumach, etc., references [111–115] have been determined. Equally, the discovery of carbohydrate chains of various lengths linked to condensed tannins is also due to this technique [116]. The explanation of the mechanism of African tannin exudates as total bio-hardeners for tannin adhesives has also been found by this technique [117,118]. It is also this analysis technique that has allowed to find that proteins such as collagen and soy re-act covalently with tannin extracts and not only by secondary forces association. The formation of a relatively small proportion of covalent and ionic linkages between a tannin and some protein amino acids appear to occur even at ambient temperature but at a higher temperature such as up to 80°C the proportion of covalent linkages increases to such a considerable extent that the ionic bonds do disappear [119–125]. The linkages between the two materials appeared to be by amination of the phenolic –OHs of the tannin by the amino groups of the non-skeletal side chains of arginine, and by esterification by the –COOH groups of glutamic and aspartic acid of the aliphatic alcohol-OH on the C3 site of the flavonoid units heterocycle of the tannin [120–125]. The proportion of covalent linkages increases markedly and predominate with increasing temperatures. This tightening of the tannin-protein covalent network formed may be an additional contributing factor both to leather wear resistance and performance as well to leather shrinking when this is subjected to excessive temperatures, but more interestingly in the marked upgrading of soy protein wood adhesives without addition of any toxic hardener.
Many other interesting results other than what described can be obtained, some of which are too long to explain in such a limited review.
The MALDI ToF Technique can successfully be used and has been used extensively also for hydroysable tannins. Sumach and mainly chestnut have been tested by MALDI and the type of structures present have been clarified, first in 2002 [114]. For chestnut wood tannin a new insight on its structure in situ in wood before extraction was deduced from MALDI ToF mass spectrometry. This is that of a pervasive and extended random tridimensional macromolecular network, formed by pentagalloylglucose clusters linked to each other, to form chains and encrust the wood constituents matrix. Pentagalloylglucose monomers, dimers and trimers were identified for commercial chestnut tannin extract. These appeared to be the degradation products of longer chains present in situ in the wood before extraction, linked in the network through polygallic/polyellagic chains or flavogallonic acid bridges. By extraction such a network is extensively degraded and thus degradation products are found in the commercial extract. Such a degradation occurs due to the susceptibility to hydrolysis of the ester bridges holding together the network. The fragments formed readily and easily rearrange as well, giving numerous structures presenting ellagic acid residues. Internal rearrangements of the fragments formed by the extraction appear to occur readily and easily generating a number of of different structures where ellagic acid residues, flavogallonic acid residues, and even some nonahydroxytriphnoic acid residues are present. Castalagin/vescalagin and castalin/vescalin are detected as the main compounds of the chestnut extract of commerce are just the more stable degradation compounds produced by the internal rearrangement subsequent to the hydrolysis of polypentagalloylglucose oligomers.
The structures chestnut, oak, tara, sumach, chinese gall, and turkey gall hydrolysable tannins were also examined by MALDI ToF mass spectrometry [126] with definition of oligomers structures and their distribution. Degradation products of different structures than previous examinations were observed. Different galloyl glucose monomers were observed for chestnut and oak tannin extracts and in chinese gall gallotannin extract. Positive-and negative-mode MALDI ToF analyses showed the galloyl residues majority on the galloyl glucose chains were stripped from the skeletal glucose chain. Long oligomers, up to 16–17 glucose chains, almost completely stripped of galloyl groups were detected. A conclusion from this was that a wide chain lengths distribution of gaIloyl glucose chains are present in commercial hydrolysable tannin extracts and that they are composed mostly of long, mixed chains presenting di-, tri-, and pentagalloyl glucose units on the same chain. Commercial Tara and turkey gall tannins appears to be mostly polygallic chain oligomers of up to eight chain-linked gallic acid residues. Sumach tannin extract appears to be an even more complex mix of glucose oligomers up to 13 repeating units.
Solvent extracted commercial Tara tannin extract after having been investigated by MALDI ToF mass spectrometry and HPLC appeared formed by a number of polygallic acid oligomers linked by an ester bond to one quinic acid these constituting the largest proportion of the extract (Fig. 6). Other Polygallic acid oligomer chains present are instead attached to one or two units of either caffeic acid and/or methylated quinic, methylated gallic and methylated caffeic acids. Some carbohydrate residues attached to the extract phenolics have also been shown to occur but in rather low proportion by MALDI ToF analysis in negative ion mode as expected in a tannin solvent extracted [127].
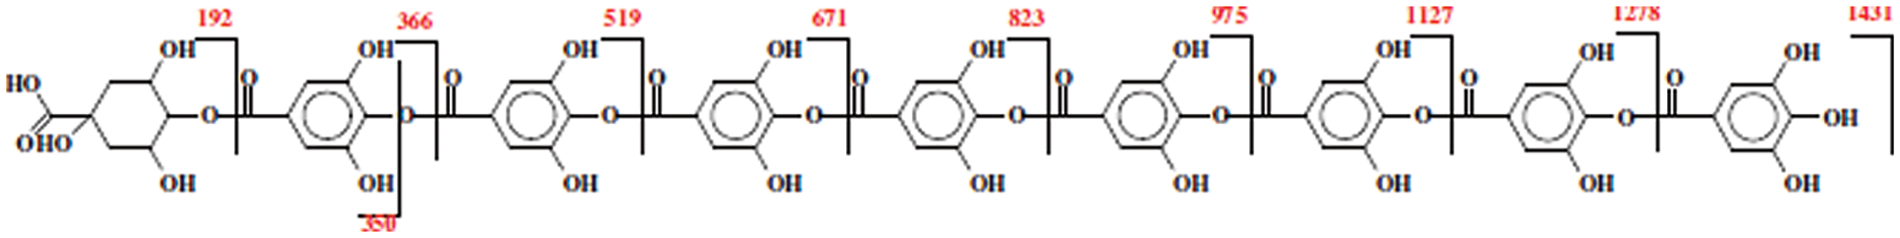
Figure 6: Series of oligomers representing the highest peaks in MALDI ToF and their respective molecular weights in solvent extracted commercial Tara tannin extract. The sequence of gallic acid units that can vary between 0 and 8 can be linked to other monomer units instead than to quinic acid as shown in the figure for the main series of oligomers [127]
While tara, turkey gall, and chestnut wood tannin extracts were analyzed by MALDI ToF mass spectrometry showing the oligomer structure of these tannins, such a technique is not able to distinguish between isomers with isobaric masses causing sometime ambiguous structural assignments. To determine Their actual microstructures were instead determined by MALDI-ToF-CID (collision induced dissociation) which enables monomer sequence determination and positive assignments of isobaric structures [128]. It must also be noted that as one starts reacting and modifying hydrolysable extracts for different applications their already difficult chemistry is shown in all its real complexity, well beyond what observed by a simple series of instrumental analyses, as it has been the case of chestnut wood commercial tannin extract when reacting it to obtain non-isocyanate biopolyurethanes [129].
FTIR Analysis of tannins by FTIR is a technique extensively used but with the drawback that it gives very limited information. As an example, the three spectra of the same grape pomace tannin which differ in the proportions of their opened heterocyclic rings are shown in Fig. 7 [130]. The hydroxyl groups, aliphatic from the carbohydrates in the extract as well as phenolic from the tannin itself, are represented by the band at 3318 cm−1. The methyl and methylene groups C-H stretch is represented by the band at 2973 cm−1, while the 1878 cm−1 small band belongs to the carbonyl group. Rearrangements to catechinic acid [129,130] (see Fig. 4) induced by the tannin hot temperature extraction can account for the presence of these carbonyl groups. The 1212, 1264 and 1308 cm−1 bands can be assigned to C-C bonds stretching in CR2-CHR-CR (SO3) causing heterocyclic pyran ring opening by tannin sulfitation [130,131]. Once one compares in Fig. 4, the IR bands and their intensities for the same tannin extracted with NaHCO3 (C), with Na2CO3 (B) and with NaOH (A) one can notice that the level of pyran rings that have opened differs as a function of the base used for extraction. The proportion of pyran rings that have opened appears to be higher for cases B and C rather than in A.
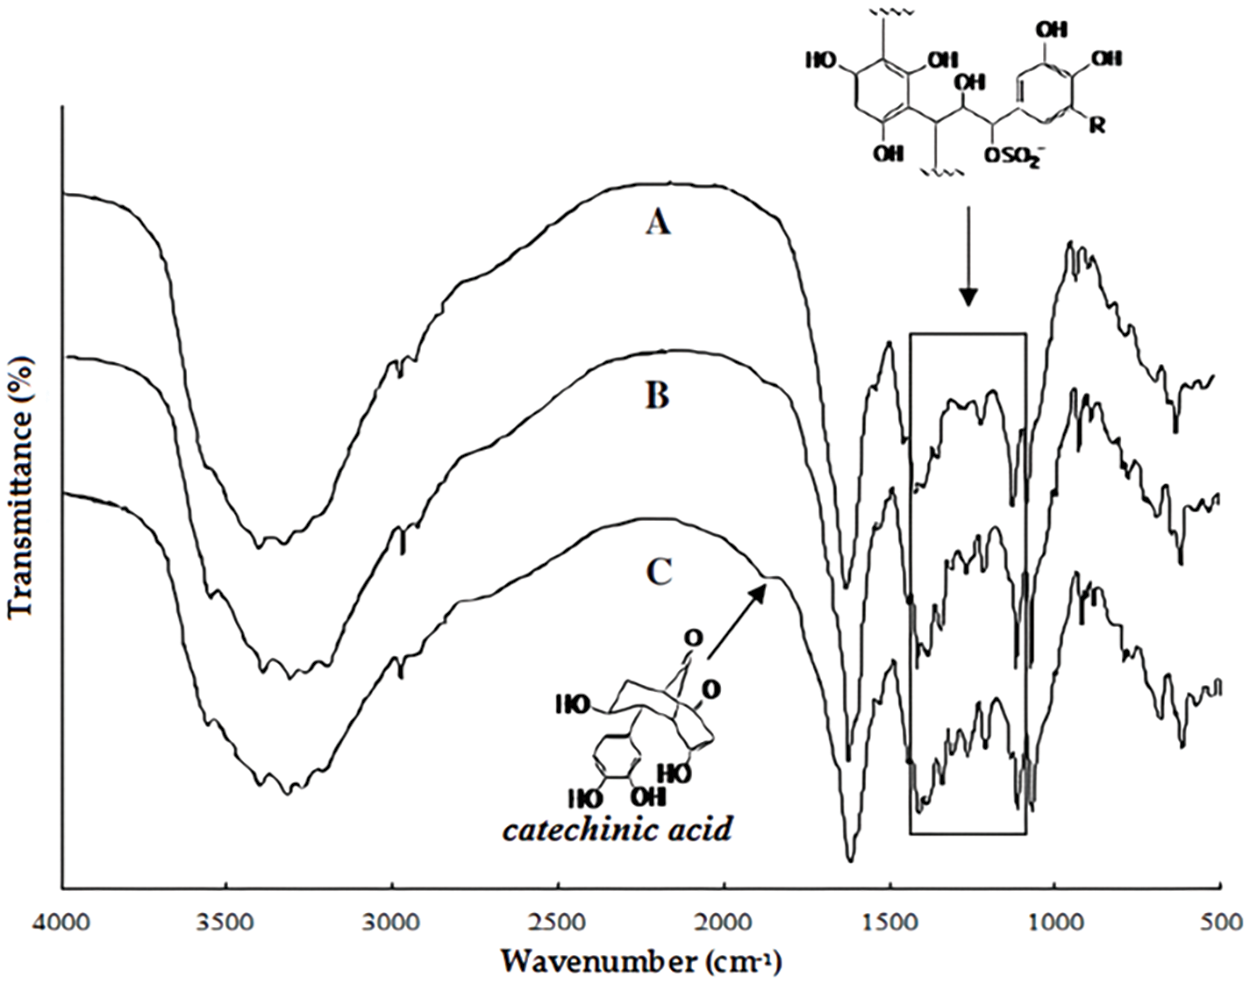
Figure 7: Comparison of FTIR spectra of a tannin extracted with by aid of three different bases, namely extracted with NaOH (A), extracted with Na2CO3 (B) and extracted with NaHCO3 (C). Note the small band of the catechinic acid rearrangement [130]
Moreover chestnut (Castanea sativa Mill.) wood tannins, commonly used in winemaking and other industrial application, was studied using spectroscopy approach that revealed diagnostic bands assigned to phenolic compounds, including 1600, 1509, 1447, 1197 and 1032 cm−1, and identified polygalloylglucose, e.g., castalagin/vescalagin–like structures as the most representative molecules [132].
5.6 Additional Advances in Spectrometric Approaches
While the hereby reviewed spectroscopic methods are commonly used analytics for-polymers including natural polymers and are as such also suited for hydrolysable and condensed tannins, more complex spectroscopic experiments are being increasingly used to finely characterize the structure of tannins and of their derivatives. In particular NMR offers a range of pulses, 2-dimensional experiments and characterization possibilities both in the gel and in the solid state. For example, HSQC; 1H/13C-NMR is increasingly used to finely determine composition and substitution patterns of complex tannin extracts [61]. Likewise the breath of Mass spectrometry technologies opens additional views on substitution patterns of tannins, as recently demonstrated with ESI(-)-MS/MS of hydroxypropyl tannins by Garcia et al. [133] and with MALDI ToF-CID by Radebe et al. [110,112] for both hydrolysable and condensed tannins. It can be expected that significant advances and understanding of composition, substitution and bonding patterns in tannin extracts can be by expanding on these even more sophisticated spectroscopic approaches.
6 Traditional Industrial Test Methods
6.1 Hide Powder and Divergan (Polyvynylpyrrolydone) Titration Methods
These methods are particularly adapted to the testing of the tanning power of tannins for manufacturing leather. The hide powder method was based on the absorption of a tannin on a standardized dried powdered hide. Hide powder for the gravimetric analysis of vegetable tanning agents and extracts is still produced [134–136]. This method is not anymore used as it is now obsolete and superseded by a method presenting a better re-producibility due to a more reliable standardization of the product, namely Divergan (Polyvynylpyrrolydone). Thus, the Divergan titration method has taken the place of the hide powder method and it is used to titrate the percentage of tannin in a tannin extract [137]. The problem of both these methods is that they are specific for leather tanning, thus determining only the phenolic oligomers percentage from tannin trimers to higher molecular weight oligomers, hence only of the part of the tannin extracts useful for leather tanning. They do not determine the proportion of phenolic monomers and dimers, not useful for tanning hides into leather, although these are very usable for adhesives, resins and many other applications. For these latter applications these methods are thus not advisable.
The Divergan method takes roughly 6 g of dry tannin extract, measuring its exact weight accurately and exactly by using an analytical balance. The tannin extract sample is then dissolved in distilled water at 60°C–70°C, and brought up to volume with distilled water in a 500 ml glass measuring flask. The solution is then cooled down to approximately 20°C (solution A).
The percentage total solids (TS) content is then obtained by evaporating 25 ml of this solution in an accurately pre-weighed (on an analytical balance) stainless steel or glass open round bottom capsule partially immersed in a water bath at 100°C. After total evaporation of the solution the capsule containing the solid residue is cooled in a desiccator, weighed and the solution percentage solids content calculated. The original powder extract moisture content is then calculated as Moisture content (%) = 100-%Total Solids.
In the case that solution A is not clear determining the soluble solids (SS) is necessary. If instead it is clear the total solids and soluble solids coincide. If solution A is turbid then it must be filtered through a 0.45 micron membrane, and the same procedure used for TS determination must be repeated starting from the filtered solution.
It is then necessary to determine the so-called non-tannins (NT). To do this a bit less than 50 ml of solution A are placed in a glass measuring flask and ml 88% formic acid is added, the whole brought up to 100 ml with distilled water (solution B). 7 grams of Divergan HM (by Merck) are then placed in a filter column of 27 mm diameter and equipped of a filtering membrane of porous polyethylene and 50 ml of solution B are then filtered under a constant water vacuum pump depression of 200 mm Hg, collecting 30 ml filtrate. 25 ml of this filtrate are evaporated in an accurately pre-weighed (on an analytical balance) stainless steel or glass open round bottom capsule partially immersed in a water bath at 100°C. When the capsule is dry it is placed for 4 h in an oven at 100°C, be cooled afterwards in a desiccator for approximately 15 min and then accurately weighed on an analytical balance. The percentage NT is then measured by the [(residual weight)/(original weight)] × 100 ratio, obtaining the effective tanning material by the expression Tannin (%) = %SS-%NT. A Divergan blank is needed for each Divergan tested batch. The blank is obtained by substituting the 50 ml of solution A with 50 ml distilled water in the measuring procedure of the NT percentage.
This brief review of tannins main sources, industrial and laboratory extraction systems, of tannins structural determination and characterization by both simple or even almost primitive but effective methods, by wet chemistry and more traditional titration analysis, and by progressively more sophisticated instrumental analysis methods is presented as a review of one of the possibly less-known sustainable resources of the forestry industry, but a sustainable resource that has continuously progressed since very ancient times to the present and that is acquiring now even greater importance for the preparation of an ever increasing number of biomaterials of substitution for petroleum products. What is necessary to discuss in conclusion are also what are the prospects in tannin resources. While the extraction of commercial tannins is of around 220 thousand solids tons yearly, and while is recognized as too small amount for the multitude of applications of these materials the blockage is not in the resource, but in the number of extraction factories. The available raw resource is instead enormous, millions of tons of usable tannins can be extracted with relatively simple factories, if one considers the tree species that are cultivated for their wood but the bark of which can yield tannins in sustainable quantities from the bark. Thus, a great number of pine species (but not all), Douglas fir and spruce, just to mention just some of them, do all yield usable tannins in economical amounts. Equally the solid residues of wine making are very rich in tannins. The future will tell if at last this huge resource will be exploited. Some new factories have indeed been erected in the last 20 years but the increase is still too low, but is an indication that more might well be built in the future.
Acknowledgement: None.
Funding Statement: The authors received no specific funding for this study.
Author Contributions: Conception: Antonio Pizzi; writing: Antonio Pizzi, Marie-Pierre Laborie, Zeki Candan; editing: Antonio Pizzi.
Availability of Data and Materials: Data available on request from the authors.
Conflicts of Interest: The authors declare that they have no conflicts of interest to report regarding the present study.
References
1. Pizzi, A. (1983). Tannin-based adhesives. In: Pizzi, A. (Ed.Wood adhesives chemistry and technology, vol. 1, pp. 177–246. New York, USA: Marcel Dekker. [Google Scholar]
2. Pizzi, A. (1994). Tannin-based wood adhesives. In: Advanced wood adhesives technology, pp. 149–218. New York, USA: Marcel Dekker. [Google Scholar]
3. Pizzi, A. (2019). Tannins: Prospectives and actual industrial applications. Biomolecules, 9(8), 344. [Google Scholar] [PubMed]
4. Pizzi, A. (2020). Tannin-based biofoams–A review. Journal of Renewable Materials, 7(5), 477–492. https://doi.org/10.32604/jrm.2019.06511 [Google Scholar] [CrossRef]
5. Pizzi, A., Papadopoulos, A., Policardi, F. (2020). Wood composites and their polymer binders. Polymers, 12(5), 1115. [Google Scholar] [PubMed]
6. Dunky, M. (2020). Wood adhesives based on natural resources: A critical review: Part III. Tannin- and Lignin-Based Adhesives. Reviews of Adhesion and Adhesives, 8(4), 383–529. [Google Scholar]
7. Thebault, M., Pizzi, A., Policardi, F. (2023). Naturally occurring phenolic sources for industrial applications. In: Mortier, J. (Ed.Industrial arene chemistry: Markets, technologies, processes and case studies of aromatic commodities. New York, USA: Wiley. [Google Scholar]
8. Pizzi, A. (2021). Tannins medical/pharmacological and related applications: A critical review. Sustainable Chemistry and Pharmacy, 22, 100481. [Google Scholar]
9. Valenzuela, J., von Leyser, E., Pizzi, A., Westermeyer, C., Gorrini, B. (2012). Industrial production of pine tannin-bonded particleboard and MDF. European Journal of Wood and Wood Products, 70(5), 735–740. [Google Scholar]
10. Roux, D. G., Ferreira, D., Hundt, H. K. L., Malan, E. (1975). Structure, stereochemistry, and reactivity of natural condensed tannins as basis for their extended industrial application. Journal of Applied Polymer Science, 28, 378, 335–353. [Google Scholar]
11. Pizzi, A. (2023). Little secrets for the successful industrial use of tannin adhesives: A review. Journal of Renewable Materials, 11(9), 3403–3415. [Google Scholar]
12. Herrick, F. W. (1980). Chemistry and utilization of western hemlock bark extractives. Journal of Agriculture and Food Chemistry, 28(2), 228–237. [Google Scholar]
13. Hergert, H. L. (1989). Hemlock and spruce tannins: An odyssey. In: Hemingway, R. W., Karchesy, J. J., Branham, S. J. (Eds.Chemistry and significance of condensed tannins. Boston, MA: Springer. https://doi.org/10.1007/978-1-4684-7511-1_1 [Google Scholar] [CrossRef]
14. Beng Hoong, Y., Pizzi, A., Tahir, P. Md., Pasch, H. (2010). Characterization of Acacia mangium polyflavonoid tannins by MALDI-TOF mass spectrometry and CP-MAS 13C NMR. European Polymer Journal, 46, 1268–1277. [Google Scholar]
15. McGraw, G. W., Rials, T. G., Steynberg, J. P., Hemingway, R. W. (1992). Chemistry of pecan tannins and analysis of cure of pecan tannin-based cold-setting adhesives with a DMA ‘micro-beam’ test. In: Hemingway, R. W., Laks, P. E. (Eds.Plant polyphenols, vol. 59, pp. 979–990. Boston, USA: Basic Life Sciences, Springer. [Google Scholar]
16. Thompson, D., Pizzi, A. (1995). Simple 13C NMR methods for the quantitative determination of polyflavonoid tannins characteristics. Journal of Applied Polymer Science, 55, 107–112. [Google Scholar]
17. Pasch, H., Pizzi, A., Rode, K. (2001). MALDI-TOF mass spectrometry of polyflavonoid tannins. Polymer, 42, 7531–7539. [Google Scholar]
18. Ricci, A., Parpinello, G., Schwertner, A. P., Teslic, N., Brilli, N. et al. (2017). Analytical profiling of food-grade extracts from grape (Vitis vinifera sp.) seeds and skins, green tea (Camellia sinensis) leaves and Limousin oak (Quercus robur) heartwood using MALDI-TOF-MS, ICP-MS and spectrophotometric methods. Journal of Food Composites and Analysis, 59, 95–104. [Google Scholar]
19. Arunkumar, J., Rajarajan, S. (2018). Study on antiviral activities, drug-likeness and molecular docking of bioactive compounds of Punica granatum L. to Herpes simplex virus-2 (HSV-2). Microbiological Pathology, 118, 301–309. [Google Scholar]
20. Ping, L., Gambier, F., Pizzi, A., Guo, Z. D., Brosse, N. (2012). Wood adhesives from agricultural products: Lignins and tannins for the elaboration of particleboards. Cellulose Chemistry and Technology, 46, 457–462. [Google Scholar]
21. Saad, H., Pizzi, A., Charrier, B., Ayed, N., Rode, K. et al. (2015). Valorisation of Tunisian pomegranate peels tannins in green adhesives formulations. Journal of Renewable Material, 3(1), 34–43. https://doi.org/10.7569/JRM.2014.634130 [Google Scholar] [CrossRef]
22. Matsumoto, K., Yokoyama, S. I. (2012). Induction of uncoupling protein-1 and -3 in brown adipose tissue by kaki-tannin in type 2 diabetic NSY/Hos mice. Food Chemistry and Toxicology, 50, 184–190. [Google Scholar]
23. Papoutsi, Z., Kassi, E., Chinou, I., Halabalaki, M., Skaltsounis, L. A. et al. (2008). Walnut extract (Juglans regia L.) and its component ellagic acid exhibit anti-inflammatory activity in human aorta endothelial cells and osteoblastic activity in the cell line KS483. British Journal of Nutrition, 99, 715–722. [Google Scholar] [PubMed]
24. Sun, Y., Qi, G., Li, D., Meng, H., Zhu, Z. et al. (2018). Walnut (Juglans regia L.) kernel extracts protect against isoproterenol-induced myocardial infarction in rats. Rejuvenation Research, 22, 306–312. [Google Scholar] [PubMed]
25. Dudzinska, D., Bednarska, K., Boncler, M., Luzak, B., Watala, C. (2016). The influence of Rubus idaeus and Rubus caesius leaf extracts on platelet aggregation in whole blood. Cross-talk of platelets and neutrophils. Platelets, 27, 433–439. [Google Scholar] [PubMed]
26. Ram, H., Jatwa, R., Purohit, A. (2014). Antiatherosclerotic and cardioprotective potential of Acacia senegal seeds in diet-induced atherosclerosis in rabbits. Biochemistry Research International, 436848. https://doi.org/10.1155/2014/436848 [Google Scholar] [PubMed] [CrossRef]
27. Martini, S., D’Addario, C., Colacevich, A., Focardi, S., Borghini, F. et al. (2009). Antimicrobial activity against Helicobacter pylori strains and antioxidant properties of blackberry leaves (Rubus ulmifolius) and isolated compounds. International Journal of Antimicrobial Agents, 34, 50–59. [Google Scholar] [PubMed]
28. El-Saber Batiha, G., Beshbishy, A. M., Adeyemi, O. S., Nadwa, E. H., Rashwan, E. K. M. et al. (2020). Phytochemical screening and antiprotozoal effects of the methanolic Berberis vulgaris and acetonic Rhus coriaria extracts. Molecules, 25(3), 550. [Google Scholar]
29. Kotia, A., Kumar, A. (2015). Biodiversity of the Indian desert and its value. https://core.ac.uk/download/pdf/56342159.pdf (accessed on 17/09/2023). [Google Scholar]
30. Pizzi, A. (2008). Tannin: Major sources, properties and applications. In: Belgacem, M. N., Gandini, A. (Eds.Monomers, polymers and composites from renewable resources, pp. 179–199. Oxford, UK: Elsevier. [Google Scholar]
31. Brillouet, J. M. (2013). The tannosome is an organelle forming condensed tannins in the chlorophyllous organs of Tracheophyta. Annals of Botany, 112, 1003–1014. [Google Scholar] [PubMed]
32. Kanzaki, S., Yonemori, K., Sugiura, A. (2001). Identification of molecular markers linked to the trait of natural astringency loss of Japanese persimmon (Diospyros kaki) fruit. Journal of the American Society of Horticultural Science, 126, 51–55. [Google Scholar]
33. Pizzi, A. (1980). Tannin-based adhesives. Journal of Macromolecular Science, Polymer Reviews, 18, 247–315. [Google Scholar]
34. Sealy-Fisher, V. J., Pizzi, A. (1992). Increased pine tannins extraction and wood adhesives development by phlobaphenes minimization. Holz als Roh-und Werkstoff, 50, 212–220. [Google Scholar]
35. Giovando, S. (2001). Silva chimica, St. Michele Mondovi. Italy: Private communication. [Google Scholar]
36. Kemppainen, K., Siika-aho, M., Pattathil, S., Giovando, S., Kruus, K. (2014). Spruce bark as an industrial source of condensed tannins and non-cellulosic sugars. Industrial Crops and Products, 52, 158–168. [Google Scholar]
37. Chupin, L., Motillon, C., Charrier-El Bouhtoury, F., Pizzi, A., Charrier, B. (2013). Characterization of maritime pine (Pinus pinaster) bark tannins extracted under different conditions by spectroscopic methods, FTIR and HPLC. Industrial Crops and Products, 49, 897–903. [Google Scholar]
38. Rhazi, N., Oumam, M., Hannache, H., Sesbou, A., Charrier, B. et al. (2015). Comparison of the impact of different methods of extraction on the yields of polyphenols and tannins extracted from the barks of Acacia mollissima from Morocco: Part 1: Preliminary studies. Industrial Crops and Products, 70, 245–252. [Google Scholar]
39. de Hoyos-Martínez, P. L., Merle, J., Labidi, J., Charrier–El Bouhtoury, F. (2019). Tannins extraction: A key point for their valorization and cleaner production. Journal of Cleaner Production, 206, 1138–1155. [Google Scholar]
40. Olivier-Bourbigou, H., Magna, L., Morvan, D. (2010). Ionic liquids and catalysis: Recent progress from knowledge to applications. Applied Catalysis A: General, 373, 1–56. [Google Scholar]
41. Vázquez, G., González-Alvarez, J., Freire, S., López-Suevos, F., Antorrena, G. (2001). Characteristics of Pinus pinaster bark extracts obtained under various extraction conditions. Holz als Roh-und Werkstoff, 59, 451–456. [Google Scholar]
42. Markom, M., Hasan, M., Daud, W. R. W. (2010). Pressurized water extraction of hydrolysable tannins from Phyllanthus niruri Linn. Separation Science and Technology, 45, 548–553. [Google Scholar]
43. Vieira, M. C., Lelis, R. C. C., Couto Da Silva, B., De, G., Oliveira, L. et al. (2011). Tannin extraction from the bark of Pinus oocarpa var. oocarpa with sodium carbonate and sodium bisulfite. Floresta e Ambiente, 18, 1–81. [Google Scholar]
44. Liu, Z., Chen, Z., Han, F., Kang, X., Gu, H. et al. (2016). Microwave-assisted method for simultaneous hydrolysis and extraction in obtaining ellagic acid, gallic acid and essential oil from Eucalyptus globulus leaves using Brönsted acidic ionic liquid [HO3S(CH2)4mim]HSO4. Industrial Crops and Products, 81, 152–161. [Google Scholar]
45. Lu, C., Wang, H., Lv, W., Ma, C., Lou, Z. et al. (2012). Ionic liquid-based ultrasonic/microwave assisted extraction combined with UPLC–MS–MS for the determination of tannins in Galla chinensis. Natural Products Research, 26, 1842–1847. [Google Scholar]
46. Ajila, C. M., Brar, S. K., Verma, M., Tyagi, R. D., Godbout, S. et al. (2011). Extraction and analysis of polyphenols: Recent trends. Critical Reviews in Biotechnology, 31, 227–249. [Google Scholar] [PubMed]
47. Azmir, J., Zaidul, I. S. M., Rahman, M. M., Sharif, K. M., Mohamed, A. et al. (2013). Techniques for extraction of bioactive compounds from plant materials: A review. Journal of Food Engineering, 117, 426–436. [Google Scholar]
48. Palmer, M. V., Ting, S. S. T. (1995). Applications for supercritical fluid technology in food processing. Food Chemistry, 52, 345–352. [Google Scholar]
49. Talmaciu, A. I., Ravber, M., Volf, I., Knez, Ž., Popa, V. I. (2016). Isolation of bioactive compounds from spruce bark waste using sub- and supercritical fluids. Journal of Supercritical Fluids, 117, 243–251. [Google Scholar]
50. Cavalcanti, R. N., Navarro-Díaz, H. J., Santos, D. T., Rostagno, M. A., Meireles, M. A. A. (2012). Supercritical carbon dioxide extraction of polyphenols from pomegranate (Punica granatum L.) leaves chemical composition, economic evaluation and chemometric approach. Journal of Food Research, 1(3), 282. [Google Scholar]
51. Conde, E., Hemming, J., Smeds, A., Reinoso, B. D., Moure, A. et al. (2013). Extraction of low-molar-mass phenolics and lipophilic compounds from Pinus pinaster wood with compressed CO2. Journal of Supercritical Fluids, 81, 193–199. [Google Scholar]
52. Perrut, M. (2000). Supercritical fluid applications: Industrial developments and economic issues. Industrial Engineering Chemical Research, 39, 12, 4531–4535. [Google Scholar]
53. Chemat, F., Huma, Z., Khan, M. K. (2011). Applications of ultrasound in food technology: Processing, preservation and extraction. Ultrasonics Sonochemistry, 18, 813–835. [Google Scholar] [PubMed]
54. Ali, A., Lim, X. Y., Chong, C. H., Mah, S. H., Chua, B. L. (2018). Optimization of ultrasound-assisted extraction of natural antioxidants from Piper beetle using response surface methodology. 89, 681–688. [Google Scholar]
55. Ivanovic, J., Tadic, V., Dimitrijevic, S., Stamenic, M., Petrovic, S. et al. (2014). Antioxidant properties of the anthocyanin-containing ultrasonic extract from blackberry cultivar Čačanska Bestrna. Indusrial Crops and Products, 53, 274–281. [Google Scholar]
56. Dalzell, S. A., Kerven, G. L. (1998). A rapid method for the measurement of Leucaena spp proanthocyanidins by the proanthocyanidin (butanol/HCl) assay. Journal of the Science of Food and Agriculture, 78, 405–416. [Google Scholar]
57. Giovando, S. (2000). Private communication. SILVA chimica. Italy: St. Michele Mondovi. [Google Scholar]
58. Kemmpainnen, K., Siikaaho, M., Patthathil, S., Giovando, S., Kruus, K. (2014). Spruce bark as an industrial source of condensed tannins and non-cellulosic sugars. Industrial Crops and Products, 52, 158–168. [Google Scholar]
59. Carus, M. (2016). Nova GmbH, Final Report, ERA-NET-Wood Wisdom: Isolating Foams and Bionenergy : Value-added Use of Bark (BIOFOAMBARK, FKZ 22020711)–3-Technico-economical Evaluation, Fachagentur Nachwawhsende Rohstoffe, financed through the Bundesministerium fuer Ernährung und Land-wirthschaft. [Google Scholar]
60. Zhang, H. (2002). Detrmination of hydrolyzavble tannins (Gallotannins and Ellagitannins) after reaction with potassium iodate. Journal of Agricultural Food Chemistry, 50, 1795–1790. [Google Scholar]
61. Naumann, H., Sepela, R., Rezaire, A., Massih, S., Zeller, W. E. et al. (2018). Relationships between structures of condensed tannins from texas legumes and methane production during in vitro rumen digestion. Molecules, 23(9), 2123. [Google Scholar] [PubMed]
62. Garcia, D. E., Glasser, W. G., Pizzi, A., Osorio-Madrazo, A., Laborie, M. P. (2013). Hydroxypropyl tannin derivatives from Pinus pinaster (Ait.) bark. Industrial Crops and Products, 49, 730–739. [Google Scholar]
63. Garcia, D. E., Glasser, W. G., Pizzi, A., Osorio-Madrazo, A., Laborie, M. P. (2014). Synthesis and physico-chemical properties of hydroxypropyl tannins from maritime pine bark (Pinus pinaster Ait.). Holzforschung, 68(4), 411–418. [Google Scholar]
64. Hansen, C. (2007). Hansen solubility parameters: A user’s handbook, 2nd edition,pp. 1–511. Boca Raton, Fla, USA: CRC Press. [Google Scholar]
65. Pizzi, A., Stephanou, A. (1992). Theory and practice of non-fortified tannin adhesives for particleboard. Holzforschung und Holzverwertung, 44(4), 62–68. [Google Scholar]
66. Stiasny, E. (1905). Die einwiirkung von formaldehyde auf gerbstoffe. Der Gerber, 740, 186–188. [Google Scholar]
67. Athomo, A. B. B., Anris, S. P. E., Tchiama, R. S., Leroyer, L., Pizzi, A. et al. (2019). Chemical analysis and thermal stability of African mahogany (Khaya ivorensis A. Chev) condensed tannins. Holzforschung, 74(7), 683–702. [Google Scholar]
68. Grigsby, M., Grigsby, W. J. (2009). Thermal degradation of condensed tannins from Radiata Pine Bark. Journal of Wood Chemistry and Technology, 29, 305–321. [Google Scholar]
69. Pizzi, A. (1997). On the correlation of some theoretical and experimental parameters in polycondensation cross-linked networks. Journal of Applied Polymer Science, 63, 603–617. [Google Scholar]
70. Kamoun, C., Pizzi, A., Garcia, R. (1998). The effect of humidity on cross-linked and entanglement networking of formaldehyde-based wood adhesives. Holz als Roh-und Werkstoff, 56(4), 235–243. [Google Scholar]
71. Garnier, S., Pizzi, A. (2001). CHT and TTT curing diagrams of polyflavonoid tannin resins. Journal of Applied Polymer Science, 81, 3220–3230. [Google Scholar]
72. Barth, H. G., Boyes, B. E., Jackson, C. (1998). Size exclusion chromatography and related separation techniques. Analytical Chemistry, 70, 251–278. [Google Scholar]
73. Richel, A., Vanderghem, C., Simon, M., Wathelet, B., Paquot, M. (2012). Evaluation of matrix-assisted laser desorption/ionization mass spectrometry for second-generation lignin analysis. Analytical Chemistry Insights, 7, 79–89. [Google Scholar] [PubMed]
74. Wu, P. W., Hwang, L. S. (2002). Determination of soluble persimmon tannin by high performance gel permeation chromatography. Food Research International, 35, 793–800. [Google Scholar]
75. Folin, O., Denis, W. (1915). Method for the determination of phenols (and Phenol derivatives) in urine. Journal of Biological Chemistry, 22, 305–308. [Google Scholar]
76. Folin, O., Ciocalteu, V. (1927). On tyrosine and tryptophane determinations in proteins. Journal of Biological Chemistry, 73, 627–650. [Google Scholar]
77. Hemingway, R. W., Laks, P. E., Branham, S. J. (1992). Plant polyphenols: Synthesis, properties, significance. Berlin, Germany: Springer Science & Business Media. [Google Scholar]
78. van Alstyne, K. L. (1995). Comparison of three methods for quantifying brown algal polyphenolic compounds. Journal of Chemical Ecology, 21, 45–58. [Google Scholar] [PubMed]
79. Yates, J. L., Peckol, P. (1993). Effects of nutrient availability and herbivory on polyphenolics in the seaweed Fucus versiculosus. Ecology, 74, 1757–1766. [Google Scholar]
80. Harma, S., Bhat, T. K., Dawra, R. K. (2000). A spectrophotometric method for assay of tannase using rhodanine. Analytical Biochemistry, 279, 85–89. [Google Scholar]
81. Noue, K. H., Hagerman, A. E. (1988). Determination of gallotannin with rhodanine. Analytical Biochemistry, 169, 363–369. [Google Scholar]
82. Hartzfeld, P. W., Forkner, R., Hunter, M. D., Hagerman, A. E. (2002). Determination of hydrolyzable tannins (Gallotannins and Ellagitannins) after reaction with potassium iodate. Journal of Agricultural Food Chemistry, 50, 1785–1790. [Google Scholar] [PubMed]
83. Bate-Smith, E. C. (1972). Detection and determination of ellagitannins. Phytochemistry, 11, 1153–1156. [Google Scholar]
84. Paul, W., Hartzfeld, R. F. (2002). Determination of hydrolyzable tannins (gallotannins and ellagitannins) after reaction with potassium iodate. Journal of Agricultural Food Chemistry, 50, 1785–1790. [Google Scholar]
85. Butler, L. G., Price, M. L., Brotherton, J. E. (1982). Vanillin assay for proanthocyanidins (condensed tanninsModification of the solvent for estimation of the degree of polymerization. Journal of Agricultural Food Chemistry, 30, 1087–1089. [Google Scholar]
86. Sun, B., Ricardo-da-Silva, J. M., Spranger, I. (1998). Critical factors of vanillin assay for catechins and proanthocyanidins. Journal of Agricultural Food Chemistry, 46, 4267–4274. [Google Scholar]
87. Covington, A. D. (1997). Modern tanning chemistry. Chemical Society Reviews, 26, 111–126. [Google Scholar]
88. Pizzi, A., Stephanou, A. (1993). A comparative 13C NMR study of polyflavonoid tannin extracts for phenolic polycondensates. Journal of Applied Polymer Science, 50, 2105–2113. [Google Scholar]
89. Pizzi, A., Stephanou, A. (1994). A 13C NMR study of polyflavonoid tannin adhesives intermediates. I. Non-colloidal, performance-determining rearranragements. Journal of Applied Polymer Science, 51, 2109–2124. [Google Scholar]
90. Pizzi, A., Stephanou, A. (1994). A 13C NMR study of polyflavonoid tannin adhesives intermediates. II. Colloidal state reactions. Journal of Applied Polymer Science, 51, 2125–2130. [Google Scholar]
91. Reid, D. G., Bonnet, S. L., Kemp, G., van der Westhuizen, J. H. (2013). Analysis of commercial proanthocyanidins. Part 4: Solid state 13C NMR as a tool for in situ analysis of proanthocyanidin tannins, in heartwood and bark of quebracho and acacia, and related species. Phytochemistry, 94, 243–248. [Google Scholar] [PubMed]
92. Braghiroli, F., Fierro, V., Pizzi, A., Rode, K., Radke, W. et al. (2023). Condensation reaction of flavonoid tannins with ammonia. Industrial Crops and Products, 44, 330–335. [Google Scholar]
93. Zeller, W. E., Ramsay, A., Ropiak, H. M., Fryganas, C., Mueller-Harvey, I. et al. (2015). 1H-13C HSQC NMR spectroscopy for estimating procyanidin/prodelphinidin and cis/trans-flavan-3-ol ratios of condensed tannin samples: Correlation with thiolysis. Journal of Agricultural Food Chemistry, 63(7), 1967–1973. [Google Scholar] [PubMed]
94. Newman, R. H., Porter, L. J., Foo, L. Y., Johns, S. R., Willing, I. (1987). High-resolution 13C NMR studies of proanthocyanidin polymers (condensed tannins). Magnetic Resonance in Chemistry, 25(301), 118–124. [Google Scholar]
95. Roux, D. G. (1965). Modern applications of mimosa extract, pp. 33–51. Grahamstown, Sout Africa: Leather Industries Research Institute, Rhodes University, South Africa. [Google Scholar]
96. Abe, I., Funaoka, M., Kodama, M. (1987). Phenolic nuclei of condensed tannins: Approaches by the phenyl nucleus-exchange method. Mokuzai Gakkaishi, 33, 582–588. [Google Scholar]
97. Crestini, C., Argyropoulos, D. S. (1997). Structural analysis of wheat straw lignin by quantitative 31P and 2D NMR spectroscopy. The occurrence of ester bonds and α-O-4 substructures. Journal of Agricultural Food Chemistry, 45, 1212–1219. [Google Scholar]
98. Argyropoulos, D. S. (1994). Quantitative phosphorus-31P NMR analysis of Lignins, a new tool for the lignin chemist. Journal of Wood Chemistry and Technology, 14, 45–63. [Google Scholar]
99. Crestini, C., Lange, H., Bianchetti, G. (2016). Detailed chemical composition of condensed tannins via quantitative 31P NMR and HSQC analyses: Acacia catechu, Schinopsis balansae, and Acacia mearnsii. Journal of Natural Products, 79, 2287–2295. [Google Scholar] [PubMed]
100. Melone, F., Saladino, R., Lange, H., Crestini, C. (2013). Tannin structural elucidation and quantitative 31P NMR analysis. 1. model compounds. Journal of Agricultural Food Chemistry, 61, 9307–9315. [Google Scholar] [PubMed]
101. Melone, F., Saladino, R., Lange, H., Crestini, C. (2013). Tannin structural elucidation and quantitative 31P NMR Analysis. 2. Hydrolyzable tannins and proanthocyanidins. Journal of Agricultural Food Chemistry, 61, 9316–9324. [Google Scholar] [PubMed]
102. Antoine, M. L., Simon, C., Pizzi, A. (2004). A UV spectrophotometric method for polyphenolic tannin analysis. Journal of Applied Polymer Science, 91, 2729–2732. [Google Scholar]
103. Bahr, U., Deppe, A., Karas, M., Hillenkamp, F., Giessmann, U. (1992). Mass spectrometry of synthetic polymers by UV-matrix-assisted laser desorption/ionization. Analytical Chemistry, 64, 22, 2866–2869. [Google Scholar]
104. Ehring, H., Karas, M., Hillenkamp, F. (1992). Role of photoionization and photochemistry in ionization processes of organic molecules and relevance for matrix-assisted laser desorption lonization mass spectrometry. Organic Mass Spectrometry, 27(4), 472–480. [Google Scholar]
105. Danis, P. O., Karr, D. E., Mayer, F., Holle, A., Watson, C. H. (1992). The analysis of water-soluble polymers by matrix-assisted laser desorption time-of-flight mass spectrometry. Organic Mass Spectrometry, 27(7), 843–846. [Google Scholar]
106. Danis, P. O., Karr, D. E. (1993). A facile sample preparation for the analysis of synthetic organic polymers by matrix-assisted laser desorption/ionization. Organic Mass Spectrometry, 28(8), 923–925. [Google Scholar]
107. Pasch, H., Gores, F. (1995). Matrix-assisted laser desorption/ionization mass spectrometry of synthetic polymers: 2. Analysis of poly (methyl methacrylate). Polymer, 36(10), 1999–2005. [Google Scholar]
108. Navarrete, P., Pizzi, A., Pasch, H., Rode, K., Delmotte, L. (2010). MALDI-TOF and 13C NMR characterisation of maritime pine industrial tannin extract. Industrial Crops and Products, 32, 105–110. [Google Scholar]
109. Navarrete, P., Pizzi, A., Pasch, H., Rode, K., Delmotte, L. (2013). Characterisation of two maritime pine tannins as wood adhesives. Journal of Adhesion Science and Technology, 27, 2462–2479. [Google Scholar]
110. Radebe, N., Rode, K., Pizzi, A., Pasch, H. (2013). Microstructure elucidation of polyflavonoid tannins by MALDI-TOF-CID. Journal of Applied Polymer Science, 127, 1937–1950. [Google Scholar]
111. Giovando, S., Pizzi, A., Pasch, H., Pretorius, N. (2013). Structure and oligomers distribution of commercial Tara (Caesalpina spinosa) hydrolysable tannin. Pro Ligno, 9, 22–31. [Google Scholar]
112. Rode, N., Rode, K., Pizzi, A., Giovando, S., Pasch, H. (2013). MALDI-TOF-CID for the microstructure elucidation of polymeric hydrolysable tannins. Journal of Applied Polymer Science, 128, 97–107. [Google Scholar]
113. Pizzi, A., Pasch, H., Rode, K., Giovando, S. (2009). Polymer structure of commercial hydrolysable tannins by MALDI-TOF mass spectrometry. Journal of Applied Polymer Science, 113, 3847–3859. [Google Scholar]
114. Pasch, H., Pizzi, A. (2002). On the macromolecular structure of chestnut ellagitannins by MALDI-TOF mass spectrometry. Journal of Applied Polymer Science, 85, 429–437. [Google Scholar]
115. Abdalla, S., Pizzi, A., Ayed, N., Charrier, F., Bahabri, F. et al. (2014). MALDI-TOF and 13C NMR analysis of Tunisian Zizyphus jujuba root bark tannins. Industrial Crops and Products, 59, 277–281. [Google Scholar]
116. Drovou, S., Pizzi, A., Lacoste, C., Zhang, J., Abdulla, S. et al. (2015). Flavonoid tannins linked to long carbohydrate chains-MALDI-TOF analysis of the tannin extract of the African locust bean shells. Industrial Crops and Products, 67, 25–32. [Google Scholar]
117. Ndiwe, B., Pizzi, A., Tibi, B., Danwe, R., Konai, N. et al. (2019). African tree bark exudate extracts as biohardeners of fully biosourced thermoset tannin adhesives for wood panels. Industrial Crops and Products, 132, 253–268. [Google Scholar]
118. Ndiwe, B., Pizzi, A., Tibi, B., Danwe, R., Konai, N. et al. (2019). Particleboard bonded with biohardeners of tannin adhesives. European Journal of Wood and Wood Products, 77, 1221–1223. [Google Scholar]
119. Pizzi, A. (2021). Covalent and ionic bonding between tannin and collagen in leather making and shrinking: A MALDI-ToF study. Journal of Renewable Materials, 9, 1345–1364. https://doi.org/10.32604/jrm.2021.015663 [Google Scholar] [CrossRef]
120. Ghahri, S., Pizzi, A., Hajihassani, R. (2022). A study of concept to prepare totally biosourced wood adhesives from only soy protein and tannin. Polymers, 14, 1150. [Google Scholar] [PubMed]
121. Chen, X., Li, J., Pizzi, A., Fredon, E., Gerardin, C. et al. (2021). Tannin-furanic foams modified by soybean protein isolate (SPI) and lignin substituting formaldehyde addition. Industrial Crops and Products, 168, 113607. [Google Scholar]
122. Ghahri, S., Pizzi, A., Mohebby, B., Mirshokraie, A., Mansouri, H. M. (2018). Soy-based, tannin-modified plywood adhesives. Journal of Adhesion, 94, 218–237. [Google Scholar]
123. Ghahri, S., Pizzi, A. (2018). Improving soy-based adhesives for wood particleboard by tannins addition. Wood Science and Technology, 52, 261–279. [Google Scholar]
124. Ghahri, S., Mohebby, B., Pizzi, A., Mansouri, A., Mansouri, H. M. (2018). Improving water resistance of soy-based adhesive by vegetable tannin. Journal of Polymers and Environment, 26, 1881–1890. [Google Scholar]
125. Ghahri, S., Chen, X., Pizzi, A., Hajihassani, R., Papadopoulos, A. (2021). Tannins as new cross-linking materials for soy-based adhesives. Polymers, 13, 595. [Google Scholar]
126. Pizzi, A., Pasch, H., Rode, K., Giovando, S. (2009). Polymer structure of commercial hydrolysable tannins by MALDI-TOF mass spectrometry. Journal of Applied Polymer Science, 113(6), 3847–3859. [Google Scholar]
127. Giovando, S., Pizzi, A., Pasch, H., Pretorius, N. (2013). Structure and oligomers distribution of commercial Tara (Caesalpina spinosa) hydrolysable tannin. ProLigno, 9(1), 22–31. [Google Scholar]
128. Radebe, N., Rode, K., Pizzi, A., Giovando, S., Pasch, H. (2013). MALDI-TOF-CID for the microstructure elucidation of polymeric hydrolysable tannins. Journal of Applied Polymer Science, 128, 97–107. [Google Scholar]
129. Azadeh, E., Pizzi, A., Gerardin-Charbonnier, C., Gerardin, P. (2023). Hydrolysable chestnut tannin extract chemical complexity in its reactions for non-isocyanate polyurethanes (NIPU) foams. Journal of Renewable Materials, 11(6), 2823–2848. https://doi.org/10.32604/jrm.2023.027651 [Google Scholar] [CrossRef]
130. Ping, L., Pizzi, A., Zhou, D. G., Brosse, N. (2012). Condensed tannins from grape pomace: Characterization by FTIR and MALDI TOF and production of environment friendly wood adhesive. Industrial Crops and Products, 40, 13– 20. [Google Scholar]
131. Navarrete, P., Pizzi, A., Bertaud, F., Rigolet, S. (2011). Condensed tannin reactivity inhibition by internal rearrangements: Detection by CP-MAS 13C NMR. Maderas Sciencia y Technologia, 13(1), 59–68. [Google Scholar]
132. Ricci, A., Lagel, M. C., Parpinello, G. P., Pizzi, A., Kilmartin, P. A. et al. (2016). Spectroscopy analysis of phenolic and sugar patterns in a food grade chestnut tannin. Food Chemistry, 203, 405–429. [Google Scholar]
133. Garcia, D., Glasser, W., Packowski, S., Laborie, M. P. (2015). Substitution pattern elucidation of hydroxypropyl Pinus pinaster (Ait.) bark polyflavonoids derivatives by ESI(-)-MS/MS. Journal of Mass Spectrometry, 49(10), 1050–1058. [Google Scholar]
134. Hide powder test method. https://www.blcleathertech.com/testing/laboratory-supplies/hide-powder (accessed on 18/09/2023). [Google Scholar]
135. Haroun, M. A., Ahmed, M. M. (2022). Hide-power and combined methods for characterization of vegetable tannin in plants. GSC Advanced Research and Reviews, 13(3), 97–102. https://doi.org/10.30574/gscarr [Google Scholar] [CrossRef]
136. Swain, T., Goldstein, J. L. (1964). Methods of polyphenol chemistry. New York: Macmillan. [Google Scholar]
137. Divergan® F (2015). 2–4. https://dematechsa.com/upload/1568209246.pdf (accessed on 18/09/2023). [Google Scholar]
Cite This Article
 Copyright © 2024 The Author(s). Published by Tech Science Press.
This work is licensed under a Creative Commons Attribution 4.0 International License , which permits unrestricted use, distribution, and reproduction in any medium, provided the original work is properly cited.
 Downloads
 Citation Tools