
 Submit a Paper
 Propose a Special lssue
 Open Access
ARTICLE
Research on the Hydrophobic Performance of Bamboo Surface Treated via Coordinated Plasma and PDMS Solution Treatments
1 College of Furnishings and Industrial Design, Nanjing Forestry University, Nanjing, 210037, China
2 Bamboo Research Institute of Zhejiang Academy of Forestry, Hangzhou, 310023, China
* Corresponding Author: Hongyan Wang. Email:
(This article belongs to the Special Issue: Modification and Functionalization of Wood)
Journal of Renewable Materials 2025, 13(5), 931-955. https://doi.org/10.32604/jrm.2025.02024-0040
Received 17 November 2024; Accepted 17 February 2025; Issue published 20 May 2025
 View Full Text
 Download PDF
Abstract
Herein, the surface of Moso bamboo was hydrophobically modified by combining O2/N2 plasma treatments with polydimethylsiloxane (PDMS) solution treatment as the hydrophobic solution. The effects of plasma treatment process (power and time), PDMS solution concentration, and maceration time on the hydrophobic performance of bamboo specimens were studied, and the optimal treatment conditions for improving the hydrophobicity were determined. Scanning electron microscopy (SEM), fourier transform infrared (FTIR), X-ray diffraction (XRD), and X-ray photoelectron spectroscopy (XPS) were used to analyze the surface morphology, chemical structure, and functional groups in the specimens before and after the plasma and PDMS solution treatments under optimal conditions. Response surface analysis was also performed to determine the optimal treatment conditions. Results show that the hydrophobic performance of the Moso bamboo surface is effectively improved and the surface energy is reduced after the coordinated treatment. The optimal conditions for improving the hydrophobic performance of Moso bamboo surface are a treatment power of 800 W, treatment time of 15 s, O2 flow rate of 1.5 L/min, PDMS solution concentration of 5%, and maceration time of 60 min for O2 plasma treatment and a treatment power of 1000 W, treatment time of 15 s, N2 flow rate of 1.5 L/min, PDMS solution concentration of 5%, and maceration time of 60 min for N2 plasma treatment. After treatment, silicone oil particles and plasma etching traces are observed on the bamboo surface. Moreover, Si-O bonds in the PDMS solution are grafted to the bamboo surface via covalent bonds, thereby increasing the contact angle and decreasing the surface energy to achieve the hydrophobic effect.Graphic Abstract
Keywords
Bamboo has a high capacity for water absorption because it contains abundant hydrophilic groups and has a porous structure; thus, it is highly prone to phenomena such as deformation and cracking [1]. To enhance its stability and broaden its applicability, bamboo must be transformed into a hydrophobic material. Several studies have focused on improving the hydrophobicity of bamboo surfaces in recent years. For instance, polydimethylsiloxane (PDMS) has been used to improve the hydrophobicity of bamboo owing to its high ultraviolet resistance, heat resistance, and chemical stability as well as low surface energy [2–5]; polysiloxanes with reactive groups such as hydroxyl, amino, epoxy, and anhydride which can improve the hydrophobicity of bamboo via chemical bonding [6]. He et al. used PDMS as a stamp and fabricated a hydrophobic rose-like/TiO2 micro-nano structure on the bamboo surface via soft printing. The results show that the water contact angle of this surface was as high as 154°, indicating that it is superhydrophobic [7]. Guo et al. performed comparative tests on the surfaces of cotton fabrics used in wearable textiles treated with low press RF and an atmospheric-pressure cold plasma jet. Results show that the cold plasma jet considerably enhanced the hydrophobicity of the material, endowing it with a water contact angle of 153°. Moreover, the modified fabrics retained their high hydrophobicity even after 25 washes [8]. Zhang et al. comprehensively investigated the effects of PDMS heat treatment on bamboo. Results show that with increasing heat-treatment temperature, the equilibrium moisture content, linear expansion rate, and surface wettability of heat-treated bamboo specimens decreased along with the moduli of rupture and elasticity. Thermogravimetric (TG) analysis indicated that with increasing heat-treatment temperature, the relative content of hemicellulose in bamboo decreased, whereas those of lignin and cellulose increased [9].
Plasma treatment can effectively modify the surface properties of bamboo materials such as their wetting behavior. Xuehua Wang and Jianhua Zheng used the contact angle measurement method, noncontact confocal profilometry, and scanning electron microscopy (SEM) to investigate the effects of plasma treatment on green bamboo. Results reveal that plasma technology etched the green bamboo surface and made it rougher, thereby effectively transforming its hydrophobic surface into a hydrophilic surface. However, this effect was temporary and the contact angle increased and recovered to approximately 30% of its original value after 24 h [10]. Parvinzadeh Gashti et al. investigated and characterized HAp on PET surface treated with Ar/O2 and NH3/C2H4 plasma, followed by incubation in SBF. Results show that HAp was successfully synthesized on the treated PET surface and plasma treatment promoted the penetration of pigments into PET and enhanced the bonding ability [11]. Although plasma treatment can modify the surface of materials, the relationship between plasma treatment (treatment power and time) and the modification effect remains unclear.
Herein, the surface of Moso bamboo was hydrophobically modified via O2/N2 plasma etching, followed by PDMS solution treatment. The effects of plasma treatment parameters such as power, time, and gas flow rate as well as PDMS solution concentration and maceration time on the hydrophobicity of Moso bamboo surface were investigated. The surface micro-structure and chemical composition of the Moso bamboo surface before and after treatments were analyzed. Response surface method was used to optimize plasma treatment, and a response surface model of surface energy and plasma treatment process was developed to support the coordinated plasma and PDMS solution treatment of hydrophobic Moso bamboo.
Moso bamboo purchased from Millennium Boat New Material Technology Group Co., Ltd. (Hangzhou, China) was cut in to 80 mm3 × 25 mm3 × 0.5 mm3 with moisture content 10%–12%, the density of PDMS was 0.9630 g/cm3 purchased from Chengdu Kelong Chemicals Co., Ltd. (Chengdu, China), the purity of diiodomethane (CH2I2) was ≥ 99.0%, purchased from Shanghai Macklin Biochemical Technology Co., Ltd. (Shanghai, China), the purity of anhydrous ethanol was ≥99.9%, purchased Chengdu Kelong Chemicals Co., Ltd., the distilled water in this paper was self-made in the laborator, the purity of O2 and N2 was 99.9%, purchased frome Shanghai Yunguang Industrial Gas Co., Ltd. (Shanghai, China) and Hangzhou Yuetong Gas Technology Co., Ltd. (Hangzhou, China), respectively.
The cold-temperature plasma (model number PG-3000K, produced by Nanjing Suman Plasma Technology Co., Ltd., Nanjing, China) was used to treated the surface of Moso bamboo, the video optical contact angle measuring instrument (model number DSA100, produced by Kruss GmbH, Germany) was used to test the contact angles, the scanning electron microscope (model number S-3400N, produced by Hitachi Limited, Japan), the X-ray diffractometer (model numberX’Pert Pro, produced by PANalytical B.V., Netherlands) and the fourier transform infrared spectrometer (model number iS10, produced by Thermo Fisher Scientific, USA) were used to analyze the surface morphology, chemical structure, and functional groups of the Moso bamboo.
2.3.1 Cold-Temperature Plasma Treatment
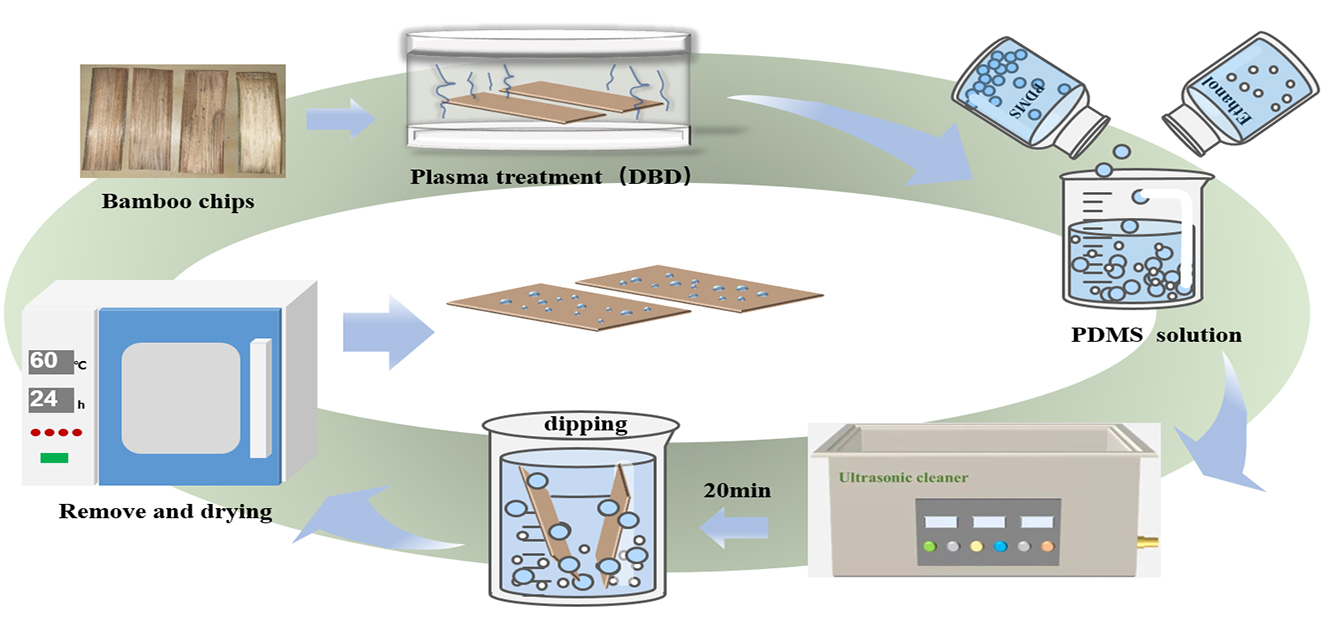
To avoid the adverse effects of bamboo nodes, Moso bamboo slices (80 mm × 25 mm × 0.5 mm) without nodes near the flesh were used. They were then dried to absolute dryness in an oven and placed in a sealed bag for subsequent treatment [10]. The dried slices were subjected to cold-temperature plasma treatment using O2/N2 as the working gases. Plasma treatment was performed at powers of 800, 1000, and 1200 W and processing times of 5, 10, and 15 s, respectively, under a gas flow rate of 1.5 L/min.
2.3.2 PDMS Solution Impregnation
PDMS and anhydrous ethanol were mixed to form an intolerant solution at room temperature; the solution was shaken and mixed for 20 min, then the PDMS solution was completely preparation, in which the plasma-treated Moso bamboo specimens were immersed for a period of time. The soaked specimens were then placed in an oven and dried to absolute dryness. Solutions with different concentrations of 1%, 3%, 5%, and 10% were obtained after maceration time of 10, 20, 40, and 60 min, respectively (Fig. 1).

Figure 1: Test flow chart of cold-temperature plasma and PDMS solution treatments performed on the Moso bamboo surface
The effects of different plasma treatment gases, treatment powers, treatment time, solution concentrations, and maceration time on the surface energy of Moso bamboo (represented by the contact angle) were investigated using the single factor method. SEM, XRD, FTIR and XPS were performed to analyze the surface morphology and chemical composition of Moso bamboo specimens before and after modification. These characterizations also revealed the optimal process of plasma modification and the optimal hydrophobic process of Moso bamboo.
(1) Contact angle measurements
The dynamic droplet method was used for the contact angle measurements of Moso bamboo surface by employing H2O and CH2I2 as the testing liquids. The angle at which the droplet contacted the bamboo surface was considered the contact angle. Each sample was tested at nine points, and the average contact angle was taken as the final result. Surface energy was calculated using the Young–Good–Girifalco–Fowkes (YGGF) equation [12], where
(2) SEM
Before the SEM test, the bamboo specimens were attached to a disk using a conductive adhesive for applying a thin gold coating. During SEM test, the acceleration voltage was 12.5 kV.
(3) XRD
The treated and untreated Moso bamboo specimens were scanned using an X-ray diffractometer, with the scanning angle of 5°–80° at a rate of 2°/min; the voltage and current were set to 40 kV and 40 mA, respectively.
(4) FTIR
The changes in the surface functional groups of Moso bamboo specimens before and after modification were tested via FTIR spectroscopy using the press cake method at wavenumbers of 400–4000 with 32 times of scanning.
(5) XPS
Surface elemental composition was analyzed via XPS using a monochromatic Cu Kα X-ray source. Binding energies were calibrated based on the C1s peak (284.8 eV).
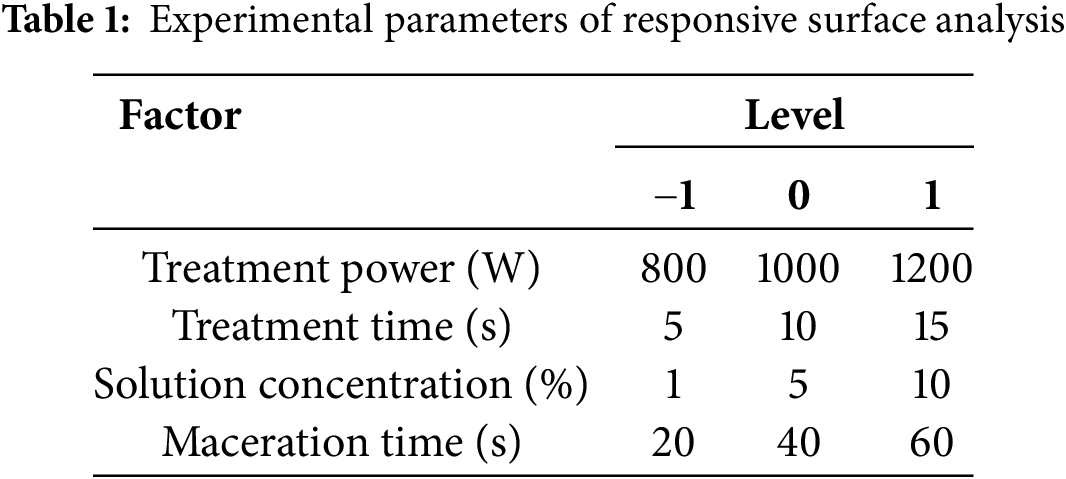
2.3.4 Response Surface Analysis
The results of the single factor method were used for response surface analysis using plasma treatment power and time, PDMS solution concentration, and maceration time as the experimental parameters. Three-level experimental designs were created for each factor, with surface energy as the response value. Results were fitted with a multivariate regression equation using Design-Expert 11.0 and subjected to variance analysis. Table 1 shows the experimental parameters.
3.1 Influence of Different Plasma Treatments on the Contact Angle and Surface Energy of Moso Bamboo Specimens
O2 plasma treatment was performed under an O2 flow rate of 1.5 L/min for 10 s, with a solution concentration of 3% and maceration time of 10 min, whereas N2 plasma treatment was performed under a N2 flow rate of 1.5 L/min for 10 s, with a solution concentration of 5% and maceration time of 10 min. The effects of these treatments on the surface wettability of Moso bamboo specimens at different treatment powers were investigated. The corresponding results of the influence of different treatment powers and treatment times on the surface contact angle and surface energy of specimens are plotted (Tables 2 and 3, Figs. 2 and 3). The H2O and CH2I2 contact angles of untreated Moso bamboo specimens were 54.98° and 24.28°, respectively. These values considerably increased after O2 and N2 plasma treatments. The maximum contact angle was achieved during O2 and N2 plasma treatments at 800 and 1000 W, respectively, for 15 s.
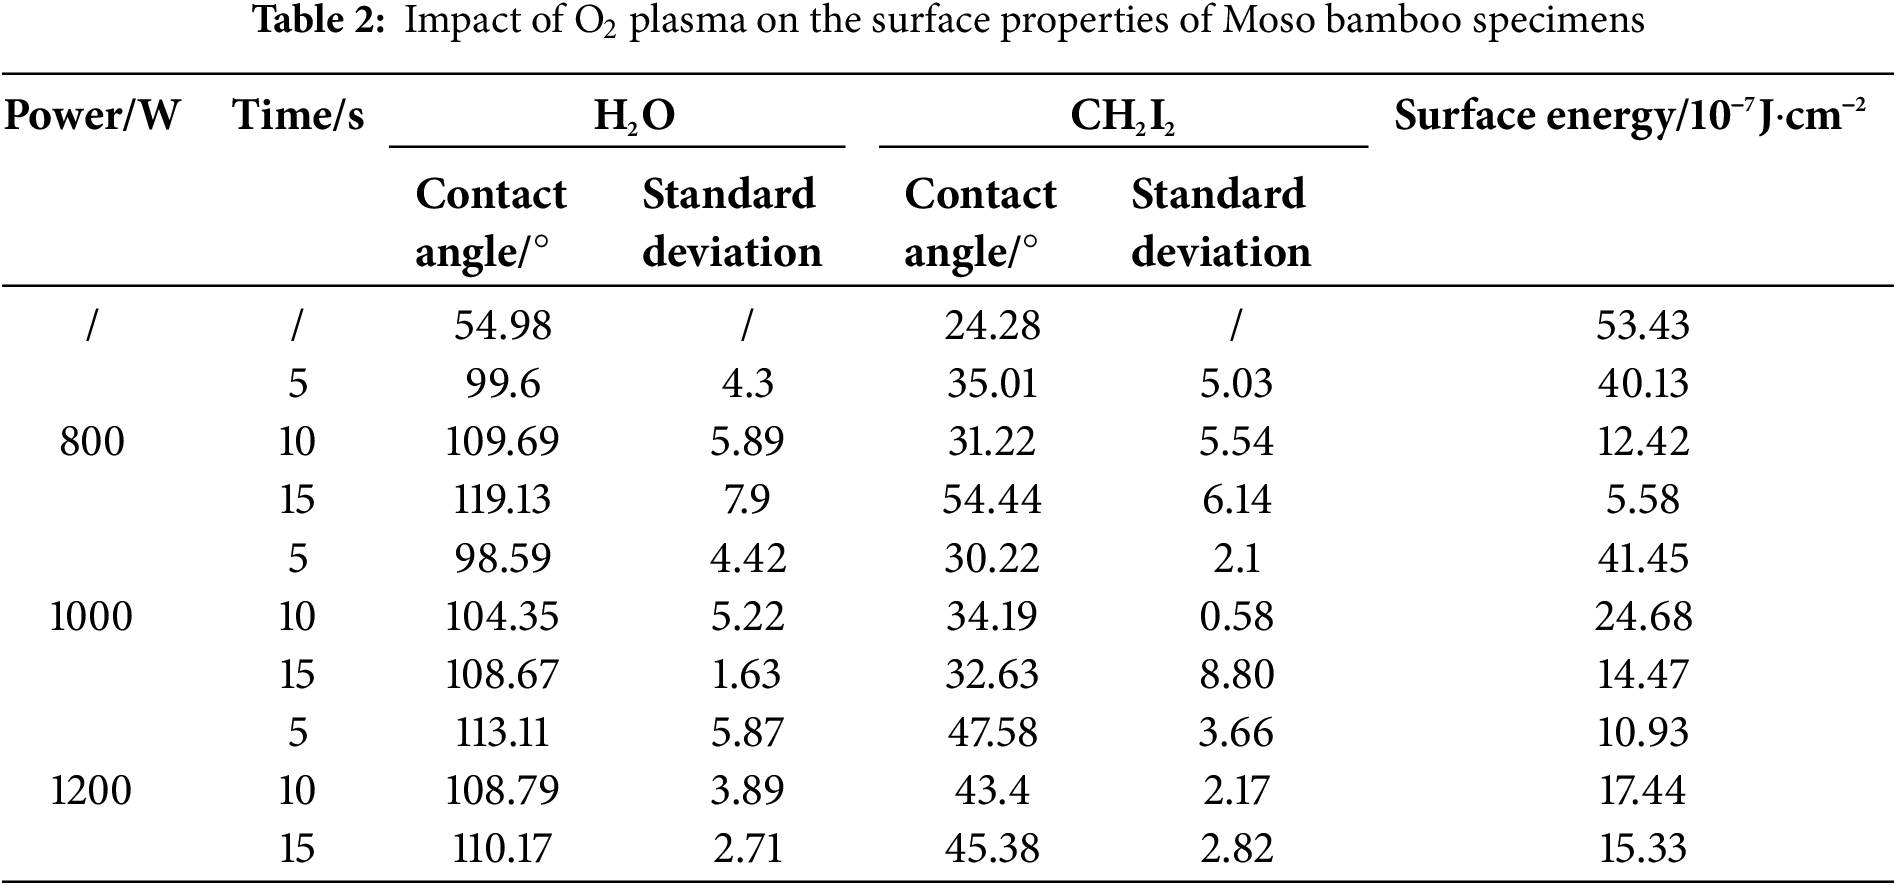
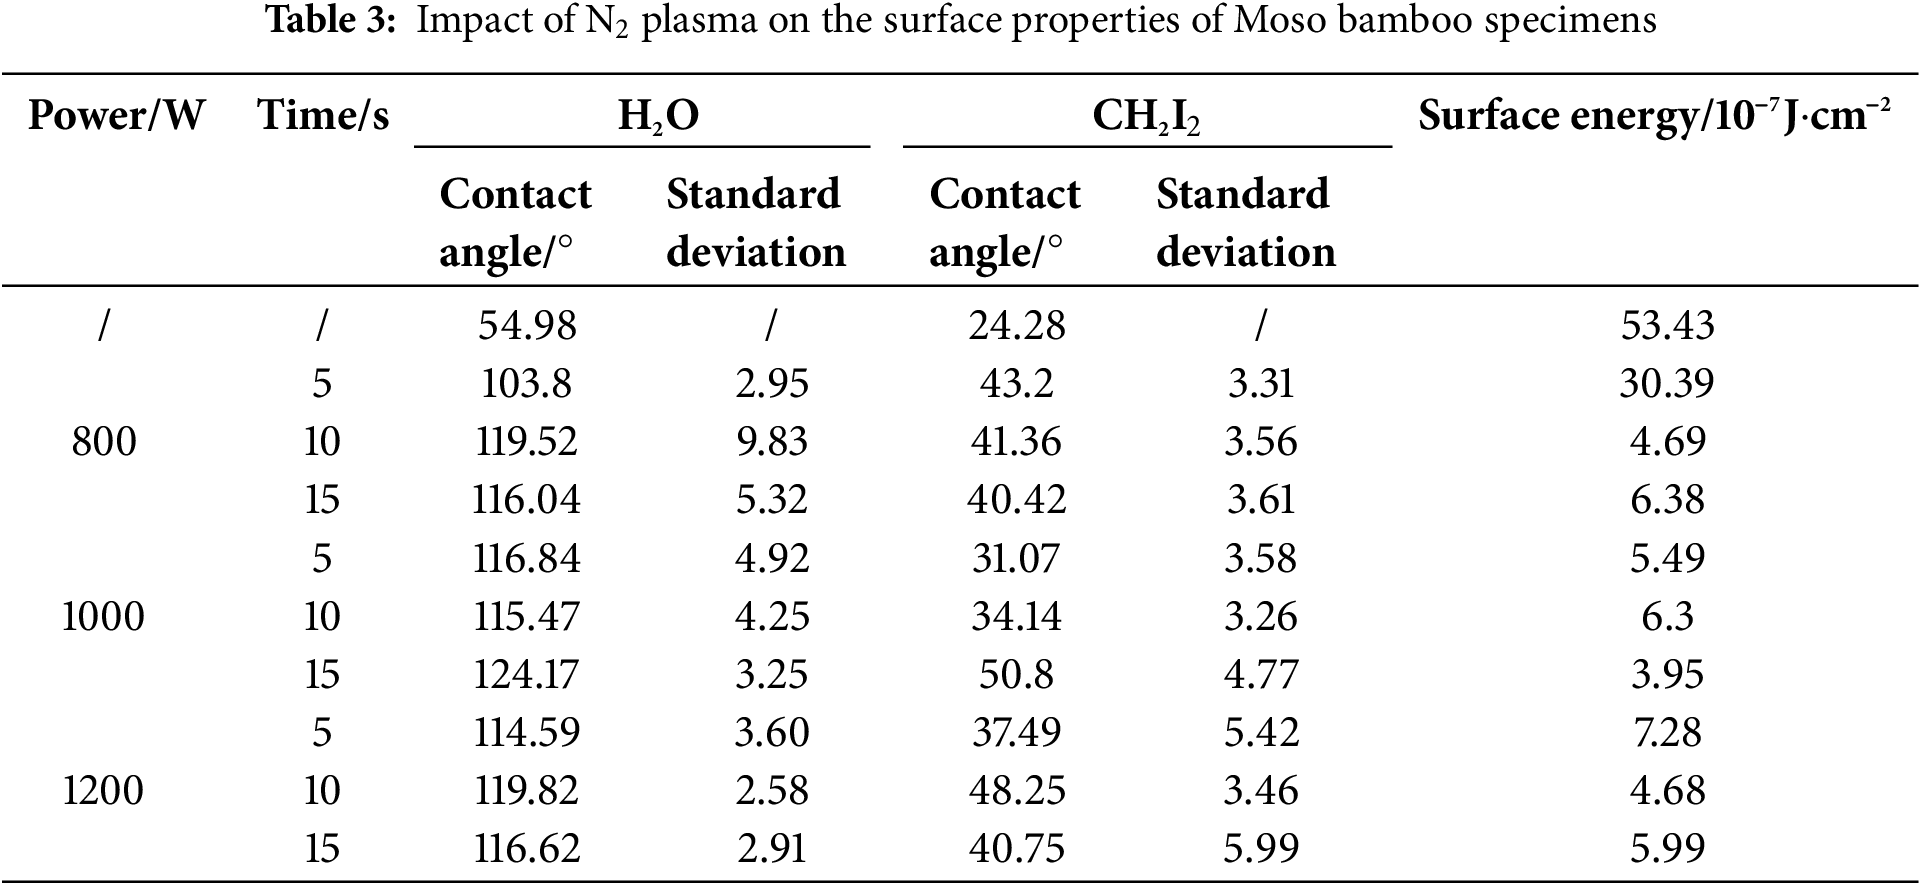

Figure 2: Contact angle and surface energy of O2 plasma–treated Moso bamboo surface

Figure 3: Contact angle and surface energy of N2 plasma–treated Moso bamboo surface
After N2 plasma treatment, the surface energy of specimens slightly decreased and varied similar to that of the contact angle. After O2 plasma treatment, the surface energy of specimens first increased and then decreased with increasing treatment power and carbon spots appeared on their surface, thereby impacting the surface energy and contact angle. At a treatment power of 800 W and time of 15 s, the surface energy was 5.58 (10−7 J·cm−2); this value was 89.5% lower than that observed for the untreated specimen (53.43). Thus, a treatment power of 800 W and time of 15 s were considered ideal conditions for O2 plasma treatment. After N2 plasma treatment, the surface energy of specimens decreased with increasing treatment power. The surface energy was 6.38 at a treatment power of 800 W and time of 15 s and decreased to 3.95 when the treatment power was further increased to 1000 W; this value was 92.6% lower than that reported for untreated specimens. Upon further increasing the treatment power to 1200 W for 15 s, the surface energy increased from 3.95 to 5.99. Thus, a treatment power of 1000 W and time of 15 s were considered ideal conditions for N2 plasma treatment.
In summary, the hydrophobicity of Moso bamboo surface was considerably enhanced after O2 or N2 plasma treatment, and its surface energy considerably decreased. The optimal treatment powers were 800 and 1000 W for O2 and N2 plasma treatments, respectively, with a treatment time of 15 s.
3.2 Influence of PDMS Solution on the Hydrophobic Properties of Moso Bamboo Surface
3.2.1 Effect of PDMS Solution Concentration on the Surface Wettability of Moso Bamboo Specimens
The influence of different PDMS solution concentrations on the hydrophobic properties of the Moso bamboo surface (characterized by the contact angle) was studied. The solution concentrations were 1%, 3%, 5%, and 10%; maceration time was 10 min; O2 plasma treatment conditions were 800 W and 15 s; and N2 plasma treatment conditions were 1000 W and 15 s.
Tables 4 and 5, Figs. 4 and 5 show the contact angles and surface energy of Moso bamboo specimens soaked in different concentrations of PDMS solutions after O2/N2 plasma treatment under optimal conditions. The water contact angles on the treated specimens first increased and then decreased as the PDMS solution concentration increased. This is possibly because the adsorption capacity on the Moso bamboo surface reached saturation.
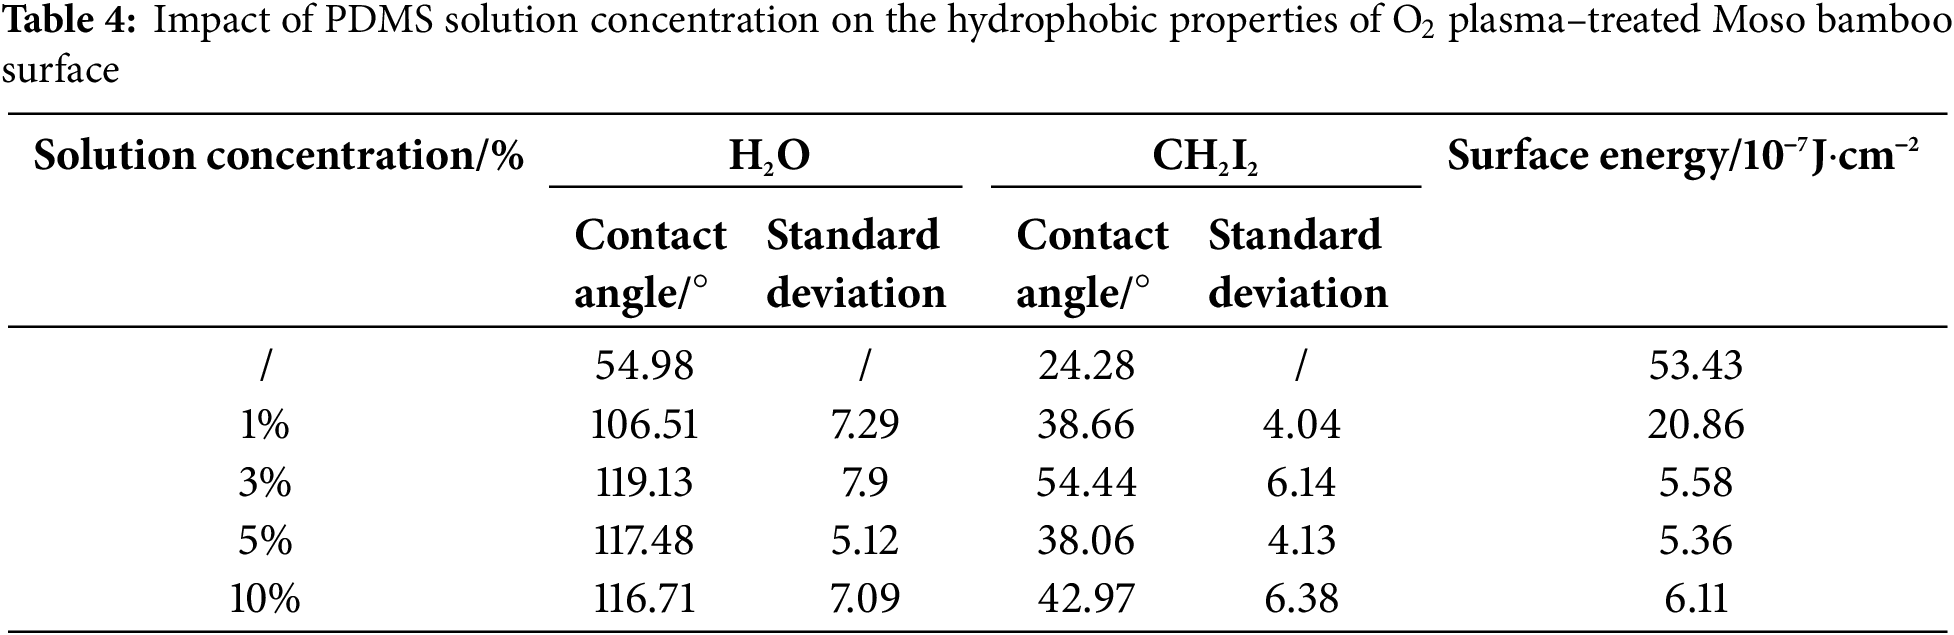
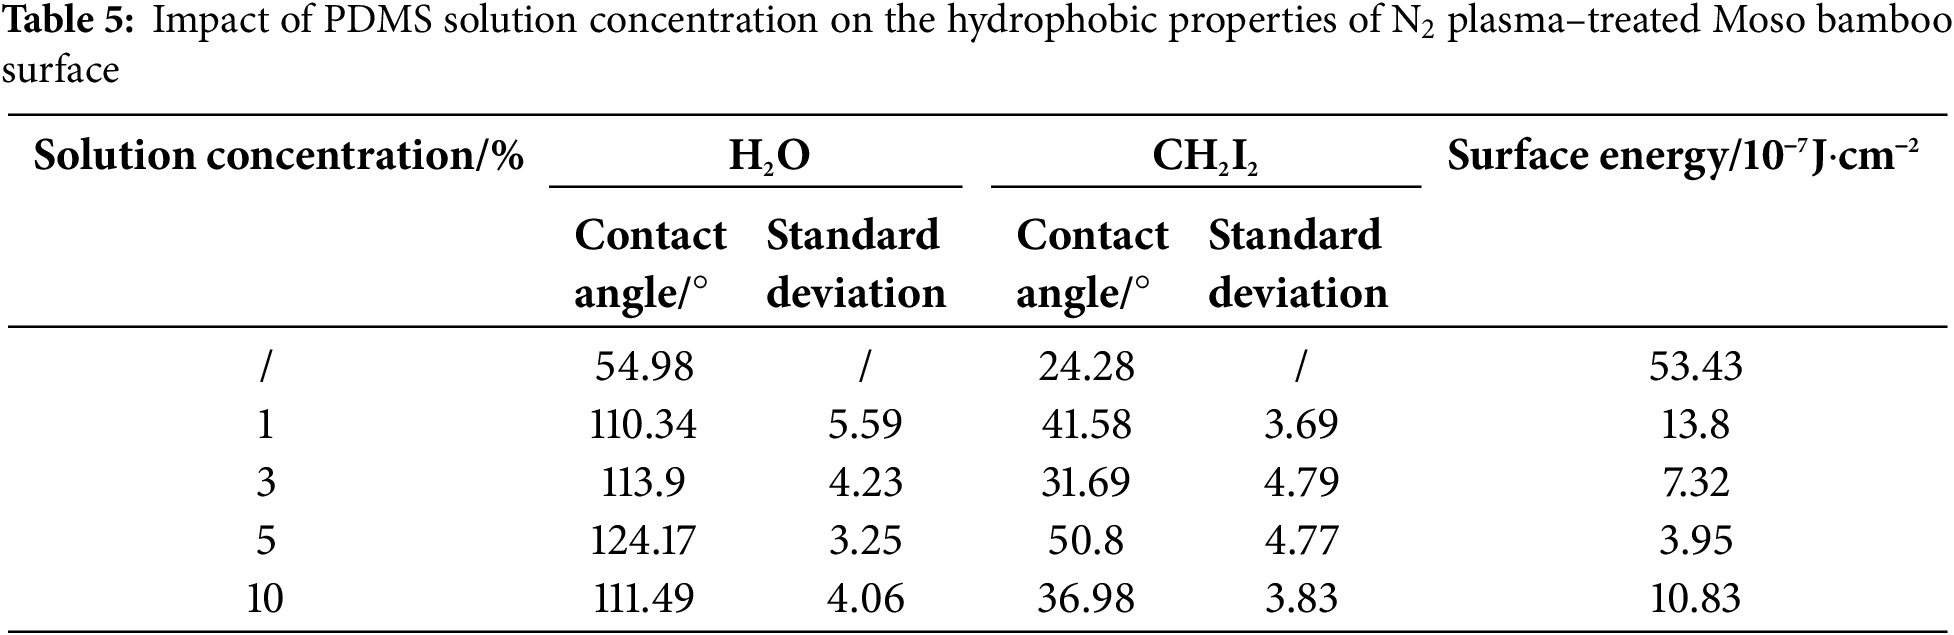

Figure 4: Contact angle and surface energy of Moso bamboo surface subjected to O2 plasma treatment under different PDMS solution concentrations

Figure 5: Contact angle and surface energy of Moso bamboo surface subjected to N2 plasma treatment under different PDMS solution concentrations
At a PDMS solution concentration of 5%, the H2O and CH2I2 contact angles of O2 plasma treatment specimen were 117.48° and 38.06°, respectively. The surface energy was 5.36, which was 89.97% lower than that of the untreated specimen (53.43). Similarly, the H2O and CH2I2 contact angles of N2 plasma treatment specimen reached a maximum of 124.7° and 50.8°, respectively, at a PDMS solution concentration of 5%. The surface energy decreased to 3.95, which was 92.61% lower than that of the untreated specimen (53.43).
Based on these findings, the optimal PDMS solution concentration was deemed 5%.
3.2.2 Impact of PDMS Solution Maceration Times on the Surface Wettability of Moso Bamboo Specimens
The influence of different maceration times on the hydrophobic properties of Moso bamboo surface was studied under optimal treatment conditions: treatment powers of 800 W (O2) and 1000 W (N2); treatment time of 15 s; and maceration time of 10, 20, 40, and 60 min.
Tables 6 and 7, Figs. 6 and 7 show the effect of PDMS solution maceration time on the hydrophobic properties of O2/N2 plasma treatment bamboo specimens under optimal treatment conditions. The contact angles of O2 plasma treatment specimens considerably increased with increasing maceration time. At a maceration time of 60 min, the H2O and CH2I2 contact angles reached their maximum values of 122.35° and 42.36°, respectively. The surface energy reached its minimum value of 4.50, which was 91.58% lower than that of the untreated specimen (53.43). The H2O and CH2I2 contact angles of N2 plasma treatment specimen reached 123.66° and 52.91° respectively at a maceration time of 60 min. The surface energy reached its minimum value of 3.77, which was 92.94% lower than the untreated specimen (53.43). As the PDMS penetration reached saturation, the increase rate of contact angle considerably reduced. This is because as the PDMS volume reached a certain level in the loosely distributed vascular bundles near the yellow part of the bamboo specimen, the densely distributed thin-walled cells and vascular bundles near the green part hindered further penetration of PDMS. These findings suggest that the optimal maceration time for PDMS solution was 60 min.

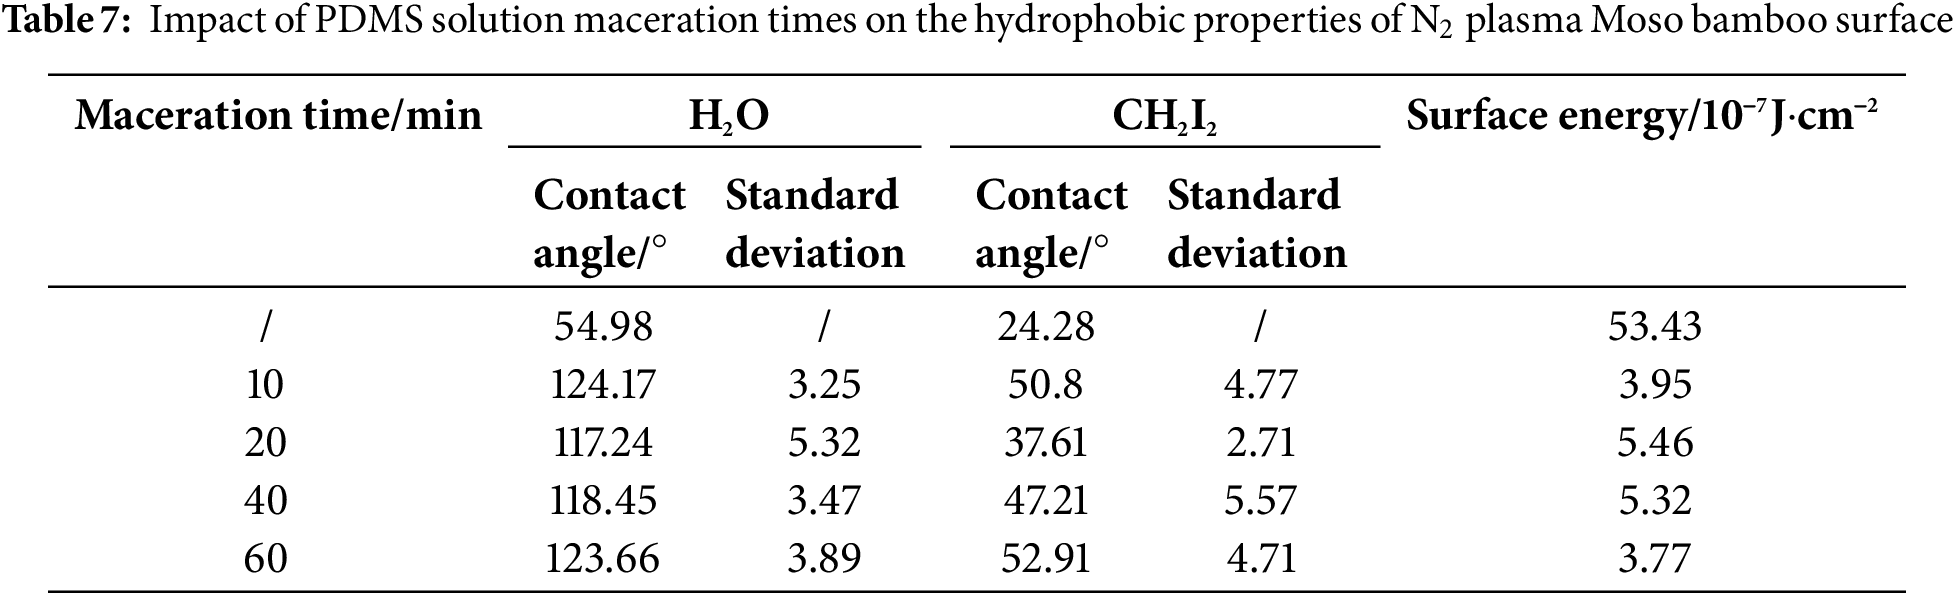

Figure 6: Impact of different maceration times of PDMS solution on the contact angle and surface energy of the O2 plasma–treated Moso bamboo surface

Figure 7: Impact of different maceration times of PDMS solution on the contact angle and surface energy of the N2 plasma–treated Moso bamboo surface
In summary, the maceration of PDMS solution in N2/O2 plasma treatment Moso bamboo specimens can considerably improve their hydrophobicity. Table 8 shows the optimal process conditions for improving the hydrophobicity of N2/O2 plasma treatment bamboo.

3.3 Surface Morphology and Chemical Structure of Specimens before and after Plasma Treatment
Fig. 8 shows the surface morphology of Moso bamboo specimens before and after treatment observed via SEM. Contrary to the untreated bamboo specimens, the surface of treated specimens showed clear plasma etching marks and distinct dense silicone oil particles that were clustered and interwoven in an uneven distribution. The surface structure of treated specimens were damaged, and several pores of varying sizes were interspersed in the fibrous material, forming a network-like interlacing pattern. Some areas also appeared unevenly rough and pitted. These formations increased the surface roughness of specimens, indicating that high-speed ion bombardment caused a certain degree of cross-linking [12–14]. These changes were observed the hydrophobic modification of the rough surface of Moso bamboo specimens, performing by introducing PDMS solution with a low surface energy such as grafing for introducing organosilicon functional groups.

Figure 8: SEM images of the Moso bamboo surface before and after plasma and PDMS solution treatments: (a) and (d) untreated surface; (b), (e), and (g) surface treated with O2 plasma and PDMS solution; and (c), (f), and (h) surface treated with N2 plasma and PDMS solution
3.3.2 Energy-Dispersive X-Ray Spectroscopy (EDS)
Fig. 9a–c shows the elemental composition of bamboo specimens before and after O2/N2 plasma and PDMS solution treatments. The specimens mainly contained C, N, O, and Si. C and O originated from the bamboo and the PDMS attached to it. The untreated, O2 plasma and PDMS solution treatment specimen showed negligible amounts of N. Si content, which was considerably higher in N2 plasma and PDMS solution treatment specimen, indicating that the surface energies decreased and the carrying capacity enhanced after plasma treatment [15].

Figure 9: EDS spectra and elemental content of Moso bamboo surface before and after plasma and PDMS solution treatments: (a) untreated surface; (b) surface treated with O2 plasma and PDMS solution; and (c) surface treated with N2 plasma and PDMS solution
Fig. 10 shows the XRD spectrum of Moso bamboo specimens before and after the N2/O2 plasma and PDMS solution treatments. Typical diffraction peaks were observed at 16.0°, 22.2°, and 34.5°, corresponding to the (101), (002), and (040) crystallographic planes of untreated bamboo specimens, respectively. The strongest diffraction peak was observed at 22.2°, indicating the presence of typical cellulose I in the specimen. The diffraction peak at 22.2° corresponding to treated specimens did not show any apparent shift, and no obvious change was observed in their crystal planes. This indicated that the modification treatment did not change the crystal structure of bamboo [16,17].

Figure 10: XRD spectra of Moso bamboo surface before and after plasma and PDMS solution treatments
The variation in the half-peak width (f) of the crystalline region represents the crystal grain sizes, with a smaller peak width indicating larger grain sizes. After plasma and hydrophobic solution treatments, the crystalline spacing of bamboo specimens decreased and the grain size increased; these changes considerably improved the dimensional stability of bamboo and enhanced its hydrophobicity [18].
FTIR spectroscopy was performed to analyze the chemical structure and changes in the internal structure of bamboo specimens before and after N2/O2 plasma and PDMS solution treatments. Fig. 11 shows the FTIR spectrum obtained at 400–4000 cm−1. The FTIR spectra of untreated specimen showed several characteristic absorption peaks at 1738 and 1596 cm−1, corresponding to C=O stretching vibration and stretching vibration of the benzene ring that represents lignin, respectively. The absorption peak at 1249 cm−1 corresponds to the stretching vibration of the acetyl group, which is a characteristic of hemicellulose. The absorption peak at 1033 cm−1 is attributed to the C-O stretching vibration and that at 1160 cm−1 corresponds to the C–O–C asymmetric stretching vibration of cellulose [19,20]. Upon PDMS solution treatment, absorption peak was observed at 2911 cm−1, corresponding to the significant C–H stretching vibration in saturated carbon. Moreover, new bands appeared at 795 and 793 cm−1, corresponding to Si–O–Si bonds. The Si–C3 stretching vibration of Si–CH in PDMS indicates that siloxane covalently bonded with bamboo during O2 plasma treatment [8]. The absorption peak corresponding to the stretching vibration of nonconjugated carbonyl CO was observed at 1738 cm−1, indicating a significant increase in carbonyl content. The intensity of the absorption peak at 1014 cm−1 (cellulose and hemicellulose) changed noticeably, indicating that the polysaccharide components in bamboo specimens were considerably impacted by the plasma-induced photoelectric effect [21,22].

Figure 11: FTIR spectra of Moso bamboo surface before and after plasma and PDMS solution treatments
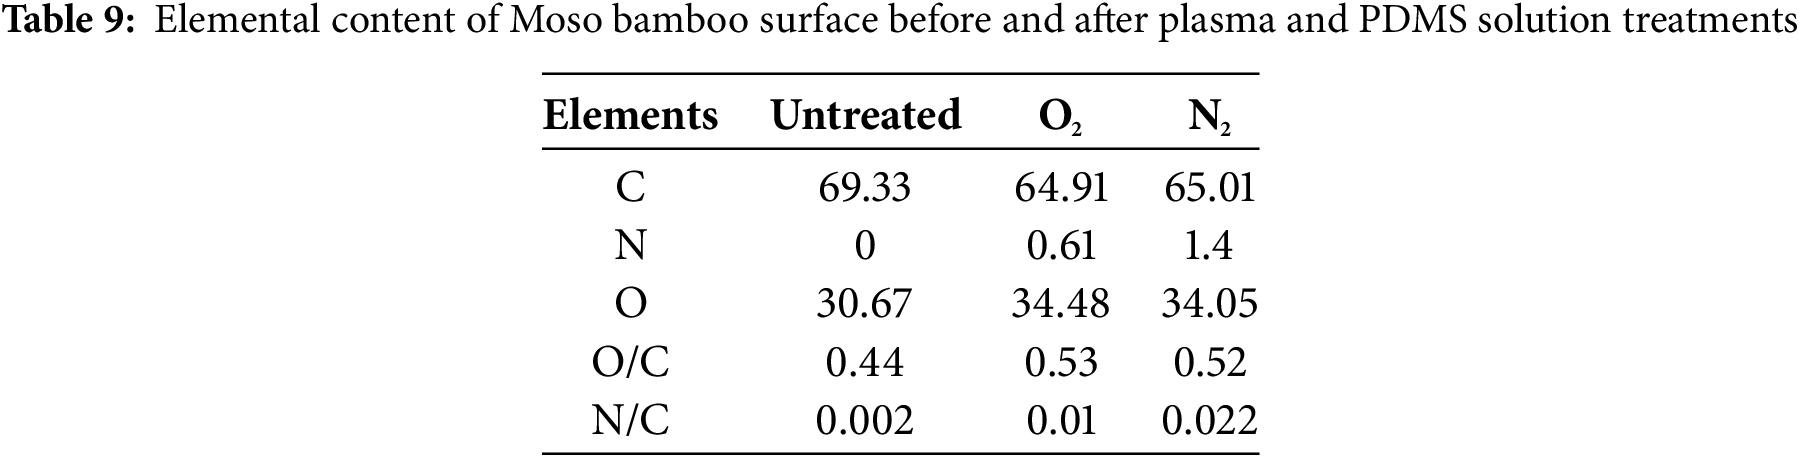
Fig. 12 shows the X-ray photoelectron spectra of C1s, O1s, and N1s of Moso bamboo surface before and after N2/O2 plasma and PDMS solution treatments. The C1s spectrum appears symmetrical with a binding energy of 284.4 eV and is composed of C–C/C–H (285.0 eV), C–OH (286.2 eV), –O–C–O–/CO (288.1 eV) [23,24]. The C1 peak primarily originates from lignin in bamboo and extracts of fatty acids, fats, and wax [25]. Table 9 shows the content of oxygen-containing functional groups on the specimen surface increased after O2 plasma and PDMS solution treatments. Moreover, the content of these functional groups, particularly the hydroxyl groups(−OH), on the specimen surface, directly impacts its surface wettability. After N2 plasma and PDMS solution treatments, the nitrogen content on the specimen surface increased from 0.61 to 1.4. The C1s spectrum shows that the content of ketone and aldehyde groups (–CHO/CO) in lignin enhanced after O2 and N2 plasma and PDMS solution treatments. This indicates that the plasma treatment exposes the lignin structure on the bamboo surface and facilitates the formation of new carboxyl groups(−COOH) [26]. The O1s peak was relatively narrow, which is typical of pure cellulose. This is because only one component in the O1s peak does not undergo any chemical shift and O and C in cellulose are linked by single bonds. This type of oxygen is usually attributed to O2, with an electron binding energy of approximately 533 eV. The O2 peak with a binding energy of approximately 531 eV is attributed to oxygen in Si–O–Si and Si–O–C bonds, resulting from to the covalent grafting of PDMS chains onto the Moso bamboo surface. The presence of O1 and O2 indicates that the material composition contained noncellulose components [27,28].

Figure 12: High-resolution XPS spectra of Moso bamboo surface before and after plasma and PDMS solution treatments
4.1 Development of the Experimental Model
The surface energy of Moso bamboo specimens after O2 and N2 plasma and PDMS solution treatments was evaluated via response surface analysis. The corresponding results are shown in Tables 10 and 11.
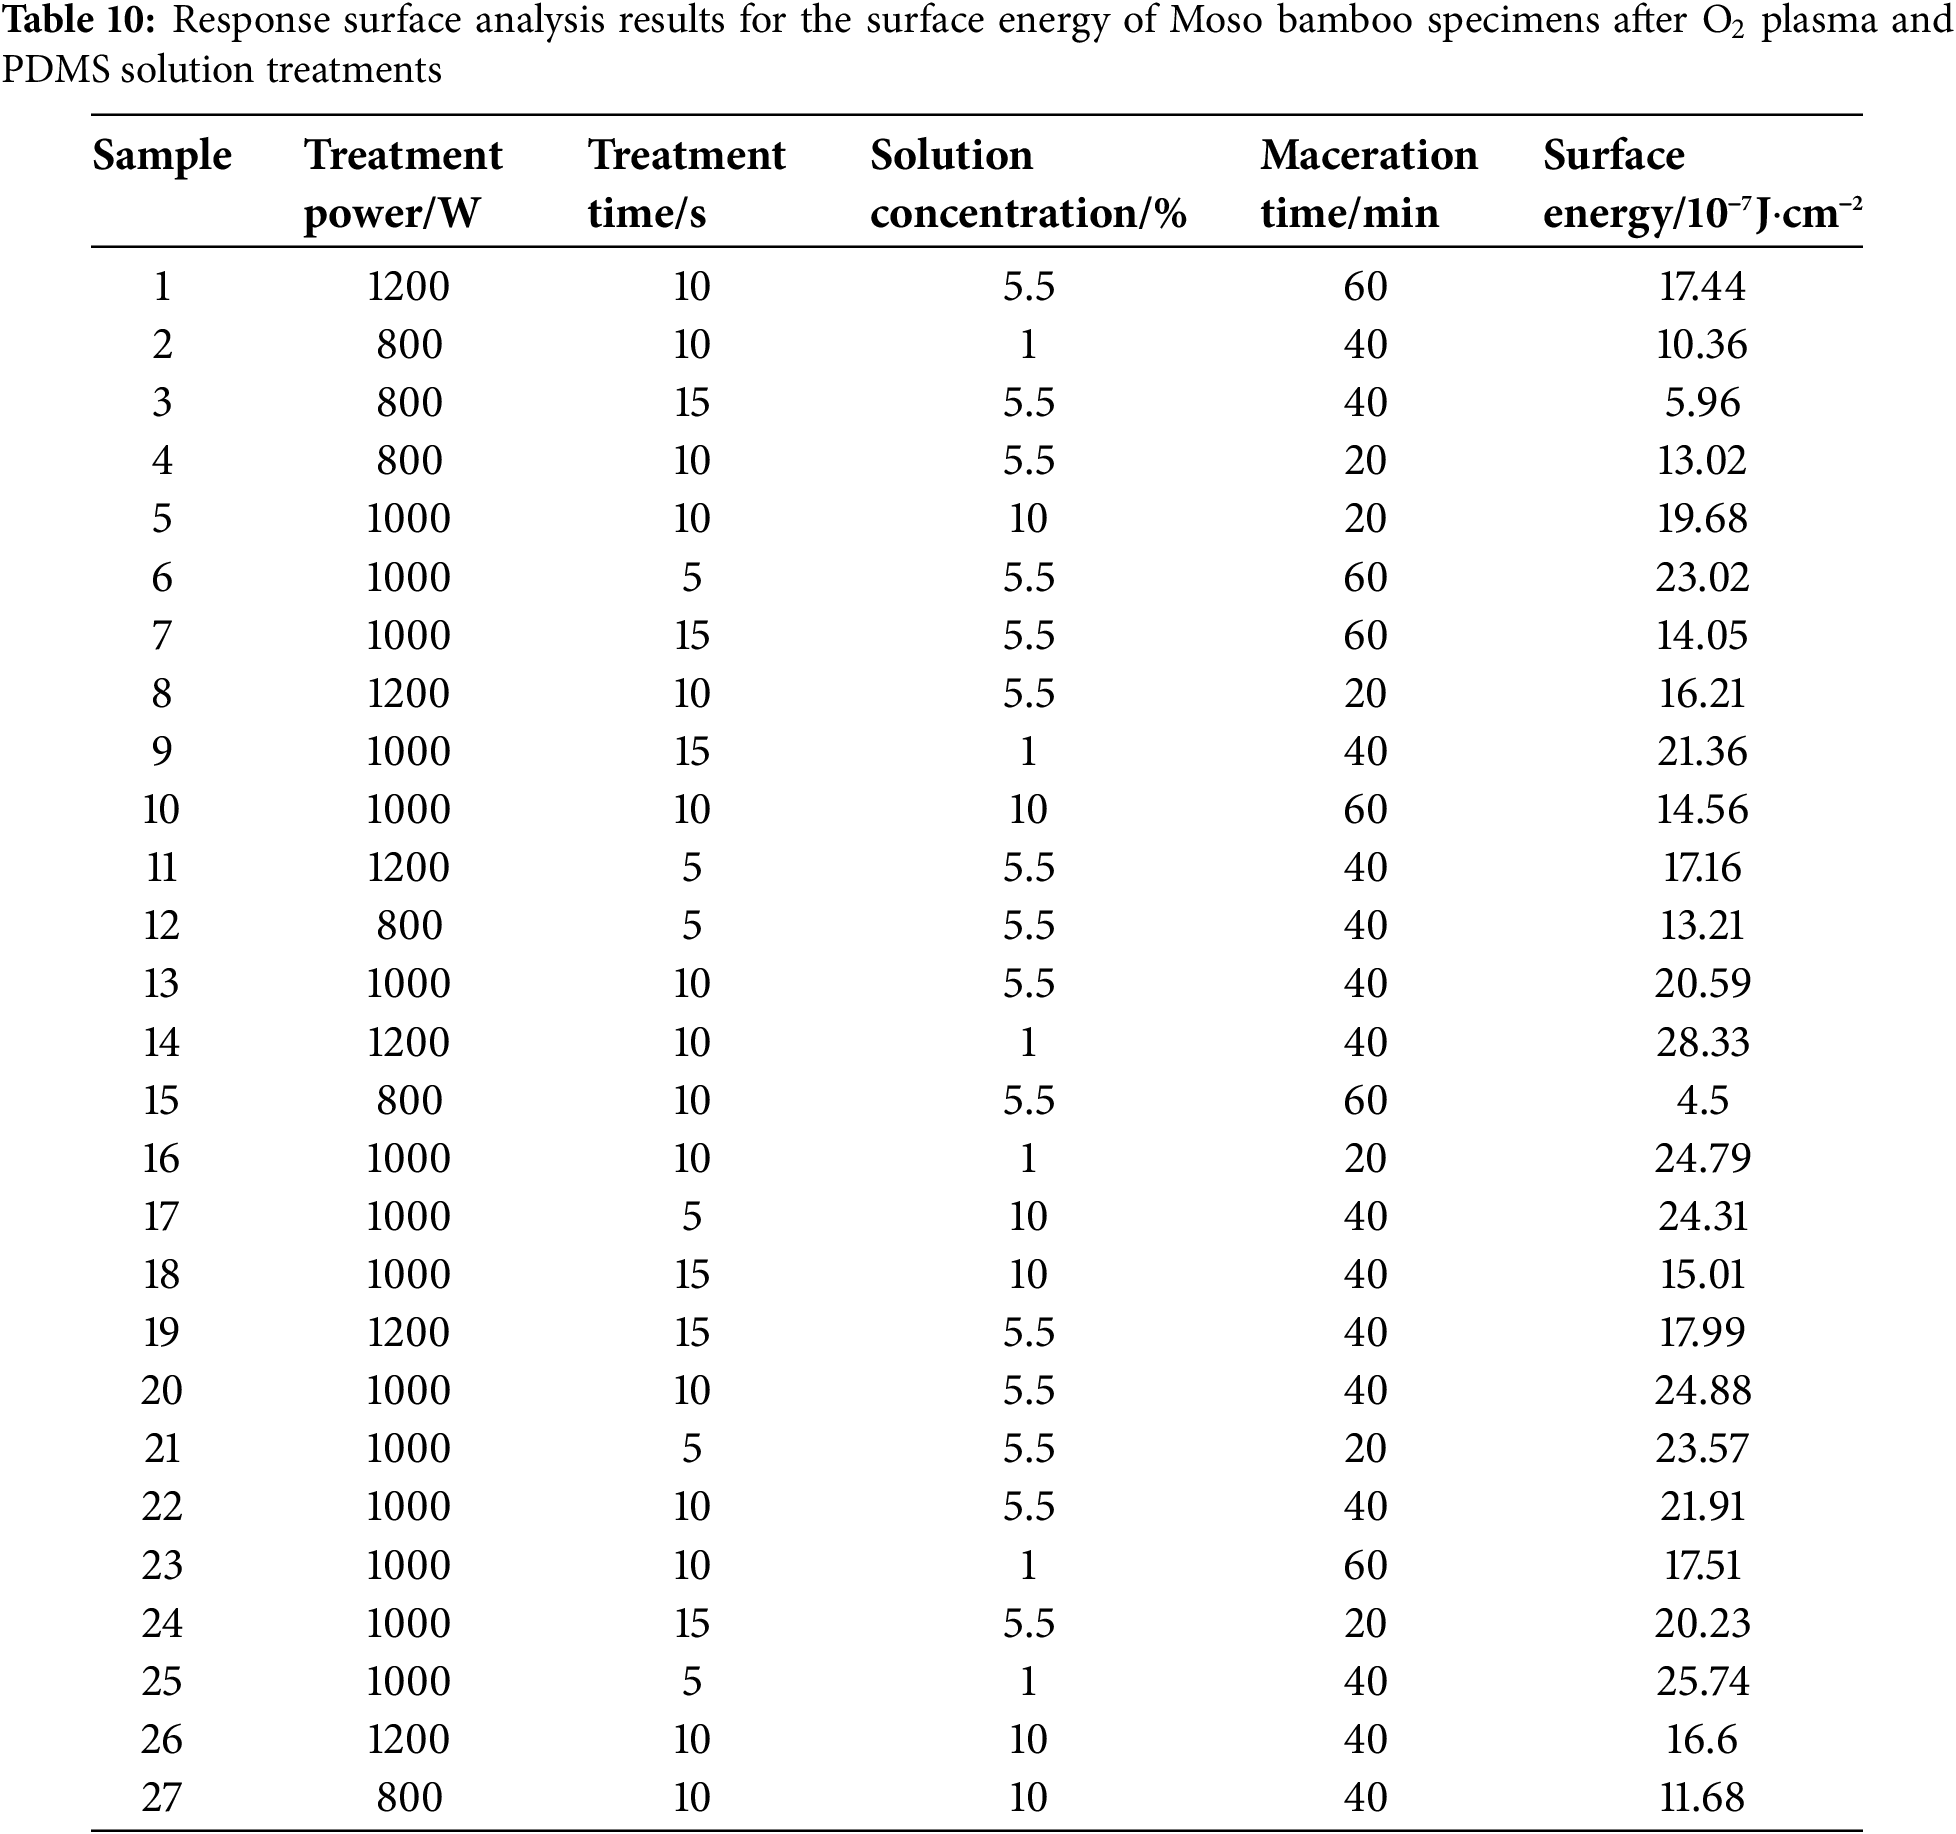
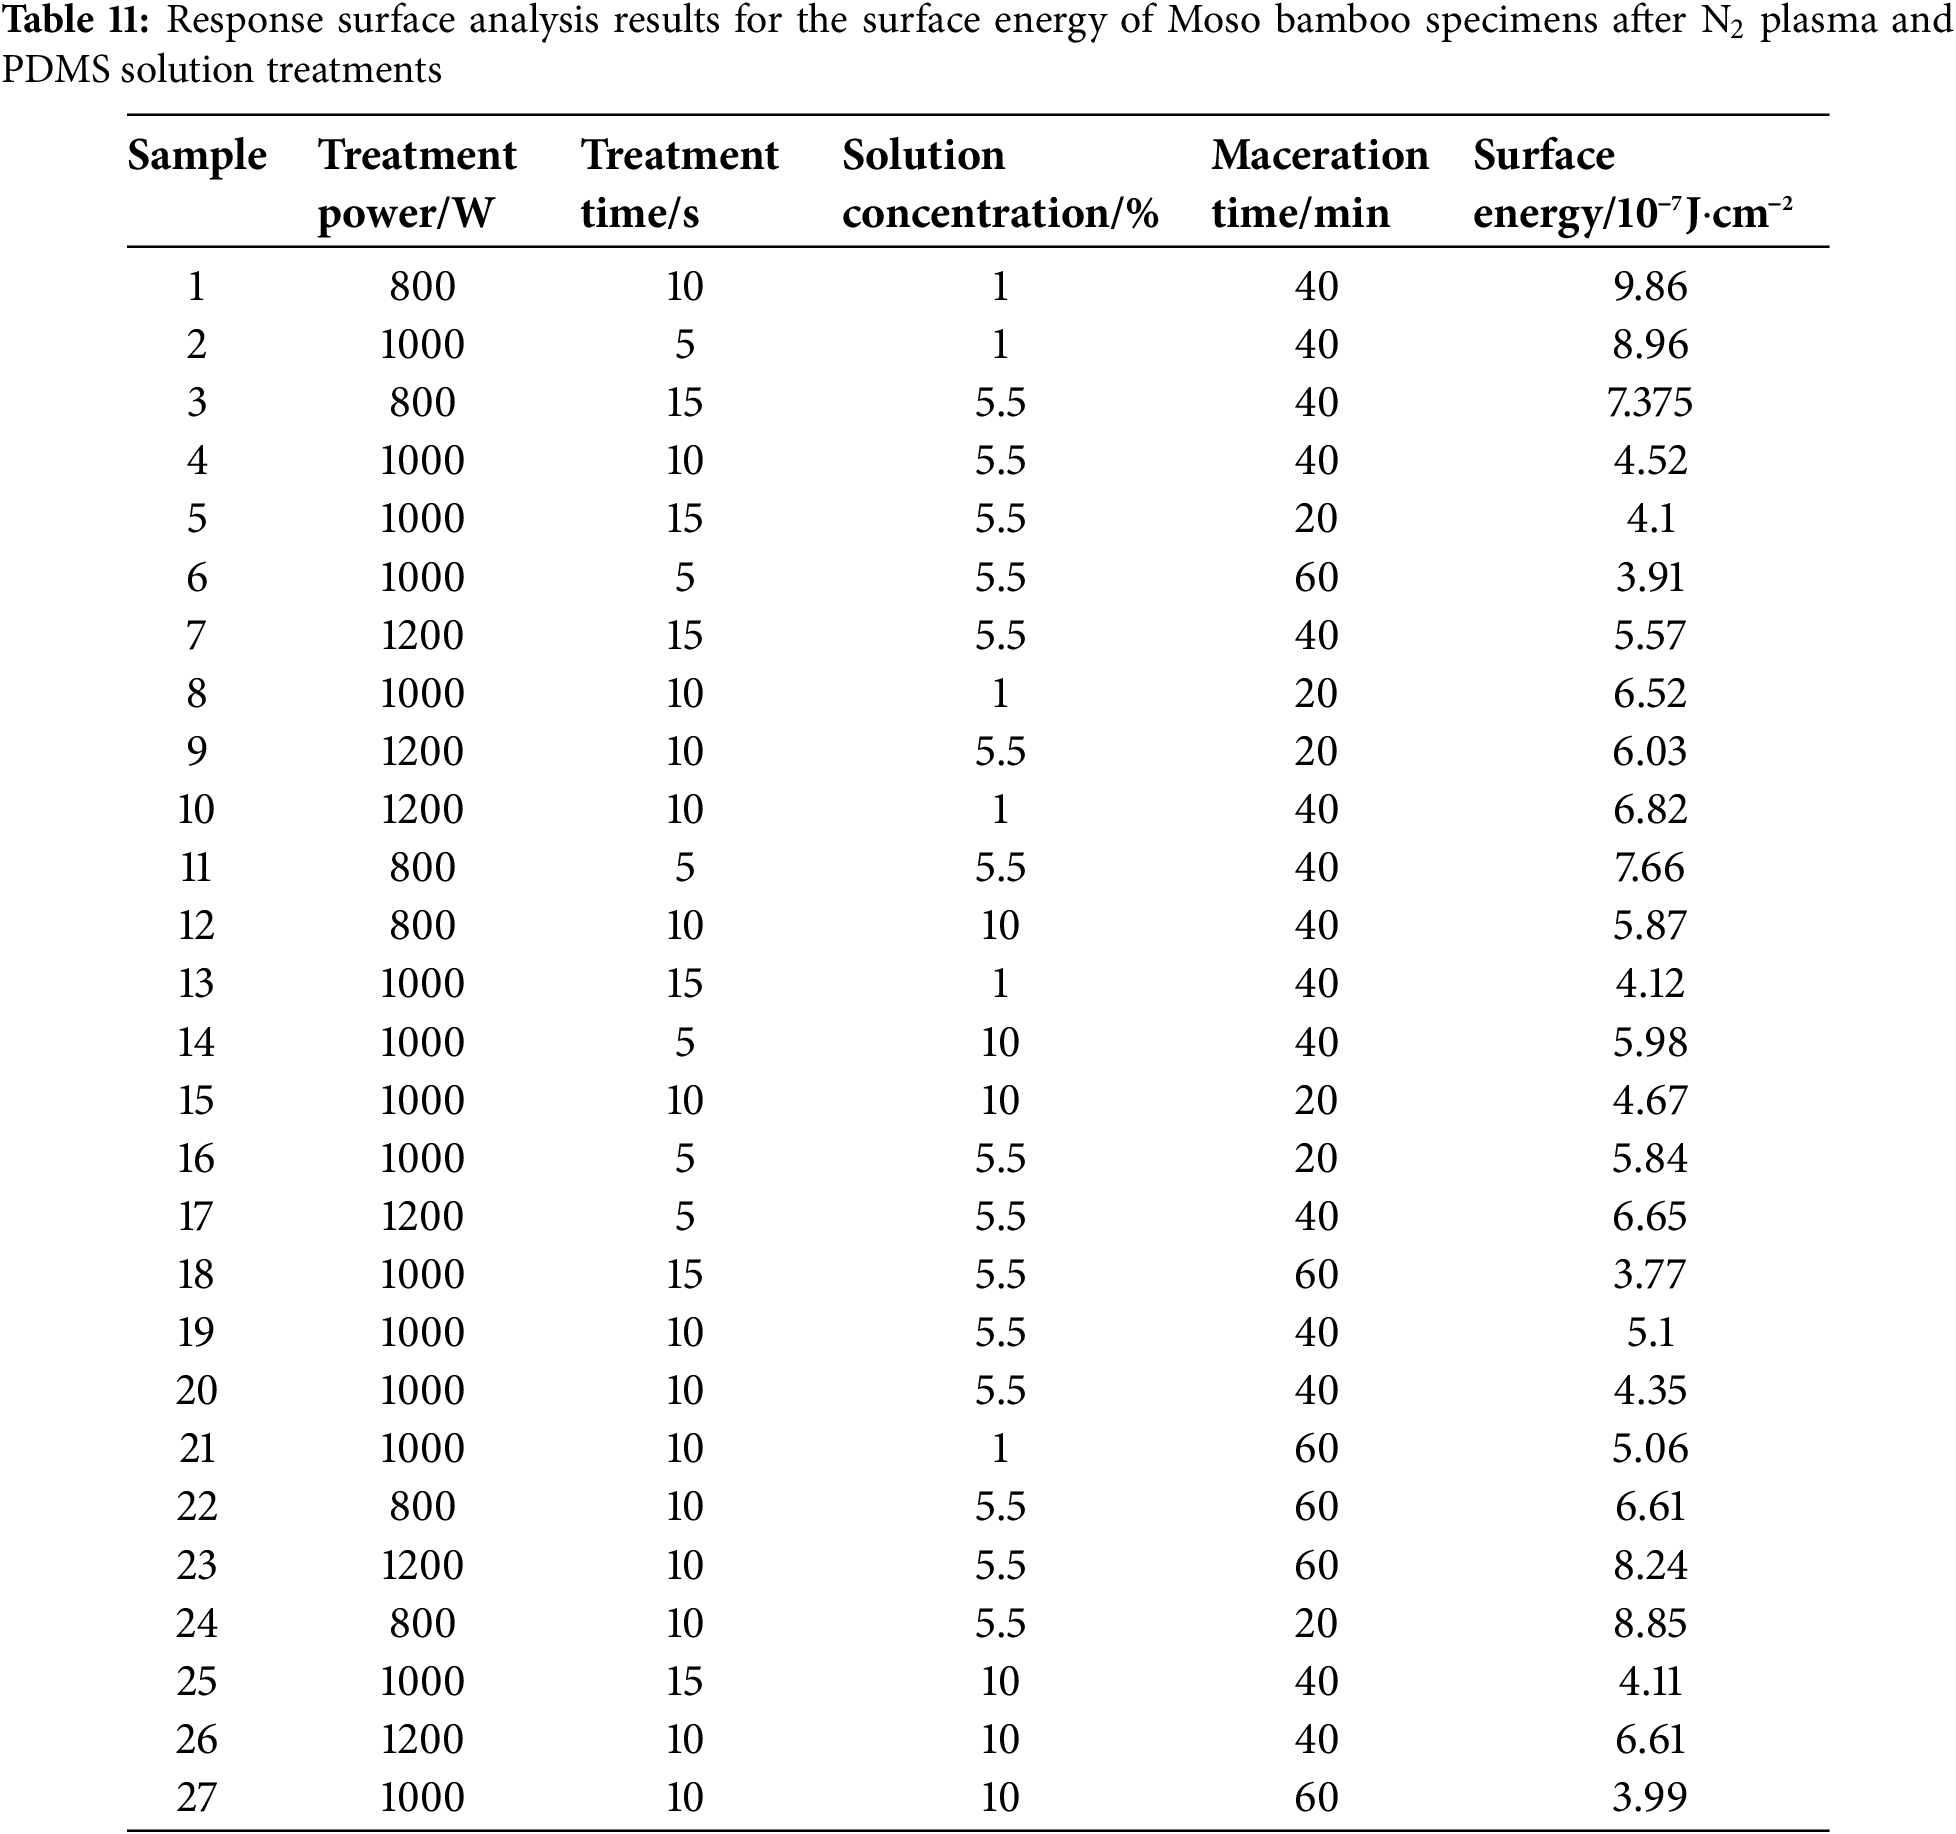
The determined surface energy values were fitted via multivariate regression fitting using Design-Expert 11.0. Then, multivariate regression equations were obtained for surface energy and treatment processing parameter in relation to treatment power, treatment time, solution concentration, and maceration time.
The multivariate regression equation for O2 plasma and PDMS solution treatments is
The multivariate regression equation for N2 plasma and PDMS solution treatments is
where Y, A, B, C, and D denote the surface energy, treatment power, treatment time, PDMS solution concentration, and maceration time, respectively.
Tables 12–15 show the variance analysis results of the quadratic model of the surface energy of Moso bamboo specimens subjected to O2/N2 plasma and PDMS solution treatments.
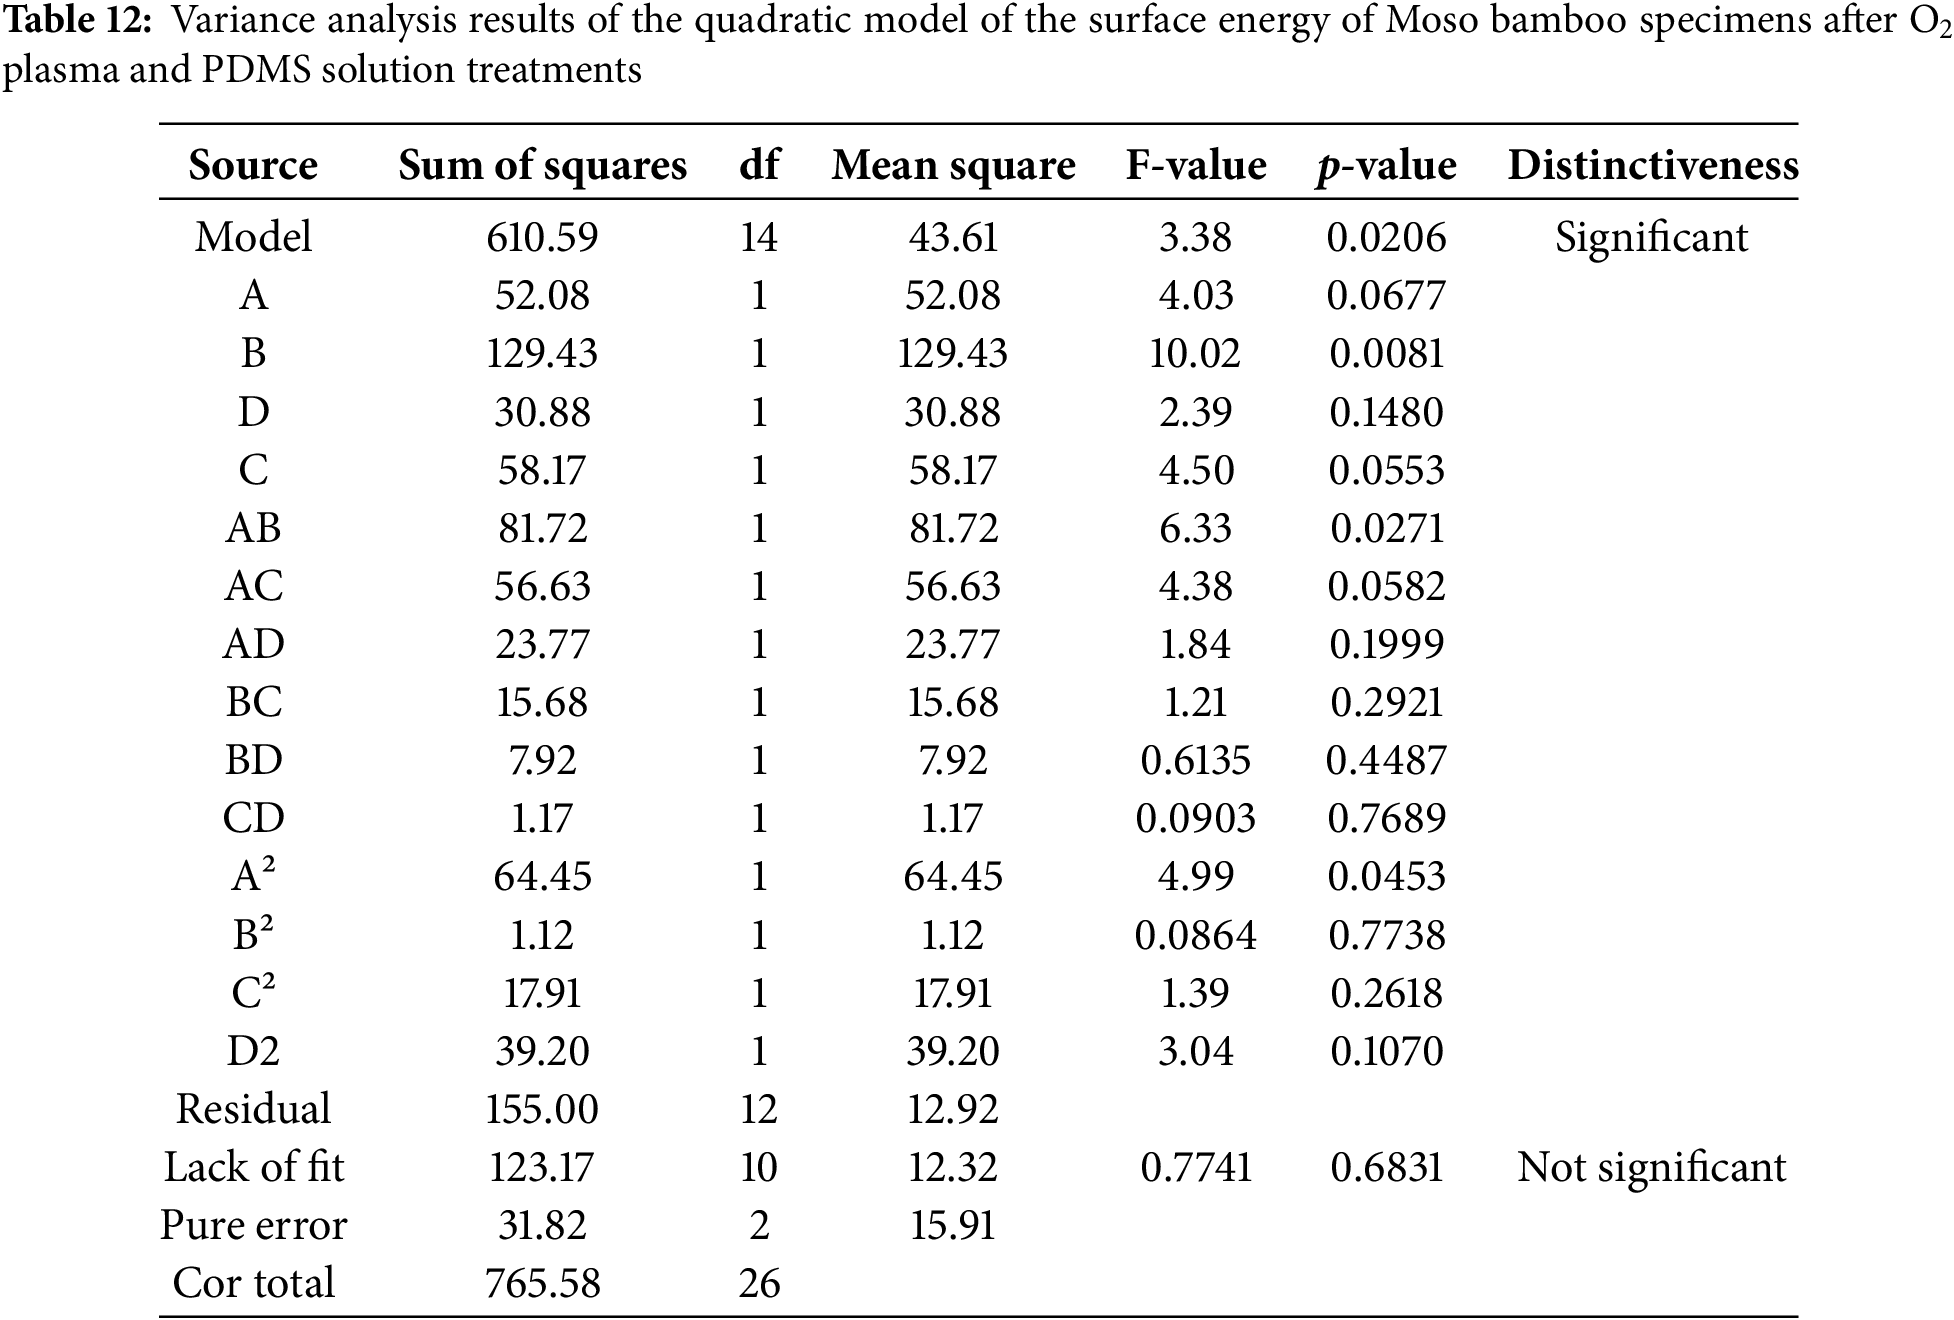


Tables 12–15 show the variance analysis results and fitting statistics for the quadratic model of Moso bamboo specimens after O2/N2 plasma and PDMS solution treatments. The F-values for the regression models were 3.38 and 6.53, respectively. The p-value for the O2 plasma quadratic model was <0.1, indicating that it was significant. The p-value for the N2 plasma quadratic model was <0.01, indicating the model was highly significant. The lack of fit p-values is 0.6831 and 0.1630, respectively, and the p-values were not significant. This suggests that the lack of fit due to errors was not significant and the equation was reliable [29]. The adjusted determination coefficients (R2Adj) were 0.8835 and 0.7486, indicating that the model can explain 88.35% and 74.86% of the variation in surface energy after O2/N2 plasma and PDMS solution treatments, respectively. The data in tables can be used for analyzing and predicting the surface energy. The coefficients of determination (R2) were 94.62% and 88.40%, respectively, indicating that both equations had a good fit and a good correlation existed between predicted and measured values [30–32]. The coefficients of variation (CV) were 11.29% and 14.39%, both below 15%, indicating that these results can be used for predictive analysis. By combining the data in Tables 12 and 14, the significance of each regression coefficient, and comparing the F-values, the extent of influence of each influencing factor on the surface energy results after O2/N2 plasma and PDMS solution treatments can be determined. Results show that the order of influence is as follows: treatment time > maceration time > treatment power > solution concentration. The order of influence after N2 plasma and PDMS solution treatment is solution concentration > treatment time > treatment power > maceration time.
4.3 Response Surface Optimization: 3D Graph Analysis
Figs. 13 and 14 show the response surface and contour plots of variations in the surface energy of Moso bamboo specimens subjected to O2 plasma treatment under different conditions of treatment power, time, PDMS solution concentration, and maceration time. The response surface plot shows the degree of influence of variables on the dependent variable. The steeper the fitted surface slope of the response surface plot and the denser the contour lines, the more significant the impact of the factor on the correlation [33]. When the contour lines are elliptical, their interaction is significant. In contrast, when the contour lines are circular, no interaction exists between the two variables [34,35]. Moreover, the slope of the response surface plot denoting the impact of treatment power and maceration time of O2 plasma on the surface energy of Moso bamboo was steep; this indicated significant interaction between the two variables [17,36,37]. Moreover, the order of influence of the interaction between various factors on the correlation was AD > AB > AC. The slope of the contour surface for BC, DC, and BD was not high and the interaction between the treatment power and maceration time of O2 plasma significantly impacted the surface energy of Moso bamboo. The interaction between the treatment time and PDMS solution concentration of O2 plasma had the least impact on the surface energy of Moso bamboo.

Figure 13: Response surface diagrams denoting the effects of treatment power, time, PDMS solution concentration, and maceration time on the surface energy of Moso bamboo specimens after O2 plasma and PDMS solution treatments

Figure 14: Contour plots of the effects of treatment power, time, PDMS solution concentration, and maceration time on the surface energy of Moso bamboo specimens after O2 plasma and PDMS solution treatments
Figs. 15 and 16 show the response surface diagrams that denoted the influence of N2 plasma and PDMS solution treatments on the surface energy of Moso bamboo with parameters including treatment power, time, PDMS solution concentration, and maceration time. The fitted surface slope of the N2 plasma treatment power and PDMS solution concentration interactions on the surface energy of Moso bamboo was steep, indicating a significant interaction between the two parameters. The interactive effect of PDMS solution concentration and maceration time on the surface energy of Moso bamboo was relatively minor, whereas that of treatment power and solution concentration is the most significant. As the maceration time increases, the change in the surface energy of Moso bamboo specimens became notably smaller. The order of influence of the interactions between factors on the correlation was AC > AD > BC > CD > BD.

Figure 15: Response surface diagrams denoting the effects of treatment power, time, PDMS solution concentration, and maceration time on the surface energy of Moso bamboo specimens after N2 plasma and PDMS solution treatments

Figure 16: Contour plots of the effects of treatment power, time, PDMS solution concentration, and maceration time on the surface energy of Moso bamboo specimens after N2 plasma and PDMS solution treatments
The effects of O2/N2 plasma and PDMS solution treatments on the surface hydrophobicity of Moso bamboo were studied using the single factor method. Moreover, the surface morphology and chemical groups in the specimens before and after treatment were analyzed. Response surface analysis was performed to establish the relationship model between the surface energy of bamboo and plasma treatment power, time, PDMS solution concentration, and maceration time. The influence of these factors on the surface energy results of bamboo was analyzed. The results are as follows:
(1) The hydrophobicity of the Moso bamboo surface can be modified by combining plasma treatment with PDMS solution treatment. This method is easy, nontoxic, and inexpensive; it also exhibits high hydrophobic modification efficiency. This makes it suitable for industrial applications.
(2) The combination of O2/N2 plasma treatments with PDMS solution treatment considerably improved the hydrophobicity of the Moso bamboo surface; the optimal process conditions were determined as follows. For O2 plasma treatment, treatment power was 800 W, treatment time was 15 s, O2 flow rate was 1.5 L/min, PDMS solution concentration was 5%, and maceration time was 60 min. For N2 plasma treatment, treatment power was 1000 W, treatment time was 15 s, N2 flow rate was 1.5 L/min, PDMS solution concentration was 5%, and maceration time was 60 min.
(3) After plasma and PDMS solution treatments, abundant silicone oil particles appeared on the Moso bamboo surface along with pores of varying sizes. Thus, plasma treatment produced a certain cross-linking effect on the Moso bamboo surface.
(4) The degree of influence of two plasma treatments and PDSM solution treatment on the surface energy of the Moso bamboo are as follows: plasma treatment time > maceration time > plasma treatment power > PDMS solution concentration (O2 plasma) and PDMS solution concentration > plasma treatment time > plasma treatment power > maceration time (N2 plasma).
Acknowledgement: The authors gratefully thank the financial support from Zhejiang Provincial Cooperative Forestry Science and Technology Project and Zhejiang Provincial Science and Technology Project.
Funding Statement: Zhejiang Provincial Cooperative Forestry Science and Technology Project (No. 2023SY05) and Zhejiang Provincial Science and Technology Project (No. 2024F1065-2).
Author Contributions: Conceptualization: Hongyan Wang and Shaofei Yuan; methodology: Hongyan Wang and Yan Wu; formal analysis: Zihan Ma; writing—original draft preparation: Zihan Ma; writing—review and editing: Hongyan Wang and Jian Zhang. All authors reviewed the results and approved the final version of the manuscript.
Availability of Data and Materials: The data that support the findings of this study are available from the corresponding author, Hongyan Wang, upon reasonable request.
Ethics Approval: Not applicable.
Conflicts of Interest: The authors declare no conflicts of interest to report regarding the present study.
References
1. Tian GL, Yu Y, Wang G, Cheng HT, Lu F. Preliminary study on super-hydrophobic modification of bamboo. J Beijing For Univ. 2010;32(3):166–9. [Google Scholar]
2. Hu XC, Bai J, Luo H, Qing YC, Wu YB. Preparation and properties of epoxy resin/polydimethylsiloxane/MCM-41 superhydrophobic coating. PCI Magaz. 2023;53(12):1−8+15. doi:10.12020/j.issn.0253-4312.2023-175. [Google Scholar] [CrossRef]
3. Sun R, Zhao J, Liu C, Yu N, Mo J, Pan Y, et al. Design and optinization of hybrid supertydrophobic-hydrophilic pattern surfaces for improving fog harvesting efficiency. Prog Org Coat. 2022;171:107016. doi:10.1016/j.porgcoat.2022.107016. [Google Scholar] [CrossRef]
4. Elinas K, Gogoldes E. Ultra-low frction, superhydrophobic, plasma micro-nanotextured fluorinated ethylene propylene (FEP) surfaces. Microsyst Nanoeng. 2022;14:100104. doi:10.1016/j.mne.2022.100104. [Google Scholar] [CrossRef]
5. Zhang K, Zhang XY, Wang BN, Liu JC, Wei W, Li XJ. Cycloaliphatic epoxy polydimethylsiloxane as modifier for cycloaliphatic epoxy resin. CSCD. 2023;38(5):15–22. [Google Scholar]
6. Pan Z, Chen M, Zeng K, Kang Y. Synthesis of epoxy-modified methyl phenyl silicone resins for LED encapsulation. Silicon. 2022;14(3):1159–67. doi:10.1007/s12633-020-00868-6. [Google Scholar] [CrossRef]
7. He XW, Fu SY, Dai YP, Jin CD, Wang FP. Research on surface characteristics of bamboo with bionic super-hydrophobic Chinese Rose/TiO2. World Bamboo and Rattan. 2017;15(5):11–15. [Google Scholar]
8. Guo F, Fang K, Song Y, Fu R, Li H, Zhang C. Optimizing a fabricating program for wearable super-hydrophobic cotton by clean production technology of plasma and reducing chemical consumption. J Clean Prod. 2020;276(20):124233. doi:10.1016/j.jclepro.2020.124233. [Google Scholar] [CrossRef]
9. Zhang Y, Zhang X, Yu Y, Che W, Zhang X, Hou J. Evaluating the comprehensive influences of heat treatment and polydimethylsiloxane on integrated performance of bamboo timber. RSC Adv. 2020;10(71):43438–46. doi:10.1039/D0RA08713K. [Google Scholar] [PubMed] [CrossRef]
10. Wang X, Cheng KJ. Effect of glow-discharge plasma treatment on contact angle and micromorphology of bamboo green surface. Forests. 2020;11(12):1293. doi:10.3390/f11121293. [Google Scholar] [CrossRef]
11. Parvinzadeh Gashti M, Hegemann D, Stir M, eHulliger J. Thin film plasma functionalization of polyethylene terephthalate to induce bone-like hydroxyapatite nanocrystals. Plasma Process Polym. 2014;11(1):37–43. doi:10.1002/ppap.201300100. [Google Scholar] [CrossRef]
12. Li R, He CJ, Peng B, Wang CG. Differences in fiber morphology and partial physical properties in different parts of Phyllostachys edulis. J Zhejiang A&F Univ. 2021;38(4):854–60. doi:10.11833/j.issn.2095-0756.20200649. [Google Scholar] [CrossRef]
13. Wang HY, Du GB, Han YG, Yu JB. Influence of dielectric barrier discharge (DBD) cold plasma treatment on wettability of Pinus yunnanensis wood. J For Eng. 2013;27(1):35–7. [Google Scholar]
14. Zuo WJ. Advances in the study of droplet impact behaviour on the surface of superhydrophobic structures. J Mater. 2023;17(4):676–89. [Google Scholar]
15. Sun CW, Liu AJ, Du G. Plasma treatment of bamboo fibers on the tribological property of polyimide composite filled with graphite. Surf Interface Anal. 2018;50(2):234–9. doi:10.1002/sia.6362. [Google Scholar] [CrossRef]
16. Lin WS. Study on the properties ofhydrophobic/superhydrophobic coatingsconstructed in situ on wood surface basedon organosilicon chemistry [Ph.D. thesis]. China:Fujian Agriculture and Forestry University 2023. doi:10.27018/d.cnki.gfjnu.2023.000012. [Google Scholar] [CrossRef]
17. Wu W, Yuan S, Zhang W, Zhao Y, Wang H, Wang J, et al. Preparation and performance of a bamboo-based electromagnetic wave absorber by interfacial polymerization of graphene oxide/polyaniline. Arab J Chem. 2024;17(3):105651. doi:10.1016/j.arabjc.2024.105651. [Google Scholar] [CrossRef]
18. Li X, Zhong SH, Chen H, Li JJ. Chemical composition and thermal stability of cells in different structures of Phyllostachys edulis. J Beijing For Univ. 2023;45(8):156–62. (In Chinese). [Google Scholar]
19. Rocky BP, Thompson AJ. Characterization of the crystallographic properties of bamboo plants, natural and viscose fibers by X-ray diffraction method. J Text Inst. 2020;112(8):1295–303. doi:10.1080/00405000.2020.1813407. [Google Scholar] [CrossRef]
20. Liu MD. Study on the cell morphology and chemicalcomposition of moso bamboo during the ageing [master’s thesis]. China: Guangxi University. 2023. doi:10.27034/d.cnki.ggxiu.2022.002260. [Google Scholar] [CrossRef]
21. Hong C. Study on the structural characteristics of bamboo cel wall [Ph.D. thesis]. China: Chinese Academy of Forestry; 2014. [Google Scholar]
22. Asmare FW, Liu X, Qiao G, Li R, Murugesh BK, Wu D. Investigation and application of different extraction techniques for the production of finer bamboo fibres. Adv Bamboo Sci. 2024;7:100070. doi:10.1016/j.bamboo.2024.100070. [Google Scholar] [CrossRef]
23. Wang XQ, Ren H, Zhao RJ, Cheng Q, Chen YP. FTIR and XPS spectroscopic studies of photodegradation of moso bamboo (Phyllostachys pubescens mazel). Spectrosc Spect Anal. 2009;29(7):1864–7. doi:10.3964/j.issn.1000-0593(2009)07-1864-04. [Google Scholar] [CrossRef]
24. Yu H, Pan X, Wang Z, Yang WM, Zhang WF, Zhuang XW. Effects of heat treatments on photoaging properties of moso bamboo (Phyllostachys pubescens Mazel). Wood Sci Technol. 2018;52(6):1671–83. doi:10.1007/s00226-018-1042-x. [Google Scholar] [CrossRef]
25. Rachtanapun P, Sawangrat C, Kanthiya T, Thipchai P, Kaewapai K, Suhr J, et al. Effect of plasma treatment on bamboo fiber-reinforced epoxy composites. Polymers. 2024;16(7):938. doi:10.3390/polym16070938. [Google Scholar] [PubMed] [CrossRef]
26. Leonard D, Bertrand P, Scheuer A, Prat R, Hommet J, Le Moigne J, et al. Time-of-flight SIMS and in-situ XPS study of O2 and O2-N2 post-discharge microwave plasma-modified high-density polyethylene and hexatriacontane surfaces. J Adhes Sci. 1996;10(11):1165–97. doi:10.1163/156856196x00184. [Google Scholar] [CrossRef]
27. Xu G, Wang L, Liu J, Wu J. FTIR and XPS analysis of the changes in bamboo chemical structure decayed by white-rot and brown-rot fungi. Appl Surf Sci. 2013;280:799–805. doi:10.1016/j.apsusc.2013.05.065. [Google Scholar] [CrossRef]
28. Ghobeira R, Tabaei PSE, Morent R, Geyter ND. Chemical characterization of plasma-activated polymeric surfaces via XPS analyses: a review. Surf Interfaces. 2022;31:102087. doi:10.1016/j.surfin.2022.102087. [Google Scholar] [CrossRef]
29. Sawangrat C, Thipchai P, Kaewapai K, Jantanasakulwong K, Suhr J, Wattanachai P, et al. Surface modification and mechanical properties improvement of bamboo fibers using dielectric barrier discharge plasma treatment. Polymers. 2023;15(7):1711. doi:10.3390/polym15071711. [Google Scholar] [PubMed] [CrossRef]
30. Zhou XY. Study about the characteristic of bamboo surface and interface bythe treatment of cold temperature plasma [master’s thesis]. China: Nanjing Forestry University; 2008. [Google Scholar]
31. Chen YJ, Lu WT, Yang YT. Optimization of laser paint removal process for carbon fiber composite substrate based on response surface analysis. Chin J Lasers. 2023;50(12):165–76. [Google Scholar]
32. Lin B, Zhai XY, Li R, Sun LP, Zhang YT, Yin YX, et al. Optimization of preparation process of birch veneer/glass fiber composite. J Beijing For Univ. 2019;41(4):127–35. [Google Scholar]
33. Dan Z, Li C, Li Y, Zhang X, Huang Q. Optimization of polyvinyl alcohol chitosan hydrogel formulation by response surface analysis. Guangdong Chem Ind. 2018;45(16):7–10. (In Chinese). [Google Scholar]
34. Shi LJ, Zhang DF, Hu M. Optimization of preparations of MIP-N-TiO2 by response surface methodology. Guangzhou Chem Ind. 2018;46(18):74–8. (In Chinese). [Google Scholar]
35. Mäkelä M. Experimental design and response surface methodology in energy applications: a tutorial review. Energ Convers Manage. 2017;151:630–40. doi:10.1016/j.enconman.2017.09.021. [Google Scholar] [CrossRef]
36. Downing DJ, Gardner RH, Hoffman FO. An examination of response-surface methodologies for uncertainty analysis in assessment models. Technometrics. 1985;27(2):151–63. doi:10.1080/00401706.1985.10488032. [Google Scholar] [CrossRef]
37. Chen S, Zhang J, Jiang H. Application of response surface methodologyin optimizing flocculation-coagulation process of sweet potato wastewater. Food Ferment Ind Editor Staff. 2019;45(6):165–71. (In Chinese). [Google Scholar]
Cite This Article
 Copyright © 2025 The Author(s). Published by Tech Science Press.
This work is licensed under a Creative Commons Attribution 4.0 International License , which permits unrestricted use, distribution, and reproduction in any medium, provided the original work is properly cited.
 Downloads
 Citation Tools