
 Submit a Paper
 Propose a Special lssue
 Open Access
ARTICLE
Optimizing Activation Temperature of Sustainable Porous Materials Derived from Forestry Residues: Applications in Radar-Absorbing Technologies
1 National Institute for Space Research, São José dos Campos, 12227-010, Brazil
2Departamento de Engenharias e Computação (DEC), Universidade Estadual de Santa Cruz (UESC), Ilhéus, 45662-900, Brazil
3 Department of Metallurgical and Materials Engineering, University of São Paulo, São Paulo, 05508-030, Brazil
4 Institut de recherche sur les forêts (IRF), Université du Québec en Abitibi-Témiscamingue (UQAT), Rouyn-Noranda, QC J9X 5E4, Canada
* Corresponding Author: Flavia Lega Braghiroli. Email:
(This article belongs to the Special Issue: Renewable Nanostructured Porous Materials: Synthesis, Processing, and Applications)
Journal of Renewable Materials 2025, 13(6), 1021-1042. https://doi.org/10.32604/jrm.2025.02025-0017
Received 22 January 2025; Accepted 27 March 2025; Issue published 23 June 2025
 View Full Text
 Download PDF
Abstract
Biochar, a carbon-rich material derived from the thermochemical conversion of biomass under oxygen-free conditions, has emerged as a sustainable resource for radar-absorbing technologies. This study explores the production of activated biochars from end-of-life wood panels using a scalable and sustainable physical activation method with CO2 at different temperatures, avoiding the extensive use of corrosive chemicals and complex procedures associated with chemical or vacuum activation. Compared to conventional chemically or vacuum-activated biochars, the physically activated biochar demonstrated competitive performance while minimizing environmental impact, operational complexity, and energy consumption. Furthermore, activation at 750°C reduces energy consumption by 14% and 28% compared to activations at 850°C and 950°C, respectively, emphasizing the cost-effectiveness of this method for large-scale applications. The composite with 15% of biochar embedded in silicon rubber presented good electromagnetic performance, achieving a measured reflection loss (RL) of −37.2 dB at 11.3 GHz with an 8.4 mm thickness and an effective absorption bandwidth (EAB) of 1.25 GHz. These results highlight the potential of biochar-silicone rubber composites as flexible radar-absorbing materials (RAMs) for applications in electromagnetic shielding, anechoic chambers, and Internet of Things (IoT) devices. This study also shows the importance of forestry residues as sustainable precursors for producing low-cost porous carbon materials, aligning with circular economy principles and the United Nations’ 2030 Agenda for Sustainable Development. This work establishes a framework for scalable, cost-effective, and sustainable biochar production, addressing critical challenges in electromagnetic interference (EMI) mitigation and advancing the global adoption of green technologies.Graphic Abstract
Keywords
Biochar is a carbon-rich material produced through thermochemical processes such as torrefaction, pyrolysis, or gasification of biomass or biomass waste under an oxygen-free environment. The diversity in biomass types and production conditions, including activation method, temperature, residence time, and heating rate, results in activated biochar with a wide range of physicochemical properties [1,2]. These properties typically include carbon content higher than the pristine material, developed surface areas up to 500 m2/g, cation exchange capacity, and functional groups such as carboxyl, hydroxyl, and phenolic moieties.
Biochar has gained significant attention in recent decades due to its ability to interact with contaminants and organic matter, making it highly versatile for a wide range of applications [3–5]. These applications include its use in bioenergy production via biochar pellets [6], as an additive in construction materials such as concrete [7], in composting processes [8], as an adsorbent for pollutants [9,10], and as a catalyst or catalyst support in chemical reactions [11,12]. Additionally, biochar has shown promise in land restoration efforts, including rehabilitating degraded sites and the remediation of contaminated areas [13,14].
Several kinds of biomass waste have been identified as good precursors to produce biochar. Specifically, wood has been considered a great source of bioenergy due to its high carbon content. However, not only wood but also wood waste, including engineered wood from mass timber, composite wood, and low-grade wood waste like painted wood, wood treated with preservatives, and wood fibers combined with thermosetting resins from end-of-life panels [15]. Most of the wood decontamination processes are done at a laboratory scale, including biological and chemical decontamination to degrade and remove the chemical contaminants, as well as thermal decontamination to convert low-grade wood residues into biochar (instead of chemicals removal). Differently from the other approaches, thermal decontamination could be easily scaled up through pyrolysis furnaces existents [16]. Biochar’ s ability to capture carbon and enhance soil fertility highlights its significant role in climate change mitigation, with the potential to offset 1.9 to 4.8 GtCO2 annually [17]. As a result, biochar has attracted considerable interest from policymakers and industry, with the global biochar market anticipated to expand from $220.27 million in 2022 to $633.31 million by 2032, partly driven by its growing integration into carbon credit markets [18,19]. However, challenges remain in scaling biochar-based circular economy technologies, customizing production processes for specific applications, and optimizing its physicochemical properties. In this context, pilot-scale biochar production serves as a critical initial step toward large-scale production, motivating the expansion of the global biochar market.
An emerging application of biochar is its use as a RAM, essential in scenarios demanding both lightweight structures and efficient electromagnetic wave absorption [20,21]. RAMs are widely used in stealth technologies to reduce radar cross-sections in military applications. They are also utilized in civilian domains such as electromagnetic shielding, anechoic chambers, and microwave heating [22,23] Typically, RAMs consist of dielectric, magnetic, or hybrid materials, with carbon-based fillers serving as key dielectric components. While nanostructured carbons like carbon nanotubes and graphene have received significant research attention [24,25], biochar derived from biomass sources, including bamboo [26], coconut shells [27], loofah sponges [28,29], and rice husks [30], is becoming more known. Biochar can be utilized in pure carbon form or functionalized with metallic or magnetic particles to enhance attenuation properties. Despite moderate reflection loss (RL) performance, biochar can be effectively integrated into multilayer absorber structures or frequency-selective surfaces [31,32].
The growing dependence on wireless technologies, electronic devices, 5G networks, and communication systems has intensified the demand for materials capable of absorbing or attenuating electromagnetic radiation across a broad range of frequencies [33–37]. Additionally, attenuating EMI pollution, recognized as a threat to both human health and the functionality of electronic devices, has emerged as a critical challenge [38]. To address the need for cost-effective, sustainable, and high-performance RAMs, this study investigates the production of sustainable activated biochars derived from end-of-life wood panels at relatively low activation temperatures (750°C). These biochars are assessed for their potential as flexible, eco-friendly RAMs, providing an innovative approach to decrease EMI pollution and associated issues.
2.1 Preparation of Biochar-Derived Materials
End-of-life particle panels were collected at the Enviroparc de la MRC de La Vallée-de-L’ Or (Val d’ Or, QC), ground, and pyrolyzed through an industrial scale fast pyrolysis (CarbonFX technology, Airex Energy Inc., Bécancour, QC, Canada). The biochar generated was then physically activated in an in-house activation furnace developed in the laboratory at 750°C, 850°C, and 950°C under a N2 flow to maintain the system inert and CO2 at 3 L/min at the desired temperature for 1 h. More details about these processes can be found elsewhere [1]. The pristine biochar and activated samples were labeled according to their final treatment temperature as 450, 750, 850, and 950. The activated materials were grounded to particles lesser than 200 μm.
2.2 Preparation of Composite Materials
Composite samples were prepared by physically blending silicone rubber with 15% biochar, which was identified as the saturation point. The mixture was mechanically stirred for 5 min to ensure uniform dispersion. Subsequently, the mixtures were poured into molds with dimensions of 10.16 × 22.86 mm and thicknesses varying from 0.8 to 9.6 mm. This approach produced composite materials exhibiting high flexibility and environmental sustainability.
2.3 Materials Characterization
The morphology of the samples was assessed using a Field Emission Gun Scanning Electron Microscopy (FEG-SEM), TESCAN model MIRA3, in the SE mode at a voltage of 5 kV. The X-ray diffractometry (XRD) was conducted in a PANalytical X’ PertPRO automatic diffractometer, operating with CuKα radiation (λ = 1.54 Å). Raman spectra of the samples were acquired using a Horiba Scientific model Labram Hr Evolution spectrometer equipped with a 514.6 nm laser. The spectrum was recorded as the average value of three consecutively acquired spectral acquisitions for each sample. The deconvolution peaks were identified and calculated using conventional four curves fitting [39].
Nitrogen adsorption/desorption isotherms were recorded at 77 K using an ASAP 2020 PLUS instrument. Before analysis, the samples were outgassed for 24 h under vacuum, with temperatures ranging from 150°C for the pristine sample to 250°C for the activated samples to remove any adsorbed contaminants. The specific surface area (SBET) and the micropore volume (VDR) were determined using the Brunauer-Emmett-Teller (BET) [40] and the Dubinin-Radushkevich (DR) [41] methods, respectively. The mesopore volume (Vmeso) was obtained by subtracting VDR from the total pore volume at a relative pressure (P/P0) of 0.99, denoted as V0.99. The pore size distribution was subsequently calculated using the Density Functional Theory (DFT) method. The chemical composition of the biochar-derived materials was investigated by X-ray Photoelectron Spectroscopy, using a PHI 5600-ci spectrometer (Physical Electronics, Eden Prairie, MN, USA). The main XPS chamber was maintained at a pressure of <1.10−8 Torr. A standard aluminum X-ray source was used to record survey and high-resolution spectra.
The flexible composites were characterized using a Keysight N5235A Vector Network Analyzer (VNA). The material went through dielectric characterization using the epsilon precision method [42] only since there are no metallic ions in the composition and, therefore, no magnetic characteristic. The relative complex permittivity
The Reflection Loss (RL) was calculated using [43]:
where
where
3.1 Morphological, Textural, Structural and Chemical Analysis
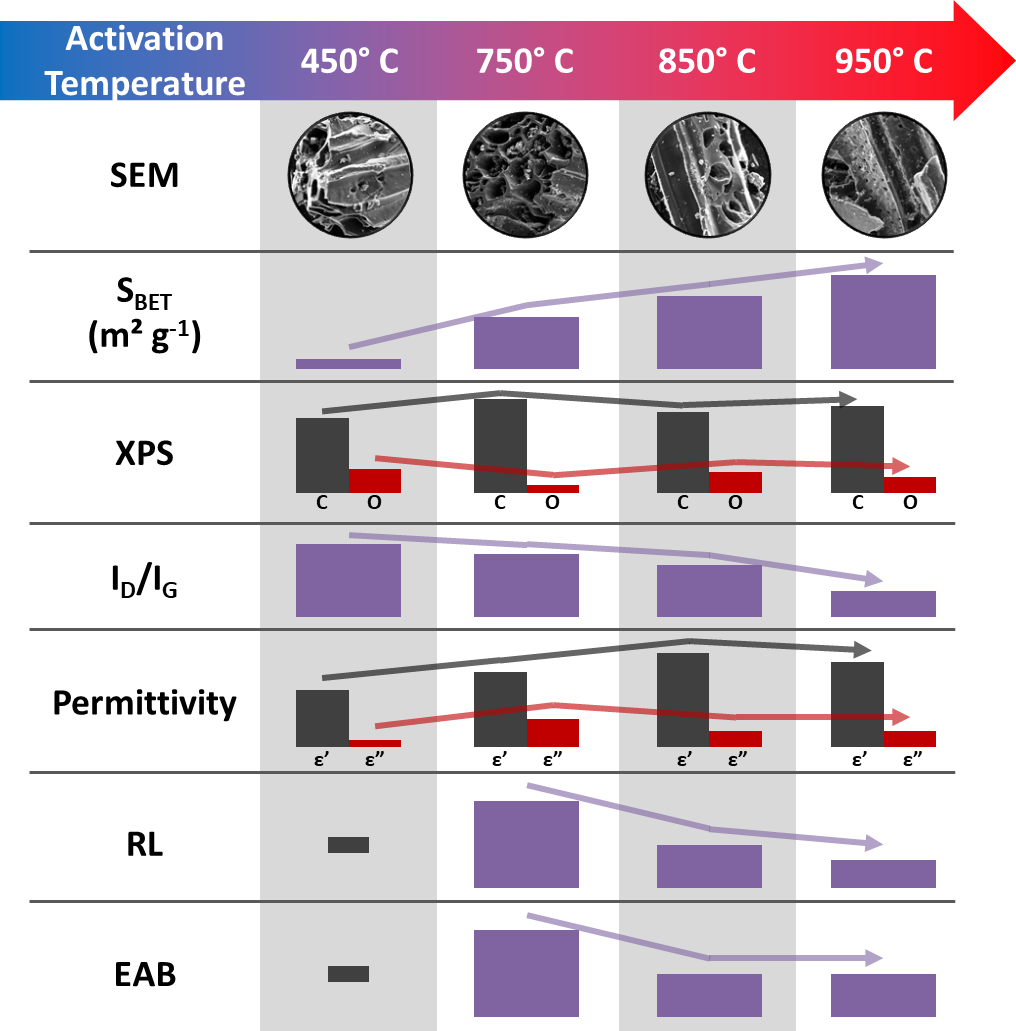
The morphology of end-of-life wood panels materials after pyrolysis followed by activation is illustrated in the following micrographs. The characteristic honeycomb-like structure, commonly observed in biochar-based materials [31], is present in all samples, as shown in Fig. 1. The porosity on the surface of the honeycomb walls seems to rise as the activation temperature increases, consistent with previous studies reporting an increase in surface area and porosity with higher activation temperatures [1]. At 850°C, smaller pores become visible on the sample surfaces, while at 950°C, the surface roughness increases significantly, indicating a further enhancement in porosity. This trend has been widely reported in the literature for biochar activated at higher temperatures [44]. The roughness and pore structure increase suggests enhanced material properties for applications such as wastewater treatment [3,4] and energy storage [45]. Elevated activation temperatures are known to promote the development of a more accessible surface, facilitating molecular or ion interactions, including catalytic and adsorption processes [46]. Porosity plays an important role in reducing the weight of RAMs or radomes [47,48] and can be used to design a material with a specific permittivity that can be estimated through Maxwell-Garnett equations [49].

Figure 1: SEM photos of the following materials: biochar at 450°C (a,b), and activated biochars at 750°C (c,d), 850°C (e,f), and 950°C (g,h)
Furthermore, the elemental mapping of the activated samples (750, 850 and 950) was conducted using energy-dispersive X-ray spectrometry (EDX). Fig. 2 highlights the distribution of the primary elements: carbon (C), oxygen (O), potassium (K), and calcium (Ca). Trace elements, including sulfur, chlorine, and silicon, were also detected in the carbonaceous matrix (not shown) at very low weight concentrations (≤1.0 wt%). C and O are characteristic products of biomass thermal conversion followed by activation, whereas K and Ca are typical trace elements found in biochar. The presence of all trace elements aligns with the composition commonly observed in biochar materials [50–52].

Figure 2: SEM of 750 (a) and EDX elemental mapping of (b) carbon (C); (c) oxygen (O); (d) potassium (K), and (e) calcium (Ca). The respective SEM and EDX for the 850 and 950 samples are shown in (f–j) and (k–o)
The textural properties of those materials were evaluated by N2 physisorption isotherms. The adsorption-desorption isotherms of the materials are shown in Fig. 3a and, according to the IUPAC [53], can be classified as type II (450) and type Ib (750, 850, and 950). Type II isotherms are typical of non-porous or poorly porous materials due to weak adsorbate-adsorbent interactions, whereas type Ib isotherms indicate microporous materials with a broad distribution of micropores (pores < 2 nm) [53]. The presented pore size distribution using the DFT method (Fig. 3b) reveals that the 750 and 850 samples are predominantly microporous, with pores centered at approximately 0.73 nm and 0.64 nm, respectively, and a secondary peak at 1.18 nm in both samples. In contrast, the 950 sample shows micropores centered at 0.73 nm, 1.3 nm, and 1.6 nm, with a minor mesoporosity distributed between 2 nm and 10 nm. This transition from microporous to mesoporous structures at higher temperatures has been attributed to the progressive widening of micropores and the collapse of blocked pores, as observed in [1]. These findings suggest that higher activation temperatures promote the development of larger pore sizes, enhancing the material porosity.

Figure 3: (a) Adsorption-desorption isotherms: full and open symbols, respectively; (b) DFT pore size distribution
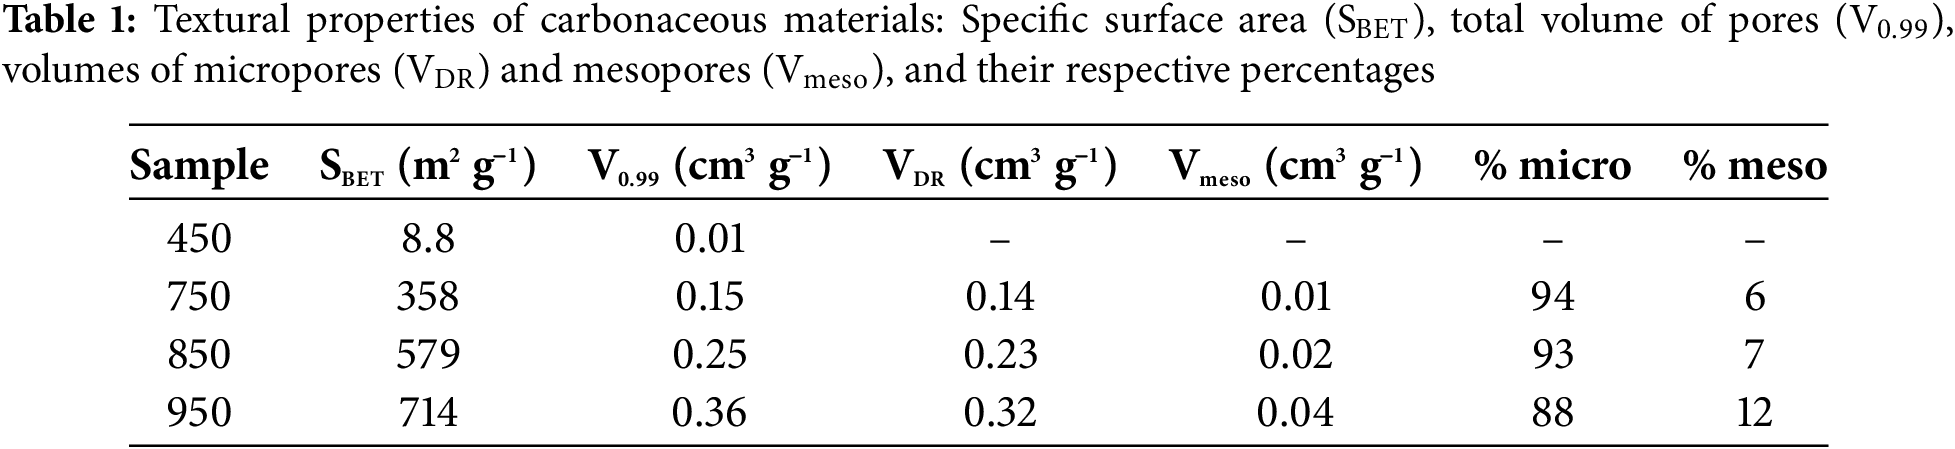
The porous materials present surface areas ranging from 8.8 m2/g (450) to 714 m2/g (950) (Table 1). With the increase in the activation temperature (from 750°C to 950°C), the total pore volume increased from 0.14 to 0.32 cm3/g. Despite the increase in surface area and total volume of pores by 56% and 66%, respectively, due to temperature elevation from 750°C to 850°C, the percentages of micro and mesopores are almost the same. Only at 950°C, the material shows a two-fold higher mesopores (12%) compared to the lowest temperatures (6%) at 750°C and a more developed surface area (714 vs. 358 m2/g). Indeed, the activation process typically develops channels, grooves, spaces, and fissures on the carbon structure, generating a large internal surface area [2]. Furthermore, these results agree with the SEM results (Fig. 1).
XPS, XRD, and Raman spectroscopy were carried out to evaluate the chemical and structural composition of the studied materials. XPS elemental analysis highlighted significant changes in the chemical composition of the samples with increasing activation temperatures (Fig. 4). The carbon content in the pristine sample (84.5%) significantly increased to 94% after activation at 750°C; then, it decreased to 87.9% at 850°C before slightly rising to 89.3% at 950°C. Conversely, the oxygen content dropped from 13.8% at 450°C to 6.1% at 750°C. At higher temperatures, the oxygen content increased to 11.5% at 850°C and remained at 9.5% at 950°C. This trend reflects the thermochemical decomposition of cellulose, hemicellulose, and lignin, the key wood components, during heating [1]. The reduction in carbon content at higher temperatures was followed by an increase in oxygen content, attributed to the oxidative environment of the CO2 medium. Under these conditions, oxygenated species from CO2 can be incorporated into the carbon matrix [2]. The nitrogen in the pristine sample at 1.8% was likely removed as volatile compounds during the thermochemical process [54,55]. Additionally, Ca was detected in the high-temperature-treated samples, with contents of 0.7% and 1.2% at 850°C and 950°C, respectively. The Ca content increases at elevated temperatures, as also indicated by elemental mapping (Fig. 2) due to the degradation of the carbon matrix and the catalytic effect of the naturally occurring ash components in the biomass, which is a characteristic of specific biomass types at high temperature (above 600°C) [56,57]. This process enhances porosity, as evidenced by BET analysis, and results in an increased relative concentration of calcium in the final material.

Figure 4: (a) XPS survey of all samples, (b) Elemental composition by XPS analysis, and XPS curve fitting of the sample 850C (c) C 1s, (d) O 1s
The samples’ XPS analysis was performed by deconvoluting the primary components, carbon and oxygen. The main peak below 285 eV was attributed to aliphatic and aromatic carbon groups (C–C, C–H, and C=C). The peaks in the ranges of 285.7–287.1 eV, 286.1–288 eV, and 288–289.4 eV were associated with oxygen-containing functional groups, including C–O, C=O or O–C–O, and O=C–O, respectively [1].
The XRD patterns of all samples are presented in Fig. 5. Each sample exhibits two characteristic bands of carbonaceous materials, corresponding to the (002) and (100) planes, located at approximately 24° and 45°, respectively [58]. These bands indicate a turbostratic structure comprising both amorphous and graphitic phases [59]. Most of the remaining peaks can be attributed to CaCO3 (JCPDS 01-080-2791/01-078-3262/04-012-8072) and are observed at 2θ positions around 23°, 29°, 36°, 39°, 43°, 47°, and 48°. Additional peaks corresponding to SiO2 (JCPDS 03-065-0466/01-070-2517), appear at diffraction angles near 20.81°, 26.6°, 50°, and 60°. These features have been previously identified in biochar studies involving various precursors, including CaCO3 [60] and SiO2 [60,61]. The intensity and sharpness of the diffraction peaks notably increase with rising carbonization temperatures, reaching a maximum at 850°C. Similar trends in biochar diffraction patterns have been reported and attributed to reduced organic amorphous phase and modifications in the material ultrastructure [58,62].

Figure 5: XRD diffractograms of (a) pristine biochar 450, activated samples at 750, 850, and 950, and standard spectrum of (b) SiO2 and (c) CaCO3
Raman spectra and the corresponding deconvoluted peaks were analyzed to further investigate biochar’s carbon structure, complementing the chemical analysis. Fig. 6a displays the peaks alongside the Raman spectrum, featuring two broad bands commonly observed in the first-order spectra of carbon-based materials. The G band, located at 1590 cm−1, is associated with the ordered graphitic layers arising from sp2-hybridized carbon atoms, while the D band, at 1350 cm−1, corresponds to the presence of disorder and defects within the carbon structure [39]. The intensity ratio of the D band to the G band (ID/IG) typically measures structural disorder in carbon materials, with higher values indicating greater disorder and a lower degree of graphitization [63]. The ID/IG values of the biochar progressively decrease with increasing carbonization temperatures (Fig. 6b), reflecting improved alignment and organization of graphitic layers. Additionally, the size of the sp2 clusters is inversely proportional to the ID/IG values [39].

Figure 6: (a) Raman spectra of Biochar samples and (b) the relationship between the ID/IG ratio and the carbonization temperature
3.2 Electromagnetic Characterization and Attenuation Properties
The relative complex permittivity is an intrinsic property of dielectric composites, where the real permittivity (

Figure 7: The (a) complex permittivity and (b) the dielectric tangent loss of pristine biochar (450) and activated samples 750, 850, and 950
The performance of an electromagnetic absorber is typically assessed through reflection loss (RL) analysis, where values below −10.00 dB represent an attenuation of 90% of the incident electromagnetic wave [69]. Fig. 8 presents the 3D RL profiles for all samples, allowing the evaluation of RL behavior as a function of frequency and material thickness. The 450 sample showed negligible RL performance (Fig. 8a), with a minimum value of −2.00 dB at 12.38 GHz for a thickness of 10 mm, consistent with its low complex permittivity. In contrast, the 750 sample (Fig. 8b) exhibited the best performance, achieving the lowest RL value of −29.20 dB at 12.32 GHz with a thickness of 7.7 mm. The RL of the 850 sample (Fig. 8c) reached a minimum value of −13.88 dB at 12.39 GHz with the smallest thickness of 6.7 mm. For the 950 sample (Fig. 8d), the lowest RL was −12.98 dB at 11.58 GHz with a thickness of 7.5 mm. The improved RL values observed for the 750, 850, and 950 samples correspond to their higher complex permittivity, highlighting the role of dielectric properties in enhancing electromagnetic wave absorption.

Figure 8: 3D Reflection Loss map of samples (a) 450°C, (b) 750°C, (c) 850°C, and (d) 950°C. It is noticeable that the 750°C sample exhibited the best performance compared to the others
Another important performance metric for electromagnetic absorbers is the effective absorbing bandwidth (EAB), defined as the frequency range where the reflection loss (RL) is below −10 dB. A wider EAB is desirable, as it allows the incident wave to be attenuated over a broader frequency range using a single absorber. The sample heated at 450°C exhibited poor RL performance across all frequency and thickness ranges, so its EAB analysis is omitted. The RL for the 750 is presented in Fig. 9a as a colormap projection of the 3D RL, with contours at −10 dB and −20 dB indicating the thicknesses at which the best RL values occur. While the best RL for this sample is observed at a thickness of 7.7 mm, the EAB at this thickness is approximately 0.86 GHz, as the RL extends into the Ku band (higher frequency range), as shown in Fig. 9b, highlighting the potential for thinner samples to perform well at those frequencies. The optimal EAB for this sample is about 1.55 GHz, achieved with a thickness of 8.2 mm. The graph below the RL plot in Fig. 9b indicates that the primary attenuation mechanism is likely related to the multiple of the quarter-wavelength matching thickness effect [70]:
here,

Figure 9: The 2D colormap RL and the comparison between RL and matching thickness for samples (a,b) 750, (c,d) 850, and (e,f) 950, respectively
The calculated RL approximates the frequency where the RL happens, but the experimental RL values often differ. Fig. 10 compares the best RL measured (following the same procedure as in [73]) and the RL calculated with the respective thickness. For sample 750, shown in Fig. 10a, both 8.4 mm and 9.6 mm thicknesses show a good approximation of the RL frequency. For the 8.4 mm thickness, the measured RL is centered at 11.3 GHz with a value of −37.2 dB, while the calculated RL is −24.3 dB@11.3 GHz. The measured and calculated EAB are 1.25 GHz and 1.52 GHz, respectively. For the 9.6 mm thickness, the measured RL is −27.1 dB@9.9 GHz, and the calculated RL is −19.5 dB@9.8 GHz. The measured and calculated EABs are 0.94 GHz and 1.20 GHz, respectively.

Figure 10: Comparison between measured and calculated Reflection Loss for samples (a) 750, (b) 850, and (c) 950
Fig. 10b compares the measured and calculated RL for sample 850. The experimental and calculated center frequencies for the 7.1 mm thickness are closely matched, with measured RL 18.2 dB@11.8 GHz and calculated RL −12.6 dB@11.7 GHz. This thickness provides the largest EAB for this sample, with measured and calculated EABs of 0.82 GHz and 0.78 GHz, respectively. For the 8.0 mm thickness, the measured RL is −17.0 dB@10.3 GHz with an EAB of 0.60 GHz, compared to the calculated RL of −11.8 dB@10.4 GHz and an EAB of 0.55 GHz. For the 9.1 mm thickness, the measured RL is −13.8 dB at 9.3 GHz, and the calculated RL is −10.1 dB@9.1 GHz. The measured and calculated EABs are 0.46 GHz and 0.17 GHz, respectively. These values are relatively lower than those for the 750°C sample, as the RLs do not reach sufficiently low values to support a larger EAB.
For sample 950, Fig. 10c, the measured RL for the 8.0 mm thickness is 15.0 dB@11.2 GHz with an EAB of 0.77 GHz, while the calculated RL is −11.7 dB@10.9 GHz with an EAB of 0.66 GHz. For the 9.0 mm thickness, the measured RL is −14.9 dB@10.0 GHz with an EAB of 0.53 GHz, while the calculated RL is −11.2 dB@9.6 GHz with an EAB of 0.43 GHz. The measured and calculated results are in good agreement, with the largest center frequency difference being 0.4 GHz for the 9.0 mm thickness of the 950 sample. This discrepancy is likely due to the precision of the thickness measurement. Methods such as Nicolson-Ross-Weir or NIST precision technique require accurate thickness measurements to calculate the intrinsic properties of the material, which are also needed for RL calculations (Eq. (2)). Variations in sample thickness can arise from the slight rounding of the sample’ s top during fabrication due to the tension in the silicone rubber mold. Additionally, the softness of the composite material may result in slight inaccuracies when measuring thickness with a caliper.
Finally, the attenuation constant (
Higher values of

Figure 11: Attenuation constants for samples 450, 750, 850, and 950
Furthermore, one of the most promising properties of biochar, to the best of our knowledge, has not been reported in the literature. Biochar is an effective filter for heavy metals in water [75], and the material discharged after filtration could potentially be repurposed as a radar-absorbing material (RAM). This post-filtration application could enhance both the complex permittivity and reflection loss (RL). Furthermore, future research may explore the use of biochar as an alternative material for replacing aerogels used in gas sensors [76] that are typically produced through multiple steps, including supercritical drying, a costly and impractical technique for large-scale production, and materials from synthetic sources. The porosity of biochar enables the adsorption of gas molecules, which could alter the electromagnetic transmission through the material.
3.3 Assessment of Cost-Effective Strategies for Large-Scale Production
Few studies in the literature explore the use of activated biochar for the development of RAM. Most of these studies focus on chemically activated biochars, which typically require multiple preparation steps, including ultrasonication, hydrothermal impregnation, crushing, filtration, and prolonged stirring (up to 12 h). The chemical activation process often involves using highly concentrated corrosive chemicals, such as KOH and H3PO4, followed by acid washing (e.g., HCl) and extensive rinsing with water, a procedure that can last up to five days. These methods generate significant amounts of corrosive waste, posing substantial challenges for large-scale material production. Moreover, another commonly employed technique, vacuum activation, is unsuitable for large-scale applications due to its reliance on vacuum pumps, which add operational complexity, high energy consumption, and maintenance requirements, reducing overall cost-effectiveness. In contrast, physical activation using CO2 offers a more sustainable and efficient alternative. This method facilitates the preparation of biochars without requiring corrosive chemicals or extensive washing, thereby minimizing environmental impact and enhancing scalability for industrial production. Additionally, existing facilities and technologies designed for activated carbon production can be readily adapted for this process, leveraging established infrastructure and streamlining the transition to large-scale biochar manufacturing.
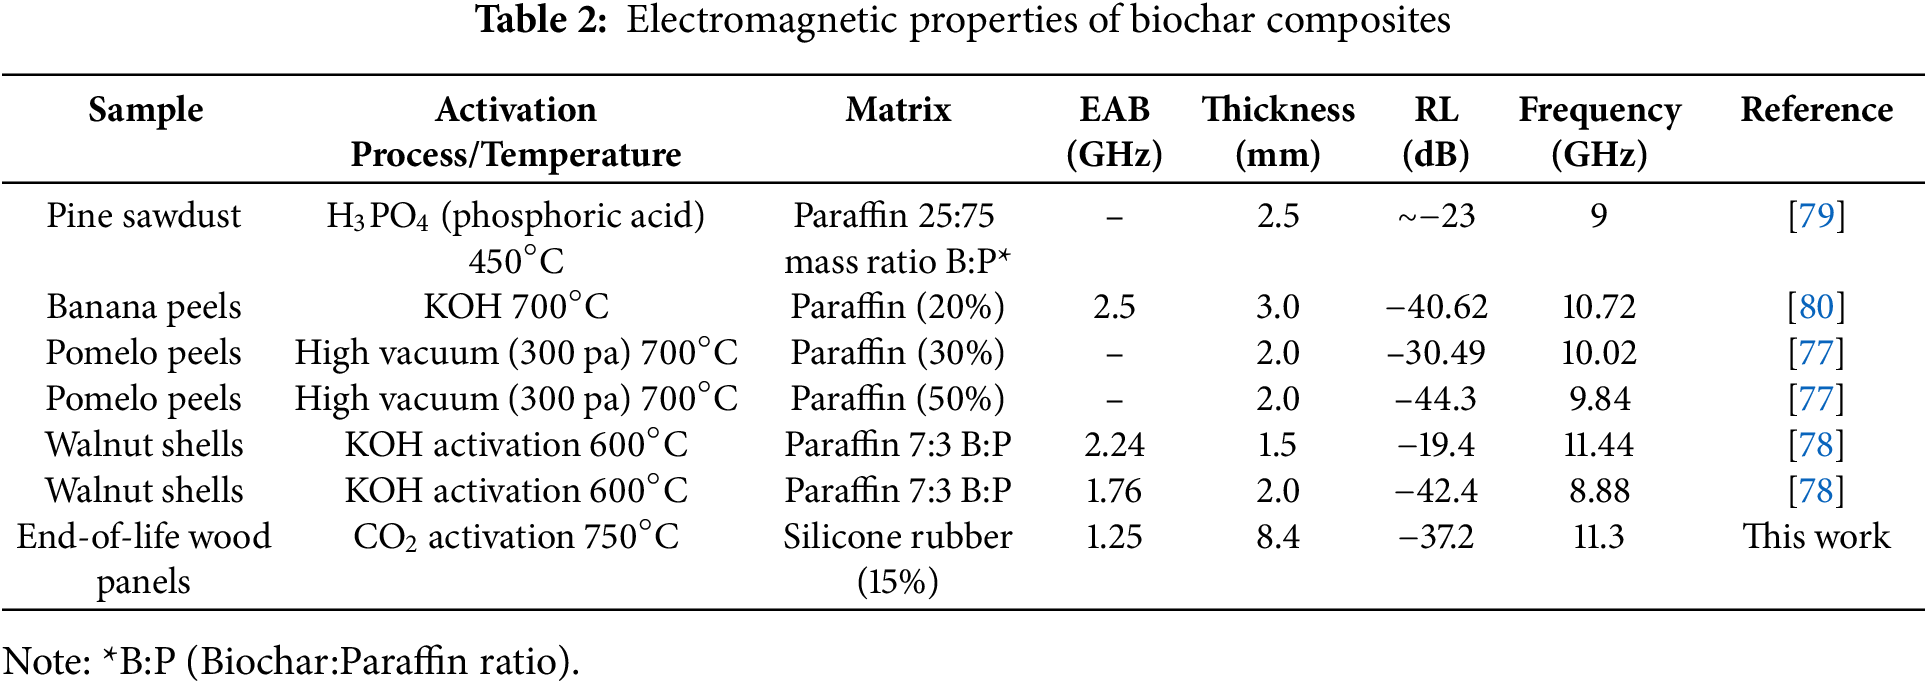
Table 2 shows the electromagnetic properties of biochar dispersed on different matrices. As expected, a low material concentration in the matrix typically results in lower RL values, as observed for the pomelo peels samples [77]. In this work, the 15% material content was chosen as it represented the saturation point, whereas other studies typically employed higher material proportions due to the greater loading capacity of paraffin matrices. The sample 750, containing only 15% of physically activated biochar dispersed in a silicone rubber matrix, achieved an RL value of −37.2 dB. The choice of a silicone rubber matrix enabled the production of a flexible material, making it suitable for coating applications across various fields. This measured RL value is comparable to those obtained using chemically activated biochars and represents a 16% lower difference compared to the most absorbing material prepared at 700°C using vacuum activation (−44.3 dB) [77] and a 62% higher difference compared to the least absorbing material activated with KOH at 600°C (−19.4 dB) [78]. Although the activation temperatures in these studies are relatively low, their production processes are unsuitable for large-scale applications due to the reliance on high vacuum systems or the generation of corrosive by-products. Interestingly, the flexible composite material developed in this study demonstrated enhanced absorption at a higher frequency of 11.3 GHz, consistent with the observation that all evaluated carbon materials exhibited absorption between 8.8 GHz and 11.44 GHz.
Furthermore, optimizing the production technique, the temperature, and the matrix used for large-scale biochar production could yield significant energy savings without compromising the final properties of the material. This optimization would also enhance the flexibility of RAM, broadening its potential applications across devices. For comparative purposes, an estimated energy savings calculation was performed. Using the principles of thermodynamics, specifically the calorimetry equation, it is estimated that thermal activation at 750°C could reduce energy consumption by approximately 14% and 28% compared to activations at 850°C and 950°C, respectively. While most studies in the literature emphasize increasing activation temperatures to enhance properties such as porosity or fixed carbon content [1,2], this study identifies 750°C as an optimal activation temperature for producing sustainable RAM additives. The material exhibits good performance for applications such as electromagnetic protective storage pouches, Internet of Things (IoT) sensor nodes, and railway vehicles [81–83]. These findings highlight the material’s functional efficiency and its potential for significant cost reductions in energy consumption, a critical consideration in sustainable material development. However, accurately assessing potential energy savings requires consideration of additional factors, such as thermal losses to the environment via radiation and conduction, as well as the overall efficiency of the furnace. Furnace efficiency depends on various design parameters, including size, thermal insulation quality, and heating rate.
Additionally, using forestry residues as precursors for producing porous carbon through physical activation aligns with the sustainability goals outlined in the 2030 Agenda for Sustainable Development [84]. This approach promotes a circular economy by valorizing agricultural and industrial byproducts, reducing waste, and minimizing reliance on fossil fuel-based feedstocks. Furthermore, porous carbon materials produced from biomass waste are typically low-cost [85,86], enhancing their appeal for sustainable and cost-effective applications in the global market. The production of activated biochar represents a straightforward and scalable technology that can be implemented using existing pilot-scale systems [1] to achieve desirable physicochemical properties for various applications. This approach supports standardized production and increases annual production capacity, making it a viable solution for addressing sustainability challenges in material development.
This study demonstrated the existence of an optimal temperature for producing activated biochar suitable for RAM applications. Biochar activated at 750°C resulted in superior conductivity and higher imaginary permittivity. A sample with a 7.7 mm thickness achieved a RL of −29.2 dB at 12.32 GHz. The maximum EAB was 1.55 GHz at an 8.2 mm thickness, as the RL of the 7.7 mm extended into the next frequency band. RAM composites combining silicone rubber and biochar show significant potential for practical applications, such as electromagnetic coatings for anechoic chambers or shielding for electronic devices. Although the concentration of sustainable materials within the silicone matrix is low, the results are comparable to those achieved with biochars that were either vacuum-activated or chemically activated and dispersed in a paraffin matrix, which allows a higher material concentration. This demonstrates the potential for producing flexible, sustainable RAM on a pilot scale. Consequently, the large-scale production of low-cost materials with tunable properties is aligned with the sustainability goals outlined in the 2030 Agenda, representing a promising strategy for advancing a circular economy and achieving a cleaner future. Additionally, the biochar’ s ability to filter heavy metals from water offers a dual functionality, suggesting that, in future works, a biochar made from low-grade wood waste could be repurposed as a RAM, with the embedded metallic ions enhancing the composite’ s electromagnetic properties.
Acknowledgement: Alan Boss and Beatriz Carvalho da Silva Fonseca would like to thank CNPq for the financial support. Manuella Gobbo de Castro Munhoz would like to thank CAPES.
Funding Statement: FINEP No. 01.22.0305.00 and CAPES—Finance Code 88887.832847/2023-00 and 88887.631486/2021-00.
Author Contributions: Nila Cecília Faria Lopes Medeiros: Conceptualization—supporting; Data curation—equal; Investigation—lead; Methodology—lead; Gisele Amaral-Labat: Conceptualization—lead; Formal analysis—supporting; Project administration—equal; Supervision—equal; Validation—equal; Visualization—equal; Writing original draft—lead; Writing—review & editing—equal; Leonardo Iusuti de Medeiros: Conceptualization—supporting; Data curation—equal; Investigation—lead; Methodology—lead; Alan Fernando Ney Boss: Conceptualization—supporting; Data curation—equal; Formal analysis—lead; Supervision—equal; Validation—equal; Visualization—equal; Writing original draft—lead; Writing—review & editing—equal; Beatriz Carvalho da Silva Fonseca: Data curation—equal; Formal analysis—supporting; Writing original draft—supporting; Writing—review & editing—supporting; Manuella Gobbo de Castro Munhoz: Data curation—equal; Formal analysis—supporting; Writing original draft—supporting; Writing—review & editing—supporting; Guilherme F. B. Lenz e Silva: Funding acquisition—equal; Resources—equal; Supervision—equal; Mauricio Ribeiro Baldan: Funding acquisition—lead; Project administration—lead; Resources—lead; Supervision—lead; Flavia Lega Braghiroli: Validation—equal; Visualization—equal; Resources—supporting; Writing original draft—supporting; Writing—review & editing—equal. All authors reviewed the results and approved the final version of the manuscript.
Availability of Data and Materials: Data can be available under request.
Ethics Approval: Not applicable.
Conflicts of Interest: The authors declare no conflicts of interest to report regarding the present study.
Nomenclature
| RAM | Radar-absorbing Material |
| RL | Reflection Loss |
| EMI | Electromagnetic interference |
| SBET | Specific surface area calculated by Brunauer Emmett Teller method |
| relative complex permittivity | |
| relative complex permeability | |
| free space impedance | |
| impedance between free space and material interface | |
| frequency | |
| material thickness | |
| speed of light |
References
1. Braghiroli FL, Bouafif H, Hamza N, Bouslimi B, Neculita CM, Koubaa A. The influence of pilot-scale pyro-gasification and activation conditions on porosity development in activated biochars. Biomass Bioenergy. 2018;118:105–14. doi:10.1016/j.biombioe.2018.08.016. [Google Scholar] [CrossRef]
2. Braghiroli FL, Bouafif H, Neculita CM, Koubaa A. Influence of pyro-gasification and activation conditions on the porosity of activated biochars: a literature review. Waste Biomass Valor. 2020;11(9):5079–98. doi:10.1007/s12649-019-00797-5. [Google Scholar] [CrossRef]
3. Braghiroli FL, Bouafif H, Hamza N, Neculita CM, Koubaa A. Production, characterization, and potential of activated biochar as adsorbent for phenolic compounds from leachates in a lumber industry site. Environ Sci Pollut Res. 2018;25(26):26562–75. doi:10.1007/s11356-018-2712-9. [Google Scholar] [PubMed] [CrossRef]
4. Braghiroli FL, Bouafif H, Neculita CM, Koubaa A. Performance of physically and chemically activated biochars in copper removal from contaminated mine effluents. Water Air Soil Pollut. 2019;230(8):178. doi:10.1007/s11270-019-4233-7. [Google Scholar] [CrossRef]
5. Braghiroli FL, Calugaru IL, Gonzalez-Merchan C, Neculita CM, Bouafif H, Koubaa A. Efficiency of eight modified materials for As(V) removal from synthetic and real mine effluents. Miner Eng. 2020;151:106310. doi:10.1016/j.mineng.2020.106310. [Google Scholar] [CrossRef]
6. Arous S, Koubaa A, Bouafif H, Bouslimi B, Braghiroli FL, Bradai C. Effect of pyrolysis temperature and wood species on the properties of biochar pellets. Energies. 2021;14(20):6529. doi:10.3390/en14206529. [Google Scholar] [CrossRef]
7. Wang L, Chen L, Tsang DCW, Kua HW, Yang J, Ok YS, et al. The roles of biochar as green admixture for sediment-based construction products. Cem Concr Compos. 2019;104:103348. doi:10.1016/j.cemconcomp.2019.103348. [Google Scholar] [CrossRef]
8. Czekała W, Malińska K, Cáceres R, Janczak D, Dach J, Lewicki A. Co-composting of poultry manure mixtures amended with biochar—the effect of biochar on temperature and C-CO2 emission. Bioresour Technol. 2016;200:921–7. doi:10.1016/j.biortech.2015.11.019. [Google Scholar] [PubMed] [CrossRef]
9. Braghiroli FL, Bouafif H, Neculita CM, Koubaa A. Activated Biochar as an effective sorbent for organic and inorganic contaminants in water. Water Air Soil Pollut. 2018;229(7):230. doi:10.1007/s11270-018-3889-8. [Google Scholar] [CrossRef]
10. Jha S, Gaur R, Shahabuddin S, Tyagi I. Biochar as sustainable alternative and green adsorbent for the remediation of noxious pollutants: a comprehensive review. Toxics. 2023;11(2):117. doi:10.3390/toxics11020117. [Google Scholar] [PubMed] [CrossRef]
11. Lee J, Kim KH, Kwon EE. Biochar as a catalyst. Renew Sustain Energy Rev. 2017;77:70–9. doi:10.1016/j.rser.2017.04.002. [Google Scholar] [CrossRef]
12. Pan J, Ma J, Zhai L, Luo T, Mei Z, Liu H. Achievements of biochar application for enhanced anaerobic digestion: a review. Bioresour Technol. 2019;292(5):122058. doi:10.1016/j.biortech.2019.122058. [Google Scholar] [PubMed] [CrossRef]
13. Beesley L, Moreno-Jiménez E, Gomez-Eyles JL, Harris E, Robinson B, Sizmur T. A review of biochars’ potential role in the remediation, revegetation and restoration of contaminated soils. Environ Pollut. 2011;159(12):3269–82. doi:10.1016/j.envpol.2011.07.023. [Google Scholar] [PubMed] [CrossRef]
14. Rodriguez-Franco C, Page-Dumroese DS. Woody biochar potential for abandoned mine land restoration in the U.S.: a review. Biochar. 2021;3(1):7–22. doi:10.1007/s42773-020-00074-y. [Google Scholar] [CrossRef]
15. Korba A, Lekawska-Andrinopoulou L, Chatziioannou K, Tsimiklis G, Amditis A. Wood waste valorization and classification approaches: a systematic review. Open Res Eur. 2025;5:5. doi:10.12688/openreseurope. [Google Scholar] [PubMed] [CrossRef]
16. Agyemang E, Ofori-Dua K, Dwumah P, Forkuor JB. Towards responsible resource utilization: a review of sustainable vs. unsustainable reuse of wood waste. PLoS One. 2024;19(12):e0312527. doi:10.1371/journal.pone.0312527. [Google Scholar] [PubMed] [CrossRef]
17. Royal Society and Royal Academy of Engineering. Greenhouse gas removal. London, UK: Royal Academy of Engineering; 2018. [Google Scholar]
18. Hu Q, Jung J, Chen D, Leong K, Song S, Li F, et al. Biochar industry to circular economy. Sci Total Environ. 2021;757(3):143820. doi:10.1016/j.scitotenv.2020.143820. [Google Scholar] [PubMed] [CrossRef]
19. Precedence Research. Biochar market [Internet]. 2025 [cited 2025 Jan 1]. Available from: https://www.precedenceresearch.com/biochar-market. [Google Scholar]
20. Zeng Z, Zhang Y, Ma XYD, Shahabadi SIS, Che B, Wang P, et al. Biomass-based honeycomb-like architectures for preparation of robust carbon foams with high electromagnetic interference shielding performance. Carbon. 2018;140(6304):227–36. doi:10.1016/j.carbon.2018.08.061. [Google Scholar] [CrossRef]
21. Zhang Z, Zhao H, Gu W, Yang L, Zhang B. A biomass derived porous carbon for broadband and lightweight microwave absorption. Sci Rep. 2019;9(1):18617. doi:10.1038/s41598-019-54104-2. [Google Scholar] [PubMed] [CrossRef]
22. Anuradha S, Balakrishnan J. Resonance based discrimination of stealth targets coated with radar absorbing material (RAM). Prog Electromagn Res M. 2021;99:69–79. doi:10.2528/PIERM20101001. [Google Scholar] [CrossRef]
23. Yin X, Kong L, Zhang L, Cheng L, Travitzky N, Greil P. Electromagnetic properties of Si–C–N based ceramics and composites. Int Mater Rev. 2014;59(6):326–55. doi:10.1179/1743280414Y.0000000037. [Google Scholar] [CrossRef]
24. Bao W, Liu Y, Zhao X. Recent research progress of carbon-based and their composites for electromagnetic waves absorption. Text Res J. 2023;93(7–8):1889–912. doi:10.1177/00405175221136290. [Google Scholar] [CrossRef]
25. Zhang B, Qu Z, Ruiz-Agudo C, Yang L, Chi B, Kong Y, et al. Lightweight magnetic carbon nanotube/cellulose nanofibre aerogels with microstructure engineering for enhanced microwave absorption. Carbon. 2025;234:120020. doi:10.1016/j.carbon.2025.120020. [Google Scholar] [CrossRef]
26. Huang X, Wang Y, Lou Z, Chen Y, Li Y, Lv H. Porous, magnetic carbon derived from bamboo for microwave absorption. Carbon. 2023;209:118005. doi:10.1016/j.carbon.2023.118005. [Google Scholar] [CrossRef]
27. Huang Q, Bao C, Wang Q, Dong C, Guan H. Tuning the microwave absorption capacity of TiP2O7 by composited with biomass carbon. Appl Surf Sci. 2020;515:145974. doi:10.1016/j.apsusc.2020.145974. [Google Scholar] [CrossRef]
28. Liu L, Yang S, Hu H, Zhang T, Yuan Y, Li Y, et al. Lightweight and efficient microwave-absorbing materials based on loofah-sponge-derived hierarchically porous carbons. ACS Sustain Chem Eng. 2019;7(1):1228–38. doi:10.1021/acssuschemeng.8b04907. [Google Scholar] [CrossRef]
29. Lu C, Geng H, Ma J, Zhao J, Wang R, An Z, et al. Hierarchical porous carbon/co nanocomposites derived from biomass for high-performance microwave absorption. ACS Appl Nano Mater. 2023;6(18):16778–89. doi:10.1021/acsanm.3c02981. [Google Scholar] [CrossRef]
30. Yin S, Huang Y, Deng C, Jiao Y, Wu W, Seidi F, et al. Hierarchically porous biochar derived from orthometric integration of wooden and bacterial celluloses for high-performance electromagnetic wave absorption. Compos Sci Technol. 2022;218:109184. doi:10.1016/j.compscitech.2021.109184. [Google Scholar] [CrossRef]
31. Boss AFN, Ferreira HR, Braghiroli FL, Amaral-Labat GA, Souza AAT, Bouafif H, et al. Investigation of sustainable porous carbon as radar absorbing material. Matéria Rio J. 2021;26(2):e12963. doi:10.1590/s1517-707620210002.1263. [Google Scholar] [CrossRef]
32. Vergara DEF, Lopes BHK, Quirino SF, Silva GFBLE, Boss AFN, Amaral-Labat GA, et al. Frequency selective surface properties of microwave new absorbing porous carbon materials embedded in epoxy resin. Mat Res. 2019;22(suppl 1):e20180834. doi:10.1590/1980-5373-mr-2018-0834. [Google Scholar] [CrossRef]
33. Cheng Y, Seow JZY, Zhao H, Xu ZJ, Ji G. A flexible and lightweight biomass-reinforced microwave absorber. Nano-Micro Lett. 2020;12(1):125. doi:10.1007/s40820-020-00461-x. [Google Scholar] [PubMed] [CrossRef]
34. Jamshed MA, Heliot F, Brown TWC. A survey on electromagnetic risk assessment and evaluation mechanism for future wireless communication systems. IEEE J Electromagn RF Microw Med Biol. 2020;4(1):24–36. doi:10.1109/JERM.2019.2917766. [Google Scholar] [CrossRef]
35. Lou Z, Wang Q, Kara UI, Mamtani RS, Zhou X, Bian H, et al. Biomass-derived carbon heterostructures enable environmentally adaptive wideband electromagnetic wave absorbers. Nano-Micro Lett. 2022;14(1):11. doi:10.1007/s40820-021-00750-z. [Google Scholar] [PubMed] [CrossRef]
36. Qiang R, Feng S, Chen Y, Ma Q, Chen B. Recent progress in biomass-derived carbonaceous composites for enhanced microwave absorption. J Colloid Interface Sci. 2022;606(27):406–23. doi:10.1016/j.jcis.2021.07.144. [Google Scholar] [PubMed] [CrossRef]
37. Xia L, Feng Y, Zhao B. Intrinsic mechanism and multiphysics analysis of electromagnetic wave absorbing materials: new horizons and breakthrough. J Mater Sci Technol. 2022;130:136–56. doi:10.1016/j.jmst.2022.05.010. [Google Scholar] [CrossRef]
38. Sani Y, Azis RS, Ismail I, Yaakob Y, Mohammed J. Enhanced electromagnetic microwave absorbing performance of carbon nanostructures for RAMs: a review. Appl Surf Sci Adv. 2023;18:100455. [Google Scholar]
39. Shimodaira N, Masui A. Raman spectroscopic investigations of activated carbon materials. J Appl Phys. 2002;92(2):902–9. doi:10.1063/1.1487434. [Google Scholar] [CrossRef]
40. Brunauer S, Emmett PH, Teller E. Adsorption of gases in multimolecular layers. J Am Chem Soc. 1938;60(2):309–19. doi:10.1021/ja01269a023. [Google Scholar] [CrossRef]
41. Dubinin MM. Fundamentals of the theory of adsorption in micropores of carbon adsorbents: characteristics of their adsorption properties and microporous structures. Carbon. 1989;27(3):457–67. [Google Scholar]
42. Keysight. Keysight technical overview. N1500A materials measurement suite. [Internet]. 2025 [cited 2025 Feb 18]. Available from: https://www.keysight.com/us/en/assets/7018-04630/technical-overviews/5992-0263.pdf. [Google Scholar]
43. Wen F, Hou H, Xiang J, Zhang X, Su Z, Yuan S, et al. Fabrication of carbon encapsulated Co3O4 nanoparticles embedded in porous graphitic carbon nanosheets for microwave absorber. Carbon. 2015;89:372–7. [Google Scholar]
44. Phothong K, Tangsathitkulchai C, Lawtae P. The analysis of pore development and formation of surface functional groups in bamboo-based activated carbon during CO2 activation. Molecules. 2021;26(18):5641. doi:10.3390/molecules26185641. [Google Scholar] [PubMed] [CrossRef]
45. Braghiroli FL, Cuña A, Da Silva EL, Amaral-Labat G, Silva GFB, Bouafif H, et al. The conversion of wood residues, using pilot-scale technologies, into porous activated biochars for supercapacitors. J Porous Mater. 2020;27(2):537–48. doi:10.1007/s10934-019-00823-w. [Google Scholar] [CrossRef]
46. Kundu S, Khandaker T, Anik MAAM, Hasan MDK, Dhar PK, Dutta SK, et al. A comprehensive review of enhanced CO2 capture using activated carbon derived from biomass feedstock. RSC Adv. 2024;14(40):29693–736. doi:10.1039/d4ra04537h. [Google Scholar] [PubMed] [CrossRef]
47. Portes RC, Baldan MR, Amaral-Labat G. From waste to resource: transforming Kraft black liquor into sustainable porous carbon fillers for radome applications. Chem Eng J. 2024;497:155007. doi:10.1016/j.cej.2024.155007. [Google Scholar] [CrossRef]
48. Singh AK, Shishkin A, Koppel T, Gupta N. A review of porous lightweight composite materials for electromagnetic interference shielding. Compos Part B Eng. 2018;149:188–97. doi:10.1016/j.compositesb.2018.05.027. [Google Scholar] [CrossRef]
49. Huang Y, Wang Y, Li Z, Yang Z, Shen C, He C. Effect of pore morphology on the dielectric properties of porous carbons for microwave absorption applications. J Phys Chem C. 2014;118(45):26027–32. doi:10.1021/jp506999k. [Google Scholar] [CrossRef]
50. Saletnik B, Zaguła G, Bajcar M, Tarapatskyy M, Bobula G, Puchalski C. Biochar as a multifunctional component of the environment—a review. Appl Sci. 2019;9(6):1139. doi:10.3390/app9061139. [Google Scholar] [CrossRef]
51. Shi W, Lian W, Tian S, Gong X, Yu Q, Guo Z, et al. A review of agronomic and environmental properties of inorganic compounds in biochars. Curr Res Environ Sustain. 2023;5(2):100226. doi:10.1016/j.crsust.2023.100226. [Google Scholar] [CrossRef]
52. Xiu L, Gu W, Sun Y, Wu D, Wang Y, Zhang H, et al. The fate and supply capacity of potassium in biochar used in agriculture. Sci Total Environ. 2023;902(5):165969. doi:10.1016/j.scitotenv.2023.165969. [Google Scholar] [PubMed] [CrossRef]
53. Thommes M, Kaneko K, Neimark AV, Olivier JP, Rodriguez-Reinoso F, Rouquerol J, et al. Physisorption of gases, with special reference to the evaluation of surface area and pore size distribution (IUPAC Technical Report). Pure Appl Chem. 2015;87(9–10):1051–69. doi:10.1515/pac-2014-1117. [Google Scholar] [CrossRef]
54. De Souza Souza C, Bomfim MR, Almeida CMD, Alves LDS, De Santana WN, Da Silva AIC, et al. Induced changes of pyrolysis temperature on the physicochemical traits of sewage sludge and on the potential ecological risks. Sci Rep. 2021;11(1):974. doi:10.1038/s41598-020-79658-4. [Google Scholar] [PubMed] [CrossRef]
55. Kabir E, Kim KH, Kwon EE. Biochar as a tool for the improvement of soil and environment. Front Environ Sci. 2023;11:1324533. doi:10.3389/fenvs.2023.1324533. [Google Scholar] [CrossRef]
56. Case PA, Truong C, Wheeler MC, DeSisto WJ. Calcium-catalyzed pyrolysis of lignocellulosic biomass components. Bioresour Technol. 2015;192:247–52. doi:10.1016/j.biortech.2015.05.028. [Google Scholar] [PubMed] [CrossRef]
57. Chen X, Li S, Liu Z, Chen Y, Yang H, Wang X, et al. Pyrolysis characteristics of lignocellulosic biomass components in the presence of CaO. Bioresour Technol. 2019;287:121493. doi:10.1016/j.biortech.2019.121493. [Google Scholar] [PubMed] [CrossRef]
58. Han G, Jia J, Liu Q, Huang G, Xing B, Zhang C, et al. Template-activated bifunctional soluble salt ZnCl2 assisted synthesis of coal-based hierarchical porous carbon for high-performance supercapacitors. Carbon. 2022;186:380–90. doi:10.1016/j.carbon.2021.10.042. [Google Scholar] [CrossRef]
59. Santos RKS, Nascimento BF, De Araújo CMB, Cavalcanti JVFL, Bruckmann FS, Rhoden CRB, et al. Removal of chloroquine from the aqueous solution by adsorption onto açaí-based biochars: kinetics, thermodynamics, and phytotoxicity. J Mol Liq. 2023;383(2):122162. doi:10.1016/j.molliq.2023.122162. [Google Scholar] [CrossRef]
60. Pasumarthi R, Sawargaonkar G, Kale S, Kumar NV, Choudhari PL, Singh R, et al. Innovative bio-pyrolytic method for efficient biochar production from maize and pigeonpea stalks and their characterization. J Clean Prod. 2024;448(2):141573. doi:10.1016/j.jclepro.2024.141573. [Google Scholar] [CrossRef]
61. Torsello D, Ghigo G, Giorcelli M, Bartoli M, Rovere M, Tagliaferro A. Tuning the microwave electromagnetic properties of biochar-based composites by annealing. Carbon Trends. 2021;4(6):100062. doi:10.1016/j.cartre.2021.100062. [Google Scholar] [CrossRef]
62. Pariyar P, Kumari K, Jain MK, Jadhao PS. Evaluation of change in biochar properties derived from different feedstock and pyrolysis temperature for environmental and agricultural application. Sci Total Environ. 2020;713(11):136433. doi:10.1016/j.scitotenv.2019.136433. [Google Scholar] [PubMed] [CrossRef]
63. Ferrari AC. Raman spectroscopy of graphene and graphite: disorder, electron-phonon coupling, doping and nonadiabatic effects. Solid State Commun. 2007;143(1–2):47–57. doi:10.1016/j.ssc.2007.03.052. [Google Scholar] [CrossRef]
64. Li W, Jin H, Zeng Z, Zhang L, Zhang H, Zhang Z. Flexible and easy-to-tune broadband electromagnetic wave absorber based on carbon resistive film sandwiched by silicon rubber/multi-walled carbon nanotube composites. Carbon. 2017;121:544–51. doi:10.1016/j.carbon.2017.06.034. [Google Scholar] [CrossRef]
65. Jian X, Wu B, Wei Y, Dou SX, Wang X, He W, et al. Facile synthesis of Fe3O4/GCs composites and their enhanced microwave absorption properties. ACS Appl Mater Interfaces. 2016;8(9):6101–9. doi:10.1021/acsami.6b00388. [Google Scholar] [PubMed] [CrossRef]
66. Cui L, Han X, Wang F, Zhao H, Du Y. A review on recent advances in carbon-based dielectric system for microwave absorption. J Mater Sci. 2021;56(18):10782–811. doi:10.1007/s10853-021-05941-y. [Google Scholar] [CrossRef]
67. Gupta TK, Singh BP, Mathur RB, Dhakate SR. Multi-walled carbon nanotube-graphene–polyaniline multiphase nanocomposite with superior electromagnetic shielding effectiveness. Nanoscale. 2014;6(2):842–51. doi:10.1039/c3nr04565j. [Google Scholar] [PubMed] [CrossRef]
68. Ao W, Fu J, Mao X, Kang Q, Ran C, Liu Y, et al. Microwave assisted preparation of activated carbon from biomass: a review. Renew Sustain Energy Rev. 2018;92:958–79. doi:10.1016/j.rser.2018.04.051. [Google Scholar] [CrossRef]
69. Dong S, Zhang X, Hu P, Zhang W, Han J, Hu P. Biomass-derived carbon and polypyrrole addition on SiC whiskers for enhancement of electromagnetic wave absorption. Chem Eng J. 2019;359:882–93. doi:10.1016/j.cej.2018.11.101. [Google Scholar] [CrossRef]
70. Liu T, Liu N, Gai L, An Q, Xiao Z, Zhai S, et al. Hierarchical carbonaceous composites with dispersed CO species prepared using the inherent nanostructural platform of biomass for enhanced microwave absorption. Microporous Mesoporous Mater. 2020;302:110210. doi:10.1016/j.micromeso.2020.110210. [Google Scholar] [CrossRef]
71. Medeiros LID, Medeiros NCDFL, Silva LGFB, Lima RGAD, Amaral-Labat G, Boss AFN, et al. Improved microwave absorption performance with sustainable porous carbon/carbon nanotube composites. Mat Res. 2022;25(suppl 2):e20220169. doi:10.1590/1980-5373-mr-2022-0169. [Google Scholar] [CrossRef]
72. Medeiros NCFL, Medeiros LI, Silva GFBL, Boss AFN, Gomes NAS, Sardinha AF, et al. Sustainable carbon xerogel in the production of electromagnetic radar absorbing composites in the Ku-band. Mat Res. 2022;25(suppl 2):e20220157. doi:10.1590/1980-5373-mr-2022-0157. [Google Scholar] [CrossRef]
73. Boss AF, Braghiroli FL, Amaral-Labat G, Souza AA, Baldan MR, Bouafif H, et al. Dielectric characterization of white birch-activated biochar composites: a sustainable alternative to radar-absorbing materials. J Compos Mater. 2020;54(9):1233–44. doi:10.1177/0021998319877493. [Google Scholar] [CrossRef]
74. Guo Y, Ruan K, Wang G, Gu J. Advances and mechanisms in polymer composites toward thermal conduction and electromagnetic wave absorption. Sci Bull. 2023;68(11):1195–212. doi:10.1016/j.scib.2023.04.036. [Google Scholar] [PubMed] [CrossRef]
75. Qiu B, Tao X, Wang H, Li W, Ding X, Chu H. Biochar as a low-cost adsorbent for aqueous heavy metal removal: a review. J Anal Appl Pyrolysis. 2021;155(11):105081. doi:10.1016/j.jaap.2021.105081. [Google Scholar] [CrossRef]
76. Wu Y, Pecorella GR, Verderame G, Annicchiarico D, Galhena T, Hodge S, et al. Microwave gas sensor based on graphene aerogels. IEEE Sens J. 2023;23(17):19282–9. doi:10.1109/JSEN.2023.3295176. [Google Scholar] [CrossRef]
77. Cai YP. A high-performance eletromagnetic wave absorption material based on biochar derived from pomelo peel. Main Group Chem. 2021;20(3):269–78. doi:10.3233/MGC-210033. [Google Scholar] [CrossRef]
78. Qiu X, Wang L, Zhu H, Guan Y, Zhang Q. Lightweight and efficient microwave absorbing materials based on walnut shell-derived nano-porous carbon. Nanoscale. 2017;9(22):7408–18. doi:10.1039/C7NR02628E. [Google Scholar] [PubMed] [CrossRef]
79. Wen M, Liu Y, Ren J, Wang J, Jiang J. Optimizing microwave frequencies for hydrogen and electromagnetic shielding materials production through methane pyrolysis over biochar. Energy Convers Manag. 2024;309:118430. doi:10.1016/j.enconman.2024.118430. [Google Scholar] [CrossRef]
80. Soleimani H, Yusuf JY, Soleimani H, Chuan LK, Sabet M. Banana-peel derived activated carbon for microwave absorption at X-band frequency. Synth Sinter. 2022;2(3):120–4. doi:10.53063/synsint.2022.2389. [Google Scholar] [CrossRef]
81. Boteanu A, Rastoceanu F, Radoi I, Rusea C. Modeling and simulation of electromagnetic shielding for IoT sensor nodes case. In: 2019 International Conference on Speech Technology and Human-Computer Dialogue (SpeD); 2019 Oct 10–12; Timisoara, Romania. p. 1–6. [Google Scholar]
82. Joskiewicz Z, Janukiewicz J. Experimental study of the shielding effectiveness performance degradation for a shielding material used in protective storage pouch. In: 2020 International Symposium on Electromagnetic Compatibility-EMC EUROPE; 2020 Sep 23–25; Rome, Italy. p. 1–4. [Google Scholar]
83. Zhao T, Teng W, Hao H, Sun P, Liu Y. Simulation research on electromagnetic shielding characteristics of carbon fiber car body for railway vehicles. Procedia Comput Sci. 2019;154(4):537–42. doi:10.1016/j.procs.2019.06.085. [Google Scholar] [CrossRef]
84. UNEP. Sustainable development goals. [Internet]. 2025 [cited 2025 Jan 16]. Available from: https://sdgs.un.org/goals. [Google Scholar]
85. Boss AFN, Munhoz MGC, Amaral-Labat G, Lima RGA, Medeiros LI, Medeiros NCFL, et al. Why sustainable porous carbon should be further explored as radar-absorbing material? A comparative study with different nanostructured carbons. J Renew Mater. 2024;12(10):1639–59. doi:10.32604/jrm.2024.056004. [Google Scholar] [CrossRef]
86. Stavropoulos GG, Zabaniotou AA. Minimizing activated carbons production cost. Fuel Process Technol. 2009;90(7–8):952–7. doi:10.1016/j.fuproc.2009.04.002. [Google Scholar] [CrossRef]
Cite This Article
 Copyright © 2025 The Author(s). Published by Tech Science Press.
This work is licensed under a Creative Commons Attribution 4.0 International License , which permits unrestricted use, distribution, and reproduction in any medium, provided the original work is properly cited.
 Downloads
 Citation Tools