
 Submit a Paper
 Propose a Special lssue
 Open Access
ARTICLE

Optimization of Comprehensive Performance of Polylactic Acid by Chitosan Blend Modification
College of Material Science and Chemical Engineering, Harbin Engineering University, Harbin, 150001, China
* Corresponding Authors: Xiaodong Wang. Email: ; Yingjie Qiao. Email:
(This article belongs to the Special Issue: Advances in Sustainable Materials for a Green Future: Innovations in Eco-friendly Composites based on Poly(lactic acid) (PLA))
Journal of Renewable Materials 2025, 13(8), 1587-1604. https://doi.org/10.32604/jrm.2025.02025-0075
Received 29 March 2025; Accepted 26 May 2025; Issue published 22 August 2025
 View Full Text
 Download PDF
Abstract
Polylactic acid (PLA), a biodegradable polymer, exhibits superior mechanical strength and processability. However, its broader adoption is hindered by inherent brittleness, low hydrophilicity, and sluggish crystallization kinetics. Chitosan (CS), a natural polysaccharide renowned for its biocompatibility and biodegradability, offers potential to address these limitations. While both materials have garnered significant attention in materials science, research on their integration via melt blending and the resulting performance enhancements for food-contact plastics remains understudied. This research comprehensively explores how different levels of CS content, from 0% to 10%, impact the characteristics of chitosan/polylactic acid (CS/PLA) composites. It specifically analyzes the influence of various CS concentrations on the mechanical attributes, crystallization behavior, thermomechanical properties, and rheological performance of these composites. The study concludes that a CS content of 4% in the CS/PLA composite results in the best overall properties. At this point, its elongation at break and impact strength reached their maximum values (16.16% and 20.63 kJ/m²), representing increases of 23.9% and 15.7% compared to pure PLA. At this particular concentration, CS is evenly distributed throughout the PLA matrix, acting as a heterogeneous nucleating agent. It facilitates the crystallization of the composite material and offers effective reinforcement. This study presents a promising approach for developing environmentally friendly and sustainable alternatives to fossil-based plastics, highlighting significant research value and practical application potential.Keywords
Food contact materials are substances that come into direct, indirect, or potential contact with food under normal conditions of use but are not classified as food themselves. These materials are integral to food packaging, storage, transportation, and retail, necessitating strict safety standards to prevent the release of harmful substances into food [1]. Currently, most food contact materials are predominantly derived from fossil-based polymers [2]. However, the widespread use of non-degradable, petrochemical-derived plastics has raised significant environmental concerns due to persistent ecological damage caused by accumulating plastic waste [3]. In response, the industry is prioritizing the development and adoption of biodegradable polymers as sustainable alternatives [4]. Such innovations address the finite availability of petrochemical resources while simultaneously reducing CO2 emissions, offering a promising pathway toward mitigating environmental impacts.
Polylactic acid (PLA), a prominent biodegradable polymer, demonstrates bioabsorbable and biocompatible properties and is synthesized from lactic acid or its cyclic dimer, lactide [5]. Unlike conventional plastics, PLA is derived from renewable starch-based crops such as corn [6] and wheat [7], with its production and degradation processes achieving maintaining balanced atmospheric CO2 levels. Compared to other biodegradable polymers [8], PLA exhibits superior mechanical strength and processing versatility, enabling applications in food packaging [9–11] and biomedical sectors [12]. For instance, Li et al. [13] fabricated microsphere-hydrogel composites by integrating MgO/MgCO3-PLA microspheres into chitosan-based hydrogel matrices. The composite exhibited controlled magnesium ion release, highlighting its potential for medical use. Despite these advantages, PLA suffers from excessive brittleness, low thermal resistance, and limited mechanical durability, hindering broader adoption. Addressing these challenges requires further research into modification techniques and process optimization to broaden PLA’s applicability. Extensive research confirms that blending modification serves as a practical strategy to enhance PLA’s material properties. Common modifiers include biomass fillers such as wood flour, lignin, and starch [14–16].
Chitosan (CS), a cationic polysaccharide derived from the partial deacetylation of chitin, is nontoxic and exhibits inherent biodegradability and biocompatibility [17]. These intrinsic properties, combined with its multifunctional groups, have sparked extensive research into CS across diverse fields, particularly in biomedical applications such as filtration membranes, biosensing systems, tissue engineering scaffolds, and environmental remediation technologies [18]. Although both CS and PLA demonstrate strong biocompatibility and degradability, garnering significant interest in materials science, the integration of these polymers via melt blending and their potential applications in food-contact plastics remain understudied. This approach offers potential to enhance material performance while providing a novel strategy to address the environmental challenges posed by conventional fossil-based plastics. Shang et al. [19] developed PLA bio-composites reinforced with functionalized wood fibers (FWF). The incorporation of FWFs endowed PLA with unique optical properties, such as nearly complete UV-blocking (100% UVR) across the entire UV spectrum when 20 wt% FWFs were added. Sun et al. [20] fabricated electrospun fibrous membranes by incorporating chitosan, PLA, and zein, which formed a ternary network structure that demonstrated effective airborne pollutant filtration, highlighting their potential for air purification applications.
Based on the background outlined above, this study utilizes CS as a blending agent to fabricate CS-PLA composite materials via melt processing. The research focuses on investigating the dispersion of CS particles within the PLA matrix and their impact on crystallization kinetics and mechanical properties. By optimizing CS content, we aim to address PLA’s inherent limitations-excessive brittleness, poor hydrophilicity, and sluggish crystallization rates-thereby enhancing the composite’s mechanical and thermal performance. This approach advances the development of sustainable alternatives to conventional fossil-derived plastics.
PLA granules (model 4032D, with a density of 1.24 g/cm³ and a melting point of 165°C) were sourced from Nature Works (Minnetonka, MN, USA). Additionally, chitosan (CS) with a deacetylation degree of at least 95% was obtained from Shanghai Aladdin Biochemical Technology Co., Ltd.
2.2 Preparation of CS/PLA Composite Materials
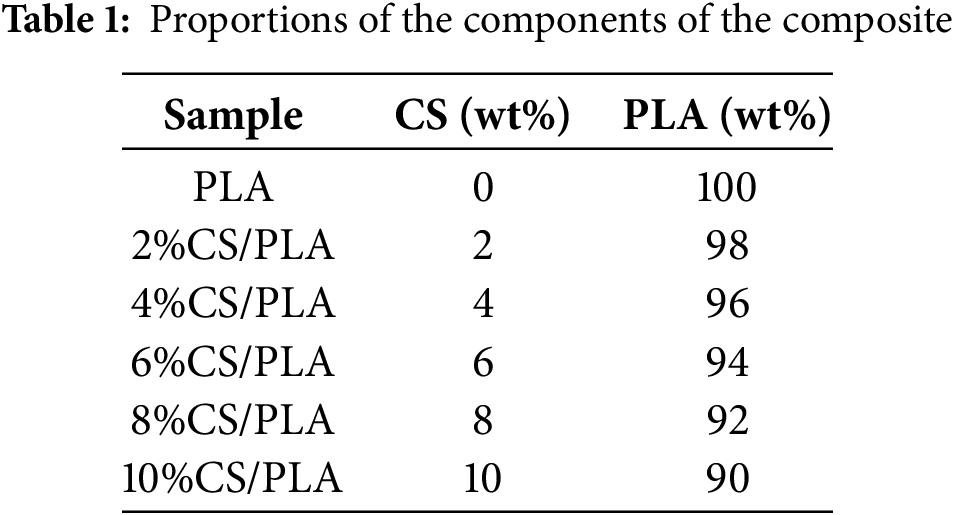
The procedure for preparing CS/PLA composites is depicted in Fig. 1. Initially, CS and PLA were dried in a vacuum oven at 80°C for 10 h to eliminate moisture. Subsequently, CS and PLA were mixed in a twin-screw extruder at a predetermined ratio. The temperature settings for the extruder, from the die to the feed zone, were 135°C, 165°C, 175°C, 175°C, and 135°C, respectively. This process yielded the CS/PLA composites. The composites were then ground into granules using a multifunctional grinder. Finally, injection molding was carried out with a micro-injection molding machine at 180°C, under a working pressure of 0.8 MPa, and a heating time of 300 s to fabricate dumbbell-shaped and strip-shaped samples. Table 1 lists the specific ratios of CS and PLA in each sample.

Figure 1: Schematic of chitosan/polylactic acid composite material
2.3.1 Chemical Structure Characterization
The changes in the characteristic peaks of functional groups existing in CS, PLA, and their mixtures were obtained by Fourier transform infrared (FTIR) spectroscopy (Tensor II, Bruker, Hong Kong). The measurements were conducted over a wavelength range of 500 to 4000 cm−1, with a resolution of 4 cm−1 and a total of 32 scans.
2.3.2 Mechanical Property Test
The mechanical characterization of the materials was performed under ambient conditions using a computer-controlled universal testing machine (CMT-5504, SANS Testing Machine Co., Shenzhen, China). Three-point flexural and uniaxial tensile evaluations were implemented at a constant crosshead speed of 2 mm/min, following Chinese national standards GB/T 9341-2008 and GB/T 1040.1-2018. The tensile test specimens were dumbbell-shaped, with a minimum cross-sectional area of 5 mm × 2 mm. For the three-point bending test, specimens were prepared using a mold with dimensions of 80 mm × 10 mm × 4 mm. The unnotched impact strength of the materials was assessed at room temperature using an XJC-50 simply supported beam impact testing machine, following the national standard GB/T 1043.1-2008. The pendulum used for the tests had a capacity of 2 J. The preparation of impact specimens is consistent with the pattern of three-point bending. Before conducting the tensile, bending, and impact tests, the dimensions of each specimen were measured with a vernier caliper. A minimum of five tests were performed for each sample composition, and the results were averaged.
2.3.3 Differential Scanning Calorimetry test
The thermodynamic characteristics of all samples were evaluated using a differential scanning calorimeter (DSC, model 214 Polyma, NETZSCH Instruments, Selb, Germany). The samples were heated from 25°C to 210°C at a rate of 10°C/min. The crystallinity was calculated according to Eq. (1).
In the formula,
The morphological characteristics of chitosan distribution on the PLA matrix were observed and analyzed using scanning electron microscopy (QUANTA 220, FEI Company, Eindhoven, The Netherlands). Samples were immobilized with conductive adhesive and subjected to gold sputter coating.
2.3.5 Polarized Microscope Analysis
A polarized light microscope (POM, model BX53M) was used to observe the isothermal crystallization of all samples. A hot stage in the Ultra High-Definition Dynamic Visual Phase Transformation Analysis System (UHD-DVPTAS, Model HCS621GXY) was used to increase the temperature from room temperature to 200°C to melt the samples completely. Then, the sample was cooled down to 120°C at a rate of 50°C /min. In addition, the crystallization pattern of the specimen was observed isothermally.
The crystalline structure of the sample was analyzed using an X-ray diffractometer (model D/max 220, Rigaku, Japan) over the angular range from 5° to 50° (with a scanning rate of 5°/min).
2.3.7 Water Absorption (WA) Test
The samples were vacuum-dried at 60°C for 12 h and subsequently weighed (recorded as Wa). Subsequently, the samples were submerged in ultrapure water and held in beakers at ambient temperature. Every 12 h, the samples were taken out, their surface moisture was gently wiped off, and their weights were measured and documented (recorded as Wb). The water absorption was then computed using Eq. (2).
2.3.8 Dynamic Thermo-Mechanical Performance Test
Dynamic mechanical analysis (DMA) was conducted using a dynamic mechanical analyzer (242 E, NETZSCH, Selb, Germany) in three-point bending mode. The composite samples had dimensions of 45 mm in length, 5 mm in width, and 2 mm in thickness. During the testing process, the frequency was set to 5 Hz. The temperature program began at −20°C and then increased to 150°C at a controlled heating rate of 5°C /min.
The thermal stability of the samples was assessed using a thermogravimetric analyzer (209F3, NETZSCH, Selb, Germany). The testing was performed across a temperature range from 25°C to 600°C at a heating rate of 10°C/min.
2.3.10 Rheological Property Test
The rheological properties were evaluated using a rotational rheometer (AR2000ex, TA Instruments, New Castle, DE, USA) at 180°C, equipped with a 25 mm parallel plate fixture (with a gap of 2 mm). A frequency sweep from 0.1 to 100 rad/s was performed at a strain amplitude of 0.1% to gather data on the melt dynamic properties.
The experimental measurements were tested triple and expressed as mean ± standard deviation.
3.1 Chemical Structure Analysis
In the FTIR spectra (Fig. 2a) and enlarged FTIR spectra (Fig. 2b,c), PLA exhibits distinct absorption peaks at 2995 and 2940 cm−¹, which primarily correspond to the asymmetric stretching vibrations of the -CH groups within the PLA molecules. These peaks characterize the vibrations of the methyl and methylene groups found in both the main and side chains of polylactic acid [21]. A prominent absorption peak appears at 1750 cm−¹, attributed to the stretching vibration of the ester carbonyl (C=O) group in PLA. The peak near 1380 cm−¹ is mainly attributed to the symmetric or slightly asymmetric bending vibrations of the –CH3 groups present on the PLA side chains. This peak indicates the vibrational characteristics of the methyl groups in PLA [22]; The region from 1180 to 1041 cm−¹ is attributed to the stretching vibrations of the C-O-C or C-O skeletal structures in PLA molecules. The absorption peaks in this range often manifest as multiple shoulder peaks or overlapping peaks, reflecting the complexity of the vibrations associated with ester bonds and oxygen atoms in the main chain of PLA. Moreover, the absorption peak at 865 cm−¹ is associated with the stretching or local out-of-plane vibrations of the C–C bonds in the main chain of PLA molecules. In contrast, the infrared spectrum of CS exhibits features characteristic of its unique polysaccharide structure. The peak at 2865 cm−¹ corresponds to the symmetric stretching vibrations of the aliphatic -CH2 groups, reflecting the regular arrangement of methylene groups within the chitosan molecules. A distinct peak at 1590 cm−¹ is associated with the amide II band, which primarily involves N–H bending vibrations or the characteristic absorption of amino groups. This indicates the presence of amino groups and residual acetyl groups [23]; The peaks at 1420, 1375, and 1320 cm−¹ are attributed to the coupling of -CH, C-N, and amide III vibrations within the chitosan polysaccharide backbone, reflecting its complex intramolecular interactions and structural characteristics. Additionally, the absorption peaks at 1025 and 1150 cm−¹ correspond to the glycosidic bonds (C-O-C) and ring-breathing vibrations, which are key indicators of the structural integrity of the chitosan polysaccharide. The characteristic peak of the β-(1,4) glycosidic chain is usually at 890 cm, directly reflecting the connection mode of the polysaccharide [24]. Upon mixing PLA with CS, the asymmetric stretching peak of the C–H bond in PLA shifts from 2944 to 2942 cm−¹. This shift indicates a change in the local electronic environment of the C–H bonds within the PLA molecules. The observed shift is attributed to hydrogen bonds or other polar interactions between PLA and CS, which reduce the vibrational energy of the C–H bonds in PLA, resulting in a red shift (i.e., a shift to lower wavenumbers) [25]. Meanwhile, in the CS structure, the symmetric stretching vibration peak of the aliphatic -CH2 groups at 2869 cm−¹ splits into two distinct peaks (2925 and 2852 cm−¹) upon the formation of the composite. This situation can be considered that the presence of PLA has changed the microenvironment of aliphatic -CH2 groups in CS. Some -CH2 groups are affected by the PLA segments, resulting in a shift of their asymmetric stretching vibration peak to a higher wavenumber (2925 cm−¹), while the characteristic peak around 2852 cm−¹ primarily corresponds to symmetric stretching vibrations [26]. The characteristic C-O stretching peak of PLA near 1100 cm−¹ shows a pronounced increase in intensity, indicative of hydrogen bond formation and enhanced molecular compatibility between CS and PLA. This interaction leads to sharper absorption peaks, confirming molecular compatibility and intermolecular interactions within the composite film. Fig. 3 schematically depicts the hydrogen bonding and intermolecular interactions between PLA and CS.

Figure 2: (a) FTIR spectra and (b,c) enlarged FTIR spectra of PLA and CS/PLA composites with different CS content

Figure 3: The intermolecular forces between polylactic acid and chitosan
3.2 Mechanical Properties of Composites
As shown in Fig. 4a, pure PLA exhibits a tensile strength of 67.45 MPa. However, increasing chitosan (CS) content progressively reduces this property, with tensile strengths declining to 60.84 MPa (2% CS), 58.10 MPa (4%), 54.94 MPa (6%), 54.37 MPa (8%), and 49.10 MPa (10%). This decline is attributed to the inherent polarity mismatch between chitosan and PLA. Chitosan, a natural polymer abundant in polar hydroxyl and amino groups, contrasts with the weakly polar PLA, creating thermodynamic incompatibility. This incompatibility weakens interfacial adhesion, and under mechanical stress, the modulus disparity between the two phases concentrates stress at the chitosan domains. Concurrently, poor interfacial bonding promotes phase separation, generating defects that propagate fractures in the PLA matrix. As the CS content rises, the compatibility of the composite deteriorates further. This makes the CS phase more susceptible to agglomeration, resulting in the formation of more and larger defects within the material. The presence of these defects hinders the effective transfer of stress, leading to a gradual decrease in the tensile strength of the composite material. As shown in Fig. 4b, the elongation at break of the CS/PLA composites initially increases with rising chitosan content, before subsequently decreasing. The maximum elongation at break is observed at 16.16% when the chitosan content is 4%. The images of the samples, both before and after tensile strength testing, shown in Fig. 4c, correspond with the observed trend in elongation at break. At low chitosan (CS) content, weak interfacial adhesion between CS and PLA readily de-bonds under external stress, inducing cavitation that nucleates multiple microcracks within the PLA matrix [27]. In such composites, stress concentrations at microcrack tips promote shear yielding and shear band formation. Molecular chain slippage within these shear bands enhances PLA’s plastic deformation capacity, significantly improving material toughness. Conversely, excessive CS content amplifies intermolecular attraction among polar chitosan molecules, driving particle agglomeration. Under stress, interfaces between agglomerated CS domains and the PLA matrix de-bond, forming macroscopic voids. These voids intensify localized stress concentrations, ultimately triggering catastrophic fracture.

Figure 4: (a) Tensile strength, (b) elongation at break, (c) photos of samples before and after tensile test, (d) flexural strength and (e) impact strength of PLA and composites
According to Fig. 4d, the flexural strength of pure PLA is 106.21 MPa. As the CS content increases, the flexural strength of the composites decreases to 103.85, 95.58, 86.76, 89.37, and 78.12 MPa, respectively. This decline phenomenon is attributed to the poor interfacial compatibility, resulting in inadequate bonding strength at the interface, which negatively impacts the overall mechanical properties of the composite material. Fig. 4e reveals that the impact strength peaks at 20.63 kJ/m2 at 4% CS content. Beyond this threshold, impact resistance progressively decreases. This decline stems from interfacial adhesion destabilization at higher CS loadings, which induces debonding under mechanical stress. Such debonding generates macroscopic voids that disrupt the material’s microstructure, consequently hindering the formation of energy-dissipating crazes and shear bands, thereby reducing impact resistance.
3.3 Microscopic Morphology of Composites
This study employed cryogenic fracture via liquid nitrogen to prepare fractured samples of CS-PLA composites with varying CS contents (2%–10%), analyzing their microstructures in comparison to pure PLA. As shown in Fig. 5a, pure PLA exhibits a smooth, featureless fracture surface with minimal fibrous structures, indicative of its inherent brittleness, consistent with prior literature [28]. Fig. 5b–f presents SEM images of CS-PLA composites with increasing CS content. The incorporation of CS markedly enhances surface roughness on the fracture planes. At low CS loadings (2%–4%, Fig. 5b,c), sparse pores and CS particles are visible, yet the microstructure remains uniform without macroscopic phase separation. This homogeneity suggests effective dispersion of CS within the PLA matrix at lower concentrations, reflecting enhanced interfacial compatibility.
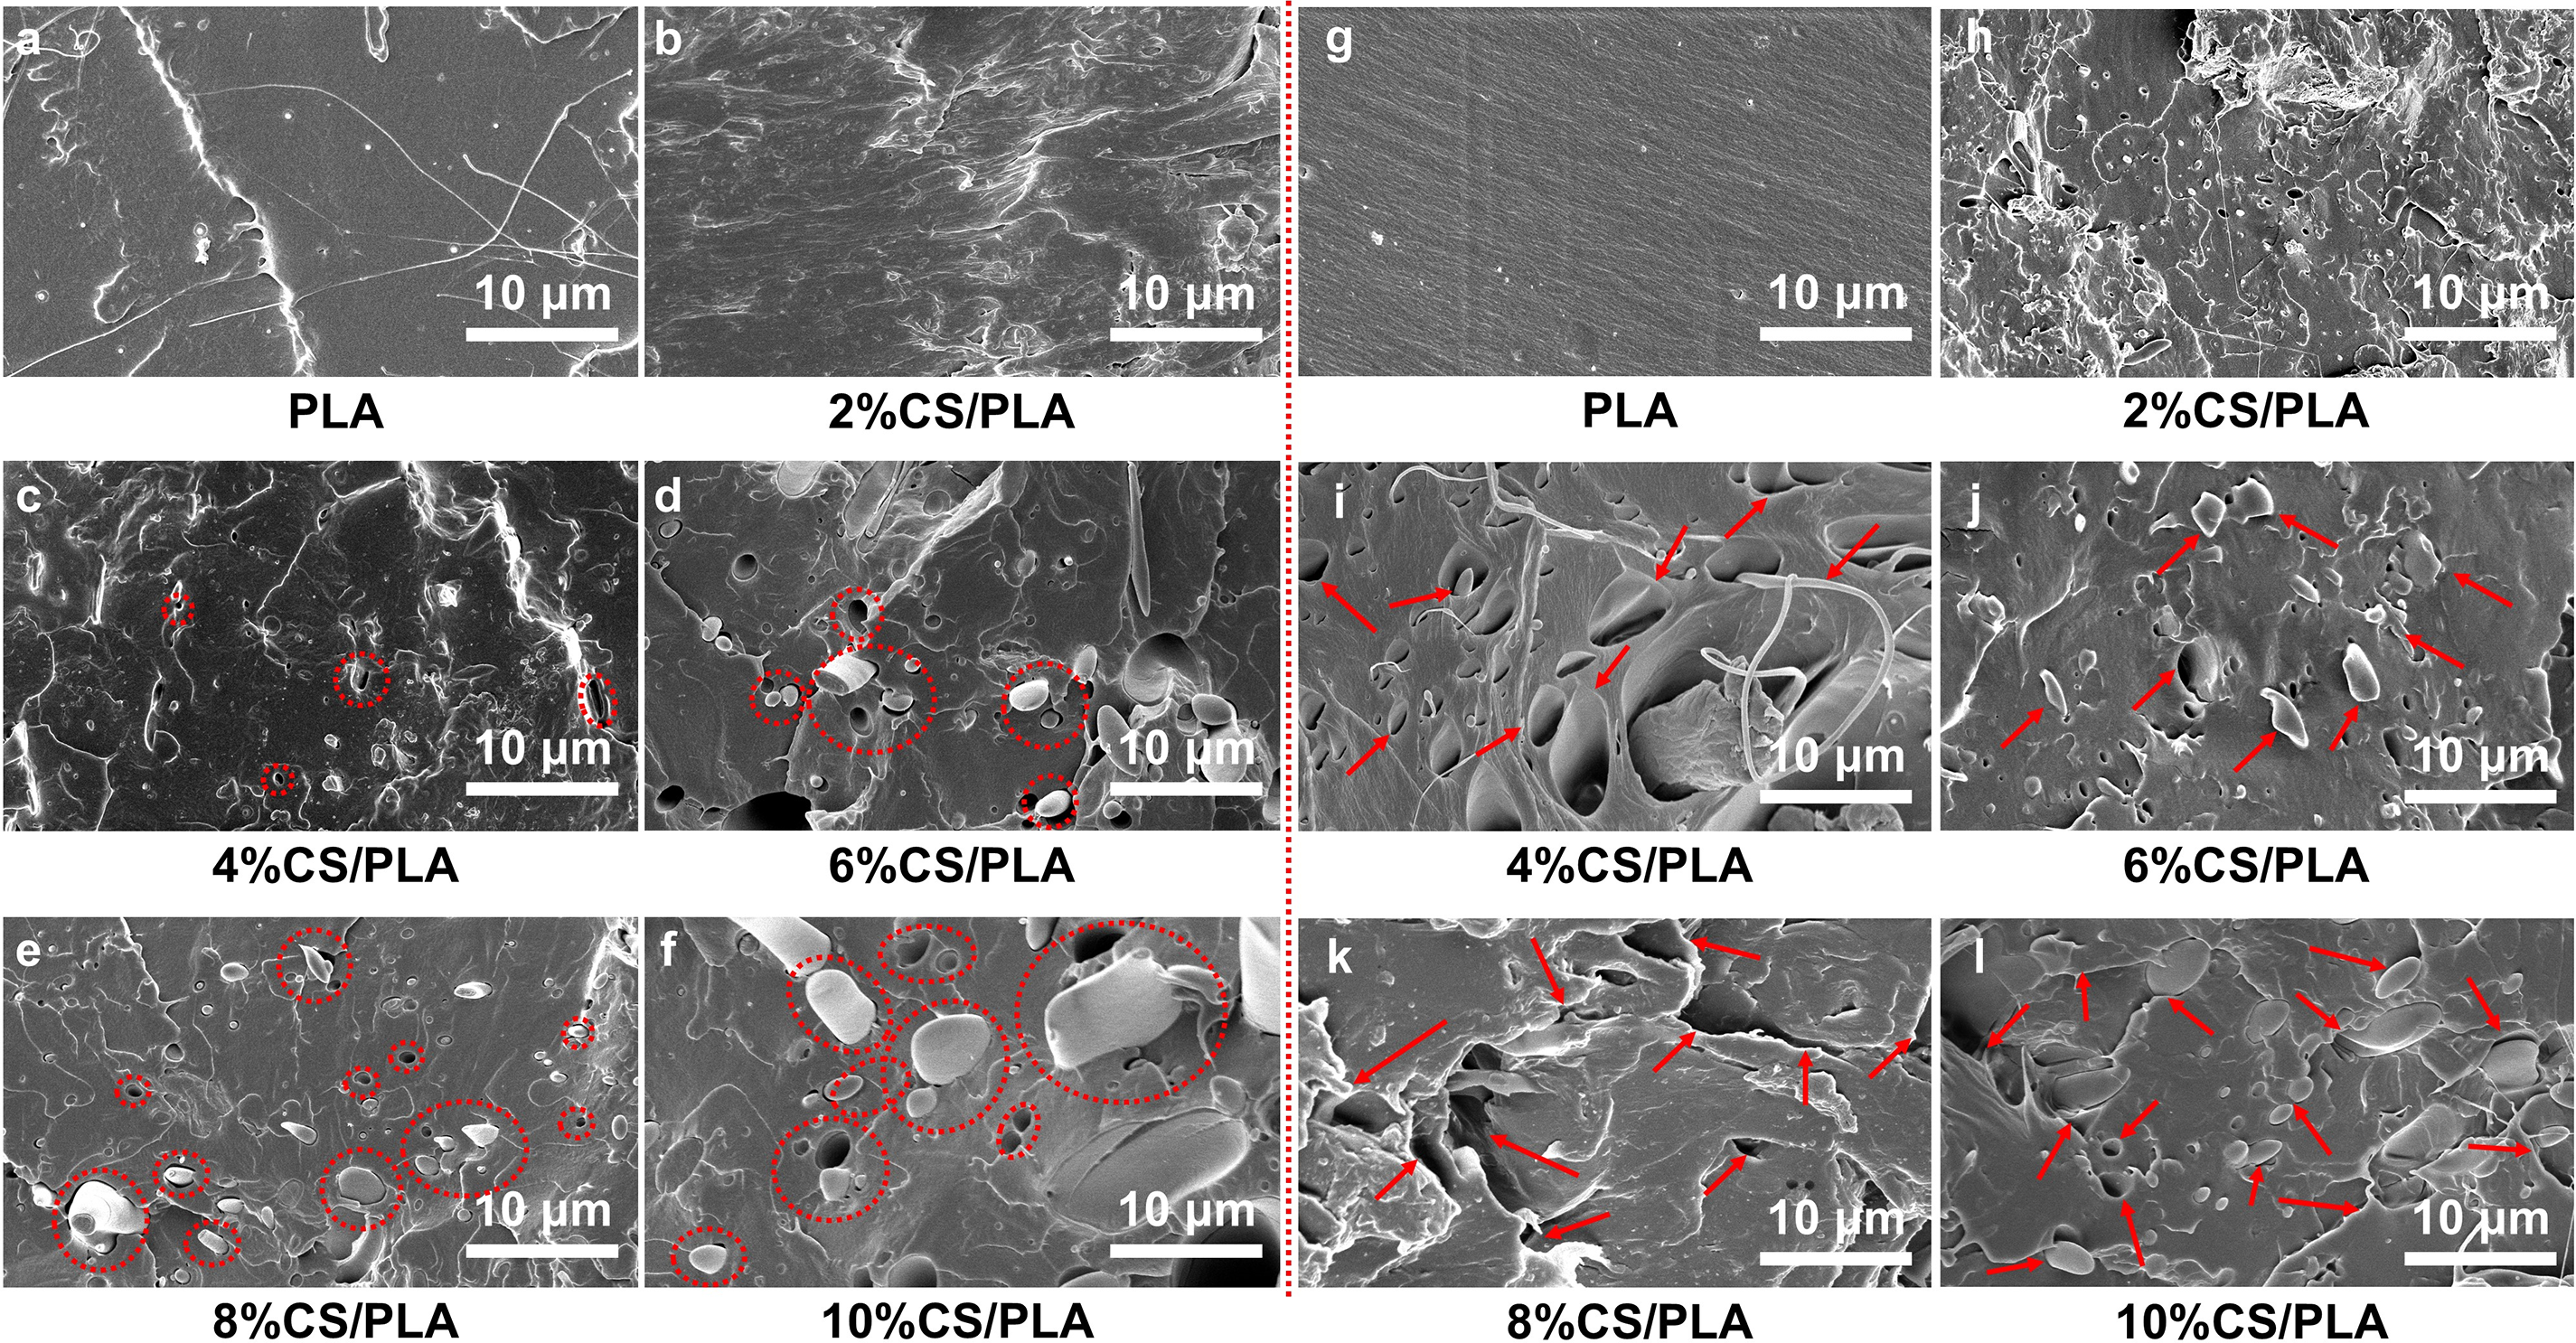
Figure 5: (a–f) SEM images of sample sections obtained through brittle fracture of PLA and CS/PLA composites with varying CS contents in liquid nitrogen; (g–l) SEM images of PLA and CS/PLA composites with different CS contents following tensile testing
When CS content exceeds 4% (as shown in Fig. 5d–f), the fracture surfaces of CS-PLA composites exhibit a marked proliferation of pores, enlarged CS particles, and distinct phase boundaries between PLA and CS domains. This transition arises from chitosan agglomeration at higher loadings (≥6%), reducing dispersion efficiency and exacerbating interfacial incompatibility [29]. These microstructural changes correlate with declining mechanical performance. At lower CS loadings (≤4%), the composites exhibit enhanced toughness, particularly at 4% CS, where uniform CS distribution within the PLA matrix provides optimal reinforcement. Conversely, excessive CS content (>4%) promotes agglomeration-induced voids that act as stress concentrators, degrading overall mechanical performance [30].
To elucidate the microstructural evolution of CS-PLA composites under tensile stress, SEM analysis was conducted on fracture surfaces of samples with varying CS loadings (Fig. 5g–l). Pure PLA exhibits a smooth fracture morphology (Fig. 5g), characteristic of brittle fracture behavior [31]. Comparative analysis reveals that composites with 4% CS (Fig. 5i) display abundant voids and fibrillar structures formed during tension. These voids arise from uniform CS dispersion within the PLA matrix, which triggers cavitation during fracture [32]. Cavitation-induced voids promote localized crazing, thereby enhancing energy dissipation and fracture resistance. However, as the CS content further increases, as shown in Fig. 5j–l, the composites gradually exhibit a distinct two-phase structure. Under tensile stress, interfacial debonding preferentially initiates at phase boundaries, serving as the predominant mechanism for mechanical performance degradation in composite materials.
Fig. 6a illustrates the water absorption behavior of CS-PLA composites with varying CS contents. Pure PLA, a hydrophobic polyester, exhibits minimal water absorption (0.85%) after 14-day water immersion. In contrast, CS-a hydrophilic biopolymer-contains abundant hydroxyl (-OH) and amino (-NH2) groups. The -OH and -NH2 in CS contain lone electron pairs (N: one pair; O: two pairs), which enhance molecular polarity and enable hydrogen bonding with water. Incorporating CS into PLA markedly enhances hydrophilicity, with water absorption increasing progressively at higher CS loadings. However, below 4% CS, water uptake remains limited due to pronounced phase separation caused by polarity mismatch. At these low loadings, CS forms isolated domains (“discontinuous phase”) within the PLA matrix rather than a continuous network. The hydrophilic groups in CS are shielded by the hydrophobic PLA matrix, restricting water interaction. Consequently, water diffusion occurs predominantly through interfacial defects or sparse pores, resulting in limited water uptake. However, once the chitosan content surpasses 8%, there is a notable increase in the water absorption rate of the composite.

Figure 6: (a) Water absorption rate curve, (b) DSC curve, (c) XRD spectrum, and (d) magnified XRD spectrum of PLA and CS/PLA composites with different CS content
At 10% CS content, the composite achieves a water absorption rate of 10.37% after 14-day immersion. This increase arises as chitosan forms a continuous hydrophilic network within the composite at higher loadings, enabling water to rapidly diffuse through interconnected CS channels and interact with polar groups (-OH/-NH2). Furthermore, PLA’s semi-crystalline structure inherently resists water penetration due to its ordered crystalline regions. At low CS loadings, PLA’s crystallinity remains largely unaffected, preserving its barrier properties. However, excessive CS disrupts PLA’s crystalline order, increasing amorphous domains that act as percolation pathways for water diffusion. These combined mechanisms-enhanced hydrophilic networks and disrupted crystallinity-synergistically amplify the composite’s water absorption capacity.
3.5 Thermal Properties Analysis
Fig. 6b displays the DSC curves of the PLA/CS composites, with the specific parameters outlined in Table 2. With the gradual increase of the content, the glass transition temperature (Tg) and cold crystallization temperature (Tcc) of the PLA composite material decreased to varying degrees, but both rebounded at a concentration of 10%, while the melting temperature (Tm) and crystallinity (Xc) increased. The change in Tg is relatively minor, remaining around 62°C–63°C, which indicates that the blending of CS and PLA results in a physical mixture without significant chemical bonding between the two components. The variation in Tg is relatively small, staying around 62°C–63°C. This suggests that blending CS and PLA produces a physical mixture rather than creating chemical connections. The cold-crystallization temperature exhibits a significant reduction, dropping from 137.54°C for pure PLA to 102°C–105°C in CS-PLA composites. This shift suggests chitosan acts as a plasticizer, loosening PLA’s molecular chain packing and improving chain mobility during crystallization. Consequently, crystallization kinetics accelerate, leading to earlier crystallization onset [33]. The plasticizing effect also manifests in mechanical behavior, with CS incorporation reducing tensile strength due to diminished intermolecular cohesion [34].
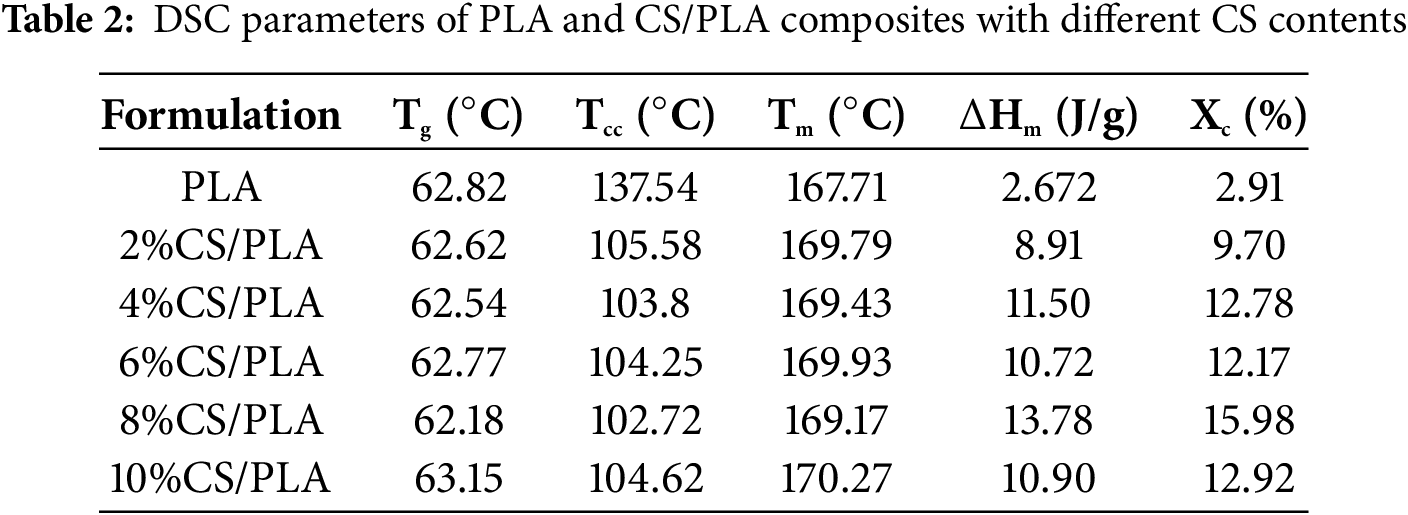
The crystallinity of PLA increases from 2.91% to 9.70% with 2% CS incorporation, rising further to 15.98% at 8% CS-a ∽13% increase relative to pure PLA. This enhancement confirms CS’s role as a nucleating agent, where CS particles promote heterogeneous nucleation by lowering crystallization activation energy, thereby improving crystallinity [35]. However, at 10% CS, crystallinity declines to 12.92%, likely due to a transition from nucleation efficacy to chain immobilization. At lower loadings, CS acts as discrete nucleation sites that accelerate crystallization, whereas excessive CS induces agglomeration, restricting polymer chain mobility and suppressing crystalline domain formation [36]. Additionally, the addition of chitosan leads to the appearance of an extra endothermic peak around 160°C in the composite. This phenomenon likely arises from the formation of polydisperse crystallites during heterogeneous crystallization. The melting of these crystallites across a broad temperature range, driven by their size-dependent endothermic behavior, accounts for the distinct endothermic peak observed prior to the primary melt [37].
3.6 Impact of CS Incorporation on the Crystallization of CS/PLA Composites
The XRD spectra (Fig. 6c,d) display characteristic diffraction peaks at 2θ = 16.8° and 21.8°, consistent with semi-crystalline PLA [38]. CS, which adopts an amorphous or low-crystallinity structure, lacks prominent peaks in XRD patterns. As CS content increases from 2% to 10%, PLA’s diffraction peaks exhibit progressive changes in intensity and full width at half maximum, reflecting alterations in crystalline ordering.
At lower CS content, polar groups within CS molecules—such as -OH and -NH2 groups—interact with PLA segments via hydrogen bonding. These interactions act as localized nucleating agents, slightly enhancing PLA crystallinity and yielding sharper XRD peaks or modest intensity increases. However, as CS content rises, excess amorphous CS disrupts the ordered stacking of PLA molecular chains, broadening peaks and reducing intensity, thereby suppressing crystallization. Despite variations in CS content, PLA’s primary XRD peaks (16.8° and 21.8°) persist, indicating no fundamental structural transformation. Nevertheless, PLA crystallinity and crystal perfection initially improve but decline at higher CS loadings.
Polymer crystallization involves two critical stages: nucleation and crystal growth. POM is a powerful tool for studying these processes and deriving crystallization kinetics. Under isothermal conditions, POM reveals nuclei density and spherulite growth rates in transparent polymer films. During crystallization from melt or solution, polymers often form spherulites—structures whose size and morphology directly influence mechanical and optical properties. Understanding spherulite formation mechanisms is thus crucial for tailoring material performance and applications. Fig. 7 shows POM images of PLA and CS-PLA composites with varying CS content. At 0 min, increasing CS content correlates with more crystalline regions in the images, attributed to un-melted CS crystallites at the observation temperature. These regions appear as bright spots due to light refraction by CS crystals. For pure PLA, nuclei emerge at 2 min during cooling, proliferate by 3 min, and coalesce into spherulites covering the field of view by 5 min. However, the crystallization rate of the composite material significantly increases with the addition of CS as the CS content rises. At 10% CS content, crystallization initiates as early as 2 min, with full-field spherulite coverage achieved by 3 min. This accelerated crystallization stems from CS acting as a heterogeneous nucleating agent—its particles provide preferential sites for PLA chain alignment during the nucleation phase. By lowering the energy barrier for nucleation, CS drastically reduces induction time and enhances crystallization kinetics.

Figure 7: POM images of PLA and CS/PLA composites with different CS contents
3.7 Thermomechanical Properties Analysis
The thermomechanical properties of CS-PLA composites were analyzed via DMA. Fig. 8a,b depicts the temperature-dependent storage modulus and loss tangent (tan δ), respectively. Incorporating CS markedly enhanced the storage modulus of PLA: at 6% CS loading, the storage modulus increased from 1670 MPa (pure PLA) to 3091 MPa, demonstrating improved rigidity. Beyond 6% CS, the storage modulus declined to ~2404 MPa due to CS agglomeration and compromised dispersion. The sharp drop in storage modulus at elevated temperatures corresponto the onset of molecular chain mobility, signaling the glass transition. DMA results aligned with DSC data, with both methods showing minimal Tg variation across composites [39].
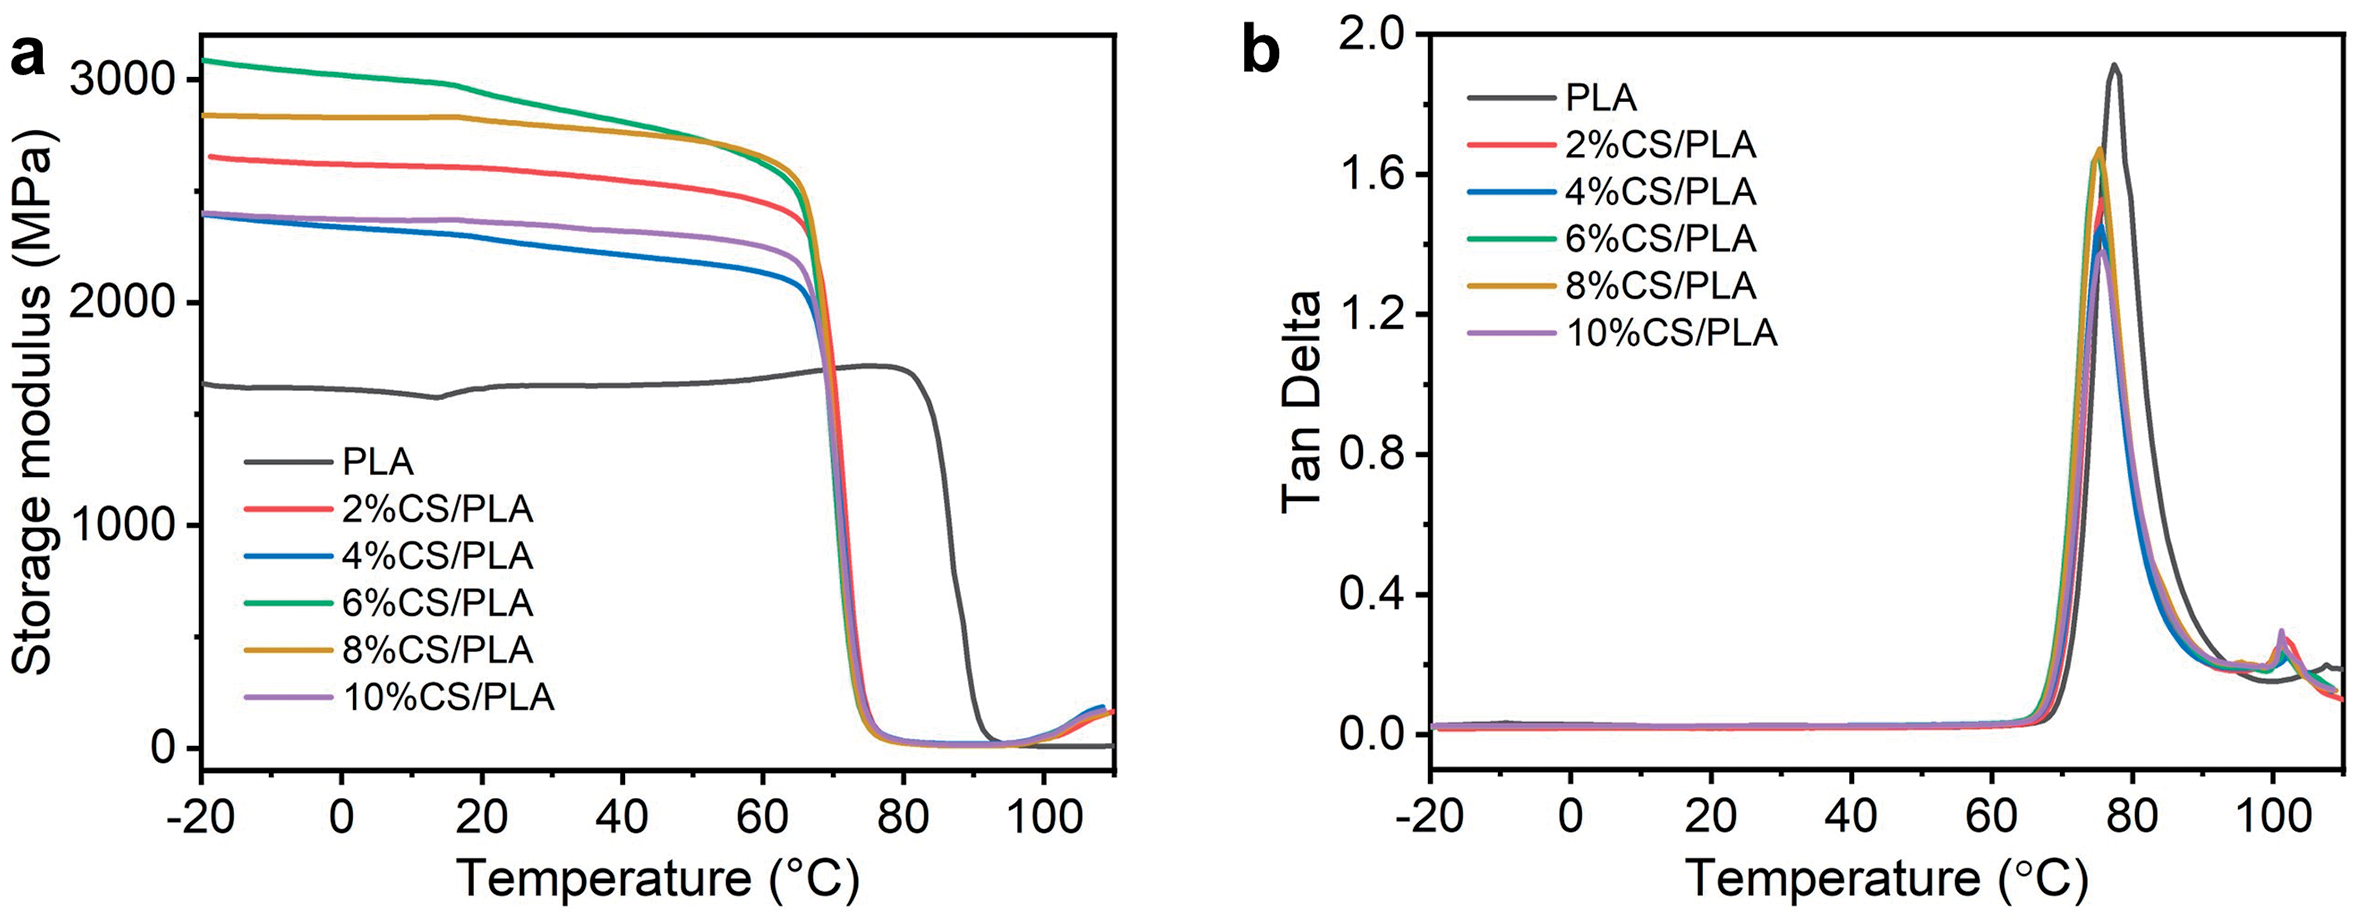

Figure 8: (a) storage modulus, (b) loss angle, (c) TG and (d) DTG curves of PLA and CS/PLA composites with different CS contents
The Tg is characterized by the peak value of tan δ, whose magnitude correlates with molecular chain mobility and structural order. Upon CS incorporation, the tan δ peak intensity initially rises then declines, reflecting a transition from PLA’s amorphous state (evidenced by high damping) to a more ordered crystalline structure. This shift aligns with increased crystallinity induced by CS acting as a nucleating agent. While CS’s rigid framework enhances energy dissipation via restricted chain motion, excessive CS loading (>6%) promotes agglomeration, weakening interfacial viscoelasticity and forming micro-voids that reduce stiffness—consistent with observed modulus reductions at higher CS content [40].
At lower chitosan (CS) loadings (2%–6%), the Tg marginally decreases, consistent with CS acting as a nucleating agent that disrupts interfacial adhesion and reduces interchain constraints. Conversely, at higher CS loadings (8%–10%), Tg rebounds due to restricted PLA chain mobility caused by hydrogen-bonding interactions and physical entanglements with CS. The observed Tg elevation may also arise from excessive CS-inducing localized thermal barriers, impeding heat dissipation during DMA testing [41]. The narrowing loss peak width upon CS incorporation reflects CS-induced disruption of PLA’s native chain segment relaxation modes. Concurrently, the storage modulus increases and the loss of tangent extremum observed at 100°C arises from cold crystallization—a temperature-dependent process where enhanced chain mobility enables structural reordering within the polymer matrix [42].
3.8 Effect of CS Addition on the Thermal Stability of CS/PLA Composites
Fig. 8c illustrates that TG analysis of CS-PLA composites reveals a marked increase in residual mass with CS incorporation. This originates from CS’s propensity for char formation during thermal degradation. Unlike PLA, CS—with its polysaccharide backbone and polar functional groups (-OH/-NH2)—promotes the development of a thermally stable carbon network under pyrolysis. Interfacial interactions (e.g., hydrogen bonding) between CS and PLA further enhance char layer formation. This char serves as a thermal barrier, retarding mass transfer and volatile release during decomposition, thereby increasing residual mass [43].
The DTG results shown in Fig. 8d demonstrate that with an increase in CS content, the maximum weight loss rate of the composite during pyrolysis gradually diminishes. This behavior primarily stems from hydrogen bonding and interfacial interactions between CS and PLA, which stabilize PLA’s molecular architecture and suppress rapid thermal degradation. Furthermore, CS itself degrades over a wider temperature range compared to PLA, leading to a more gradual decomposition profile and attenuated peak mass loss rates. Additionally, CS promotes char layer formation during pyrolysis; this carbonaceous barrier impedes the outward diffusion of volatile degradation byproducts, synergistically decelerating the overall pyrolysis kinetics [44].
3.9 Rheological Properties Analysis
Dynamic rheology quantifies the viscoelastic-mechanical response of materials under periodic oscillatory stress or strain, offering a robust method to probe structural and morphological features in complex systems [45,46]. The storage modulus (G′) represents the capacity of the composite to elastically store deformation energy, indicative of its solid-like behavior. Conversely, the loss modulus (G′′) measures energy dissipation as heat, signifying viscous (liquid-like) behavior. Dynamic viscosity (η*) quantifies flow resistance under shear stress. Collective analysis of these parameters across angular frequencies provides insights into molecular chain mobility, entanglements, and structural network integrity.
Dynamic rheological analysis (Fig. 9a,b) reveals that pure PLA exhibits low G’ at low frequencies, reflecting limited elastic energy storage under low strain. As angular frequency rises, restricted molecular mobility enhances rigidity, driving a gradual increase in G′. Conversely, PLA’s G′ shows a gradual increase with frequency, underscoring dominant viscous behavior due to energy dissipation via chain motion. Introducing chitosan (CS) into PLA reduces both G′ and G″ across all frequencies, with reductions intensifying at higher CS loadings. For instance, at 10% CS-PLA, G′ and G″ decrease by ~10× in low-frequency regions, indicating compromised viscoelasticity. This stems from poor CS-PLA compatibility, causing inefficient stress transfer and reduced energy storage. At ≥4% CS loading, polar CS molecules agglomerate due to intermolecular attraction, exacerbating dispersion issues. Poor dispersion diminishes CS’s reinforcement efficacy, further degrading modulus performance [47]. Agglomerates can act as stress concentration points, diminishing the efficiency of energy storage and dissipation during material deformation, which ultimately results in a decrease in both G′ and G″.
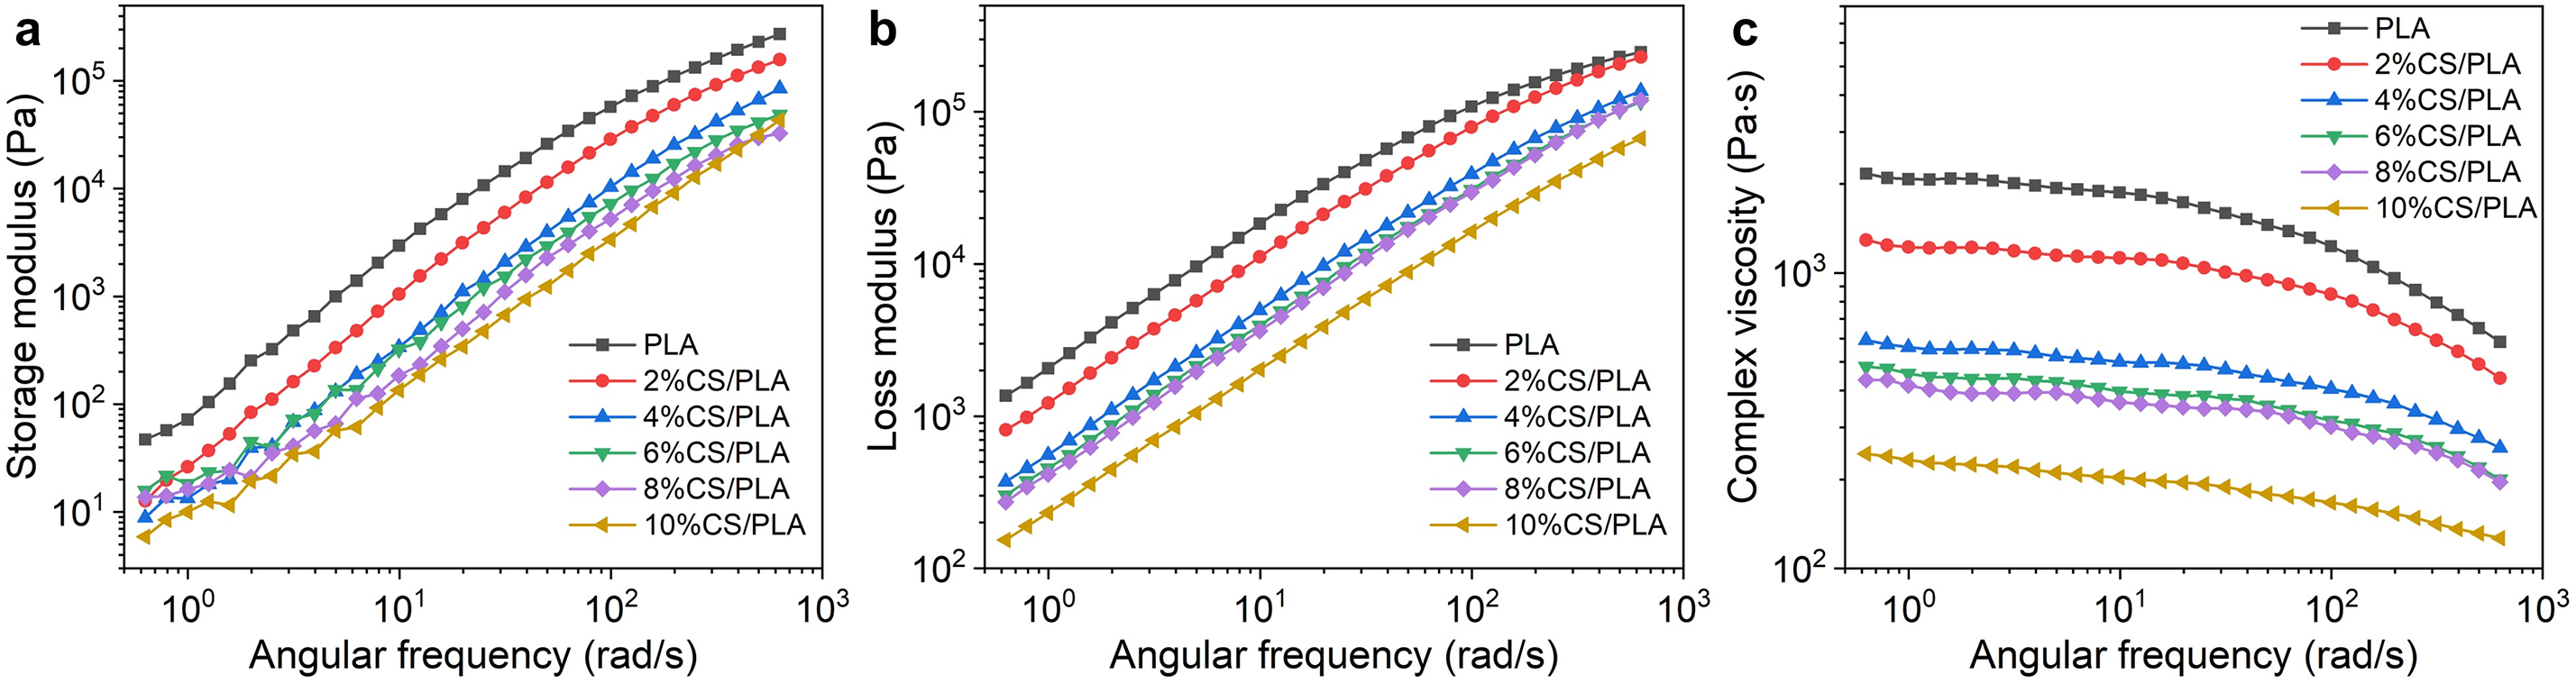
Figure 9: (a) storage modulus, (b) loss modulus and (c) complex viscosity curves of PLA and CS/PLA composites with different CS contents
As depicted in Fig. 9c, pure PLA exhibits minimal viscosity variation across the tested angular frequencies, indicative of stable flow behavior. In contrast, CS incorporation markedly reduces composite viscosity, with a pronounced decline at higher CS loadings. For instance, the 10% CS-PLA composite shows a ~10-fold viscosity reduction compared to pure PLA. This reduction stems from CS disrupting PLA’s molecular chain packing, lowering flow resistance. The disorderly chain arrangement and weakened intermolecular forces enhance deformation susceptibility during processing, thereby decreasing overall viscosity.
This research comprehensively examined how CS content affects the properties of CS/PLA composites. The findings show that an optimal amount of CS can enhance the impact strength, elongation at break, and crystallization performance of the composites. Moreover, within a certain content range, the addition of CS can markedly improve the thermal stability and rigidity of the composites. However, when the CS content is too high, agglomeration may happen within the material, resulting in weakened interfacial bonding strength and a subsequent deterioration of various properties. However, CS’s inherent hydrophilicity promotes material water absorption, which intensifies at elevated CS loadings due to aggregation. Balancing these trade-offs, the composite achieves optimal performance at 4% CS loading. At this threshold, uniform CS dispersion enables efficient stress transfer, yielding peak fracture elongation (16.16%) and impact strength (20.63 kJ/m2), while simultaneously improving crystallization kinetics—evidence of a balanced microstructure with enhanced multifunctional performance. This work advances the development of CS-PLA composites by optimizing mechanical durability, extending service life, and enhancing sustainability, providing a viable strategy for sustainable food-contact materials.
Acknowledgement: Not applicable.
Funding Statement: This research was funded by National Natural Science Foundation of China (NSFC), grant number (No. U2341237).
Author Contributions: Study conception and design: Tingqiang Yan, Xiaodong Wang, Yingjie Qiao; data collection: Tingqiang Yan, Xiaodong Wang; analysis and interpretation of results: Tingqiang Yan, Xiaodong Wang; draft manuscript preparation: Tingqiang Yan, Xiaodong Wang, Yingjie Qiao. All authors reviewed the results and approved the final version of the manuscript.
Availability of Data and Materials: The data that support the findings of this study are available from the corresponding author, Yingjie Qiao, upon reasonable request.
Ethics Approval: Not applicable.
Conflicts of Interest: The authors declare no conflicts of interest to report regarding the present study.
References
1. Bronczyk K, Dabrowska A, Bielicka-Daszkiewicz K, Milczewska K. Safety of new food contact materials: migration and sorption studies based on Tenax, powdered milk, baby cereal and oat flakes. Food Chem. 2025;483:144148. doi:10.1016/j.foodchem.2025.144148. [Google Scholar] [PubMed] [CrossRef]
2. Sepúlveda-Carter J, Moreno de Castro JL, Marín L, Baños P, Rodríguez MS, Arrieta MP. Regulatory frameworks and state-of-the-art decontamination technologies for recycled polystyrene for food contact applications. Polymers. 2025;17(5):658. doi:10.3390/polym17050658. [Google Scholar] [PubMed] [CrossRef]
3. Drago E, Moliner C, Lagazzo A, Pettinato M, Casazza AA, Finocchio E, et al. Food contact compatibility of bioplastic materials filled with degradable additives for repeated-use food applications. J Appl Polym Sci. 2025;16(2):e57104. doi:10.1002/app.57104. [Google Scholar] [CrossRef]
4. O’Loughlin J, Doherty D, Herward B, McGleenan C, Mahmud M, Bhagabati P, et al. The potential of bio-based polylactic acid (PLA) as an alternative in reusable food containers: a review. Sustainability. 2023;15(21):15312. doi:10.3390/su152115312. [Google Scholar] [CrossRef]
5. Reshma CS, Remya S, Bindu J. A review of exploring the synthesis, properties, and diverse applications of poly lactic acid with a focus on food packaging application. Int J Biol Macromol. 2024;283(4):137905. doi:10.1016/j.ijbiomac.2024.137905. [Google Scholar] [PubMed] [CrossRef]
6. Liu Y-J, Zhang Y, Chi F, Chen C, Wan W, Feng Y, et al. Integrated lactic acid production from lignocellulosic agricultural wastes under thermal conditions. J Environ Manag. 2023;342:118281. doi:10.1016/j.jenvman.2023.118281. [Google Scholar] [PubMed] [CrossRef]
7. Rebolledo-Leiva R, Ladakis D, Ioannidou S-M, Koutinas A, Moreira MT, González-García S. Attributional and consequential life cycle perspectives of second-generation polylactic acid: the benefits of integrating a recycling strategy. J Clean Prod. 2023;420:138354. doi:10.1016/j.jclepro.2023.138354. [Google Scholar] [CrossRef]
8. Colorado HA, Velásquez EIG, Monteiro SN. Sustainability of additive manufacturing: the circular economy of materials and environmental perspectives. J Mater Res Technol. 2020;9(4):8221–34. doi:10.1016/j.jmrt.2020.04.062. [Google Scholar] [CrossRef]
9. Jannatiha N, Gutiérrez TJ. Recycling and revalorization of PLA and PHA-based food packaging waste: a review. Sustain Mater Technol. 2025;44:e01364. doi:10.1016/j.susmat.2025.e01364. [Google Scholar] [CrossRef]
10. Sun P, Liu K, Dong C, Yan L, Zhu H, Fang M, et al. Optimizing polylactic acid: synthesis, properties, and regulatory strategies for food packaging applications. Front Chem Sci Eng. 2025;19(3):19. doi:10.1007/s11705-025-2523-8. [Google Scholar] [CrossRef]
11. Abdul Malek Nur S, Omar H, Rosman N, Hajar N, Aizamddin Muhammad F, Bonnia Noor N, et al. Tailoring synergistic polylactic acid-based nanocomposites for sustainable antimicrobial fruit packaging. Packag Tech Sci. 2025;38(2):163–92. doi:10.1002/pts.2864. [Google Scholar] [CrossRef]
12. Oktavia LW, Bégué D, Campana PT, Hiorns RC. Review: syntheses of poly(lactic acid)s and their block copolymers for drug delivery applications. Polym Int. 2023;72(10):881–98. doi:10.1002/pi.6529. [Google Scholar] [CrossRef]
13. Li L, Wu Y, Xu Z, Xu Y, Gao X, Diao Y, et al. Controlled release of magnesium ions from PLA microsphere-chitosan hydrogel complex for enhancing osteogenic and angiogenic activities in vitro. Int J Biol Macromol. 2024;283:137649. doi:10.1016/j.ijbiomac.2024.137649. [Google Scholar] [PubMed] [CrossRef]
14. Zhou J, Wang B, Xu C, Xu Y, Tan H, Zhang X, et al. Performance of composite materials by wood fiber/polydopamine/silver modified PLA and the antibacterial property. J Mater Res Technol. 2022;18:428–38. doi:10.1016/j.jmrt.2022.02.113. [Google Scholar] [CrossRef]
15. Frasca S, Katsiotis CS, Henrik-Klemens Å, Larsson A, Strømme M, Lindh J, et al. Compatibility of kraft lignin and phenol-organosolv lignin with PLA in 3D printing and assessment of mechanical recycling. ACS Appl Polym Mater. 2024;6(22):13574–84. doi:10.1021/acsapm.4c02208. [Google Scholar] [CrossRef]
16. Volpe V, De Feo G, De Marco I, Pantani R. Use of sunflower seed fried oil as an ecofriendly plasticizer for starch and application of this thermoplastic starch as a filler for PLA. Ind Crops Prod. 2018;122:545–52. doi:10.1016/j.indcrop.2018.06.014. [Google Scholar] [CrossRef]
17. El-Araby A, Janati W, Ullah R, Ercisli S, Errachidi F. Chitosan, chitosan derivatives, and chitosan-based nanocomposites: eco-friendly materials for advanced applications (a review). Front Chem. 2023;11:1327426. doi:10.3389/fchem.2023.1327426. [Google Scholar] [PubMed] [CrossRef]
18. Elsawy MA, Saad GR, Sayed AM. Mechanical, thermal, and dielectric properties of poly(lactic acid)/chitosan nanocomposites. Polym Eng Sci. 2016;56(9):987–94. [Google Scholar]
19. Shang H, Xu K, Li X, Lu S, Ke L, Yang H-R, et al. UV-protective and high-transparency poly(lactic acid) biocomposites for ecofriendly packaging of perishable fruits. Int J Biol Macromol. 2022;222:927–37. doi:10.1016/j.ijbiomac.2022.09.219. [Google Scholar] [PubMed] [CrossRef]
20. Sun M, Wang J, Kang J, Zhao Y, Tian H, Jin Y, et al. Bimodal structure in electrospun Zein/PLA-chitosan films with enhanced filtration efficiency and low pressure drop. Colloids Surf A Physicochem Eng Asp. 2025;711:136380. doi:10.1016/j.colsurfa.2025.136380. [Google Scholar] [CrossRef]
21. Shang J, Abdurexit A, Jamal R, Abdiryim T, Liu X, Liu F, et al. Waste cotton stalks enhancing the impact and crystallization performances of polylactic acid/polypropylene composite with PP-g-mah compatibilizer. Compos Sci Technol. 2024;249(8–9):110485. doi:10.1016/j.compscitech.2024.110485. [Google Scholar] [CrossRef]
22. Torres-Huerta A, Del Angel D, Domínguez-Crespo MA, Palma Ramírez D, Perales-Castro M, Flores-Vela A. Morphological and mechanical properties dependence of PLA amount in PET matrix processed by single-screw extrusion. Polym Plast Technol Eng. 2016;55(7):672–83. doi:10.1080/03602559.2015.1132433. [Google Scholar] [CrossRef]
23. Ye J, Wang S, Lan W, Qin W, Liu Y. Preparation and properties of polylactic acid-tea polyphenol-chitosan composite membranes. Int J Biol Macromol. 2018;117:632–9. doi:10.1016/j.ijbiomac.2018.05.080. [Google Scholar] [PubMed] [CrossRef]
24. Petit T, Puskar L. FTIR spectroscopy of nanodiamonds: methods and interpretation. Diam Relat Mater. 2018;89(N62):52–66. doi:10.1016/j.diamond.2018.08.005. [Google Scholar] [CrossRef]
25. Vasile C, Stoleru E, Darie-Niţa RN, Dumitriu RP, Pamfil D, Tarţau L. Biocompatible materials based on plasticized poly(lactic acidChitosan and rosemary ethanolic extract I. Effect of chitosan on the properties of plasticized poly(lactic acid) materials. Polymers. 2019;11:941. [Google Scholar] [PubMed]
26. Mohamad SNK, Ramli I, Abdullah LC, Mohamed NH, Islam MS, Ibrahim NA, et al. Evaluation on structural properties and performances of graphene oxide incorporated into chitosan/poly-lactic acid composites: CS/PLA versus CS/PLA-GO. Polymers. 2021;13(11):1839. [Google Scholar] [PubMed]
27. Chen X, Zhang R, Mao Y, Zhong L, Lin P, Deng Q, et al. Development of a toughened and antibacterial poly(lactide acid) (PLA) with preserved strength by elemental sulfur-based bio-renewable dynamically crosslinked elastomers. Chem Eng J. 2023;467:143419. doi:10.1016/j.cej.2023.143419. [Google Scholar] [CrossRef]
28. Chen P, Liang X, Xu Y, Zhou Y, Nie W. Enhanced thermal and mechanical properties of PLA/MoS2 nanocomposites synthesized via the in-situ ring-opening polymerization. Appl Surf Sci. 2018;440:1143–9. doi:10.1016/j.apsusc.2018.01.260. [Google Scholar] [CrossRef]
29. Chinh NT, Trang NTT, Thanh DTM, Hang TTX, Giang NV, Quan PM, et al. Thermal property, morphology, and hydrolysis ability of poly(lactic acid)/chitosan nanocomposites using polyethylene oxide. J Appl Polym Sci. 2015;132(12):41690. [Google Scholar]
30. Yu D, Yang Q, Zhou X, Guo H, Li D, Li H, et al. Structure and properties of polylactic acid/butenediol vinyl alcohol copolymer blend fibers. Int J Biol Macromol. 2023;232:123396. doi:10.1016/j.ijbiomac.2023.123396. [Google Scholar] [PubMed] [CrossRef]
31. Xue B, Bao J, Zhang J. Ultrafine fly ash as a reinforcing filler in poly(lactic acid) matrix. J Appl Polym Sci. 2016;133(30):43716. [Google Scholar]
32. Huang J, Fan J, Cao L, Xu C, Chen Y. A novel strategy to construct co-continuous PLA/NBR thermoplastic vulcanizates: metal-ligand coordination-induced dynamic vulcanization, balanced stiffness-toughness and shape memory effect. Chem Eng J. 2020;385:123828. doi:10.1016/j.cej.2019.123828. [Google Scholar] [CrossRef]
33. Bhasney SM, Bhagabati P, Kumar A, Katiyar V. Morphology and crystalline characteristics of polylactic acid [PLA]/linear low density polyethylene [LLDPE]/microcrystalline cellulose [MCC] fiber composite. Compos Sci Technol. 2019;171(5):54–61. doi:10.1016/j.compscitech.2018.11.028. [Google Scholar] [CrossRef]
34. Zhao X, Copenhaver K, Wang L, Korey M, Gardner DJ, Li K, et al. Recycling of natural fiber composites: challenges and opportunities. Resourc Conservat Recycl. 2022;177(6):105962. doi:10.1016/j.resconrec.2021.105962. [Google Scholar] [CrossRef]
35. Tee YB, Talib RA, Abdan K, Chin NL, Basha RK, Yunos KFM. Thermally grafting aminosilane onto kenaf-derived cellulose and its influence on the thermal properties of poly(lactic acid) composites. BioResources. 2013;8(3):4468–83. doi:10.1177/096739111702500110. [Google Scholar] [CrossRef]
36. Di Y, Iannace S, Di Maio E, Nicolais L. Reactively modified poly(lactic acidproperties and foam processing. Macromol Mater Eng. 2005;290(11):1083–90. doi:10.1002/mame.200500115. [Google Scholar] [CrossRef]
37. Georgousopoulou I-N, Vouyiouka S, Dole P, Papaspyrides CD. Thermo-mechanical degradation and stabilization of poly(butylene succinate). Polym Degrad Stab. 2016;128(1):182–92. doi:10.1016/j.polymdegradstab.2016.03.012. [Google Scholar] [CrossRef]
38. Kurzina IA, Laput OA, Zuza DA, Vasenina IV, Salvadori MC, Savkin KP, et al. Surface property modification of biocompatible material based on polylactic acid by ion implantation. Surf Coat Technol. 2020;388(3):125529. doi:10.1016/j.surfcoat.2020.125529. [Google Scholar] [CrossRef]
39. Zhang X, Zhang Y. Reinforcement effect of poly(butylene succinate) (PBS)-grafted cellulose nanocrystal on toughened PBS/polylactic acid blends. Carbohydr Polym. 2016;140:374–82. doi:10.1016/j.carbpol.2015.12.073. [Google Scholar] [PubMed] [CrossRef]
40. Andrzejewski J, Krawczak A, Wesoły K, Szostak M. Rotational molding of biocomposites with addition of buckwheat husk filler. Structure-property correlation assessment for materials based on polyethylene (PE) and poly(lactic acid) PLA. Compos Part B Eng. 2020;202:108410. doi:10.1016/j.compositesb.2020.108410. [Google Scholar] [CrossRef]
41. Alikarami N, Abrisham M, Huang X, Panahi-Sarmad M, Zhang K, Dong K, et al. Compatibilization of PLA grafted maleic anhydrate through blending of thermoplastic starch (TPS) and nanoclay nanocomposites for the reduction of gas permeability. Int J Smart Nano Mater. 2022;13(1):130–51. doi:10.1080/19475411.2022.2051639. [Google Scholar] [CrossRef]
42. Yeo JCC, Muiruri JK, Tan BH, Thitsartarn W, Kong J, Zhang X, et al. Biodegradable PHB-Rubber copolymer toughened PLA green composites with ultrahigh extensibility. ACS Sustain Chem Eng. 2018;6(11):15517–27. doi:10.1021/acssuschemeng.8b03978. [Google Scholar] [CrossRef]
43. Luo S, Cao J, McDonald AG. Interfacial improvements in a green biopolymer alloy of poly(3-hydroxybutyrate-co-3-hydroxyvalerate) and lignin via in situ reactive extrusion. ACS Sustain Chem Eng. 2016;4(6):3465–76. doi:10.1021/acssuschemeng.6b00495. [Google Scholar] [CrossRef]
44. Wan Y, Wu H, Yu A, Wen D. Biodegradable polylactide/chitosan blend membranes. Biomacromolecules. 2006;7(4):1362–72. doi:10.1021/bm0600825. [Google Scholar] [PubMed] [CrossRef]
45. Zuo Y, Chen K, Li P, He X, Li W, Wu Y. Effect of nano-SiO2 on the compatibility interface and properties of polylactic acid-grafted-bamboo fiber/polylactic acid composite. Int J Biol Macromol. 2020;157(1):177–86. doi:10.1016/j.ijbiomac.2020.04.205. [Google Scholar] [PubMed] [CrossRef]
46. Wu G, Song Y, Zheng Q, Du M, Zhang P. Dynamic rheological properties for HDPE/CB composite melts. J Appl Polym Sci. 2003;88(9):2160–7. doi:10.1002/app.11859. [Google Scholar] [CrossRef]
47. Râpă M, Miteluţ AC, Tănase EE, Grosu E, Popescu P, Popa ME, et al. Influence of chitosan on mechanical, thermal, barrier and antimicrobial properties of PLA-biocomposites for food packaging. Compos Part B Eng. 2016;102:112–21. doi:10.1016/j.compositesb.2016.07.016. [Google Scholar] [CrossRef]
Cite This Article
 Copyright © 2025 The Author(s). Published by Tech Science Press.
This work is licensed under a Creative Commons Attribution 4.0 International License , which permits unrestricted use, distribution, and reproduction in any medium, provided the original work is properly cited.
 Downloads
 Citation Tools