
 Login
Login Register
 Submit a Paper
 Propose a Special lssue
 Open Access
ARTICLE
Oil Palm Empty Fruit Bunch-Derived Nanocellulose Boosts Methylene Blue Removal in CuO-Based Photocatalysts
1 Department of Materials and Metallurgical Engineering, Institut Teknologi Sepuluh Nopember, Surabaya, Indonesia
2 Department of Physics, Institut Teknologi Sepuluh Nopember, Surabaya, Indonesia
3 Nuclear Structure Research Group, RIKEN Nishina Center, 2-1 Hirosawa, Wako, Saitama, Japan
* Corresponding Authors: Haniffudin Nurdiansah. Email: ; Retno Asih. Email:
(This article belongs to the Special Issue: Nanocellulose for Sustainable Material Applications: Emerging Biodegradable Materials and Nanocomposites)
Journal of Renewable Materials 2026, 14(9), 2 https://doi.org/10.32604/jrm.2026.02026-0031
Received 26 February 2026; Accepted 28 May 2026; Issue published 23 September 2026
 View Full Text
 Download PDF
Abstract
A synergistic effect of adsorption and photocatalysis provides a key role ensuring high degradation efficiency. In this study, nanocellulose (nC) derived from oil palm empty fruit bunch (OPEFB) via delignification followed by acid hydrolysis was combined with CuO for methylene blue (MB) removal through a two-stage process: adsorption followed by photocatalysis. The nC content varied at 5%, 15%, and 25% by mass. Structural analyses revealed successful extraction of nC from OPEFB, with particle sizes of 260–310 nm, a surface area of 2.3 m2/g, and a pore diameter of 9.5 nm. The incorporation of nC improves CuO dispersion and stability while maintaining visible-light-responsive bandgap characteristics, resulting in a significant increase in MB removal from 43.6% (pure CuO) to 99.7% (CuO/nC 25%) within 60 min under UV irradiation. The nC contributes to rapid MB adsorption in the initial stage (0–15 min), followed by enhanced photocatalytic degradation in the later stage (15–60 min). This study highlights the potential of enhancing the adsorption and photocatalytic activities of CuO/nC composites for facile and efficient MB removal.Keywords
The textile industry is considered one of the most polluting industries in the world due to its high consumption of water, energy, and dyes, as well as its generation of solid waste and harmful byproduct [1,2]. Every year, approximately 280,000 metric tons of textile dyes are released into wastewater globally [3]. According to Indonesia’s Central Bureau of Statistics, in 2021, 10,683 villages/sub-districts experienced water pollution, with approximately 20% of this pollution caused by activities in the textile sector [4]. One of the most concerning liquid pollutants from textile processing is MB, a synthetic dye that is toxic, carcinogenic, and non-biodegradable [5]. Textile industries frequently discharge large volumes of MB directly into water bodies, resulting in destructive effects of ecosystems and posing serious health risks to humans [6]. Moreover, MB contamination can hinder sunlight penetration in aquatic environments, inhibiting photosynthesis and disrupting aquatic ecosystems [5,6].
To mitigate the environmental impacts of dye-containing wastewater, appropriate treatment prior to discharge is essential. Among various methods, photocatalytic degradation has emerged as one of the most efficient and widely studied approaches for removing MB because of its effectiveness and environmental compatibility [5]. Photocatalysis involves the light-induced acceleration of chemical reactions using photocatalyst materials, typically semiconductors, which absorb photons to produce reactive species without being consumed in the process [7]. Semiconductor nanoparticle-based photocatalysts are particularly attractive due to their low cost, eco-friendliness, and ease of use [8,9].
Copper (II) oxide (CuO), a p-type semiconductor with a narrow band gap of 1.2–2.0 eV [10], exhibits visible-light-driven photocatalytic activity. Its small band gap allows rapid excitation of electrons from the valence to the conduction band, thereby enabling the efficient generation of oxygen species, such as hydroxyl (OH−) and superoxide (O2−) radicals, which are essential for the breakdown of dye molecules [11,12]. However, CuO also presents challenges in practical applications, particularly regarding catalyst recovery and separation after treatment [13]. Conventional techniques such as filtration, centrifugation, and coagulation are energy-intensive and may not be sustainable at scale [14].
One promising strategy to overcome the limitations of CuO photocatalysts, particularly their tendency to agglomerate and their difficult recovery after treatment, is the formation of heterostructure composites by combining CuO with support materials that improve dispersion, stability, and photocatalytic performance [15]. Although its specific surface area is moderate, nC provides abundant hydroxyl (-OH) groups that facilitate strong interactions with CuO, improving nanoparticle dispersion and stability [16]. The nC has been reported to exhibit good adsorption capacity toward organic dyes due to its polar surface and functional groups, which enhances dye-catalyst interaction, whereas its hydrophilicity and optical transparency contribute to better light absorption and scattering [17]. Additionally, nC aids in charge separation and interfacial electron transfer, thereby enhancing the formation of reactive oxygen species during photocatalysis [18]. Previous studies have demonstrated the potential of cellulose-based composites in dye removal systems, including bacterial cellulose/g-C3N4/polydopamine and CuO/cellulose-based materials, which showed high degradation efficiencies for MB [19] and crystal violet [20,21], respectively. However, reports on CuO/nC composites specifically for MB degradation remain limited. Therefore, this study introduces a CuO/nC composite derived from OPEFB, aiming to exploit the synergistic effects of adsorption and photocatalysis.
Indonesia generates significant amounts of agricultural waste, particularly OPEFB, with annual production reaching tens of millions on tons [22]. OPEFB accounts for approximately 20%–25% of fresh fruit bunch weight. This biomass contains up to 46.5% cellulose, making it a promising precursor for nanocellulose production [23]. The use of OPEFB-derived nC in CuO/nC composites not only enhances photocatalytic performance but also supports circular bioeconomy principles by converting low-value waste into functional materials for environmental remediation, in line with sustainable development goal (SDGs), particularly SDGs 6 (clean water) and 12 (responsible consumption and production). Building on this potential, this study investigates the green synthesis and characterization of CuO/nC composites using OPEFB-derived nC, with varying nC content to evaluate its effect on MB removal.
The synthesis process comprised three steps: (i) preparing microcellulose from OPEFB through delignification and bleaching, (ii) synthesizing nanocellulose from microcellulose via acid hydrolysis, and (iii) preparing CuO/nC composites. An illustration of the material synthesis is shown in Fig. 1.
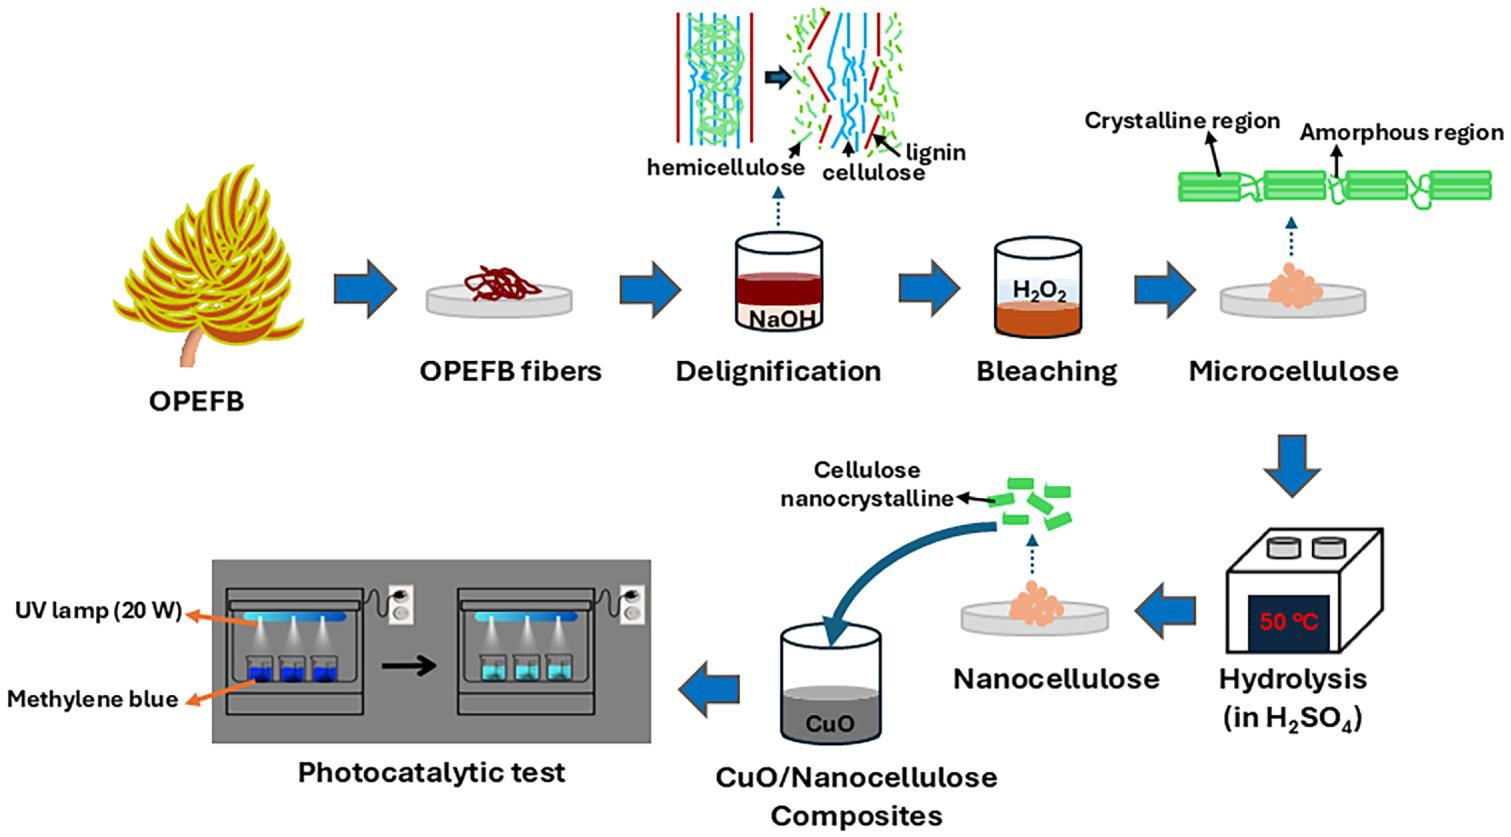
Figure 1: Illustration of synthesis procedures of CuO/nC composites from OPEFB.
OPEFB powders were prepared from OPEFB fibers using a grinder and sieved with a 200-mesh sieve. The process continued with delignification using 17.5% (w/v) NaOH (SAP Chemicals, >98%) at a solid-to-liquid ratio of 1:10. The solution was stirred at 80°C for 30 min, then cooled to room temperature, washed using distilled water, and dried at 110°C for 20 h. The delignified sample was then bleached using 10% (v/v) H2O2 (SAP Chemicals, 30%) at a solid-to-liquid ratio of 1:10. The solution was stirred at 80°C for 90 min until it turned yellowish. It was then cool, washed with distilled water until neutral (pH = 7), and dried at 110°C for 20 h.
Nanocellulose was synthesized via acid hydrolysis of microcellulose using 30% (v/v) H2SO4 (SAP Chemicals, >98%) in a water bath at 50°C for 45 min. The process was followed by neutralization and centrifugation at 4000 rpm for 30 min. The solution was then freeze-dried at −53°C for 24 h to obtain nC in a form of cellulose nanocrystal (CNC).
To prepare CuO/nC composites, CuO (Merck, 98%) was dissolved into 30 mL of distilled water and stirred for 10 min. nC was added to the CuO solution and sonicated for 1 h. The nC content varied at 5%, 15%, and 25%, and the corresponding samples were designated as CuO/nC 5%, CuO/nC 15%, and CuO/nC 25%, respectively. The solution was subsequently stirred for 30 min and dried at 110°C for 6 h.
2.2 Material Characterizations and Photocatalytic Tests
X-ray diffraction (XRD, PANAnalytical, CuKα, λ = 1.54056 Å) was used to analyze peak position differences and identify crystalline phases from the diffraction patterns. The functional groups, elemental composition, and morphology of the samples were examined using Fourier transform infrared (FTIR, Nicolet iS10), energy dispersive X-ray (EDX), scanning electron microscopy (SEM, INSPECT S50), and transmission electron microscopy (TEM, JEM-2100Plus JEOL), respectively. Additional characterizations included Brunauer-Emmett-Teller (BET) analysis to determine the specific surface area and pore diameter of nC, particle size analyzer (PSA) measurements to evaluate nC size distribution, and zeta potential analysis to assess the stability of composite.
For photocatalytic tests, MB (C.I. 52015, Merck) solutions with concentrations of 2, 4, 6, 8, and 10 ppm were prepared to generate MB standard curves using UV-Vis spectroscopy (Thermo Scientific, Genesys 150). CuO and CuO/nC composites (0.2 g each) were added to 100 mL of 10 ppm MB solution and stirred in the dark box for 30 min to establish adsorption-desorption equilibrium between the dye and the catalyst. Subsequently, the suspension was irradiated under a 20-W UV lamp to initiate the photocatalytic reaction. Solution samples were collected every 15 min for up to 60 min. The initial MB concentration of 10 ppm was selected as a controlled condition commonly used in preliminary studies for fundamental assessment [24–26]. Under dilute conditions, diffusion is relatively fast, allowing the reaction to better reflect surface reaction kinetics [27,28]. The samples were then analyzed using UV-Vis spectroscopy to determine the maximum absorbance value of the MB solution after degradation.
3.1 Structural Analysis of OPEFB-Derived Nanocellulose
The XRD patterns of OPEFB, microcellulose (mC), and nC are shown in Fig. 2a. These patterns align with JCPDS-ICCD:50-2241 [29], exhibiting characteristic peaks of cellulose Iβ at 18° and 22.7° and cellulose II at 16° and 21.7°. The (200) and (020) peaks at 22.7° and 21.7°, respectively, correspond to a crystalline structure, whereas the peaks at 16° and 18° indicate an amorphous region. The crystallinity index (CI) of each sample was calculated using the Segal method [30], as expressed in Eq. (1).
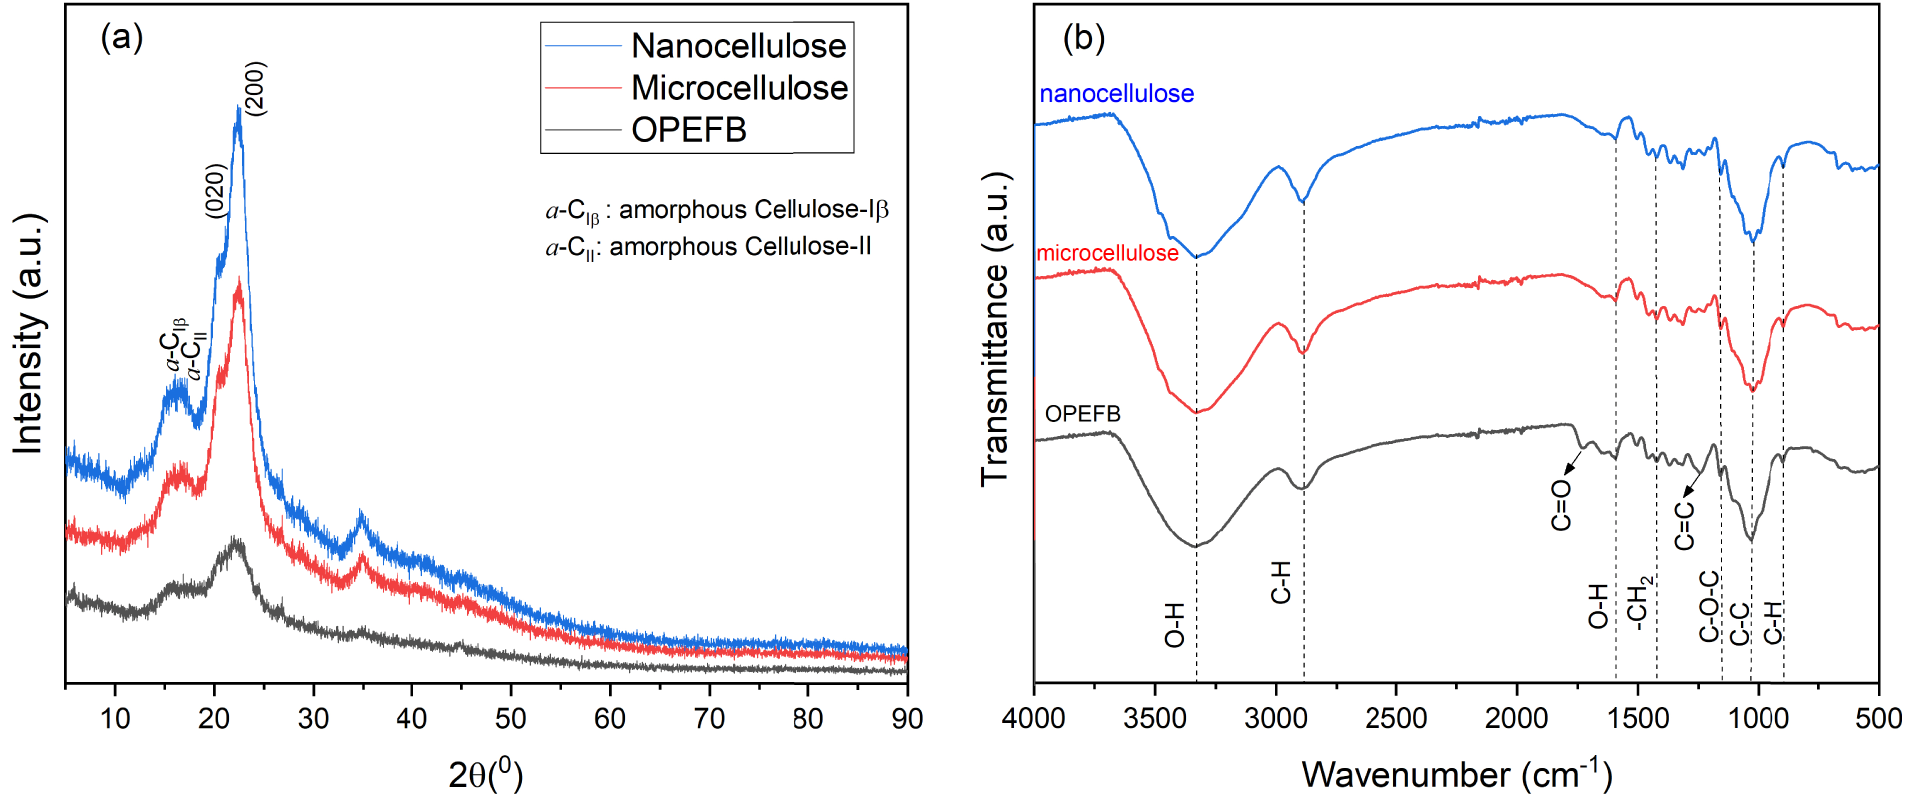
Figure 2: (a) XRD patterns and (b) FTIR spectra of OPEFB, microcellulose, and nanocellulose.
Ic and Ia represent the total intensities of the crystalline and amorphous peaks, respectively. The CI increases in the order of OPEFB, mC, and nC, with estimated values of 32%, 58%, and 64%, respectively. OPEFB primarily consists of three main components: lignin, hemicellulose, and cellulose. Lignin and hemicellulose are amorphous polymers, whereas cellulose can exist in both amorphous and crystalline forms [31]. The increased CI in mC compared to OPEFB is due to the synthesis process, which involves 17.5% NaOH for delignification and 10% H2O2 for bleaching. The NaOH solution breaks the ether bonds (R-OR′) that link lignin and cellulose and removes acetyl groups and uronic acids [32]. During the bleaching process with H2O2, oxygen atoms react by binding to the carbon elements in the benzene ring of lignin. This reaction causes the release of previous bonds, reducing the lignin content and decreasing its size [33]. Among the other samples, nC exhibits the highest CI because its synthesis involves acid hydrolysis using 30% H2SO4. During hydrolysis, the strong acid selectively attacks the amorphous regions while leaving the crystalline regions intact due to their high resistance [34].
Fig. 2b displays FTIR spectra of OPEFB, mC, and nC. The functional groups exclusive to OPEFB appeared at 1725.90 and 1243.09 cm−1. The peak in the range of 1550–1870 cm−1 corresponds to C=O stretching, which is associated with hemicellulose and lignin [35,36]. Meanwhile, the peak at 1243.09 cm−1 represents a C=C (aromatic ring) functional group, a characteristic component of lignin [37]. The absence of C=O and C=C functional groups in mC and nC is attributed to the delignification and bleaching processes involved in their synthesis. These processes are designed to remove lignin and hemicellulose; primarily through dissolution and the de-esterification of intermolecular ester bonds [38]. A previous study by [39] reported that the C=C functional group present in OPEFB disappears after bleaching. Additionally, a C-O-C functional group was observed at 1158 cm−1, indicating the presence of a pyranose ring in cellulose [40]. The C-H stretching functional group within the 690–900 cm−1 range corresponds to glucose, which forms glycosidic bonds in cellulose [41]. The FTIR analysis confirms that after delignification and bleaching, lignin and hemicellulose are effectively removed, resulting in the production of pure cellulose.
The surface morphology transformation of OPEFB into mC and nC, as observed via SEM, is presented in Fig. 3. OPEFB exhibits a relatively smooth surface without visible pores. The presence of irregular waxy substances, lignin, and other inorganic materials coats the OPEFB fiber surface, giving it a smoother appearance [42]. The resulting mC has a rougher surface, with exposed fibers due to the removal of waxy substances and lignin through interactions with sodium ions during delignification process [43]. Additionally, the fibers appear to be agglomerated, likely because of Van der Waals attraction forces. However, this agglomeration is significantly reduced in nC after acid hydrolysis, resulting in a more dispersed and porous structure. These findings confirm the removal of non-cellulosic components and the progressive structural refinement of OPEFB fibers, facilitating the transition from raw fiber to mC and ultimately to nC. Furthermore, EDX analysis estimates the atomic percentages (at%) of carbon (C) and oxygen (O) in nC to be approximately 54 at% and 46 at%, respectively.
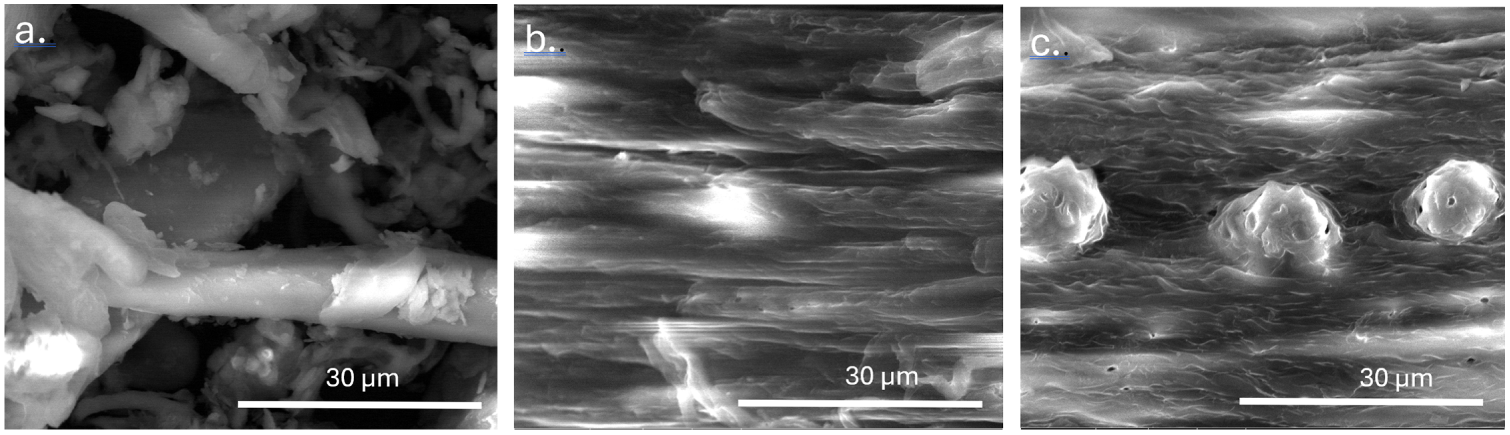
Figure 3: Surface morphologies of (a) OPEFB, (b) microcellulose, and (c) nanocellulose.
The surface area of the resulting nC, as determined using the BET method, was approximately 2.3 m2/g, similar to the value previously reported by [44]. The relatively low surface area is likely due to the morphology of nC, which consists of coarse fiber-shaped structures. Fig. 4a shows the adsorption-desorption isotherm curve for nanocellulose, which corresponds to a type-IV isotherm according to the IUPAC classification. Type-IV isotherms are characteristic of mesoporous materials with pore sizes ranging from 2 to 50 nm [45]. The presence of hysteresis in the curve indicates a difference between the adsorption and desorption rates, further confirming the mesoporous nature of the nC. The pore size of nC was ~9.6 nm. PSA analysis confirmed that nC has particle sizes ranging from 200 to 400 nm. These values fall within the typical size range of nC as reported in [46]. The nC particles predominantly ranged in size from 260 to 310 nm, as illustrated in the size distribution (Fig. 4b).
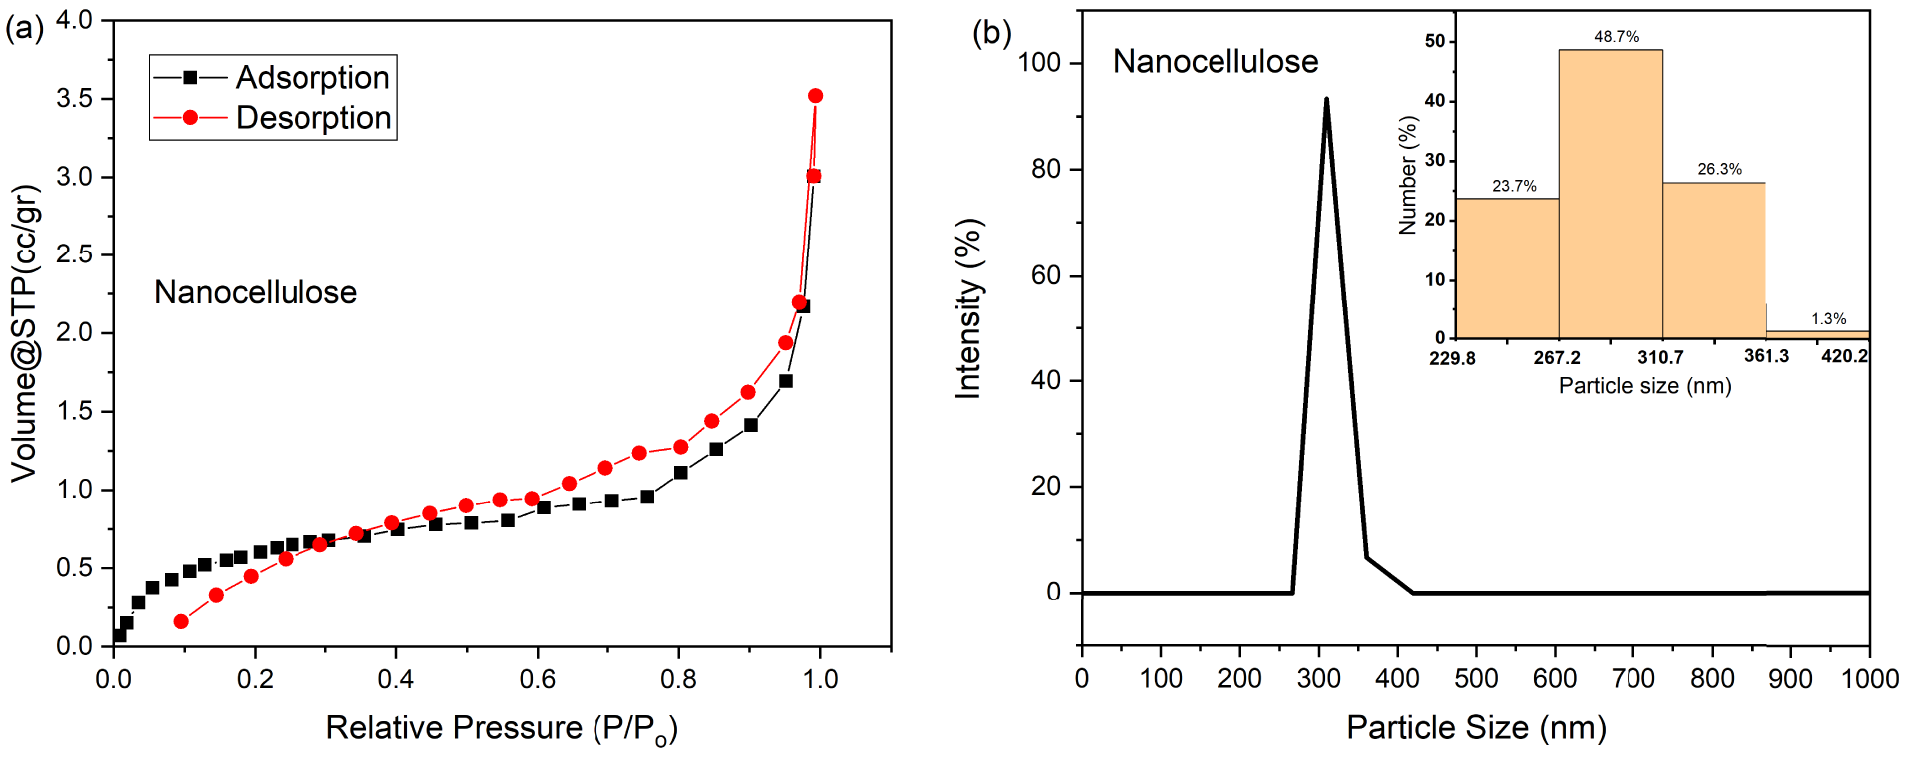
Figure 4: (a) Adsorption–desorption isotherm curve of nanocellulose. (b) Particle size distribution of nanocellulose analyzed using PSA.
3.2 Structural, Morphology, and Stability Analysis of CuO/nC Composites
Fig. 5a shows the XRD patterns of the CuO/nC composites, indicating the presence of CuO peaks corresponding to the JCPDS card No. 01-080-1268 [47], for a monoclinic structure. When nC is added, a different peak appears at 22.5° and becomes more significant with increasing nC content. The absence of any secondary phases indicates the successful formation of the CuO/nC composites. The crystallite size of CuO, estimated using the Scherrer equation from the (110) peak at 2θ = 35.5°, gradually decreases with increasing nC content. CuO and CuO/nC (5%, 15%, and 25%) exhibits crystallize sizes of ~34, ~29, ~25, and ~23 nm, respectively, indicating that the carbon matrix suppresses crystal growth and enhances nanoparticle dispersion.
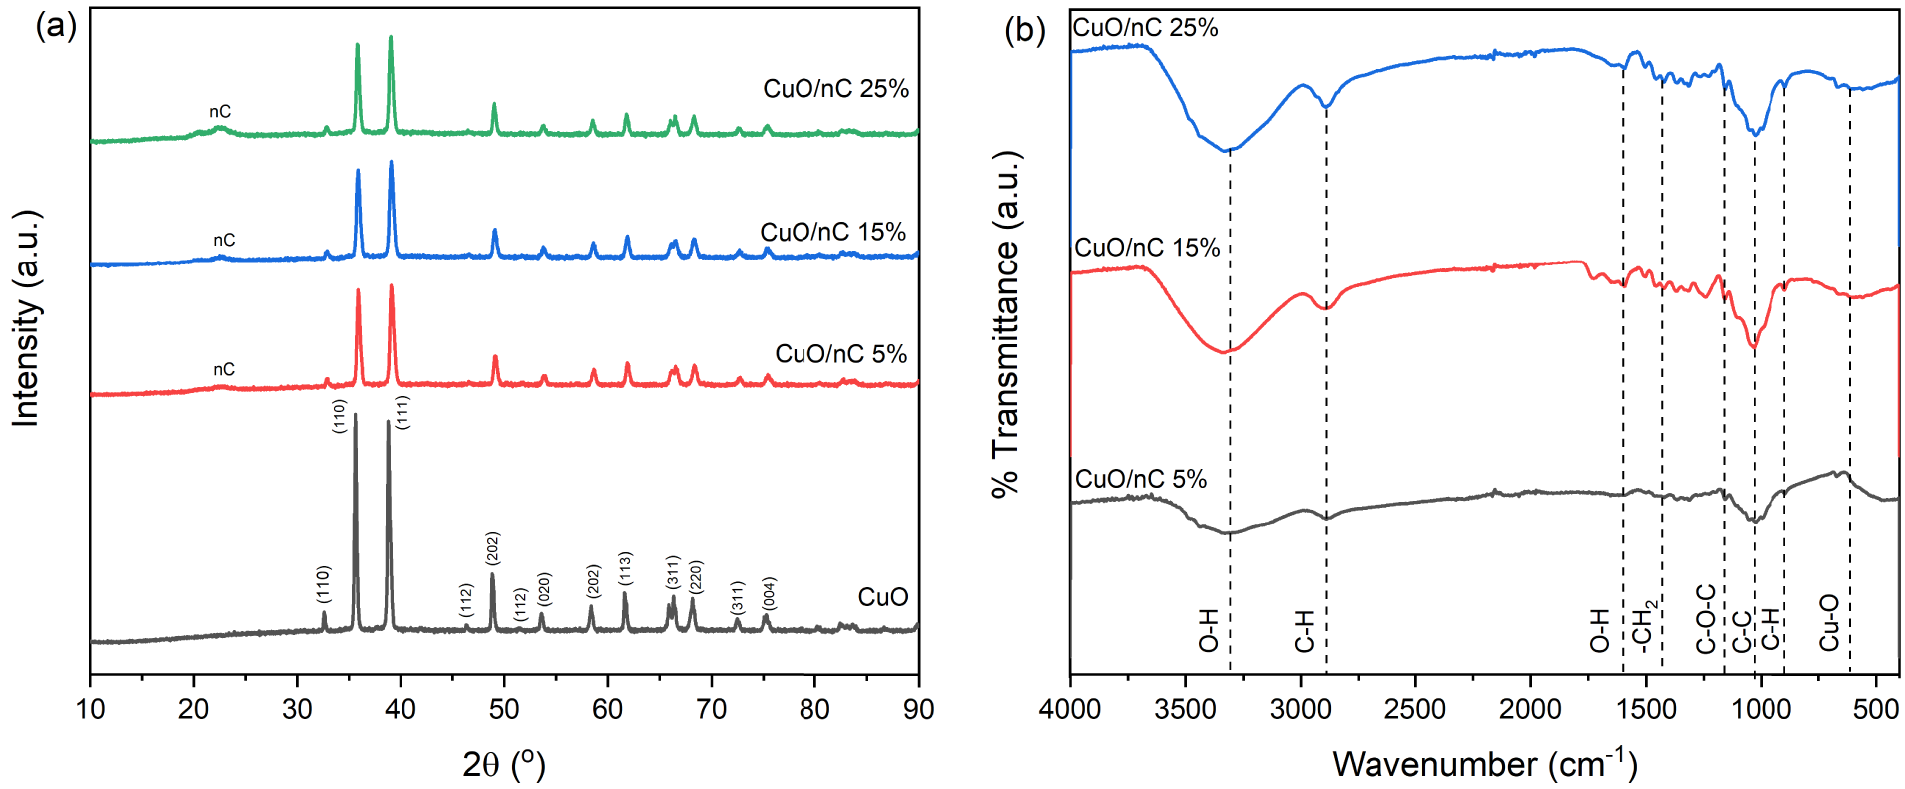
Figure 5: (a) XRD patterns of CuO and CuO/nC composites with varied nC contents. (b) FTIR spectra of the composites.
The FTIR spectra of the composites (Fig. 5b) display characteristic bonds of both nC and Cu-O stretching vibrations at ~513 and ~622 cm−1 [48]. The nC-related functional groups, including broad -OH stretching, C-H, and C-O-C linkages, are consistent with those observed in Fig. 2b, indicating that the cellulose structure is preserved after composite formation. No new covalent bond signatures are detected, suggesting that the interaction between CuO and nC is primarily electrostatic in nature [49]. These interactions promote strong interfacial adhesion within the CuO/nC composites [50].
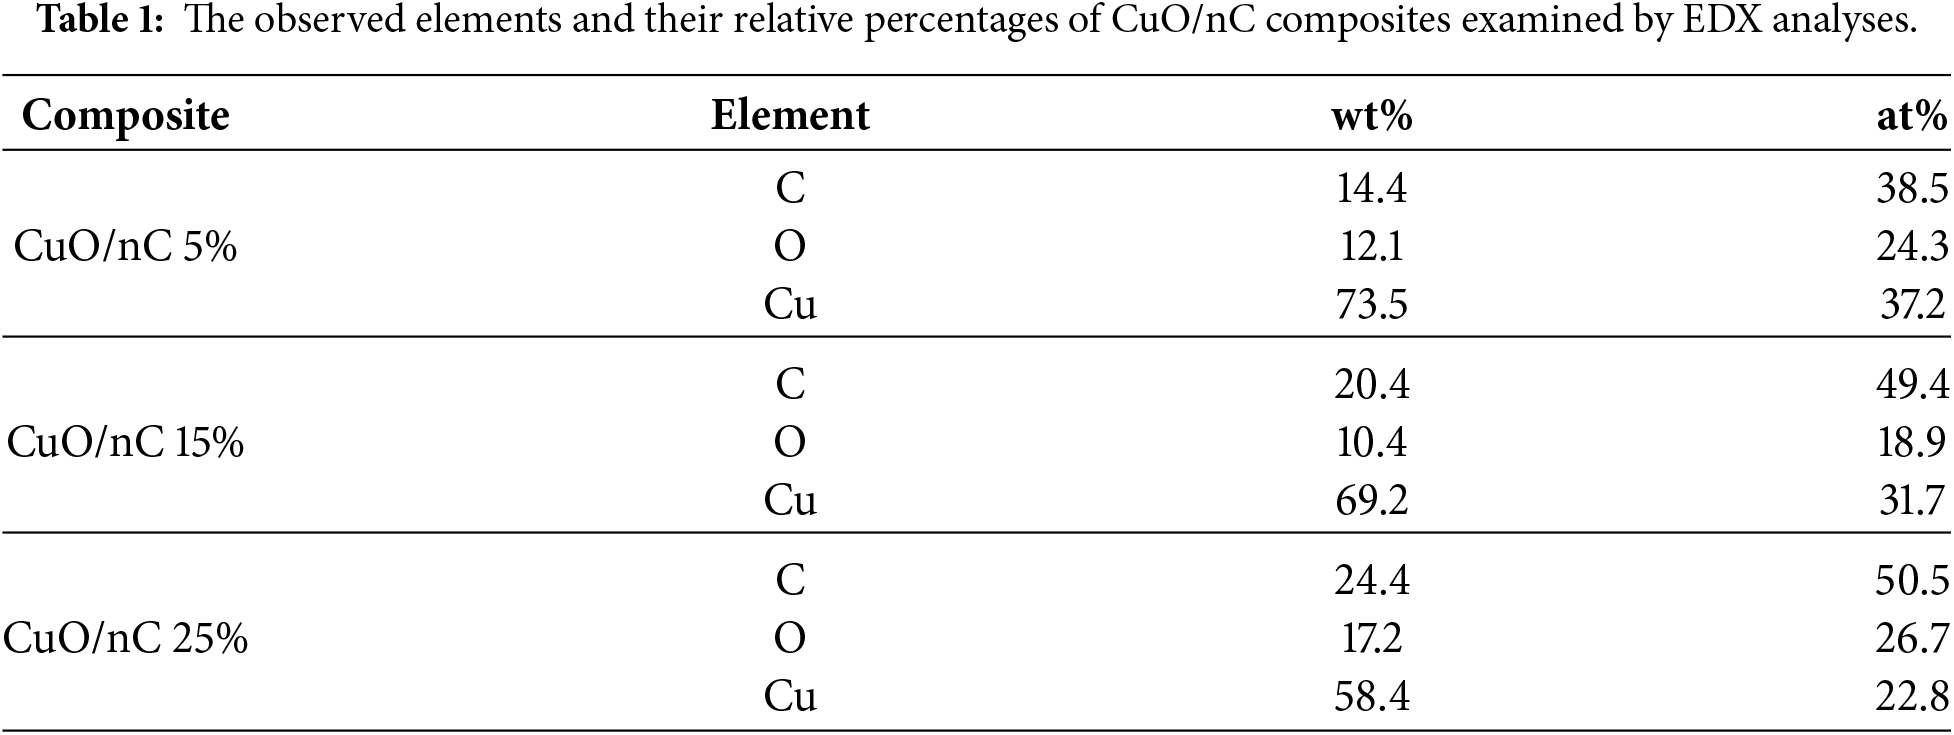
SEM images of the composites are shown in Fig. 6, revealing agglomerated quasi-spherical particles alongside layered fibrous structures. The former corresponds to CuO particles, as reported in a previous study [51], whereas the latter indicates the presence of nC. At low nC content, CuO particles dominate and appear densely agglomerated with limited fibrous features. With increasing nC loading, fibrous structures become more evident, indicating improved dispersion of CuO particles within the nC matrix and confirming the nC role in enhancing particle distribution. EDX analysis estimated the atomic percentages (at%) of Cu and O in CuO to be 78.6% and 21.4%, respectively. In the CuO/nC composites, an additional EDX peak corresponding to carbon (C) was observed. The at% of C increased with the amount of nC added, confirming the successful incorporation and increased presence of nC within the composites. In contrast, the variation in O content likely arises from the combined contributions of CuO and nC, as well as differences in dispersion and surface coverage. A summary of the EDX analysis for the composites is presented in Table 1.
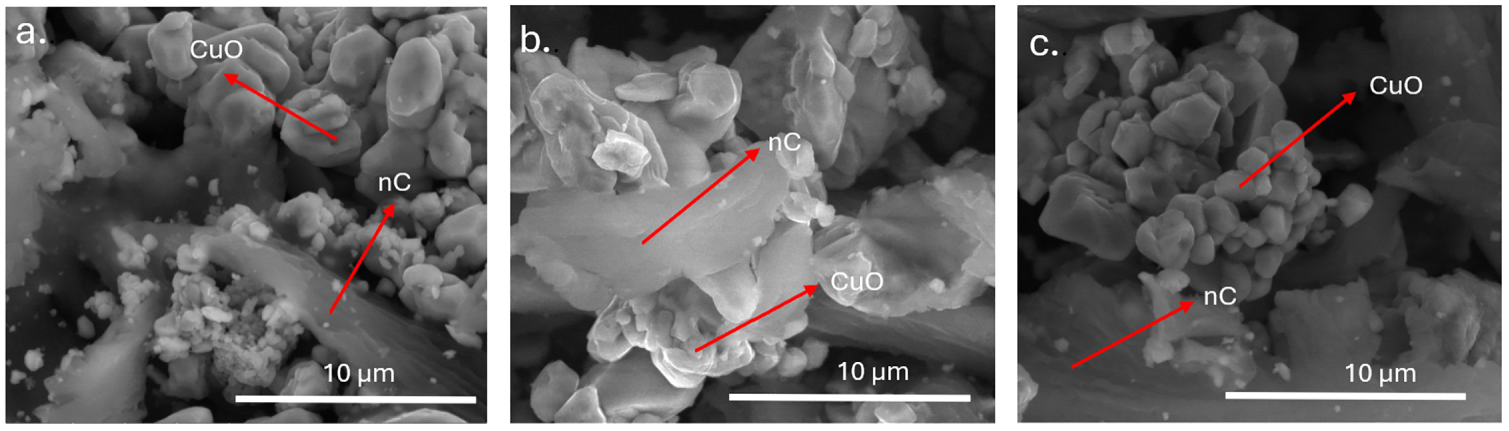
Figure 6: SEM images of the composites: (a) CuO/nC 5%, (b) CuO/nC 15%, and (c) CuO/nC 25%.
TEM analysis was performed to elucidate nanoscale morphology, particle distribution, and dispersion of CuO within the nC, as shown at Fig. 7a–c. The contrast difference between electron-dense CuO and the low-density nC is clearly observed. TEM images show that CuO nanoparticles appear as dark, electron-dense agglomerates due to the higher atomic number of Cu, while the nC is observed as a lighter, low-contrast background. CuO particles are distributed on the nC surface, although partial agglomeration is evident (Fig. 7b,c), indicating that nC acts as a supporting material for CuO dispersion.
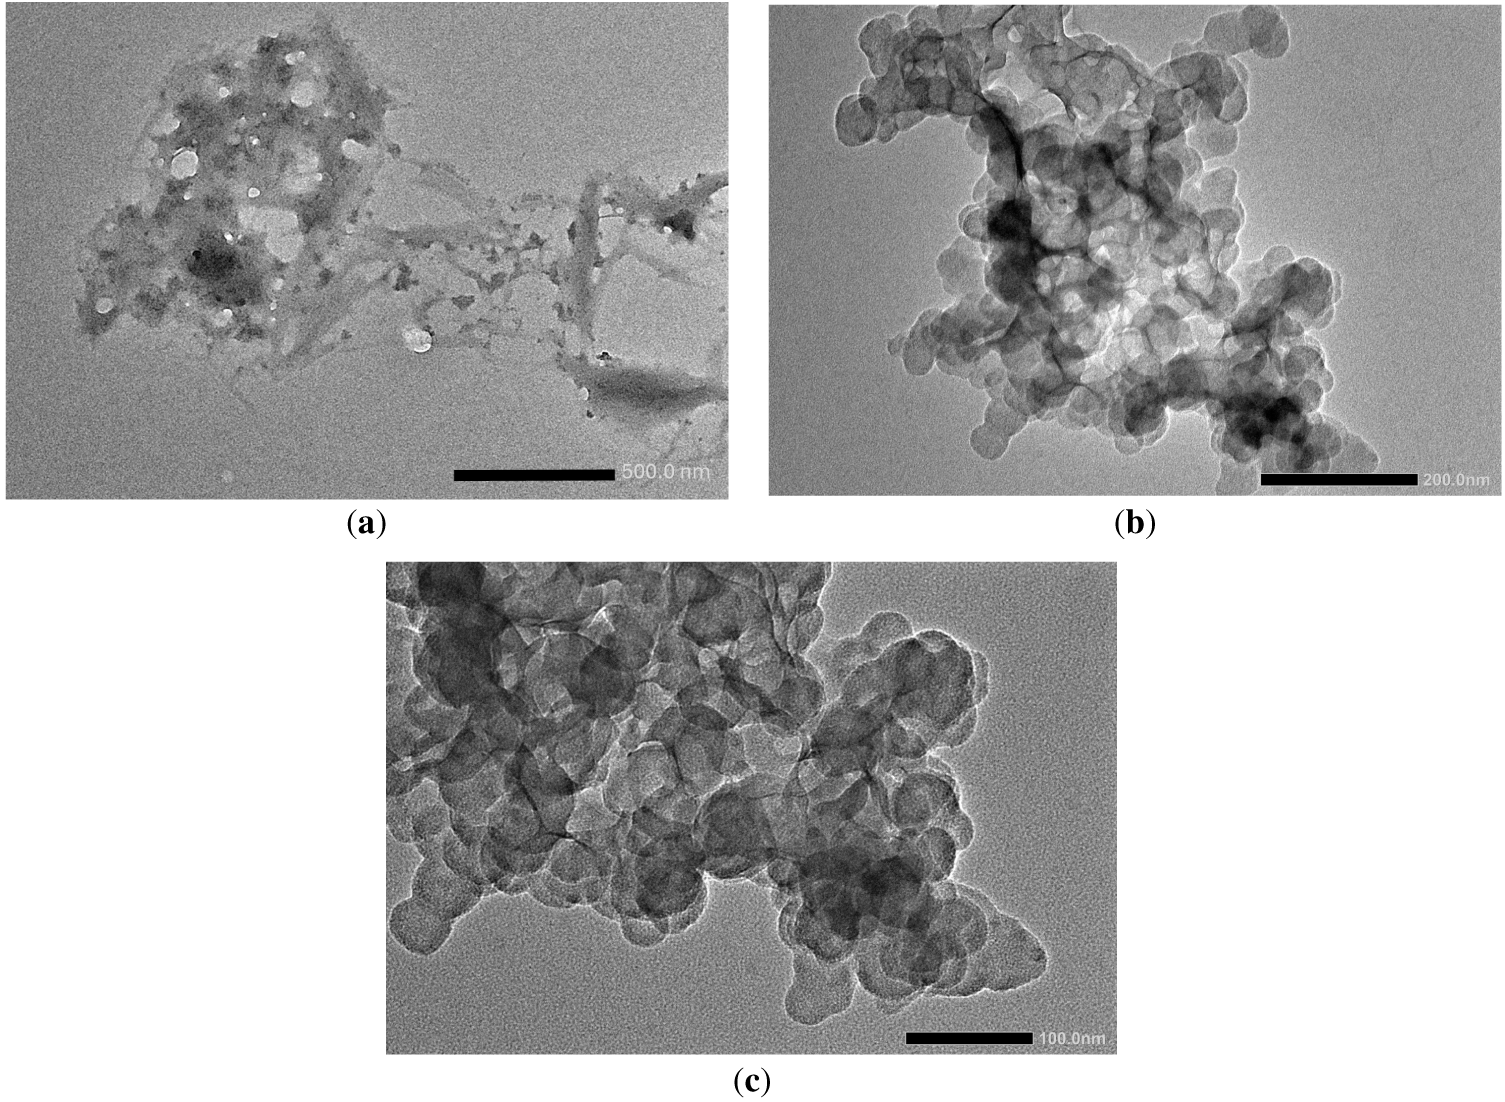
Figure 7: TEM images of the CuO/nC 25% at different magnifications, showing: (a) transparent low-density region of nC and a darker high-density of CuO particles. Closed views (b, c) clearly show agglomerated CuO particles mixed with nC.
To evaluate the stability of CuO and CuO/nC 25% as photocatalyst, the zeta potential test conducted using water as medium at pH 7. The results clearly indicate an improvement in colloidal stability after incorporation of nC into CuO. The pure CuO exhibits a zeta potential of −8.01 mV (Fig. 8), which lies in the range of incipient instability, meaning that the electrostatic repulsion between particles is weak and aggregation is highly likely, as reported [52]. This is consistent with typical behavior of metal oxide particles in aqueous media, where insufficient surface charge leads to rapid coagulation [53]. In contrast, the CuO/nC 25% composite shows a significantly more negative zeta potential of −20.34 mV, indicating enhanced surface charge and stronger electrostatic repulsion among particles. Although this value still falls within the moderate stability regime which is generally from ±20 to ±30 mV [54], it represents a substantial shift toward improved dispersion stability compared to pure CuO.
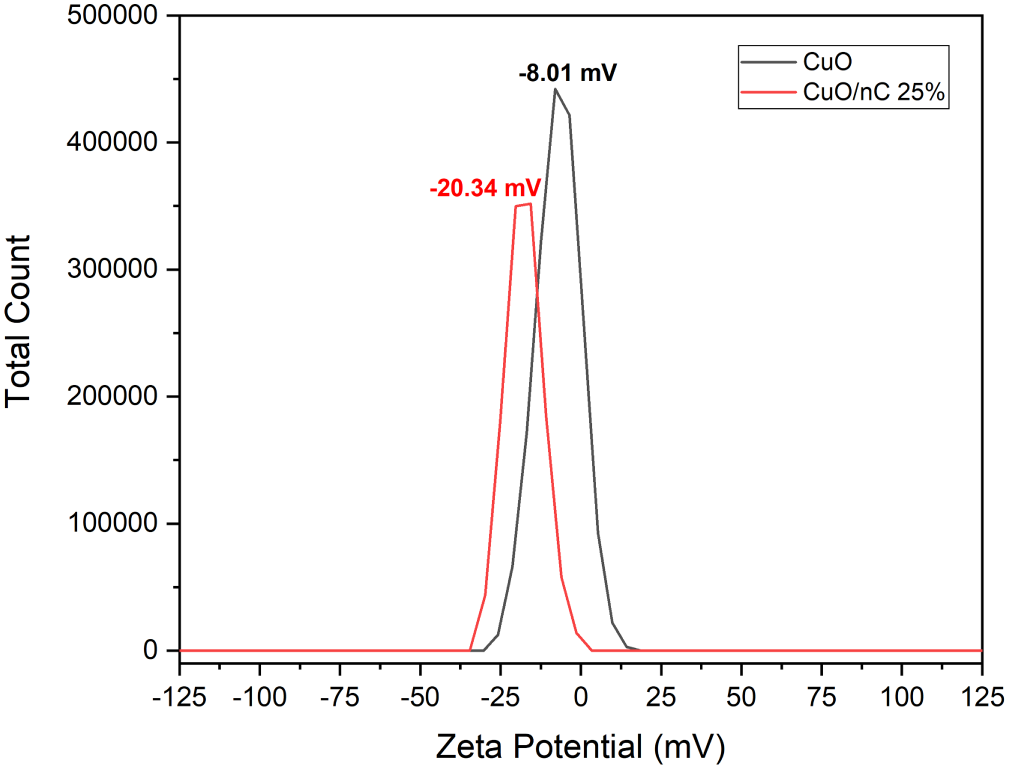
Figure 8: Zeta potential of pure CuO and CuO/nC 25%.
3.3 Two Stages (Adsorption-Photocatalytic) Performance of Methylene Blue Removal
Fig. 9 shows the optical bandgap values obtained from the Tauc plot analysis [55]. Pure CuO (Fig. 9a) exhibits a bandgap of 1.30 eV, consistent with the reported values and confirming its visible-light photocatalytic activity [56,57]. In contrast, nC (Fig. 9b) shows a wide bandgap of 3.85 eV, indicating its insulating nature with absorption mainly in the UV region [58]. This suggests that nC supports roles in dispersion and dye adsorption rather than direct photoexcitation [59,60]. The CuO/nC composites shows intermediate bandgaps of 2.75, 2.86, and 2.99 eV for 5%, 15%, and 25% nC, respectively. This increase compared to pure CuO indicates that nC modifies the electronic structure through improved dispersion, reduced crystallite size, and interfacial interactions. Despite their wider bandgap, the composites remain active under visible light, with the modified electronic structure likely suppressing electron-hole recombination.
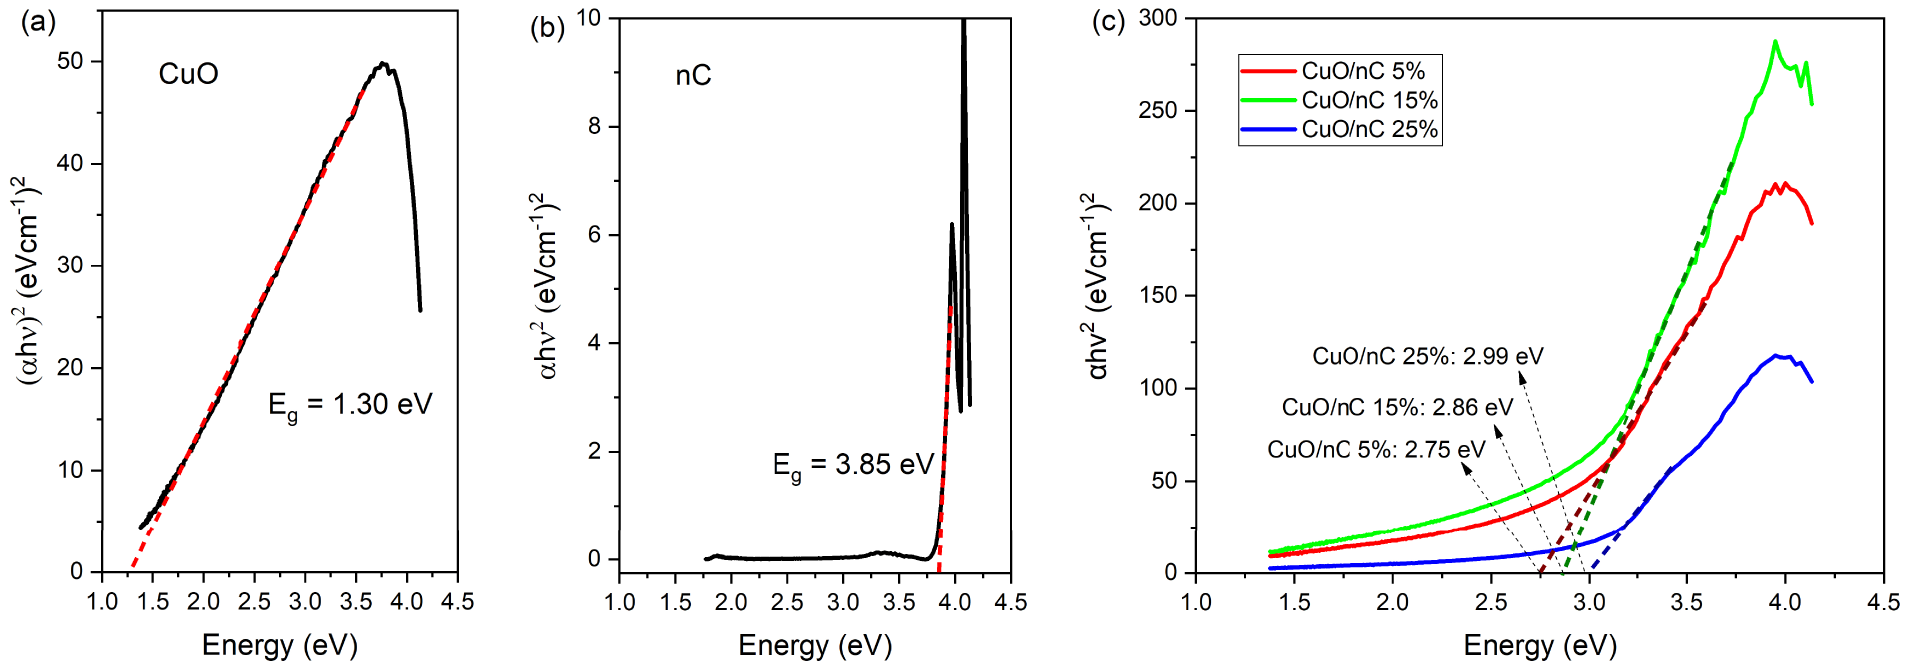
Figure 9: Tauc plot and optical bandgap estimation for (a) pure CuO, (b) nC, and (c) the composites.
Fig. 10a shows the change in maximum absorbance with irradiation time for CuO and CuO/nC composites. All samples exhibit a gradual decrease in absorbance, indicating progressive dye removal, with more pronounced decline observed as the nC content increases. The corresponding MB concentration (Fig. 10b) was calculated from the absorbance from the MB standard curve. During the initial stage (0–15 min), a significant decrease in MB concentration was observed. The MB concentration in pure CuO decreased from 10 to ~5.64 ppm, whereas CuO/nC 5%, 15%, and 25% decreased to ~2.99, ~1.71, and ~0.69 ppm, respectively. This rapid decrease in the early stage indicates that adsorption dominates the removal process, which becomes more significant with increasing nC content due to enhanced surface interaction and adsorption sites. In the subsequent irradiation stage (15–60 min), the decrease in absorbance and MB concentration became slower and more linear. Pure CuO showed limited degradation, with the MB concentration decreasing from ~5.64 to ~4.36 ppm after 60 min. In contrast, CuO/nC 5%, 15%, and 25% reduced MB to ~2.75, ~0.98, and ~0.025 ppm, respectively, with the CuO/nC 25% exhibiting the best performance. These results suggest the role of nC not only as an adsorbent but also as an electron transfer mediator that suppresses electron-hole recombination in CuO, as reported in [61].
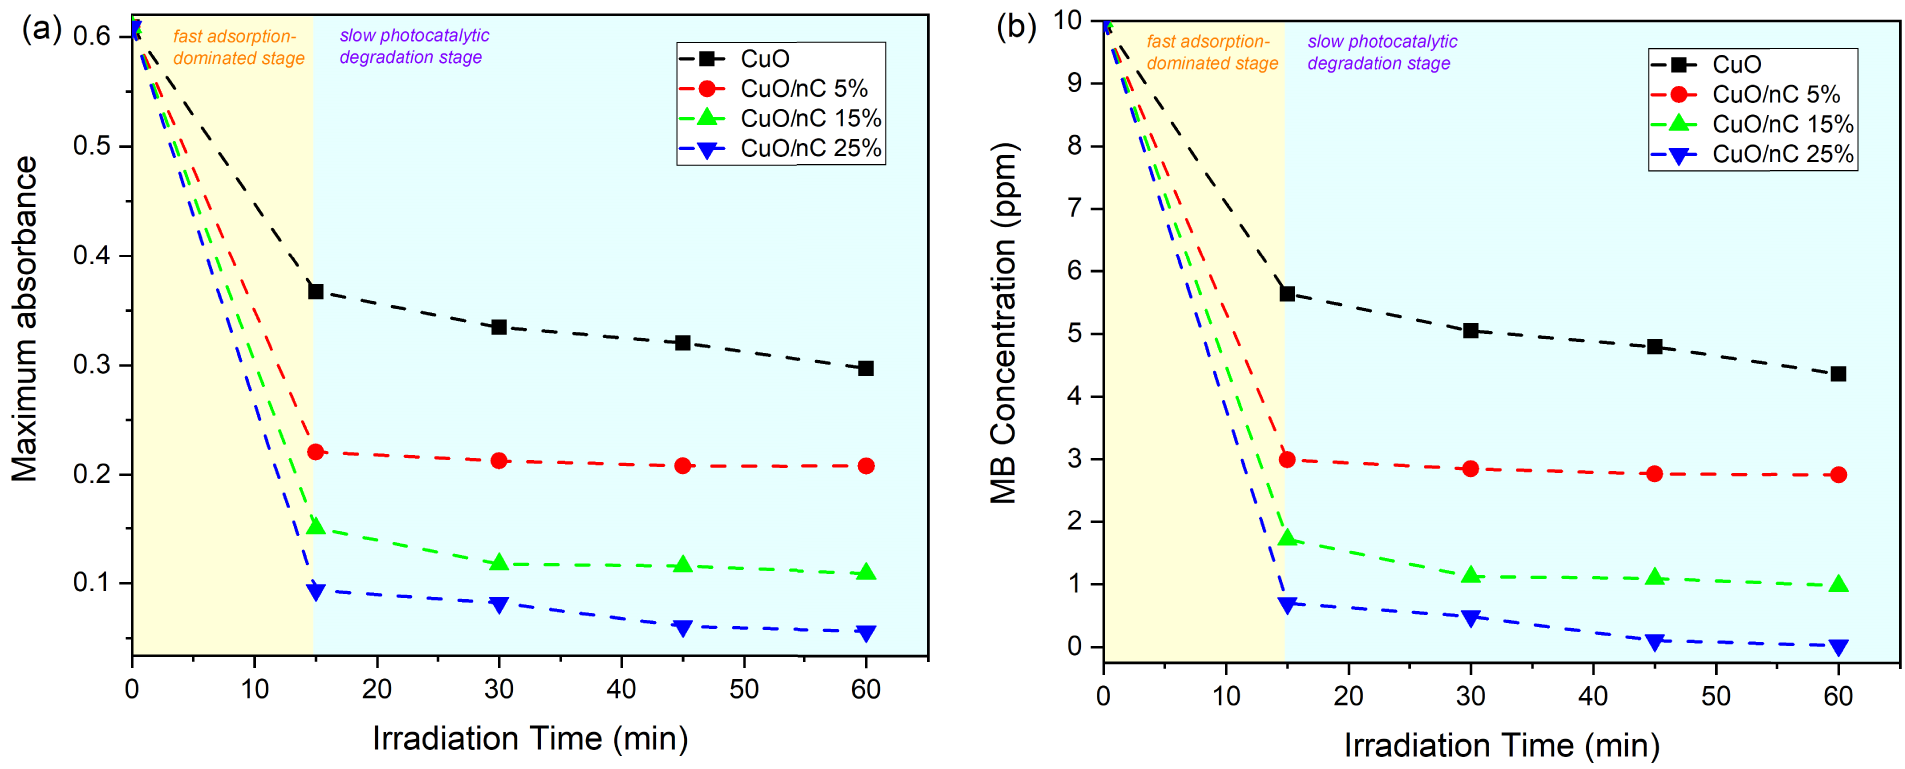
Figure 10: (a) Relationship between the maximum absorbance and (b) MB concentration with irradiation time.
Fig. 11 shows the variation in the normalized concentration (Ct/C0) and MB removal efficiency with irradiation time. In the initial stage (0–15 min), all samples exhibit a rapid decrease in the Ct/C0, indicating adsorption-dominated removal. Pure CuO decreases from 1.0 to ~0.56, while CuO/nC 5%, 15%, and 25% drop more significantly to ~0.29, ~0.17, and ~0.07, respectively, highlighting the strong influence of nC in enhancing early-stage removal through improved adsorption and interfacial interaction. In the subsequent stage (15–60 min), the decrease in the Ct/C0 becomes more gradual, indicating that this process was primarily controlled by photocatalytic degradation. Pure CuO shows limited activity (Ct/C0 ~0.43 at 60 min), whereas the composites achieve much lower values of ~0.27, ~0.09, and ~0.0025 for 5%, 15%, and 25% nC, respectively, with CuO/nC 25% approaching a complete removal.
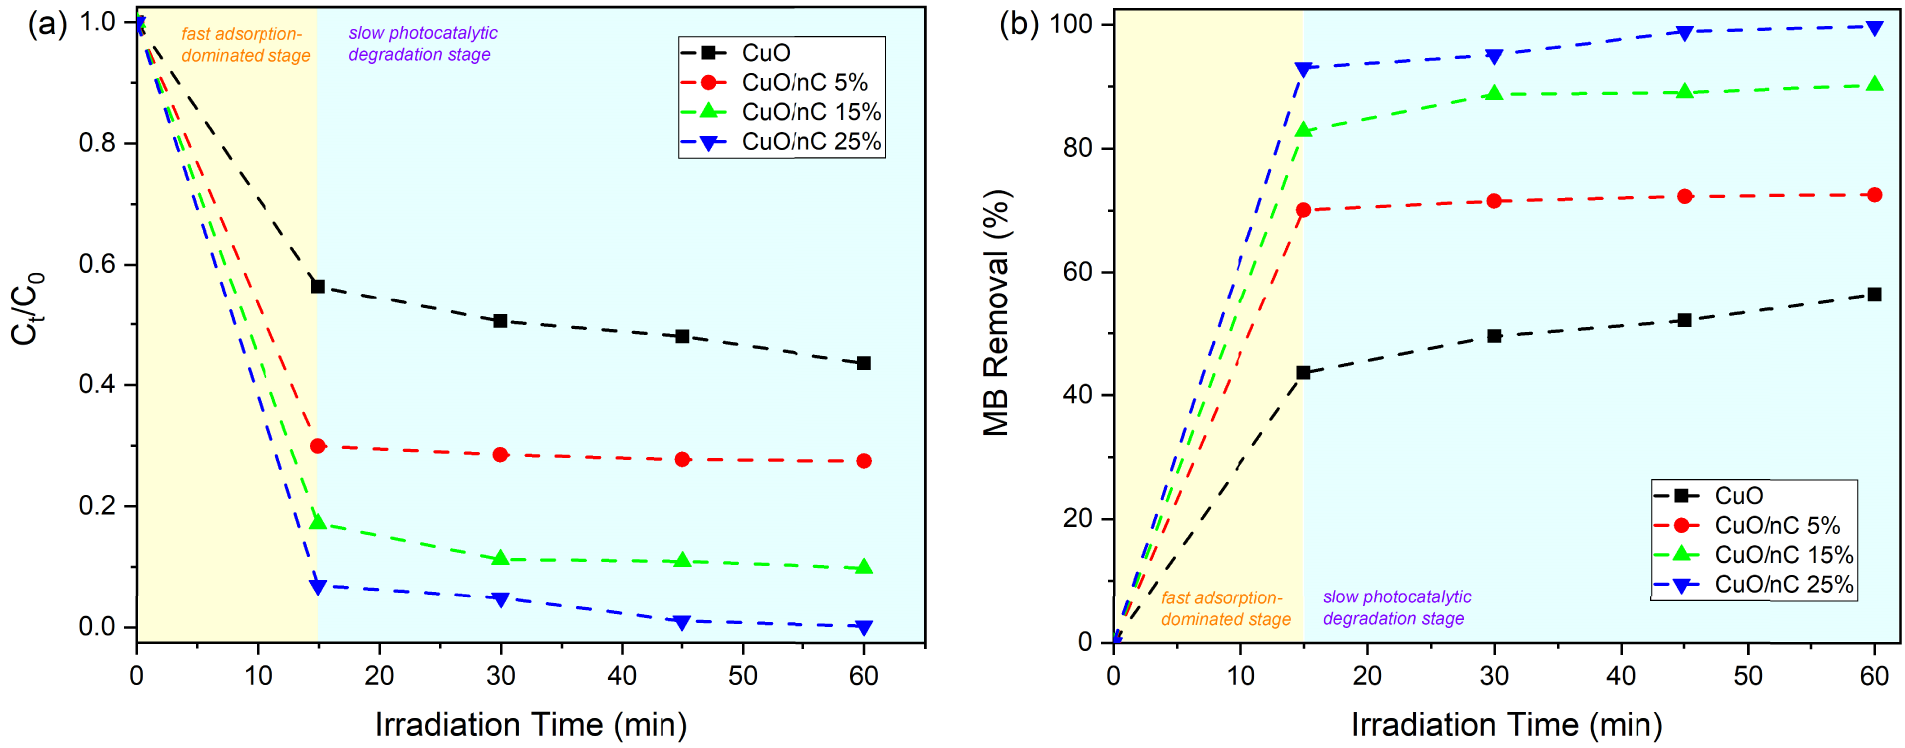
Figure 11: Relationship between (a) the normalized concentration, Ct/C0 and (b) the relative percentage of MB removal with irradiation time.
The MB removal efficiency (Fig. 11b) follows a similar two-stage trend. After 15 min of irradiation, CuO achieves only 43.6% removal, while CuO/nC 5%, 15%, and 25% reach ~70.1%, ~82.8%, and ~93.0%, respectively, indicating rapid adsorption enhanced by nC. With extended light exposure up to 60 min, CuO shows limited improvement (up to ~56.4%), and CuO/nC 5% reaches a plateau (~72.5%). In contrast, CuO/nC 15% and 25% continue to increase, reaching ~90.2% and ~99.7%, respectively. This trend confirms the synergistic role of nC in providing adsorption sites and facilitating electron transfer, thereby suppressing electron-hole recombination [61]. Overall, increasing nC content significantly enhances both rate and extent of MB removal, with CuO/nC 25% demonstrating the best photocatalytic performance.
Fig. 12 shows the UV-Vis absorbance spectra of MB, illustrating both the effect of nC content after 60 min irradiation and the time evolution for the most active composites. In the left panel, all samples exhibit a decrease in the characteristic MB peak at 664–668 nm, confirming dye removal. Pure CuO retains the highest absorbance, indicating incomplete removal, while the intensity decreases progressively with increasing nC content. This trend is consistent with the visual color change from deep blue to nearly colorless. In the right panel, the CuO/nC 25% sample shows a sharp drop in absorbance within the first 15 min, followed by a slower decrease up to 60 min. The rapid initial decline indicates adsorption-dominated removal, while the subsequent gradual decrease reflects ongoing photocatalytic degradation. The unchanges spectral shape suggests true degradation rather than peak shifting.
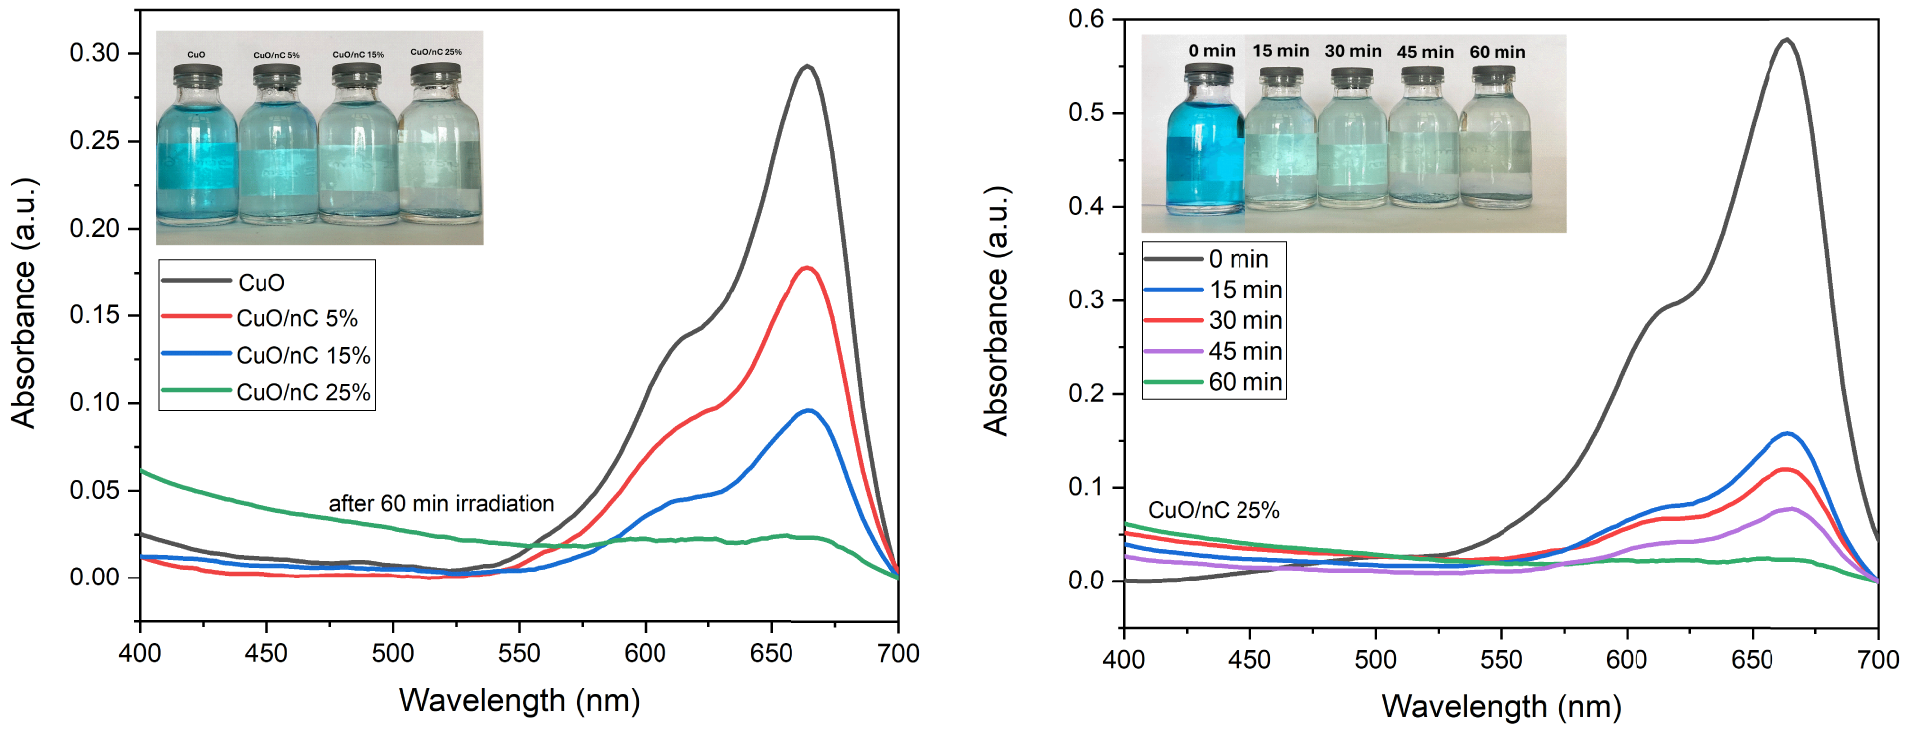
Figure 12: Absorbance curves of all samples after 60 min of irradiation (left) and absorbance curve for CuO/nC 25% with variation in irradiation time (right).
The initial stage (0–15 min) of MB removal is dominated by rapid adsorption of MB molecules at the nC-CuO interface, leading to a sharp decrease in concentration that deviates from conventional kinetic models and becomes more pronounced with increasing nC loading. In the second stage (15–60 min), the process is governed by photocatalytic degradation, which follows a pseudo-first-order kinetic model based on the Langmuir-Hinshelwood mechanism [62]. At this stage, CuO absorbs light, and charge separation (enhanced by nC) drives the degradation of adsorbed MB. Excluding the initial adsorption stage, the kinetic data show good agreement with the pseudo-first-order model (Fig. 13), with correlation coefficients (R2) of 0.803–0.983. This supports a two-step mechanism consisting of rapid adsorption followed by photocatalytic surface reactions.
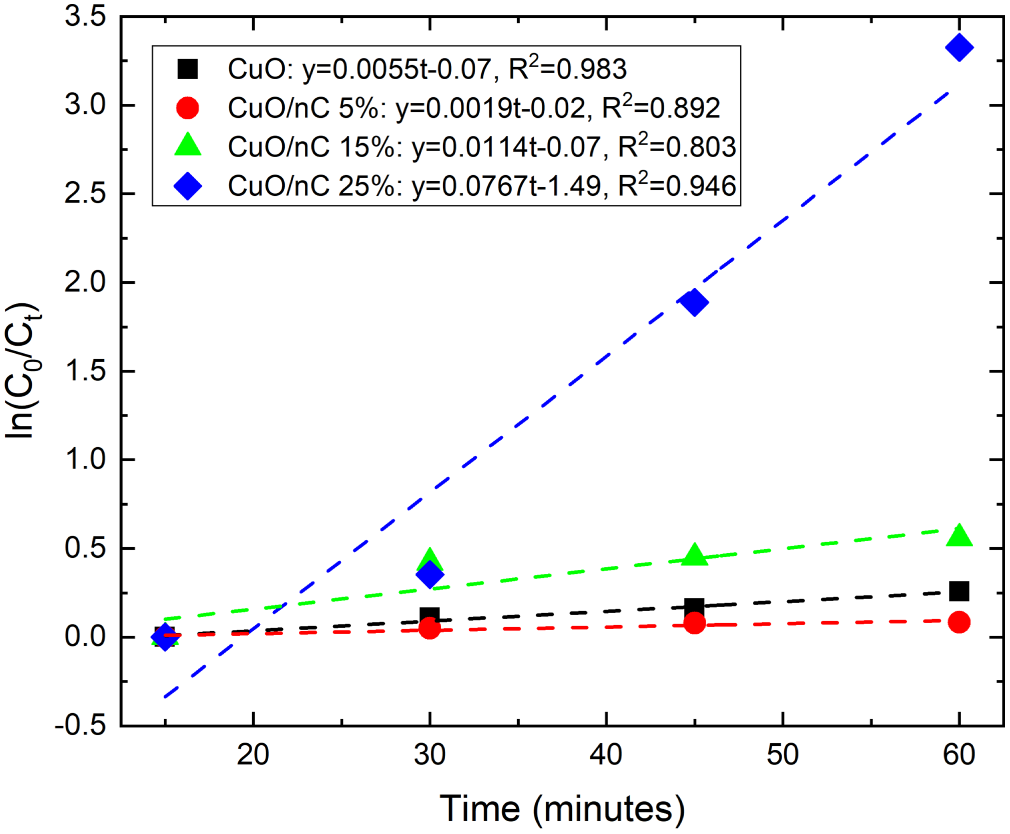
Figure 13: Pseudo-first-order kinetic plots for all samples.
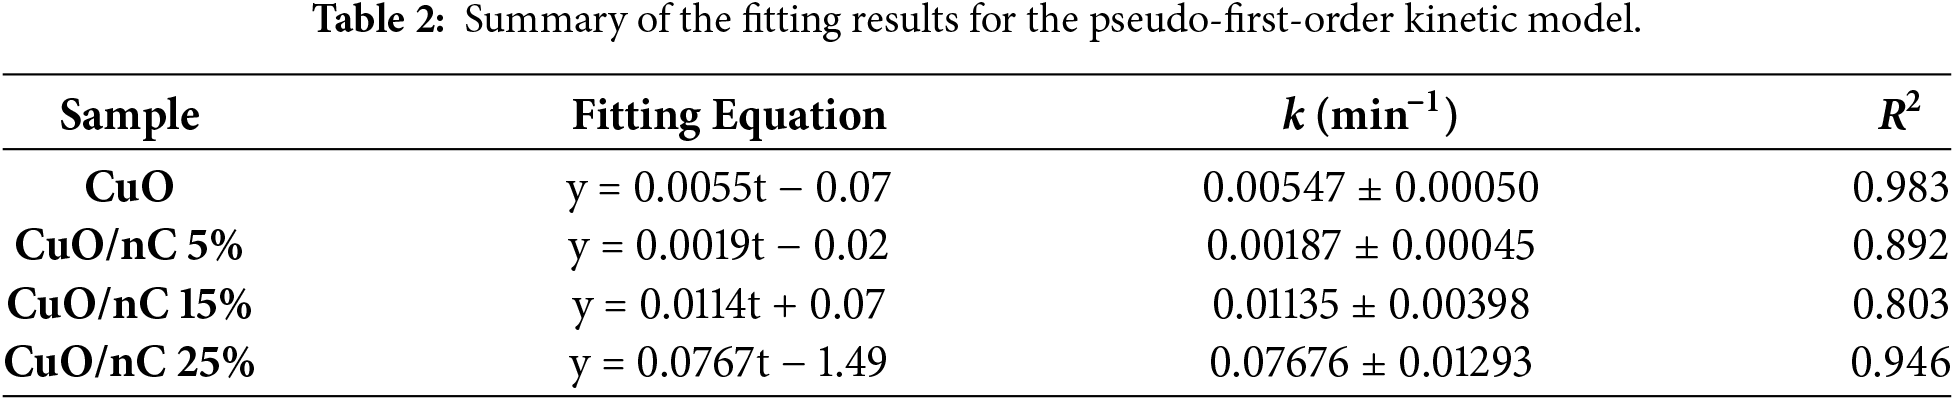
The slope of the linear graph of ln(C0/Ct) vs. irradiation time directly corresponds to the apparent pseudo-first-order rate constant (k) [63]. This constant represents the intrinsic rate of the photocatalytic degradation after the initial adsorption equilibrium is reached, where C0 is the dye concentration at the start of the second stage. Physically, k reflects the efficiency with which the catalyst converts adsorbed dye molecules into degradation products under irradiation, considering the combined effects of surface reaction kinetics, adsorption strength, charge separation efficiency, and reactive species formation. A higher k value indicates faster photocatalytic degradation and higher catalyst efficiency [64]. Among the samples, CuO/nC 25% exhibited the highest k value of (0.07676 ± 0.01293) min−1, indicating the most effective charge transfer and surface reaction dynamics during the photocatalytic stage. Additionally, the R2 value for the CuO/nC 25% sample was also the highest among the other composites, as summarized in Table 2, indicating the best fit criteria.
The reusability of CuO/nC 25% was evaluate for five cycles. After each reaction cycle, the photocatalyst was recovered by centrifugation, thoroughly washed with ethanol and deionized water to remove residual dye species, and dried prior to reuse. As shown in Fig. 14, CuO/nC 25% catalyst demonstrates good stability, maintaining MB removal efficiencies above 90% for up to four consecutive cycles. A slight decline in performance is observed in the fifth cycle, where the removal efficiency decreases to approximately 87%, indicating minor deactivation while still retaining satisfactory photocatalytic activity.
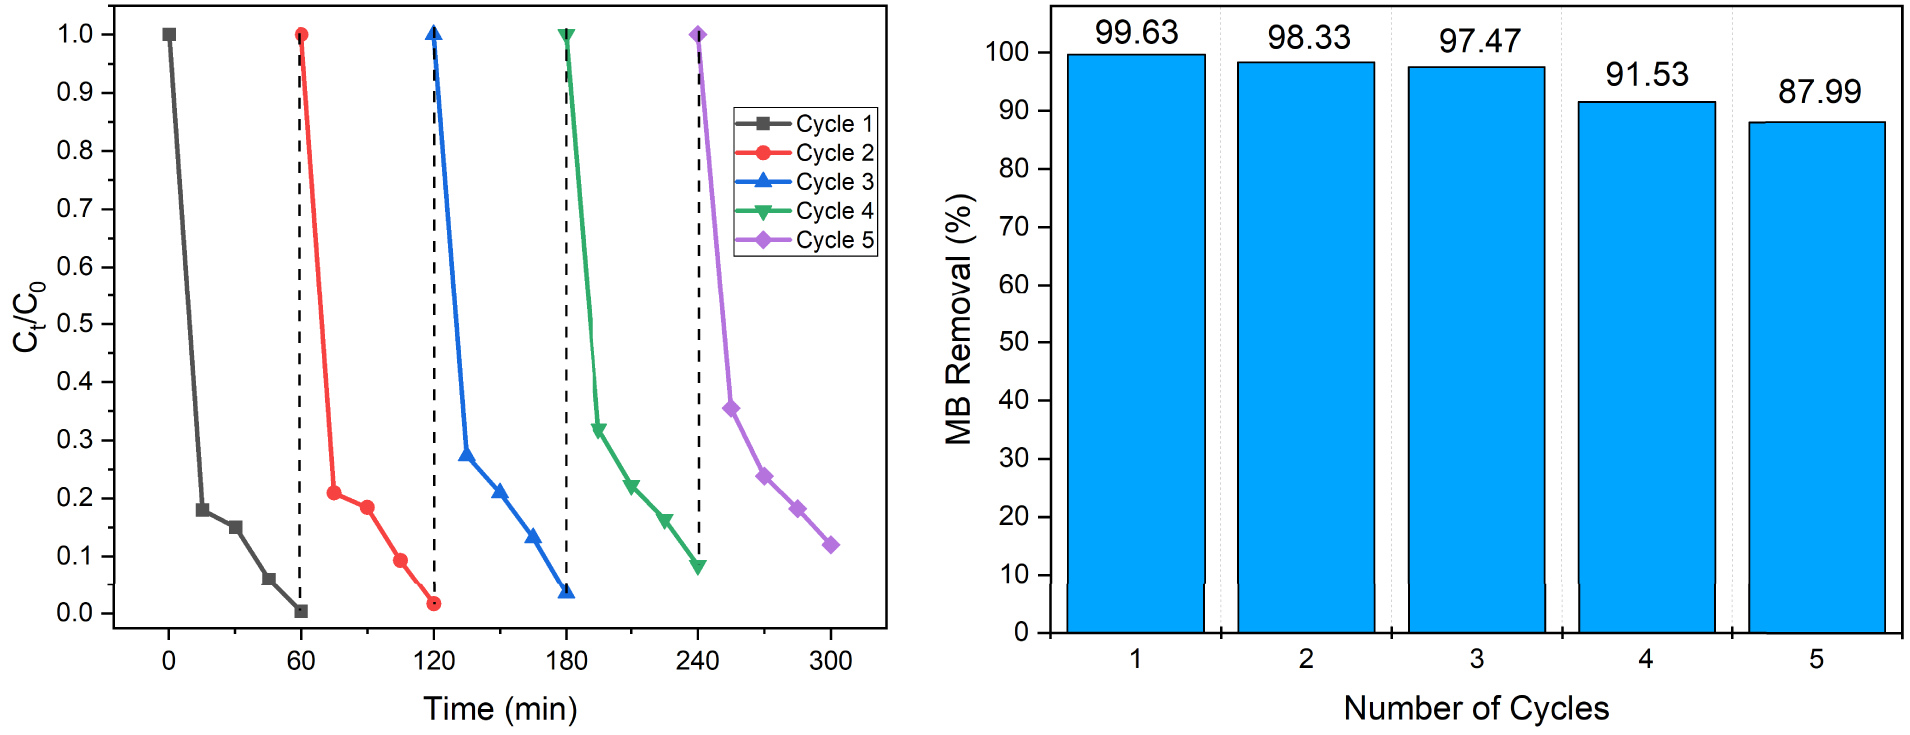
Figure 14: Reusability test: Ct/C0 vs. time for 5 consecutive cycles (left) and percentage of MB removal at the end of each cycles (right).
A two-way ANOVA with interaction test was employed to evaluate the effects of catalyst type and irradiation time on MB concentration and to determine whether these factors act independently or synergistically. This approach is particularly suitable because the experimental design involves two independent variables, each expected to influence the removal process. For this calculation, the replication number is 3 and the level of significance (α) is 0.05. Table 3 presents a summary of the calculation results.
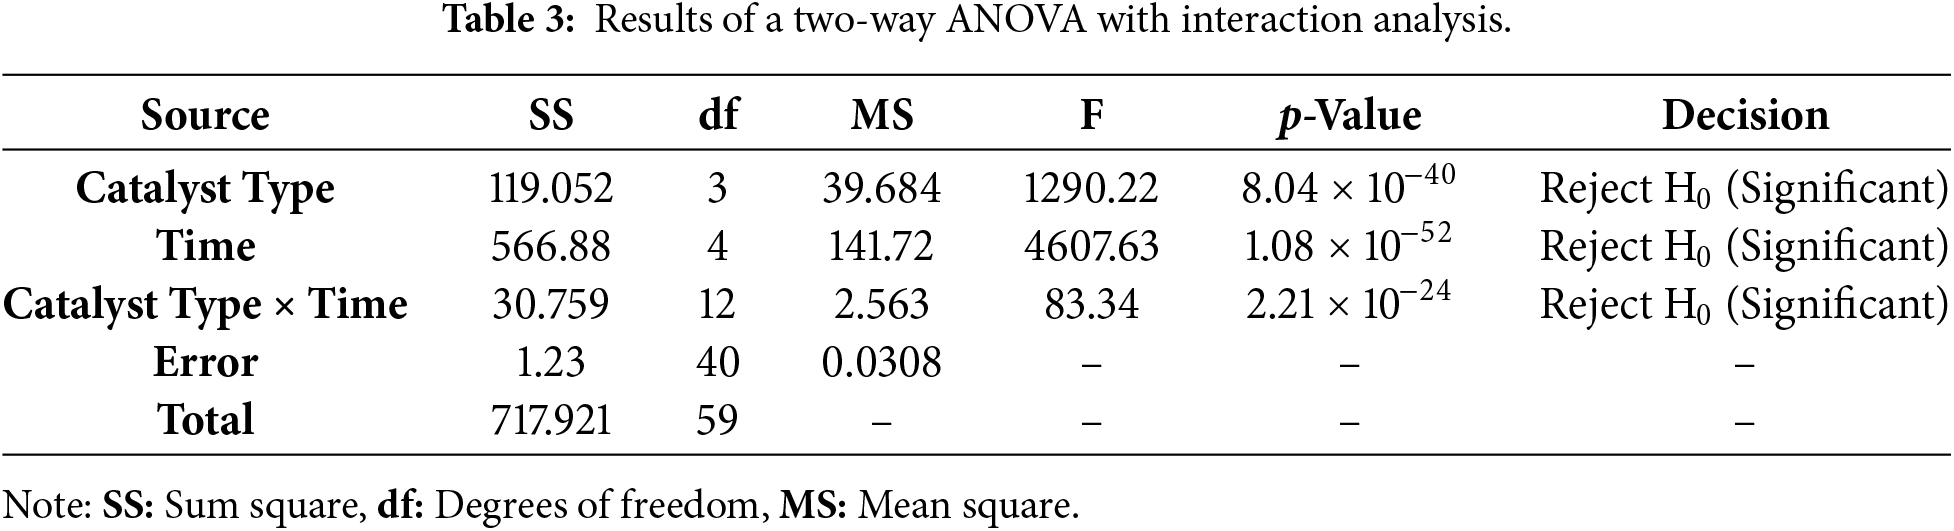
The ANOVA result indicates that both catalyst type and irradiation time significantly influence MB concentration (p < 0.05). A significant interaction effect was also observed, confirming that the degradation kinetics depend on the catalyst composition. To analyze which sample is significantly different with others, the Tukey HSD post-hoc analysis was also conducted, and the result is summarized in Table 4.
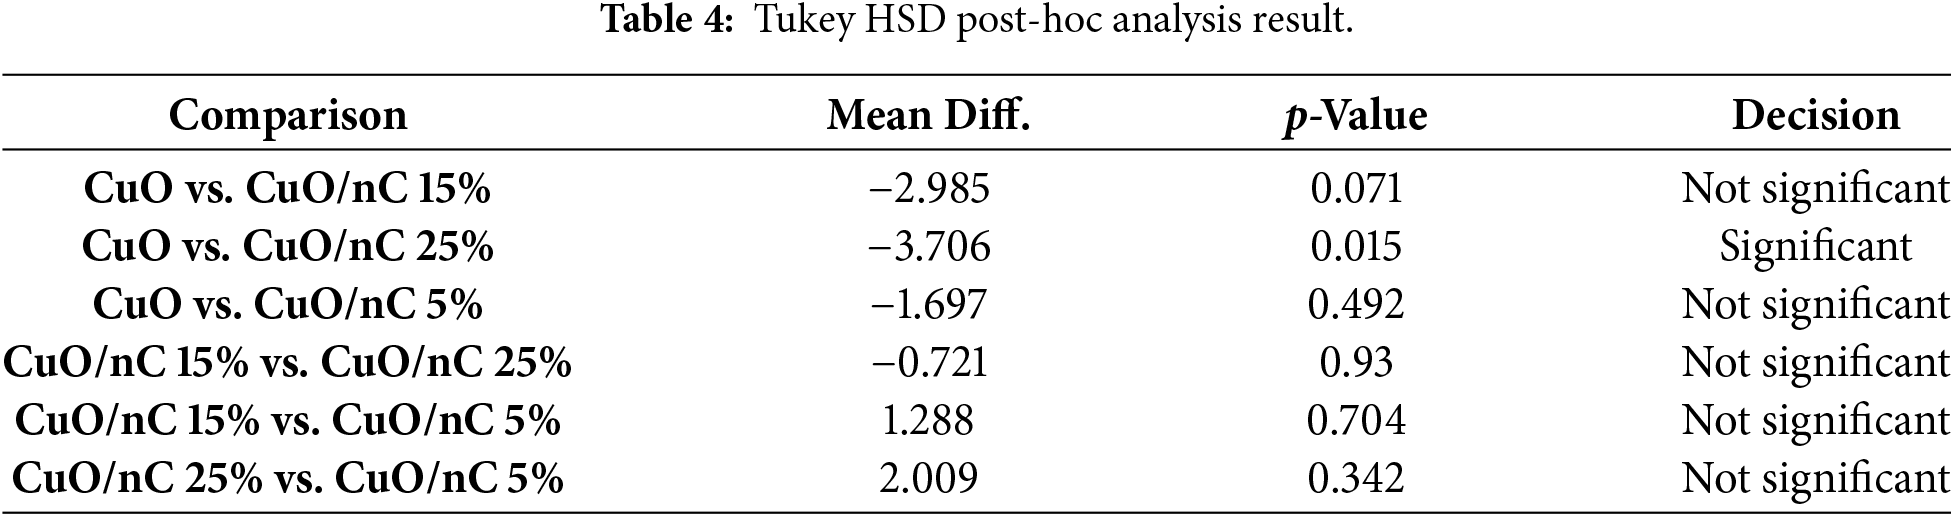
The Tukey HSD post-hoc analysis (α = 0.05) revealed that only the CuO/nC 25% shows a statistically significant difference compared to pure CuO (p = 0.015). Other pairwise comparisons were not statistically significant, indicating that lower nC loadings (5% and 15%) do not produce a sufficiently distinct effect within the experimental variability.
Fig. 15 illustrates the proposed mechanism for MB removal by the CuO/nC system, which proceeds via a two-phase process: adsorption followed by photocatalytic oxidation. In phase I (0–15 min), rapid adsorption dominates, driven by nC. The abundant -OH groups and polar surface enable strong interactions with MB through hydrogen bonding, electrostatic attraction, and possibly π-π interactions, resulting in a sharp decrease in dye concentration. In phase II (15–60 min), photocatalytic degradation occurs under UV irradiation. CuO absorbs photons (hν ≥ Eg), generating electron-hole pairs, while nC facilitates electron transfer and suppresses recombination, enhancing charge separation. The produced electrons in the conduction band (CB) react with dissolved O2 to form superoxide radicals (·O2−), while holes in the valence band (VB) oxidize surface-adsorbed water to generate hydroxyl radicals (·OH). These reactive species attack the adsorbed dye molecules, converting them to intermediate products (e.g., formaldehyde and formic acid) and ultimately to mineralization products. Nanocellulose enhances charge separation and suppresses electron-hole recombination by facilitating electron transport, thereby accelerating the degradation kinetics. Consequently, the second stage follows pseudo-first-order kinetic consistent with the Langmuir-Hinshelwood mechanism.
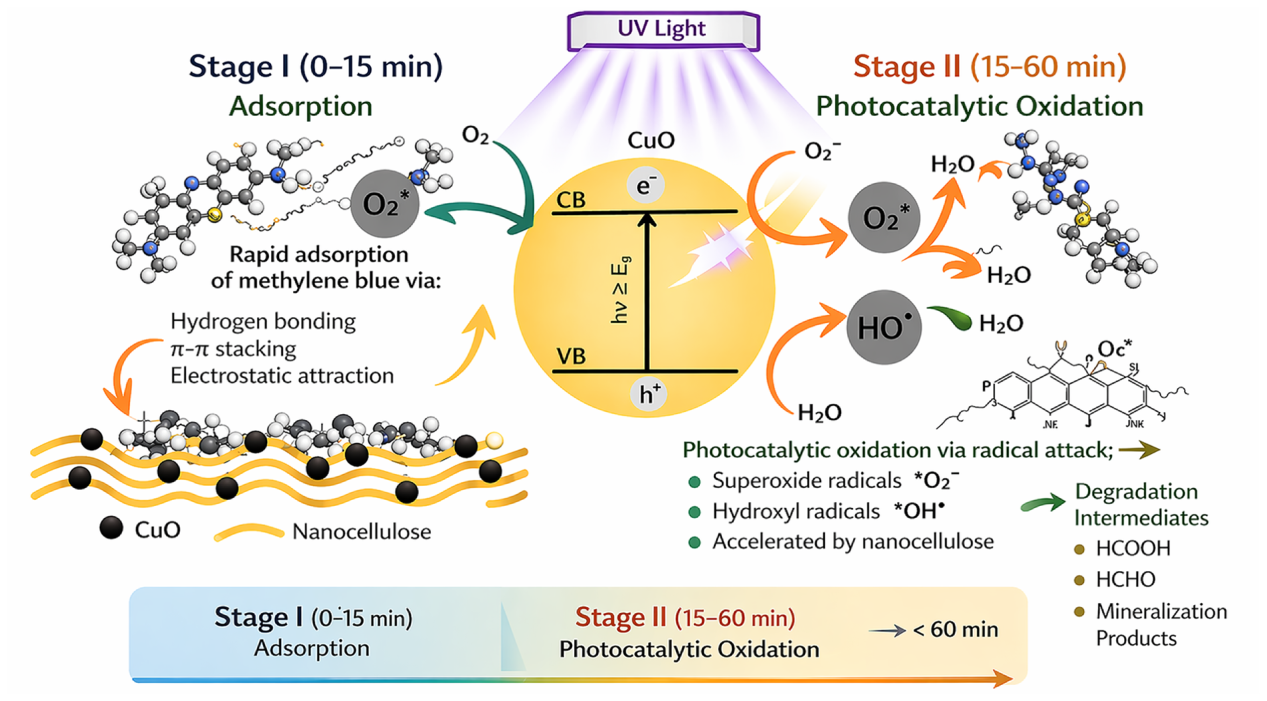
Figure 15: Postulated mechanism of MB removal by the CuO/nC composite.
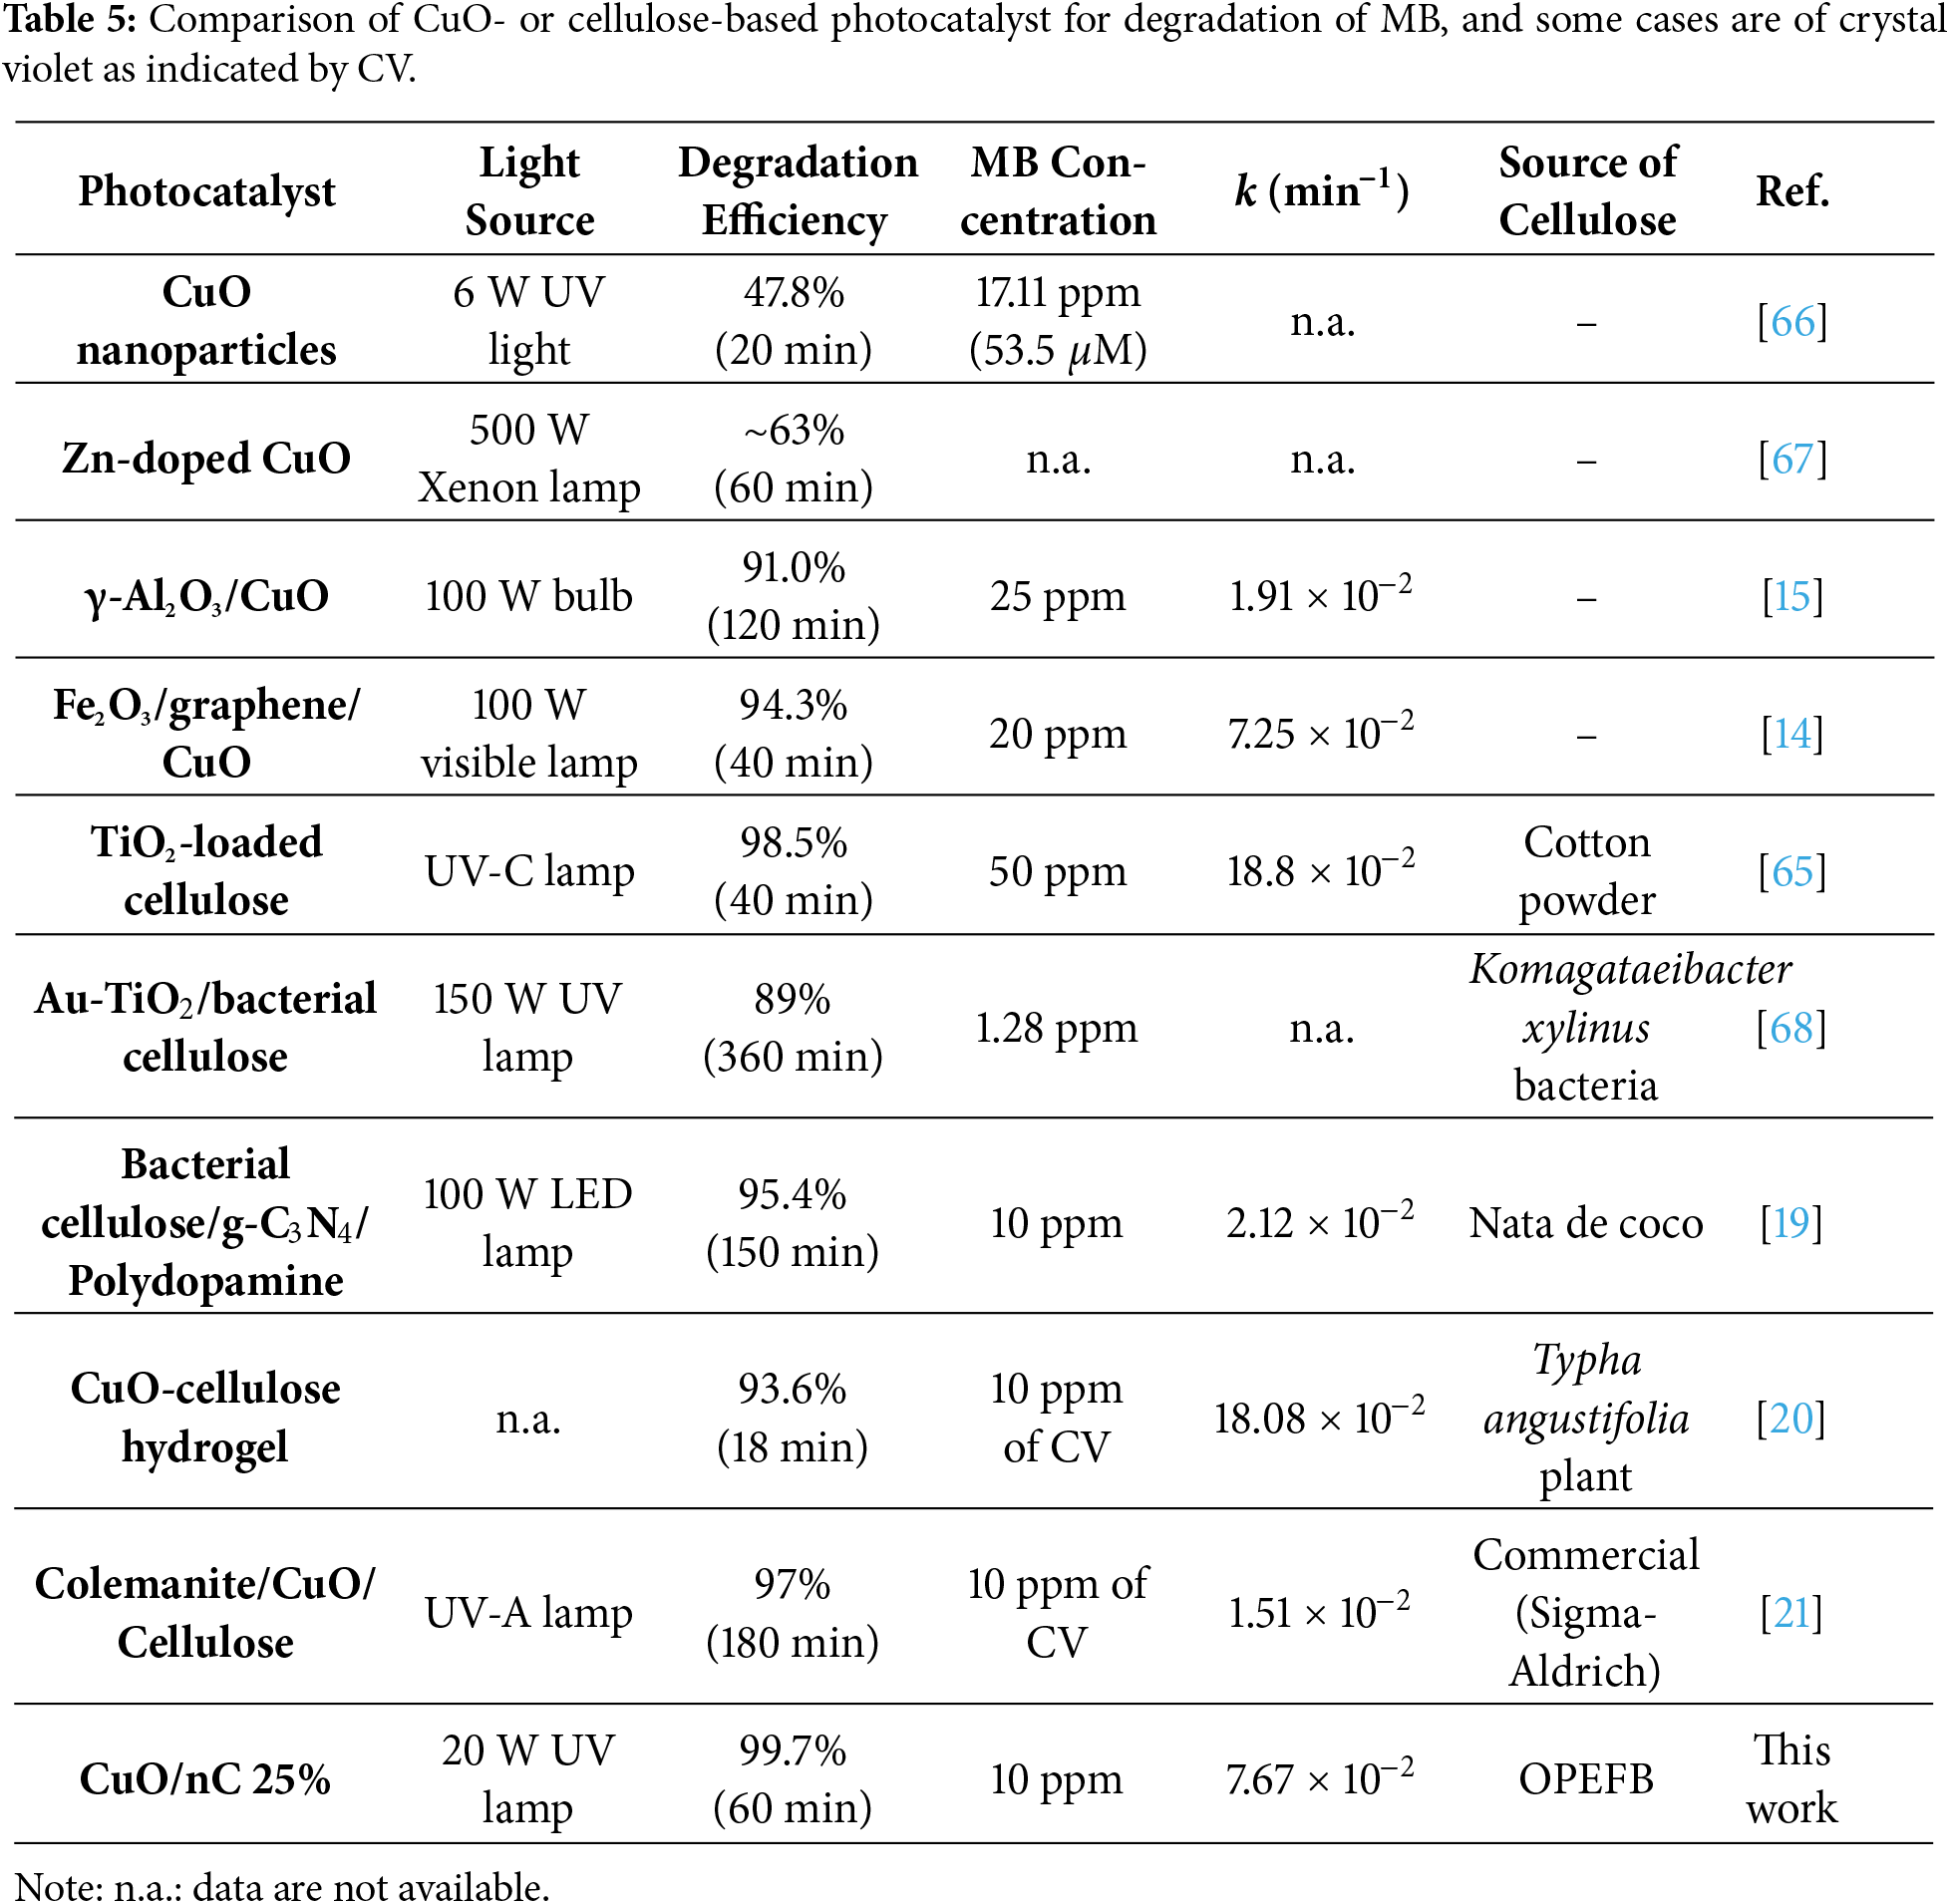
The comparative summary in Table 5 demonstrates that the CuO/nC composite developed in this study exhibits competitive and, in some cases, superior photocatalytic performance relative to previously reported materials. The incorporation of nC significantly enhances removal efficiency compared to pure CuO, which can be attributed to improved dispersion, enhanced surface interaction, and increased accessibility of active sites [65]. A high degradation efficiency of CuO/nC for MB aligns with performance trends observed in CuO/cellulose-based systems for other dyes, such as crystal violet (CV) [20,21]. This comparison reinforces the potential of the proposed composite as an efficient and sustainable photocatalyst within the current research landscape.
OPEFB-derived nanocellulose (nC) was successfully synthesized via delignification and acid hydrolysis and incorporated into CuO for MB removal through a two-stage process: adsorption and photocatalysis. The nC content varied at 5%, 15%, and 25% by mass. The obtained nC exhibited a higher crystallinity index than micro-cellulose and raw OPEFB fibers, with particle sizes of 260–310 nm, a surface area of 2.3 m2/g, and a pore diameter of 9.5 nm. Incorporation of nC suppressed CuO crystal growth, improved dispersion and stability, while maintaining the composite bandgap within the visible range. The addition of nC significantly enhanced MB removal under UV irradiation, increasing from 43.6% (CuO) to 99.7% (CuO/nC 25%) after 60 min. The CuO/nC 25% also demonstrated good reusability, maintaining removal efficiencies ~90% over four cycles. Statistical analysis further confirms the significant role of nC in improving removal performance. MB removal proceeds via rapid nC-drived adsorption (0–15 min), followed by UV-induced CuO photocatalysis (15–60 min) enhanced by nC-facilitated charge separation. These results demonstrate the potential of CuO/nC as an efficient and sustainable photocatalyst for MB removal. Further evaluation using mixed dye systems is essential to assess performance under realistic wastewater conditions, while investigation of higher nC loadings is required to identify the optimum composition for adsorption-photocatalytic synergy.
Acknowledgement: The authors gratefully acknowledge support from Doctoral Scholarship Program for Indonesian Lecturers, Center for Higher Education Funding and Assessment, and Ministry of Higher Education, Science and Technology of Republic Indonesia. The authors also appreciate the institutional support that enabled the completion of this research.
Funding Statement: This work was supported by JSPS Core-to-Core Program (grant number: JPJSCCB20240005) and ITS Research Grant No. 2046/PKS/ITS/2024.
Author Contributions: The authors confirm contribution to the paper as follows: conceptualization, Haniffudin Nurdiansah, Retno Asih; methodology, Haniffudin Nurdiansah, Joko Setyo Wibowo; validation, Retno Asih, Diah Susanti, Rindang Fajarin, Azzah Dyah Pramata, Amaliya Rasyida, Lukman Noerochim, Isao Watanabe, Darminto; formal analysis, Haniffudin Nurdiansah, Joko Setyo Wibowo, Retno Asih; investigation, Haniffudin Nurdiansah, Joko Setyo Wibowo, Retno Asih; data curation, Haniffudin Nurdiansah, Joko Setyo Wibowo; writing—original draft preparation, Haniffudin Nurdiansah, Retno Asih; writing—review and editing, Haniffudin Nurdiansah, Retno Asih; visualization, Haniffudin Nurdiansah, Retno Asih, Joko Setyo Wibowo; supervision, Haniffudin Nurdiansah; project administration, Haniffudin Nurdiansah, Retno Asih; funding acquisition, Haniffudin Nurdiansah, Isao Watanabe. All authors reviewed and approved the final version of the manuscript.
Availability of Data and Materials: Data available on request from the authors.
Ethics Approval: Not applicable.
Conflicts of Interest: The authors declare no conflicts of interest.
References
1. de Oliveira CRS, de Oliveira PV, Pellenz L, de Aguiar CRL, da Silva AH Jr. Supercritical fluid technology as a sustainable alternative method for textile dyeing: an approach on waste, energy, and CO2 emission reduction. J Environ Sci. 2024;140:123–45. doi:10.1016/j.jes.2023.06.007. [Google Scholar] [CrossRef]
2. Azanaw A, Birlie B, Teshome B, Jemberie M. Textile effluent treatment methods and eco-friendly resolution of textile wastewater. Case Stud Chem Environ Eng. 2022;6(6):100230. doi:10.1016/j.cscee.2022.100230. [Google Scholar] [CrossRef]
3. Gomes K, Guenther E, Morris J, Miggelbrink J, Caucci S. Resource nexus oriented decision making along the textile value chain: the case of wastewater management. Curr Res Environ Sustain. 2022;4(3):100153. doi:10.1016/j.crsust.2022.100153. [Google Scholar] [CrossRef]
4. Nayak R, Panwar T, Van Thang Nguyen L. Sustainability in fashion and textiles. In: Sustainable technologies for fashion and textiles. Amsterdam, The Netherlands: Elsevier; 2020. p. 3–30. doi:10.1016/b978-0-08-102867-4.00001-3. [Google Scholar] [CrossRef]
5. Khan I, Saeed K, Zekker I, Zhang B, Hendi AH, Ahmad A, et al. Review on methylene blue: its properties, uses, toxicity and photodegradation. Water. 2022;14(2):242. doi:10.3390/w14020242. [Google Scholar] [CrossRef]
6. Mohammadpour A, Karami N, Zabihi R, Fazeliyan E, Abbasi A, Karimi S, et al. Green synthesis, characterization, and application of Fe3O4 nanoparticles for methylene blue removal: RSM optimization, kinetic, isothermal studies, and molecular simulation. Environ Res. 2023;225(25):115507. doi:10.1016/j.envres.2023.115507. [Google Scholar] [CrossRef]
7. Chakravorty A, Roy S. A review of photocatalysis, basic principles, processes, and materials. Sustain Chem Environ. 2024;8(11):100155. doi:10.1016/j.scenv.2024.100155. [Google Scholar] [CrossRef]
8. Wang H, Li X, Zhao X, Li C, Song X, Zhang P, et al. A review on heterogeneous photocatalysis for environmental remediation: from semiconductors to modification strategies. Chin J Catal. 2022;43(2):178–214. doi:10.1016/S1872-2067(21)63910-4. [Google Scholar] [CrossRef]
9. Saeed K, Khan I, Gul T, Sadiq M. Efficient photodegradation of methyl violet dye using TiO2/Pt and TiO2/Pd photocatalysts. Appl Water Sci. 2017;7(7):3841–8. doi:10.1007/s13201-017-0535-3. [Google Scholar] [CrossRef]
10. Balık M, Bulut V, Erdogan IY. Optical, structural and phase transition properties of Cu2O, CuO and Cu2O/CuO: their photoelectrochemical sensor applications. Int J Hydrogen Energy. 2019;44(34):18744–55. doi:10.1016/j.ijhydene.2018.08.159. [Google Scholar] [CrossRef]
11. Raizada P, Sudhaik A, Patial S, Hasija V, Parwaz Khan AA, Singh P, et al. Engineering nanostructures of CuO-based photocatalysts for water treatment: current progress and future challenges. Arab J Chem. 2020;13(11):8424–57. doi:10.1016/j.arabjc.2020.06.031. [Google Scholar] [CrossRef]
12. Ahmaruzzaman M. Metal oxides (ZnO, CuO and NiO)-based nanostructured materials for photocatalytic remediation of organic contaminants. Nanotechnol Environ Eng. 2023;8(1):219–35. doi:10.1007/s41204-022-00284-8. [Google Scholar] [CrossRef]
13. Xing J, Peng Q, Zhong W, Zhang Y, Wang X, Liu K. Highly efficient activation of peroxymonosulfate by novel CuO-Chrysotile catalytic membrane for degradation of p-nitrophenol. J Water Process Eng. 2023;51:103403. doi:10.1016/j.jwpe.2022.103403. [Google Scholar] [CrossRef]
14. Nuengmatcha P, Porrawatkul P, Chanthai S, Sricharoen P, Limchoowong N. Enhanced photocatalytic degradation of methylene blue using Fe2O3/graphene/CuO nanocomposites under visible light. J Environ Chem Eng. 2019;7(6):103438. doi:10.1016/j.jece.2019.103438. [Google Scholar] [CrossRef]
15. Sridevi A, Krishnamohan S, Thairiyaraja M, Prakash B, Yokeshwaran R. Visible-light driven γ-Al2O3, CuO and γ-Al2O3/CuO nanocatalysts: synthesis and enhanced photocatalytic activity. Inorg Chem Commun. 2022;138(51):109311. doi:10.1016/j.inoche.2022.109311. [Google Scholar] [CrossRef]
16. Hisham S, Kadirgama K, Alotaibi JG, Alajmi AE, Ramasamy D, Sazali N, et al. Enhancing stability and tribological applications using hybrid nanocellulose-copper (II) oxide (CNC-CuO) nanolubricant: an approach towards environmental sustainability. Tribol Int. 2024;194(12):109506. doi:10.1016/j.triboint.2024.109506. [Google Scholar] [CrossRef]
17. Solhi L, Guccini V, Heise K, Solala I, Niinivaara E, Xu W, et al. Understanding nanocellulose-water interactions: turning a detriment into an asset. Chem Rev. 2023;123(5):1925–2015. doi:10.1021/acs.chemrev.2c00611. [Google Scholar] [PubMed] [CrossRef]
18. Shak KPY, Pang YL, Mah SK. Nanocellulose: recent advances and its prospects in environmental remediation. Beilstein J Nanotechnol. 2018;9:2479–98. doi:10.3762/bjnano.9.232. [Google Scholar] [PubMed] [CrossRef]
19. Charurungsipong P, Than-Ardna B, Manuspiya H. A novel polydopamine-coated bacterial cellulose/g-C3N4 membrane for highly efficient photocatalytic degradation of methylene blue. Int J Biol Macromol. 2024;283(Pt 2):137738. doi:10.1016/j.ijbiomac.2024.137738. [Google Scholar] [CrossRef]
20. Nimavat N, Parikh P, Prajapati M. Development of a CuO-nanocomposites hydrogel using Typha angustifolia L. cellulose for sustainable dye degradation. Cellulose. 2026;33(1):203–33. doi:10.1007/s10570-025-06865-5. [Google Scholar] [CrossRef]
21. Kütük N. Preparation and characterization of multifunctional colemanite/CuO/cellulose composite; application in water treatment processes. J Cluster Sci. 2026;37(1):19. doi:10.1007/s10876-026-02977-5. [Google Scholar] [CrossRef]
22. Januari AD, Agustina H. Palm oil empty fruit bunches and the implementation of zero waste and renewable energy technologies. IOP Conf Ser Earth Environ Sci. 2022;1034(1):012004. doi:10.1088/1755-1315/1034/1/012004. [Google Scholar] [CrossRef]
23. Juliastuti SR, Hendrianie N, Sabar KR, Anggita S. Glucose production from oil palm empty fruit bunch (OPEFB) using microwave and fungal treatment method. IOP Conf Ser Earth Environ Sci. 2022;963(1):012053. doi:10.1088/1755-1315/963/1/012053. [Google Scholar] [CrossRef]
24. Salehi G, Bagherzadeh M, Abazari R, Hajilo M, Taherinia D. Visible light-driven photocatalytic degradation of methylene blue dye using a highly efficient Mg-Al LDH@g-C3N4@Ag3PO4 nanocomposite. ACS Omega. 2024;9(4):4581–93. doi:10.1021/acsomega.3c07326. [Google Scholar] [CrossRef]
25. Saint UK, Chandra Baral S, Sasmal D, Maneesha P, Datta S, Naushin F, et al. Effect of pH on photocatalytic degradation of methylene blue in water by facile hydrothermally grown TiO2 nanoparticles under natural sunlight. JCIS Open. 2025;19(9):100150. doi:10.1016/j.jciso.2025.100150. [Google Scholar] [CrossRef]
26. Abuzeyad OH, El-Khawaga AM, Tantawy H, Gobara M, Elsayed MA. Photocatalytic degradation of methylene blue dye by promising zinc copper ferrite nanoparticles for wastewater treatment. J Inorg Organomet Polym Mater. 2024;34(6):2705–15. doi:10.1007/s10904-024-03006-6. [Google Scholar] [CrossRef]
27. Tran HD, Nguyen DQ, Do PT, Tran UNP. Kinetics of photocatalytic degradation of organic compounds: a mini-review and new approach. RSC Adv. 2023;13(25):16915–25. doi:10.1039/d3ra01970e. [Google Scholar] [PubMed] [CrossRef]
28. Rao A, Thakur P, Thakur A. Recent advances in photocatalytic degradation for dye-contaminated wastewater: a review on kinetic insights and metal oxide nanoparticle approaches. Inorg Chem Commun. 2026;188(4):116562. doi:10.1016/j.inoche.2026.116562. [Google Scholar] [CrossRef]
29. Shankar S, Rhim JW. Preparation of nanocellulose from micro-crystalline cellulose: the effect on the performance and properties of agar-based composite films. Carbohydr Polym. 2016;135:18–26. doi:10.1016/j.carbpol.2015.08.082. [Google Scholar] [PubMed] [CrossRef]
30. Nam S, French AD, Condon BD, Concha M. Segal crystallinity index revisited by the simulation of X-ray diffraction patterns of cotton cellulose Iβ and cellulose II. Carbohydr Polym. 2016;135(4633):1–9. doi:10.1016/j.carbpol.2015.08.035. [Google Scholar] [CrossRef]
31. Fiore V, Scalici T, Valenza A. Characterization of a new natural fiber from Arundo donax L. as potential reinforcement of polymer composites. Carbohydr Polym. 2014;106:77–83. doi:10.1016/j.carbpol.2014.02.016. [Google Scholar] [CrossRef]
32. Singh A, Kushwaha A, Sen S, Goswami S, Katiyar S, Kumar A, et al. Recent advancement in microwave-assisted pyrolysis for biooil production. In: Waste-to-energy approaches towards zero waste. Amsterdam, The Netherlands: Elsevier; 2022. p. 197–219. doi:10.1016/b978-0-323-85387-3.00014-8. [Google Scholar] [CrossRef]
33. Behrooz R, Ghasemi S, Asadpour Atoii G, Fatehi P. Mg(OH)2-based hydrogen peroxide bleaching of CMP pulps at high consistency. BioResources. 2011;7(1):161–72. doi:10.15376/biores.7.1.161-172. [Google Scholar] [CrossRef]
34. Akhlamadi G, Goharshadi EK, Saghir SV. Extraction of cellulose nanocrystals and fabrication of high alumina refractory bricks using pencil chips as a waste biomass source. Ceram Int. 2021;47(19):27042–9. doi:10.1016/j.ceramint.2021.06.117. [Google Scholar] [CrossRef]
35. Md Salim R, Asik J, Sarjadi MS. Chemical functional groups of extractives, cellulose and lignin extracted from native Leucaena leucocephala bark. Wood Sci Technol. 2021;55(2):295–313. doi:10.1007/s00226-020-01258-2. [Google Scholar] [CrossRef]
36. Nazir MS, Wahjoedi BA, Yussof AW, Abdullah MA. Eco-friendly extraction and characterization of cellulose from oil palm empty fruit bunches. BioResources. 2013;8(2):2161–72. doi:10.15376/biores.8.2.2161-2172. [Google Scholar] [CrossRef]
37. Alherech M, Omolabake S, Holland CM, Klinger GE, Hegg EL, Stahl SS. From lignin to valuable aromatic chemicals: lignin depolymerization and monomer separation via centrifugal partition chromatography. ACS Cent Sci. 2021;7(11):1831–7. doi:10.1021/acscentsci.1c00729. [Google Scholar] [PubMed] [CrossRef]
38. Susi S, Ainuri M, Wagiman W, Falah MF. Effect of delignification and bleaching stages on cellulose purity of oil palm empty fruit bunches. IOP Conf Ser Earth Environ Sci. 2022;1116(1):012018. doi:10.1088/1755-1315/1116/1/012018. [Google Scholar] [CrossRef]
39. Hidayatulloh I, Widyanti EM, Kusumawati E, Elizabeth L. Nanocellulose production from empty palm oil fruit bunches (EPOFB) using hydrolysis followed by freeze drying. ASEAN J Chem Eng. 2021;21(1):52. doi:10.22146/ajche.61093. [Google Scholar] [CrossRef]
40. Bouramdane Y, Fellak S, El Mansouri F, Boukir A. Impact of natural degradation on the aged lignocellulose fibers of Moroccan cedar softwood: structural elucidation by infrared spectroscopy (ATR-FTIR) and X-ray diffraction (XRD). Fermentation. 2022;8(12):698. doi:10.3390/fermentation8120698. [Google Scholar] [CrossRef]
41. Rahimi Kord Sofla M, Brown RJ, Tsuzuki T, Rainey TJ. A comparison of cellulose nanocrystals and cellulose nanofibres extracted from bagasse using acid and ball milling methods. Adv Nat Sci Nanosci Nanotechnol. 2016;7(3):035004. doi:10.1088/2043-6262/7/3/035004. [Google Scholar] [CrossRef]
42. Tan JY, Tey WY, Panpranot J, Lim S, Lee KM. Valorization of oil palm empty fruit bunch for cellulose fibers: a reinforcement material in polyvinyl alcohol biocomposites for its application as detergent capsules. Sustainability. 2022;14(18):11446. doi:10.3390/su141811446. [Google Scholar] [CrossRef]
43. Mulla MH, Norizan MN, Rawi NFM, Kassim MHM, Abdullah N, Norrrahim MNF. Surface and interfaces effects of concentrations and alkaline treatment durations on sugar palm fiber as structural reinforcement in polymer composites. J Nat Fibres. 2025;22(1):2527277. doi:10.1080/15440478.2025.2527277. [Google Scholar] [CrossRef]
44. Liu GQ, Pan XJ, Li J, Li C, Ji CL. Facile preparation and characterization of anatase TiO2/nanocellulose composite for photocatalytic degradation of methyl orange. J Saudi Chem Soc. 2021;25(12):101383. doi:10.1016/j.jscs.2021.101383. [Google Scholar] [CrossRef]
45. Storck S, Bretinger H, Maier WF. Characterization of micro- and mesoporous solids by physisorption methods and pore-size analysis. Appl Catal A Gen. 1998;174(1–2):137–46. doi:10.1016/S0926-860X(98)00164-1. [Google Scholar] [CrossRef]
46. Tade RS, More MP, Chatap VK, Patil PO, Deshmukh PK. Fabrication and In vitro drug release characteristics of magnetic nanocellulose fiber composites for efficient delivery of nystatin. Mater Res Express. 2018;5(11):116102. doi:10.1088/2053-1591/aadd2b. [Google Scholar] [CrossRef]
47. Subalakshmi P, Ganesan M, Sivashanmugam A. Synthesis of 3D architecture CuO micro balls and nano hexagons and its electrochemical capacitive behavior. Mater Des. 2017;119(9672):104–12. doi:10.1016/j.matdes.2017.01.068. [Google Scholar] [CrossRef]
48. Rita A, Sivakumar A, Martin Britto Dhas SA. Influence of shock waves on structural and morphological properties of copper oxide NPs for aerospace applications. J Nanostruct Chem. 2019;9(3):225–30. doi:10.1007/s40097-019-00313-0. [Google Scholar] [CrossRef]
49. Sin JS. Ion partitioning effect on the electrostatic interaction between two charged soft surfaces. Colloids Surf A Physicochem Eng Aspects. 2021;628:127296. doi:10.1016/j.colsurfa.2021.127296. [Google Scholar] [CrossRef]
50. Muthulakshmi L, Varada Rajalu A, Kaliaraj GS, Siengchin S, Parameswaranpillai J, Saraswathi R. Preparation of cellulose/copper nanoparticles bionanocomposite films using a bioflocculant polymer as reducing agent for antibacterial and anticorrosion applications. Compos Part B Eng. 2019;175(13):107177. doi:10.1016/j.compositesb.2019.107177. [Google Scholar] [CrossRef]
51. Alhalili Z. Green synthesis of copper oxide nanoparticles CuO NPs from Eucalyptus globoulus leaf extract: adsorption and design of experiments. Arab J Chem. 2022;15(5):103739. doi:10.1016/j.arabjc.2022.103739. [Google Scholar] [CrossRef]
52. Wakchaure AA, Kumbhare MR, Gawali SR. Eco-engineered copper oxide nanoparticles via microwave-assisted extraction of Cyphostemma auriculatum (roxb.synthesis, characterization and bioactivity evaluation. AJC. 2025;37(12):3079–85. doi:10.14233/ajchem.2025.34733. [Google Scholar] [CrossRef]
53. Pochapski DJ, Carvalho dos Santos C, Leite GW, Pulcinelli SH, Santilli CV. Zeta potential and colloidal stability predictions for inorganic nanoparticle dispersions: effects of experimental conditions and electrokinetic models on the interpretation of results. Langmuir. 2021;37(45):13379–89. doi:10.1021/acs.langmuir.1c02056. [Google Scholar] [CrossRef]
54. Ardani HK, Imawan C, Handayani W, Djuhana D, Harmoko A, Fauzia V. Enhancement of the stability of silver nanoparticles synthesized using aqueous extract of Diospyros discolor Willd. leaves using polyvinyl alcohol. IOP Conf Ser Mater Sci Eng. 2017;188:012056. doi:10.1088/1757-899x/188/1/012056. [Google Scholar] [CrossRef]
55. Tauc J, Grigorovici R, Vancu A. Optical properties and electronic structure of amorphous germanium. Phys Status Solidi B. 1966;15(2):627–37. doi:10.1002/pssb.19660150224. [Google Scholar] [CrossRef]
56. Kidowaki H, Oku T, Akiyama T. Fabrication and characterization of CuO/ZnO solar cells. J Phys: Conf Ser. 2012;352:012022. doi:10.1088/1742-6596/352/1/012022. [Google Scholar] [CrossRef]
57. Dasineh Khiavi N, Katal R, Kholghi Eshkalak S, Masudy-Panah S, Ramakrishna S, Hu J. Visible light driven heterojunction photocatalyst of CuO-Cu2O thin films for photocatalytic degradation of organic pollutants. Nanomater. 2019;9(7):1011. doi:10.3390/nano9071011. [Google Scholar] [CrossRef]
58. Simão CD, Reparaz JS, Wagner MR, Graczykowski B, Kreuzer M, Ruiz-Blanco YB, et al. Optical and mechanical properties of nanofibrillated cellulose: toward a robust platform for next-generation green technologies. Carbohydr Polym. 2015;126(20):40–6. doi:10.1016/j.carbpol.2015.03.032. [Google Scholar] [PubMed] [CrossRef]
59. Wei T, Zhu Y, Duan G, Han J, Han X, Zhang C, et al. Recent advances in nanocellulose-derived materials for dyes adsorption: a review. Int J Biol Macromol. 2025;306(1491):141770. doi:10.1016/j.ijbiomac.2025.141770. [Google Scholar] [PubMed] [CrossRef]
60. Nagendran V, Goveas LC, Vinayagam R, Varadavenkatesan T, Selvaraj R. Challenges and advances in nanocellulose-based adsorbents for dye removal: mechanisms and future directions. Discover Appl Sci. 2024;7(1):14. doi:10.1007/s42452-024-06413-z. [Google Scholar] [CrossRef]
61. Balakrishnan A, Mathew FP, Tom Joseph M, Varghese MM, Aryamol KS, Chinthala M, et al. Engineered cellulose-supported photocatalysts for clean energy and environmental remediation: progress and prospects. J Mater Chem A. 2026;14(10):5473–519. doi:10.1039/D5TA07511D. [Google Scholar] [CrossRef]
62. Iqbal A, Ibrahim NH, Rahman NRA, Saharudin KA, Adam F, Sreekantan S, et al. ZnO surface doping to enhance the photocatalytic activity of lithium titanate/TiO2 for methylene blue photodegradation under visible light irradiation. Surfaces. 2020;3(3):301–18. doi:10.3390/surfaces3030022. [Google Scholar] [CrossRef]
63. Revellame ED, Fortela DL, Sharp W, Hernandez R, Zappi ME. Adsorption kinetic modeling using pseudo-first order and pseudo-second order rate laws: a review. Clean Eng Technol. 2020;1:100032. doi:10.1016/j.clet.2020.100032. [Google Scholar] [CrossRef]
64. Das OR, Uddin MT, Rahman MM, Bhoumick MC. Highly active carbon supported Sn/SnO2 photocatalysts for degrading organic dyes. J Phys: Conf Ser. 2018;1086:012011. doi:10.1088/1742-6596/1086/1/012011. [Google Scholar] [CrossRef]
65. Morshed MN, Al Azad S, Deb H, Shaun BB, Shen XL. Titania-loaded cellulose-based functional hybrid nanomaterial for photocatalytic degradation of toxic aromatic dye in water. J Water Process Eng. 2020;33(24):101062. doi:10.1016/j.jwpe.2019.101062. [Google Scholar] [CrossRef]
66. Wang Q, Gao G, Gong D, Zhang C. Redispersible CuO nanoparticles: preparation and photocatalytic capacity for the degradation of methylene blue. RSC Adv. 2025;15(24):19023–33. doi:10.1039/d5ra02244d. [Google Scholar] [PubMed] [CrossRef]
67. George A, Magimai Antoni Raj D, Venci X, Dhayal Raj A, Albert Irudayaraj A, Josephine RL, et al. Photocatalytic effect of CuO nanoparticles flower-like 3D nanostructures under visible light irradiation with the degradation of methylene blue (MB) dye for environmental application. Environ Res. 2022;203(12):111880. doi:10.1016/j.envres.2021.111880. [Google Scholar] [PubMed] [CrossRef]
68. Kumalayanti L, Khamhom W, Chankhunthod N, Kidkhunthod P, Pinitsoontorn S. Facile synthesis of Au–TiO2/Bacterial cellulose aerogel nanocomposites with enhanced photocatalytic degradation of methylene blue under UV irradiation. Radiat Phys Chem. 2024;221:111757. doi:10.1016/j.radphyschem.2024.111757. [Google Scholar] [CrossRef]
Cite This Article
 Copyright © 2026 The Author(s). Published by Tech Science Press.
This work is licensed under a Creative Commons Attribution 4.0 International License , which permits unrestricted use, distribution, and reproduction in any medium, provided the original work is properly cited.
 Downloads
 Citation Tools
