
 Submit a Paper
 Propose a Special lssue
 Open Access
ARTICLE

Construction of the panoptosis-related gene model and characterization of tumor microenvironment infiltration in hepatocellular carcinoma
1 Hebei Key Laboratory of Environment and Human Health, School of Public Health, Hebei Medical University, Shijiazhuang, China
2 Department of Ultrasonics, The First Affiliated Hospital of Hebei Medical University, Shijiazhuang, China
* Corresponding Authors: Wenxuan Liu, ; Lei Yang,
(This article belongs to the Special Issue: Role of Reactive Oxygen Species and DNA Damage in Tumor Immunological Responses)
Oncology Research 2023, 31(4), 569-590. https://doi.org/10.32604/or.2023.028964
Received 19 January 2023; Accepted 25 April 2023; Issue published 25 June 2023
 View Full Text
 Download PDF
Abstract
Hepatocellular carcinoma (HCC) is the most common fatal cancer worldwide, patients with HCC have a high mortality rate and poor prognosis. PANoptosis is a novel discovery of programmed cell death associated with cancer development. However, the role of PANoptosis in HCC remains obscure. In this study, we enrolled 274 PANoptosisrelated genes (PANRGs) and screened 8 genes to set up a prognostic model. A previous scoring system calculated PANscore was utilized to quantify the individual risk level of each HCC patient, and the reliability of the prognostic model has been validated in an external cohort. Nomogram constructed with PANscore and clinical characteristics were used to optimize individualized treatment for each patient. Single-cell analysis revealed a PANoptosis model associated with tumor immune cell infiltration, particularly natural killer (NK) cells. Further exploration of hub genes and assessment of the prognostic role of these 4 hub genes in HCC by quantitative real-time PCR (qRT-PCR) and immunohistochemistry (IHC). In conclusion, we evaluated a PANoptosis-based prognostic model as a potential prognostic biomarker for HCC patients.Keywords
Supplementary Material
Supplementary Material FileAbbreviations
| PCD | Programmed cell death |
| HCC | Hepatocellular carcinoma |
| PANRGs | PANoptosis-related genes |
| LASSO | Least absolute shrinkage and selection operator |
| WGCNA | Weighted gene coexpression network analysis |
| IHC | Immunohistochemistry |
| OS | Overall survival |
| K-M | Kaplan-Meier |
| qRT-PCR | quantitative real-time PCR |
| TCGA | The Cancer Genome Atlas |
| ICGC | The International Cancer Genome Consortium |
| CNGBdb | The China National GeneBank DataBase |
| FPKM | Fragments per kilobase million |
| RNA-seq | RNA-sequencing |
| GO | Gene Ontology |
| KEGG | Kyoto Encyclopedia of Genes and Genomes |
| ssGSEA | Single-sample GSEA |
| scRNA | Single-cell RNA |
| YP1 | YO-PRO-1 |
| PI | Propidium iodide |
| AUC | Area under the curve |
| GSEA | Gene set enrichment analysis |
| DAP3 | Death-associated protein 3 |
| TNF-α | Tumor necrosis factor receptor |
| FasL | Fas ligand |
| TRAIL | TNF-related apoptosis-inducing ligand |
| CRD | Conserved carbohydrate recognition domain |
| PP2A | Phosphatase 2A |
| HSP90 | Heat shock protein |
| PLK1 | Polo-like kinase 1 |
| GSDME | Gasdermin E |
| TILs | Tumor-infiltrating leukocytes |
Hepatocellular carcinoma (HCC) is currently one of the most common cancers worldwide and is regarded as the third most frequent cause of cancer-related deaths worldwide [1,2]. HCC accounts for approximately 75%–85% of all primary liver cancer cases and is characterized by high heterogeneity, poor prognosis, and drug response [3–5]. Currently, only a few treatments are available for HCC, and the survival advantage of chemotherapy is not apparent for advanced patients [6]. Although there are many biomarkers or genetic models that have been found to potentially predict the prognosis of HCC patients, few of them can be applied in clinical practice. Therefore, the development of a validated model to predict the prognosis of HCC patients is essential to provide new clinical management guidance.
PANoptosis is a newly described form of inflammatory cell death that encompasses three major pathways of programmed cell death (PCD), including pyroptosis, apoptosis, and Necroptosis, and there is extensive crosstalk between these molecular processes. PANoptosis was previously shown to be controlled by the cytoplasmic polyprotein complex PANoptosome. When one or more PCDs are blocked, it is replaced by alternative death mechanisms. Apoptosis is executed by the promoter caspases caspase-8/10 or -9 downstream of caspase-3 and -7. The resistance of cancer cells to apoptosis may be an essential mechanism leading to cancer [7]. Pyroptosis is performed by members of the gasdermin family and is characterized by cell swelling, plasma membrane rupture, and cytokine release [8]. Necroptosis is a RIPK1- and RIPK3-dependent anti-tumor immune mechanism [9]. Previous studies have shown that PANoptosis plays a critical role in many diseases, such as microbial infection, inflammation, and malignant tumor [10–12]. Moreover, PANoptosis is presently considered to be associated with tumor growth and metastasis, drug resistance, and poor prognosis.
Growing evidence has indicated that gene signatures based on pyroptosis, apoptosis, and necroptosis are associated with the progression and prognosis of HCC patients [13–15]. The relationship between PANoptosis and immune regulation, however, has remained unclear.
This study aims to establish a prognostic model in the TCGA database. Previous studies have explored the relationship between PANoptosis and cancer and developed a quantitative indicator that represents PANoptosis-related risk score named PANscore [16] to predict the outcome of HCC patients with prognosis. This study constructed PANscore in HCC based on this foundation to further explore the potential biological patterns of PANoptosis. Furthermore, Nomogram was developed to effectively predict prognosis and help select patients for individualized treatment. Meanwhile, our risk prediction model verified that four key genes (DAP3, PPP2R5B, GSDME, and PLK1) were overexpressed in HCC cell lines. Finally, immunohistochemical results proved that DAP3, PPP2R5B, GSDME, and PLK1 are potential prognostic biomarkers for HCC.
Sources and acquisition of data and samples
Datasets sources and preprocessing
We obtained RNA-sequencing (RNA-seq) data and the relevant clinical infor-mation of 374 liver cancer samples and 50 normal liver samples from the Cancer Ge-nome Atlas (TCGA, https://portal.gdc.cancer.gov/repository) database. Gene expression profiles were normalized by using the scale method provided in the “limma” R package. In this study, the overall survival (OS) values of the HCC patients who were missing were excluded. In addition, transcriptomic and clinical data were downloaded from the International Cancer Genome Consortium (ICGC, https://dcc.icgc.org/projects/LIRI-JP) on the clinical characteristics of 243 HCC patients and 202 normal individuals (LIRI-JP). Information on HCC patients and normal samples were obtained from Japan, and the gene expression values were normalized. 336 Metabolism-related gene sets were obtained from Gene set enrichment analysis (GSEA, https://www.gsea-msigdb.org/gsea/).
The hepatocellular carcinoma scRNA raw sequence reads CNP0000650 were downloaded from the China National GeneBank DataBase (CNGBdb, https://db.cngb.org/). Includes 16,498 full-length single-cell transcriptomes from 18 patients with primary or early relapsed HCC.
Clinical sample acquisition and ethics statement
We retrospectively collected tissues from 44 HCC patients who underwent surgical resection at the Fourth Hospital of Hebei Medical University (from December 2009 to March 2015). These patients were followed up until 2022. All patients had resectable HCC and did not receive preoperative anticancer treatment. The ethical review of this study protocol was approved by the Ethics Committee of Hebei Medical University. All patients were informed and signed an informed consent form before participating in the study. The experimental protocol was approved by the Ethics Committee of Hebei Medical University (approval number: [P] 2022077).
The HepG2 human HCC cell line used in this study was obtained from Wuhan Sevier Biotechnology Company, and human HCC HL-7721 cells and human normal hepatocyte line L-O2 were retained by our laboratory.
Acquisition of the PANoptosis gene list and identification of prognostic DEGs
We created a list containing 274 PANoptosis related genes (PANRGs) from previous research and the literature [17–19], and the details of all the genes are shown in Suppl. Table S1. The list was combined with the apoptosis, pyroptosis, and necroptosis gene sets, and the overlapping part of the genes was removed.
The RNA-seq data in TCGA were normalized to fragments per kilobase million (FPKM). The “limma” package (version 3.52.4) was used to identify the DEGs between the tumor and paired adjacent nontumor tissues. The threshold value was set to |logFC| > 1 and FDR < 0.05. Univariate Cox regression analysis identified PANRGs with a potential prognosis, and genes with a p < 0.05 were selected. The gene interaction network was constructed using the STRING (STRING, https://string-db.org/) database.
Construction of the PANoptosis-related gene prognostic model
In the TCGA datasets, 374 HCC patients with survival information were taken as the training set. To avoid overfitting the prognostic signature, the “glmnet” package (version 4.1-4) was used to perform the least absolute shrinkage and selection operator (LASSO) regression to construct a prognostic model. Then, 8 prognostic PANoptosis-related differentially expressed genes (DEGs) were identified for further analysis. The estimated regression coefficient was weighted and combined with the PANRG expression value. The PANscore formula for the progno-sis-related gene signature revealed the following: PANscore = coefficient of gene (1) * expression of gene (1) + coefficient of gene (2) * expression of gene (2) +…+ coefficient of gene (n) * expression of gene (n).
The PANscore for each HCC patient was calculated based on the above formula. Patients can be divided into two groups (high PANscore group and low PANscore group) by median PANscore. In addition, we performed Principal Components Analysis (PCA) and t-Distributed Stochastic Neighbor Embedding (t-SNE) to explore the distribution of the different groups. Furthermore, to explore the correlation between the PANoptosis-related score and the overall survival of HCC patients, the “survival” package (version 3.4-0) was used to perform survival analysis. To further validate the PANoptosis-related scores, we constructed time-dependent receiver operating characteristic (ROC) curves with the “survivalROC” package (version 1.0.3) to evaluate the predictive power of PANscore.
The validation dataset LIRI-JP cohort was used to assess the performance and prognostic power of the PANoptosis-related score using time-dependent ROC analysis and Kaplan-Meier log-rank tests.
Functional enrichment analysis
The R packages “clusterProfiler” (version 4.4.4) and “ggplot2” (version 3.3.6) were used for GSEA (gene set en-richment analysis), including the Gene Ontology (GO) and Kyoto Encyclopedia of Genes and Genomes (KEGG) databases. The analysis for the high PANscore group and low PANscore group based on DEGs was set to |log2FC| ≥ 1, FDR < 0.05. p values were adjusted using the BH method. Single sample gene set enrichment analysis (ssGSEA) was performed with the GSVA R package (version 1.44.5) to calculate the infiltration score of 16 immune cells and the activity of 13 immune-related pathways. Subsequently, advanced Heatmap Plot was performed using the OmicStudio tools at https://www.omicstudio.cn.
Analysis of infiltrating immune cells in HCC
The association between the prognostic model and immunocyte infiltration was evaluated by the CIBERSORT algorithm [20], which was used to calculate the proportion of each kind of tumor-infiltrating immune cell, such as B cells, CD4+ T cells, CD8+ T cells, neutrophils, macrophages, and dendritic cells. in HCC patients. The p value threshold was set to 0.05. Subsequently, we estimated the differences in the tumor immune microenvironment between the two groups by evaluating the expression of each type of immune cell in the high PANscore group and low PANscore group.
With the R package “rms” (version 6.3-0), a nomogram was constructed to predict OS rates at 1, 3, and 5 years. The predictors (TNM stage and PANscore) were employed. Correction curves based on the Hosmer-Lemeshow test were applied to illustrate the uniformity between the practical outcome and the model prediction model.
Single-cell RNA sequence clustering for dimension reduction
To further dissect the tumor immune microenvironment in HCC tissues at the single-cell level, we utilized previously published single-cell RNA (scRNA) data from 12 primary liver cancer and 6 early relapsed HCC patients with tumor specimens and paired adjacent nontumor tissues [21]. A total of 16,498 single-cell transcriptome data were included. First, cell filtration of scRNA data was processed by the R package “Seurat” (v4.2.0) [22]. Then, the “ScaleData” function was used to scale all genes, and the “RunPCA” function was used to conduct PCA for highly variant genes to reduce the dimensionality. In addition, we clustered the cells by the “FindNeighbors” and “FindClusters” functions (dim = 20, solution = 1) to find cell clusters and further reduce the dimensionality by the UMAP method. After finding marker genes the automatic cell annotation R package, signleR (version 2.0.0) is used to annotate the cell type.
Screening for PANoptosis-related key genes
To identify key prognostic genes correlated with PANoptosis in HCC, weighted gene coexpression network analysis (WGCNA) was used to construct key modules based on RNA-seq data of 374 tumor samples and 50 normal samples from the TCGA cohort. First, a suitable power exponent was employed to construct the weighted gene network. Hierarchical clustering analysis was performed. Then, the branches of the clustering tree and colors indicated the different gene modules. Furthermore, we calculated the correlation between gene modules and PANscores and identified a module associated with PANscores. The module with the strongest positive correlation with PANscores was selected for subsequent analysis. Key genes were identified by the intersection of module genes with PANRGs.
Expression of PLK1 in tumors and adjacent normal tissues was detected using IHC. PLK1 rabbit anti-human antibody (Cell Signaling Technologies, Danvers, Massachusetts, USA) was employed. The dilution concentration was 1:500, and all sections were independently interpreted by two pathologists who kept clinical information confidential. All samples were routinely fixed, paraffinembedded, serially sectioned, and immunohistochemically stained. Immunohistochemical staining was scored using the H-Score method [23]. Immunohistochemical staining kits (Beijing Bioson Biotechnology Company, Beijing, China) are used according to the instructions. After the staining was completed in the tissue microarray scanner for automatic scanning, the software automatically scored each tissue staining with a scale of H-Score.
Total RNA extraction and qRT‒PCR
The human normal hepatocyte line LO2 and HCC cell lines HepG2 and HL-7721 were cultured in Dulbecco’s modified Eagle’s medium (DMEM, Gibco BRL, USA) containing 10% fetal bovine serum (FBS, zeta life, USA) in a 5% CO2 incubator at 37°C. Total cellular RNA was extracted using TRIpure (Aidlab, Beijing, CN). The procedure was performed according to the manufacturer’s instructions. Total RNA was extracted from liver tissue and hepatocyte lines with TRIZOL (TIANGEN, Beijing, CN) reagent. NanoDrop-2000 (Thermo Fisher Scientific, Waltham, MA, USA) was used to assess the RNA quality and concentration. cDNA was then obtained by reverse transcription with a cDNA Synthesis Kit (Thermo Fisher Scientific, Waltham, MA, USA), and qRT-PCR (TIANGEN, FP205, GER) was used for analysis. Finally, the mRNA expression was normalized with the GAPDH gene. The specificity of the qRT-PCR products was evaluated by observing whether the melting curve was a single peak. Three replicate wells were set up for each reaction, and those with Cq values not exceeding 0.5 between replicate wells were used for data analysis, in which the mean Cq values were calculated.
Fluorescence microscopy to detect apoptosis, necroptosis, and pyroptosis
A YO-PRO-1 (YP1)- and propidium iodide (PI) cell death detection kit (C1075S, Beyotime, Jiangsu, China) was employed. LO2, HepG2 and 7721 cells were cultured on 6-well plates, and cells were stained after dilution with YP1 and PI reagents according to the instructions and incubated at 37°C for 20 min protected from light. The labeled cells were observed under a fluorescence microscope: YP1-positive cells (green) underwent apoptosis or necrosis, and PI-positive cells (red) underwent necroptosis, pyroptosis or ferroptosis.
Pan-cancer analysis of the effect of key PANRGs on cell growth
To perform the analysis, the DepMap homepage (https://depmap.org/portal) was logged into, the key gene name was inputted, “CRISPR (DepMap 22Q2 Public)” was selected for the dataset, the results were downloaded, and the image was processed with Adobe Illustrator CC 2019.
Effect of key gene knockdown on the growth of hepatocellular carcinoma cells
Behan and his team published CRISPR‒Cas9 library screening data [24] (https://score.depmap.sanger.ac.uk/downloads). The Uniform Resource Locator (URL) was opened, and the “Download” option was clicked to download the data “broad_essentiality_matrices_190724.zip190724.zip”. Liver cancer cell lines were se-lected, and the effects of four key PANRGs on the growth of various cell lines were an-alyzed and plotted using GraphPad Prism 8.0. Hepatocellular carcinoma cell lines were selected, and the effect of key PANRG knockdown on the growth of hepatocellular carcinoma cells was analyzed using GraphPad Prism 8.0.2 Plot.
All statistical analyses were performed in R 4.2.1 and GraphPad Prism 8.0.2. For samples that followed a normal distribution, Student’s t-test was used to compare differences in gene expression between different hepatocyte lines or different liver tissues. Groups of variables that did not follow a normal distribution were analyzed using a nonparametric test. p < 0.05 indicates statistical significance (two-sided).
Identification of differentially expressed prognostic PANoptosis genes
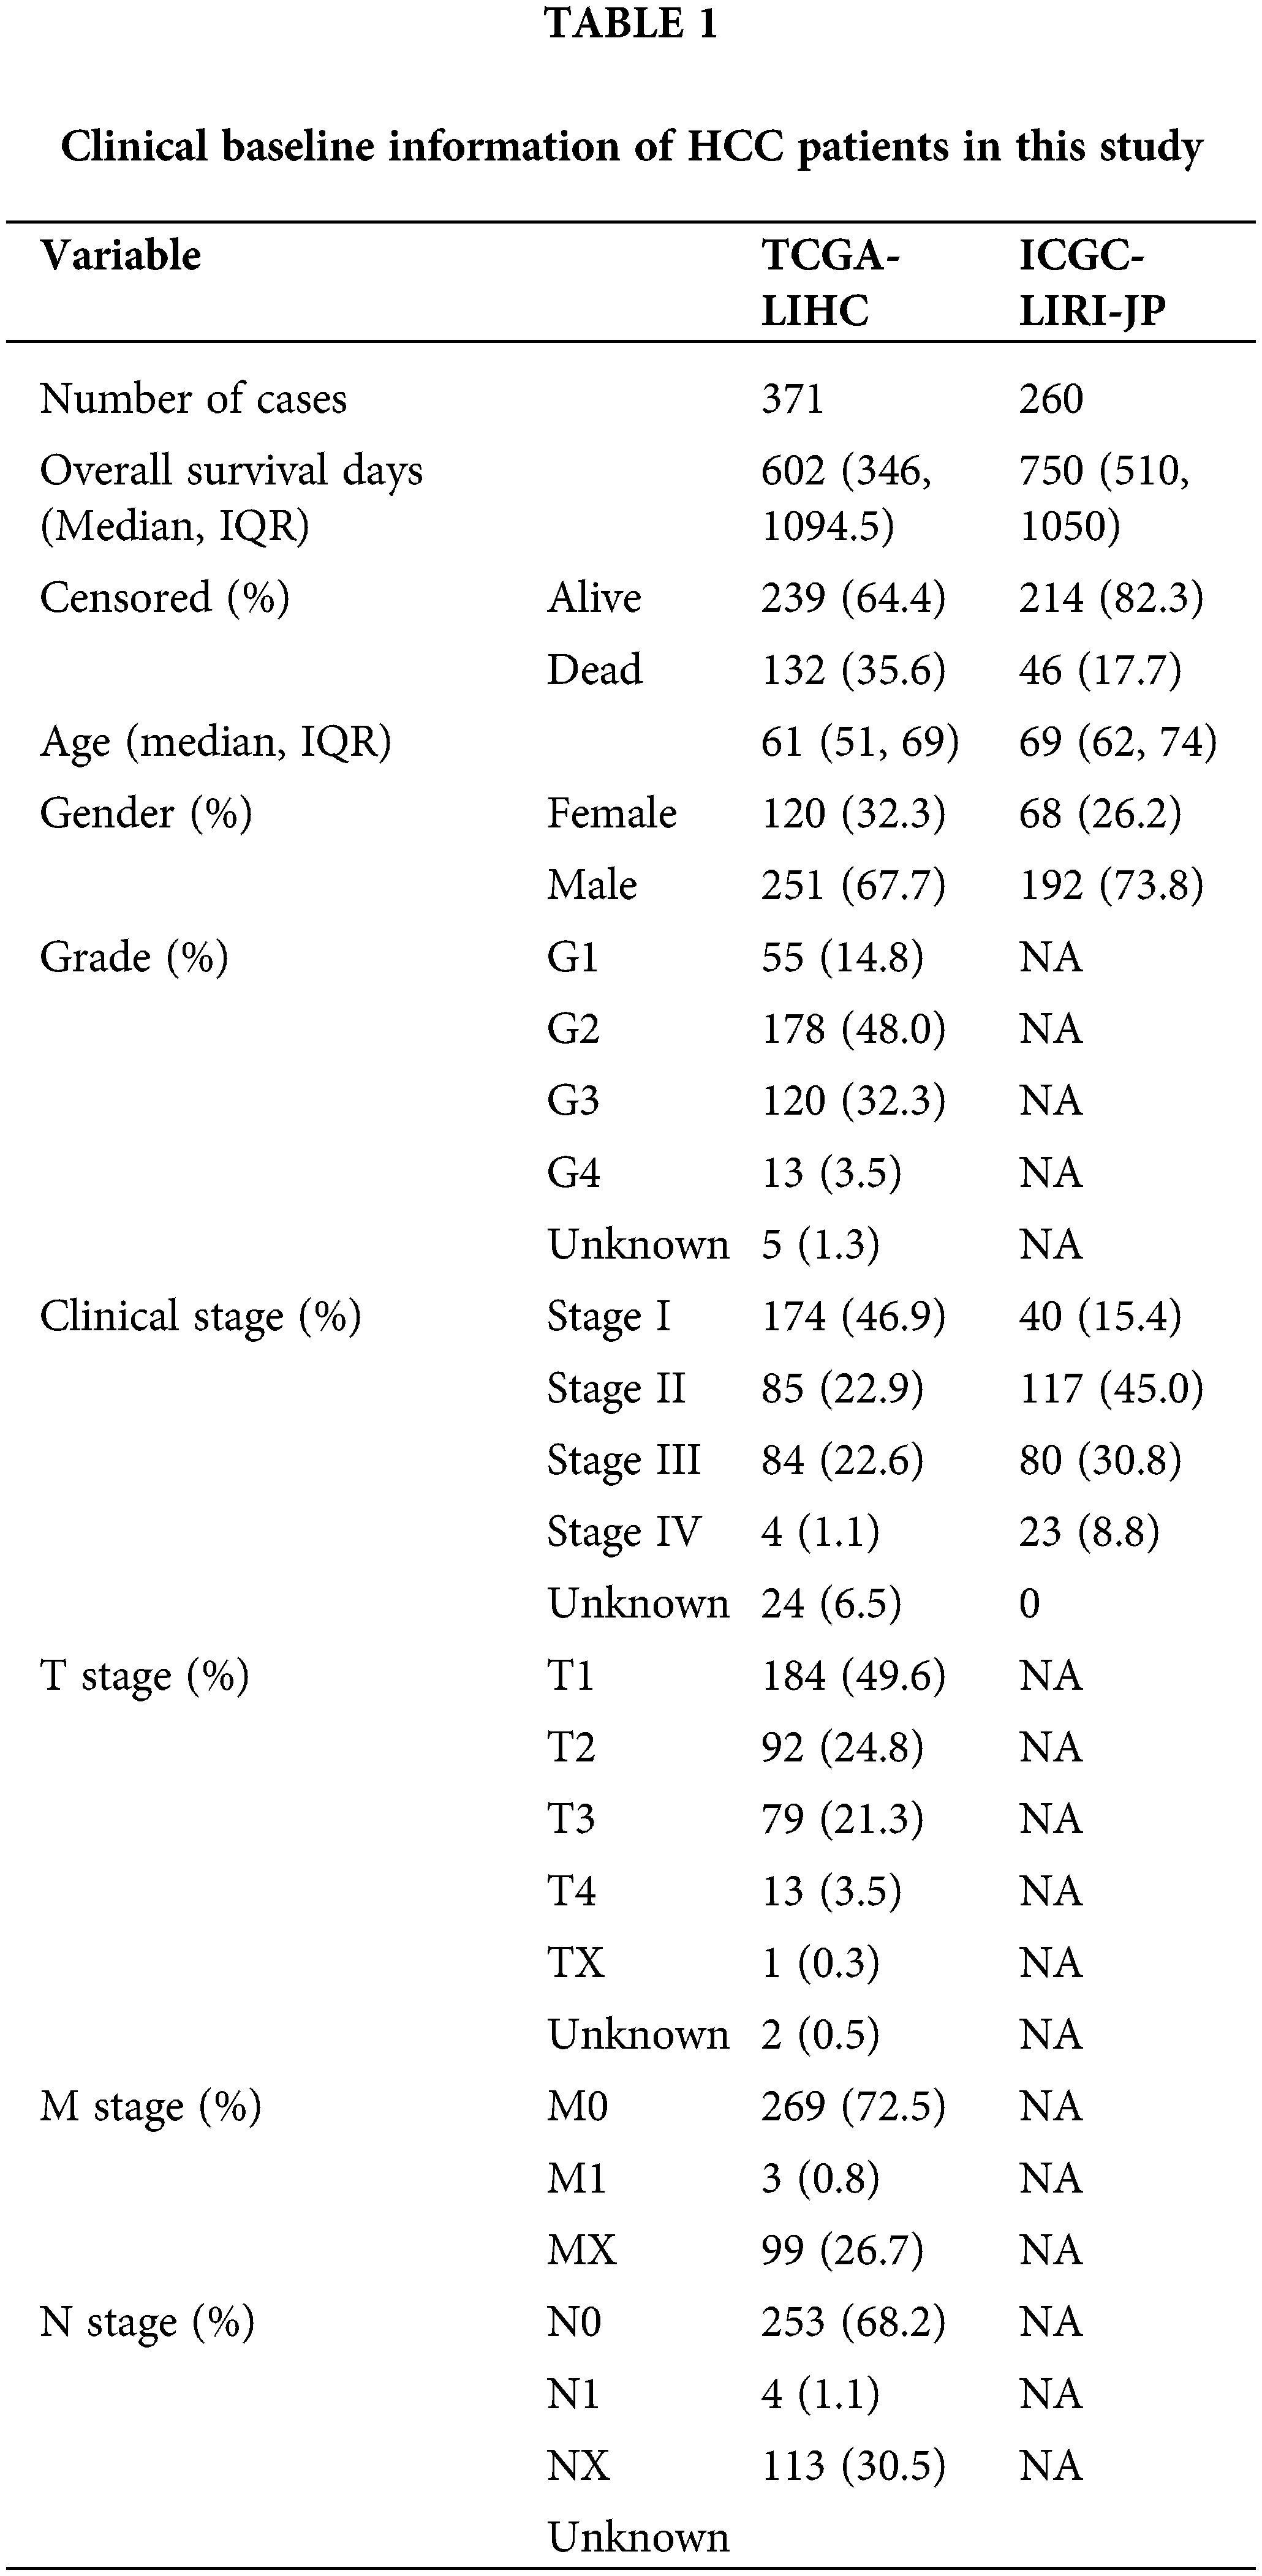
The overall workflow of our work is presented in Fig. 1A. In this study, 374 HCC patients from the TCGA-LIHC cohort and 243 HCC patients from the ICGC-LIRI-JP cohort were included. The clinical characteristics of these HCC patients are summarized in Table 1.
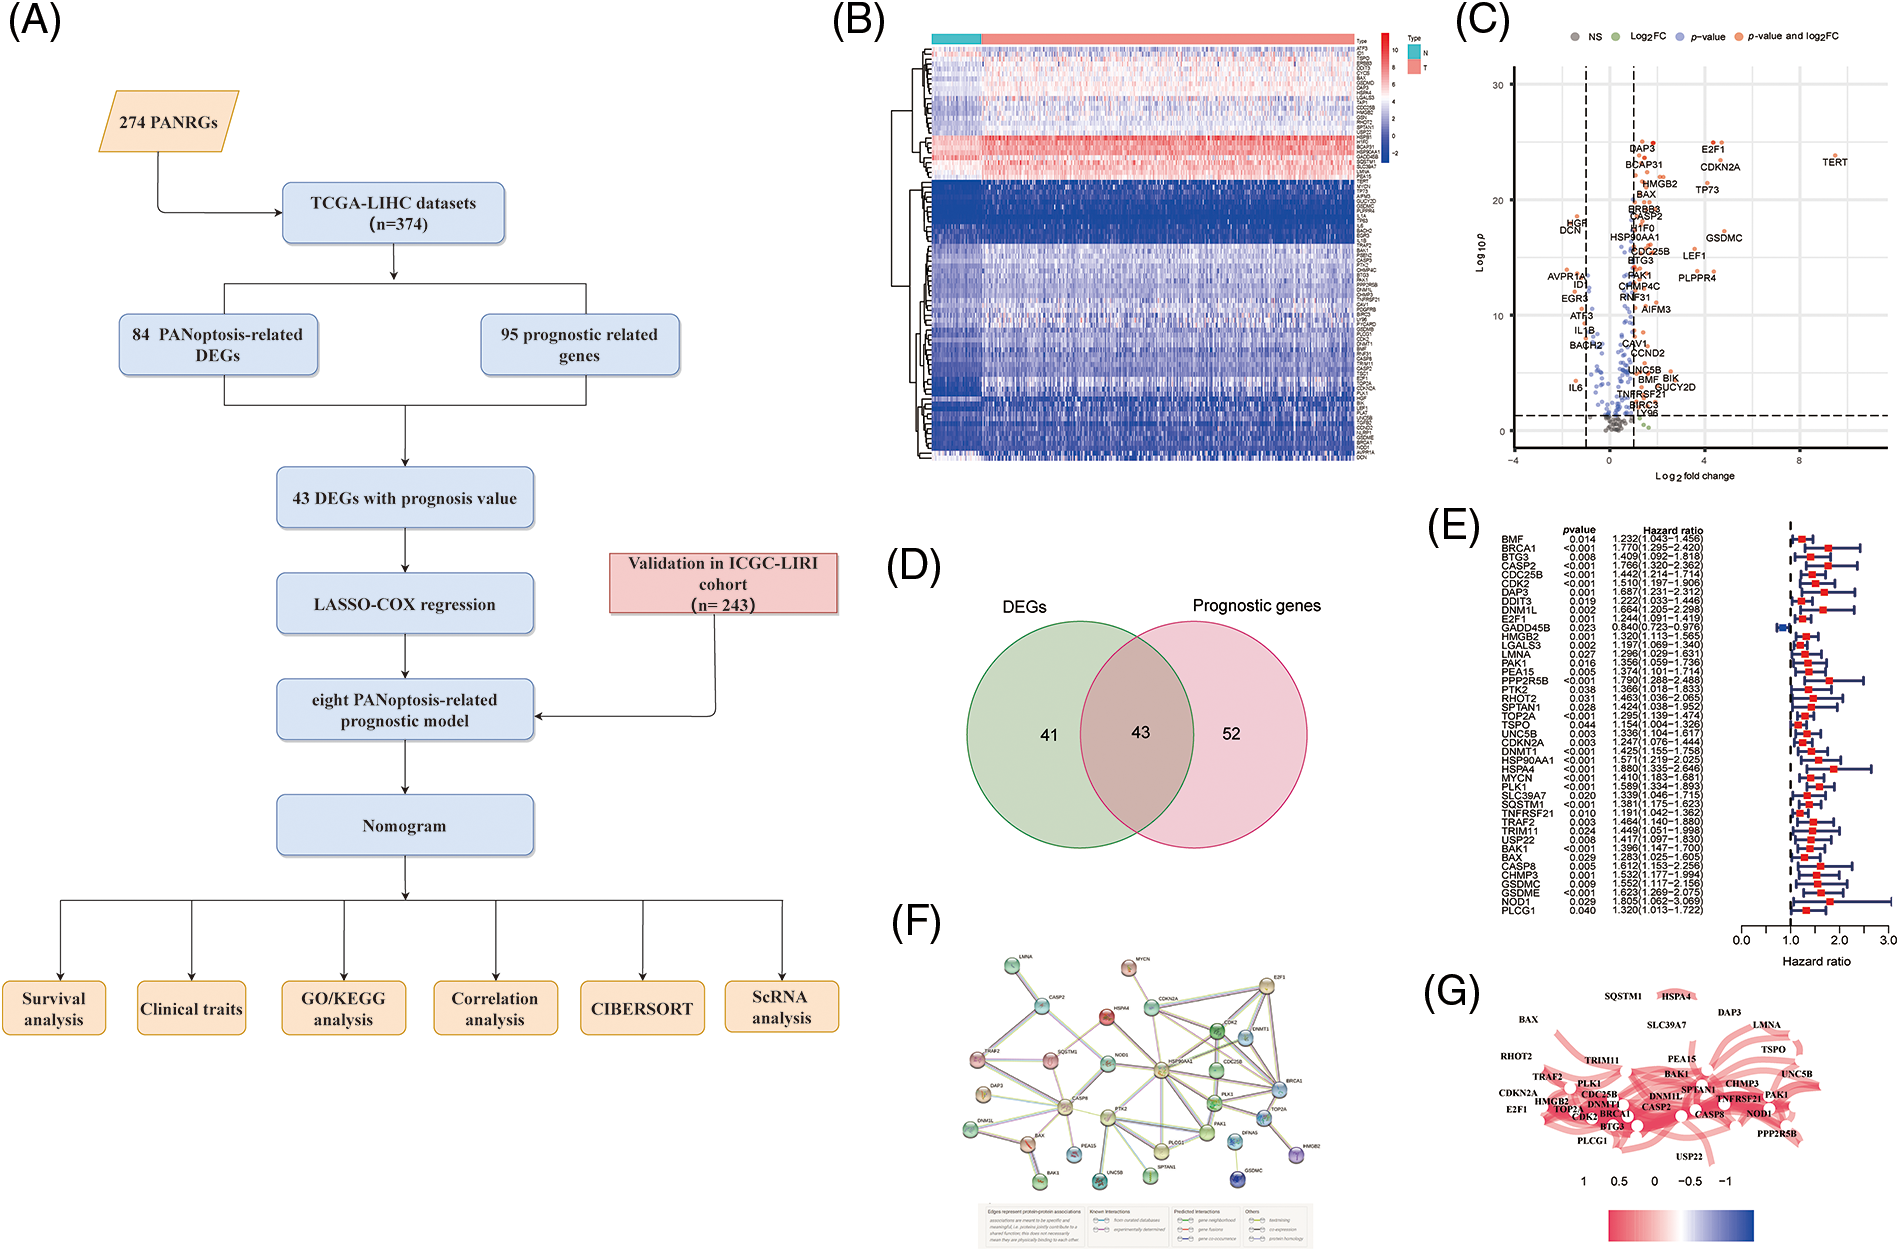
Figure 1: Screening PANRGs of HCC patients from TCGA database. (A) Flow chart of this study. (B) Heatmap of differential expression of PANRGs between normal and tumor groups. (C) Vol-cano plot of differentially expressed PANRGs. (D) Venn diagram identifies prognostic differences between tumor and adjacent normal tissue. (E) Univariate COX regression analysis of forest plots between PANRGs and OS. (F) A correlation network of 43 prognostic-related differentially ex-pressed genes. (G) Protein-protein interaction networks (PPI) interactions between progno-sis-related differentially expressed PANRGs.
We enrolled 274 PANoptosis genes, including 156 apoptosis, 65 necroptosis and 53 pyroptosis genes, and 84 differentially expressed PANoptosis genes between tumor samples and noncancer samples were obtained (Figs. 1B and 1C). Subsequently, Univariate Cox regression analysis (p < 0.05) was employed to identify the 95 PANoptosis genes associated with prognosis in HCC patients. After overlapping differentially expressed genes and prognosis-related genes, 43 PANRGs were ultimately obtained for follow-up analysis (Figs. 1D and 1E). Except for GADD45B, the remaining 42 genes were defined as deleterious effect genes with all-hazard ratio (HR) values of >1. The interaction network and correlation network between these PANRGs are shown in Figs. 1F and 1G.
Establishment of the eight-gene model based on PANRGs
To better predict the clinical outcomes of HCC, LASSO-penalized Cox analysis was conducted to further narrow down the mRNA expression profile based on the optimal value of λ (Figs. 2A and 2B). This algorithm compresses the coefficients of some less important variables to zero and keeps the coefficients of important variables greater than zero to reduce the number of covariates in the Cox regression. Finally, 8 genes were identified to construct PANoptosis risk prognostic models. The PANscore for each HCC patient was calculated as follows:
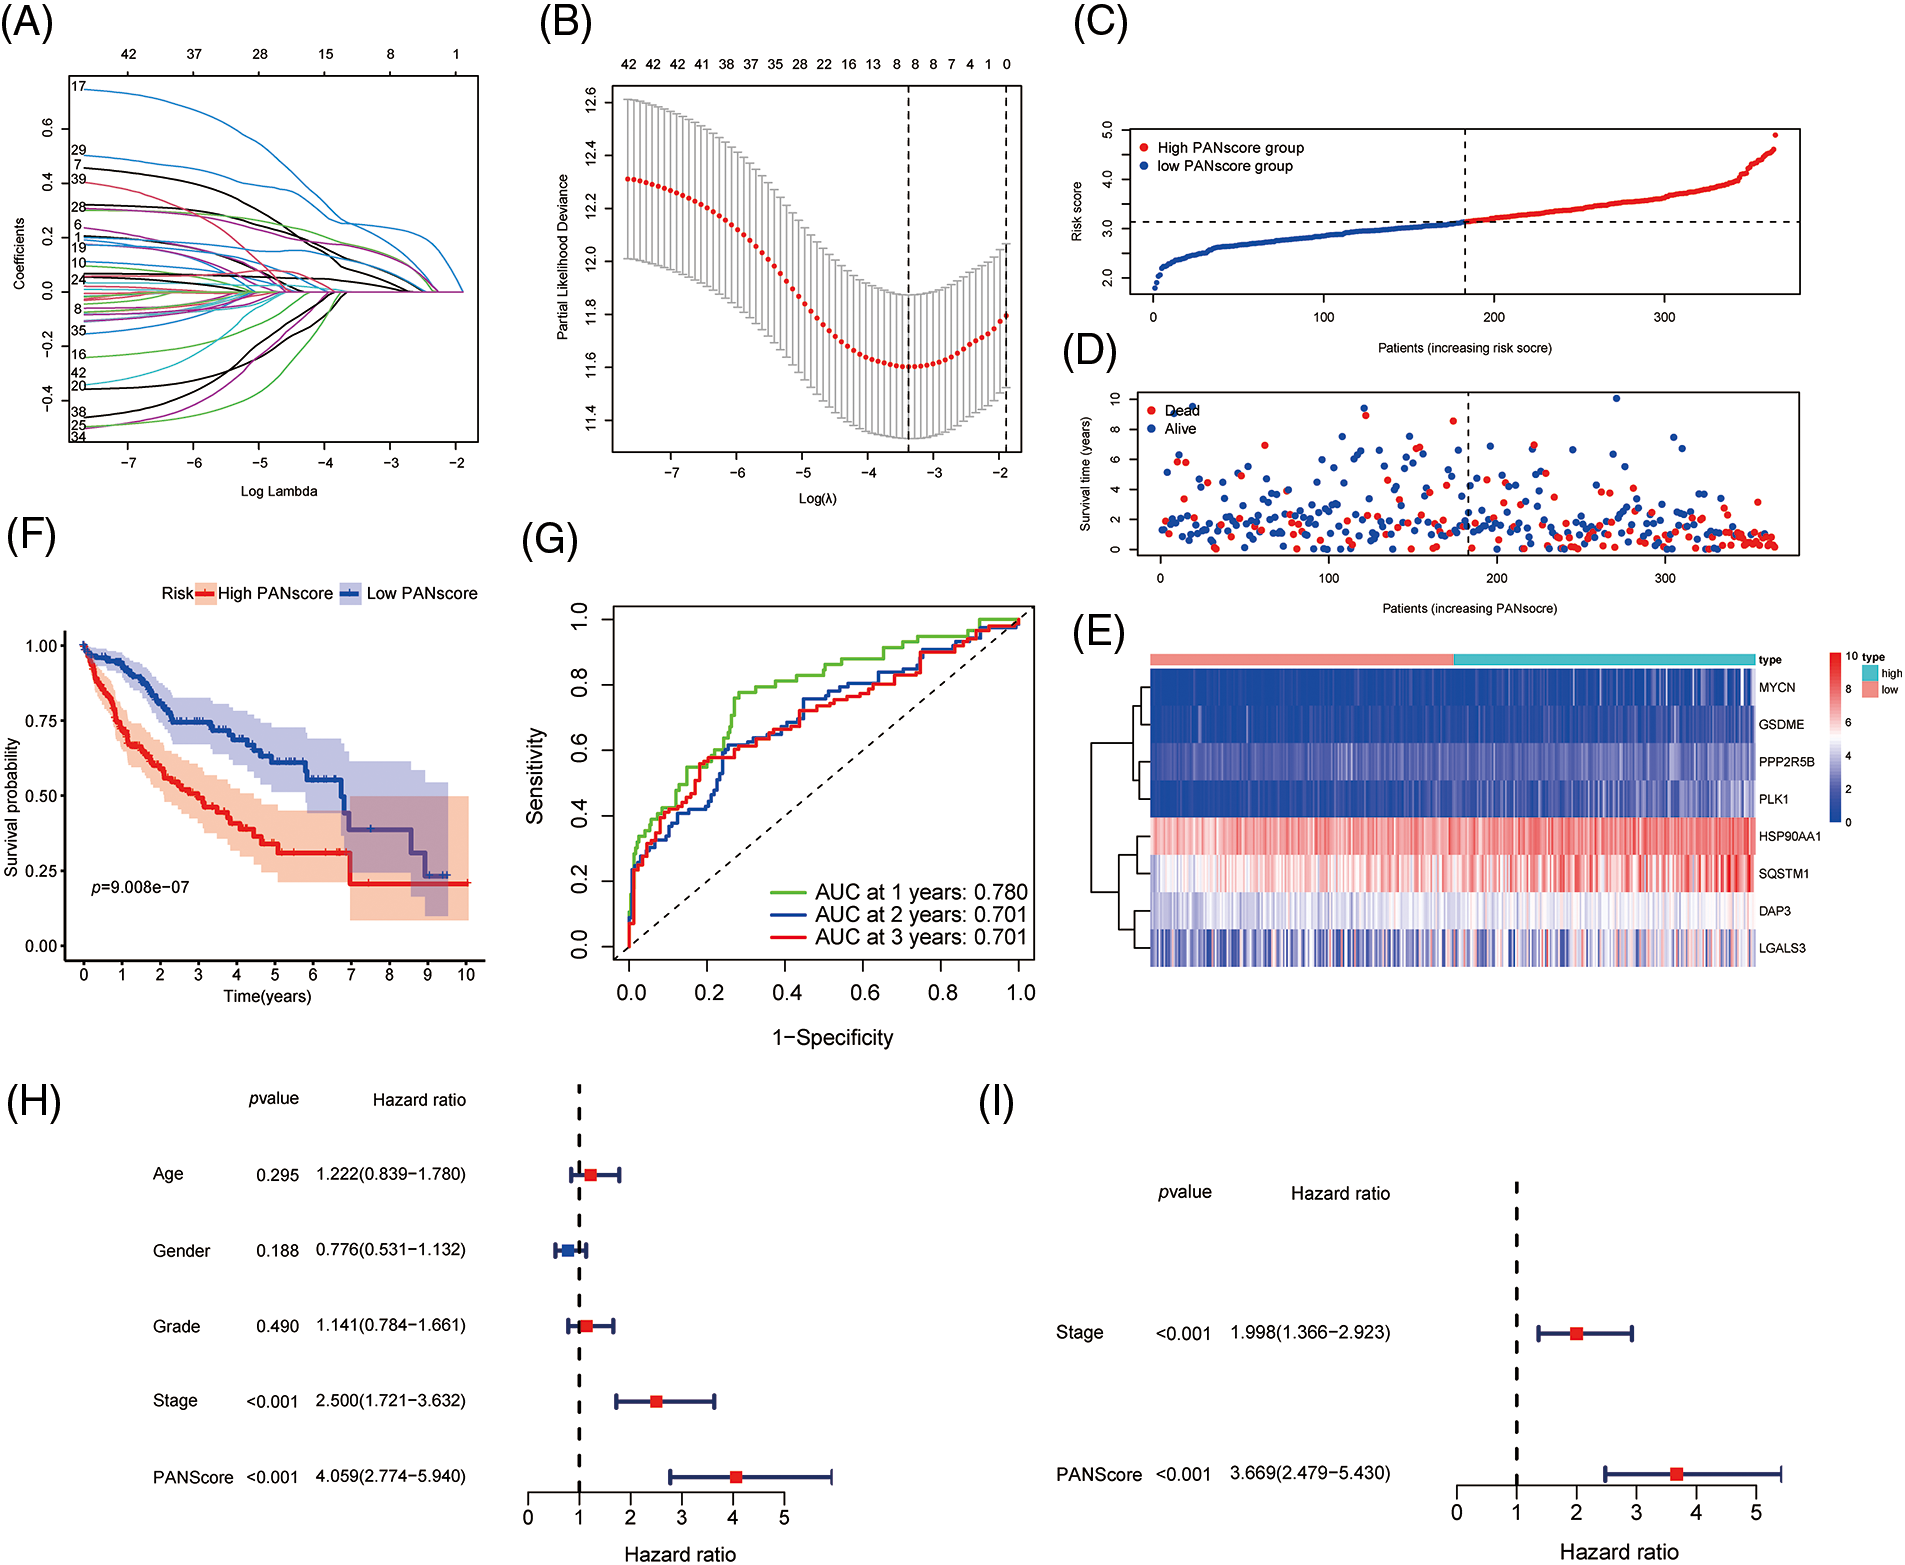
Figure 2: Development of PANoptosis-related prognostic models of HCC patients in TCGA co-hort. (A, B) The LASSO coefficient profiles and the penalty plots of the model for 43 prognostic genes. (C–E) Distribution of PANscore, survival status of HCC patients, and expression of eight risk genes related to PANoptosis. (F) Kaplan-Meier curves for OS of patients in the high PANscore and low PANscore groups. (G) The AUC of time-dependent ROC curves evaluates the predictive performance of PANscore. (H, I) Results of univariate and multivariate COX regression analysis of OS to evaluate the independence of PANscore.
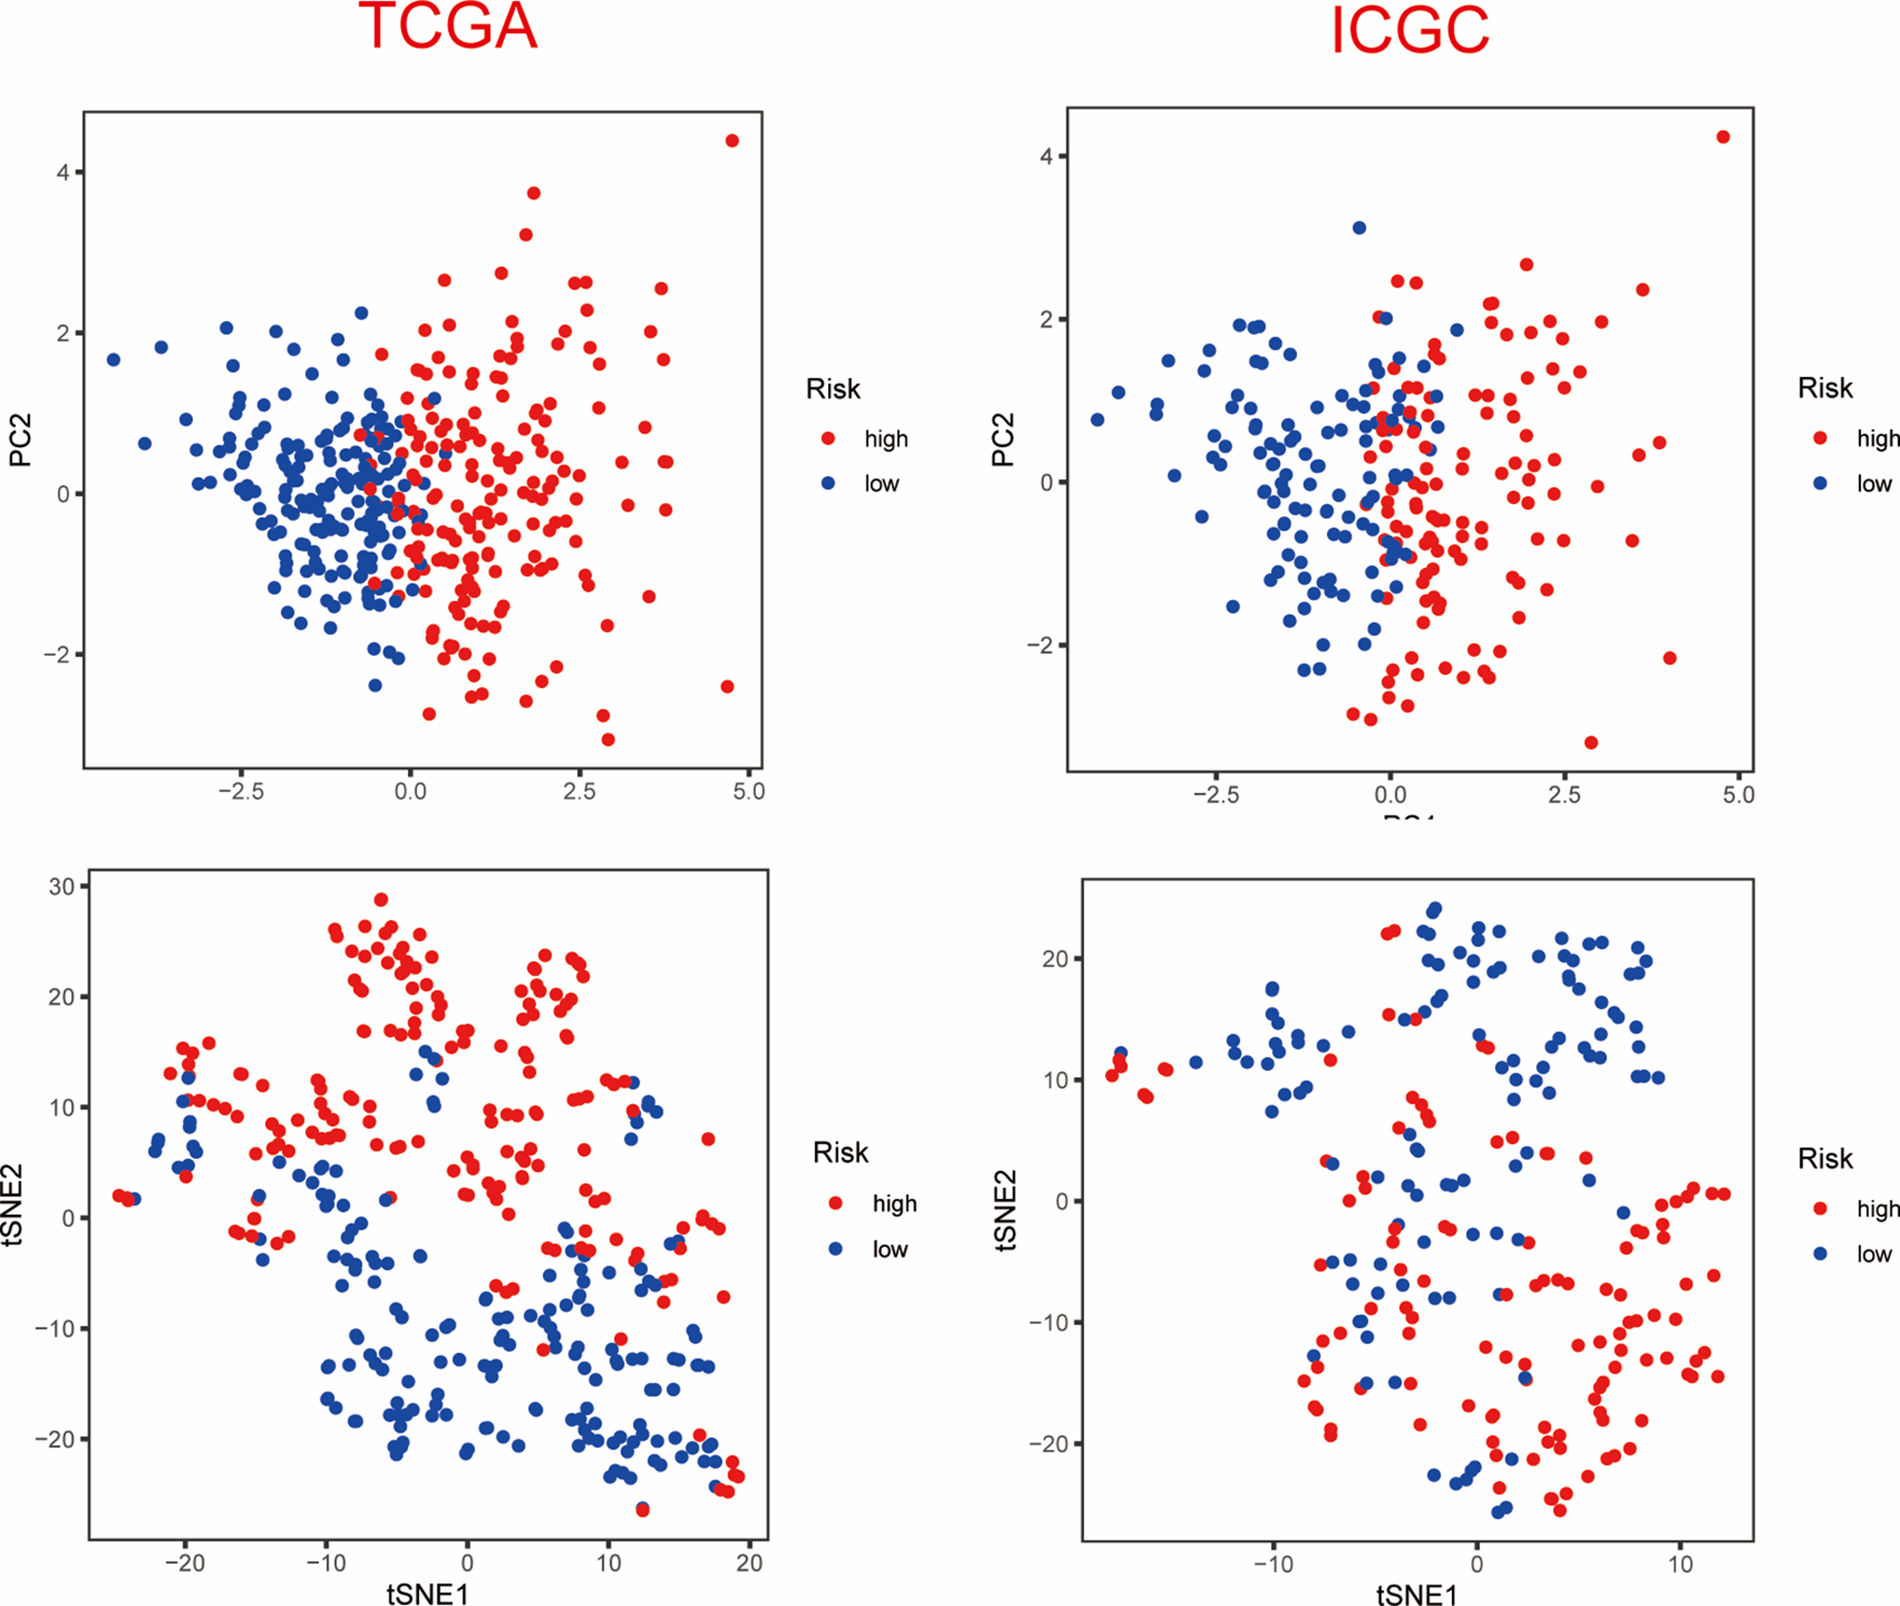
Based on the median value of the PANscore, HCC patients were divided into a high PANscore (n = 182) group and a low PANscore (n = 183) group (Figs. 2C–2E). Then, PCA and t-SNE analysis indicate that the samples in the high PANscore and low PANscore groups could be well distinguished (Suppl. Fig. 1). Moreover, the high PANscore group had a lower survival time and a higher probability of death. In addition, a heatmap of the 8 prognosis-related genes between the high- and low-PANscore groups is shown in Figs. 2C–2E. Survival analysis of the TCGA cohort demonstrated worse OS outcomes in the high PANscore group, and the predictive performance of the PANscore was assessed using a time-dependent ROC curve, the area under the curve (AUC) at 1-, 2-, and 3-year was up to 0.781, 0.701, and 0.701 (Figs. 2F and 2G). In addition, multivariate Cox regression analysis was performed for all variables that were significant in the univariate Cox regression analysis (p < 0.05) (age, sex, stage, and PANscore) of 350 HCC patients and to determine whether PANscores were independent prognostic predictors of OS. In the univariate and multivariate Cox analyses, stage and PANscore were the independent predictors of OS, and the PANscore significantly correlated with OS and had a high hazard ratio (HR) value (HR = 3.669, 95% CI = 2.497–5.430) (Figs. 2H and 2I).
Validation of the PANscore in the ICGC cohort
To validate the stability of the 8-gene model, the ICGC-LIRI-JP cohort was included as a validation cohort, to which a workflow similar to that of the training set was applied. The survival analysis revealed a statistically significant difference in the survival rates between the high- and low-PANscore groups (p < 0.001). In contrast, the overall survival in the high PANscore group was significantly worse than the low PANscore group (Fig. 3A). Moreover, the PANscore constructed in the TCGA cohort was used to calculate the area under the ROC curve (AUC), with values of 0.634, 0.681, and 0.655 for 1, 2, and 3 years, respectively (Fig. 3B). The distribution of risk scores and the associated survival status of individual patients with HCC are shown in Figs. 3C–3E. Similarly, in the ICGC cohort, 3 variables were independent prognostic predictors of OS, including sex, stage, and PANscore. PANscores are also significantly associated with HCC patient prognosis (p = 0.023, HR = 1.843, 95% CI = 1.087–3.127) (Figs. 3F and 3G). Therefore, the PANscore demonstrated favorable predictive ability in the TCGA and ICGC cohorts, and the PANscore based on PANRGs would be considered an independent predictor of OS for HCC patients.
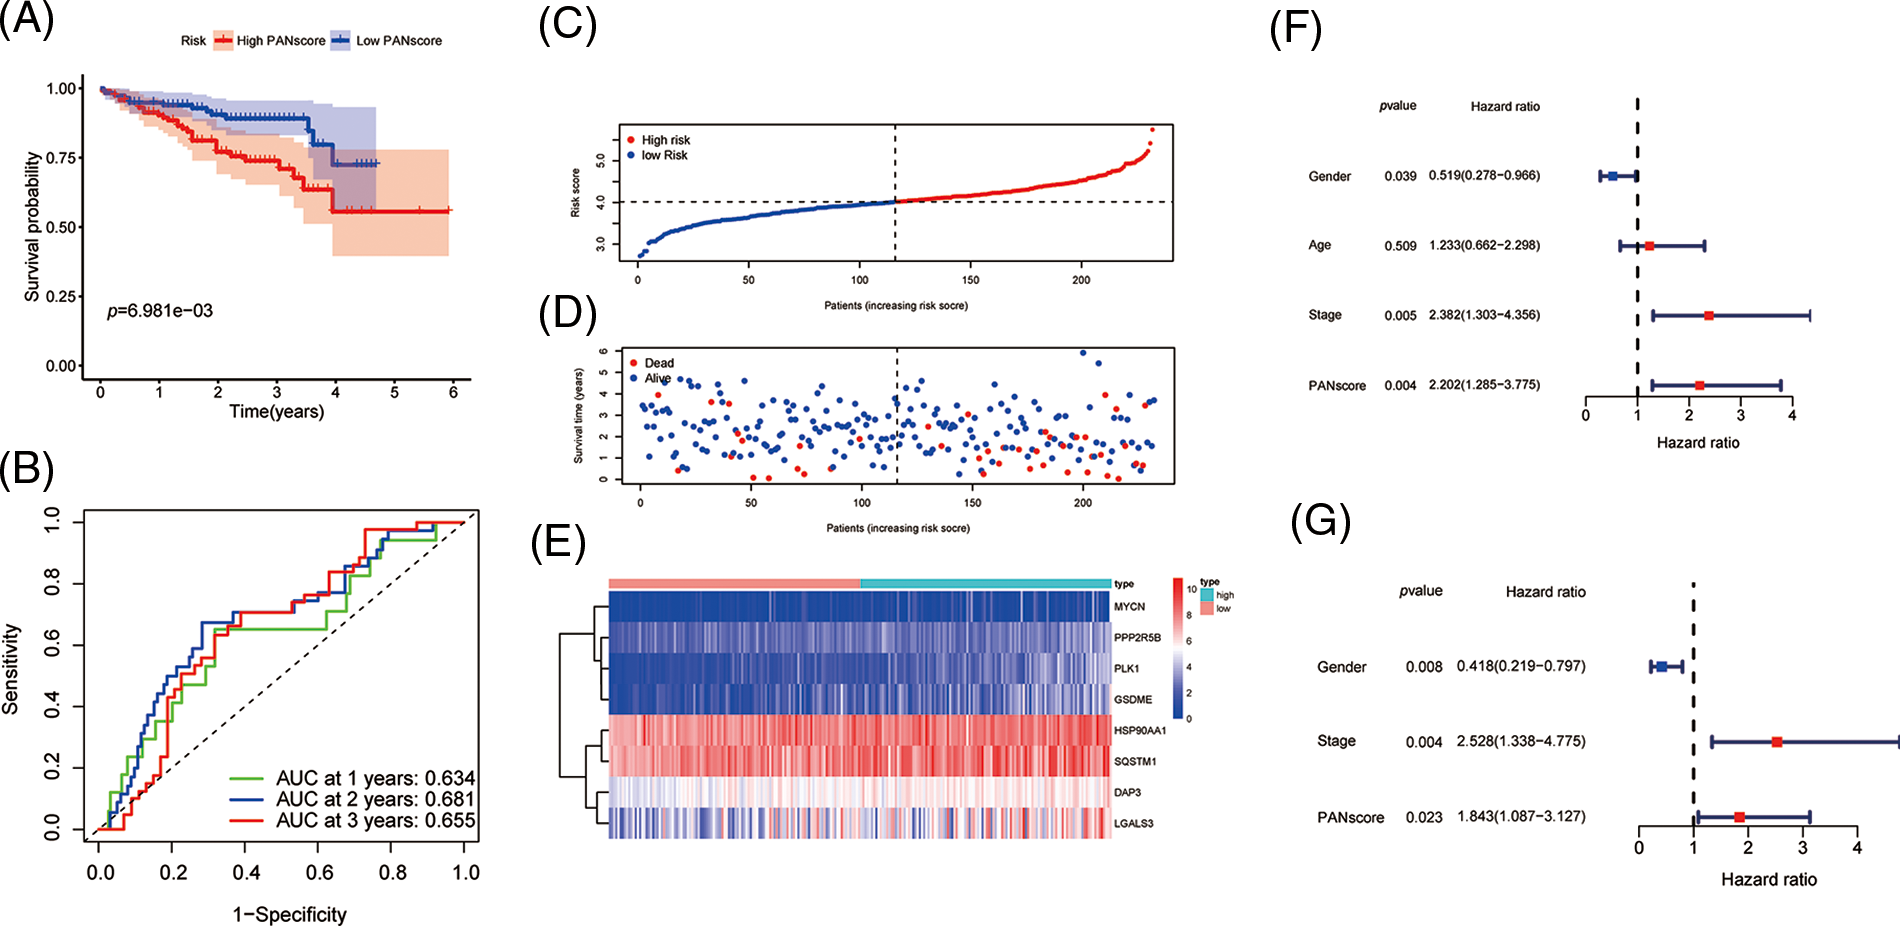
Figure 3: External validation of PANscore prediction performance based on ICGC cohort. (A) Kaplan-Meier curves in the high PANscore and low PANscore groups. (B) ROC curves to assess the predictive efficiency of PANscore in the ICGC cohort. (C–E) PANscore distribution, survival status, and heatmap of expression of 8 risk genes related to PANoptosis. (F, G) Forest plots of univariate and multivariate COX regression analysis results.
Functional enrichment analysis and tumor immune cell infiltration
To further explore the biological function of PANoptosis, we performed GSEA to find the GO and KEGG pathways enriched in differentially expressed genes with a threshold of 0.05.
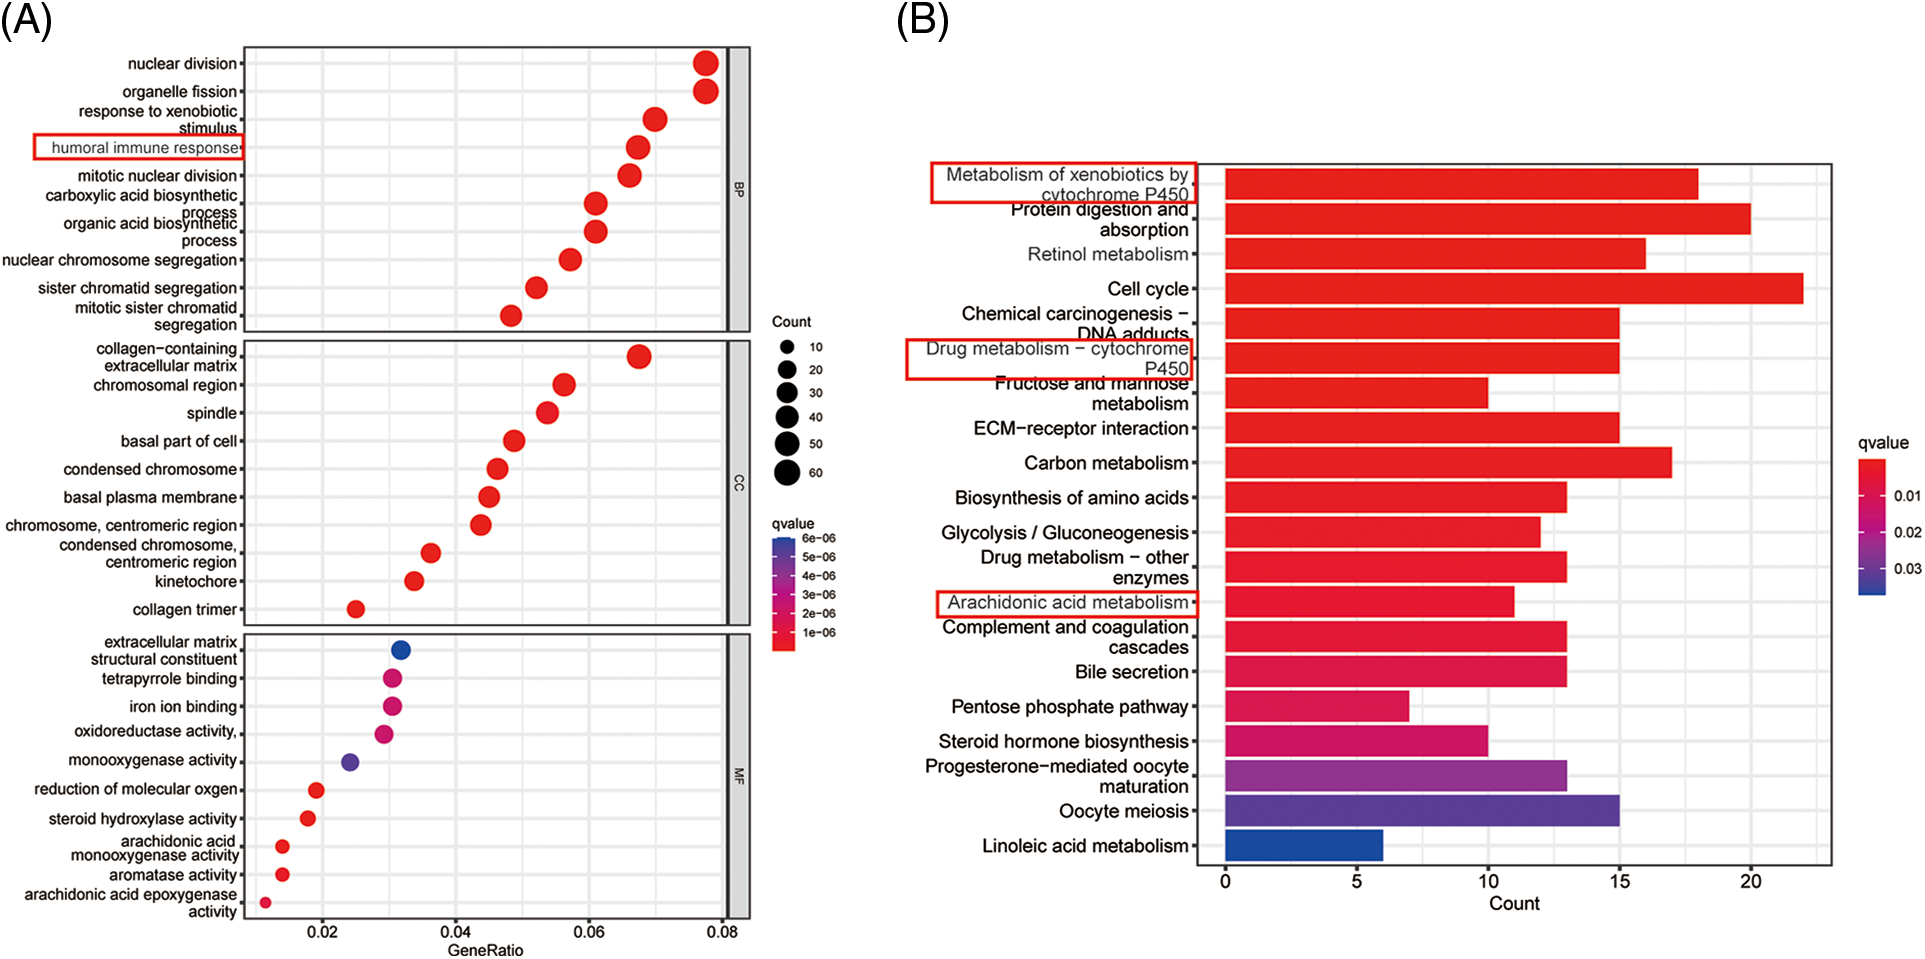
The GO is designed to find out in which GO terms differentially expressed genes are mainly enriched, molecular to biological processes, divided into three categories: molecular function (MF), cellular component (CC), biological process (BP). Many GO terms are associated with the immune system, immunoglobulin-mediated immune responses and complement activationd and other immune-related classical pathways and upregulated for biological functions. We thus further explored the impact of tumor immune cell composition and distribution on the immune status of HCC tumors (Fig. 4A). In the TCGA cohort, three types of immunocytes, including activated NK cells and M0 macrophage cells, the abundance of immune cell infiltration was significantly higher in the low PANscore group (Fig. 4B). Likewise, the expression of macrophage M0 cells was significantly higher in the low PANscore group in the ICGC cohort (Suppl. Fig. 2A). Furthermore, the KEGG pathway analysis of DEGs highlighted several metabolic pathways related to nutrition, cell cycle pathways, and cancer-related pathways (Fig. 4C). GO, and KEGG results were all validated in the ICGC cohort (Suppl. Figs. 2B and 2C). Because PANoptosis is associated with many metabolic pathways, the relationship between the eight PANRGs constructing the PANscore and 336 metabolism-related genes was analyzed (Fig. 4D). Pearson correlation analysis showed that most metabolism-related genes were associated with PANRGs, including positive and negative correlations (|r| ≥ 0.2, p < 0.05).

Figure 4: Enrichment analysis of PANscore-related DEGs. (A, C) GO enrichment and KEGG pathway in the TCGA cohort. (B, E) Violin plots of immune cell infiltration in the high PANscore and low PANscore groups in the ICGC dataset. (C) The violin plot of immune cell infiltration between the high PANscore and low PANscore groups. (D) Heatmap indicating the correlation between eight PRGs and metabolism-related genes. (E) Violin plots of immune cell infiltration in the high PANscore and low PANscore groups in the ICGC dataset. (F, H) Comparison of ssGSEA scores for different PANscore groups in TCGA cohort and ICGC cohort, box plot showing the scores of 16 immune cells. (G, I) ssGSEA scores of 13 immune-related functions in different PANscore groups in TCGA cohort and ICGC cohort. Adjusted p values are expressed as: ns, not significant *p < 0.05; **p < 0.01; ***p < 0.001.
Identification and validation of hub genes
To further analyze the hub genes in the PANoptosis model, the WGCNA method was chosen to construct key modules based on TCGA-seq data. We selected the optimal power value of 8 (Fig. 5A) to construct a scale-free coexpression network. A hierarchical clustering analysis of all samples was performed, and the results are shown in Fig. 5B. The correlation between gene modules and PANscores was calculated, and 15 gene modules associated with PANscore were identified. The blue module with the strongest positive correlation with the PANscore (coefficient = 0.63, p < 0.001) was selected (Figs. 5C and 5D). In the blue module, 8 PANRGs were overlapped. Finally, GSDME, PLK1, DAP3, and PPP2R5B were identified as the key PANRGs. Subsequently, Survival analysis based on RNA expression showed that DAP3, GSDME, PLK1, and PPP2R5B expression at the protein level and RNA level was associated with poor prognosis (both p < 0.05) (Figs. 5E–5H).
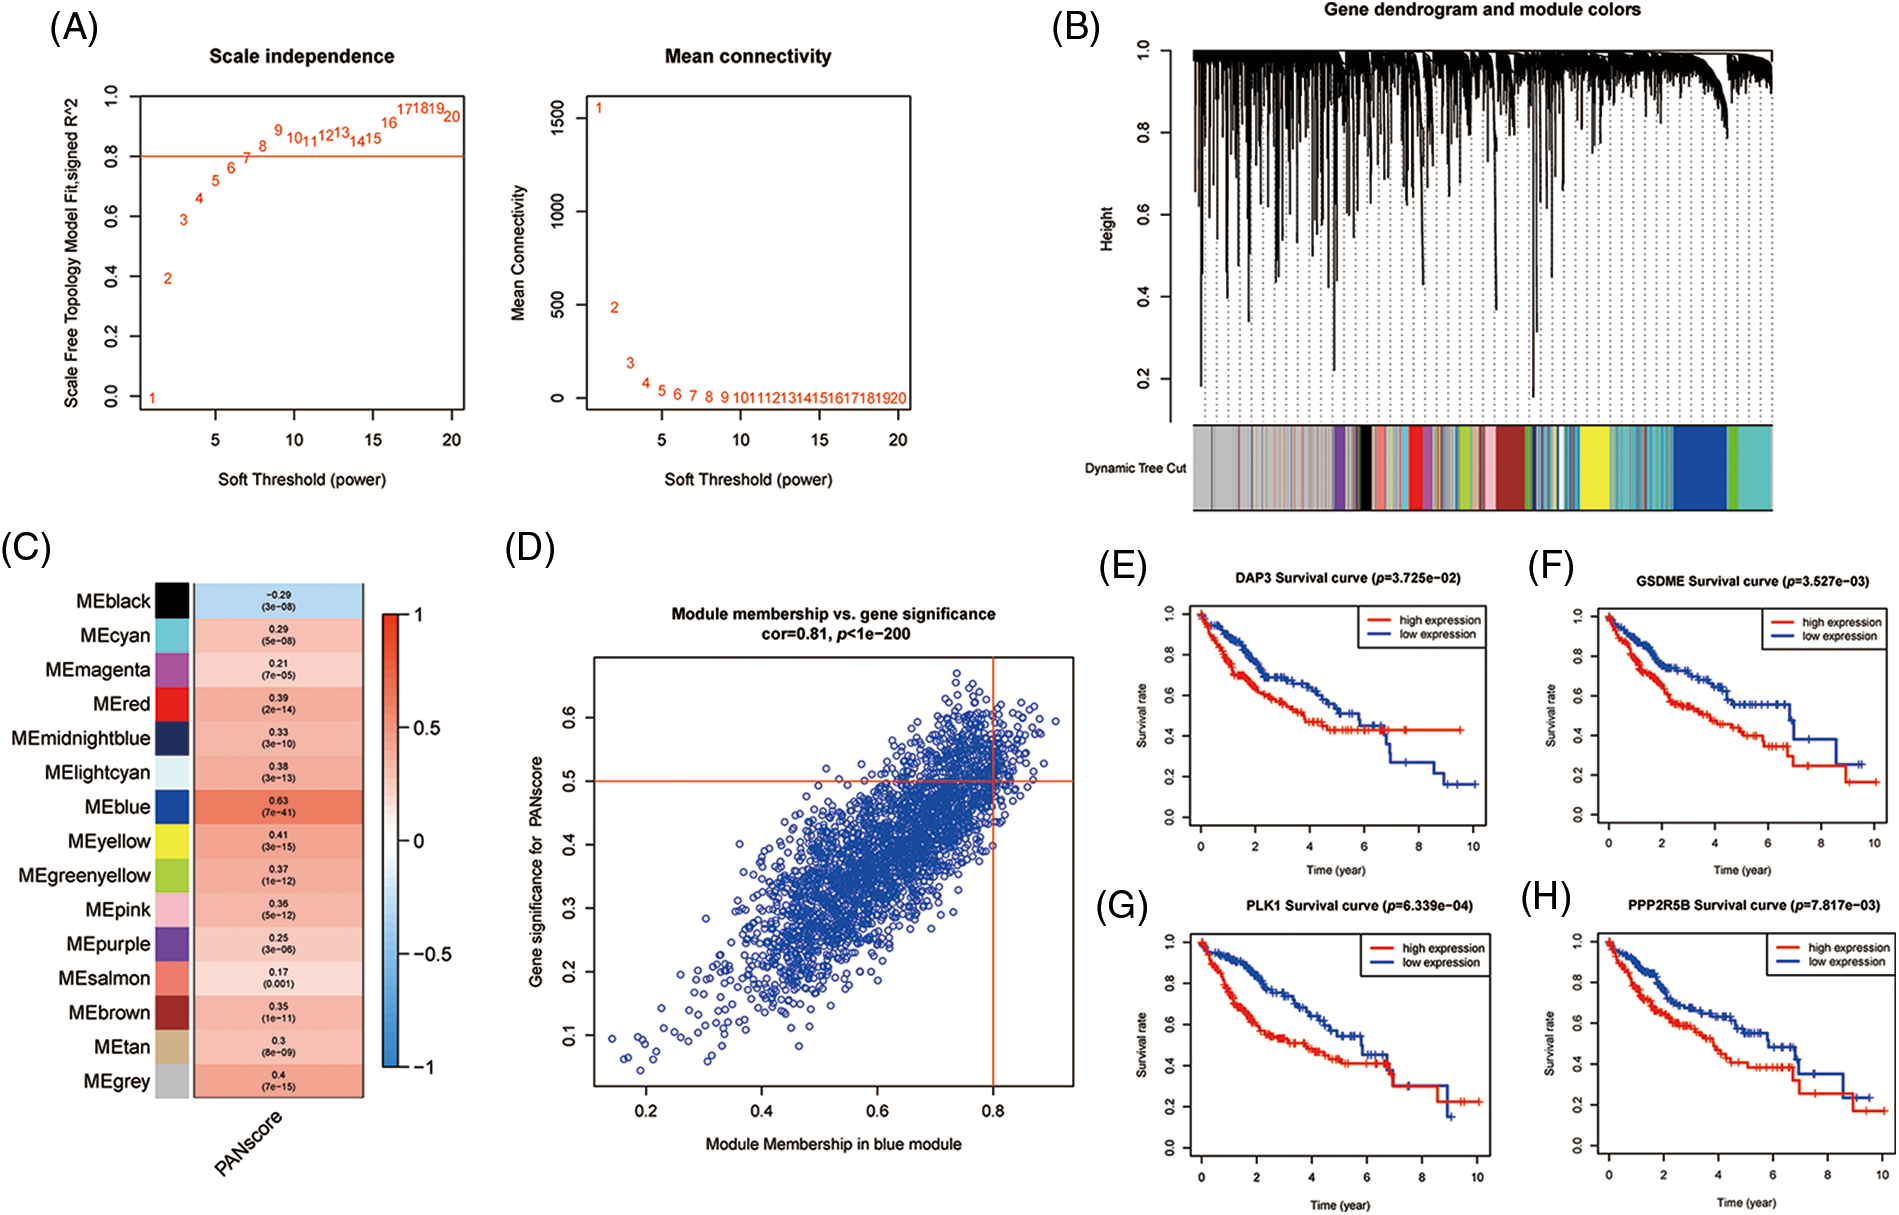
Figure 5: The WGCNA screening for PANoptosis-related hub genes. (A) Choose a suitable power index and construct a scale-free co-expression network. (B) The branches of the tree diagram correspond to the different gene modules. (C) The correlation coefficients and corresponding p-values of each gene module with PANscore are in the boxes. (D) Scatterplot of correlation between the blue module and PANoptosis gene module. (E–H) Kaplan-Meier curves for 4 hub genes.
Association between the key genes and immune infiltration
To evaluate the expression levels of the eight genes constructed on the PANscore at the single-cell level, scRNA-Seq data from CNSA-CNP0000650 were obtained. A total of 16,498 single cells from primary- and early relapse-seq samples were assigned to single cells based on surface markers of cell types. Single cells overview of primary and early relapsed HCC samples are shown in Fig. 6A. The t-SNE method was used for the manual annotation of clusters, and we finally annotated 27 clusters corresponding to a total of 8 cell types (Fig. 6B) including malignant cells, T cells, myeloid cells, NK cells, B cells, endothelial cells, HSCs, and plasma cells. Multiple clusters can be annotated for the same cell type. Ultimately, we explored the expression of the 8 PANRGs in cell clusters, as shown in Fig. 6C. Notably, they were significantly higher in T cells, bone marrow cells, and malignant cells.
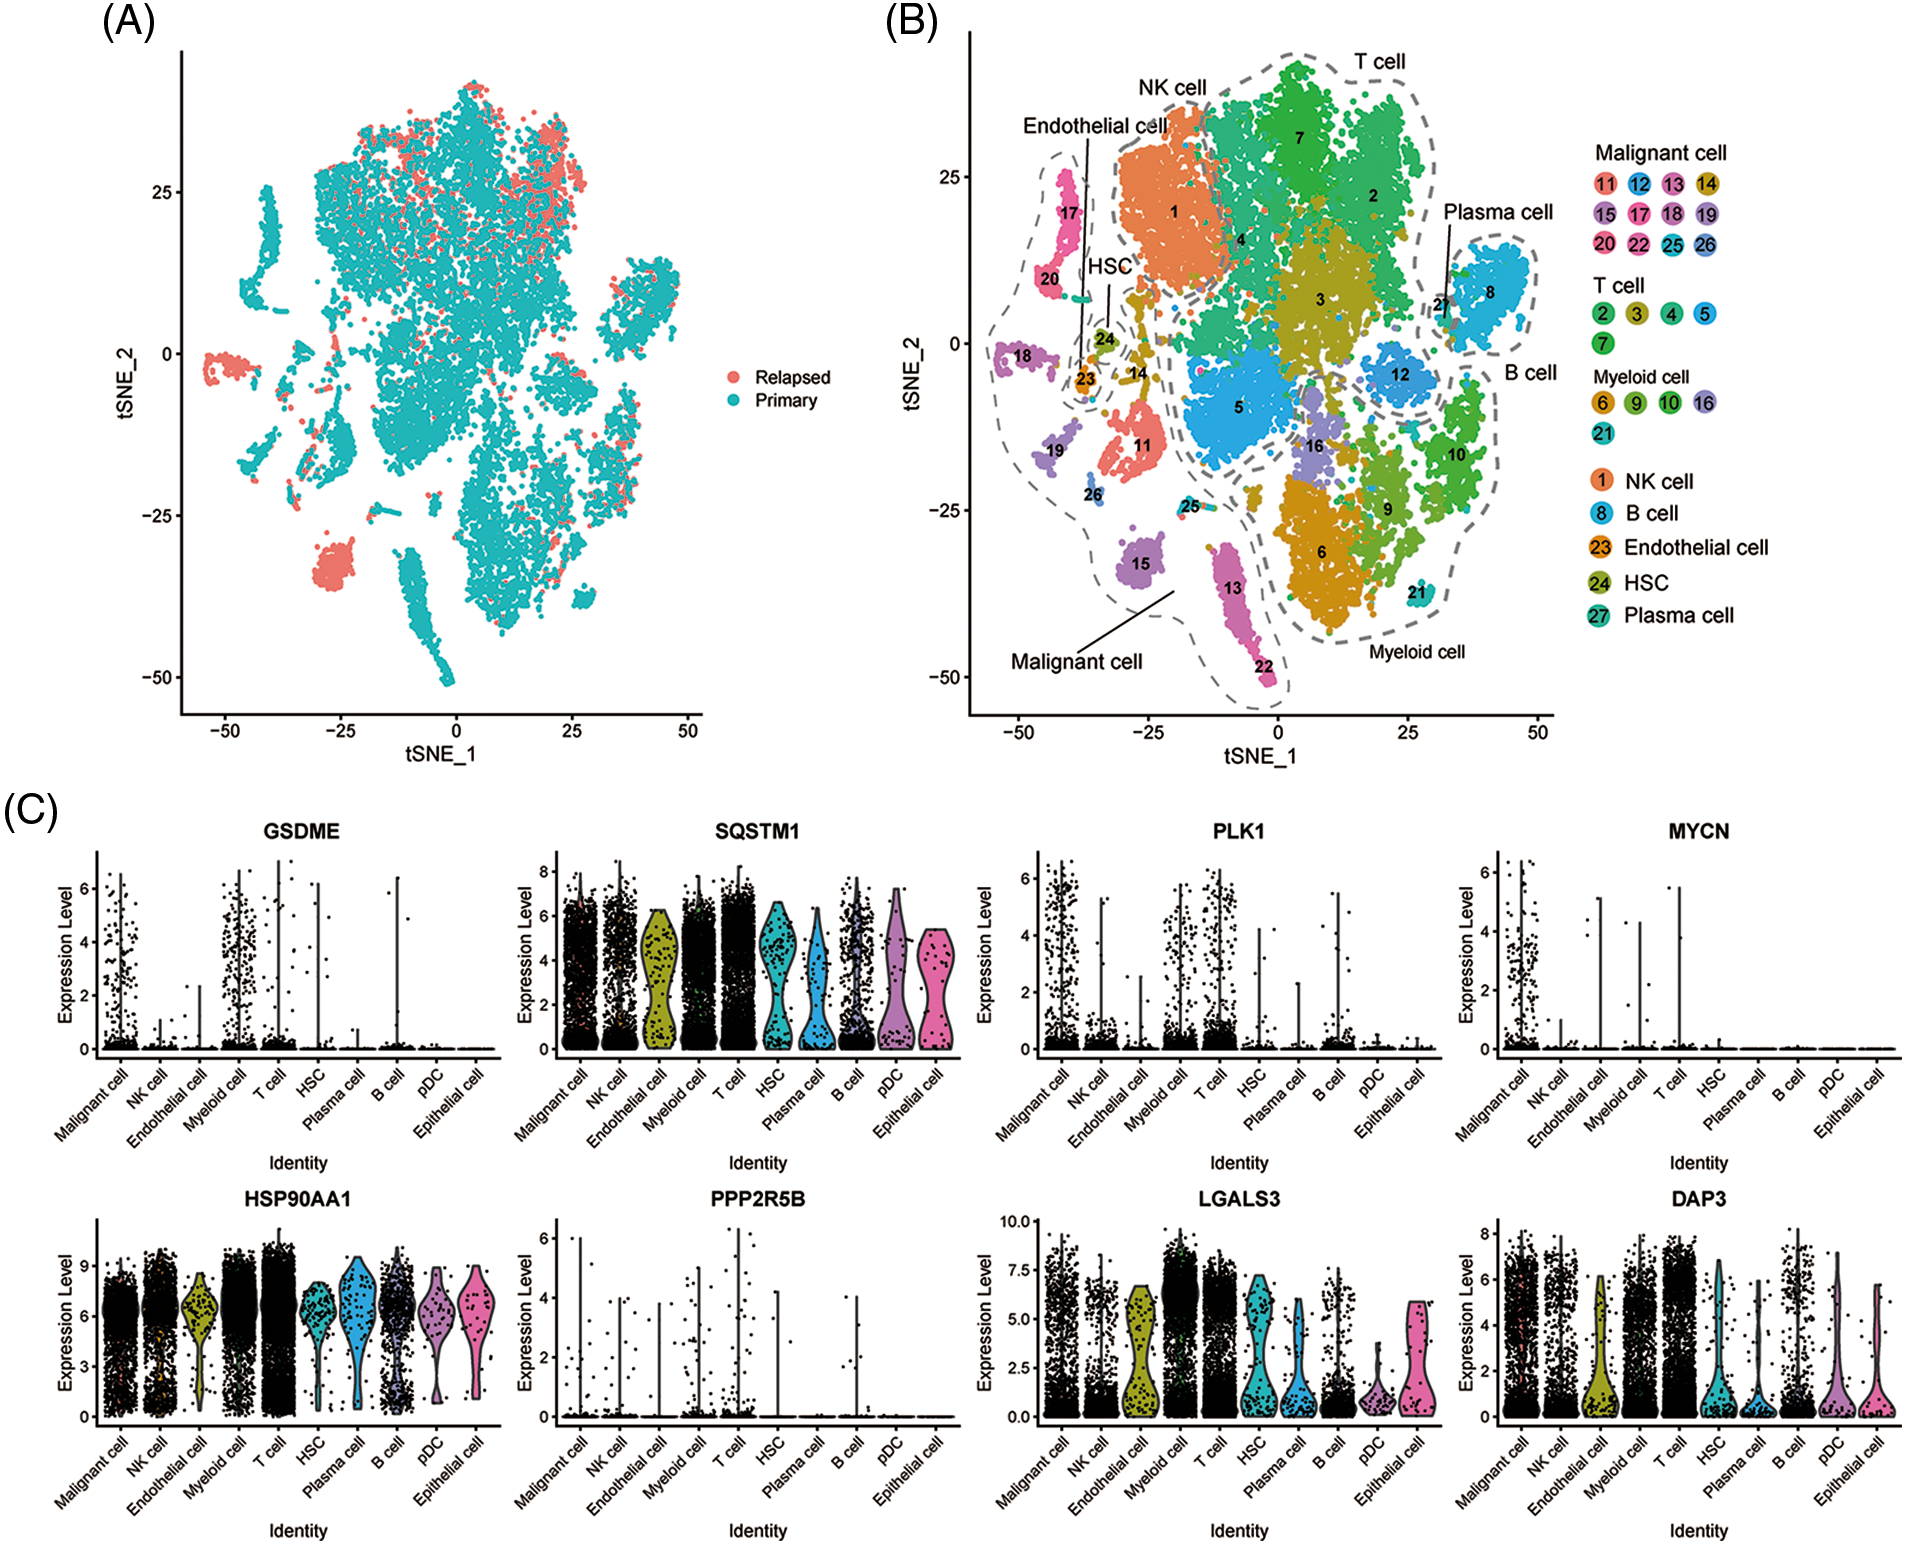
Figure 6: Single-cell analysis of eight PANRGs in hepatocellular carcinoma. (A) Sample source of cells. (B) t-distribution random neighbor embedding (t-SNE) plot showing annotation and color coding of HCC cell types. (C) Expression levels of 8 PANRGs in single cells.
Development and validation of the prognosis-related nomogram for HCC
Since independent prognostic analysis demonstrated that the PANscore was an independent risk factor for HCC, we developed a novel prognostic nomogram based on the PANscore and TNM stages (Fig. 7A). The calibration plots revealed that the nomograms provided a reliable quantitative method for predicting OS in HCC patients (Figs. 7B and 7C). The K-M curves indicated that the prognosis of patients in the high-risk group was worse compared to the low-risk group (Figs. 7D and 7E). Furthermore, the probability of OS predicted by the nomogram was closely matched to the actual OS probability. In particular, the 1-year AUC value up to 0.813 and the 3-year and 5-year AUC values of 0.797 and 0.790, respectively in the TCGA cohort, and validated in the ICGC cohort (Figs. 7F and 7G).
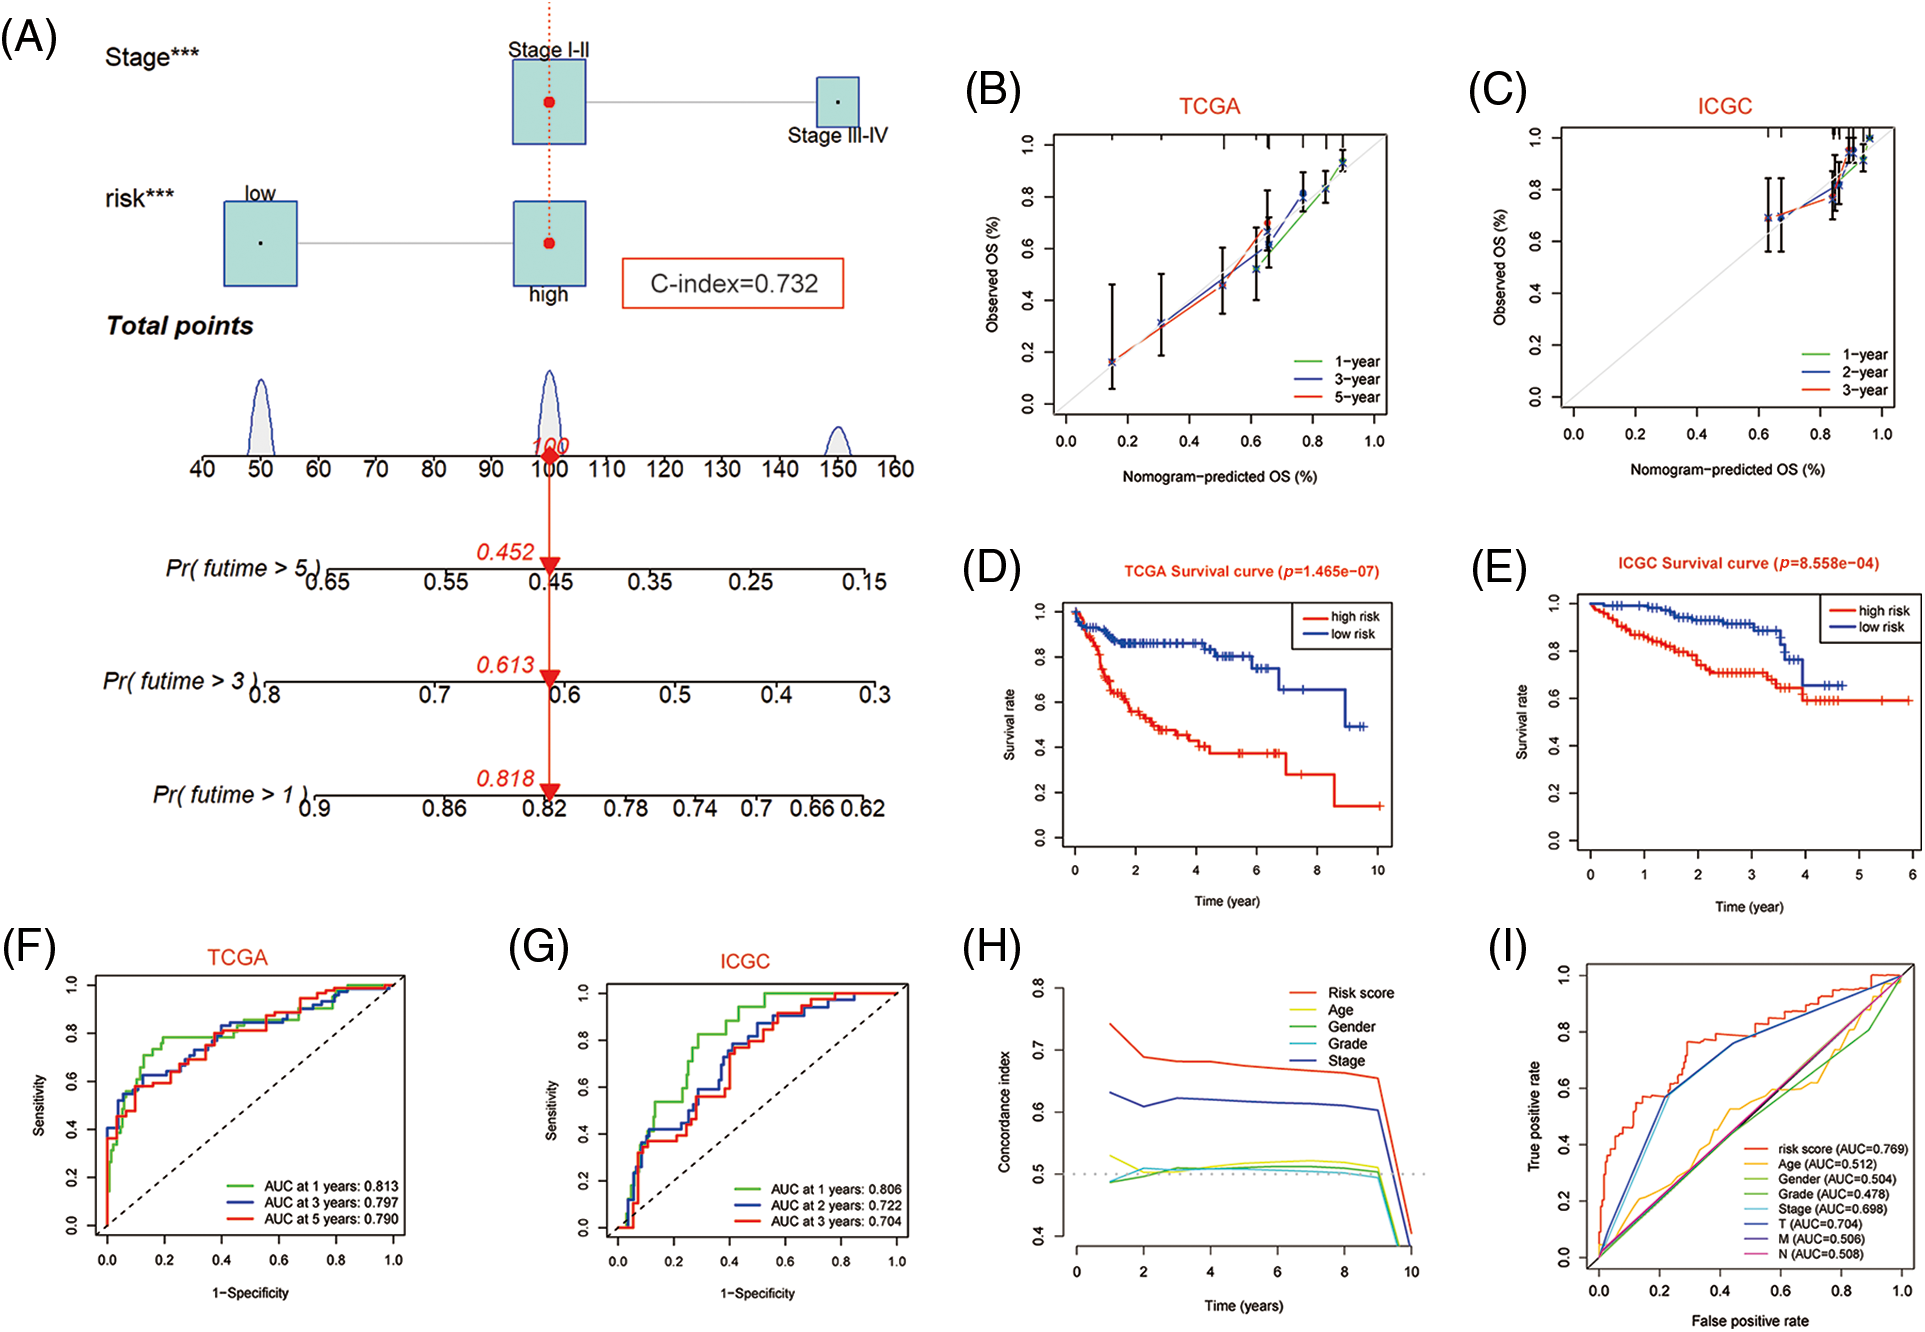
Figure 7: Nomogram predicting overall survival in HCC patients. (A) Nomogram constructed using clinical characteristics and PANscores from the TCGA dataset. (B) Calibration curves of Nomogram in the TCGA cohort. (D) K-M survival curves of the nomogram. (F) AUC of ROC curves showing the predictive efficiency of nomogram. (C, E, G) Validation of the predictive power of nomogram in ICGC dataset, including calibration curves, K-M analysis and ROC curves. (H) C-INDEX of different clinical indicators in TCGA datasets. (I) Multi-indicator ROC Curve in TCGA Database.
Validation of the occurrence of PANoptosis in HCC cells and patients and the expression of key genesThe relationship between expression of key genes and OS in HCC patients
To further confirm the occurrence of PANoptosis, we confirmed in normal hepatocytes (L-O2) and human hepatocellular carcinoma cells (HepG2 and HL-7721), including YP1-positive cells indicative of apoptosis or necroptosis and PI-positive cells indicative of necroptosis, pyroptosis or ferroptosis (Fig. 8A).
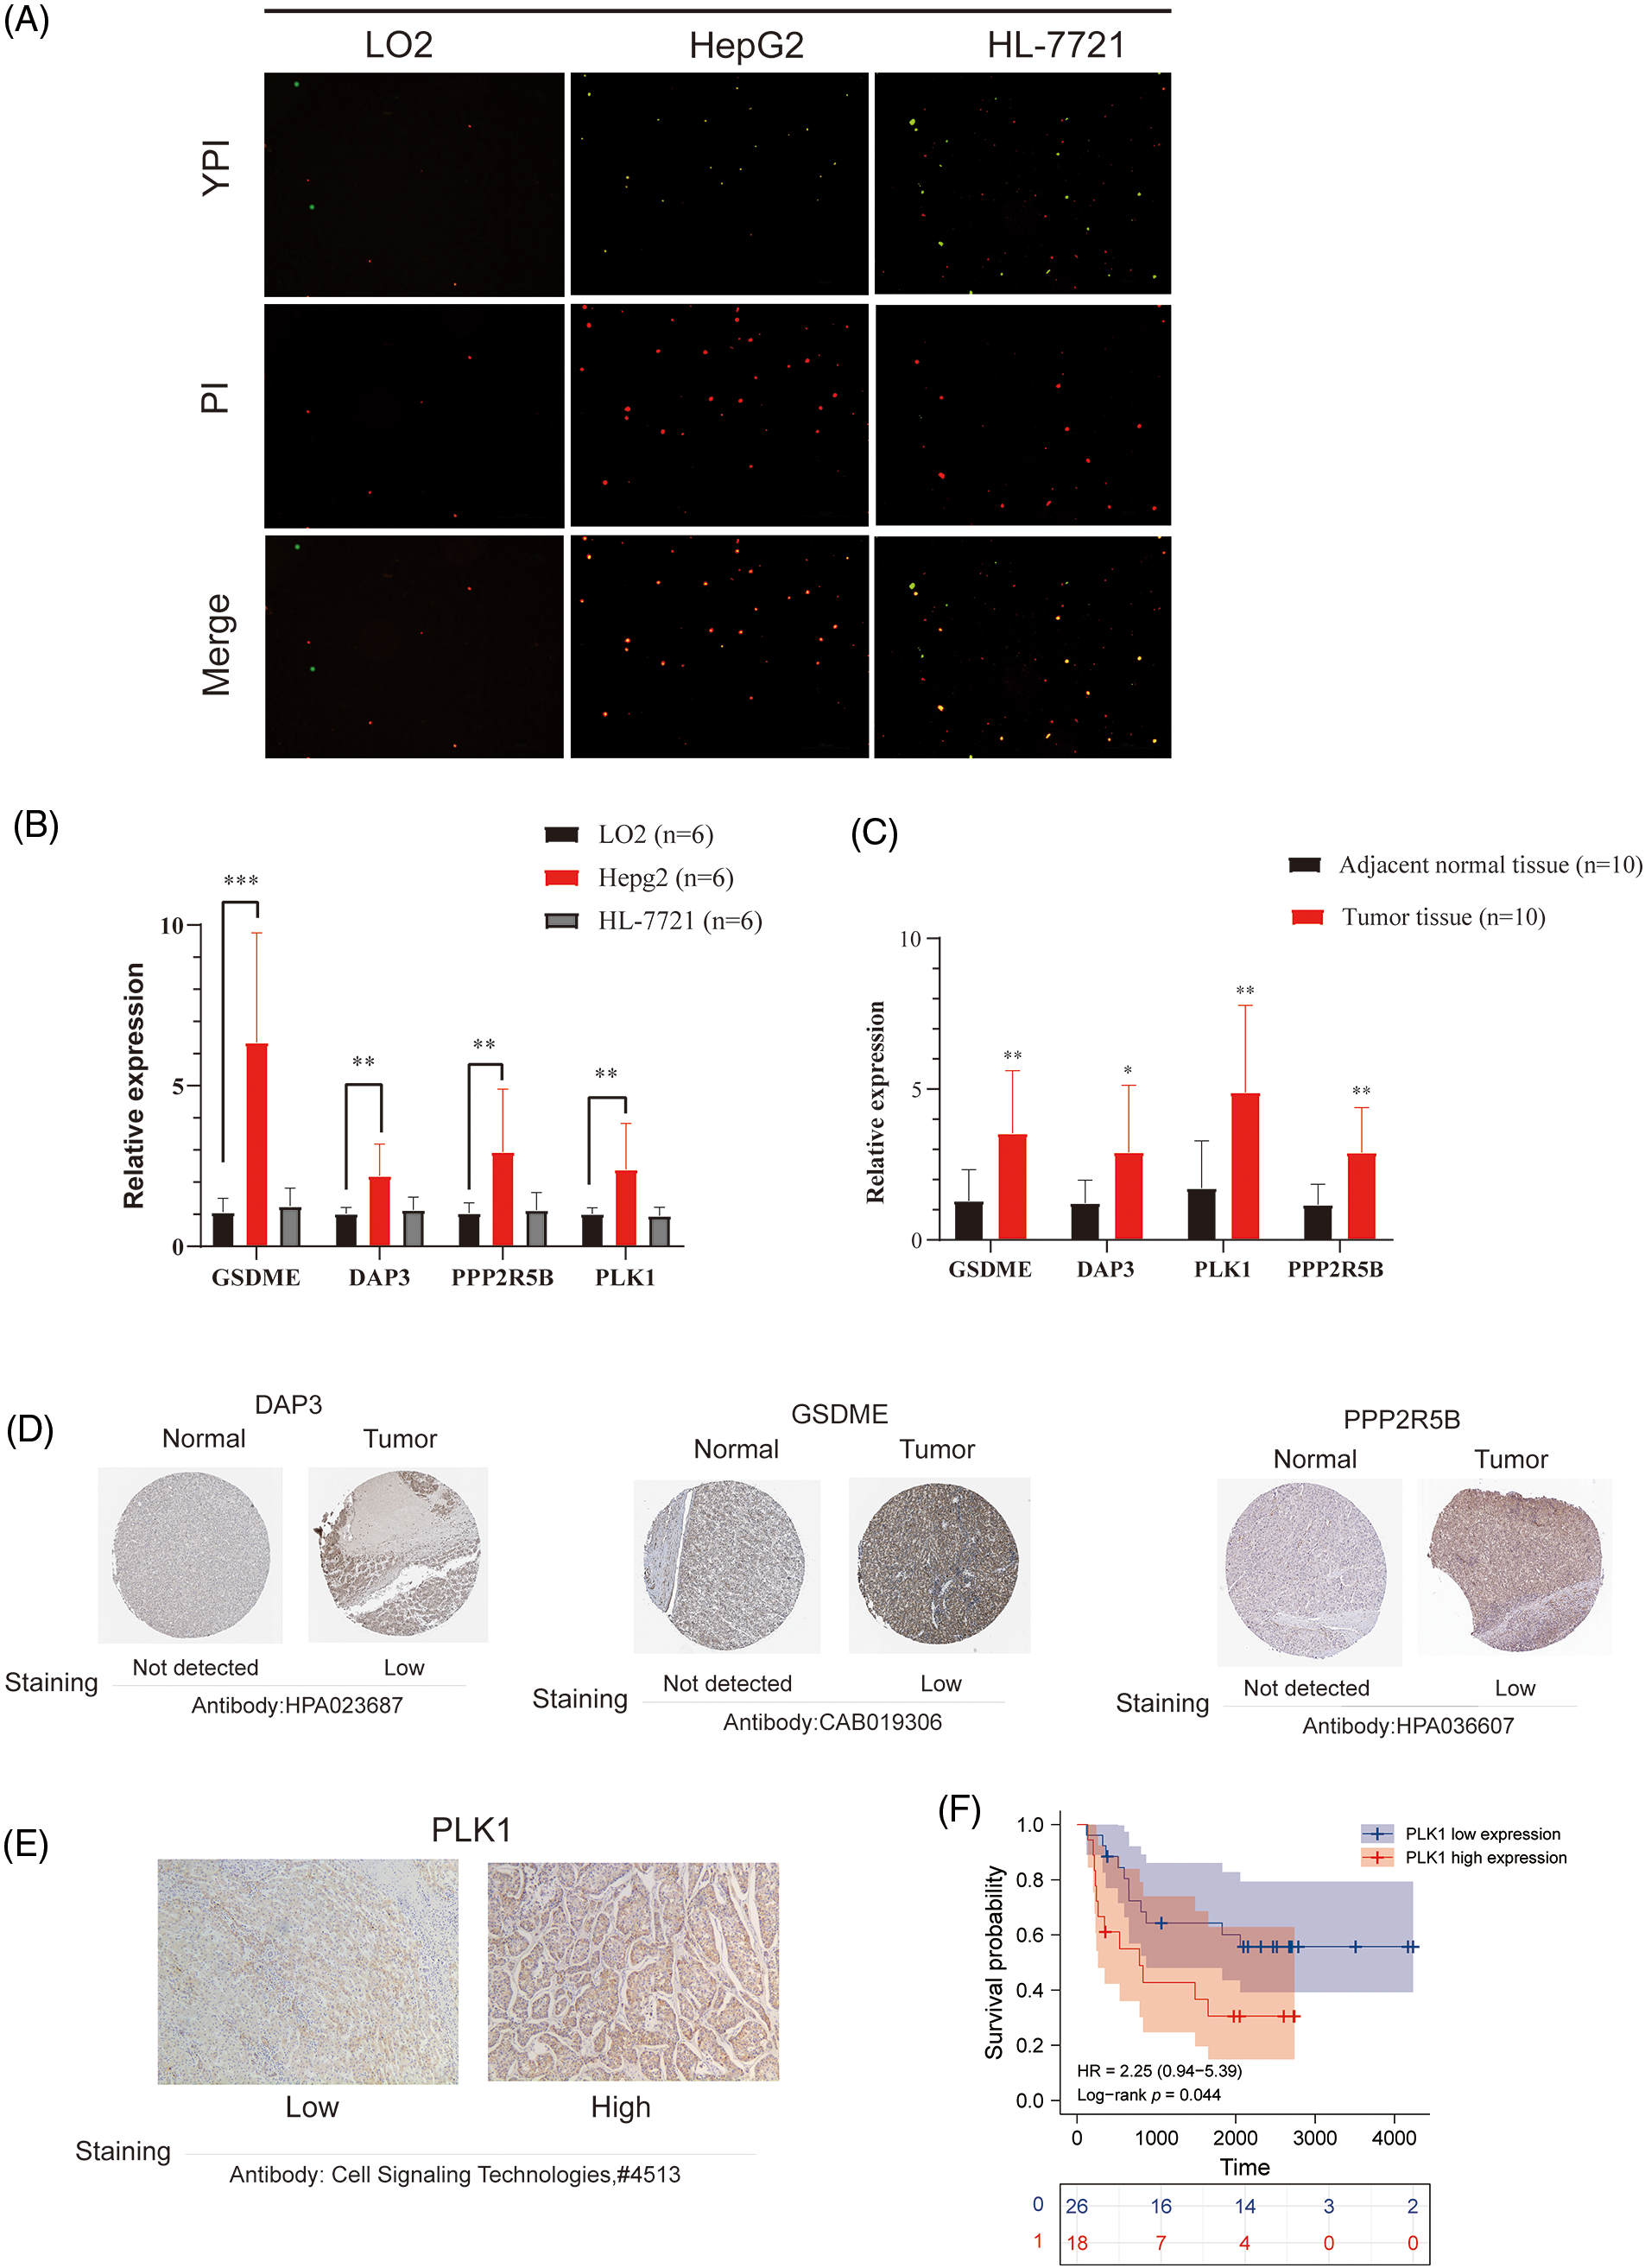
Figure 8: Validation of differential expression of hub genes at the cellular and protein levels. (A) Representative images showing the occurrence of PANoptosis in normal hepatocyte lines and HCC cell lines. YP1+ cells (green) may undergo apoptosis or necroptosis, PI+ cells (red) may undergo apoptosis, necroptosis, pyroptosis, or ferroptosis. (B) mRNA expression of GSDME, DAP3, PPP2R5B, and PLK1 in normal hepatocytes and HCC cell lines. (C) mRNA expression of GSDME, DAP3, PPP2R5B, and PLK1 in normal and HCC tissues. (D) Immunohistochemistry of DAP3, GSDME, and PPP2R5B in normal and tumor groups in the HPA database. (E) Immuno-histochemical images of PLK1 protein expression in hepatocellular carcinoma tumor tissues, 100×. (F) Prognostic significance of PLK1 expression in HCC patients.
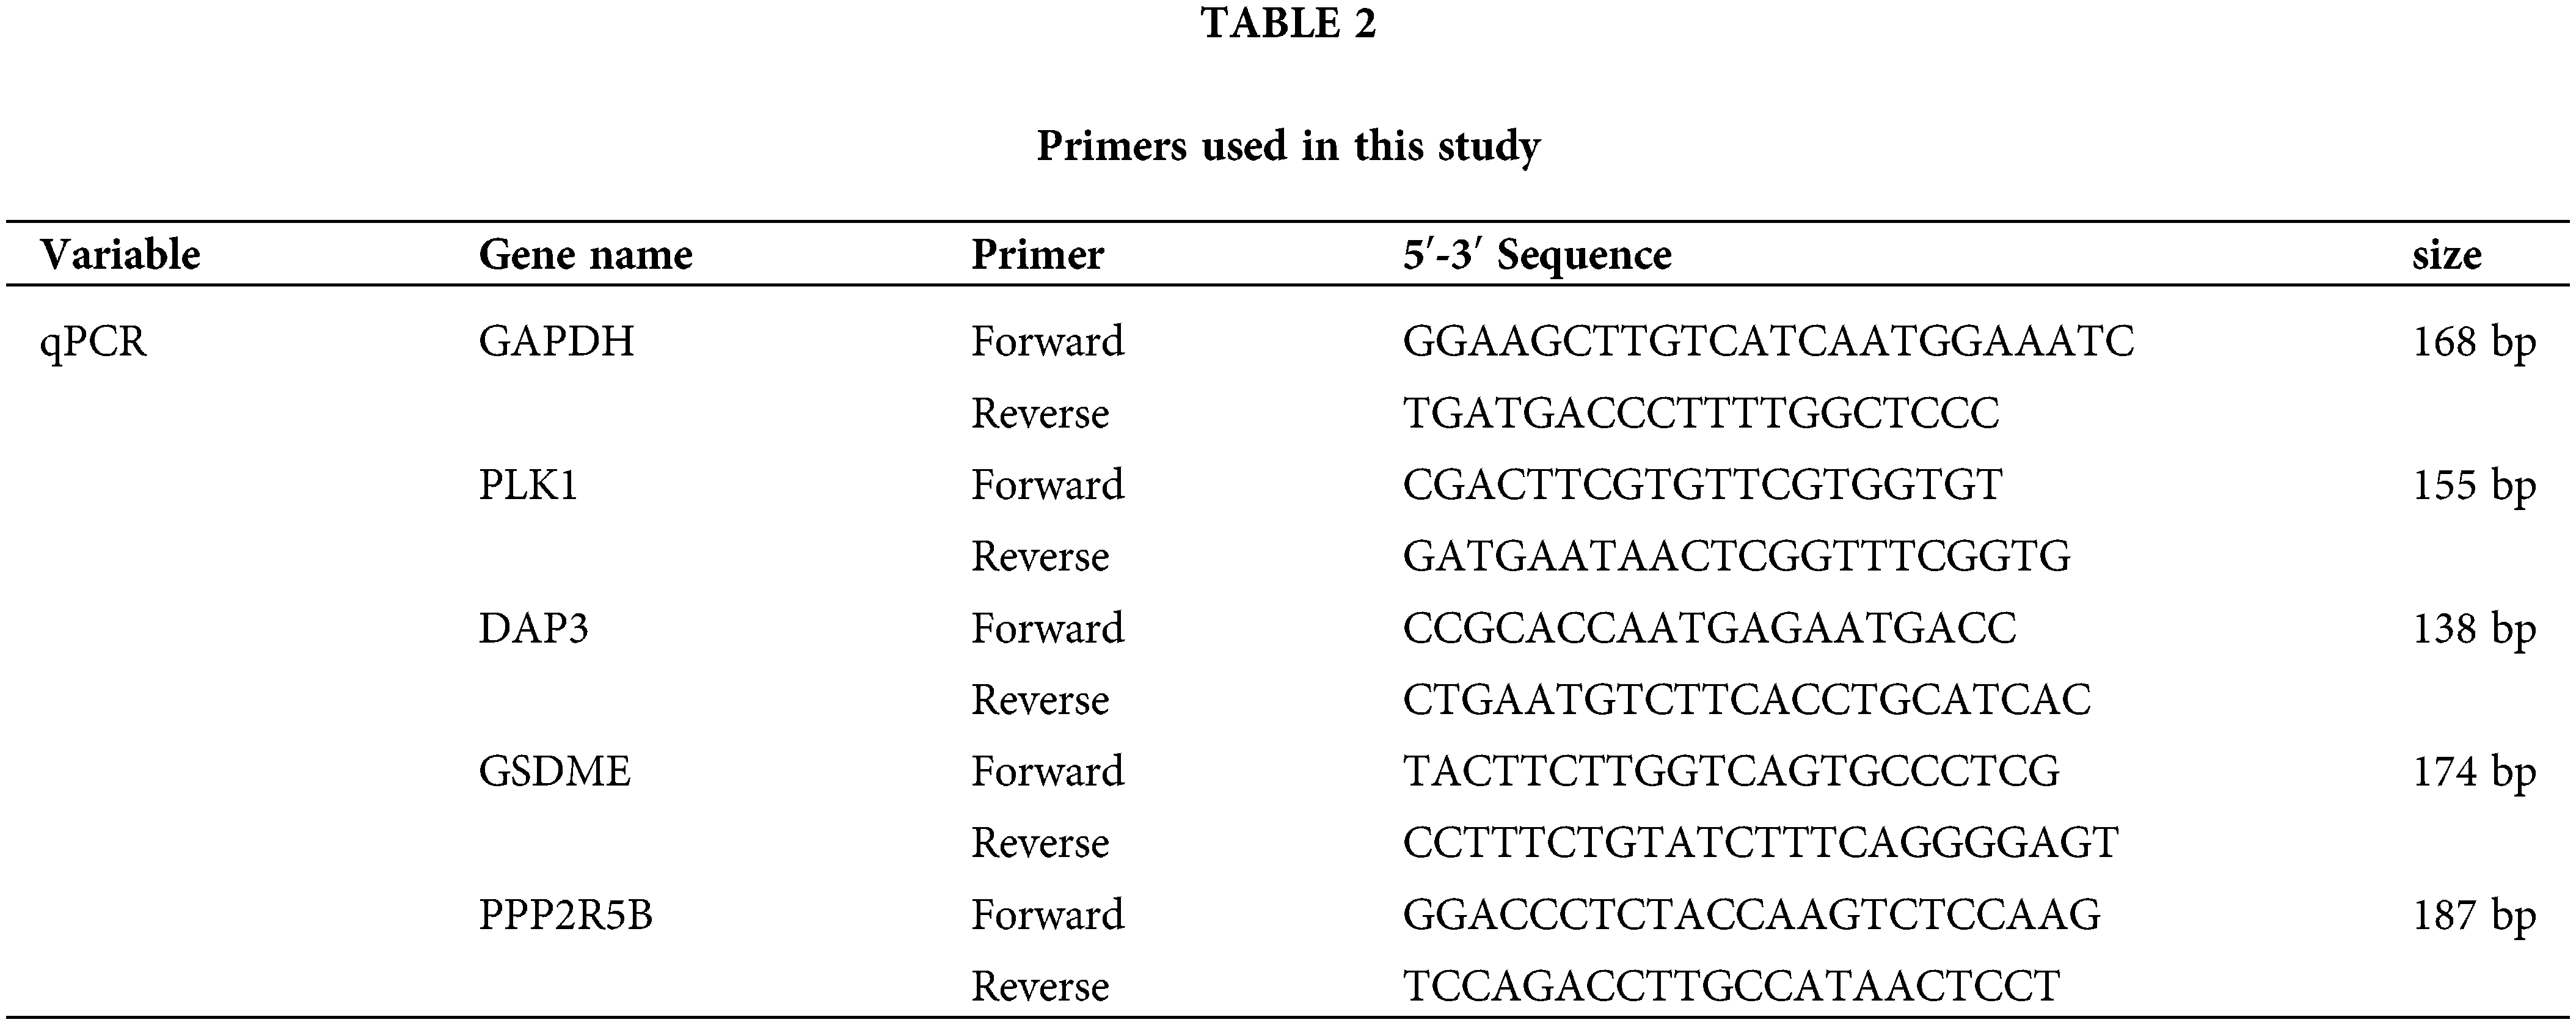
To evaluate the expression of four PANoptosis-related hub genes (GSDME, PLK1, DAP3, and PPP2R5B), qRT-PCR was used to quantify mRNA expression levels. The primer sequence information used for this study is shown in Table 2 Results indicated that the four PANoptosis-related hub genes in HCC tissues were upregulated. Besides, we confirmed the mRNA levels of these hub genes in human hepatocytes. As shown, the mRNA levels of GSDME, PLK1 and PPP2R5B were significantly higher in HepG2 cells than in the normal hepatocyte line L-O2, the mRNA level of DAP3 was higher in the HL-7721 cell line than in L-O2 (Fig. 8B). We also confirm the expected expression pattern of the four hub genes in human liver cancer tissues, the results showed that GSDME, DAP3, PPP2R5B, and PLK1 were overexpressed in human HCC tissues compared to paired adjacent non-tumor tissues, indicating poor prognosis (Fig. 8C).
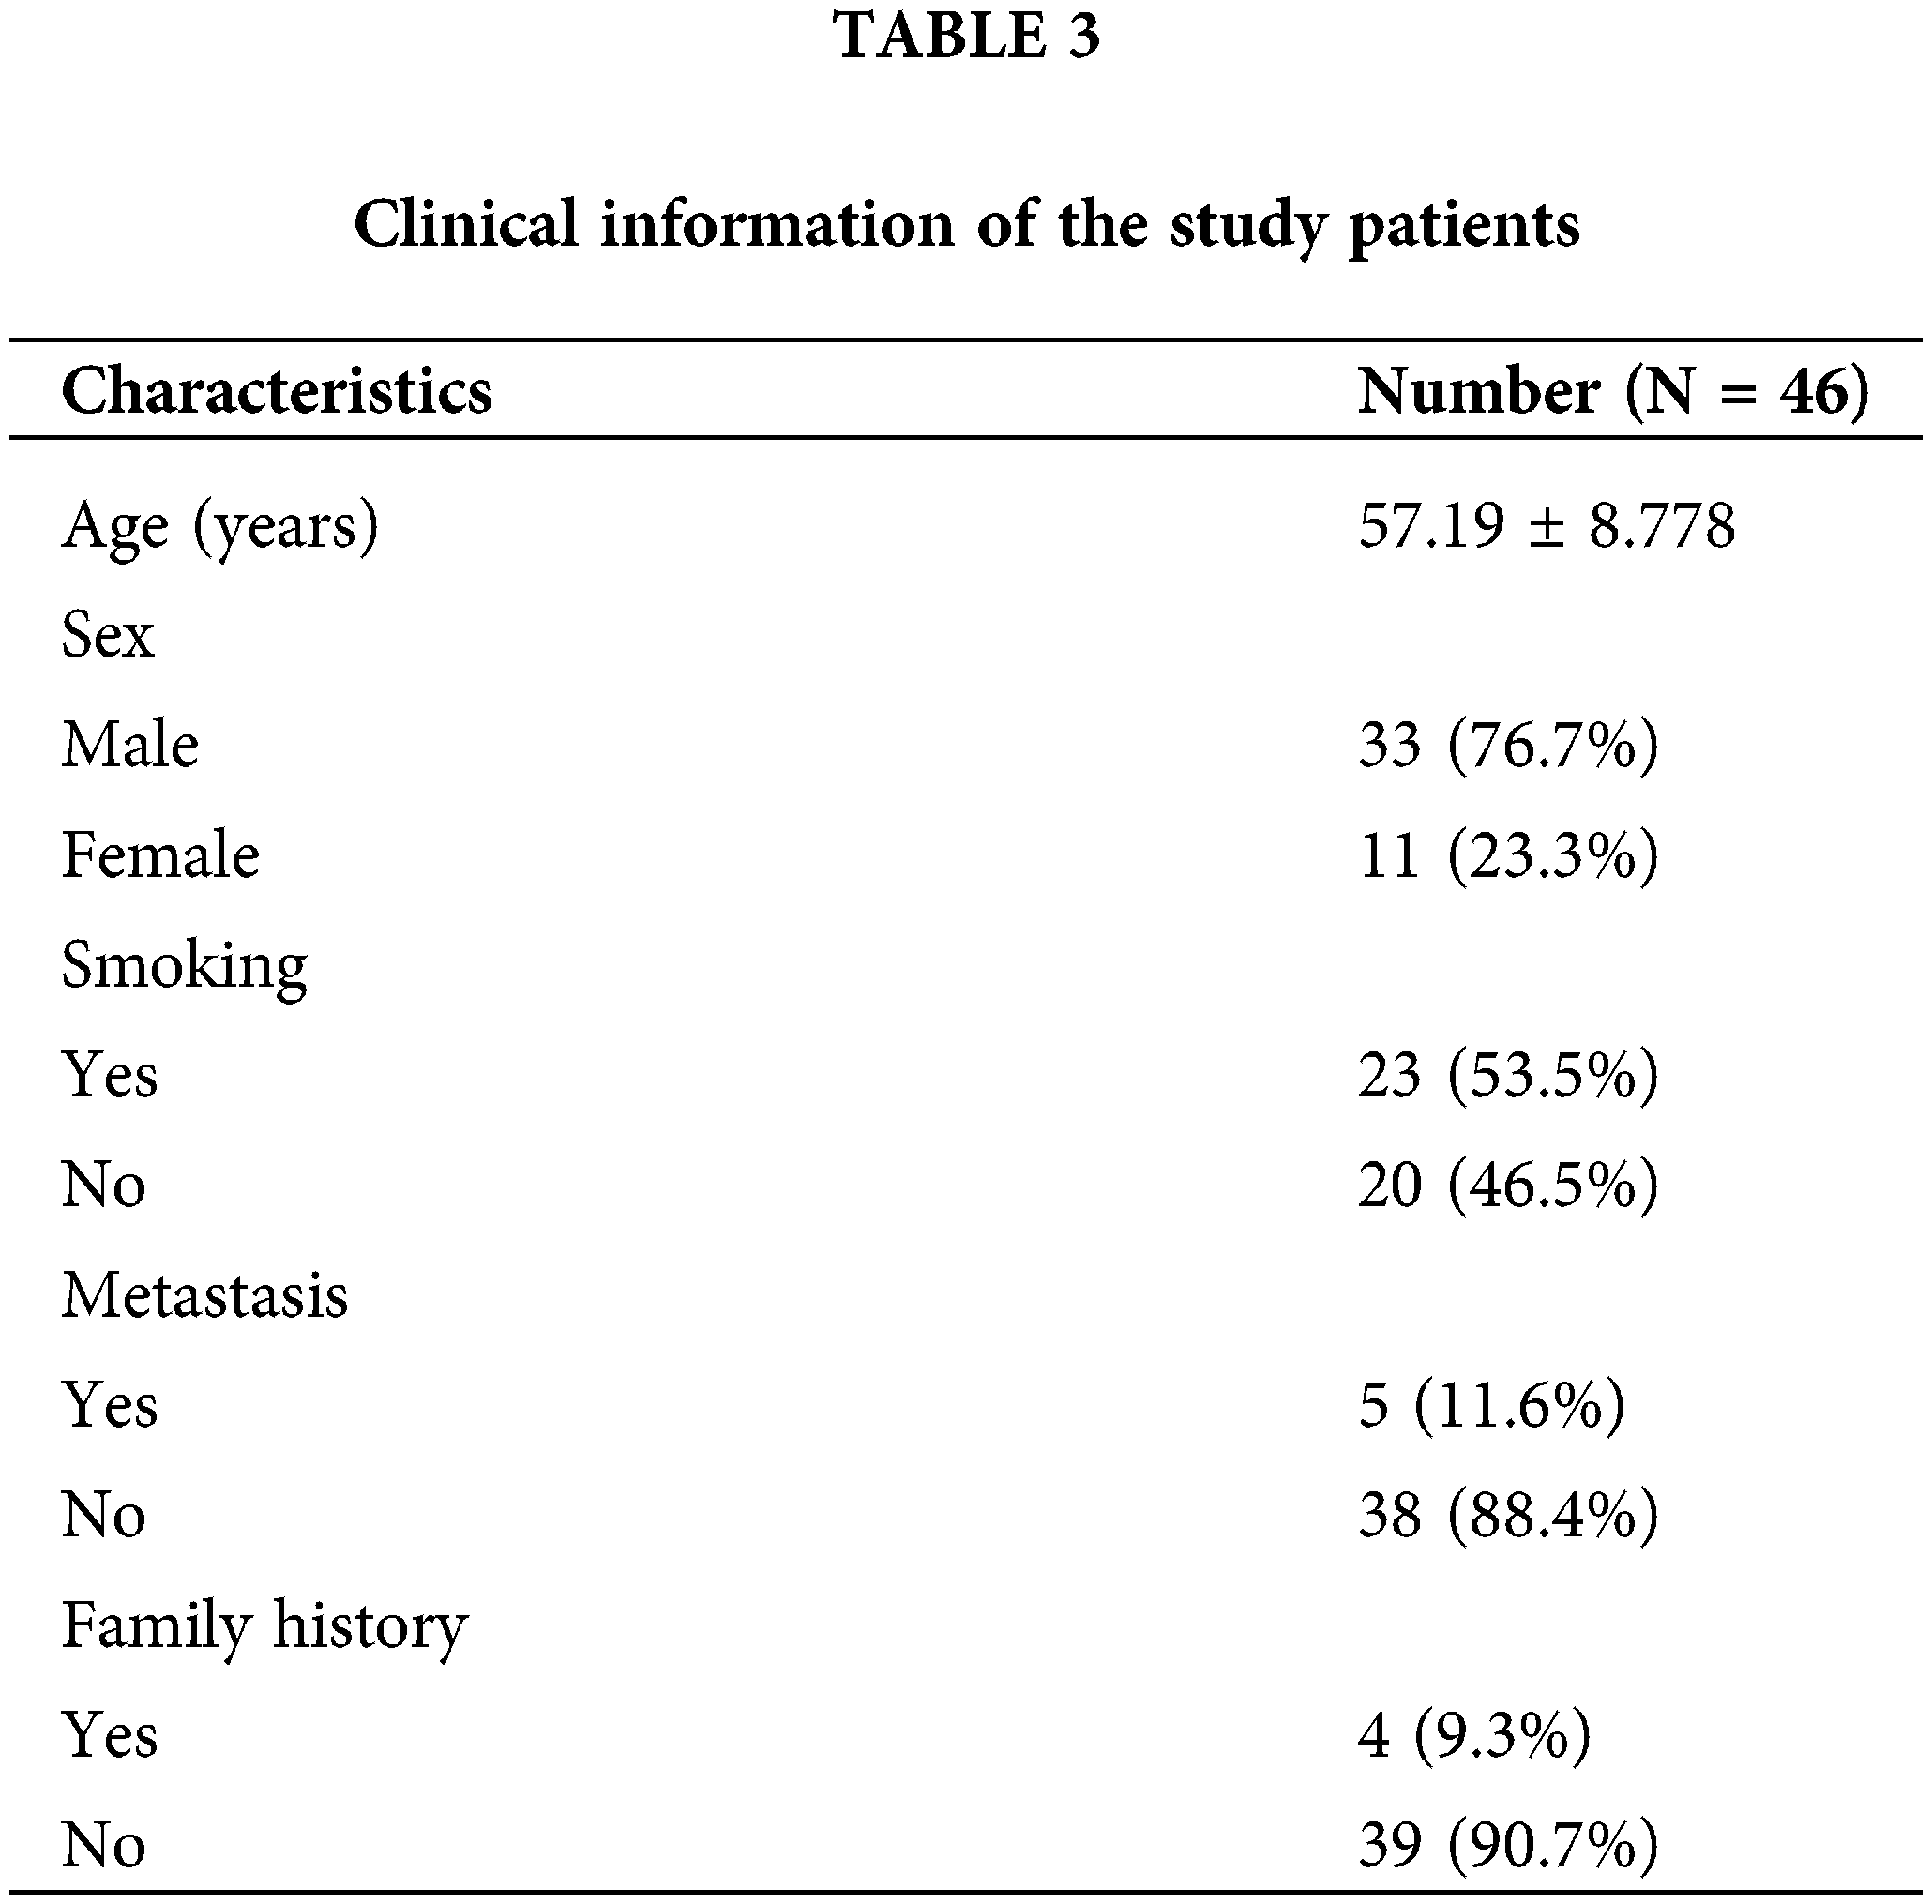
To further verify the differences in protein expression of key genes, we obtained representative immunohistochemical images of GSDME, DAP3, and PPP2R5B from the HPA database (Fig. 8D). The expression of PLK1 in 46 HCC tissues was then examined by immunohistochemistry. PLK1 protein expression levels were significantly increased in tumor tissues (Fig. 8E). Then, the prognostic impact of PLK1 on the OS of HCC patients was evaluated by K-M. As shown in Fig. 8F, PLK1 resulted in a significant survival difference in the 46 HCC samples (p = 0.044). The baseline information for these patients is summarized in Table 3.
Effects of DAP3, GSDME, PLK1, and PPP2R5B knockdown on the growth of pan-cancer cell lines and HCC cells
In this study, the effects of DAP3, GSDME, PLK1, and PPP2R5B knockdown on cancer cell growth were analyzed by DepMap, a cancer survival-dependent gene database. log2(FC) < −1 indicates that knockdown inhibits the growth of cancer cell lines. The results indicated that DAP3 and PLK1 knockdown could affect the growth of a variety of tumor cells, including liver cancer, colorectal cancer, and gastric cancer as shown in Figs. 9A–9D. Data from screening cancer growth-related genes by mining the genome-wide CRISPR-Cas9 knockdown database showed that DAP3 gene knockdown could inhibit the growth of JHH-5, HuH-1, SNU398, and other liver cancer cell lines. Meanwhile, PLK1 knockdown inhibited the growth of JHH-5, HuH-1, SK-HEP-1, and other HCC cell lines. The impact of GSDME and PPP2R5B knockdown on HCC cells was shown in Figs. 9E–9H.
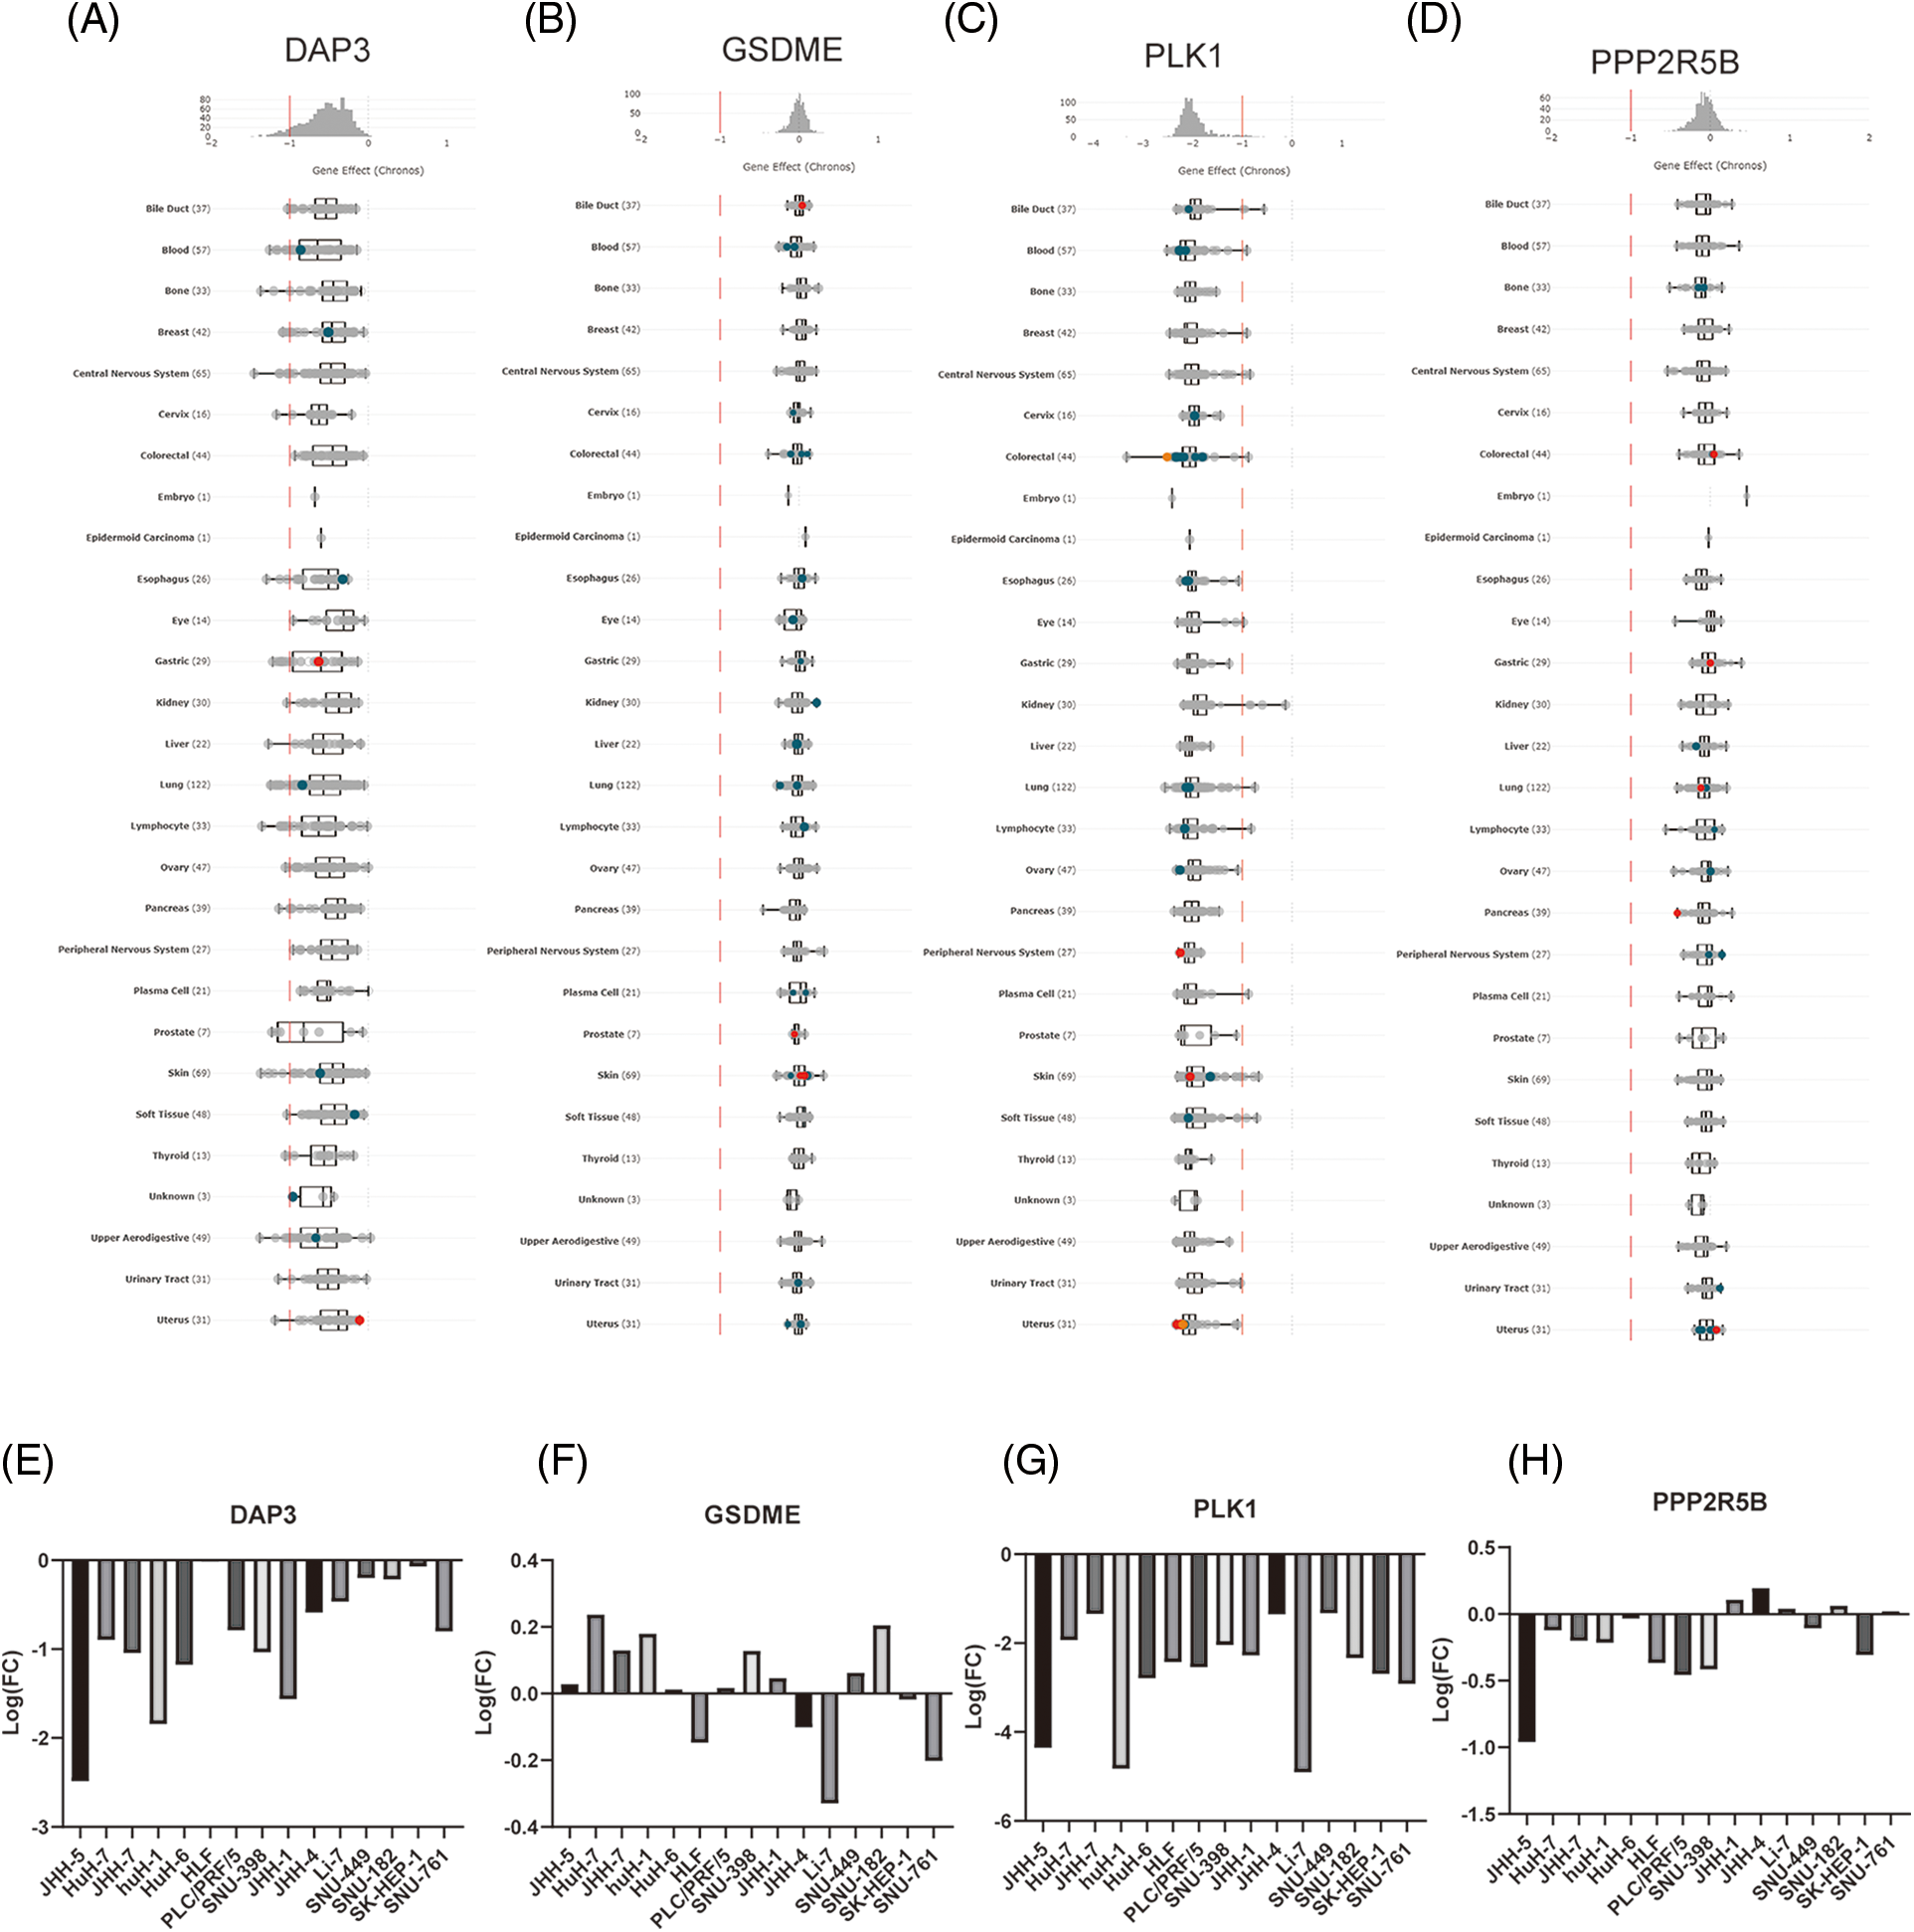
Figure 9: The role of gene knockout on cell growth. (A) Pan-cancer analysis of the effect of knockdown of four hub genes on cell lines growth. (B) Effect of GSDME, DAP3, PPP2R5B, and PLK1 knockdown on the proliferation of HCC cells.
PANoptosis kills cancer cells and inhibits tumor growth by inducing cell death through TNF-α and IFN-γ [12], thus contributing to the treatment and intervention of cancer [25,26]. PANoptosis was regulated by a cytoplasmic polyprotein complex called PANoptosome, which can simultaneously involve three programmed cell death patterns, including pyroptosis, apoptosis, and necroptosis. Meanwhile, the PANoptosome was made up of the key regulators of apoptosis caspase-8, the pyroptosis components caspase-1 and caspase-11, and the necroptosis components RIPK1 and RIPK3, which integrate the three programmed cell death mechanisms into a unified mechanism. Previous studies showed that most cancer cells can resist cell death and maintain cell growth [27], this makes it possible for PANoptosis to target cancer prevention and treatment [28]. The exploration of tumor and PCD mechanisms is currently the subject of intense research [29–31], and the potential association between HCC and PANoptosis remains elusive.
In this study, we used a gene list including 274 PANRGs, and LASSO-Cox regression analysis was used to screen a risk prognostic model PANscore consisting of 8 PANoptosis-related genes (including DAP3, LGALS3, PPP2R5B, HSP90AA1, MYCN, PLK1, SQSTM1, and GSDME) to support the prediction of HCC prognosis. Notably, eight genes associated with three PCDs were involved in the process of PANscore, which further confirmed the complex crosstalk between PCD pathways when PANoptosis occurs. In addition, correlation analysis between PANRGs showed a significant correlation between the 3 PCDs. Subsequently, we developed a nomogram [32] using a combination of independent prognostic indicators PANscore and TMN, which performed better than the earlier single indicators and was well calibrated with good agreement between external validation and the training set.
The eight PANRGs that construct the PANscore can be roughly classified into three types, apoptosis (DAP3, LGALS3, and PPP2R5B), Necroptosis (HSP90AA1, MYCN, SQSTM1, and PLK1), and pyroptosis (GSDME). Among them, death-associated protein 3 (DAP3) is a molecule that plays an important role in the control of apoptosis [19]. as a subunit of mitochondria, DAP3 is involved in the process of detachment from extracellular matrix-induced anoikis-induced apoptosis [33] and mediates IFN-induced apoptosis (interferon-γ), tumor necrosis factor receptor (TNF-α), Fas ligand (FasL) and TNF-related apoptosis-inducing ligand (TRAIL) to induce apoptosis [24]. Meanwhile, DAP3 is at the location of several important cellular pathways in tumorigenesis and has been shown to be expressed at elevated levels in aggressive glioblastoma cells and glioma cell lines with an induced migration phenotype [34]; survival analysis by Gera et al. [35] in a clinical study of a cohort of 127 breast cancer patients showed higher survival rates in the highly transcribed group. Galactose lectin-3 (LGALS3, also known as galectin-3), a member of the galectin protein family, is one of the most widely studied galactose lectins in cancer and is involved in a variety of cellular activities including apoptosis, cell migration, proliferation, and angiogenesis [36–38]. It is able to participate in apoptosis through a conserved carbohydrate recognition domain (CRD) that allows the binding of β-galactose-containing glycocalyxes [29]. Pratima et al. elaborated the regulatory role of LGALS3 in tumor stem cells (CSCs)-related phenotypes and signaling pathways [39], and it has also been shown that galactose lectin-3 is an important regulator of lung adenocarcinoma progression [40]. PPP2R5B is a subunit encoding protein phosphatase 2A (PP2A), which is associated with insulin resistance [41].PP2A is widely recognized as a tumor suppressor, studies have shown that low expression of PPP2R5B improves survival [42]. The mechanism of action of PPP2R5B in HCC is still unclear.HSP90AA1 belongs to the heat shock protein (HSP90) family, and many of its regulated client proteins are proto-oncogene products or important signal transduction factors in tumorigenesis and are closely related to tumor development [43,44]. It inhibits cancer cell proliferation and increases necrosis [45,46].MYCN proto-oncogenes regulate cell growth, apoptosis and differentiation and are associated with tumor aggressiveness and chemoresistance [47]. Specifically, MYCN overexpression promotes cell cycle progression, inhibits cytotoxic T cell infiltration, and accelerates lung cancer progression [48]. And one study found that MYCN is overexpressed in HCC cell lines and clinical samples from HCC patients, and also inhibits HCC cell growth and invasion by knocking down the gene [49]. p62/SQSTM1 is the protein responsible for mitosis, and the mitotic signaling pathway appears to be impaired in cancer [50,51]. Mitosis acts as a switch that regulates metabolism and can promote cancer cell survival [52].
Polo-like kinase 1 (PLK1) is an important regulator of the cell cycle [53], and PLK1 expression is significantly higher in HCC tissues than in normal liver tissues [54]. Inhibition of PLK1 leads to cellular G2/M blockade, inhibition of proliferation, and downregulation of Survivin expression to promote apoptosis, making it possible to use PLK1 inhibitors as a potential therapeutic tool to treat cancer [55]. Lin et al. showed that PLK1 inhibition significantly prevented liver tumorigenesis in transgenic mice, primary cells, and HCC [56], proposing a new strategy for ubiquitinylase-PLK1-targeted treatment of hepatocellular carcinoma. Gasdermin E (GSDME) is the central molecule regulating the process of scorching and necrosis. Its mechanism of action is the specific cleavage by caspase-3 at its junction, which generates a GSDME-n fragment that penetrates the cell membrane and thus induces scorch death [57]. In different cancers, GSDME has different expression levels and functions, and even the subcellular localization of GSDMD affects cancer progression and immune response. In cancer cells with low GSDME expression, Caspase3 tends to induce apoptosis. By staining hepatocellular carcinoma cells and normal hepatocytes with YO-PRO-1/PI fluorescence, we found that apoptosis and necrosis were rarely observed in normal hepatocytes, whereas extensive apoptosis, scorching and necrosis occurred simultaneously in hepatocellular carcinoma cells. Therefore, it can be assumed that pan-apoptosis occurred in HCC. Growing evidence suggests that tumor-infiltrating leukocytes (TILs), including B cells, effector T cells, and memory T cells, play a critical role in the clinical management of HCC patients [58]. In previous studies, macrophages, neutrophils, and Treg cells were shown to promote tumor progression [59–61]. The poor clinical prognosis of HCC patients is associated with NK-cell dysfunction [62]. GO and KEGG analysis based on pathways reveal immune cell infiltration and metabolism-related pathways that partly play a role in PANoptosis-related processes. Unexpectedly, DEGs are enriched in many biological processes and pathways related to immunity. Thus, it is reasonable to assume that PANoptosis is closely related to tumor immunity. We then used the CIBERSORT algorithm to quantify tumor-infiltrating immune cells and found that M0 macrophage cells and NK cells were significantly higher in the high PANscore group. Subsequently, to further analyze the PANoptosis pattern of HCC at the single-cell level, we found that the expression of prognostic PANRGs was significantly higher in T cells. HSP90AA1, SQSTM1, LGALS3, and DAP3 were significantly expressed in T cells, HSCs, myeloid cells, and other cells. GSDME and PLK1 showed distinct expression in T cells and myeloid cells.
CIRBERSORT is a method to characterize the cellular composition of complex tissues through gene expression profiles, enabling large-scale analysis of RNA mixtures, deconvolution of expression matrices of human immune cell subtypes based on the principle of linear support vector regression (linear support vector regression), by estimating relative subpopulations of RNA transcripts to accurately identify cell types of GEPs from complex tissues to find biomarkers and therapeutic targets [20]. Subsequently, we quantified tumor-infiltrating immune cells using the CIBERSORT algorithm and found a higher abundance of M0 macrophages and NK cells in the high PANscore group. Liver macrophages play a central role in the pathogenesis of liver disease (hepatic macrophages play a central role in the pathogenesis of liver disease), while NK cells are a unique cytotoxic lymphocyte that plays a critical role in fighting tumors and infections as an important component of the anti-tumor natural immune system, and the phenotype and function of NK cells have been demonstrated in patients with liver cancer, where tumor infiltration and circulating NK cell recurrence rate is positively correlated with survival benefit in HCC and has prognostic significance, and NK cell dysfunction is closely associated with HCC progression [63]. Single-cell RNA sequencing (scRNA-seq) technology allows the resolution of gene expression at single-cell resolution, dramatically revolutionizing transcriptomic studies, and its application in profiling the tumor microenvironment has brought important insights into the biology of tumor-infiltrating immune cells, including their heterogeneity, dynamics, and potential role in disease progression and response to immune checkpoint inhibitors and other immunotherapies (PMID: 28787399). Subsequent to further analysis of HCC explored at the single cell level, we found that HSP90AA1, SQSTM1, LGALS3 and DAP3 were significantly expressed in T cells, hematopoietic stem cells, bone marrow cells and other cells. gSDME and PLK1 showed differential expression in T cells and bone marrow cells.
Nomogram is a method that can predict the risk or prognosis of each patient’s disease by combining multiple clinical indicators and plotting different indicators into different lines [64]. In one study, the predictive nomogram technique based on radiomic and clinical indicators could better predict TACE response in intermediate to advanced HCC and could be further used as an aid to clinical prognosis [65]. A study showed that nomograms combining clinical radiological risk factors and radiological features of hepatobiliary phase images could better predict HCC patients [66] The main advantage of nomograms is that they allow individualized risk assessment based on patient or disease characteristics. Many nomograms have been used for individualized prognostic prediction of different cancers [66–68]. In our study, we constructed a prognostic column line graph combining clinical features and pan-apoptotic features. More importantly, our nomogram predicted prognosis with higher accuracy and clinical value than the conventional TNM staging system.
Furthermore, four key genes (DAP3, GSDME, PPP2R5B, and PLK1) were screened from the PANscore model gene members, some of them have been reported to be associated with poor prognosis in HCC. Previous studies have suggested that GSDME is overexpressed in HCC [13] and high expression of PPP2R5B was significantly associated with poor OS [69]. However, since the relationship between DAP3, GSDME, PPP2R5B, and PLK1 expression and HCC has not been previously reported, we performed the qRT-PCR analysis in LO2, HepG2, and HL-7721 cells and showed that GSDME, PPP2R5B, and PLK1 expression was upregulated in HCC cell lines. Similarly, the expression of DAP3, GSDME, PPP2R5B, and PLK1 was significantly higher in 15 HCC tissues. IHC showed that high expression of GSDME, PPP2R5B, and PLK1 was associated with poor prognosis in HCC patients.
Depmap database was used to explore genome-wide knockout library screening data, and pan-cancer analysis of DAP3, PPP2R5B, PLK1, and GSDME genes on cancer cell growth. The results showed that the knockdown or silencing of DAP3 and PLK1 genes could inhibit the growth of most HCC cells and many other cancer cells.
To our knowledge, this is the first study to report the molecular, and immune characteristics associated with PANoptosis in HCC. Our study provides new insights into PANoptosis in HCC, and subsequent studies are expected to illuminate more potential molecular mechanisms of PANoptosis, thereby providing more evidence for cancer prevention and treatment.
Inevitably, this study still has some shortcomings, such as the sample size included is relatively small, as well as the adoption of retrospective research methods, which cannot predict cancer occurrence and early diagnosis. Later, we will increase the model credibility by continuing to collect HCC samples and relevant prognostic information and establishing cohorts for prospective s follow-up studies.
Here, we obtained four key genes and an independent validated PANscore by comprehensive analysis. The PANscore contributes to OS prediction in HCC patients. Our PANscore is expected to be a clinically useful tool for individualized treatment and a specific indicator to assess prognosis in HCC.
Acknowledgement: The authors are grateful to all HCC patients who provided tissues for this work.
Funding Statement: This study was supported by grants from the Central Guidance on Local Science and Technology Development Fund of HeBei Province(226Z7705G), Hebei Natural Science Foundation (H2020206458, H2020206513 and H2022206552), Science and Technology Research Project of Colleges and Universities in Hebei Province (ZD2021074 and ZD2022143), 2022 Introduction of Foreign Intellectual Property Project in Hebei Province (SWZYCYZ202001).
Author Contributions: LY and WXL conceived and designed the research. XRS analyzed the data and write the manuscript. WCL and XJT conceptualized and developed an outline for the manuscript and revised the manu-script. JYL and DCP are responsible for the qRT-PCR experimental part of the study. All authors read and approved the final manuscript.
Availability of Data and Materials: Data available on request from the authors.
Ethics Approval: The experimental protocol was developed in accordance with the ethical guidelines of the Declaration of Helsinki and approved by the Ethics Committee of Hebei Medical University (approval number: [P]2022077). Written informed consent was obtained from the individual or guardian.
Conflicts of Interest: The authors declare that they have no conflicts of interest to report regarding the present study.
References
1. Alisi, A., Balsano, C. (2007). Enhancing the efficacy of hepatocellular carcinoma chemotherapeutics with natural anticancer agents. Nutrition Reviews, 65(12), 550–553. https://doi.org/10.1111/j.1753-4887.2007.tb00280.x [Google Scholar] [CrossRef]
2. Chidambaranathan-Reghupaty, S., Fisher, P. B., Sarkar, D. (2021). Hepatocellular carcinoma (HCCEpidemiology, etiology and molecular classification. Advances in Cancer Research, 149(3), 1–61. https://doi.org/10.1016/bs.acr.2020.10.001 [Google Scholar] [PubMed] [CrossRef]
3. Harris, P. S., Hansen, R. M., Gray, M. E., Massoud, O. I., Mcguire, B. M. et al. (2019). Hepatocellular carcinoma surveillance: An evidence-based approach. World Journal of Gastroenterology, 25(13), 1550–1559. https://doi.org/10.3748/wjg.v25.i13.1550 [Google Scholar] [PubMed] [CrossRef]
4. Qiu, Z., Li, H., Zhang, Z., Zhu, Z., He, S. et al. (2019). A pharmacogenomic landscape in human liver cancers. Cancer Cell, 36(2), 179–193.e11. https://doi.org/10.1016/j.ccell.2019.07.001 [Google Scholar] [PubMed] [CrossRef]
5. Frenette, C. (2020). Advances in hepatocellular carcinoma. Clinics in Liver Disease, 24(4), xiii–xiv. https://doi.org/10.1016/j.cld.2020.08.014 [Google Scholar] [PubMed] [CrossRef]
6. Zongyi, Y., Xiaowu, L. (2020). Immunotherapy for hepatocellular carcinoma. Cancer Letters, 470(13), 8–17. https://doi.org/10.1016/j.canlet.2019.12.002 [Google Scholar] [PubMed] [CrossRef]
7. Su, Z., Yang, Z., Xu, Y., Chen, Y., Yu, Q. (2015). Apoptosis, autophagy, necroptosis, and cancer metastasis. Molecular Cancer, 14(1), 48. https://doi.org/10.1186/s12943-015-0321-5 [Google Scholar] [PubMed] [CrossRef]
8. Hsu, S. K., Li, C. Y., Lin, I. L., Syue, W. J., Chen, Y. F. et al. (2021). Inflammation-related pyroptosis, a novel programmed cell death pathway, and its crosstalk with immune therapy in cancer treatment. Theranostics, 11(18), 8813–8835. https://doi.org/10.7150/thno.62521 [Google Scholar] [PubMed] [CrossRef]
9. Gong, Y., Fan, Z., Luo, G., Yang, C., Huang, Q. et al. (2019). The role of necroptosis in cancer biology and therapy. Molecular Cancer, 18(1), 646. https://doi.org/10.1186/s12943-019-1029-8 [Google Scholar] [PubMed] [CrossRef]
10. Zhang, X., Zhang, P., An, L., Sun, N., Peng, L. et al. (2020). Miltirone induces cell death in hepatocellular carcinoma cell through GSDME-dependent pyroptosis. Acta Pharmaceutica Sinica B, 10(8), 1397–1413. https://doi.org/10.1016/j.apsb.2020.06.015 [Google Scholar] [PubMed] [CrossRef]
11. Seehawer, M., Heinzmann, F., D'artista, L., Harbig, J., Roux, P. F. et al. (2018). Necroptosis microenvironment directs lineage commitment in liver cancer. Nature, 562(7725), 69–75. https://doi.org/10.1038/s41586-018-0519-y [Google Scholar] [PubMed] [CrossRef]
12. Malireddi R.K., S., Karki, R., Sundaram, B., Kancharana, B., Lee, S. et al. (2021). Inflammatory cell death, PANoptosis, mediated by cytokines in diverse cancer lineages inhibits tumor growth. Immunohorizons, 5(7), 568–580. https://doi.org/10.4049/immunohorizons.2100059 [Google Scholar] [PubMed] [CrossRef]
13. Fu, X. W., Song, C. Q. (2021). Identification and validation of pyroptosis-related gene signature to predict prognosis and reveal immune infiltration in hepatocellular carcinoma. Frontiers in Cell and Developmental Biology, 9, 748039. https://doi.org/10.3389/fcell.2021.748039 [Google Scholar] [PubMed] [CrossRef]
14. Hu, T., Zhao, X., Zhao, Y., Cheng, J., Xiong, J. et al. (2022). Identification and verification of necroptosis-related gene signature and associated regulatory axis in breast cancer. Frontiers in Genetics, 13, 842218. https://doi.org/10.3389/fgene.2022.842218 [Google Scholar] [PubMed] [CrossRef]
15. Tang, H., Wang, J., Luo, X., Wang, Q., Chen, J. et al. (2021). An apoptosis-related gene prognostic index for colon cancer. Frontiers in Cell and Developmental Biology, 9, 790878. https://doi.org/10.3389/fcell.2021.790878 [Google Scholar] [PubMed] [CrossRef]
16. Pan, H., Pan, J., Li, P., Gao, J. (2022). Characterization of PANoptosis patterns predicts survival and immunotherapy response in gastric cancer. Clinical Immunology, 238(5), 109019. https://doi.org/10.1016/j.clim.2022.109019 [Google Scholar] [PubMed] [CrossRef]
17. Zhao, Z., Liu, H., Zhou, X., Fang, D., Ou, X. et al. (2021). Necroptosis-related lncRNAs: Predicting prognosis and the distinction between the cold and hot tumors in gastric cancer. Journal of Oncology, 2021, 6718443. https://doi.org/10.1155/2021/6718443 [Google Scholar] [PubMed] [CrossRef]
18. Liberzon, A., Birger, C., Thorvaldsdottir, H., Ghandi, M., Mesirov, J. P. et al. (2015). The molecular signatures database (MSigDB) hallmark gene set collection. Cell Systems, 1(6), 417–425. https://doi.org/10.1016/j.cels.2015.12.004 [Google Scholar] [PubMed] [CrossRef]
19. Song, W., Ren, J., Xiang, R., Kong, C., Fu, T. (2021). Identification of pyroptosis-related subtypes, the development of a prognosis model, and characterization of tumor microenvironment infiltration in colorectal cancer. Oncoimmunology, 10(1), 1987636. https://doi.org/10.1080/2162402X.2021.1987636 [Google Scholar] [PubMed] [CrossRef]
20. Newman, A. M., Liu, C. L., Green, M. R., Gentles, A. J., Feng, W. et al. (2015). Robust enumeration of cell subsets from tissue expression profiles. Nature Methods, 12(5), 453–457. https://doi.org/10.1038/nmeth.3337 [Google Scholar] [PubMed] [CrossRef]
21. Sun, Y., Wu, L., Zhong, Y., Zhou, K., Hou, Y. et al. (2021). Single-cell landscape of the ecosystem in early-relapse hepatocellular carcinoma. Cell, 184(2), 404–421.e16. https://doi.org/10.1016/j.cell.2020.11.041 [Google Scholar] [PubMed] [CrossRef]
22. Stuart, T., Butler, A., Hoffman, P., Hafemeister, C., Papalexi, E. et al. (2019). Comprehensive integration of single-cell data. Cell, 177(7), 1888–1902.e21. https://doi.org/10.1016/j.cell.2019.05.031 [Google Scholar] [PubMed] [CrossRef]
23. Aeffner, F., Wilson, K., Martin, N. T., Black, J. C., Hendriks C.L., L. et al. (2017). The gold standard paradox in digital image analysis: Manual versus automated scoring as ground truth. Archives of Pathology & Laboratory Medicine, 141(9), 1267–1275. https://doi.org/10.5858/arpa.2016-0386-RA [Google Scholar] [PubMed] [CrossRef]
24. Behan, F. M., Iorio, F., Picco, G., Goncalves, E., Beaver, C. M. et al. (2019). Prioritization of cancer therapeutic targets using CRISPR-Cas9 screens. Nature, 568(7753), 511–516. https://doi.org/10.1038/s41586-019-1103-9 [Google Scholar] [PubMed] [CrossRef]
25. Christgen, S., Zheng, M., Kesavardhana, S., Karki, R., Malireddi R.K., S. et al. (2020). Identification of the PANoptosome: A molecular platform triggering pyroptosis, apoptosis, and necroptosis (PANoptosis). Frontiers in Cellular and Infection Microbiology, 10, 237. https://doi.org/10.3389/fcimb.2020.00237 [Google Scholar] [PubMed] [CrossRef]
26. Zheng, M., Kanneganti, T. D. (2020). The regulation of the ZBP1-NLRP3 inflammasome and its implications in pyroptosis, apoptosis, and necroptosis (PANoptosis). Immunological Reviews, 297(1), 26–38. https://doi.org/10.1111/imr.12909 [Google Scholar] [PubMed] [CrossRef]
27. Mohammad, R. M., Muqbil, I., Lowe, L., Yedjou, C., Hsu, H. Y. et al. (2015). Broad targeting of resistance to apoptosis in cancer. Seminars in Cancer Biology, 35, S78–S103. https://doi.org/10.1016/j.semcancer.2015.03.001 [Google Scholar] [PubMed] [CrossRef]
28. Koren, E., Fuchs, Y. (2021). Modes of regulated cell death in cancer. Cancer Discovery, 11(2), 245–265. https://doi.org/10.1158/2159-8290.CD-20-0789 [Google Scholar] [PubMed] [CrossRef]
29. Shao, W., Yang, Z., Fu, Y., Zheng, L., Liu, F. et al. (2021). The pyroptosis-related signature predicts prognosis and indicates immune microenvironment infiltration in gastric cancer. Frontiers in Cell and Developmental Biology, 9, 676485. https://doi.org/10.3389/fcell.2021.676485 [Google Scholar] [PubMed] [CrossRef]
30. Gao, W., Wang, X., Zhou, Y., Wang, X., Yu, Y. (2022). Autophagy, ferroptosis, pyroptosis, and necroptosis in tumor immunotherapy. Signal Transduction and Targeted Therapy, 7(1), 196. https://doi.org/10.1038/s41392-022-01046-3 [Google Scholar] [PubMed] [CrossRef]
31. Tang, R., Xu, J., Zhang, B., Liu, J., Liang, C. et al. (2020). Ferroptosis, necroptosis, and pyroptosis in anticancer immunity. Journal of Hematology & Oncology, 13(1), 110. https://doi.org/10.1186/s13045-020-00946-7 [Google Scholar] [PubMed] [CrossRef]
32. Iasonos, A., Schrag, D., Raj, G. V., Panageas, K. S. (2008). How to build and interpret a nomogram for cancer prognosis. Journal of Clinical Oncology, 26(8), 1364–1370. https://doi.org/10.1200/JCO.2007.12.9791 [Google Scholar] [PubMed] [CrossRef]
33. Wazir, U., Orakzai, M. M., Khanzada, Z. S., Jiang, W. G., Sharma, A. K. et al. (2015). The role of death-associated protein 3 in apoptosis, anoikis and human cancer. Cancer Cell International, 15, 39. https://doi.org/10.1186/s12935-015-0187-z [Google Scholar] [PubMed] [CrossRef]
34. Luigi Mariani, C. B., Mcdonough, W. S., Hoelzinger, D. B., Kaczmarek, E., Ponce, F. et al. (2001). Death-associated protein 3 (Dap-3) is overexpressed in invasive glioblastoma cells in vivo and in glioma cell lines with induced motility phenotype in vitro1. Clinical Cancer Research, 7(8), 2480–2489. [Google Scholar]
35. Gera, R., Mokbel, L., Jiang, W. G., Mokbel, K. (2018). mRNA expression of CDK2AP1 in human breast cancer: Correlation with clinical and pathological parameters. Cancer Genomics Proteomics, 15(6), 447–452. https://doi.org/10.21873/cgp.20103 [Google Scholar] [PubMed] [CrossRef]
36. Gao, Q., Xia, Y., Liu, L., Huang, L., Liu, Y. et al. (2016). Galectin-3 enhances migration of minature pig bone marrow mesenchymal stem cells through inhibition of RhoA-GTP activity. Scientific Reports, 6, 26577. https://doi.org/10.1038/srep26577 [Google Scholar] [PubMed] [CrossRef]
37. Gao, X., Balan, V., Tai, G., Raz, A. (2014). Galectin-3 induces cell migration via a calcium-sensitive MAPK/ERK1/2 pathway. Oncotarget, 5(8), 2077–2084. https://doi.org/10.18632/oncotarget.1786 [Google Scholar] [PubMed] [CrossRef]
38. Song, M., Pan, Q., Yang, J., He, J., Zeng, J. et al. (2020). Galectin-3 favours tumour metastasis via the activation of beta-catenin signalling in hepatocellular carcinoma. British Journal of Cancer, 123(10), 1521–1534. https://doi.org/10.1038/s41416-020-1022-4 [Google Scholar] [PubMed] [CrossRef]
39. Nangia-Makker, P., Hogan, V., Raz, A. (2018). Galectin-3 and cancer stemness. Glycobiology, 28(4), 172–181. https://doi.org/10.1093/glycob/cwy001 [Google Scholar] [PubMed] [CrossRef]
40. Vuong, L., Kouverianou, E., Rooney, C. M., Mchugh, B. J., Howie S.E., M. et al. (2019). An orally active galectin-3 antagonist inhibits lung adenocarcinoma growth and augments response to PD-L1 blockade. Cancer Research, 79(7), 1480–1492. https://doi.org/10.1158/0008-5472.CAN-18-2244 [Google Scholar] [PubMed] [CrossRef]
41. Beg, M., Srivastava, A., Shankar, K., Varshney, S., Rajan, S. et al. (2016). PPP2R5B, a regulatory subunit of PP2A, contributes to adipocyte insulin resistance. Molecular and Cellular Endocrinology, 437, 97–107. https://doi.org/10.1016/j.mce.2016.08.016 [Google Scholar] [PubMed] [CrossRef]
42. Cunningham, C. E., Li, S., Vizeacoumar, F. S., Bhanumathy, K. K., Lee, J. S. et al. (2016). Therapeutic relevance of the protein phosphatase 2A in cancer. Oncotarget, 7(38), 61544–61561. https://doi.org/10.18632/oncotarget.11399 [Google Scholar] [PubMed] [CrossRef]
43. Xu, Q., Tu, J., Dou, C., Zhang, J., Yang, L. et al. (2017). HSP90 promotes cell glycolysis, proliferation and inhibits apoptosis by regulating PKM2 abundance via Thr-328 phosphorylation in hepatocellular carcinoma. Molecular Cancer, 16(1), 178. https://doi.org/10.1186/s12943-017-0748-y [Google Scholar] [PubMed] [CrossRef]
44. Regan, P. L., Jacobs, J., Wang, G., Torres, J., Edo, R. et al. (2011). Hsp90 inhibition increases p53 expression and destabilizes MYCN and MYC in neuroblastoma. International Journal of Oncology, 38(1), 105–112. [Google Scholar] [PubMed]
45. Chu, S. H., Liu, Y. W., Zhang, L., Liu, B., Li, L. et al. (2013). Regulation of survival and chemoresistance by HSP90AA1 in ovarian cancer SKOV3 cells. Molecular Biology Reports, 40(1), 1–6. https://doi.org/10.1007/s11033-012-1930-3 [Google Scholar] [PubMed] [CrossRef]
46. Xiao, X., Wang, W., Li, Y., Yang, D., Li, X. et al. (2018). HSP90AA1-mediated autophagy promotes drug resistance in osteosarcoma. Journal of Experimental & Clinical Cancer Research, 37(1), 201. https://doi.org/10.1186/s13046-018-0880-6 [Google Scholar] [PubMed] [CrossRef]
47. Peifer, M., Fernandez-Cuesta, L., Sos, M. L., George, J., Seidel, D. et al. (2012). Integrative genome analyses identify key somatic driver mutations of small-cell lung cancer. Nature Genetics, 44(10), 1104–1110. https://doi.org/10.1038/ng.2396 [Google Scholar] [PubMed] [CrossRef]
48. Grunblatt, E., Wu, N., Zhang, H., Liu, X., Norton, J. P. et al. (2020). MYCN drives chemoresistance in small cell lung cancer while USP7 inhibition can restore chemosensitivity. Genes & Development, 34(17–18), 1210–1226. https://doi.org/10.1101/gad.340133.120 [Google Scholar] [PubMed] [CrossRef]
49. Yasukawa, K., Liew, L. C., Hagiwara, K., Hironaka-Mitsuhashi, A., Qin, X. Y. et al. (2020). MicroRNA-493-5p-mediated repression of the MYCN oncogene inhibits hepatic cancer cell growth and invasion. Cancer Science, 111(3), 869–880. https://doi.org/10.1111/cas.14292 [Google Scholar] [PubMed] [CrossRef]
50. Drake, L. E., Springer, M. Z., Poole, L. P., Kim, C. J., Macleod, K. F. (2017). Expanding perspectives on the significance of mitophagy in cancer. Seminars in Cancer Biology, 47, 110–124. https://doi.org/10.1016/j.semcancer.2017.04.008 [Google Scholar] [PubMed] [CrossRef]
51. Blajszczak, C., Bonini, M. G. (2017). Mitochondria targeting by environmental stressors: Implications for redox cellular signaling. Toxicology, 391, 84–89. https://doi.org/10.1016/j.tox.2017.07.013 [Google Scholar] [PubMed] [CrossRef]
52. Panigrahi, D. P., Praharaj, P. P., Bhol, C. S., Mahapatra, K. K., Patra, S. et al. (2020). The emerging, multifaceted role of mitophagy in cancer and cancer therapeutics. Seminars in Cancer Biology, 66(4), 45–58. https://doi.org/10.1016/j.semcancer.2019.07.015 [Google Scholar] [PubMed] [CrossRef]
53. Nigg, E. A. (1998). Polo-like kinases: Positive regulators of cell division from start to finish. Current Opinion in Cell Biology, 10(6), 776–783. https://doi.org/10.1016/S0955-0674(98)80121-X [Google Scholar] [PubMed] [CrossRef]
54. Sun, W., Su, Q., Cao, X., Shang, B., Chen, A. et al. (2014). High expression of polo-like kinase 1 is associated with early development of hepatocellular carcinoma. International Journal of Genomics, 2014, 312130. https://doi.org/10.1155/2014/312130 [Google Scholar] [PubMed] [CrossRef]
55. Gutteridge, R. E., Ndiaye, M. A., Liu, X., Ahmad, N. (2016). Plk1 inhibitors in cancer therapy: From laboratory to clinics. Molecular Cancer Therapeutics, 15(7), 1427–1435. https://doi.org/10.1158/1535-7163.MCT-15-0897 [Google Scholar] [PubMed] [CrossRef]
56. Lin, X. T., Yu, H. Q., Fang, L., Tan, Y., Liu, Z. Y. et al. (2021). Elevated FBXO45 promotes liver tumorigenesis through enhancing IGF2BP1 ubiquitination and subsequent PLK1 upregulation. Elife, 10, 1485. https://doi.org/10.7554/eLife.70715 [Google Scholar] [PubMed] [CrossRef]
57. Wang, Y., Gao, W., Shi, X., Ding, J., Liu, W. et al. (2017). Chemotherapy drugs induce pyroptosis through caspase-3 cleavage of a gasdermin. Nature, 547(7661), 99–103. https://doi.org/10.1038/nature22393 [Google Scholar] [PubMed] [CrossRef]
58. Garnelo, M., Tan, A., Her, Z., Yeong, J., Lim, C. J. et al. (2017). Interaction between tumour-infiltrating B cells and T cells controls the progression of hepatocellular carcinoma. Gut, 66(2), 342–351. https://doi.org/10.1136/gutjnl-2015-310814 [Google Scholar] [PubMed] [CrossRef]
59. Kovacs, T., Miko, E., Ujlaki, G., Sari, Z., Bai, P. (2020). The microbiome as a component of the tumor microenvironment. Advances in Experimental Medicine and Biology, 1225, 137–153. https://doi.org/10.1007/978-3-030-35727-6 [Google Scholar] [CrossRef]
60. Gabrilovich, D. I., Ostrand-Rosenberg, S., Bronte, V. (2012). Coordinated regulation of myeloid cells by tumours. Nature Reviews Immunology, 12(4), 253–268. https://doi.org/10.1038/nri3175 [Google Scholar] [PubMed] [CrossRef]
61. Murdoch, C., Muthana, M., Coffelt, S. B., Lewis, C. E. (2008). The role of myeloid cells in the promotion of tumour angiogenesis. Nature Reviews Cancer, 8(8), 618–631. https://doi.org/10.1038/nrc2444 [Google Scholar] [PubMed] [CrossRef]
62. Zhang, P. F., Gao, C., Huang, X. Y., Lu, J. C., Guo, X. J. et al. (2020). Cancer cell-derived exosomal circUHRF1 induces natural killer cell exhaustion and may cause resistance to anti-PD1 therapy in hepatocellular carcinoma. Molecular Cancer, 19(1), 110. https://doi.org/10.1186/s12943-020-01222-5 [Google Scholar] [PubMed] [CrossRef]
63. Sajid, M., Liu, L., Sun, C. (2022). The dynamic role of NK cells in liver cancers: Role in HCC and HBV associated HCC and its therapeutic implications. Frontiers in Immunology, 13, 887186. https://doi.org/10.3389/fimmu.2022.887186 [Google Scholar] [PubMed] [CrossRef]
64. Chen, Q., Hu, L., Chen, K. (2020). Construction of a nomogram based on a hypoxia-related lncRNA signature to improve the prediction of gastric cancer prognosis. Frontiers in Genetics, 11, 570325. https://doi.org/10.3389/fgene.2020.570325 [Google Scholar] [PubMed] [CrossRef]
65. Kong, C., Zhao, Z., Chen, W., Lv, X., Shu, G. et al. (2021). Prediction of tumor response via a pretreatment MRI radiomics-based nomogram in HCC treated with TACE. European Radiology, 31(10), 7500–7511. https://doi.org/10.1007/s00330-021-07910-0 [Google Scholar] [PubMed] [CrossRef]
66. Yang, L., Gu, D., Wei, J., Yang, C., Rao, S. et al. (2019). A radiomics nomogram for preoperative prediction of microvascular invasion in hepatocellular carcinoma. Liver Cancer, 8(5), 373–386. https://doi.org/10.1159/000494099 [Google Scholar] [PubMed] [CrossRef]
67. Liang, W., Zhang, L., Jiang, G., Wang, Q., Liu, L. et al. (2015). Development and validation of a nomogram for predicting survival in patients with resected non-small-cell lung cancer. Journal of Clinical Oncology, 33(8), 861–869. https://doi.org/10.1200/JCO.2014.56.6661 [Google Scholar] [PubMed] [CrossRef]
68. Rose, P. G., Java, J., Whitney, C. W., Stehman, F. B., Lanciano, R. et al. (2015). Nomograms predicting progression-free survival, overall survival, and pelvic recurrence in locally advanced cervical cancer developed from an analysis of identifiable prognostic factors in patients from NRG oncology/gynecologic oncology group randomized trials of chemoradiotherapy. Journal of Clinical Oncology, 33(19), 2136–2142. https://doi.org/10.1200/JCO.2014.57.7122 [Google Scholar] [PubMed] [CrossRef]
69. Liu, P., Wei, J., Mao, F., Xin, Z., Duan, H. et al. (2021). Establishment of a prognostic model for hepatocellular carcinoma based on endoplasmic reticulum stress-related gene analysis. Frontiers in Oncology, 11, 641487. https://doi.org/10.3389/fonc.2021.641487 [Google Scholar] [PubMed] [CrossRef]
Supplementary Materials

Supplementary Figure 1: PCA and t-SNE analysis of ICGC dataset.
Supplementary Figure 2: (A) GO analysis of ICGC dataset (B) KEGG analysis of ICGC dataset.
Cite This Article
 Copyright © 2023 The Author(s). Published by Tech Science Press.
This work is licensed under a Creative Commons Attribution 4.0 International License , which permits unrestricted use, distribution, and reproduction in any medium, provided the original work is properly cited.
 Downloads
 Citation Tools