
 Submit a Paper
 Propose a Special lssue
 Open Access
ARTICLE

Comprehensive molecular analysis to predict the efficacy of chemotherapy containing bevacizumab in patients with metastatic colorectal cancer
1 Division of Hematology/Oncology, Department of Medicine, Samsung Medical Center, Sungkyunkwan University School of Medicine, Gangnam-gu, Seoul, 06351, Korea
2 Precision Medicine Research Institute, Samsung Medical Center, Gangnam-gu, Seoul, 06351, Korea
3 Department of Biomedical Convergence Science and Technology, Kyungpook National University, Daegu, 41566, Korea
4 Department of Pathology and Translational Genomics, Samsung Medical Center, Sungkyunkwan University School of Medicine, Seoul, 06351, Korea
5 Department of Surgery, Samsung Medical Center, Sungkyunkwan University School of Medicine, Gangnam-gu, Seoul, 06351, Korea
* Corresponding Authors: HEE CHEOL KIM. Email: ; SEUNG TAE KIM. Email:
# These authors contributed equally to this work
Oncology Research 2023, 31(6), 855-866. https://doi.org/10.32604/or.2023.030374
Received 03 April 2023; Accepted 24 July 2023; Issue published 15 September 2023
 View Full Text
 Download PDF
Abstract
Background: Although bevacizumab is an important treatment for metastatic colorectal cancer (CRC), not all patients with CRC benefit from it; in unselected patient populations, only modest survival benefits have been reported. Methods: We evaluated clinical outcomes in 110 patients using comprehensive molecular characterization to identify biomarkers for a response to bevacizumab-containing treatment. The molecular analysis comprised whole-exome sequencing, ribonucleic acid sequencing, and a methylation array on patient tissues. Results: Genomic and molecular characterization was successfully conducted in 103 patients. Six of 103 CRC samples were hypermutated, and none of the non-hypermutant tumors were microsatellite unstable. Among those 103 patients, 89 had adenocarcinoma (ADC), 15 were diagnosed with mucinous ADC, and six had signet-ring cell carcinoma (SRCC). Consensus molecular subtype (CMS) 2 was unique to ADC. Of the four SRCCs, two were CMS1, one was CMS4, and the other was CMS3. APC mutation status was a significantly enriched factor in responders to bevacizumab treatment. Fibroblast growth factor receptor (FGFR) 1/2 signaling was upregulated in non-responders, whereas cell cycle, transfer ribonucleic acid processing, nucleotide excision repair, and oxidative phosphorylation pathways were enriched in responders. In addition, IGF1 was differentially expressed in non-responders (log2 fold change = −1.43, p = 4.11 × 10⁻⁵, false discovery rate = 0.098), and FLT1 was highly methylated in non-responders (p = 7.55 × 10⁻³). When the molecular pathways were reanalyzed separately according to the backbone chemotherapy (FOLFOX vs. FOLFIRI), the significance of the molecular pathways varied according to the backbone chemotherapy. Conclusions: This study sought a subset of CRC patients with a distinct clinical response to chemotherapy containing bevacizumab. Our results need to be validated in a large group of homogenous patient cohort and examined according to the different chemotherapy backbones to create personalized therapeutic opportunities in CRC.Keywords
Supplementary Material
Supplementary Material FileColorectal cancer (CRC) accounts for 8.5% of all tumor-related mortality and is the fourth most common cause of cancer death [1]. CRC resection offers a good prognosis, but 20%–25% of patients already have metastatic lesions at their initial diagnosis, and approximately half of patients who have a CRC resection eventually experience advanced disease [2]. The prognosis for patients with metastatic CRC is extremely poor. Several factors contribute to improved clinical outcomes [3], and the introduction of novel therapies molecularly targeting either epidermal growth factor signaling, or angiogenesis has been a key development [4–7].
Vascular endothelial growth factors (VEGFs), particularly VEGF-A, have been identified as key factors inducing tumor angiogenesis [8–10]. VEGFs can stimulate the proliferation and survival of endothelial cells and increase the permeability of vessels, thereby supporting the metabolic demands of growing tumors [11]. Treatment with bevacizumab, a monoclonal antibody directed against VEGF, could decrease present tumor vasculature and prevent the growth of new blood vessels, thereby impeding tumor progress. Bevacizumab-based therapy has improved the survival of patients with metastatic CRC [4,5,12,13]. The Food and Drug Administration approved bevacizumab as a first- or second-line treatment joined with chemotherapy for metastatic CRC, based on the survival benefit shown in a landmark trial.
Although bevacizumab has played an important role in treating metastatic CRC, not all patients with CRC benefit from it; in unselected patient populations, only modest survival benefits have been reported [14,15]. Identifying novel biomarkers that could determine which patients are likely to benefit from bevacizumab is thus essential because CRC is a heterogeneous disease consisting of several subtypes with distinct molecular traits [16,17]. In this study, we directly compare clinical outcomes with results from a comprehensive molecular characterization to identify novel biomarkers that could maximize the effective use of bevacizumab in patients with CRC.
Among the patients with metastatic CRC who received bevacizumab-containing chemotherapy as a first- or second-line treatment at Samsung Medical Center between January 2018 and January 2019, 110 patients with samples available for a comprehensive molecular analysis were included in this study. The molecular analysis comprised whole-exome sequencing, ribonucleic acid (RNA) sequencing, and a methylation array of tumor and matched normal patient tissues. Data from the medical records of each patient (age, sex, primary tumor site, histologic type, range of metastasis, treatments, and treatment outcomes) were also examined, particularly the outcomes of bevacizumab treatment. This study was approved by the Institutional Review Board of Samsung Medical Center (#2019-08-064) and was conducted in agreement with the ethical principles of the Declaration of Helsinki and Korean Good Clinical Practice guidelines. All patients provided written informed consent, which included the disclosure of information about the purpose, benefit, and potential risks of this study, the competency of patients to make a decision, and the voluntary nature of the decision to participate.
Tumor tissues were obtained prior to the start of bevacizumab treatment. If the tumor content was ≥40% after pathological assessment, tumor deoxyribonucleic acid (DNA) and RNA were mined from freshly acquired tissues using a QIAamp mini kit (Qiagen, Hilden, Germany) in accordance with the manufacturer's instructions. For DNA, we used RNaseA (cat. #19101; Qiagen). We determined the concentrations and absorbance ratios (OD260/OD280 and OD260/OD230) with an ND1000 spectrophotometer (NanoDrop Technologies, Thermo Fisher Scientific, MA, USA) and quantified DNA/RNA using a Qubit fluorometer (Life Technologies, CA, USA).
Whole-exome sequencing for tumor tissue
To generate standard exome capture libraries, we used the Agilent SureSelect Target Enrichment protocol for an Illumina paired-end sequencing library (ver. B.3, June 2015) with 200 ng of input formalin-fixed, paraffin-embedded DNA. In all cases, the SureSelect Human All Exon V5 probe set was used. DNA quantity and quality were evaluated using PicoGreen [18] and NanoDrop [19]. Fragmentation of 1 μg of genomic DNA was performed using adaptive focused acoustic technology (Covaris Inc., MA, USA). The fragmented DNA was repaired, an “A” was ligated to the 3 end, and Agilent adapters were ligated to the fragments. Once ligation had been assessed, the adapter-ligated product was amplified using polymerase chain reaction (PCR). Subsequently, the final purified product was quantified using quantitative PCR (qPCR), as directed in the qPCR Quantification Protocol Guide, and assessed using a Caliper High Sensitivity DNA LabChip kit (PerkinElmer Inc., MA, USA). For exome capture, 250 ng of the DNA library was mixed with hybridization buffers, blocking mixes, RNase block, and 5 µl of the SureSelect all exon capture library, according to the standard Agilent SureSelect Target Enrichment protocol. Hybridization to capture baits was performed at 65°C using the heated lid option on a PCR machine with a thermocycler at 105°C for 24 h. The captured DNA was amplified. The final purified product was quantified using qPCR according to the qPCR Quantification Protocol Guide and assessed using a TapeStation RNA ScreenTape (Agilent). Finally, we performed sequencing using the HiSeq™ 2500 platform (Illumina, San Diego, USA).
Whole exome sequencing data analysis
The reads resulting from the whole exome sequencing (WES) were mapped to human genome version 19 (hg19) using the Burrows-Wheeler Aligner (version 0.7.12-r1039) and the BWA-MEM algorithm [20]. SAMtools sorted the aligned sequences by genomic coordinates (v0.1.19) [21]. The sorted reads were subjected to Genome Analysis Toolkit (GATK) v3.6 and v4.13 for duplicate marking, indel realignment, and base recalibration [22]. We performed MuTect2 from GATK v4.13 to detect tumor somatic mutations in the recalibrated bam files from the tumor and matched normal samples. After removing possible germline events (population allele fraction <2.5e-6 in gnomAD), we annotated the called mutations using variant effect predictors [23]. The resulting variant events were converted to maf format, and then the variants with <4 altered reads were eliminated from further analysis in R. The COSMIC v3 single base substitution mutational signatures of each tumor sample were determined using deconstructSigs (v1.8.0, R package) [24,25]. The ngCGH Python package was used to estimate somatic copy number variations in tumor samples by comparison with the matched normal samples.
The total RNA concentration was estimated using Quant-IT RiboGreen (Invitrogen). To determine the DV200 value (% of RNA fragments >200 bp), samples were run on the TapeStation RNA ScreenTape (Agilent). Overall, 100 ng of total RNA was subjected to sequencing library construction using a TruSeq RNA Access Library prep kit (Illumina, San Diego, CA, USA) according to the manufacturer’s protocol. Briefly, total RNA was first fragmented into small pieces using divalent cations at an elevated temperature. The cleaved RNA fragments were copied into first-strand complementary DNA (cDNA) using SuperScript II reverse transcriptase (Invitrogen, #18064014) and random primers. That was followed by second-strand cDNA synthesis using DNA polymerase I, RNase H, and deoxyuridine 5-triphosphate. The cDNA fragments were subjected to an end-repair process, the addition of a single “A” base, and ligation of the adapters. Thereafter, the products were purified and enriched with PCR to create a cDNA library. All libraries were normalized, and six were pooled into a single hybridization/capture reaction. The pooled libraries were incubated with a cocktail of biotinylated oligos corresponding to the coding regions of the genome. Targeted library molecules were captured with hybridized biotinylated oligo probes using streptavidin-conjugated beads. After two rounds of hybridization/capture reactions, the enriched library molecules were subjected to a second round of PCR amplification. The captured libraries were quantified using a KAPA Library Quantification kit for the Illumina Sequencing platforms according to the qPCR Quantification Protocol Guide (KAPA BIOSYSTEMS, #KK4854) and assessed using the TapeStation D1000 ScreenTape (Agilent Technologies, #5067-5582). The indexed libraries were subsequently submitted to the Illumina HiSeq 2500 platform (Illumina, Inc., San Diego, CA, USA), and paired-end (2 × 100 bp) sequencing was performed by Macrogen Inc., Seoul, Korea.
RNA sequence reads were mapped on hg19 by STAR (v2.6.1d) [26] and sorted according to the genomic coordinates. Cufflinks (v2.2.1) was used to calculate gene expression levels in fragments per kilobase million (FPKM) [27] using Ensembl gene annotation. The FPKM values were log2-transformed for further analysis. CMSclassifier (R package) and ESTIMATE (R package) determined the consensus molecular subtype (CMS) of the tumor tissues and tumor purity, respectively [17,28]. The expression scores of gene sets were estimated using the single sample gene set enrichment analysis (ssGSEA) algorithm in GSVA (R package) [29]. The gene set enrichment analysis (GSEA) was performed on GSEA-P [30], and the networks based on the GSEA results were generated using Cytoscape (v3.7.1) Enrichment Map [31]. To identify differentially expressed genes (DEGs) between responders and non-responders to bevacizumab, the DEseq2 (R package) was used [32].
DNA from 75 CRC tumor samples was subjected to the Infinium MethylationEPIC Array to acquire genome-wide DNA methylation profiles in CRC tissues. The raw idat files were processed to generate normalized β-values for each probe using the minfi R package [33]. We selected the top 1500 most variable probes (based on standard deviation) from the normalized β-values and applied an unsupervised hierarchical clustering analysis to the filtered normalized data. Then, we sorted the CpG island methylator phenotypes (CIMPs) into CIMP-high, CIMP-low, and CIMP-negative according to the clusters. To summarize the β-values in each gene level, we first eliminated the probes that (1) were located in chromosome X or Y, (2) had a single nucleotide polymorphism (SNP)-associated distance <10 bp, or (3) were not located in a promoter region (transcription start site >1500 bp). Then, for each sample, the mean β-value of the promoter regions was calculated to represent the promoter methylation level for each gene. In that way, we obtained the promoter methylation levels for 18,226 genes from 75 tumor samples. To compare the gene promoter methylation levels of responders and non-responders, student’s t-test was performed for each gene.
Patient characteristics were summarized using descriptive statistics. The response rate (RR) was calculated as the percentage of patients who experienced a confirmed complete response (CR) or partial response (PR), and the disease control rate (DCR) was calculated as RR + stable disease (SD), following the RECIST 1.1 guidelines. Each nominal variable was compared using Fisher’s exact test or the χ2 test. Survival outcomes were estimated using the Kaplan-Meier method and compared using the log-rank test. The associations between genetic alterations and responses to bevacizumab-containing treatment were analyzed using R; other analyses were conducted using the Statistical Package for the Social Sciences version 19.0 (SPSS Inc., Chicago, IL, USA).
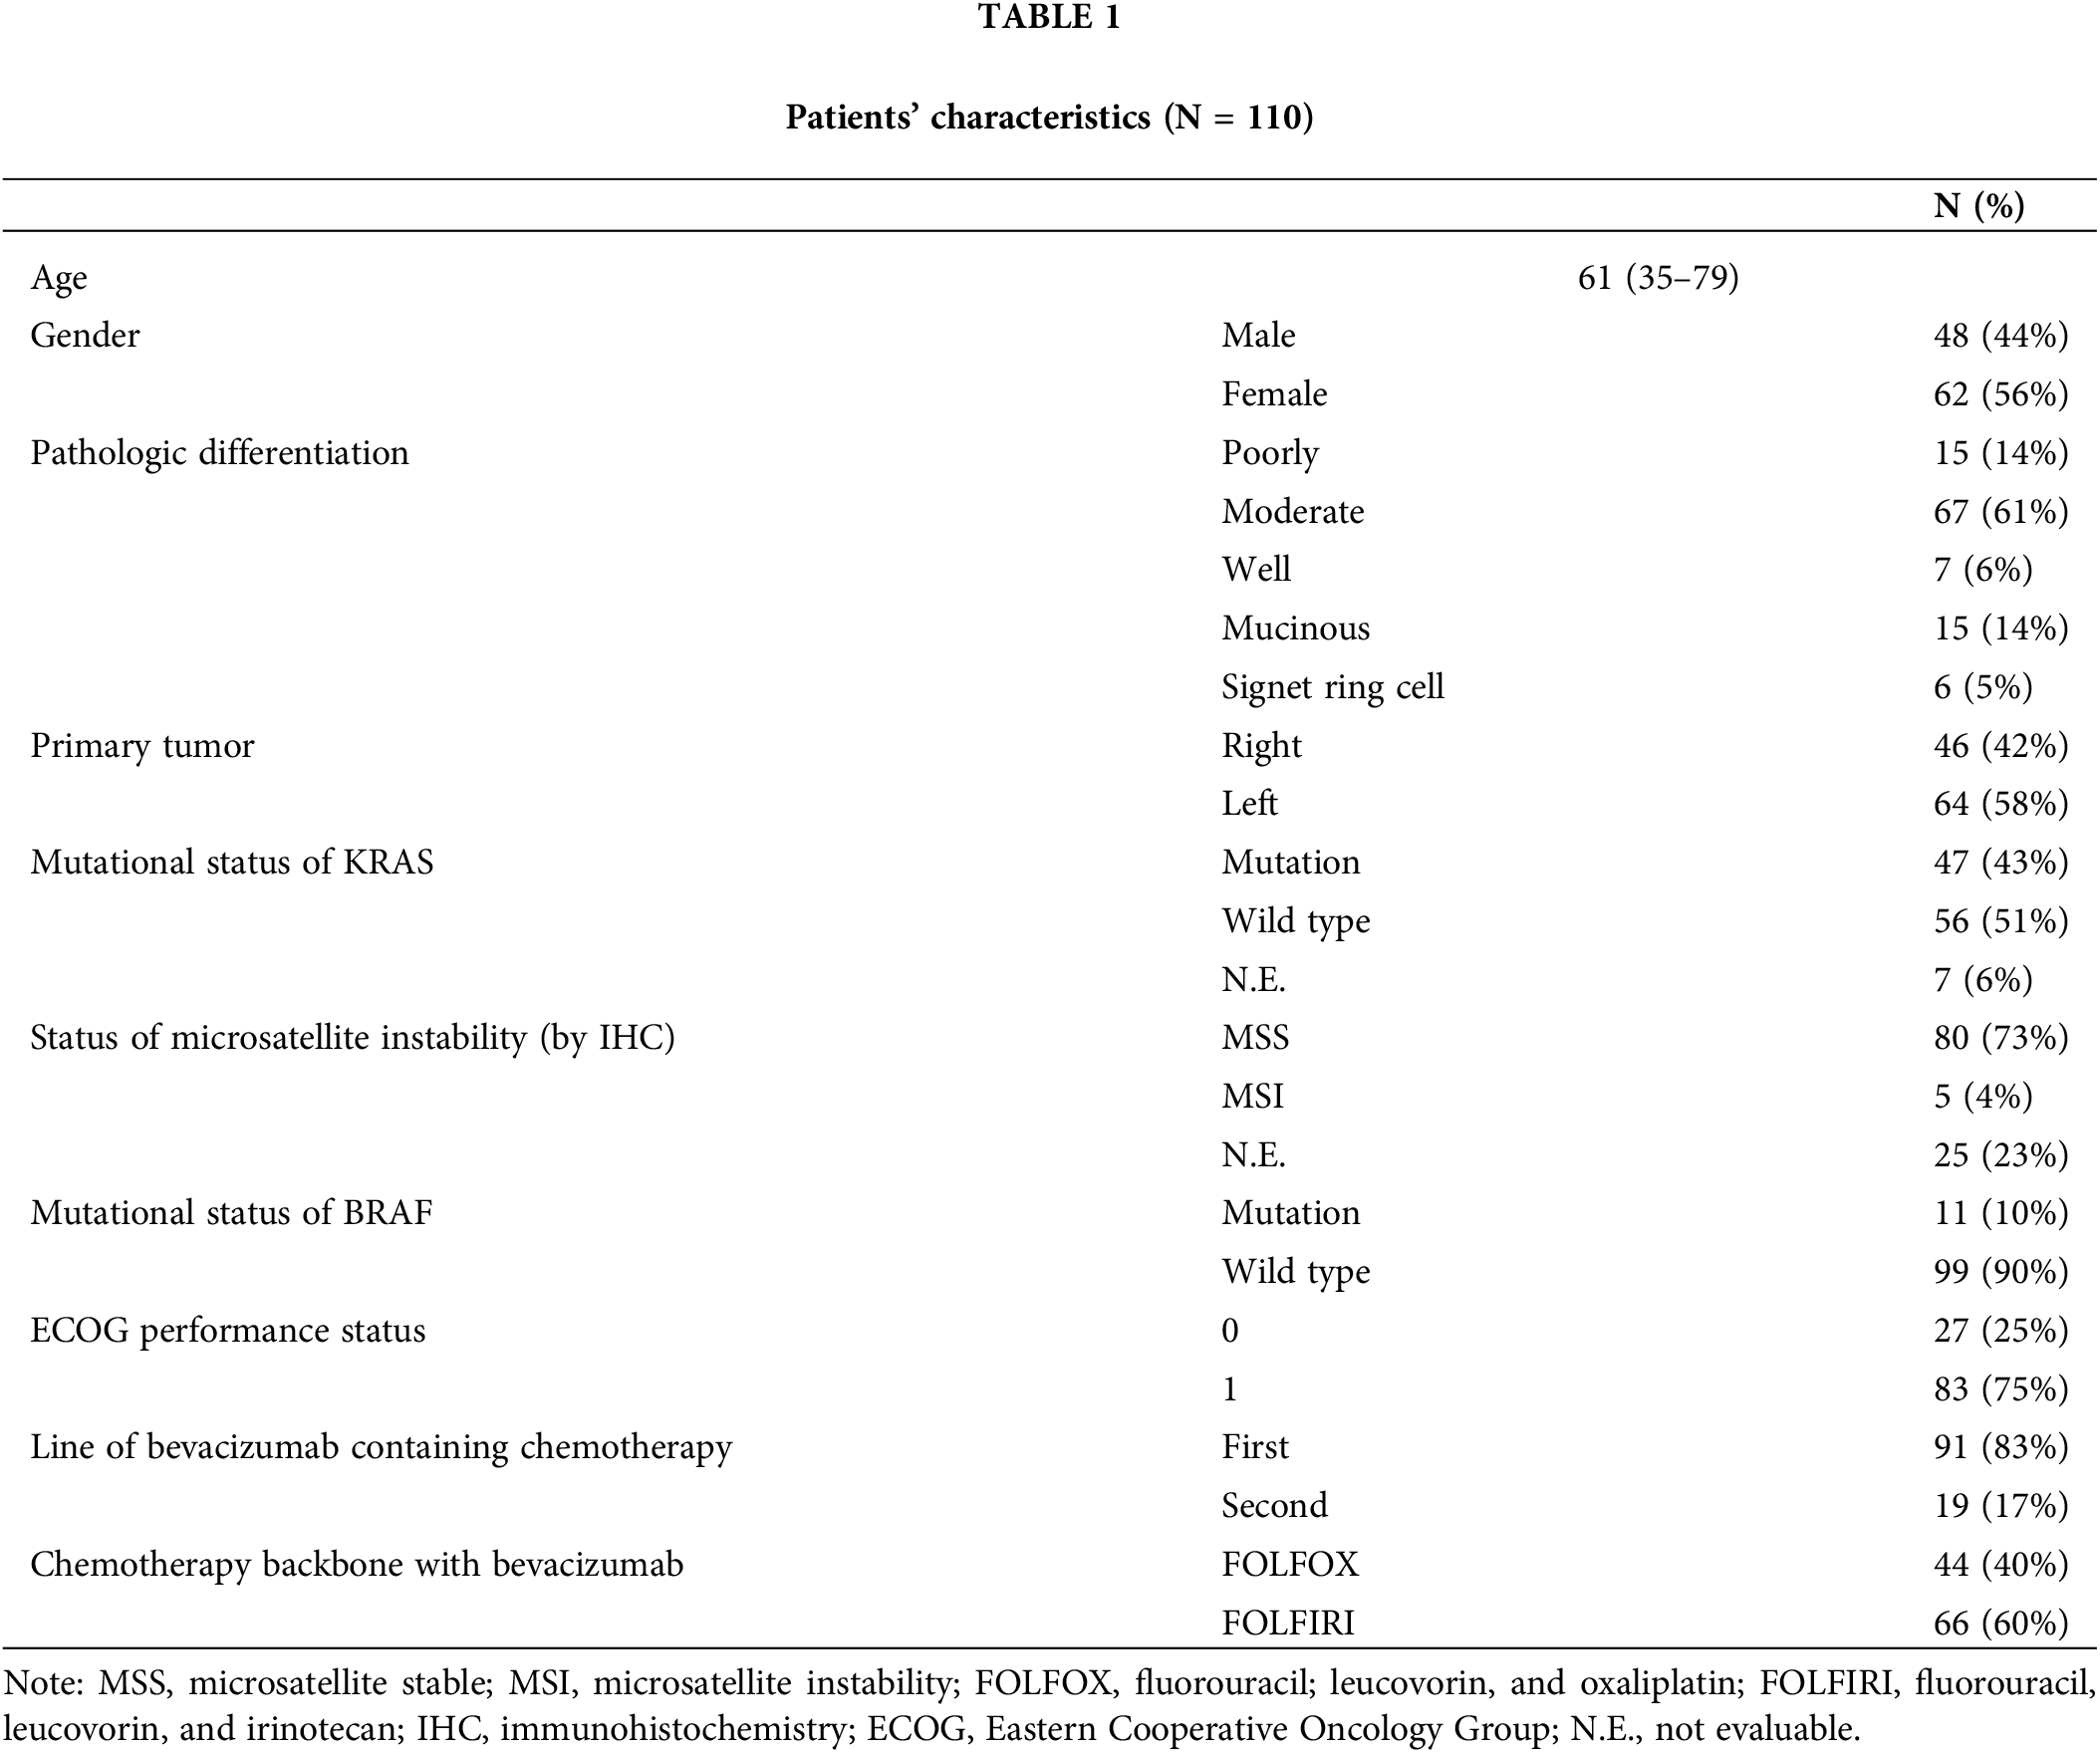
Baseline patient characteristics are presented in Table 1. The median age was 61 years (range: 35–79), and the numbers of females and males were 62 (56%) and 48 (44%), respectively. The most common pathologic differentiation was the moderate type (n = 67%, 61%), and the primary tumor locations were the left side (58%) and right side (42%). BRAF-mutated tumors were found in 11 patients (10%), and the most common BRAF mutation was V600E (N = 8), with L597Q, D594G, and E83G mutations identified in one patient each. The median Eastern Cooperative Oncology Group performance status score was 1. Most patients (83%) received bevacizumab treatment as the first-line treatment, and 60% of the patients received treatment with fluorouracil, irinotecan, and leucovorin as the backbone chemotherapy and 40% of the patients were treated with fluorouracil, oxaliplatin and leucovorin as the backbone chemotherapy.
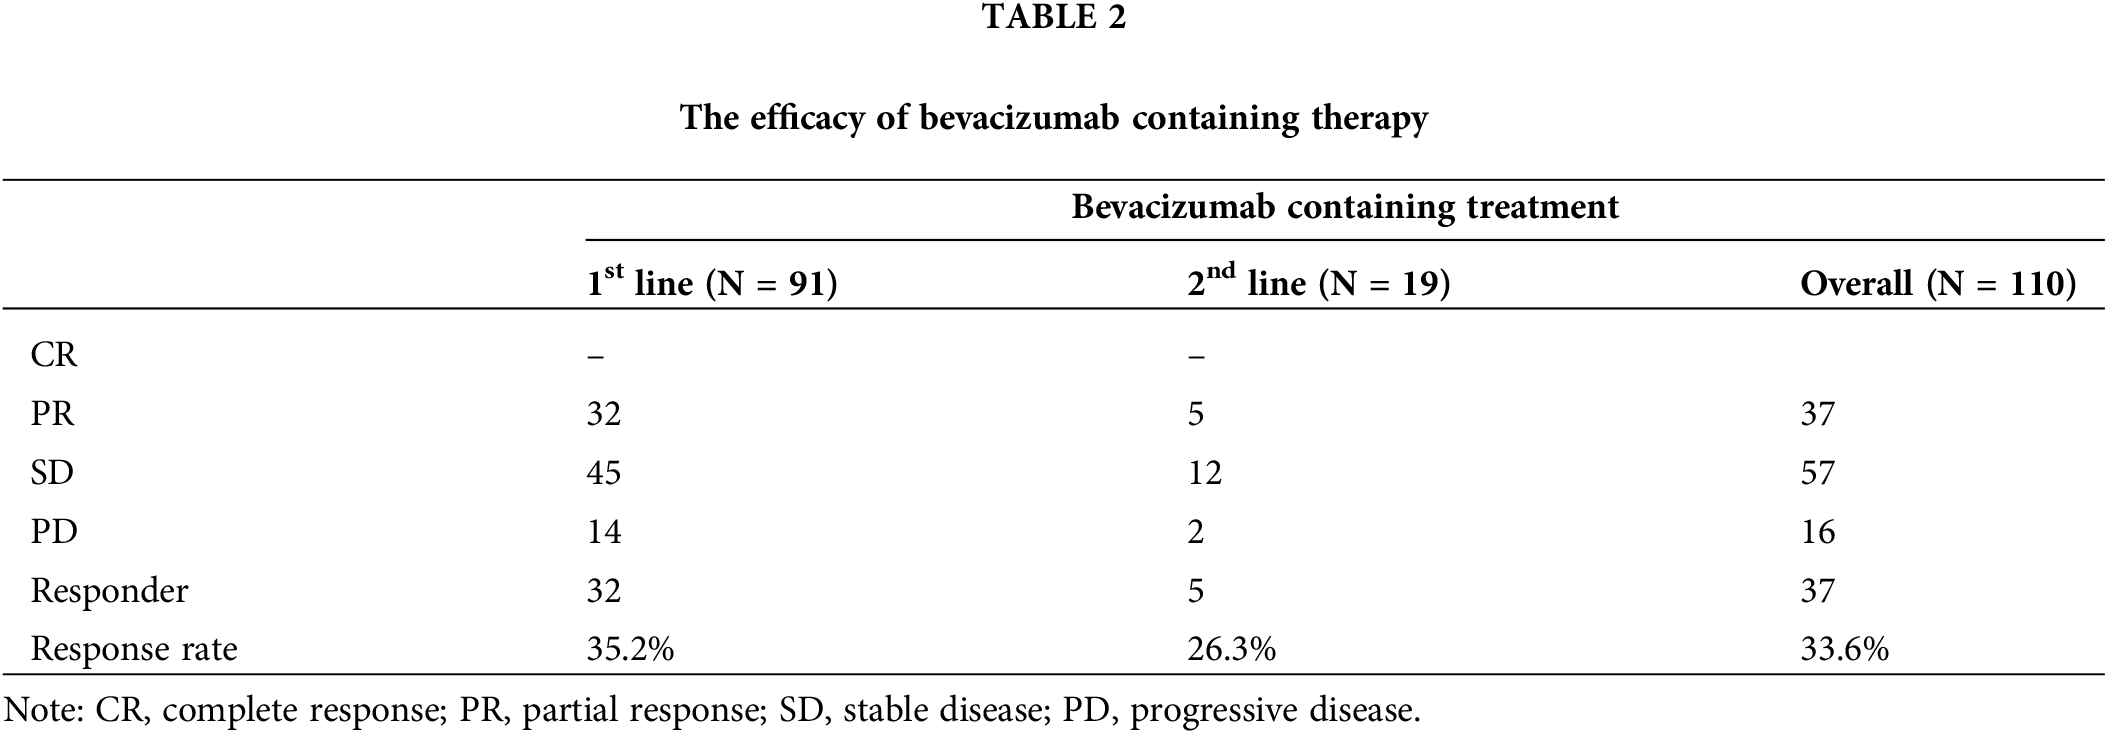
Of the 110 patients, 37 showed a PR (33%), 57 achieved SD (52%), and 16 had progressive disease (PD) (15%) (Table 2). The overall confirmed RR and DCR were 33% and 85%, respectively.
No significant difference in the patient characteristics between the response group and non-response groups (Suppl. Table S1).
Genomic landscape and correlates of response to bevacizumab
To characterize the genomic and molecular features that dictate the response to bevacizumab, we performed whole-exome sequencing, RNA sequencing, and a methylation array on tumor and matched normal tissues derived from 103 patients with CRC (Fig. 1A). Seven of the 110 patients had insufficient samples for the analysis. Of the 103 CRC samples, six were hypermutated, five were microsatellite instable (MSI), and three showed MLH1 epigenetic silencing (Fig. 1A). None of the non-hypermutant tumors was MSI. The ultra-hypermutant tumor (#40) was microsatellite stable; however, it was POLE-mutant and accordingly displayed a high proportion of POLE-induced mutational signatures (Suppl. Fig. S1A). MutSigCV identified the significantly mutated genes in the CRC cohort as follows: adenomatous polyposis coli (APC, 72%), SOX9 (17%), TP53 (77%), KRAS (61%), SMAD4 (19%), and FBWX7 (21%), which is similar to the results of previous studies (Suppl. Fig. S1B) [16]. Among the 110 CRC patients, 89 were diagnosed with adenocarcinoma (ADC), 15 were diagnosed with mucinous ADC, and the other 6 were diagnosed with signet-ring cell carcinoma (SRCC). The three different pathologies displayed distinct molecular traits. The CMS2 subtype, which is a canonical subtype characterized by low stromal/immune infiltration [17], was unique to ADC (Fig. 1B). Consistently, ADC showed significantly higher tumor purity than the other CRC types (Fig. 1C). Moreover, tumor microenvironment infiltration was high in SRCC, and tumor purity was low (Fig. 1C). Of the four SRCCs, two were CMS1 (immune activation), one was CMS4 (mesenchymal subtype), and the other was CMS3 (metabolic subtype) (Fig. 1D). In addition, we classified the tumor samples as CIMP-high, CIMP-low, and CIMP-negative using unsupervised clustering of DNA methylation (Suppl. Fig. S2A). As expected, the tumor purities were lower in CIMP-high samples than in CIMP-low and CIMP-negative samples, and >50% of the CIMP-high samples were identified as the CMS1 subtype (Fig. 1B).
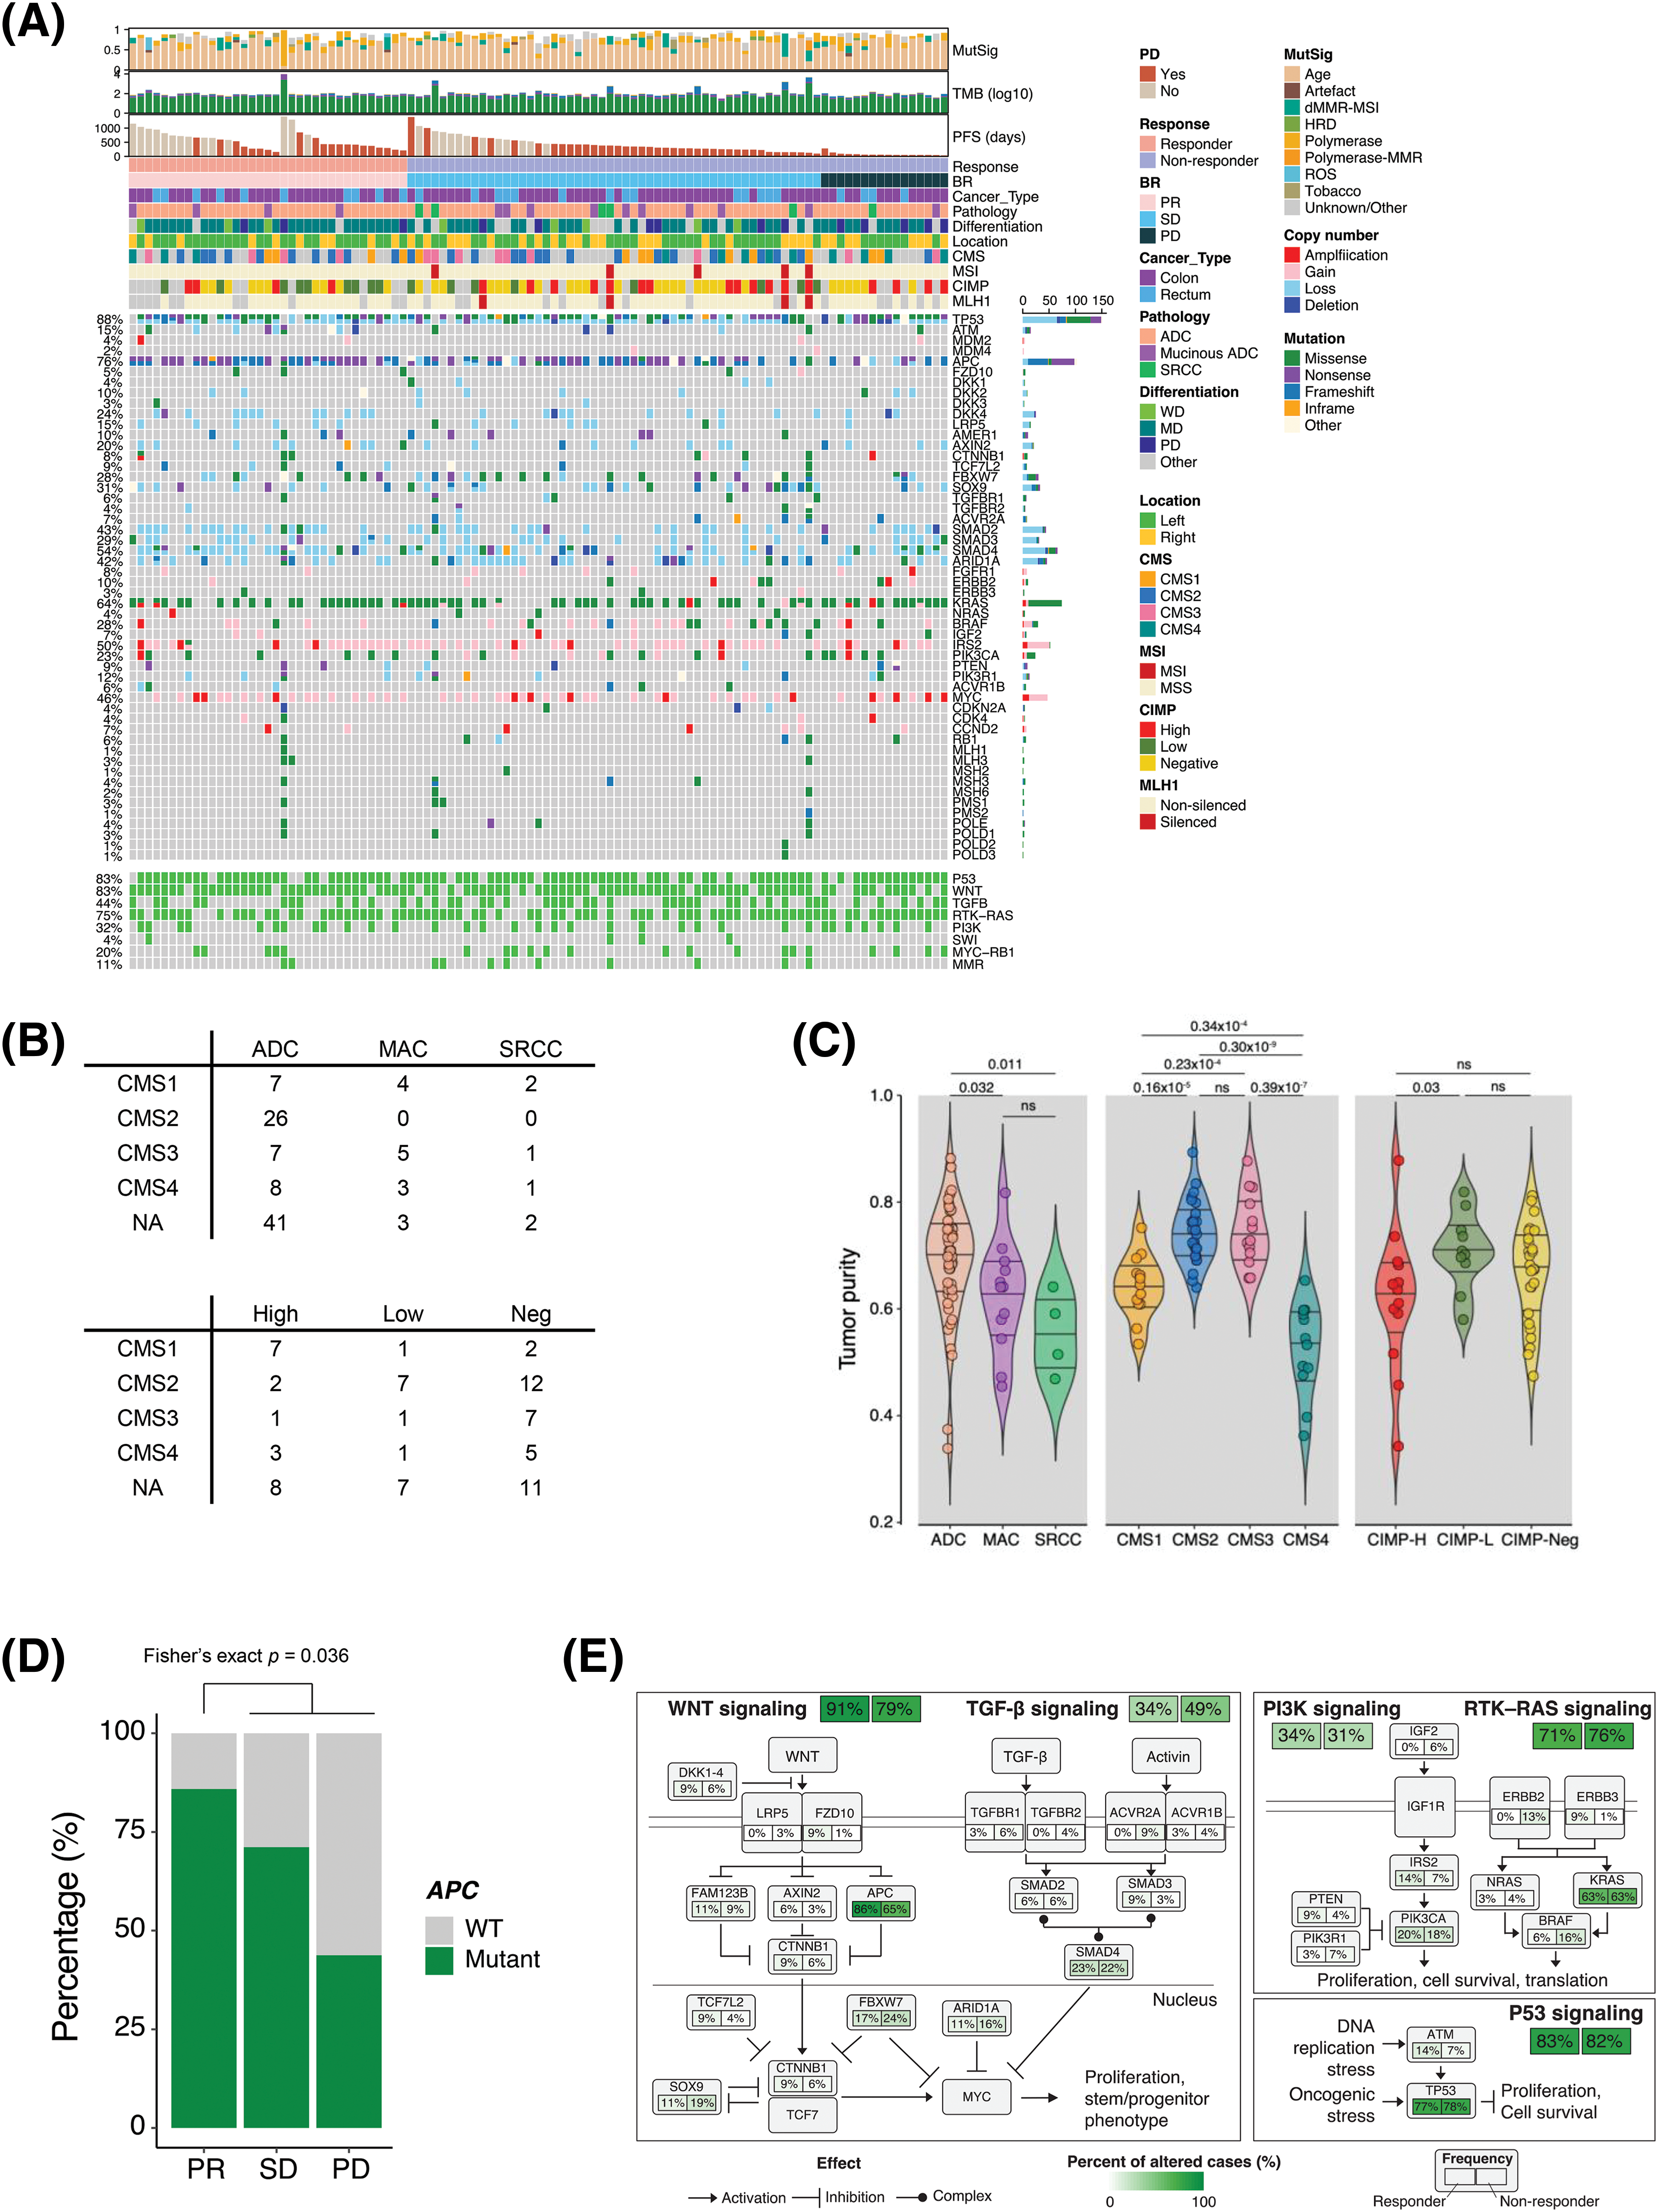
Figure 1: Genomic landscapes and correlates of the response to bevacizumab. (A) Genomic landscape of 103 patients with CRC who received bevacizumab. (B) CMS classification of patients with CRC according to pathology (top) and CIMP status (bottom). (C) Violin plot of the ESTIMATE tumor purity in CRC patients based on pathology (left), CMS classification (middle), and CIMP status (right). Wilcoxon rank-sum p values are shown. (D) Bar plot of the frequency of APC mutation in responders (CR and PR) and non-responders (SD and PD) to bevacizumab treatment. Fisher’s exact p value is shown. (E) Summary of CRC core pathway alteration frequency. CR, complete response; PR, partial response; SD, stable disease; PD, progressive disease. CMS, consensus molecular subtype; NA, not available; ADC, adenocarcinoma; MAC, mucinous adenocarcinoma; SRCC, signet-ring cell carcinoma; NEG, negative; WT, wild type; CIMP, CpG island methylator phenotype.
Subsequently, we examined the molecular and genomic correlates of responses to bevacizumab. CIMP-low tumors occurred significantly more frequently in responders (Fisher’s exact p = 0.036, odds ratio [OR] = 3.47); however, the CMS subtype and tumor purity were not associated with bevacizumab sensitivity (Suppl. Figs. S3A and S3B). Among the genomic alterations in the CRC core pathways [16], APC mutation status was a significantly enriched factor in responders (Fig. 1D and Suppl. Fig. S3C). APC mutation occurred in 72% of all CRC samples and was significantly predominant in responders (30/35 vs. 44/68, Fisher’s exact p = 0.036, OR = 3.24). Specifically, only 43.8% of patients with CRC who experienced PD after bevacizumab treatment possessed APC mutations (Fig. 1D). We summarized the alteration frequencies of CRC core pathways according to the response (Fig. 1E).
IGF1-FGFR1 pathway activation in bevacizumab-resistant patients
Transcriptomic profiles were made using RNA sequencing to reveal the potential mechanism behind resistance to bevacizumab treatment in CRC patients. To identify the molecular pathways enriched in the bevacizumab-resistant group, we applied a GSEA to the gene expression profiles and found that fibroblast growth factor receptor (FGFR) 1/2 signaling was upregulated in non-responders, whereas cell cycle, transfer RNA (tRNA) processing, nucleotide excision repair (NER), and oxidative phosphorylation pathways were enriched in responders (Fig. 2A). In addition, we used the ssGSEA method to calculate differences in the gene set expression levels in tumors and their matched normal tissues (ΔssGSEA scores) and compare the pathways up-/downregulated between them. We also compared the ΔssGSEA scores of the molecular pathways between responders and non-responders. Interestingly, in accordance with previous GSEA results, FGFR and IGF signaling was significantly upregulated in the tumors of non-responders compared with those of responders (Fig. 2B). When we analyzed DEGs between responders and non-responders, we found that IGF1 was a DEG in non-responders (log2 fold change = −1.43, p = 4.11 × 10⁻⁵, false discovery rate = 0.098) (Fig. 2C). To confirm whether FGFR and IGF1 expression levels are correlated, we performed a correlation analysis between them. FGFR1 expression levels correlated positively with IGF1 expression levels in both the SMC (r = 0.53) and TCGA CRC (r = 0.69) cohorts (Fig. 2D).
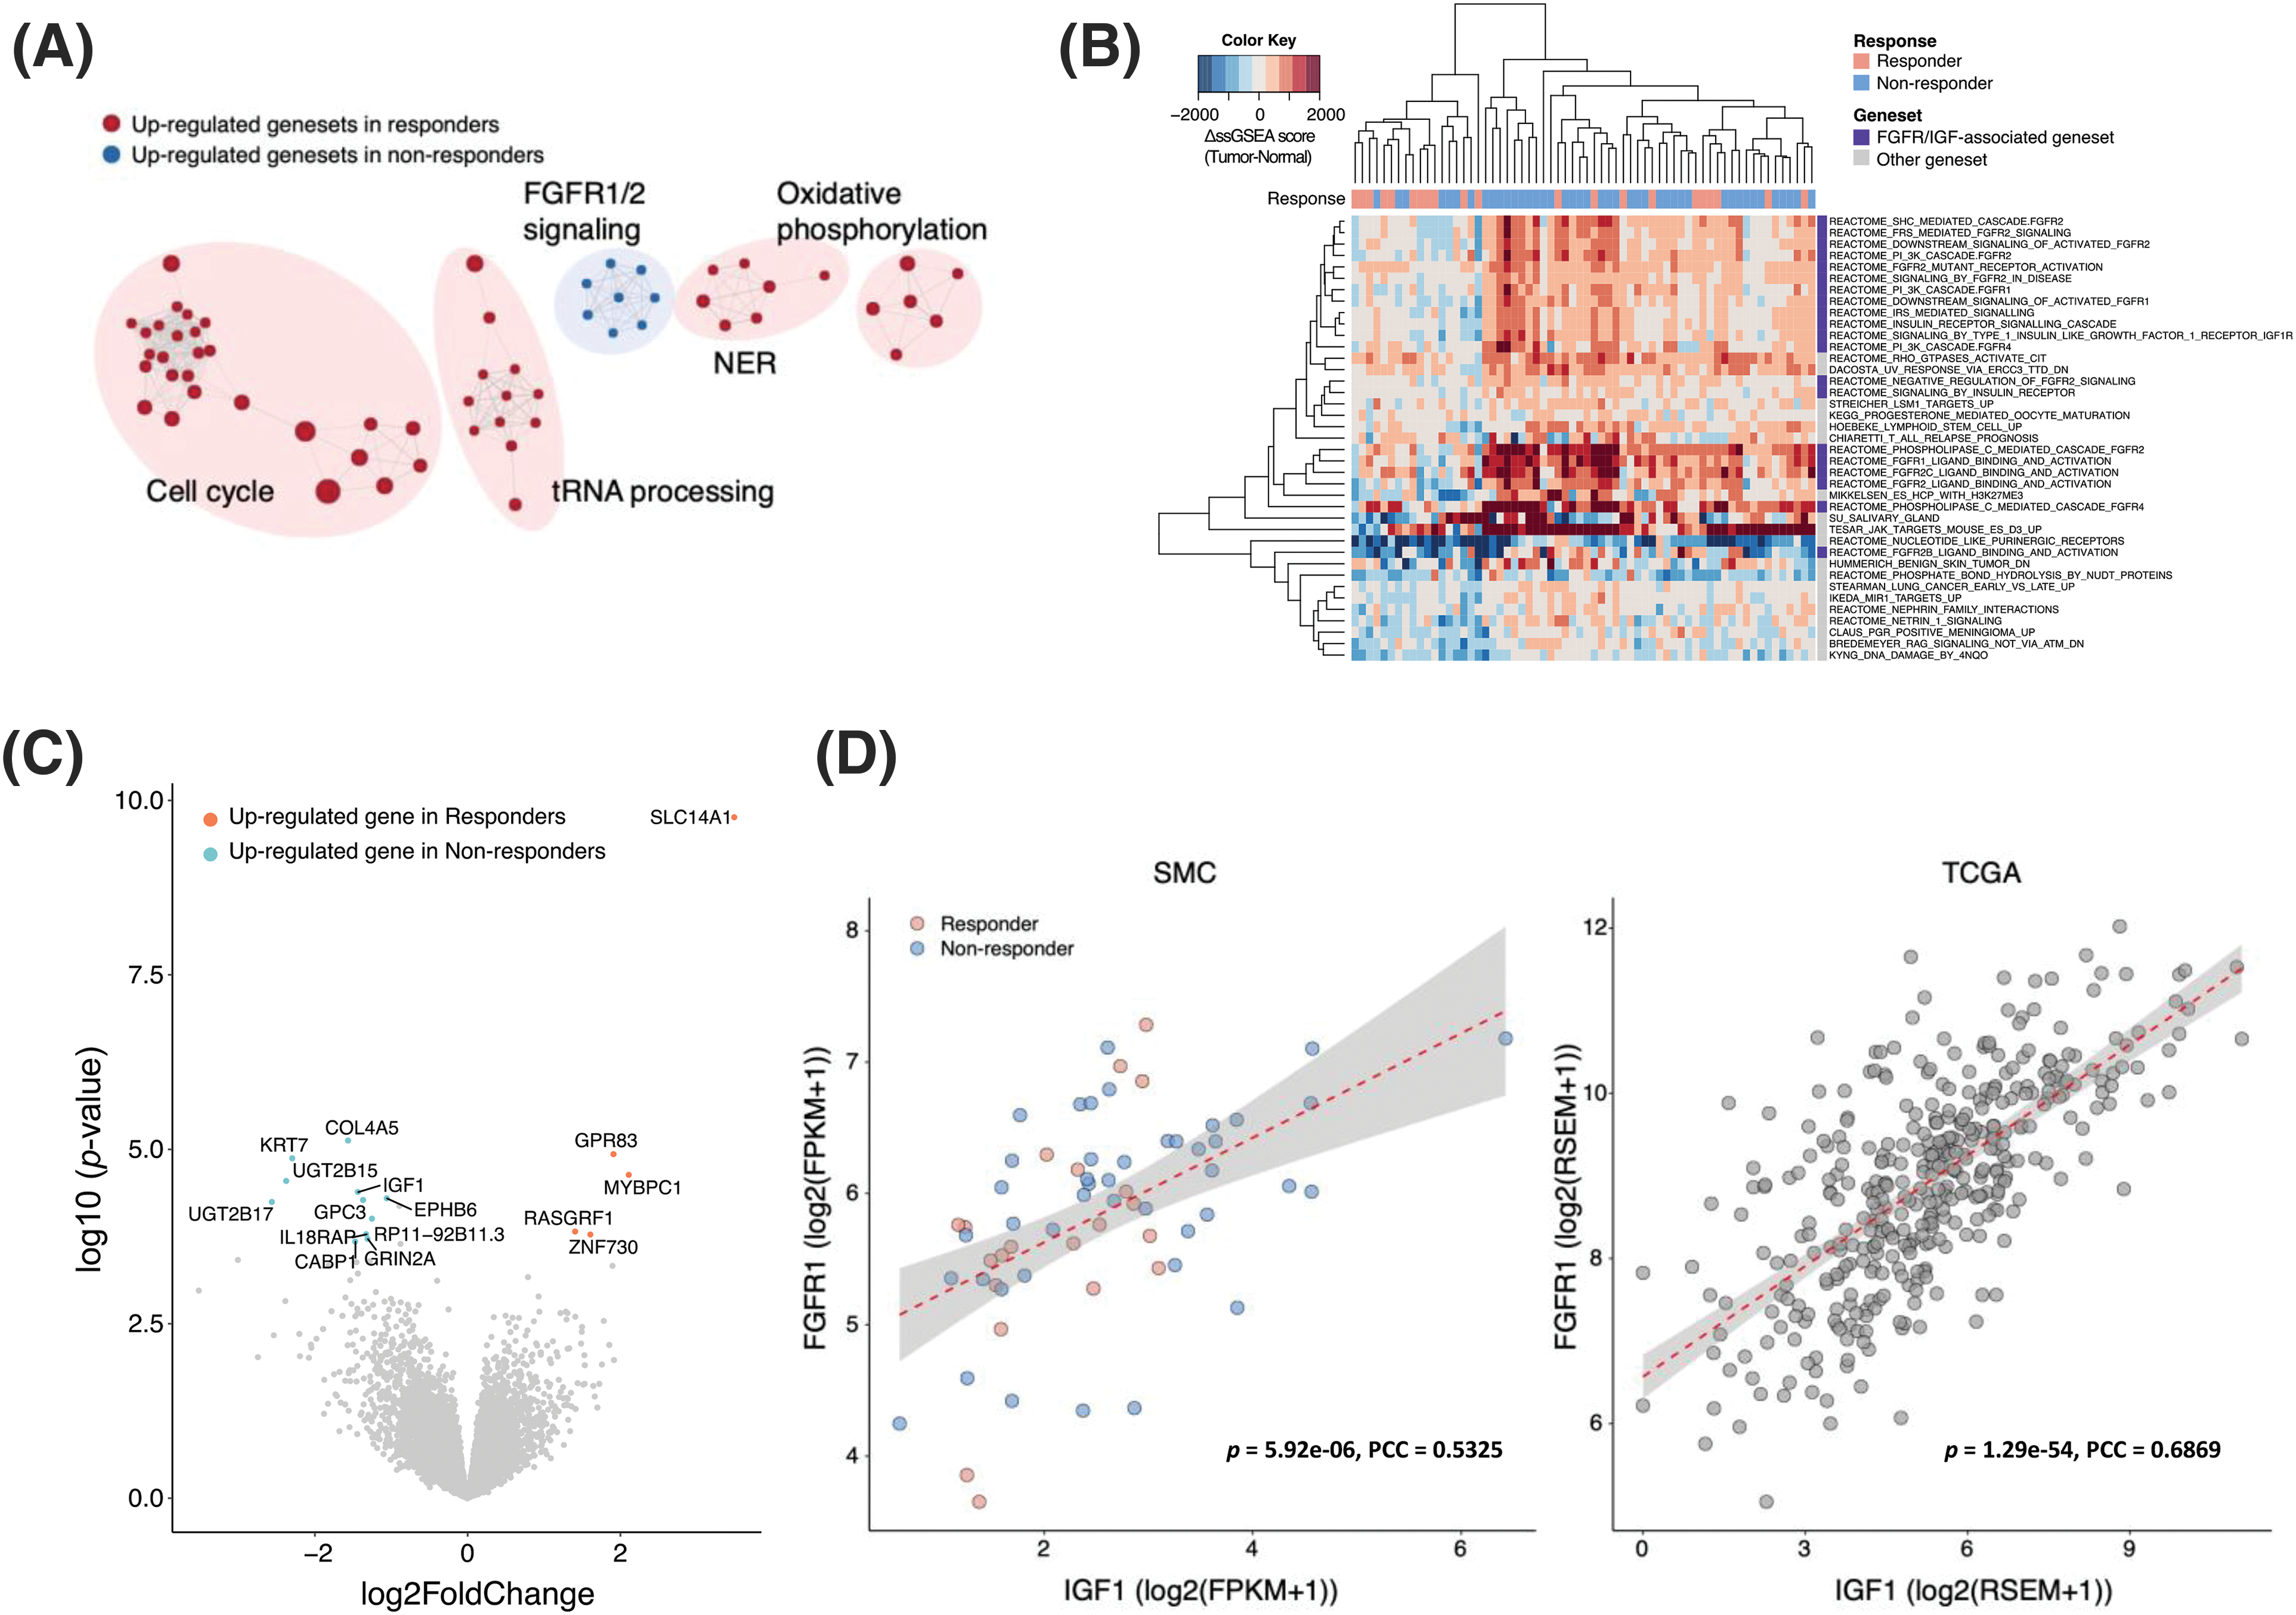
Figure 2: IGF1-FGFR signaling activation in bevacizumab-resistant colorectal cancers. (A) Clustering of significantly enriched pathways in responders (red) and non-responders (blue). (B) Gene sets with significantly higher ΔssGSEA scores in non-responders compared with responders. ΔssGSEA indicates the difference in ssGSEA scores between tumors and matched normal samples (ssGSEAtumor-ssGSEAnormal). (C) Volcano plot of differentially expressed gene analysis (absolute log2 fold changes ≥1 and FDR <0.25) between responders (red) and non-responders (blue). X-axis represents log2-scale fold change; Y-axis, −log10 p value. (D) Correlation between the expression levels of IGF1 (X-axis) and FGFR1 (Y-axis) in the SMC (left) and TCGA CRC (right) datasets.
Because epigenetic regulation is a common resistance mechanism against cancer therapies, we explored DNA methylation profiles to identify epigenomic markers that might predict the bevacizumab response. When the beta values of genes were compared between responders and non-responders, FLT1 was more highly methylated in non-responders than responders (p = 7.55 × 10⁻³) (Figs. 3A and 3B). To examine whether FLT1 promoter methylation regulates FLT1 mRNA expression, we examined the difference between FLT1 expression levels in the tumor and those in matched normal tissue and compared it with FLT1 promoter methylation levels. We found a negative correlation between FLT1 promoter methylation levels and the difference in expression levels, especially in non-responders (Fig. 3C). In addition, we confirmed that among non-responders, the expression levels of VEGF-A targets were significantly lower in methylated samples than in FLT1 promoter unmethylated samples (Fig. 3D).
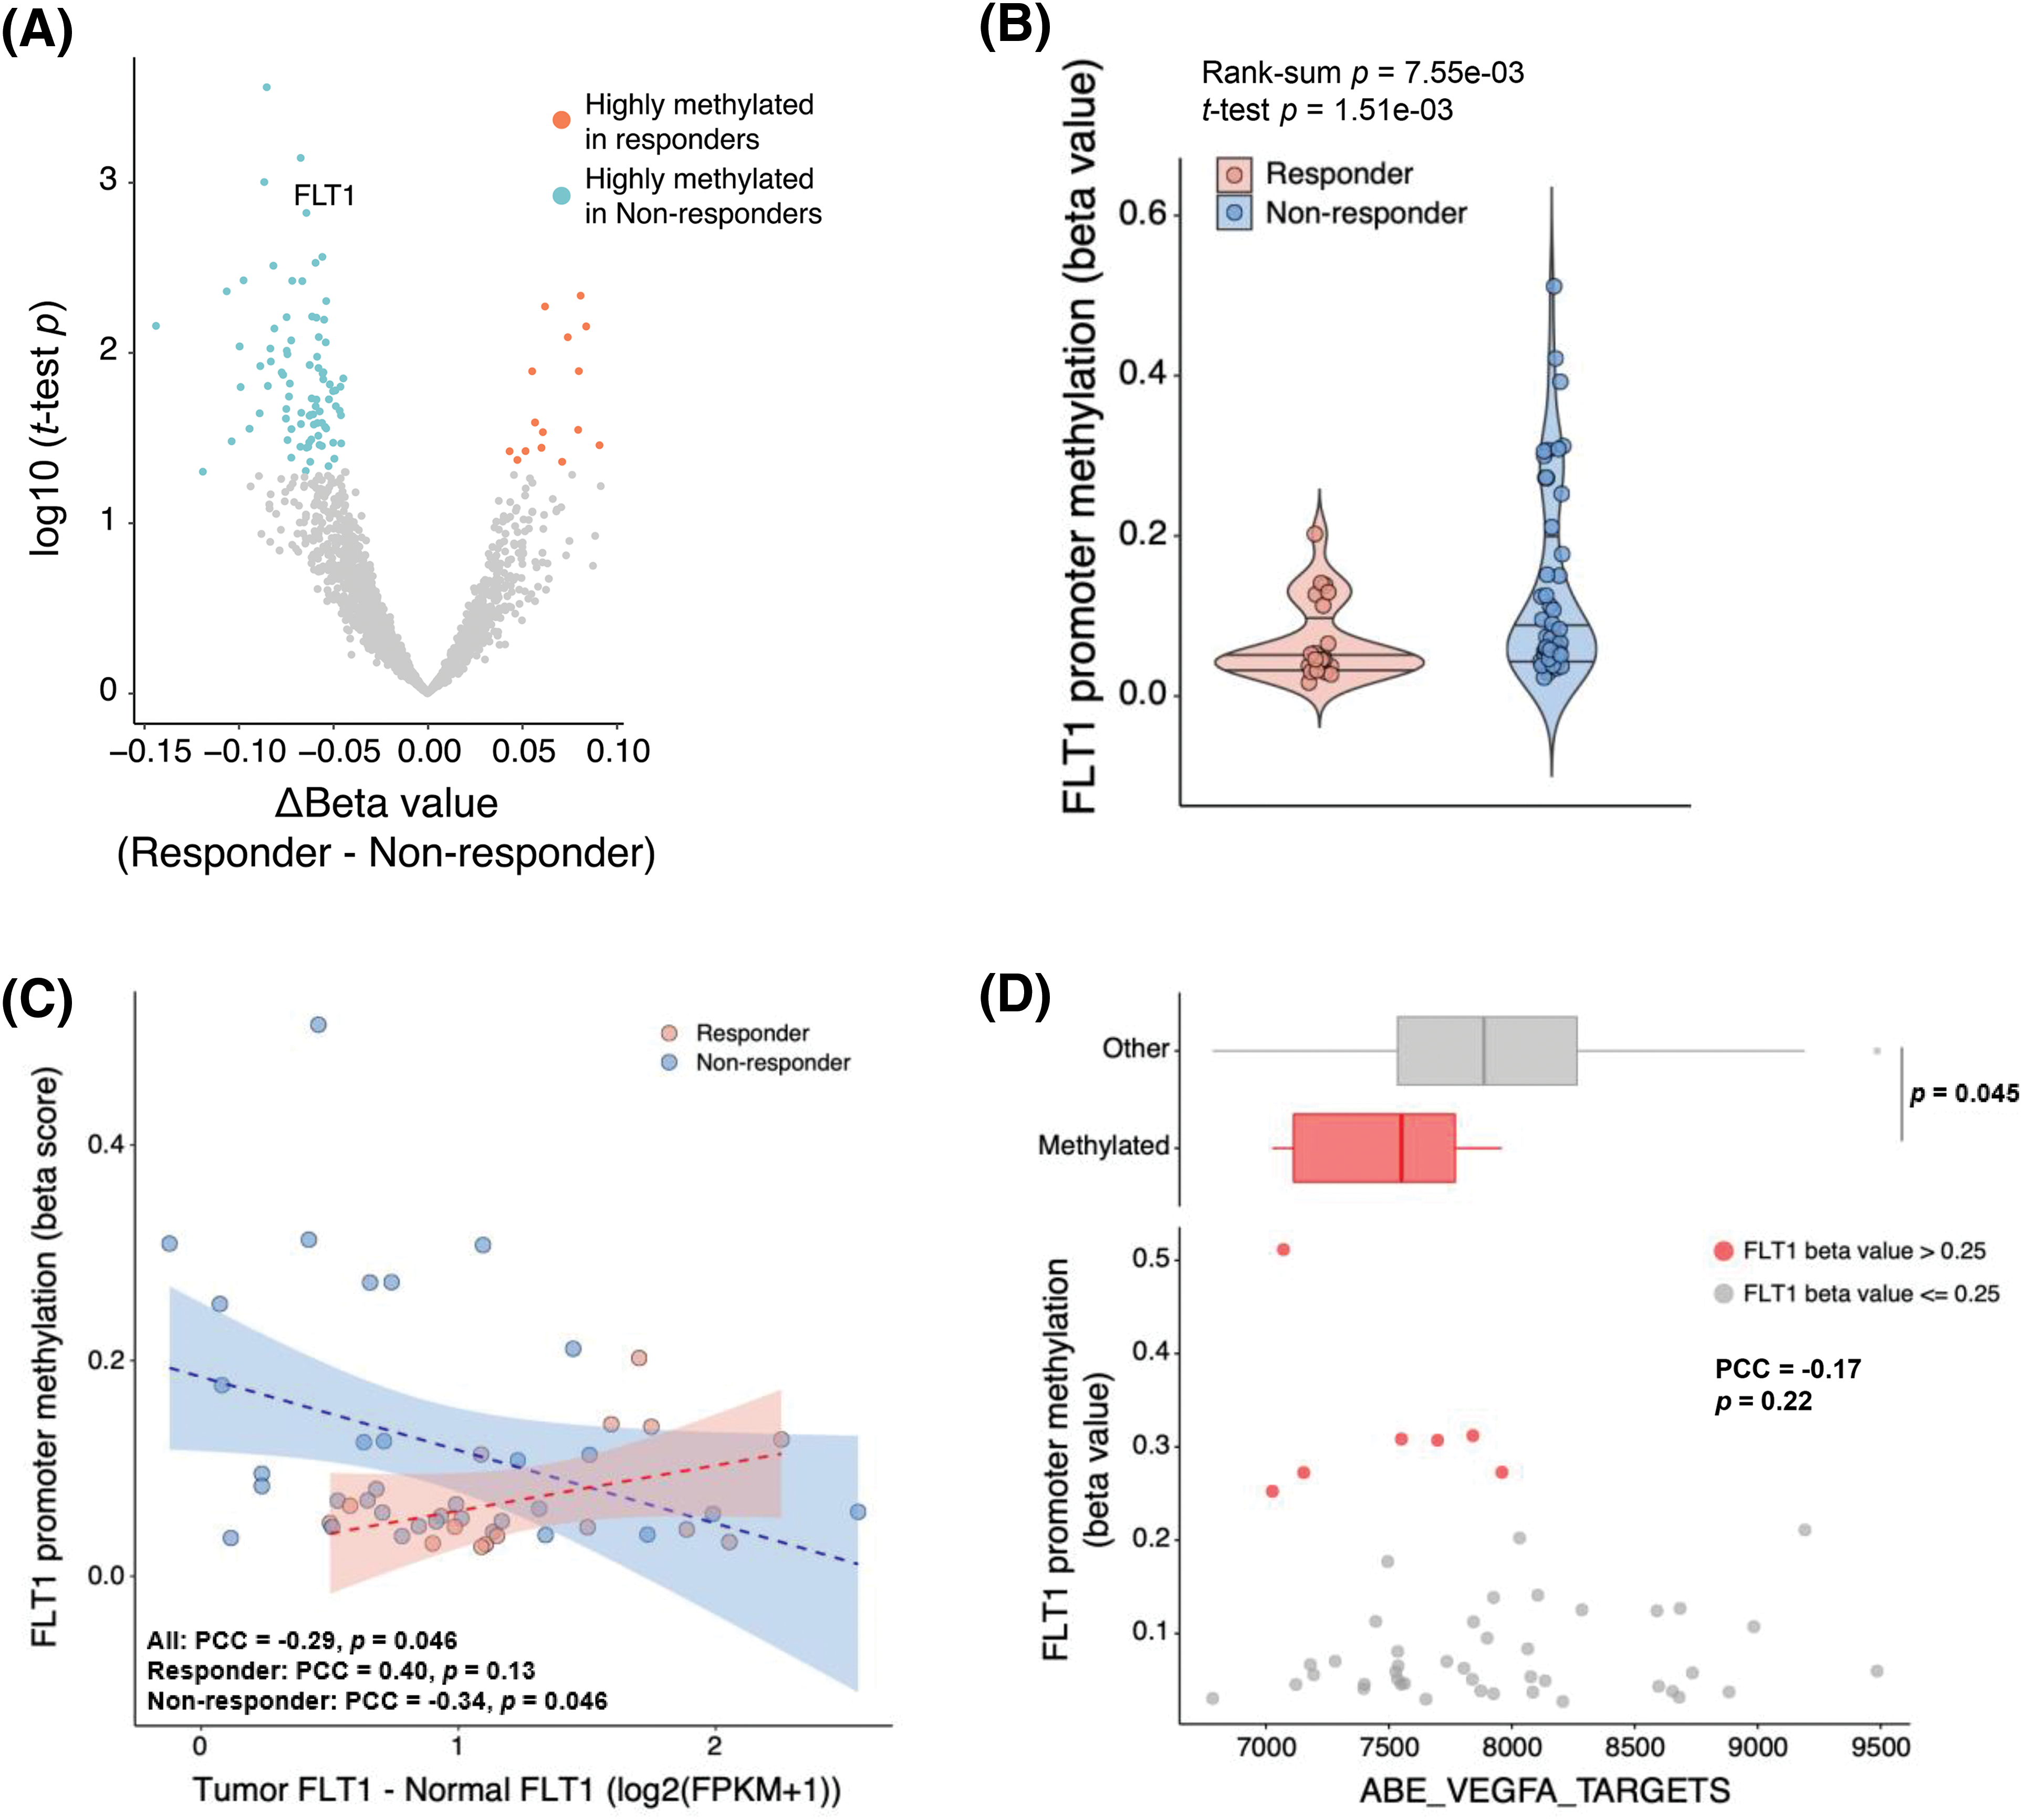
Figure 3: Decreased efficacy of bevacizumab via FLT1 epigenetic silencing. (A) Volcano plot of results from the differentially methylated gene promoter analysis between responders (red) and non-responders (blue). X-axis represents the difference in each gene β-value between responders and non-responders; Y-axis, −log10 (Student’s t-test p value). (B) FLT1 promoter methylation levels in responders and non-responders. (C) Pearson correlation analysis of FLT1 promoter methylation levels and FLT1 upregulation levels in tumors compared with matched normal samples (FLT1 log2FPKMtumor − FLT1 log2FPKMnormal). Blue and red dots indicate non-responders and responders, respectively. Blue and red lines indicate the linear regression line in non-responders and responders, respectively. (D) Correlation between the FLT1 promoter methylation levels and ssGSEA scores of VEGF-A targets. FLT1 promoter methylated tumors (β > 0.25) (red dots) showed lower expression of VEGF-A targets than unmethylated samples (upper panel). Wilcoxon rank-sum p value is shown.
The survival analysis was conducted between the response group and non-response group in the first-line and second-line setting, respectively. Among 91 patients who received bevacizumab in their first-line treatment, the response group showed significantly longer PFS and OS than non-response group. The median PFS and OS were respectively 14.2 months (95% CI 6.6–21.8), 41.7 months (95% CI 10.78–72.56) in the response group compared with 9.4 months (95% CI 7.03–11.83), 28.8 months (95% CI 23.02–34.52) in the non-response group (HR 2.18 95% CI 1.28–3.72, p = 0.004 for PFS; HR 1.94 95% CI 1.12–3.36, p = 0.018 for OS).
Although not statistically significant in patients (N = 19) treated with bevacizumab as their second-line treatment, the response group showed a better PFS and OS than non-response group. The median PFS and OS were respectively 27.8 months (95% CI 17.82–37.78), 37.9 months (95% CI 27.06–48.68) in the response group compared with 9.0 months (95% CI 3.36–14.64), 12.9 months (95% CI 3.23–22.51) in the non-response group (HR 3.19 95% CI 0.86–11.83, p = 0.082 for PFS, HR 2.43 95% CI 0.67-8.85, p = 0.179 for OS) (Suppl. Fig. S7).
For this study, we used a comprehensive molecular approach to identify novel biomarkers that might predict the response to bevacizumab in patients with metastatic CRC. Although some previous efforts were made to find potential biomarkers for a response to bevacizumab-containing therapies [34–36], they used insufficient molecular analyses and samples. In this study, all molecular analyses (whole-exome sequencing, RNA sequencing, and a methylation array) were based on tumor and matched normal tissues that were obtained before the initiation of bevacizumab treatment. Thus, our data might be used to select a patient population that could benefit from bevacizumab-based chemotherapy. In this study, APC mutation status, FGFR 1/2 signaling pathways, the cell cycle, tRNA processing, NER, oxidative phosphorylation, IGF1 expression status, and FLT1 methylation status correlated closely with sensitivity to bevacizumab-containing treatment. Nevertheless, our findings need to be validated in a prospective clinical study of patients with CRC who plan to receive bevacizumab.
Loss of APC is the main driver of Wnt signaling in CRC, and the significant role of APC has been demonstrated in previous studies [37–39]. Different APC mutations result in distinct levels of canonical Wnt pathway activity [40,41]. In this study, APC mutation occurred in 72% of all CRC samples and was significantly predominant in responders (30/35 vs. 44/68, Fisher’s exact p = 0.036, OR = 3.24). Responders also showed a higher alteration frequency in the Wnt signaling pathway than non-responders (91% vs. 79%). However, that difference was not statistically significant (32/35 vs. 54/68, Fisher’s exact p = 0.16). This discrepancy might be attributed to the complexity of the Wnt pathway. The Wnt pathway is commonly classified into β-catenin-dependent (canonical) and β-catenin-independent (non-canonical) signaling [42]. The APC gene interacts with the canonical Wnt pathway [37,38]. Additionally, Wnt pathway components, particularly APC, have been linked to chromosomal instability (CIN) by multiple mechanisms [43–45]. CIN is frequently observed in CRC and is associated with poor prognosis. According to a previous study, patients with metastatic CRC with high CIN had positive clinical outcomes after bevacizumab combination therapy [46]. However, in our study, the copy number load was not associated with the response to bevacizumab treatment (Suppl. Fig. S3D).
IGF-FGFR signaling controls the growth, migration, survival, and differentiation of numerous cell types [47–49]. This signaling could also indirectly promote angiogenesis. Theoretically, the poor efficacy of anti-VEGF therapies can be attributed to cooperation between this signaling and VEGF-R for angiogenesis. In this study, non-responders showed upregulation of both FGFR1/2 signaling and IGF1 gene expression. According to publicly available single-cell RNA-seq CRC data, both IGF1 and FGFR1 are highly expressed in Stromal3 cells (Suppl. Fig. S4), which are a sub-cell group of fibroblasts [50]. Thus, with the help of this subgroup of fibroblasts in the tumor microenvironment, IGF1-FGFR1 signaling activation could be the resistance mechanism against bevacizumab treatment in patients with CRC. Therefore, a therapeutic strategy based on the co-inhibition of FGFR and VEGF-R signaling might be needed for CRC treatment.
In some cancer cells, changes in intracellular VEGF-VEGF-R signaling occur because of the epigenetic silencing of FLT1 [51]. Cell lines with epigenetic gene silencing of FLT1 showed insufficient inhibition of proliferation after treatment with VEFG-TKIs [52]. Kim et al. reported that FLT1 epigenetic silencing is higher in renal cancer tissue from non-responders than responders to anti-angiogenetic agents [53]. In this study, we found that FLT1 epigenetic silencing via promoter methylation attenuated the therapeutic efficacy of bevacizumab in patients with CRC; a lack of therapeutic target activation was noted. This finding suggests that the promoter methylation status of FLT1 might be a helpful biomarker for predicting the success of bevacizumab treatment in patients with metastatic CRC.
In this study, we implemented our analysis using a comprehensive molecular approach with tissues to identify novel biomarkers that could predict the response to bevacizumab treatment in patients with metastatic CRC. Previously, much interesting research has examined sensitivity to antiangiogenesis therapy in CRC. Some of those previous studies, unlike our analysis, investigated germline polymorphisms in genes involved in VEGF pathways by using blood samples [54–56]. Given that bevacizumab has a soluble target (VEGF) and not a target on cancer cells, efforts to evaluate biomarkers related to bevacizumab in germline angiogenesis polymorphisms are likely to be meaningful. Currently, no biomarkers are available to select a patient population likely to benefit from bevacizumab. In the future, integrated biomarker-studies that evaluate both tissue and blood might provide more information to guide the use of bevacizumab in CRC patients.
We also separately analyzed the relationship between a response to bevacizumab and various molecular characterizations according to the backbone chemotherapy used (FOLFOX vs. FOLFIRI). We found that APC mutation status was not a significantly enriched factor for responders to bevacizumab in both the FOLFOX and FOLFIRI groups (Suppl. Fig. S5A). It was a significant prognostic factor for PFS in the FOLFOX and bevacizumab group (Suppl. Fig. S5B), but not in the FOLFIRI and bevacizumab group. On the other hand, FLT1 was a highly methylated gene in non-responders to bevacizumab treatment in the FOLFIRI and bevacizumab group, but not in the FOLFOX and bevacizumab group (Suppl. Fig. S5C). In other words, when we reanalyzed the molecular pathways separately, their significance depended on the backbone chemotherapy used (FOLFOX vs. FOLFIRI) (Suppl. Figs. S6A and S6B).
Our study has several limitations. First, our study population is clinically heterogeneous and thus subject to potential biases. For example, we included 46 CRC patients (42%) with right-sided primary tumors. That high frequency of right-sided primary tumors is unusual in studies of CRC. Also, patients in this study were treated with different backbone chemotherapy regimens alongside bevacizumab. Second, our study included a relatively small number of patients; thus, drawing definite conclusions about molecular biomarkers is difficult. Third, only Asian patients with CRC were analyzed in this study. Differences in genomic profiles and sensitivity to anti-angiogenetic agents exist between Western and Eastern patients with CRC. Fourth, we didn’t analyze the genomic profiles of control samples from patients who received only chemotherapy without bevacizumab. Fifth, we intended to analyze too many variables for our relatively small sample size, which prevented us from adjusting for important factors that might have affected our results.
Generally, the efficacy of adding bevacizumab to chemotherapy is modest. In such cases, the effect of bevacizumab might be reflected in survival times, rather than the tumor response. However, our comprehensive molecular analysis considered many variables, and our study population contained only 110 patients. Thus, it was impossible to conduct a comprehensive genomic analysis for survival. Although we could not analyze the direct associations between various molecular alterations and survival, patients in the response group showed significantly longer PFS and OS than those in the non-response group (Suppl. Fig. S7).
Therefore, our findings must be interpreted with caution, and validation with larger patient samples is warranted.
We identified multiple molecular and transcriptional features correlated with the clinical response to bevacizumab therapy in patients with CRC. When the molecular pathway data were reanalyzed separately according to the backbone chemotherapy (FOLFOX vs. FOLFIRI), the significance of the results differed between groups. We have tried to identify a subset of CRC patients with a distinct clinical response to chemotherapy containing bevacizumab, and our results need to be validated with larger patient samples and different chemotherapy backbones to enable personalized therapeutic opportunities in CRC.
Acknowledgement: A subset of the biospecimens analyzed in this study was provided by the Samsung Medical Center Biobank.
Funding Statement: This research was supported by a grant of the Korean Health Technology R&D Project through the Korean Health Industry Development Institute (KHIDI), funded by the Ministry of Health & Welfare, Republic of Korea (Grant Number: HR20C0025).
Author Contributions: Conception/design: Seung Tae Kim, Hee Cheol Kim. Provision of study material or patients: Sung Hee Lim, Young Suk Park, Ho Yeong Lim, Won Ki Kang, Seung Tae Kim, Jeeyun Lee. Collection and/or assembly of data: Sung Hee Lim, Young Suk Park, Ho Yeong Lim, Won Ki Kang, Seung Tae Kim, Jeeyun Lee, Hee Jin Cho, Hee Cheol Kim. Data analysis and interpretation: Kyoung-Mee Kim, Seung Tae Kim, Hee Jin Cho. Manuscript writing: Sung Hee Lim, Seung Tae Kim, Hee Jin Cho, Hee Cheol Kim. Final approval of manuscript: Sung Hee Lim, Seung Tae Kim, Young Suk Park, Ho Yeong Lim, Won Ki Kang, Kyoung-Mee Kim, Jeeyun Lee, Hee Jin Cho, Hee Cheol Kim.
Availability of Data and Materials: All data needed to evaluate the conclusions in the paper are present in the paper and/or the Supplementary Materials. Additional data related to this paper may be requested from the authors.
Ethics Approval: The study was conducted in accordance with the Declaration of Helsinki, and approved by the Ethics Committee of the Samsung Medical Center (#2019-08-064).
Conflicts of Interest: The authors declare that they have no conflicts of interest to report regarding the present study.
Supplementary Materials: The supplemental material for this article is available online at https://doi.org/10.32604/or.2023.030374.
References
1. Sung, H., Ferlay, J., Siegel, R. L., Laversanne, M., Soerjomataram, I. et al. (2021). Global cancer statistics 2020: GLOBOCAN estimates of incidence and mortality worldwide for 36 cancers in 185 countries. CA: A Cancer Journal for Clinicians, 71(3), 209–249. https://doi.org/10.3322/caac.21660 [Google Scholar] [PubMed] [CrossRef]
2. Cervantes, A., Adam, R., Roselló, S., Arnold, D., Normanno, N. et al. (2023). Metastatic colorectal cancer: ESMO clinical practice guideline for diagnosis, treatment and follow-up. Annals of Oncology, 34(1), 10–32. https://doi.org/10.1016/j.annonc.2022.10.003 [Google Scholar] [PubMed] [CrossRef]
3. Yoshino, T., Arnold, D., Taniguchi, H., Pentheroudakis, G., Yamazaki, K. et al. (2018). Pan-Asian adapted ESMO consensus guidelines for the management of patients with metastatic colorectal cancer: A JSMO-ESMO initiative endorsed by CSCO, KACO, MOS, SSO and TOS. Annals of Oncology, 29(1), 44–70. https://doi.org/10.1093/annonc/mdx738 [Google Scholar] [PubMed] [CrossRef]
4. Giantonio, B. J., Catalano, P. J., Meropol, N. J., O’Dwyer, P. J., Mitchell, E. P. et al. (2007). Bevacizumab in combination with oxaliplatin, fluorouracil, and leucovorin (FOLFOX4) for previously treated metastatic colorectal cancer: Results from the Eastern cooperative oncology group study E3200. Journal of Clinical Oncology, 25(12), 1539–1544. https://doi.org/10.1200/JCO.2006.09.6305 [Google Scholar] [PubMed] [CrossRef]
5. Passardi, A., Nanni, O., Tassinari, D., Turci, D., Cavanna, L. et al. (2015). Effectiveness of bevacizumab added to standard chemotherapy in metastatic colorectal cancer: Final results for first-line treatment from the ITACa randomized clinical trial. Annals of Oncology, 26(6), 1201–1207. https://doi.org/10.1093/annonc/mdv130 [Google Scholar] [PubMed] [CrossRef]
6. Riechelmann, R., Grothey, A. (2017). Antiangiogenic therapy for refractory colorectal cancer: Current options and future strategies. Therapeutic Advances in Medical Oncology, 9(2), 106–126. https://doi.org/10.1177/1758834016676703 [Google Scholar] [PubMed] [CrossRef]
7. Van Cutsem, E., Köhne, C. H., Hitre, E., Zaluski, J., Chang Chien, C. R. et al. (2009). Cetuximab and chemotherapy as initial treatment for metastatic colorectal cancer. The New England Journal of Medicine, 360(14), 1408–1417. https://doi.org/10.1056/NEJMoa0805019 [Google Scholar] [PubMed] [CrossRef]
8. Ferrara, N., Hillan, K. J., Gerber, H. P., Novotny, W. (2004). Discovery and development of bevacizumab, an anti-VEGF antibody for treating cancer. Nature Reviews Drug Discovery, 3(5), 391–400. https://doi.org/10.1038/nrd1381 [Google Scholar] [PubMed] [CrossRef]
9. Ferrara, N., Gerber, H. P., LeCouter, J. (2003). The biology of VEGF and its receptors. Nature Medicine, 9(6), 669–676. https://doi.org/10.1038/nm0603-669 [Google Scholar] [PubMed] [CrossRef]
10. Ye, W. (2016). The complexity of translating anti-angiogenesis therapy from basic science to the clinic. Developmental Cell, 37(2), 114–125. https://doi.org/10.1016/j.devcel.2016.03.015 [Google Scholar] [PubMed] [CrossRef]
11. Kerbel, R. S. (2008). Tumor angiogenesis. The New England Journal of Medicine, 358(19), 2039–2049. https://doi.org/10.1056/NEJMra0706596 [Google Scholar] [PubMed] [CrossRef]
12. Cunningham, D., Lang, I., Marcuello, E., Lorusso, V., Ocvirk, J. et al. (2013). Bevacizumab plus capecitabine versus capecitabine alone in elderly patients with previously untreated metastatic colorectal cancer (AVEXAn open-label, randomised phase 3 trial. The Lancet Oncology, 14(11), 1077–1085. https://doi.org/10.1016/S1470-2045(13)70154-2 [Google Scholar] [PubMed] [CrossRef]
13. Bennouna, J., Sastre, J., Arnold, D., Österlund, P., Greil, R. et al. (2013). Continuation of bevacizumab after first progression in metastatic colorectal cancer (ML18147A randomised phase 3 trial. The Lancet Oncology, 14(1), 29–37. https://doi.org/10.1016/S1470-2045(12)70477-1 [Google Scholar] [PubMed] [CrossRef]
14. Saltz, L. B., Clarke, S., Díaz-Rubio, E., Scheithauer, W., Figer, A. et al. (2008). Bevacizumab in combination with oxaliplatin-based chemotherapy as first-line therapy in metastatic colorectal cancer: A randomized phase III study. Journal of Clinical Oncology, 26(12), 2013–2019. https://doi.org/10.1200/JCO.2007.14.9930 [Google Scholar] [PubMed] [CrossRef]
15. Tebbutt, N. C., Wilson, K., Gebski, V. J., Cummins, M. M., Zannino, D. et al. (2010). Capecitabine, bevacizumab, and mitomycin in first-line treatment of metastatic colorectal cancer: Results of the Australasian gastrointestinal trials group randomized phase III MAX study. Journal of Clinical Oncology, 28(19), 3191–3198. https://doi.org/10.1200/JCO.2009.27.7723 [Google Scholar] [PubMed] [CrossRef]
16. The Cancer Genome Atlas Network (2012). Comprehensive molecular characterization of human colon and rectal cancer. Nature, 487, 330–337. https://doi.org/10.1038/nature11252 [Google Scholar] [PubMed] [CrossRef]
17. Guinney, J., Dienstmann, R., Wang, X., de Reyniès, A., Schlicker, A. et al. (2015). The consensus molecular subtypes of colorectal cancer. Nature Medicine, 21(11), 1350–1356. https://doi.org/10.1038/nm.3967 [Google Scholar] [PubMed] [CrossRef]
18. Singer, V. L., Jones, L. J., Yue, S. T., Haugland, R. P. (1997). Characterization of PicoGreen reagent and development of a fluorescence-based solution assay for double-stranded DNA quantitation. Analytical Biochemistry, 249(2), 228–238. https://doi.org/10.1006/abio.1997.2177 [Google Scholar] [PubMed] [CrossRef]
19. Desjardins, P., Conklin, D. (2010). NanoDrop microvolume quantitation of nucleic acids. Journal of Visualized Experiments, (45), e2565. https://doi.org/10.3791/2565 [Google Scholar] [PubMed] [CrossRef]
20. Li, H., Durbin, R. (2009). Fast and accurate short read alignment with Burrows-Wheeler transform. Bioinformatics, 25(14), 1754–1760. https://doi.org/10.1093/bioinformatics/btp324 [Google Scholar] [PubMed] [CrossRef]
21. Li, H., Handsaker, B., Wysoker, A., Fennell, T., Ruan, J. et al. (2009). The sequence alignment/map format and SAMtools. Bioinformatics, 25(16), 2078–2079. https://doi.org/10.1093/bioinformatics/btp352 [Google Scholar] [PubMed] [CrossRef]
22. McKenna, A., Hanna, M., Banks, E., Sivachenko, A., Cibulskis, K. et al. (2010). The genome analysis toolkit: A MapReduce framework for analyzing next-generation DNA sequencing data. Genome Research, 20(9), 1297–1303. https://doi.org/10.1101/gr.107524.110 [Google Scholar] [PubMed] [CrossRef]
23. McLaren, W., Gil, L., Hunt, S. E., Riat, H. S., Ritchie, G. R. et al. (2016). The ensembl variant effect predictor. Genome Biology, 17(1), 122. https://doi.org/10.1186/s13059-016-0974-4 [Google Scholar] [PubMed] [CrossRef]
24. Rosenthal, R., McGranahan, N., Herrero, J., Taylor, B. S., Swanton, C. (2016). DeconstructSigs: Delineating mutational processes in single tumors distinguishes DNA repair deficiencies and patterns of carcinoma evolution. Genome Biology, 17(1), 31. https://doi.org/10.1186/s13059-016-0893-4 [Google Scholar] [PubMed] [CrossRef]
25. Alexandrov, L. B., Kim, J., Haradhvala, N. J., Huang, M. N., Tian Ng, A. W. et al. (2020). The repertoire of mutational signatures in human cancer. Nature, 578, 94–101. https://doi.org/10.1038/s41586-020-1943-3 [Google Scholar] [PubMed] [CrossRef]
26. Dobin, A., Davis, C. A., Schlesinger, F., Drenkow, J., Zaleski, C. et al. (2013). STAR: Ultrafast universal RNA-seq aligner. Bioinformatics, 29(1), 15–21. https://doi.org/10.1093/bioinformatics/bts635 [Google Scholar] [PubMed] [CrossRef]
27. Trapnell, C., Roberts, A., Goff, L., Pertea, G., Kim, D. et al. (2012). Differential gene and transcript expression analysis of RNA-seq experiments with TopHat and Cufflinks. Nature Protocols, 7(3), 562–578. https://doi.org/10.1038/nprot.2012.016 [Google Scholar] [PubMed] [CrossRef]
28. Yoshihara, K., Shahmoradgoli, M., Martinez, E., Vegesna, R., Kim, H. et al. (2013). Inferring tumour purity and stromal and immune cell admixture from expression data. Nature Communications, 4(1), 2612. https://doi.org/10.1038/ncomms3612 [Google Scholar] [PubMed] [CrossRef]
29. Hanzelmann, S., Castelo, R., Guinney, J. (2013). GSVA: Gene set variation analysis for microarray and RNA-seq data. BMC Bioinformatics, 14(1), 7. https://doi.org/10.1186/1471-2105-14-7 [Google Scholar] [PubMed] [CrossRef]
30. Subramanian, A., Kuehn, H., Gould, J., Tamayo, P., Mesirov, J. P. (2007). GSEA-P: A desktop application for gene set enrichment analysis. Bioinformatics, 23(23), 3251–3253. https://doi.org/10.1093/bioinformatics/btm369 [Google Scholar] [PubMed] [CrossRef]
31. Merico, D., Isserlin, R., Stueker, O., Emili, A., Bader, G. D. (2010). Enrichment map: A network-based method for gene-set enrichment visualization and interpretation. PLoS One, 5(11), e13984. https://doi.org/10.1371/journal.pone.0013984 [Google Scholar] [PubMed] [CrossRef]
32. Love, M. I., Huber, W., Anders, S. (2014). Moderated estimation of fold change and dispersion for RNA-seq data with DESeq2. Genome Biology, 15(12), 550. https://doi.org/10.1186/s13059-014-0550-8 [Google Scholar] [PubMed] [CrossRef]
33. Aryee, M. J., Jaffe, A. E., Corrada-Bravo, H., Ladd-Acosta, C., Feinberg, A. P. et al. (2014). Minfi: A flexible and comprehensive bioconductor package for the analysis of infinium DNA methylation microarrays. Bioinformatics, 30(10), 1363–1369. https://doi.org/10.1093/bioinformatics/btu049 [Google Scholar] [PubMed] [CrossRef]
34. Berger, M. D., Ning, Y., Stintzing, S., Heinemann, V., Cao, S. et al. (2020). A polymorphism within the R-spondin 2 gene predicts outcome in metastatic colorectal cancer patients treated with FOLFIRI/bevacizumab: Data from FIRE-3 and TRIBE trials. European Journal of Cancer, 131(1), 89–97. https://doi.org/10.1016/j.ejca.2020.02.048 [Google Scholar] [PubMed] [CrossRef]
35. Berger, M. D., Stintzing, S., Heinemann, V., Cao, S., Yang, D. et al. (2018). A Polymorphism within the vitamin D transporter gene predicts outcome in metastatic colorectal cancer patients treated with FOLFIRI/bevacizumab or FOLFIRI/cetuximab. Clinical Cancer Research, 24(4), 784–793. https://doi.org/10.1158/1078-0432.CCR-17-1663 [Google Scholar] [PubMed] [CrossRef]
36. Jayson, G. C., Zhou, C., Backen, A., Horsley, L., Marti-Marti, K. et al. (2018). Plasma Tie2 is a tumor vascular response biomarker for VEGF inhibitors in metastatic colorectal cancer. Nature Communications, 9(1), 4672. https://doi.org/10.1038/s41467-018-07174-1 [Google Scholar] [PubMed] [CrossRef]
37. Rubinfeld, B., Souza, B., Albert, I., Muller, O., Chamberlain, S. H. et al. (1993). Association of the APC gene product with beta-catenin. Science, 262(5140), 1731–1734. https://doi.org/10.1126/science.8259518 [Google Scholar] [PubMed] [CrossRef]
38. Su, L. K., Vogelstein, B., Kinzler, K. W. (1993). Association of the APC tumor suppressor protein with catenins. Science, 262(5140), 1734–1737. https://doi.org/10.1126/science.8259519 [Google Scholar] [PubMed] [CrossRef]
39. Matano, M., Date, S., Shimokawa, M., Takano, A., Fujii, M. et al. (2015). Modeling colorectal cancer using CRISPR-Cas9-mediated engineering of human intestinal organoids. Nature Medicine, 21(3), 256–262. https://doi.org/10.1038/nm.3802 [Google Scholar] [PubMed] [CrossRef]
40. Christie, M., Jorissen, R. N., Mouradov, D., Sakthianandeswaren, A., Li, S. et al. (2013). Different APC genotypes in proximal and distal sporadic colorectal cancers suggest distinct WNT/beta-catenin signalling thresholds for tumourigenesis. Oncogene, 32(39), 4675–4682. https://doi.org/10.1038/onc.2012.486 [Google Scholar] [PubMed] [CrossRef]
41. Buchert, M., Athineos, D., Abud, H. E., Burke, Z. D., Faux, M. C. et al. (2010). Genetic dissection of differential signaling threshold requirements for the WNT/βcatenin pathway in vivo. PLoS Genetics, 6(1), e1000816. https://doi.org/10.1371/journal.pgen.1000816 [Google Scholar] [PubMed] [CrossRef]
42. Zhan, T., Rindtorff, N., Boutros, M. (2017). Wnt signaling in cancer. Oncogene, 36(11), 1461–1473. https://doi.org/10.1038/onc.2016.304 [Google Scholar] [PubMed] [CrossRef]
43. Rusan, N. M., Peifer, M. (2008). Original CIN: Reviewing roles for APC in chromosome instability. Journal of Cell Biology, 181(5), 719–726. https://doi.org/10.1083/jcb.200802107 [Google Scholar] [PubMed] [CrossRef]
44. Caldwell, C. M., Green, R. A., Kaplan, K. B. (2007). APC mutations lead to cytokinetic failures in vitro and tetraploid genotypes in Min mice. Journal of Cell Biology, 178(7), 1109–1120. https://doi.org/10.1083/jcb.200703186 [Google Scholar] [PubMed] [CrossRef]
45. Aoki, K., Aoki, M., Sugai, M., Harada, N., Miyoshi, H. et al. (2007). Chromosomal instability by β-catenin/TCF transcription in APC or β-catenin mutant cells. Oncogene, 26(24), 3511–3520. https://doi.org/10.1038/sj.onc.1210141 [Google Scholar] [PubMed] [CrossRef]
46. Smeets, D., Miller, I. S., O’Connor, D. P., Das, S., Moran, B. et al. (2018). Copy number load predicts outcome of metastatic colorectal cancer patients receiving bevacizumab combination therapy. Nature Communications, 9(1), 4112. https://doi.org/10.1038/s41467-018-06567-6 [Google Scholar] [PubMed] [CrossRef]
47. Ornitz, D. M., Itoh, N. (2015). The fibroblast growth factor signaling pathway. Wiley Interdisciplinary Reviews. Developmental Biology, 4(3), 215–266. https://doi.org/10.1002/wdev.176 [Google Scholar] [PubMed] [CrossRef]
48. Pearson, A., Smyth, E., Babina, I. S., Herrera-Abreu, M. T., Tarazona, N. et al. (2016). High-level clonal FGFR amplification and response to FGFR inhibition in a translational clinical trial. Cancer Discovery, 6(8), 838–851. https://doi.org/10.1158/2159-8290.CD-15-1246 [Google Scholar] [PubMed] [CrossRef]
49. Kunii, K., Davis, L., Gorenstein, J., Hatch, H., Yashiro, M. et al. (2008). FGFR2-amplified gastric cancer cell lines require FGFR2 and Erbb3 signaling for growth and survival. Cancer Research, 68(7), 2340–2348. https://doi.org/10.1158/0008-5472.CAN-07-5229 [Google Scholar] [PubMed] [CrossRef]
50. Lee, H. O., Hong, Y., Etlioglu, H. E., Cho, Y. B., Pomella, V. et al. (2020). Lineage-dependent gene expression programs influence the immune landscape of colorectal cancer. Nature Genetics, 52(6), 594–603. https://doi.org/10.1038/s41588-020-0636-z [Google Scholar] [PubMed] [CrossRef]
51. Kim, J. Y., Whang, J. H., Zhou, W., Shin, J., Noh, S. M. et al. (2009). The expression of VEGF receptor genes is concurrently influenced by epigenetic gene silencing of the genes and VEGF activation. Epigenetics, 4(5), 313–321. https://doi.org/10.4161/epi.4.5.9160 [Google Scholar] [PubMed] [CrossRef]
52. Kim, J., Hwang, J., Jeong, H., Song, H. J., Shin, J. et al. (2012). Promoter methylation status of VEGF receptor genes: A possible epigenetic biomarker to anticipate the efficacy of intracellular-acting VEGF-targeted drugs in cancer cells. Epigenetics, 7(2), 191–200. https://doi.org/10.4161/epi.7.2.18973 [Google Scholar] [PubMed] [CrossRef]
53. Kim, J. Y., Hwang, J., Lee, S. H., Lee, H. J., Jelinek, J. et al. (2015). Decreased efficacy of drugs targeting the vascular endothelial growth factor pathway by the epigenetic silencing of FLT1 in renal cancer cells. Clinical Epigenetics, 7(1), 99. https://doi.org/10.1186/s13148-015-0134-9 [Google Scholar] [PubMed] [CrossRef]
54. Gerger, A., El-Khoueiry, A., Zhang, W., Yang, D., Singh, H. et al. (2011). Pharmacogenetic angiogenesis profiling for first-line bevacizumab plus oxaliplatin-based chemotherapy in patients with metastatic colorectal cancer. Clinical Cancer Research, 17(17), 5783–5792. https://doi.org/10.1158/1078-0432.CCR-11-1115 [Google Scholar] [PubMed] [CrossRef]
55. Papachristos, A., Kemos, P., Katsila, T., Panoilia, E., Patrinos, G. P. et al. (2019). VEGF-A and ICAM-1 gene polymorphisms as predictors of clinical outcome to first-line bevacizumab-based treatment in metastatic colorectal cancer. International Journal of Molecular Sciences, 20(22), 5791. https://doi.org/10.3390/ijms20225791 [Google Scholar] [PubMed] [CrossRef]
56. Loupakis, F., Cremolini, C., Yang, D., Salvatore, L., Zhang, W. et al. (2013). Prospective validation of candidate SNPs of VEGF/VEGFR pathway in metastatic colorectal cancer patients treated with first-line FOLFIRI plus bevacizumab. PLoS One, 8(7), e66774. https://doi.org/10.1371/journal.pone.0066774 [Google Scholar] [PubMed] [CrossRef]
Supplementary Materials
Figure S1: (A) High proportion of POLE-induced mutational signatures in the ultra-hypermutant tumor (#40) with microsatellite stable (B) MutSigCV identified the significantly mutated genes in the CRC cohort.
Figure S2: Classification the tumor samples as CIMP-high, CIMP-low, and CIMP-negative using unsupervised clustering of DNA methylation.
Figure S3: (A) No significant association between the CMS subtype and the bevacizumab sensitivity. (B) No significant association between the tumor purity and the bevacizumab sensitivity. (C) APC mutation status was a significantly enriched factor in responders among the genomic alterations in the CRC core pathways. (D) No significant association between the copy number load and the response to bevacizumab treatment.
Figure S4: Both IGF1 and FGFR1 are highly expressed in Stromal3 cells according to publicly available single-cell RNA-seq CRC data.
Figure S5: (A) APC mutation status was not a significantly enriched factor for responders to bevacizumab in both the FOLFOX and FOLFIRI groups. (B) APC mutation was a significant prognostic factor for PFS in the FOLFOX and bevacizumab group. (C) FLT1 was a highly methylated gene in non-responders to bevacizumab treatment in the FOLFIRI and bevacizumab group, but not in the FOLFOX and bevacizumab group.
Figure S6: (A) Gene Set Enrichment Analysis of the molecular pathways showed FGFR1 significance depended on the backbone chemotherapy used (FOLFOX vs. FOLFIRI) (B) Different IGF expression between responder and non-responder according to the backbone chemotherapy (FOLFIRI vs. FOLFOX).
Figure S7: Survival analysis of PFS and OS between the patients in the response group and non-response group according to the line of chemotherapy plus bevacizumab.
Cite This Article
 Copyright © 2023 The Author(s). Published by Tech Science Press.
This work is licensed under a Creative Commons Attribution 4.0 International License , which permits unrestricted use, distribution, and reproduction in any medium, provided the original work is properly cited.
 Downloads
 Citation Tools