
 Submit a Paper
 Propose a Special lssue
 Open Access
ARTICLE
Cell cycle and HIF-1 related gene expression alteration in thyroid cell lines under microgravity
1 Department of Surgery, Chung-Ang University Hospital, Seoul, 06974, Republic of Korea
2 Department of Surgery, Inha University College of Medicine, Incheon, 22209, Republic of Korea
3 Department of Surgery, Inha University Hospital, Incheon, 22332, Republic of Korea
* Corresponding Author: JIN WOOK YI. Email:
Oncology Research 2025, 33(8), 1909-1931. https://doi.org/10.32604/or.2025.065847
Received 23 March 2025; Accepted 23 May 2025; Issue published 18 July 2025
 View Full Text
 Download PDF
Abstract
Background: With growing interest in space exploration, understanding microgravity’s impact on human health is essential. This study aims to investigate gene expression changes and migration and invasion potential in five thyroid-related cell lines cultured under simulated microgravity. Methods: Five thyroid-related cell lines—normal thyrocytes (Nthy-ori 3-1), papillary thyroid cancer (PTC) cells (SNU-790, TPC-1), poorly differentiated thyroid cancer cell (BCPAP), and anaplastic thyroid cancer cell (SNU-80)—were cultured under simulated microgravity (10−3 g) using a clinostat. Differentially expressed genes (DEGs) were analyzed using cDNA microarray, followed by functional annotation and assessment of aggressiveness via Transwell migration and invasion assays. Results: DEG analysis under simulated microgravity revealed distinct gene expression profiles by gravity condition, with 2980 DEGs in SNU-790, 1033 in BCPAP, 562 in TPC-1, 477 in Nthy-ori 3-1, and 246 in SNU-80, as confirmed by hierarchical clustering. In PTC cell lines (SNU-790, TPC-1), G2–M phase–related genes were upregulated. In non-PTC cell lines (BCPAP, SNU-80), genes associated with innate immune response, Toll-like receptor signaling, were upregulated, whereas Hypoxia-Inducible Factor 1-alpha (HIF-1α) signaling-related genes were downregulated. Additionally, under simulated microgravity, significant migration was observed in SNU-790 (3 × 10⁴ cells) and BCPAP (2 × 10⁴ and 3 × 10⁴), while significant invasion occurred in SNU-790, Nthy-ori 3-1, and BCPAP at a seeding density of 2 × 10⁴. Other conditions showed no significant differences. Conclusion: This study comprehensively evaluates the effects of simulated microgravity using a diverse panel of thyroid-related cell lines. These findings provide valuable insight into how microgravity could influence cancer biology, emphasizing the importance of further research on cancer behavior in space environments and its implications for human health during long-term space missions.Keywords
With the increased focus on space exploration and long-term habitation projects, such as Artemis, health issues in space have become a critical concern. These challenges are linked to exposure to unique conditions, such as altered gravity, vibrations, and radiation, which differ significantly from those on Earth [1]. Gravity in space is different from that on Earth, and the gravitational force approaches microgravity. Gravity is essential for maintaining homeostasis in tissues and cells during biological processes [2]. Consequently, the effects of microgravity on the human body have become a significant focus of ongoing research [3].
Microgravity differs significantly from the typical gravitational environment on Earth, offering new insights into fundamental cellular biological processes, such as cell differentiation, proliferation, growth, programmed cell death, adhesion, migration, and invasion [1,4,5]. In particular, understanding how characteristics, such as cancer cell growth, differentiation, migration, and invasion, change in microgravity can provide critical clues on the intrinsic nature of cancer and potential treatment strategies [6,7].
Thyroid cancer is prevalent worldwide, but the mechanisms underlying its development are unclear [8]. Moreover, no effective treatments are currently available for conditions like radioiodine-refractory thyroid cancer or anaplastic thyroid cancer (ATC), making the development of new therapeutic strategies a pressing issue. Astronauts and airline crew, due to continuous exposure to natural sources of radiation such as galactic cosmic rays, solar particle events, and the Earth’s radiation belts outside the shielding of the Earth’s atmosphere and magnetic field, are subject to whole-body radiation that may particularly affect radiosensitive organs like the thyroid gland [9]. Previous research has shown that ionizing radiation, a characteristic of space, is associated with a higher standardized incidence ratio (1.11) and standardized mortality ratio (1.19) for thyroid cancer in airline crew members [10]. A recent national cohort study in Korea found that female airline crew members had a significantly higher standardized incidence ratio (SIR) of 1.25 for thyroid cancer compared to the general population, suggesting a potential association with occupational factors such as cosmic radiation [11]. Hence, the space environment may have a greater impact on humans than the exposure experienced by airline crew members with regard to thyroid cancer. Furthermore, several studies have reported that microgravity induces morphological and biological changes in thyroid cancer cells [4,5,7,12,13]. In addition, changes in the immune system caused by microgravity, along with environmental and dietary changes in space, can produce conditions that adversely impact thyroid cancer [14].
Most previous studies on thyroid cancer in microgravity have focused on a limited number of Western-derived follicular thyroid cancer cell lines. Despite these findings, limited research has explored how microgravity affects the gene expression landscape and aggressive behaviors of various thyroid cancer cell types. To address this gap, we selected five thyroid-related cell lines that reflect a wide spectrum of histological differentiation and genetic diversity. This panel includes papillary thyroid carcinoma (PTC) cell lines, which represent the most prevalent subtype of thyroid cancer worldwide, as well as poorly differentiated and anaplastic thyroid carcinoma lines, which are associated with aggressive clinical behavior and limited treatment options. A normal thyrocyte line was also included as a physiological reference. This diversity allows a comprehensive comparison of microgravity effects across the spectrum of thyroid cancer progression and differentiation. Given the diversity of thyroid malignancies and their differing genetic backgrounds, a comparative evaluation under microgravity conditions may uncover novel insights into cancer progression in extraterrestrial environments.
We hypothesized that microgravity induces distinct gene expression changes and promotes the migratory and invasive behavior of thyroid cancer cells. To test this, we examined molecular and functional alterations in five thyroid-related cell lines cultured under simulated microgravity, including gene expression profiling and transwell migration and invasion assays.
This study analyzed the characteristics of five thyroid cell lines (Nthy-ori 3-1, SNU-790, SNU-80, TPC-1, BCPAP) as listed in Table 1. The SNU-790 and SNU-80 cell lines were purchased from the Korea Cell Line Bank (Seoul, Korea, https://cellbank.snu.ac.kr, accessed on 22 May 2025), while the TPC-1, BCPAP, and Nthy-ori 3-1 cell lines were provided by the Seoul National University Cancer Research Institute (Seoul, Korea, https://cri.snu.ac.kr, accessed on 22 May 2025). All cell lines were authenticated using short tandem repeat profiling and tested negative for mycoplasma contamination prior to experiments. SNU-790 and TPC-1 were used as PTC cell lines; these two cell lines do not share common genetic mutations [15,16]. In contrast, Nthy-ori 3-1, SNU-80, and BCPAP are not associated with PTC [15,17,18]. Specifically, Nthy-ori 3-1 is a permanent normal thyroid follicular epithelial cell line, SNU-80 is an ATC cell line, and BCPAP is a poorly differentiated thyroid cancer (PDTC) cell line.
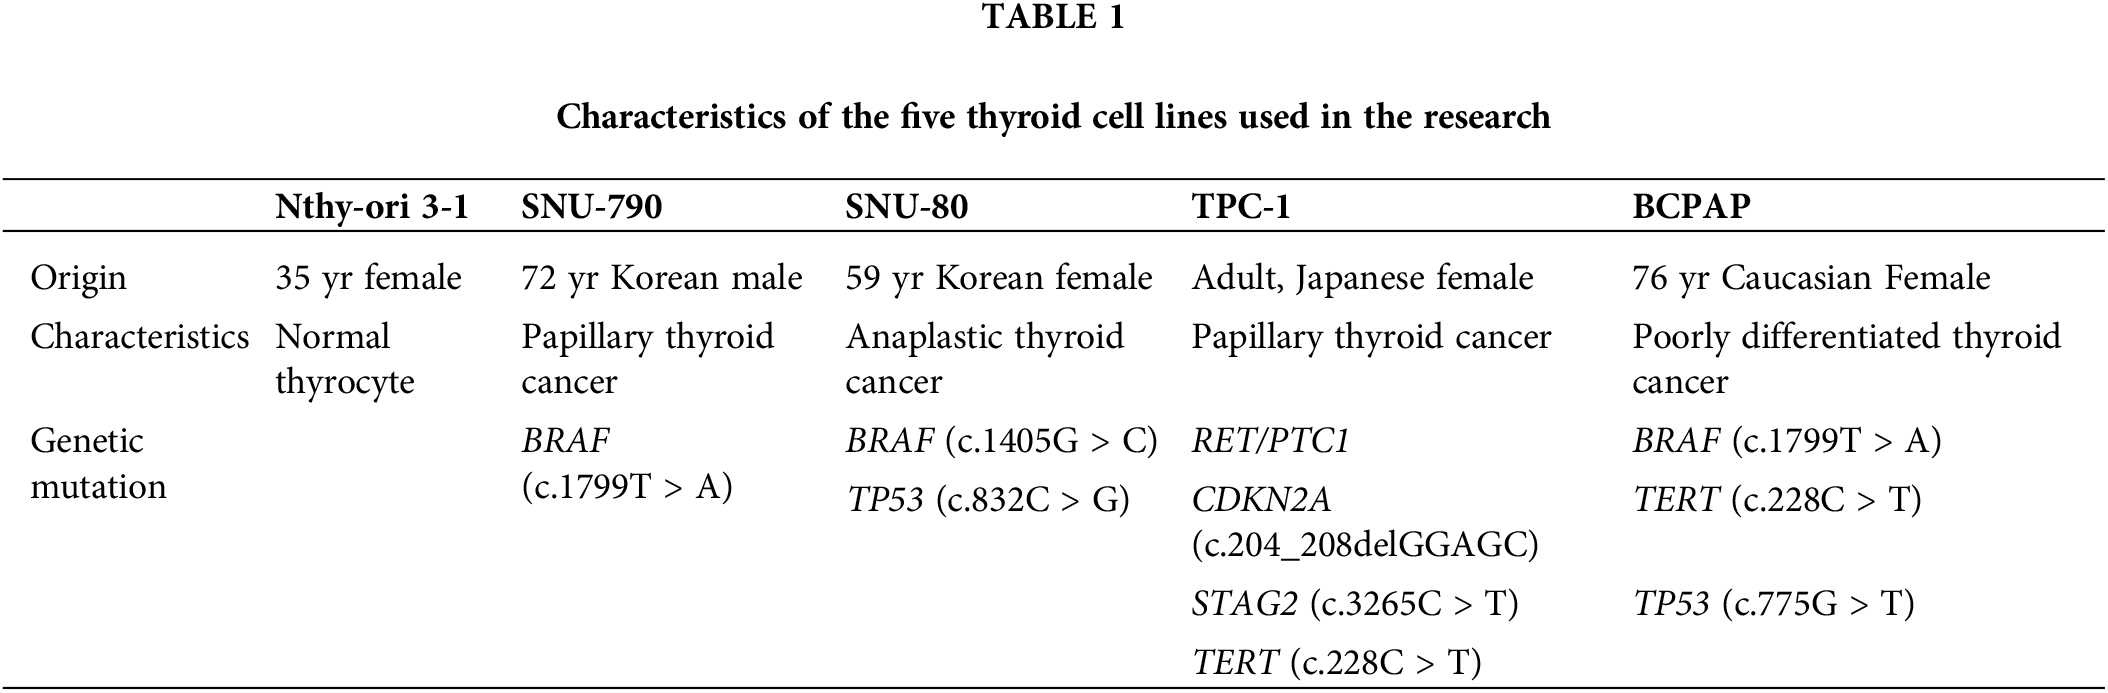
The genetic mutation characteristics showed that the SNU-790 and BCPAP cell lines carry the BRAF (c.1799T > A) mutation, while the SNU-80 cell line has the BRAF (c.1405G>C) mutation. In addition, the TERT (c.228C > T) mutation was identified in the TPC-1 and BCPAP cell lines. The TP53 (c.832C > G) mutation was observed in the SNU-80 cell line, whereas the TP53 (c.775G > T) mutation was observed in the BCPAP cell line. Further details about these cell lines can be accessed through the Cellosaurus database (https://www.cellosaurus.org/, accessed on 22 May 2025).
Cell culture under simulated ground-based microgravity and normal gravity
The cell culture and microgravity setup for this study followed a previously established protocol [19]. Five cell lines were seeded at 1 × 10⁶ cells into T-25 culture flasks (Corning, Oneonta, NY, USA) and incubated in a humidified environment with 5% CO2 at 37°C. The cells were cultured in RPMI-1640 medium (Cytiva, Marlborough, MA, USA) supplemented with 10% fetal bovine serum (FBS; Cytiva, Marlborough, MA, USA) and 1% penicillin-streptomycin (Thermo Fisher Scientific, Waltham, MA, USA).
After 24 h of subculture, each of the five thyroid-related cell lines was reseeded into six T-25 culture flasks (Corning, Corning, NY, USA) at a density of 1 × 10⁶ cells per flask with the media conditions remaining consistent with those used during the subculture. The six flasks for each cell line were then divided equally into two groups: three flasks for the simulated microgravity condition and three for the normal gravity control. Simulated microgravity was generated using clinostat equipment (Gravite®, Space Bio-Laboratories Co., Ltd., Hiroshima, Japan). The clinostat (Gravite®, Space Bio-Laboratories Co., Ltd., Hiroshima, Japan) simulates microgravity by continuously rotating the culture flask around a horizontal axis, thereby averaging the gravitational vector over time and effectively minimizing the net gravitational force experienced by the cells. This approach has been shown to effectively simulate microgravity conditions (10–3 g), yielding results comparable to those obtained under real microgravity in various biological systems, thus justifying its widespread use in ground-based studies [20]. The flasks assigned to the microgravity group were mounted on a rotating holder of the clinostat to simulate a gravitational force of 10–3 g microgravity. The control group flasks were placed stationary at the bottom of the same clinostat chamber to maintain standard Earth gravity. This setup was designed to ensure that gravity was the only differing variable, while all other environmental conditions were strictly controlled and consistent between the two groups. All flasks were placed inside the clinostat chamber and incubated for 120 h (5 days) without media replacement.
The adherent cells from flasks cultured for five days under microgravity and normal gravity conditions were collected for RNA extraction using the guanidium-acid-phenol extraction method [21]. After washing with phosphate-buffered saline (1× PBS, pH 7.0–7.2, without calcium, magnesium, or phenol red; sterile-filtered through a 0.1 μm filter; Cytiva, Marlborough, MA, USA), cell lysis was induced using TransZol (TransGen Biotech Co., Ltd., Beijing, China) to inactivate endogenous ribonuclease (RNase) activity and selectively isolate RNA. Chloroform (Merck KGaA, Darmstadt, Germany) was added to separate the RNA from DNA and protein, and the resulting aqueous phase was collected. Isopropanol (Merck KGaA, Darmstadt, Germany) was added to precipitate the RNA. The RNA was pelleted by centrifugation at 13,000 g for 10 min at 4°C and washed with 80% ethanol (Thermo Fisher Scientific, Waltham, MA, USA) to remove metal salt ions. The RNA pellet was air-dried and dissolved in distilled water (Thermo Fisher Scientific, Waltham, MA, USA) to induce the alkylation of histidine at the RNase activation sites.
The RNA quality was evaluated thoroughly using a NanoDrop spectrophotometer (Thermo Fisher Scientific, Waltham, MA, USA). The RNA concentration was determined by measuring the absorbance at 260 nm, with purity ratios of 1.7–2.0, indicating relatively pure RNA. The RNA integrity was assessed, and a minimum RNA integrity number of eight was required.
The GeneChip Human Gene 2.0 ST Array (Thermo Fisher Scientific, Waltham, MA, USA) was utilized for cDNA microarray analysis. cDNA synthesis, fragmentation, and biotin labeling were conducted using the GeneChip WT Amplification Kit and the GeneChip WT Terminal Labeling Kit (Thermo Fisher Scientific, Waltham, MA, USA). After hybridizing the cDNA to the Affymetrix GeneChip Array (Affymetrix Inc., Santa Clara, CA, USA), the arrays were washed and stained on a GeneChip Fluidics Station 450 (Thermo Fisher Scientific, Waltham, MA, USA) and scanned with a GCS3000 Scanner (Affymetrix Inc., Santa Clara, CA, USA). The probe cell intensity data were calculated, and CEL files were generated using the Analysis Power Tools version 2.11.6 (Thermo Fisher Scientific, Waltham, MA, USA).
Differentially expressed genes analysis and Functional Annotation analysis
Differentially Expressed Genes (DEGs) analyses were conducted using Transcriptome Analysis Console Software version 4.0 (Thermo Fisher Scientific, Waltham, MA, USA). DEGs between the microgravity and normal gravity conditions were analyzed. A fold change (FC) cutoff of 1.5 was used to determine the significant DEGs. Genes with a p < 0.05 or a false discovery rate (FDR) < 0.2 were considered significant. Hierarchical clustering analysis was performed to determine if the DEG patterns differed based on the gravity conditions. For DEGs that were commonly upregulated or downregulated across two or more cell types under microgravity, the analysis was carried out using Bioinformatics and Evolutionary Genomics tools (Gent, Belgium; https://bioinformatics.psb.ugent.be/webtools/Venn/, accessed on 22 May 2025).
Functional analysis of DEGs between the two gravity conditions was performed using several functional annotation databases, including the Gene Ontology (GO) (http://geneontology.org, accessed on 22 May 2025), Kyoto Encyclopedia of Genes and Genomes (KEGG) pathway (http://kegg.jp, accessed on 22 May 2025), and Gene Set Enrichment Analysis (GSEA) (https://www.gsea-msigdb.org, accessed on 22 May 2025). GO and KEGG analyses were conducted using g:Profiler (https://biit.cs.ut.ee/gprofiler/gost, accessed on 22 May 2025), while GSEA analysis was carried out using the software provided by the Broad Institute (https://www.gsea-msigdb.org/gsea/index.jsp, accessed on 22 May 2025). This study examined whether the GO terms, KEGG pathways, or GSEA gene sets with significant enrichment were common across two or more cell types.
Transwell migration and invasion assay
Transwell migration and invasion assays were used to evaluate the aggressiveness of thyroid-related cells cultured under simulated microgravity conditions. The cells were grown in simulated microgravity and normal gravity for five days and seeded into the insert wells at three different densities: 1 × 10⁴, 2 × 10⁴, and 3 × 10⁴ cells per well. The insert wells were filled with serum-free media (Hyclone, Thermo Fisher Scientific, Waltham, MA, USA), including RPMI 1640 Medium supplemented with 25 mM 4-(2-Hydroxyethyl)piperazine-1-ethanesulfonic acid (HEPES) and 2 mM L-glutamine, while complete growth media was added to the lower chamber to act as a chemoattractant. After incubation for 24 h at 37°C, the cells remaining on the upper surface of the membrane were removed with cotton swabs. The cells that migrated through the membrane were fixed with 4% paraformaldehyde and stained with a 0.1% crystal violet solution. Observations were made using an Olympus BX51 microscope (Olympus Corporation, Tokyo, Japan) with 10× magnification, and cell counting was performed manually. For the invasion assay, the procedure was similar, with the additional step of coating each well with Matrigel (Corning, Corning, NY, USA) for 24 h to allow solidification. To minimize observational bias, cell counting for migration and invasion assays was conducted manually by investigators blinded to the gravity conditions.
For gene expression analysis, DEGs between microgravity and normal gravity conditions were compared using an FC threshold of 1.5. Statistical significance was defined as a p-value < 0.05 or FDR < 0.2 using the Benjamini-Hochberg procedure. Hierarchical clustering was conducted using the Euclidean distance metric and complete linkage method. Functional annotation of DEGs was conducted using GO and KEGG via g:Profiler, with significantly enriched terms defined as adjusted p-values (padj) < 0.05, as provided by the g:Profiler tool.
GSEA was performed using software provided by the Broad Institute. The enrichment statistic was set to “weighted,” and the metric for ranking genes was “signal-to-noise.” Gene set size thresholds were set with a minimum of 15 genes and a maximum of 500 genes. The permutation type was “gene-set,” with the number of permutations set to 1000. Gene sets with an FDR < 0.25 were considered significantly enriched.
Statistical analysis was performed using a t-test to compare the number of migrated and invaded cells between the simulated microgravity and normal gravity conditions; statistical significance was set at a p-value < 0.05. Due to the small sample size (n = 3 per group), we did not conduct formal normality tests, as such tests have low power in small datasets. Although an independent t-test was applied to compare group means, the limited sample size may compromise the reliability of parametric assumptions. Therefore, the results should be interpreted with caution. The analysis was conducted using R version 4.3.1 (www.r-project.org).
Differentially expressed genes analysis
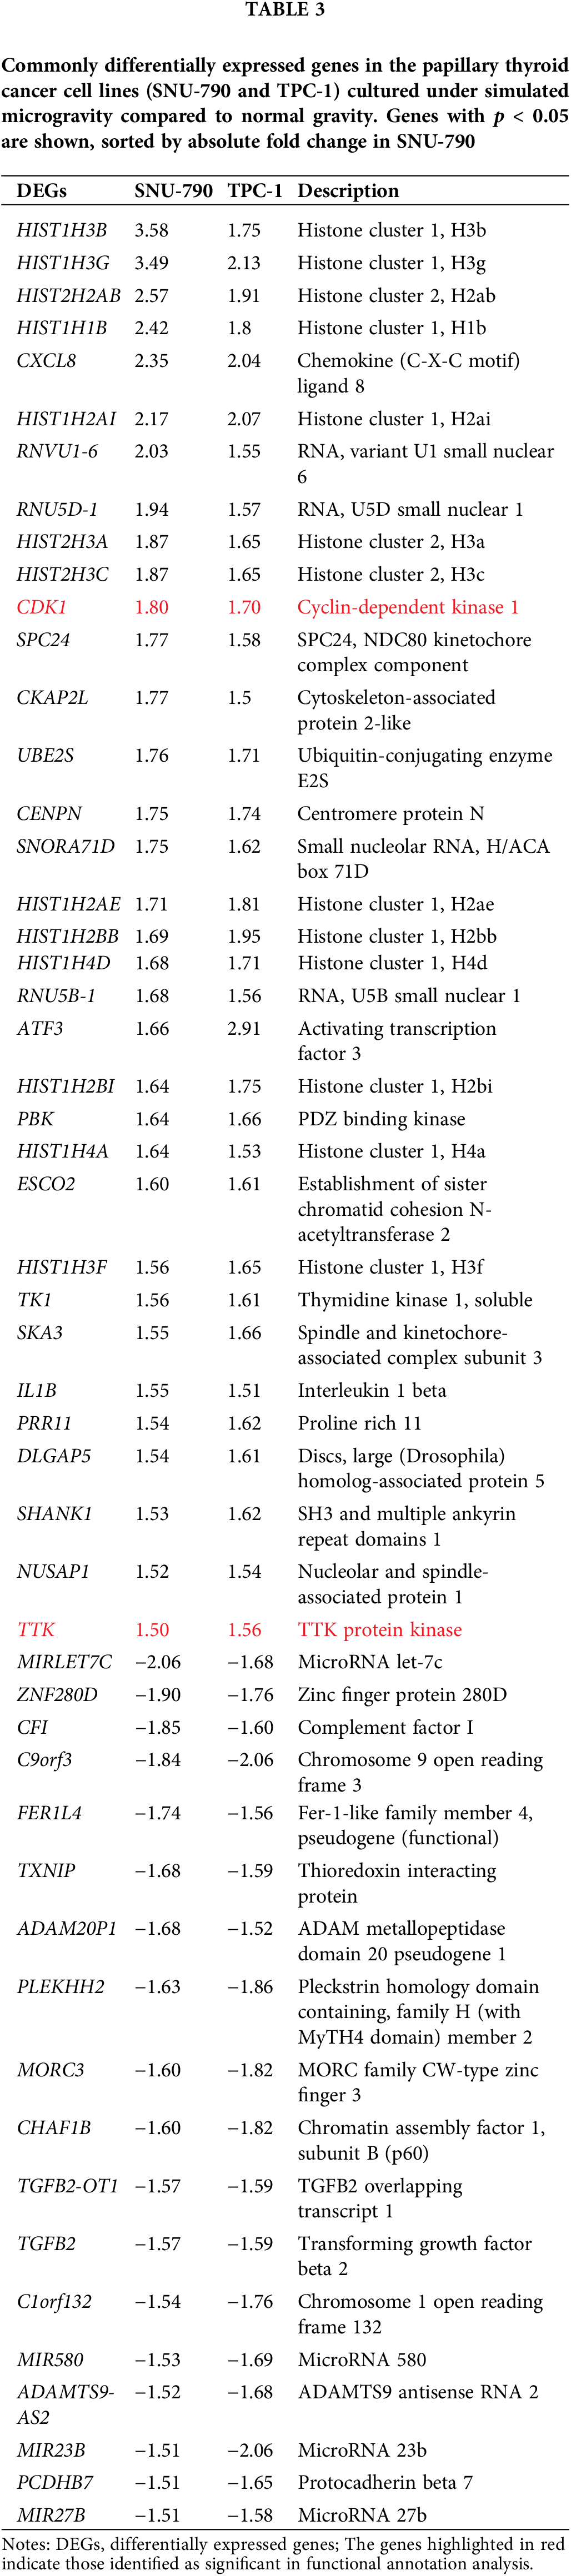
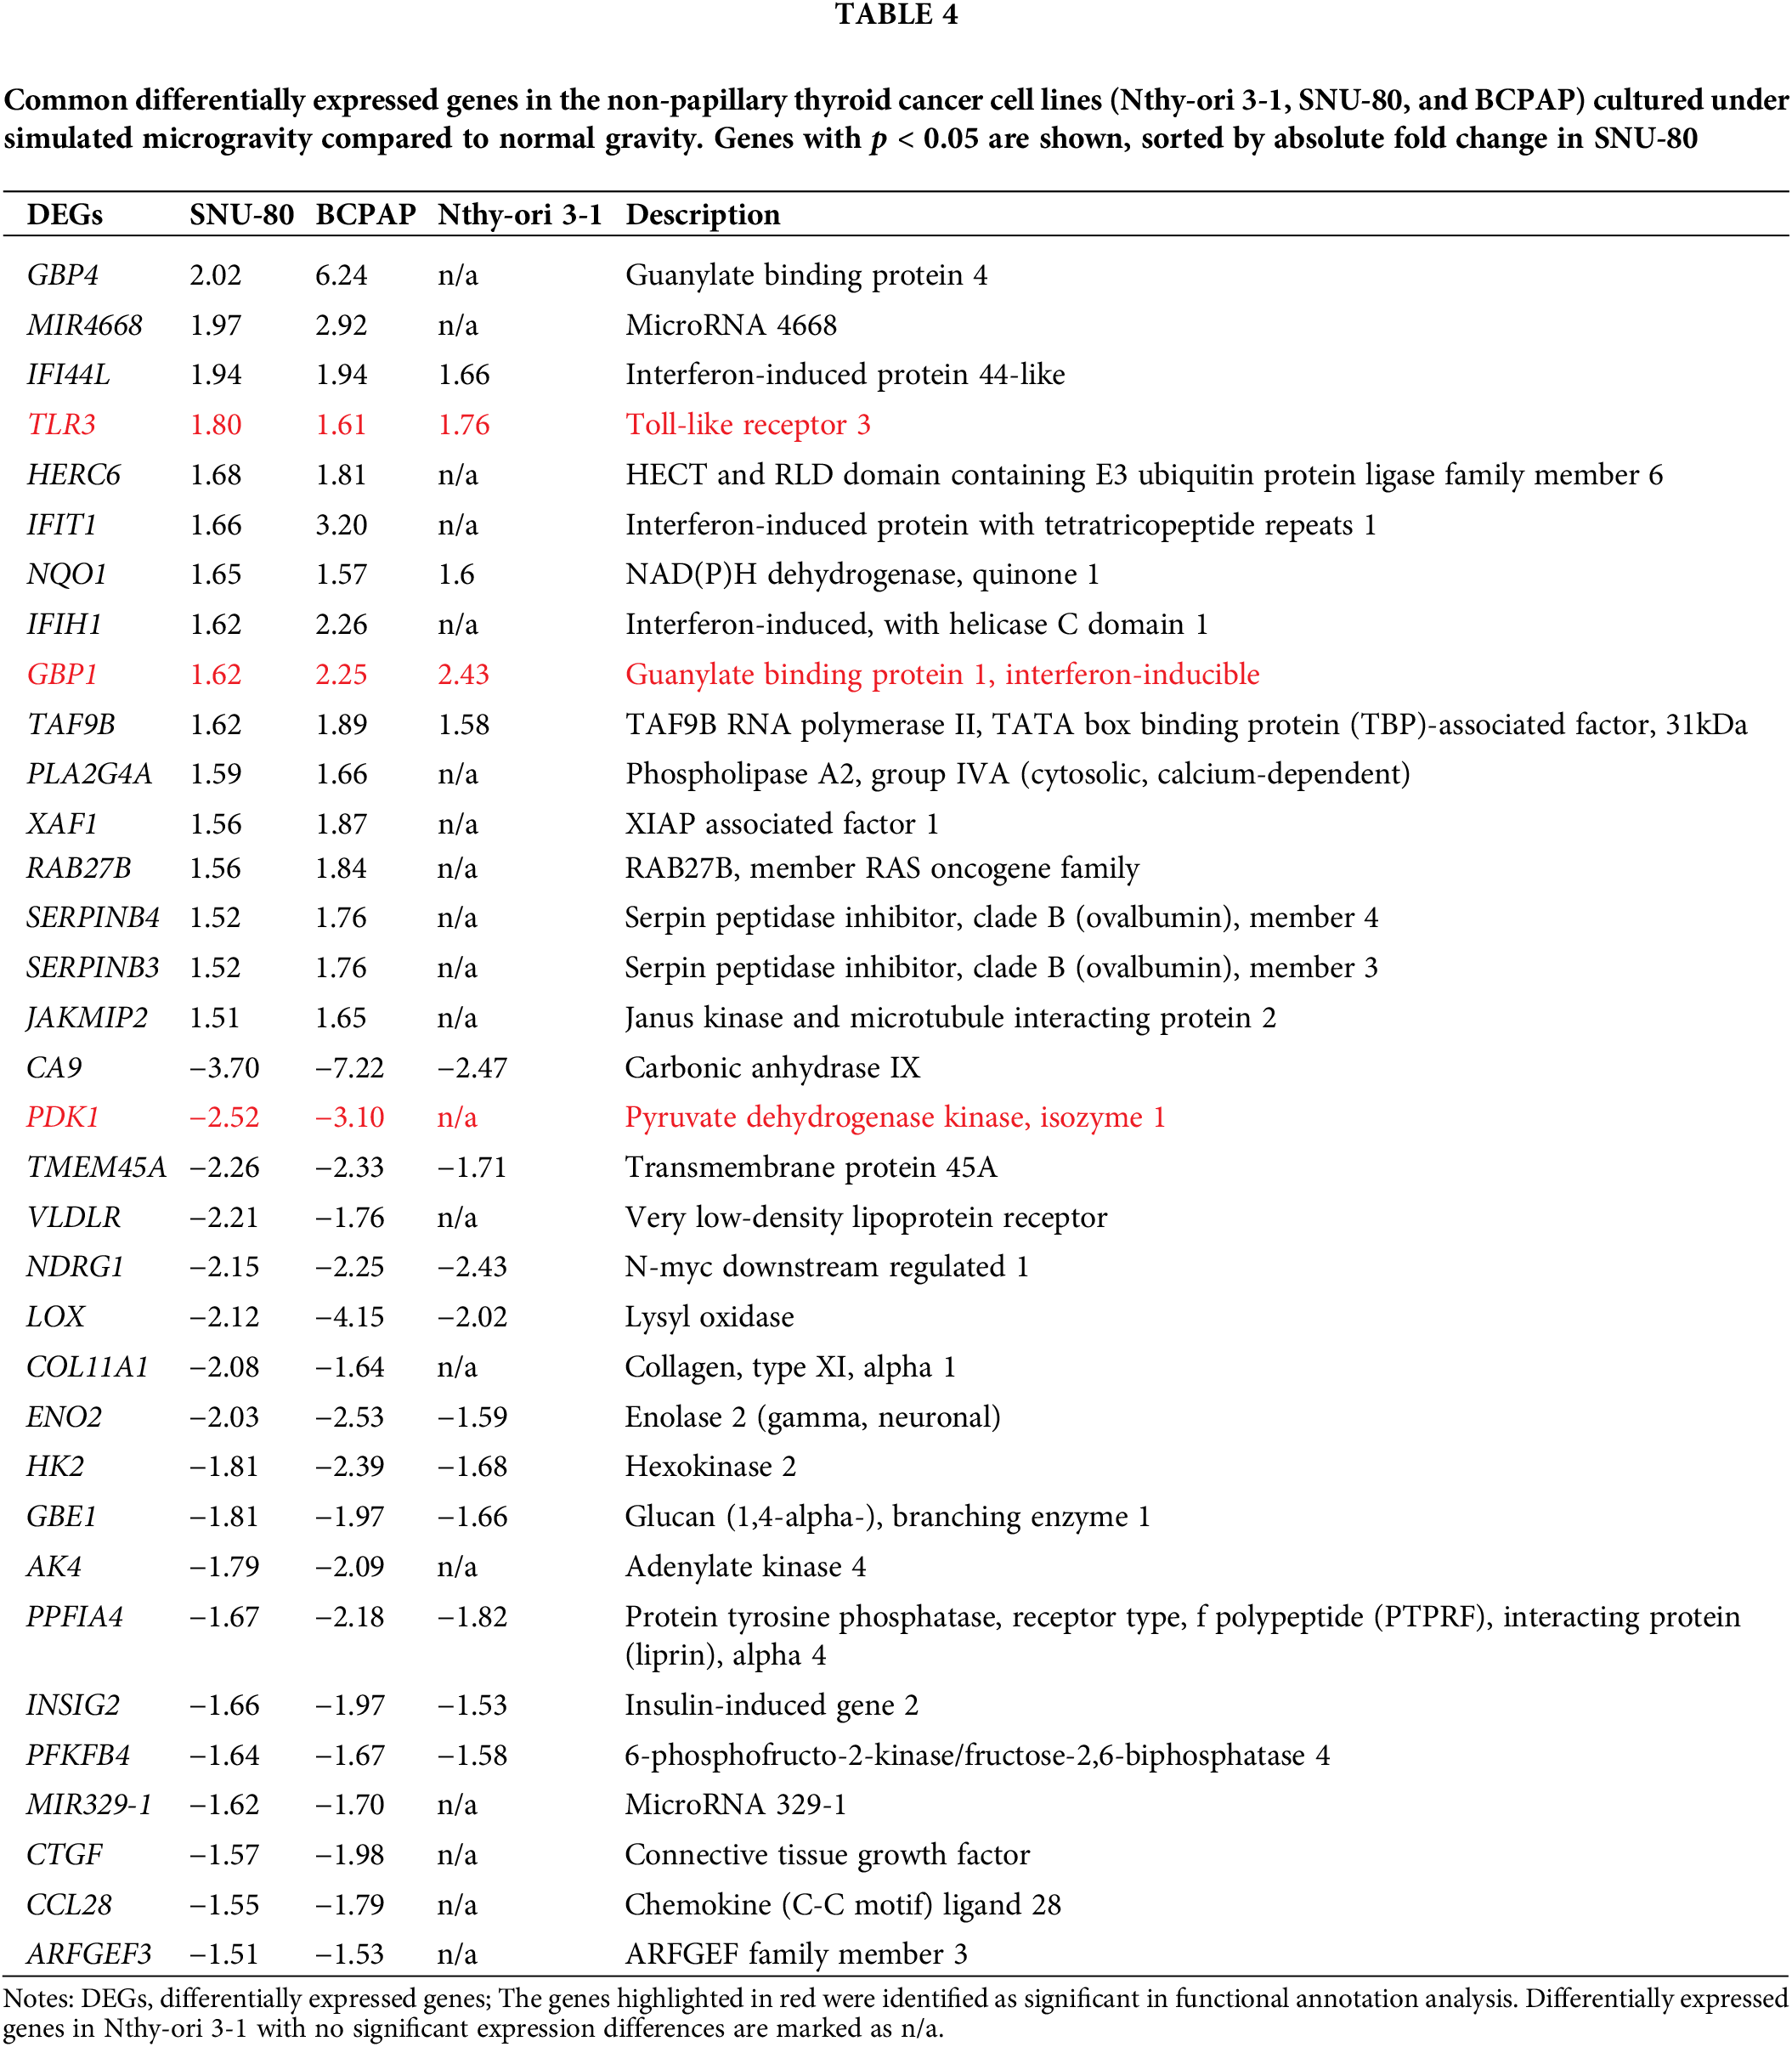
Tables A1–A5 summarize the top 20 upregulated and downregulated DEGs identified in each cell line cultured under microgravity conditions. DEG analysis showed that SNU-790 cells exhibited the most DEGs, with 2980 genes, followed by BCPAP (1033 genes), TPC-1 (562 genes), Nthy-ori 3-1 (477 genes), and SNU-80 (246 genes; Table 2). Hierarchical clustering analysis indicated that all cell lines exhibited distinct characteristics based on gravity conditions (Fig. 1). Fig. 2A,B, and Tables 3 and 4 present the common DEGs across the five cell lines. No DEGs were consistently upregulated or downregulated across all five cell lines. The PTC cell lines (SNU-790 and TPC-1) shared 34 upregulated and 18 downregulated DEGs. In particular, 13 genes related to histones were upregulated, while the cell cycle-related genes, such as CDK1 (SNU-790, FC = 1.80, p = 0.001; TPC-1, FC = 1.70, p = 0.008), and TTK (SNU-790, FC = 1.50, p = 0.004; TPC-1, FC = 1.56, p = 0.003), were also upregulated. In the non-PTC cell lines, SNU-80 and BCPAP, 18 DEGs were commonly upregulated, and 16 were downregulated. The commonly upregulated genes in the non-PTC cell lines included TLR3 (SNU-80, FC = 1.80, p < 0.001; BCPAP, FC = 1.61, p < 0.001; Nthy-ori 3-1, FC = 1.76, p < 0.001) and GBP1 (SNU-80, FC = 1.62, p = 0.001; BCPAP, FC = 2.25, p < 0.001; Nthy-ori 3-1, FC = 2.43, p < 0.001). The downregulated genes included CA9, associated with hypoxia (SNU-80, FC = −3.70, p = 0.035; BCPAP, FC = −7.22, p < 0.001; Nthy-ori 3-1, FC = −2.47, p < 0.001), along with genes involved in glucose metabolism, such as ENO2, HK2, and PFKFB4, and PDK1 (SNU-80, FC = −2.52, p = 0.038; BCPAP, FC = −3.10, p < 0.001).
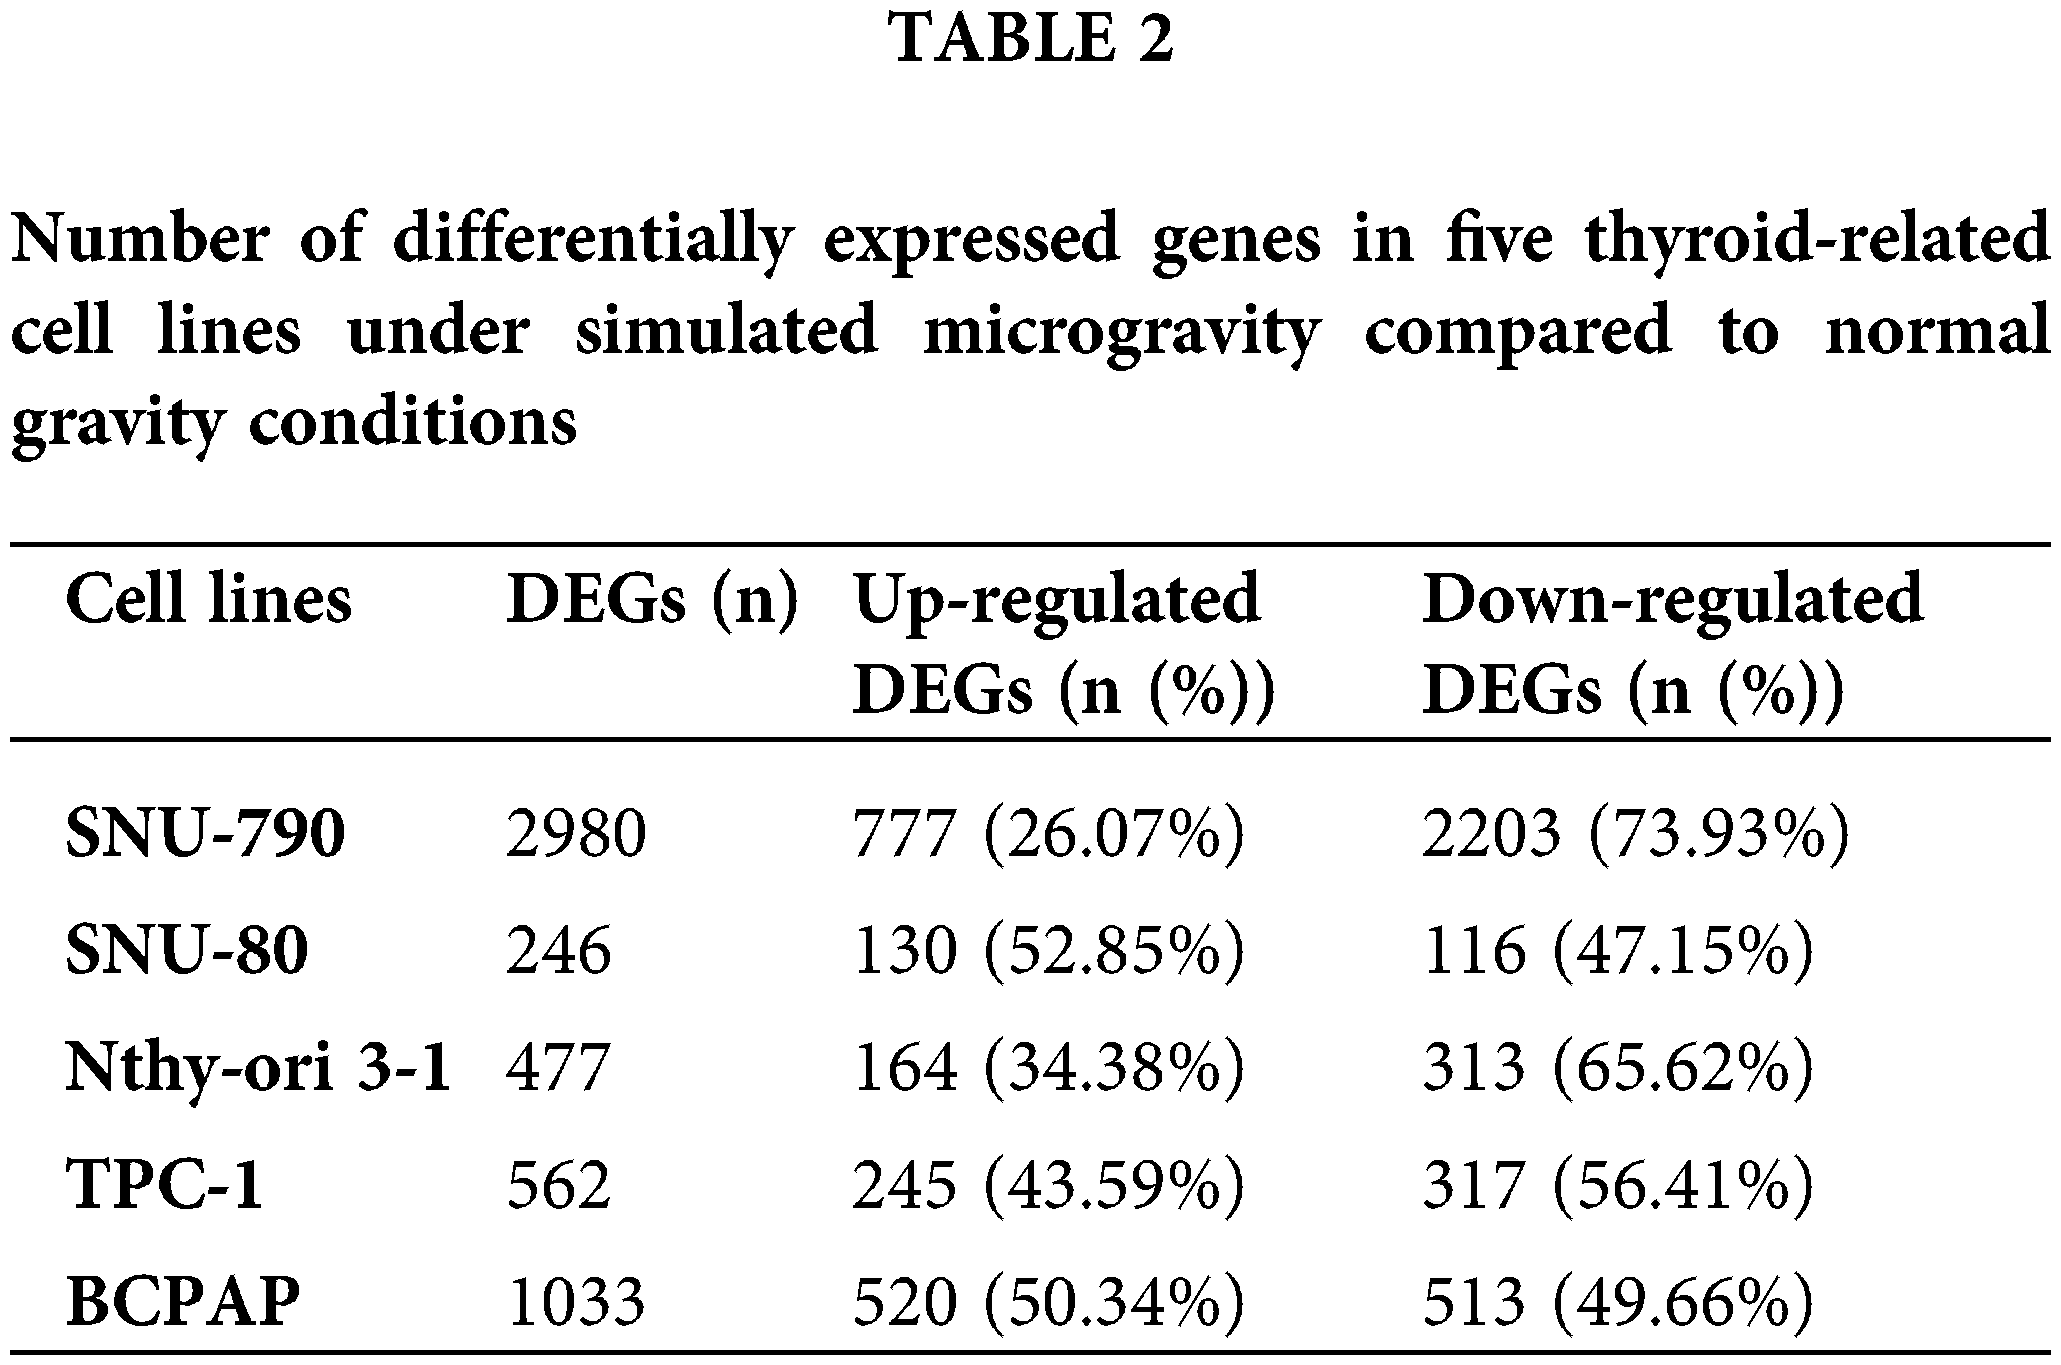
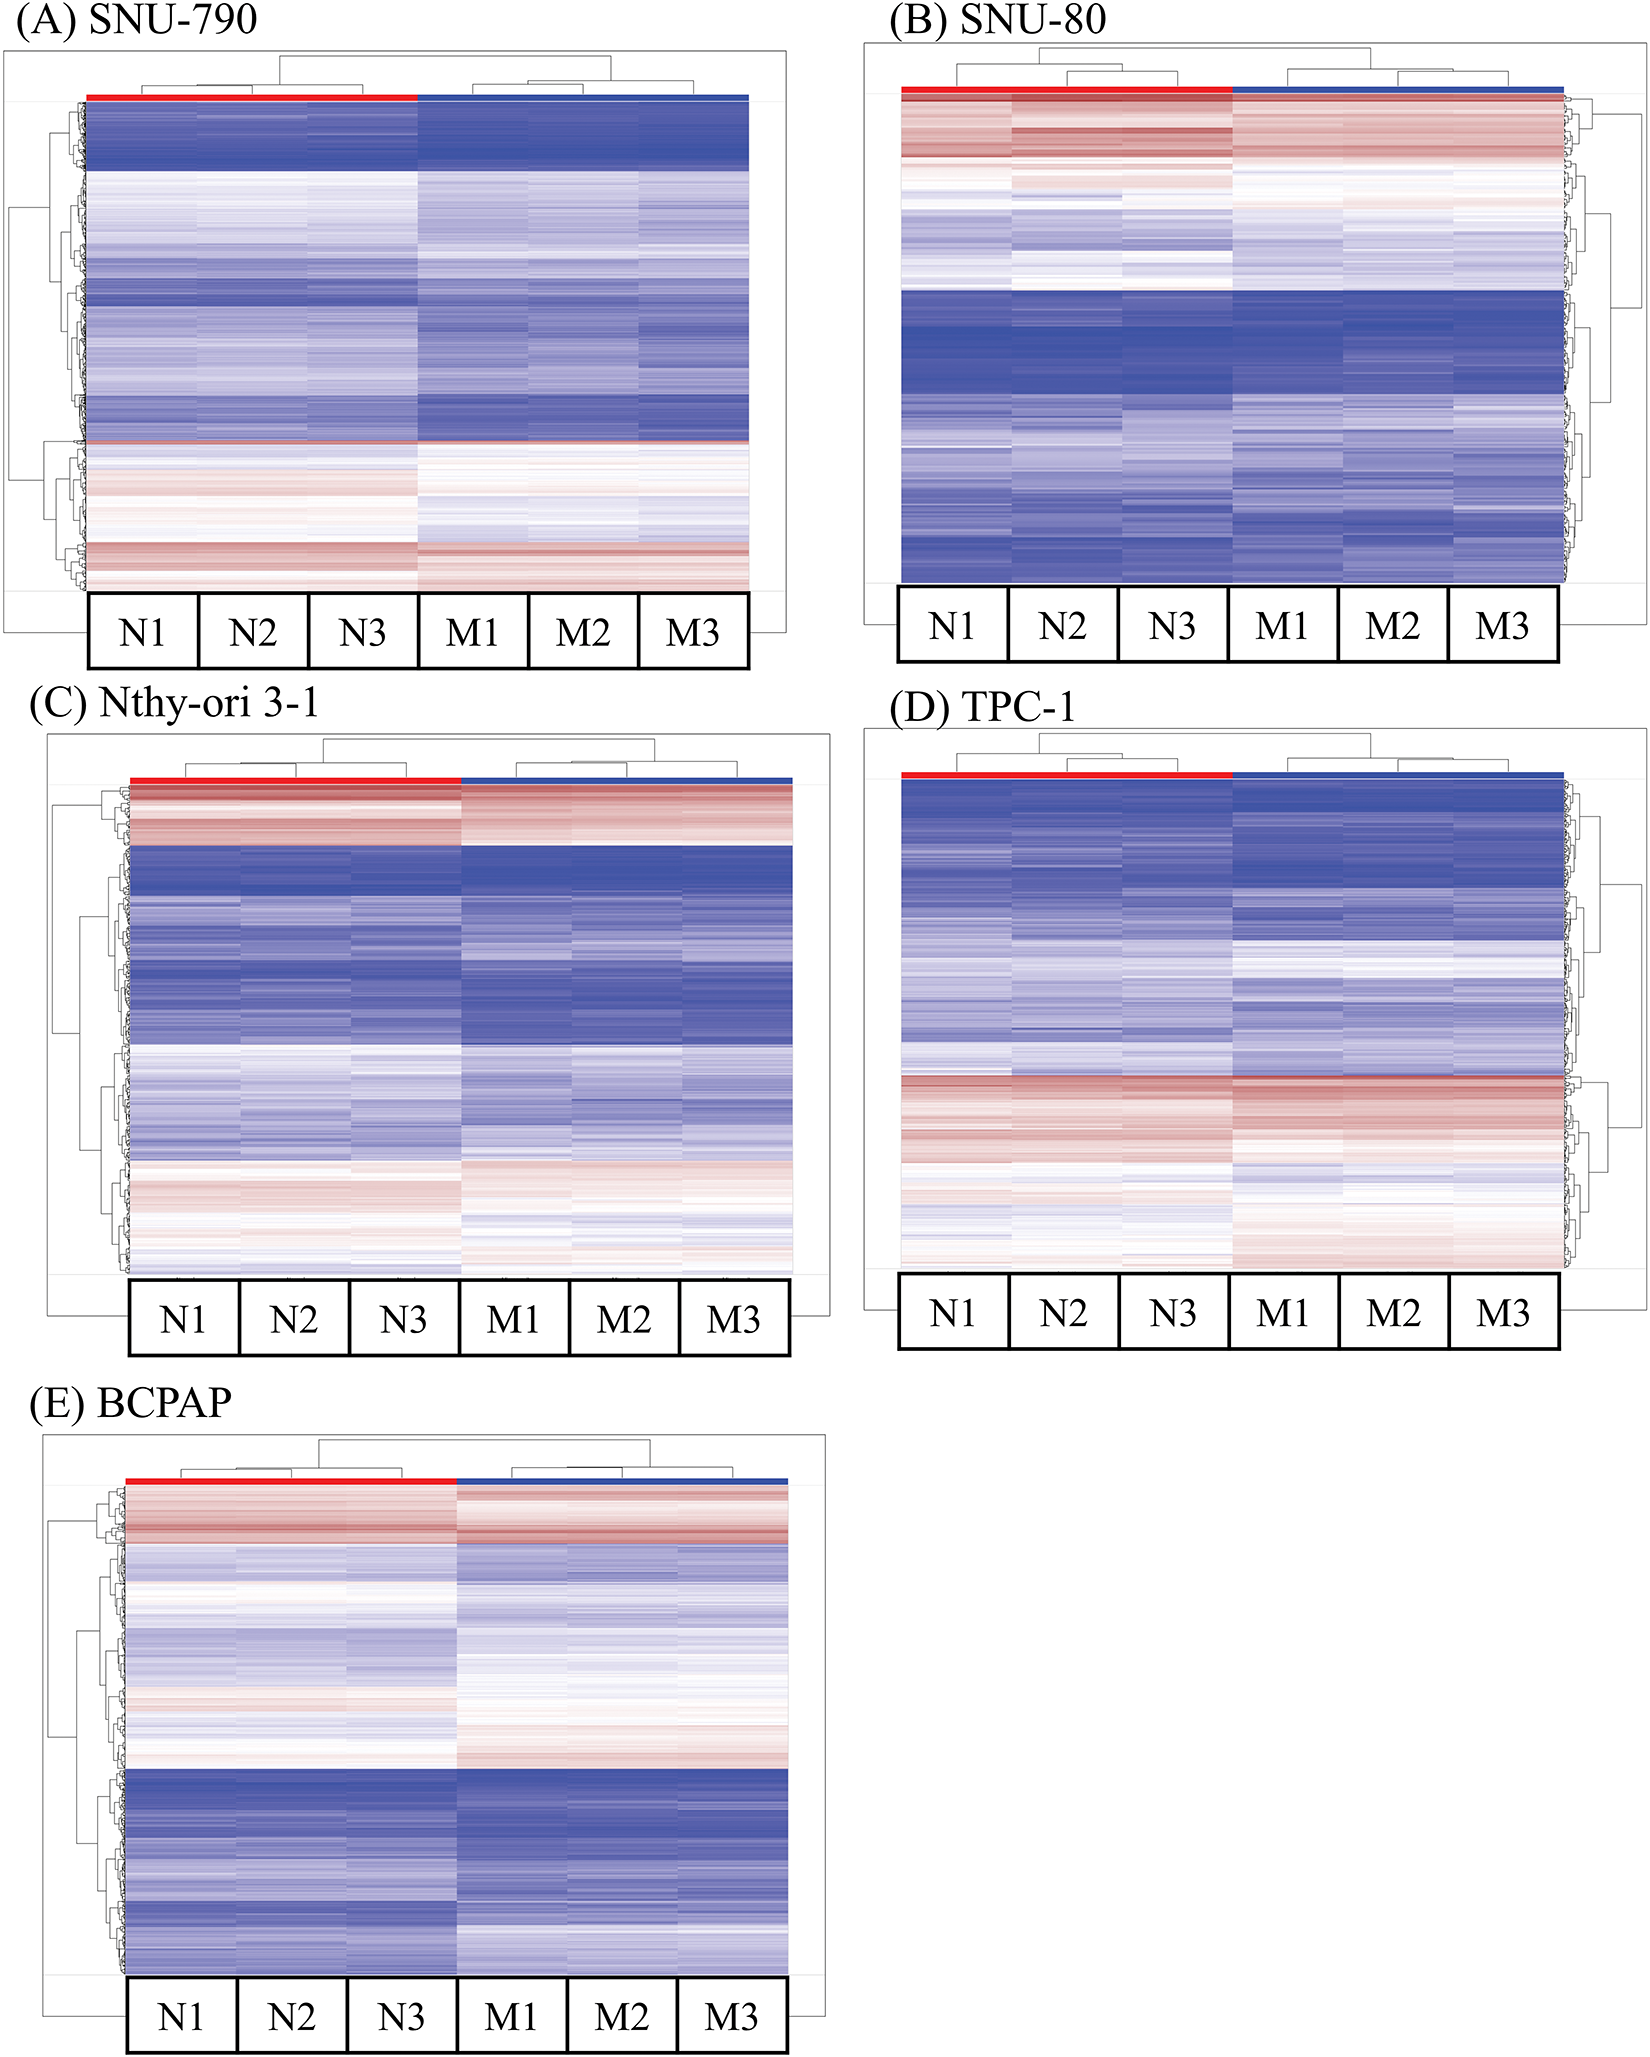
Figure 1: Hierarchical clustering analysis of differentially expressed genes (DEGs) in thyroid-related cell lines cultured under simulated microgravity. The first three columns (N1–N3) for each cell line represent normal gravity conditions, while the last three columns (M1–M3) depict microgravity conditions. (A) SNU-790. (B) SNU-80. (C) Nthy-ori 3-1. (D) TPC-1. (E) BCPAP. Upregulated DEGs are shown in brown, and downregulated DEGs are shown in blue.
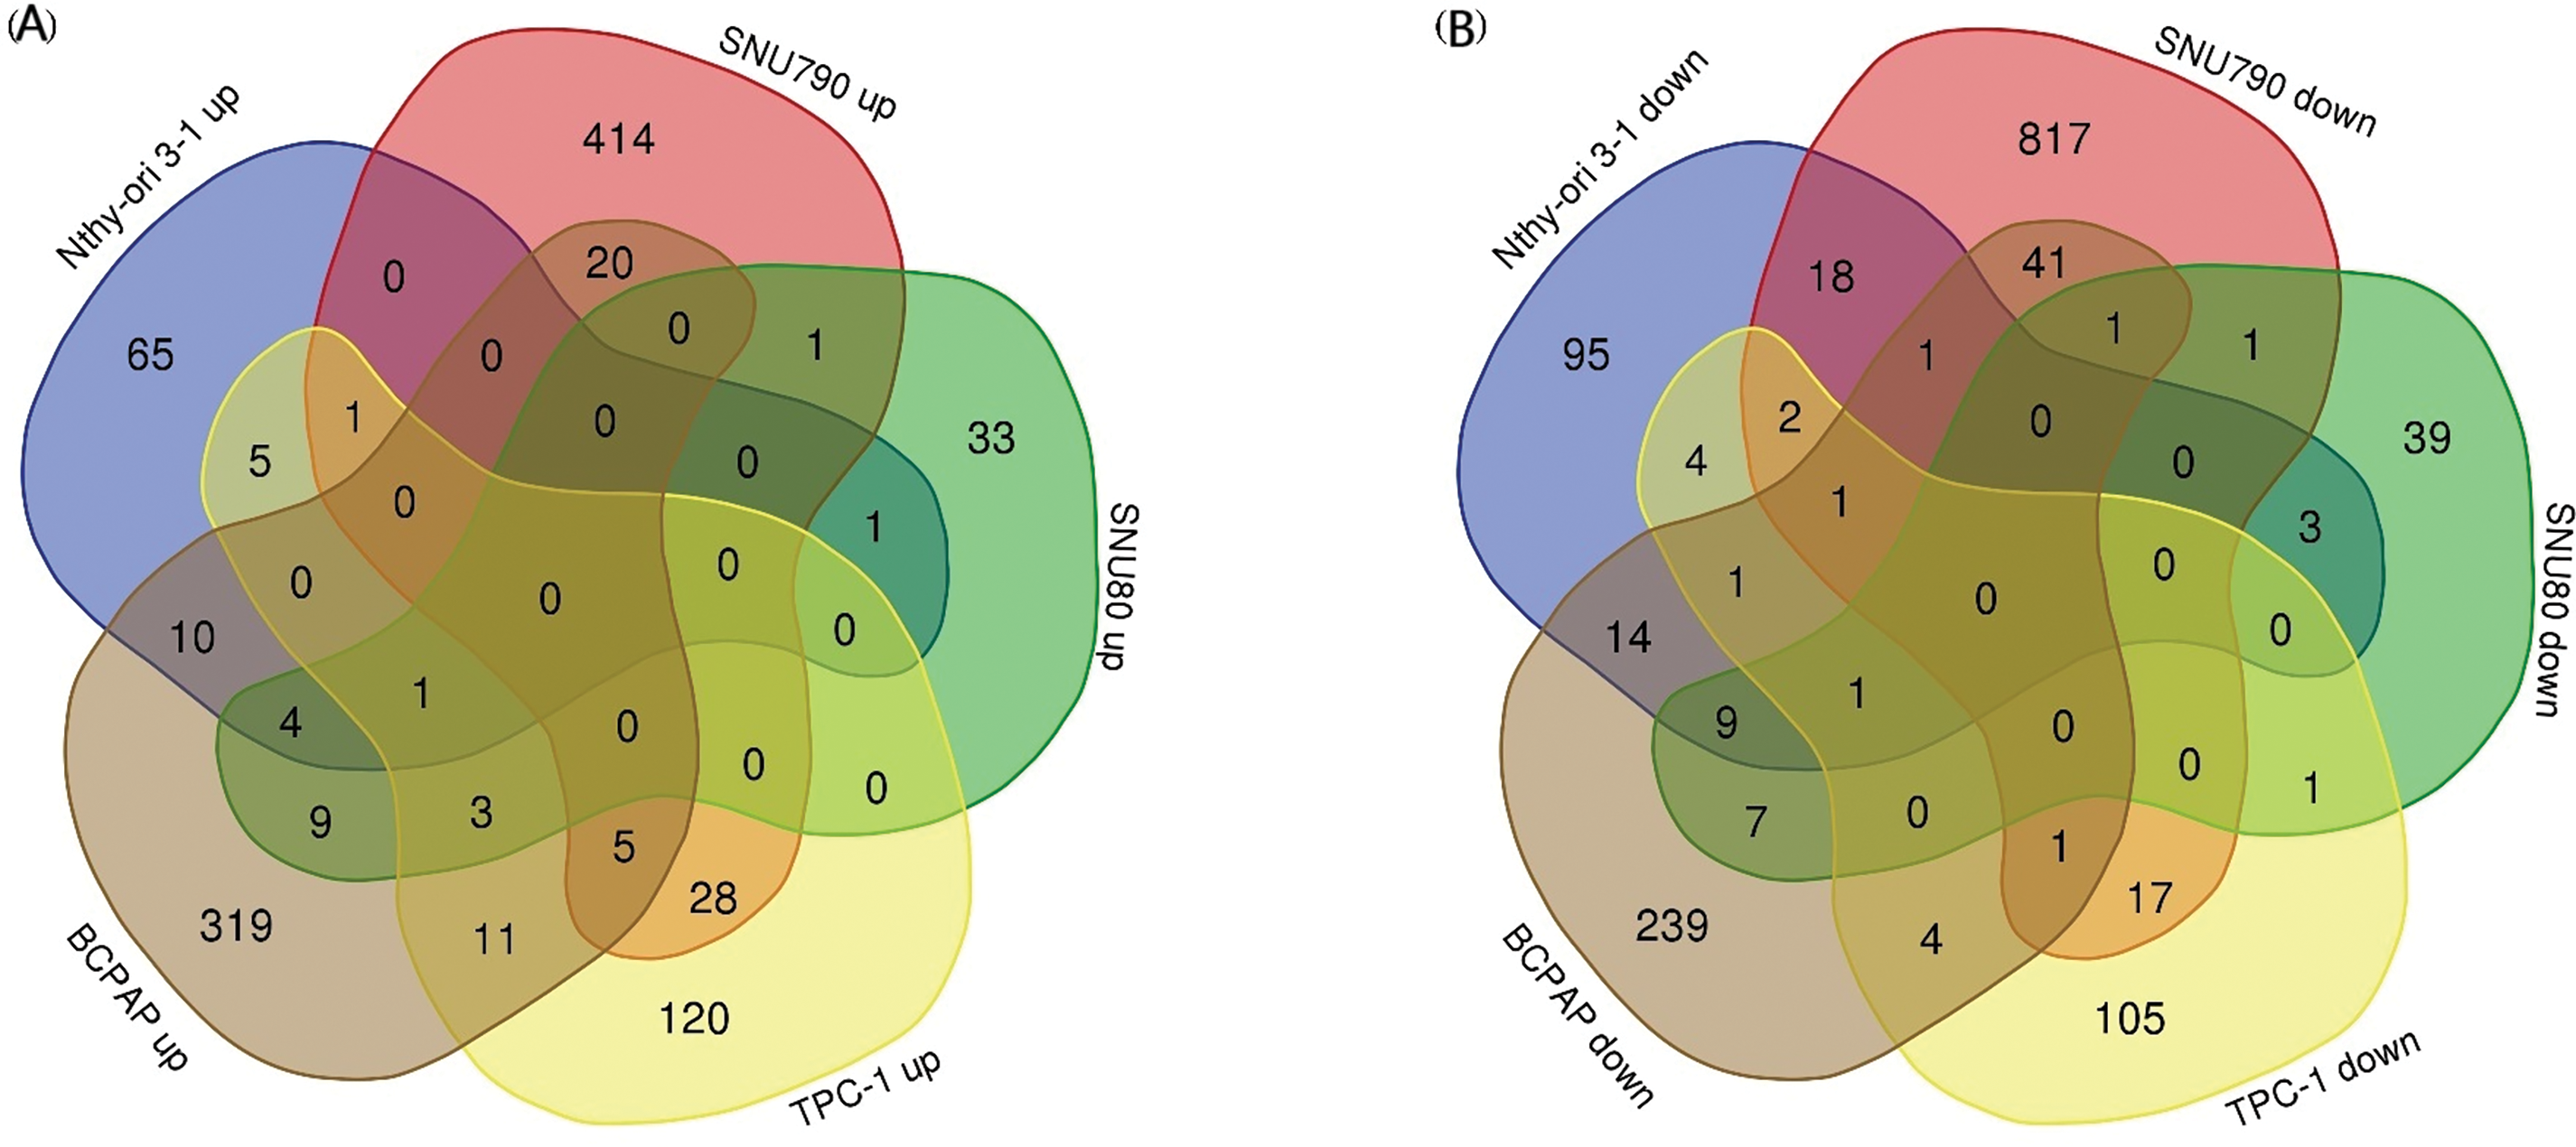
Figure 2: Common gene expression changes across five thyroid-related cell lines under simulated microgravity. (A) Venn diagram showing the common upregulation of differentially expressed genes (DEGs) across the five cell lines under microgravity. (B) Venn diagram showing the common downregulation of DEGs across the five cell lines under microgravity. The numbers within each section of the Venn diagrams represent the number of DEGs.
Functional Annotation Analysis
Figs. 3, 4 and A1 present the results of the KEGG pathway analysis. The DEGs commonly upregulated in SNU-80 and BCPAP cells cultured under simulated microgravity were associated with the Toll-like receptor (TLR) signaling pathway (KEGG:04620; SNU-80 -log10 (adjusted p-value (padj)) = 2.027, BCPAP -log10(padj) = 4.185, Fig. 3A). In addition, the downregulated DEGs in these cells were linked to the hypoxia-inducible factor (HIF)-1 signaling pathway (KEGG:04066; SNU-80 -log10(padj) = 3.702, BCPAP -log10(padj) = 3.318, Fig. 3B) and the glycolysis/gluconeogenesis pathway (KEGG:00010; SNU-80 -log10(padj) = 1.590, BCPAP -log10(padj) = 3.998). In the case of SNU-790 and TPC-1, no KEGG terms were commonly enriched. In TPC-1, however, the upregulated genes under microgravity were associated with the cell cycle pathway (KEGG:04110; -log10(padj) = 6.450). These upregulated DEGs were related to the S, G2, and M phases (Fig. 4).
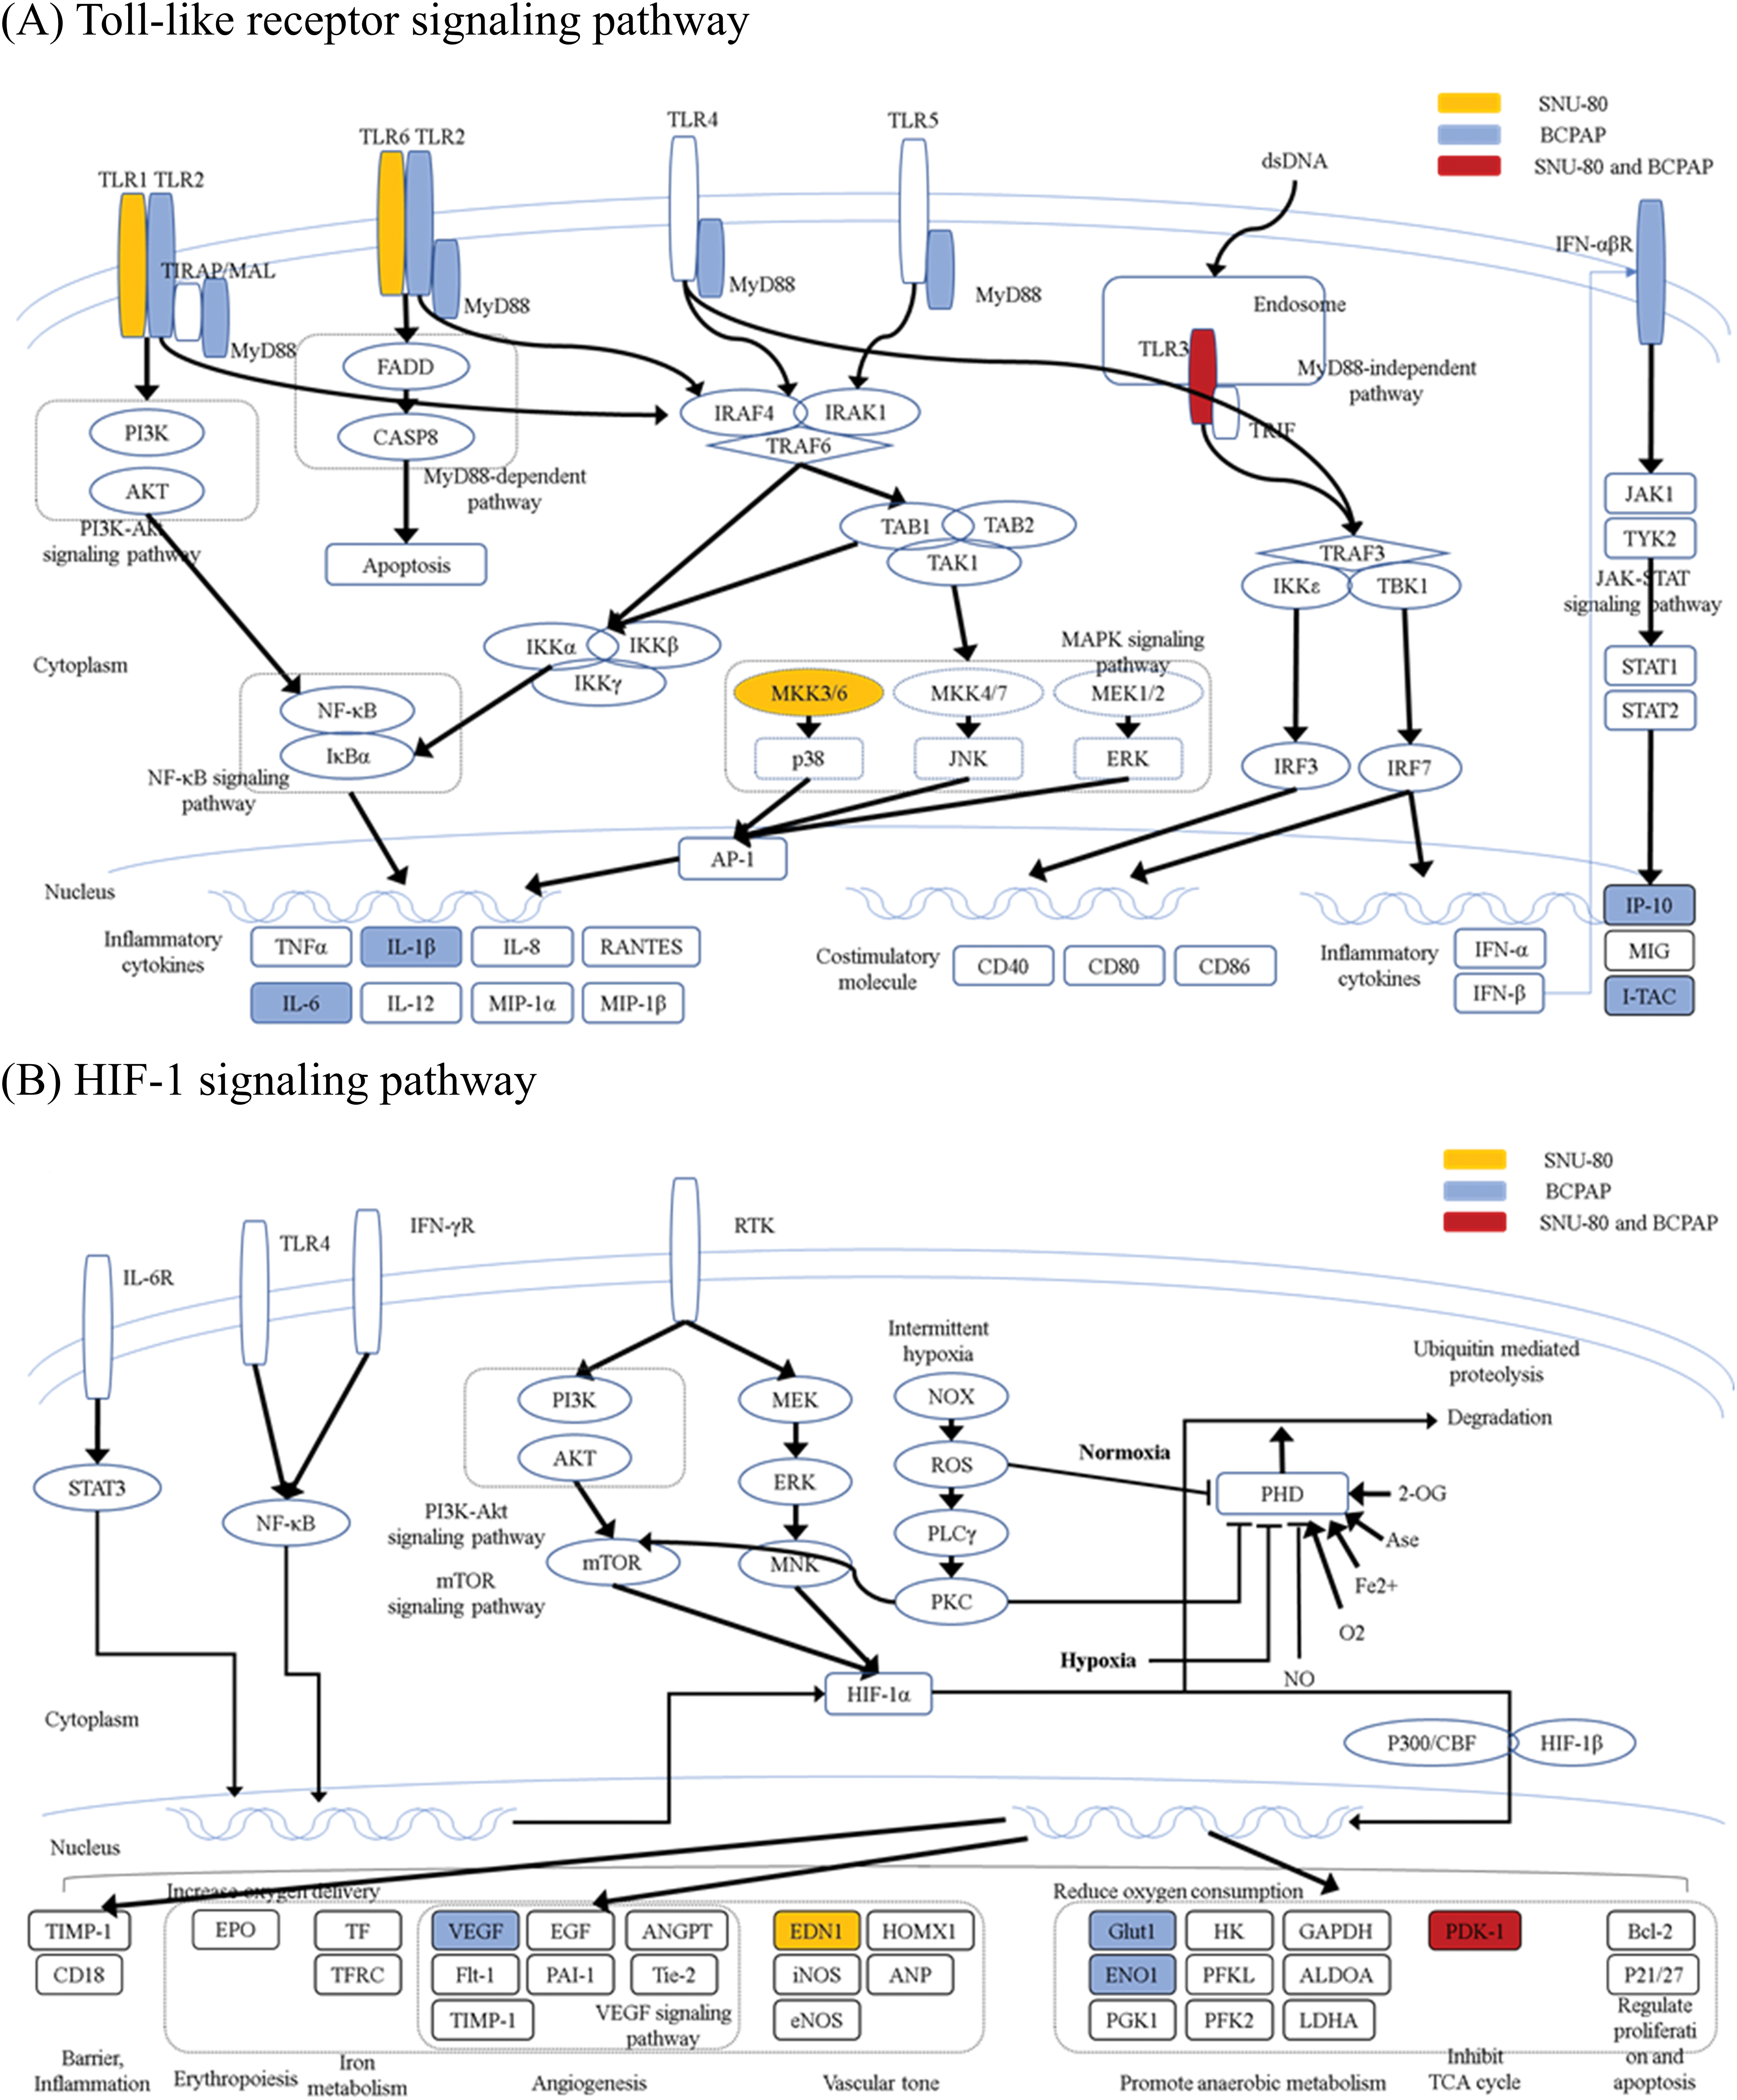
Figure 3: KEGG pathway enrichment analysis of differentially expressed genes in SNU-80 and BCPAP cells cultured under simulated microgravity compared to normal gravity. (A) KEGG enrichment analysis for upregulated DEGs in SNU-80 and BCPAP cell lines under microgravity. (B) KEGG enrichment analysis for downregulated DEGs in SNU-80 and BCPAP cell lines under microgravity.
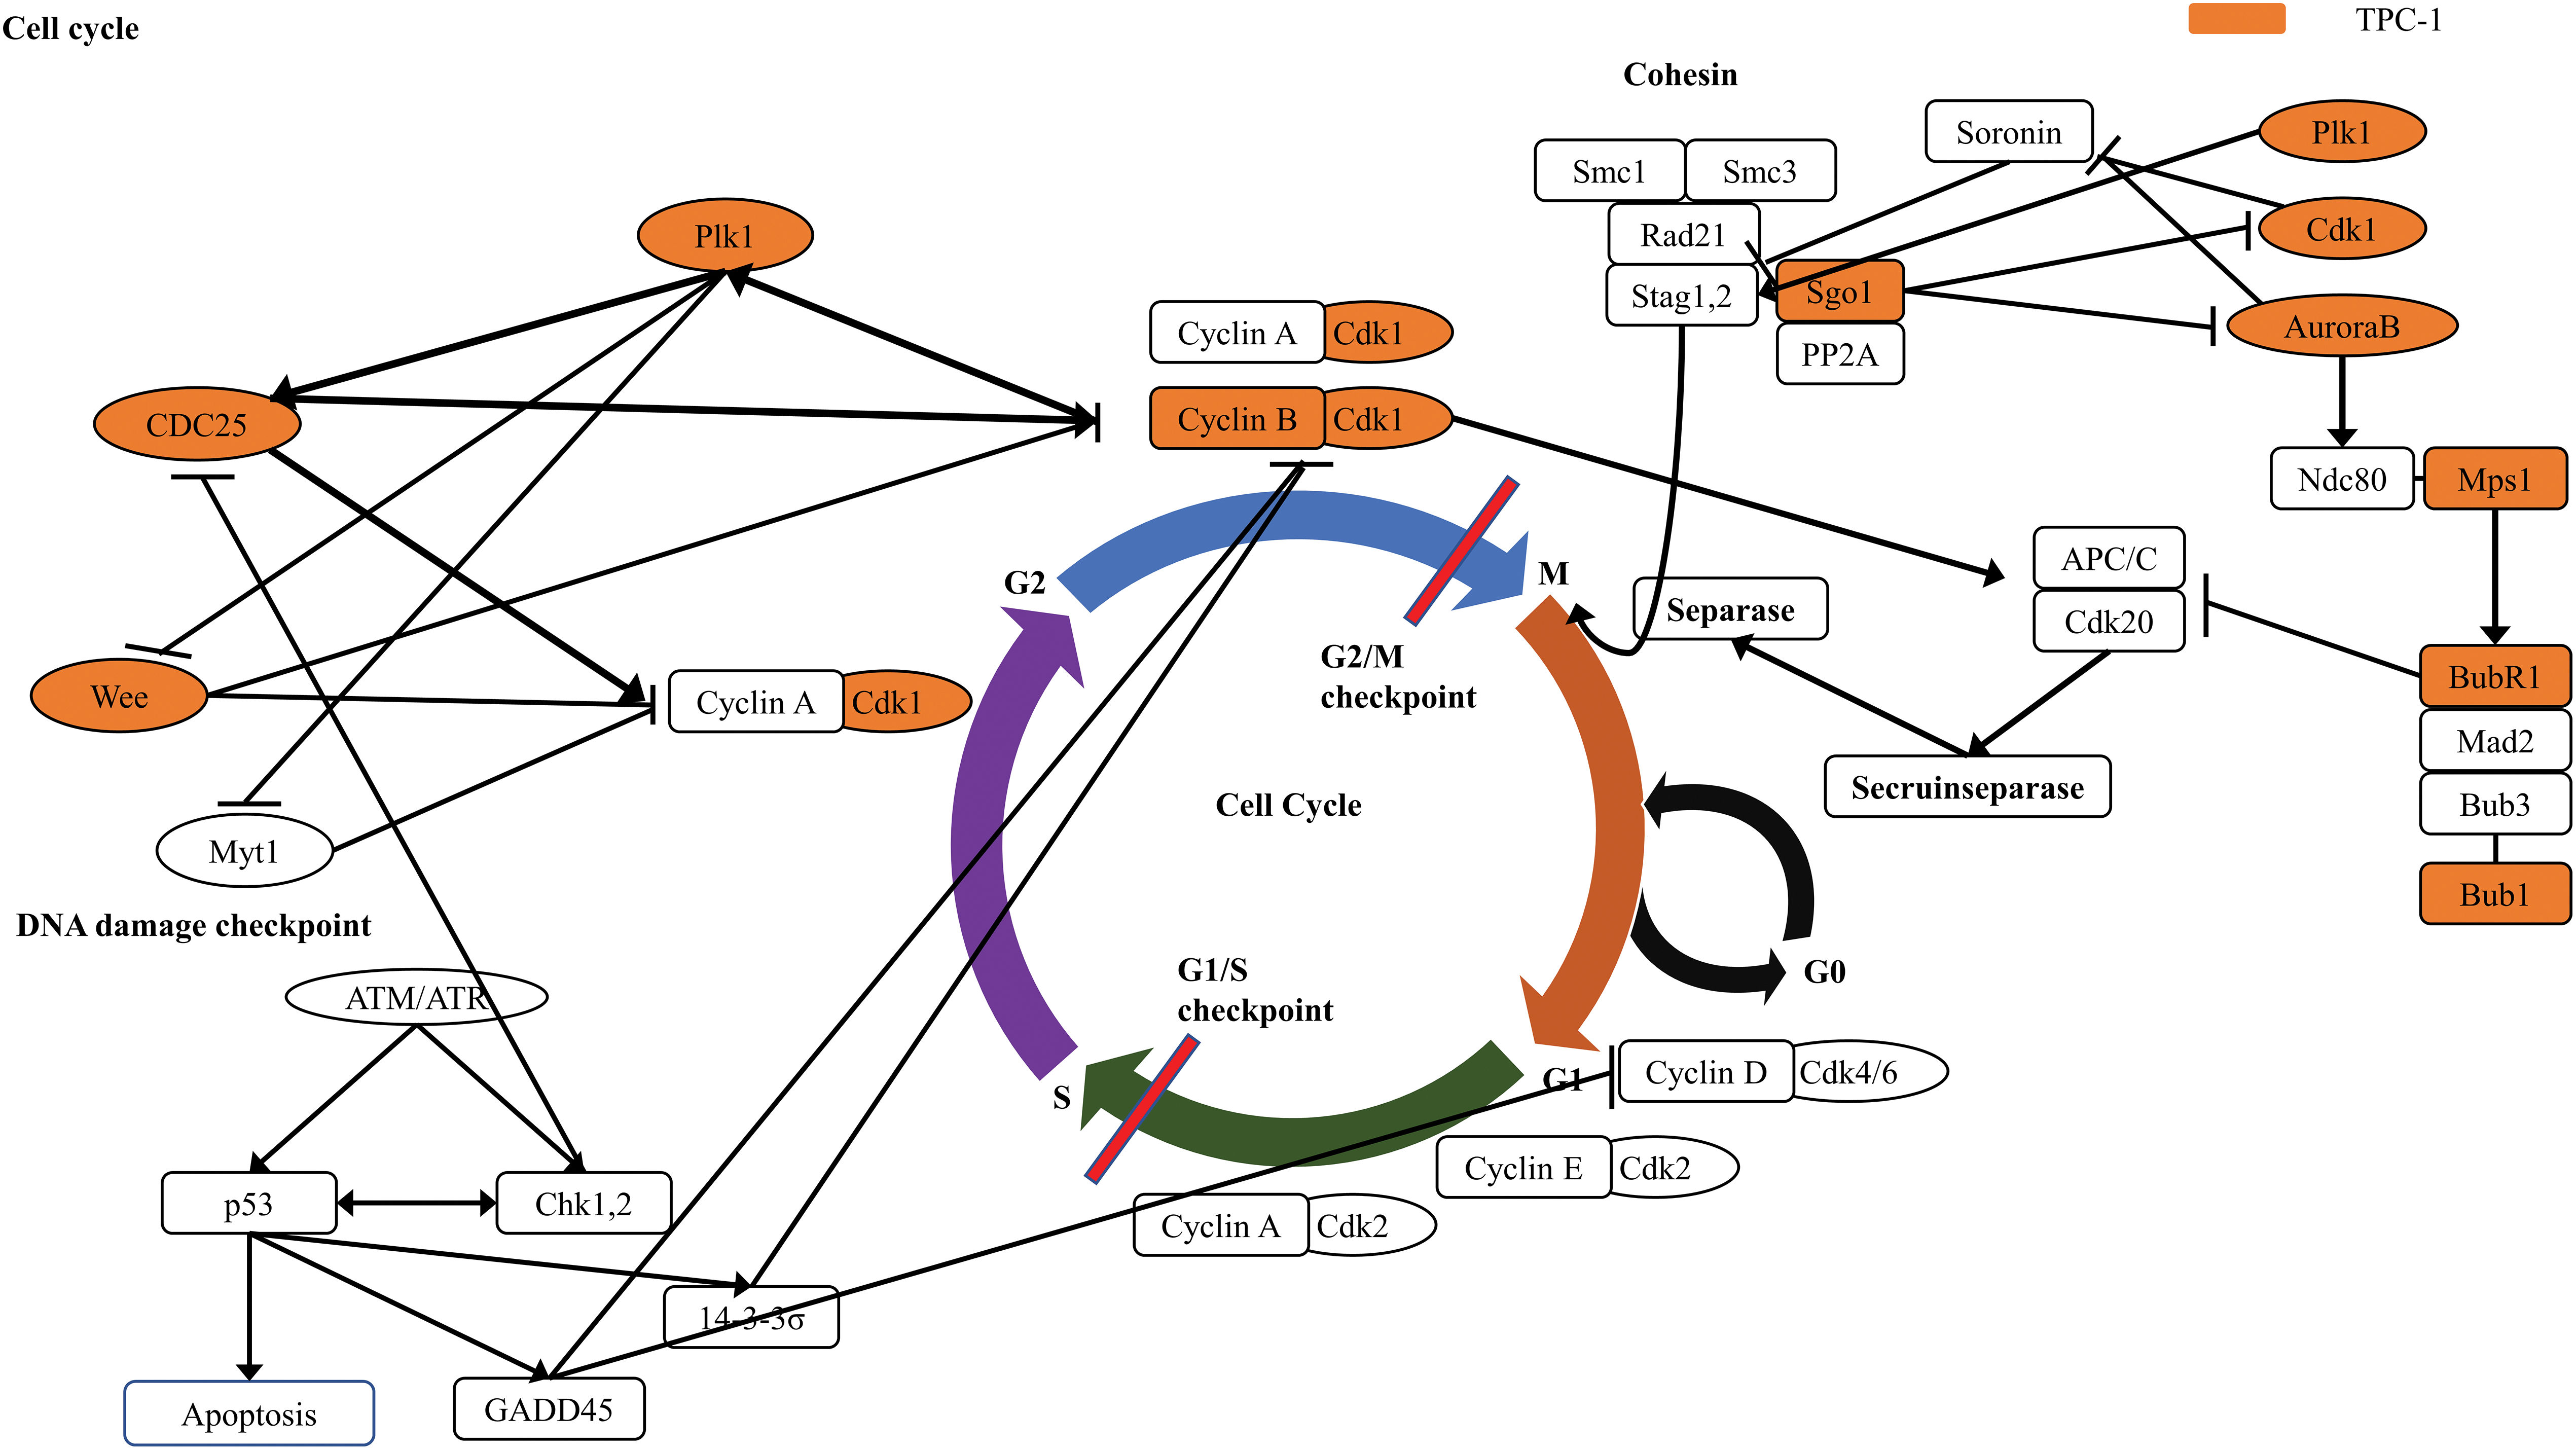
Figure 4: KEGG pathway enrichment analysis of upregulated differentially expressed genes in TPC-1 cells cultured under simulated microgravity compared to normal gravity.
Fig. 5 shows the GO enrichment analysis of upregulated DEGs in SNU-790 and TPC-1 cells cultured under simulated microgravity. In terms of molecular function, both cell lines showed enrichment in protein binding (GO:0005515, SNU-790 -log10(padj) = 2.608 and TPC-1 -log10(padj) = 2.744, Fig. 5A). Regarding biological processes, the upregulated genes were associated with mitotic nuclear division (GO:0140014, SNU-790, -log10(padj) = 4.573) and cell division (GO:0051301, TPC-1, -log10(padj) 7.922, Fig. 5B). In the cellular component category, these DEGs were related to the mitotic spindle (GO:0072686, SNU-790 -log10(padj) = 2.156) and spindle (GO:0005819, TPC-1 -log10(padj) = 6.368, Fig. 5C). For the non-PTC cell lines, the upregulated DEGs were linked primarily to molecular function related to Toll-like receptor 2 binding (GO:0035663, SNU-80, -log10(padj) = 2.338) and the cytokine activity (GO:0005125, BCPAP, -log10(padj) = 7.254; Fig. 5A). In terms of biological processes, these DEGs were enriched in pathways associated with the cellular response to external stimuli, including the cellular response to external stimuli (response to external stimulus, GO:0009605, Nthy-ori 3-1 -log10(padj) = 4.398; the cellular response to exogenous dsRNA, GO:0071360, SNU-80, -log10(padj) = 2.455, and the response to other organisms, GO:0051707, BCPAP -log10(padj) = 47.777; Fig. 5B). In the cellular component category, no significant enrichment was observed in SNU-80, whereas in BCPAP, upregulated DEGs were significantly associated with extracellular region (GO:0005576, -log10(padj) = 5.675), cell surface (GO:0009986, -log10(padj) = 3.450), and MHC class I protein complex (GO:0042612, -log10(padj) = 3.068; Fig. 5C).
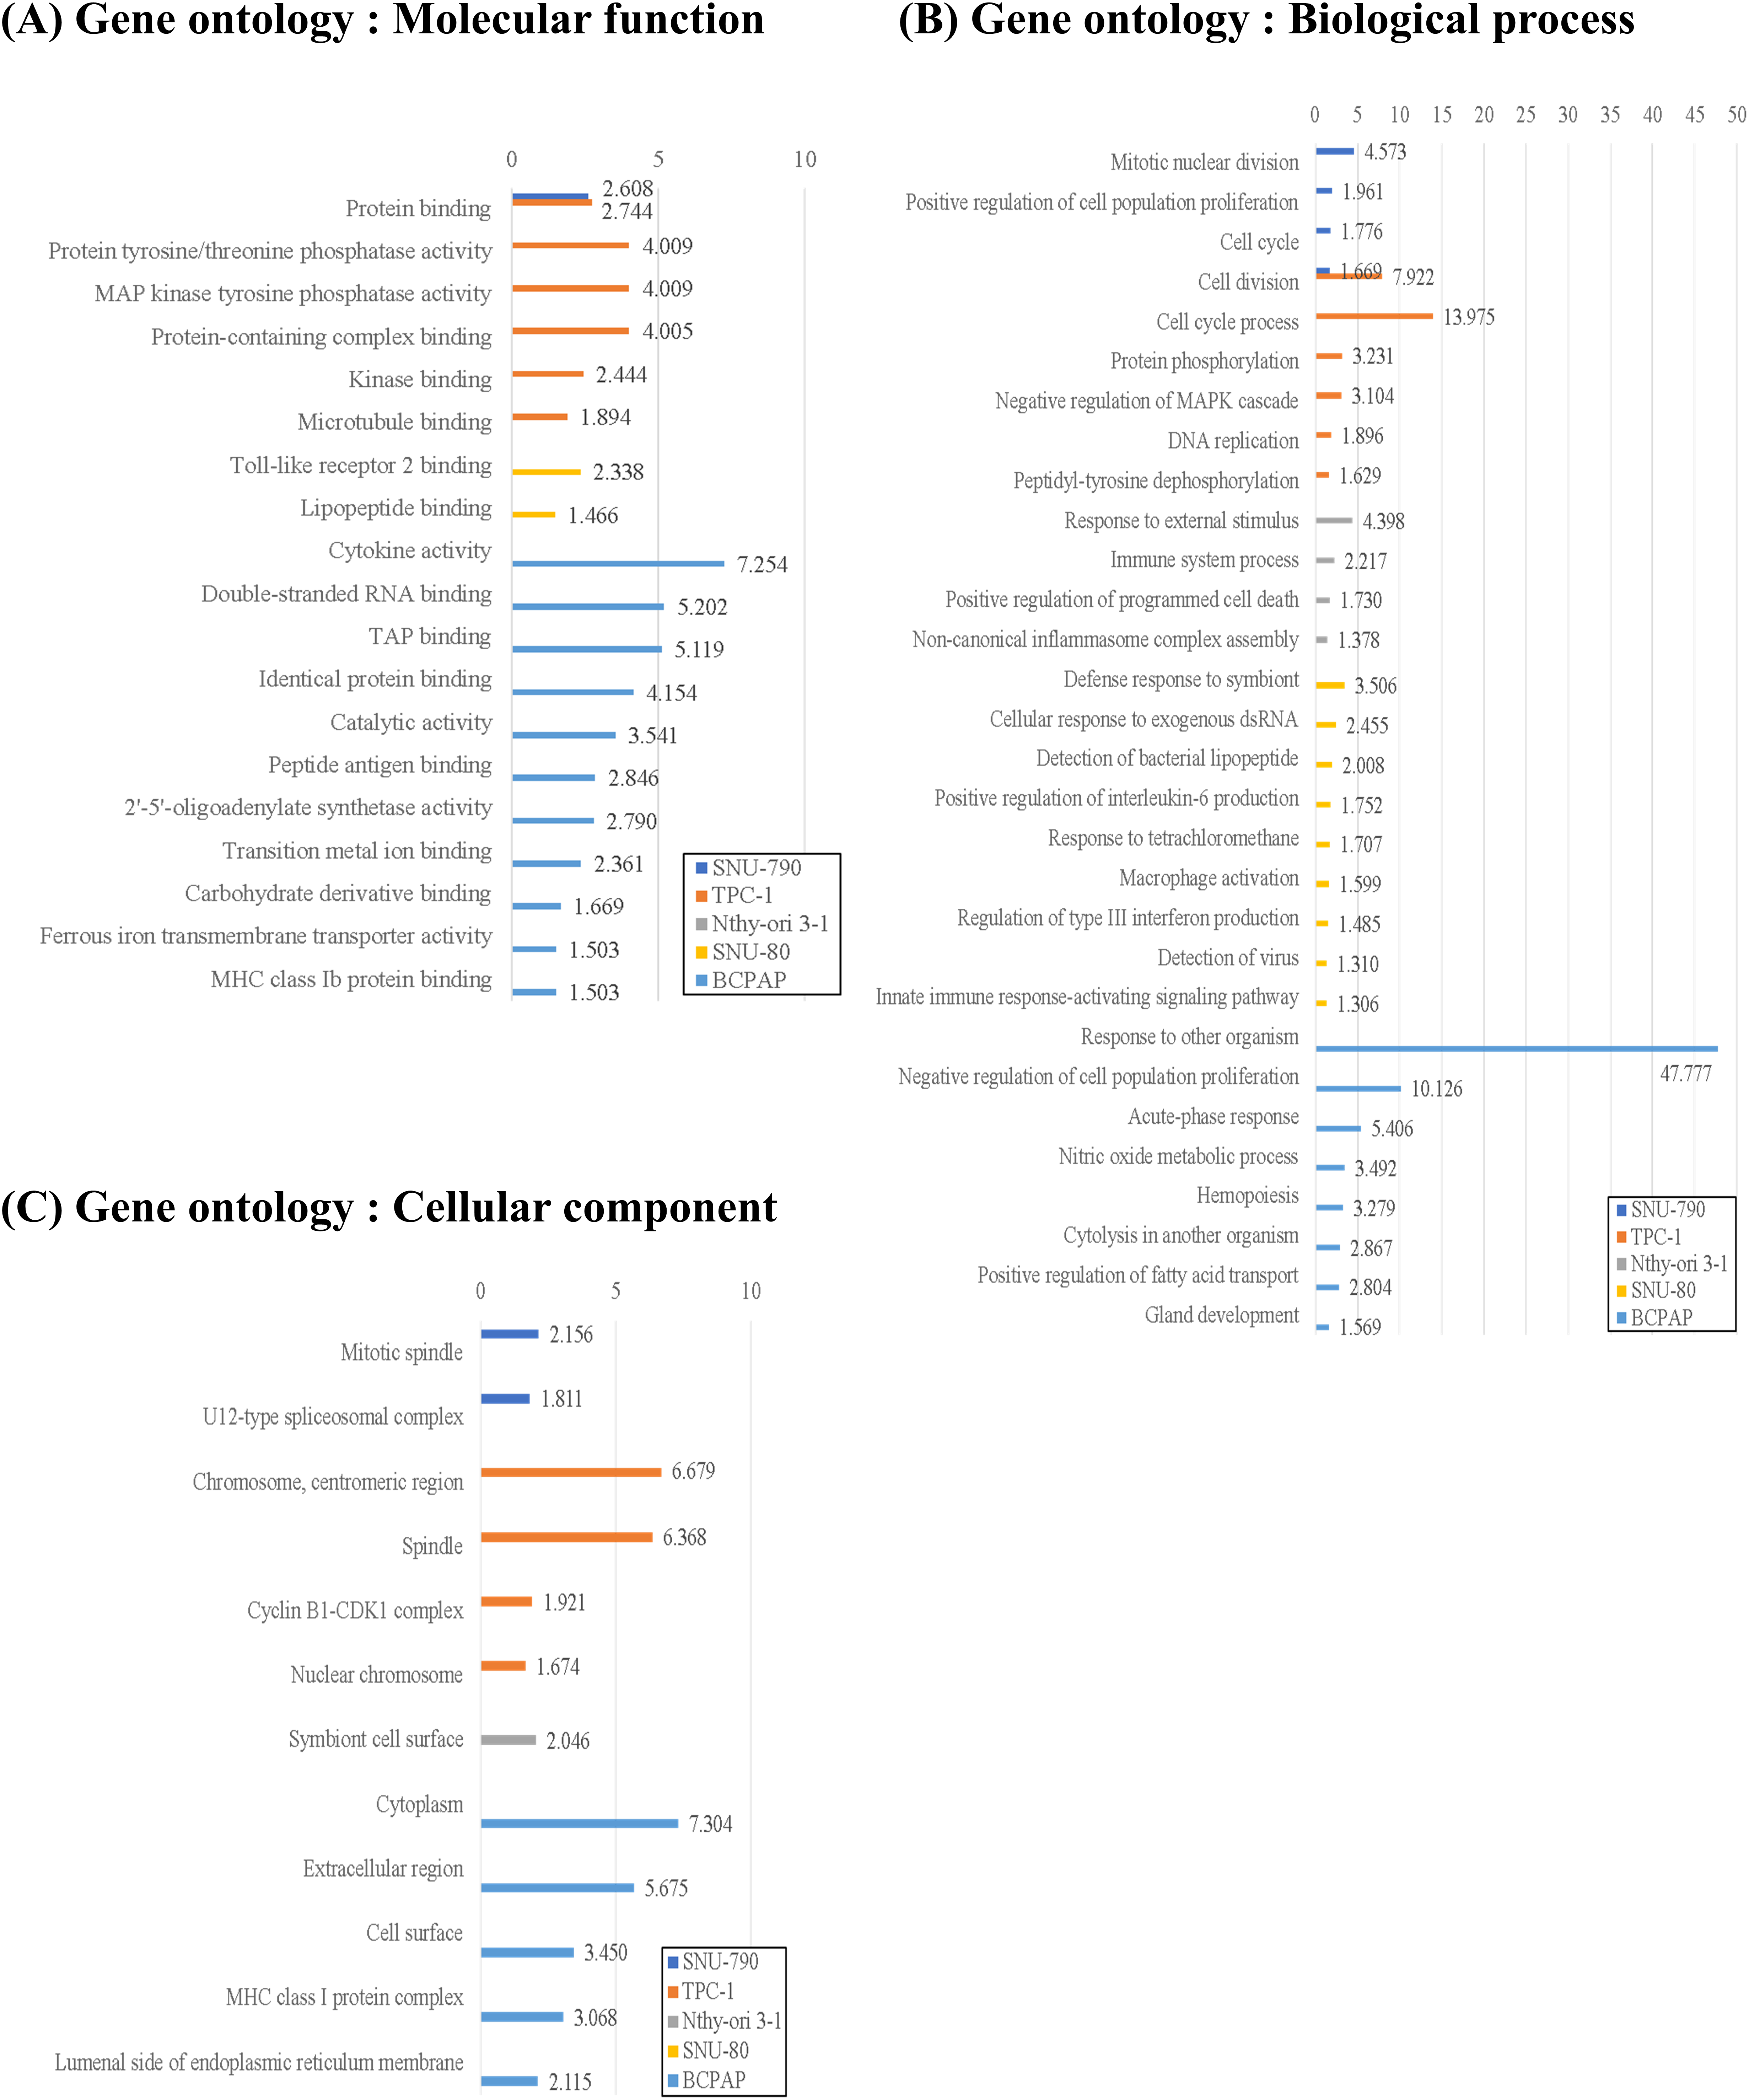
Figure 5: Gene Ontology (GO) enrichment analysis of upregulated differentially expressed genes (DEGs) in thyroid-related cell lines cultured under simulated microgravity compared to normal gravity. (A) GO enrichment analysis for upregulated DEGs in terms of the molecular function. (B) GO enrichment analysis for upregulated DEGs in terms of the biological process. (C) GO enrichment analysis for upregulated DEGs in terms of the cellular components. All results are presented as the negative log10 of the adjusted p-value.
The downregulated DEGs under microgravity were associated with molecular functions such as DNA-binding transcription activator activity, RNA polymerase II–specific (GO:0001228, BCPAP, log10(padj) = 1.485; Fig. 6A). The downregulated DEGs in non-PTC cells under microgravity were related to the responses to hypoxia (response to hypoxia, GO:0001666, Nthy-ori 3-1, -log10(padj) = 6.573; SNU-80, -log10(padj) = 2.575; and the cellular response to hypoxia, GO:0071456, BCPAP, -log10(padj) = 5.548; Fig. 6B). Furthermore, downregulated DEGs in both BCPAP and SNU-80 were significantly associated with the extracellular space (GO:0005615, SNU-80, -log10(padj) = 1.384; and BCPAP, -log10(padj) = 2.894; Fig. 6C).
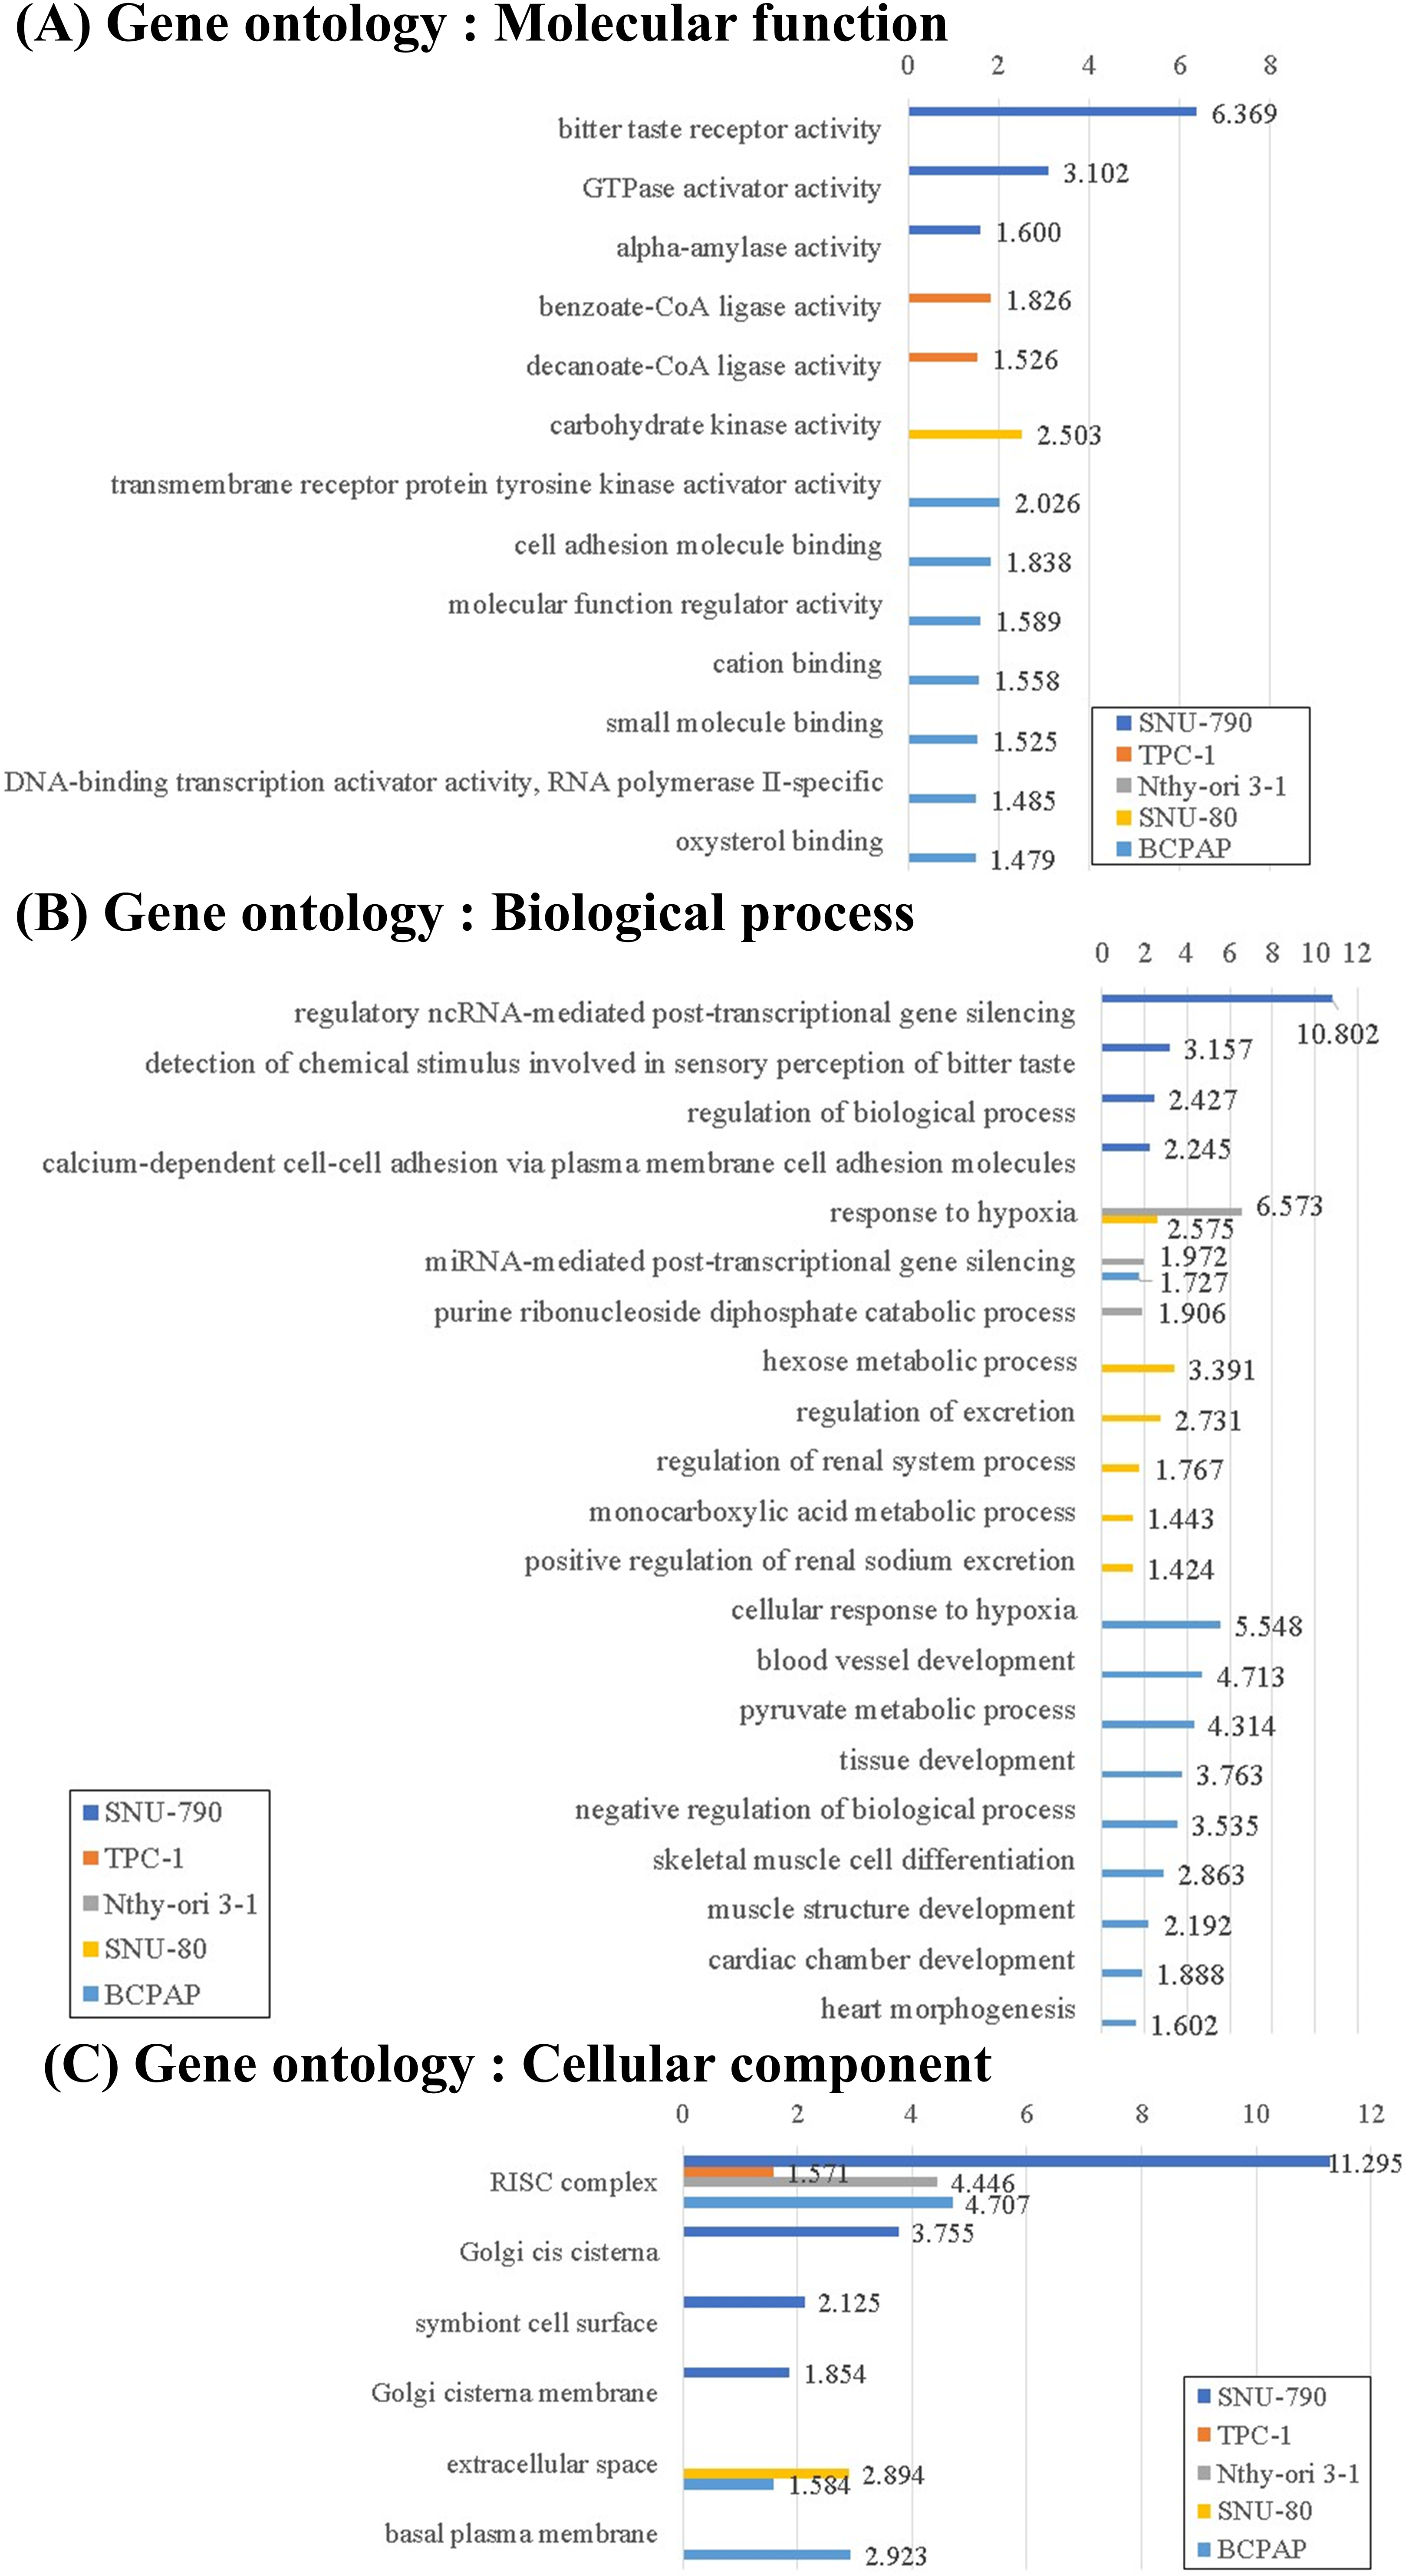
Figure 6: Gene Ontology (GO) enrichment analysis of downregulated differentially expressed genes (DEGs) in thyroid-related cell lines cultured under simulated microgravity compared to normal gravity. (A) GO enrichment analysis for downregulated DEGs in terms of the molecular function. (B) GO enrichment analysis for downregulated DEGs in terms of the biological process. (C) GO enrichment analysis for downregulated DEGs in terms of the cellular components. All results are presented as the negative log10 of the adjusted p-value.
Fig. 7 presents the GSEA results for the five different cell types. No gene sets were commonly enriched across all five cell lines. In SNU-790 cells, gene sets related to the mitotic spindle (normalized enrichment score (NES) = 1.769, p = 0.008, FDR = 0.094, Fig. 7A) and G2-M checkpoint (NES = 1.739, p = 0.033, FDR = 0.086, Fig. 7B) showed a positive correlation with the microgravity environment. For TPC-1, the G2-M checkpoint (NES = 2.145, p < 0.001, FDR = 0.005, Fig. 7C) and mitotic spindle (NES = 1.532, p = 0.058, FDR = 0.248, Fig. 7D). Gene sets were also positively correlated with microgravity. In SNU-80 and BCPAP cells, the gene sets related to hypoxia (NES = −1.954, p = 0.009, FDR = 0.018, and NES = −2.497, p < 0.001, FDR < 0.001, respectively; Figs. 7E, 7F) and glycolysis (NES = −1.472, p = 0.069, FDR = 0.113, and NES = −2.649, p < 0.001, FDR < 0.001, respectively; Fig. 7G,H) were negatively correlated with microgravity. In addition, the interferon (IFN)-γ response gene sets showed a positive correlation with microgravity in Nthy-ori 3-1 (NES = 1.897, p = 0.014, FDR = 0.035, Fig. 7I), SNU-80 (NES = 1.389, p = 0.121, FDR = 0.122, Fig. 7J), and BCPAP cells (NES = 3.014, p < 0.001, FDR < 0.001, Fig. 7K).
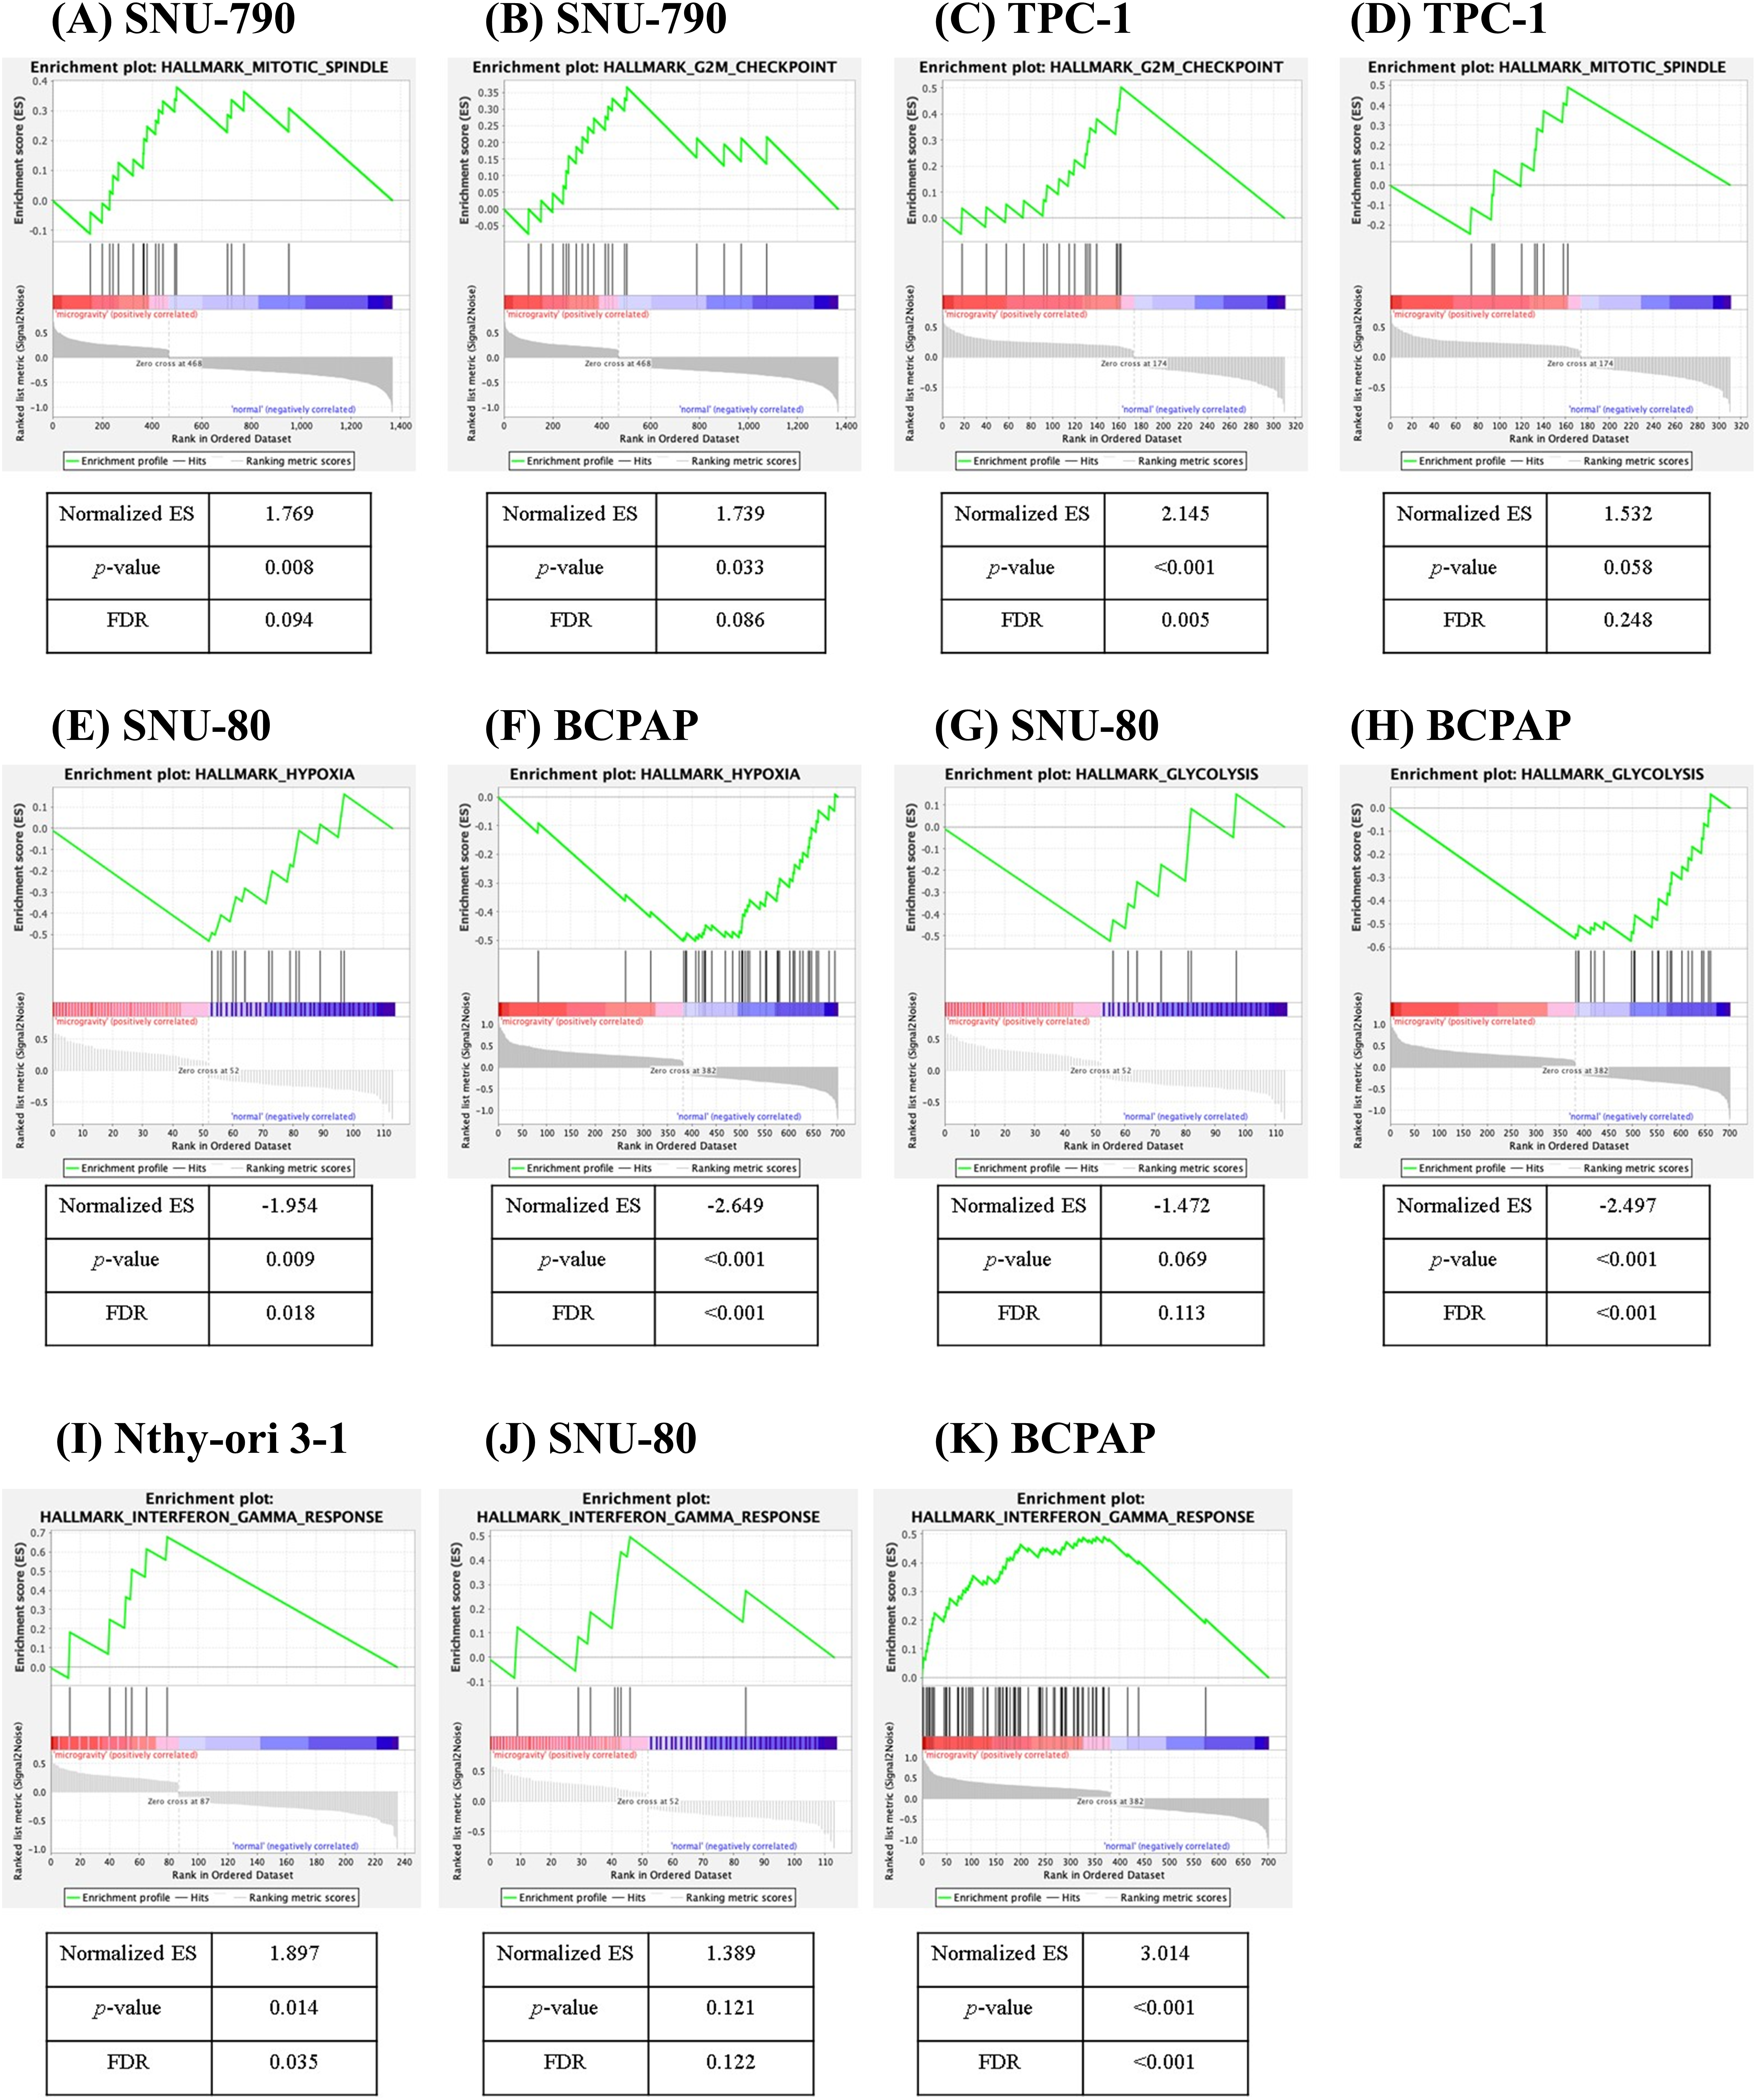
Figure 7: Gene set enrichment analysis of differentially expressed genes in thyroid-related cell lines cultured under simulated microgravity compared to normal gravity. (A, B) SNU-790, (C, D) TPC-1, (E) SNU-80, (F) BCPAP, (G) SNU-80, (H) BCPAP, (I) Nthy-ori 3-1, (J) SNU-80, and (K) BCPAP. ES denotes the enrichment score, and FDR refers to the false discovery rate.
Transwell migration and invasion assay
Fig. 8 and 9 present the results of the transwell migration and invasion assays. In the SNU-790 cell line, migration was significantly increased under microgravity at a seeding density of 3 × 10⁴ cells (microgravity: 660.0 ± 25.1 vs. normal gravity: 509.0 ± 32.1; p < 0.05). Invasion was also significantly higher under microgravity at 2 × 10⁴ cells (108.0 ± 9.6) compared to normal gravity (67.5 ± 15.5; p < 0.05). At 1 × 10⁴ and 2 × 10⁴ cells in the migration assay (125.0 ± 15.2 vs. 123.5 ± 13.2; 128.7 ± 16.0 vs. 100.6 ± 14.4) and at 1 × 10⁴ and 3 × 10⁴ cells in the invasion assay (49.0 ± 8.4 vs. 47.7 ± 11.8; 139.0 ± 18.3 vs. 125.9 ± 24.4), no statistically significant differences were observed (Fig. 9A).
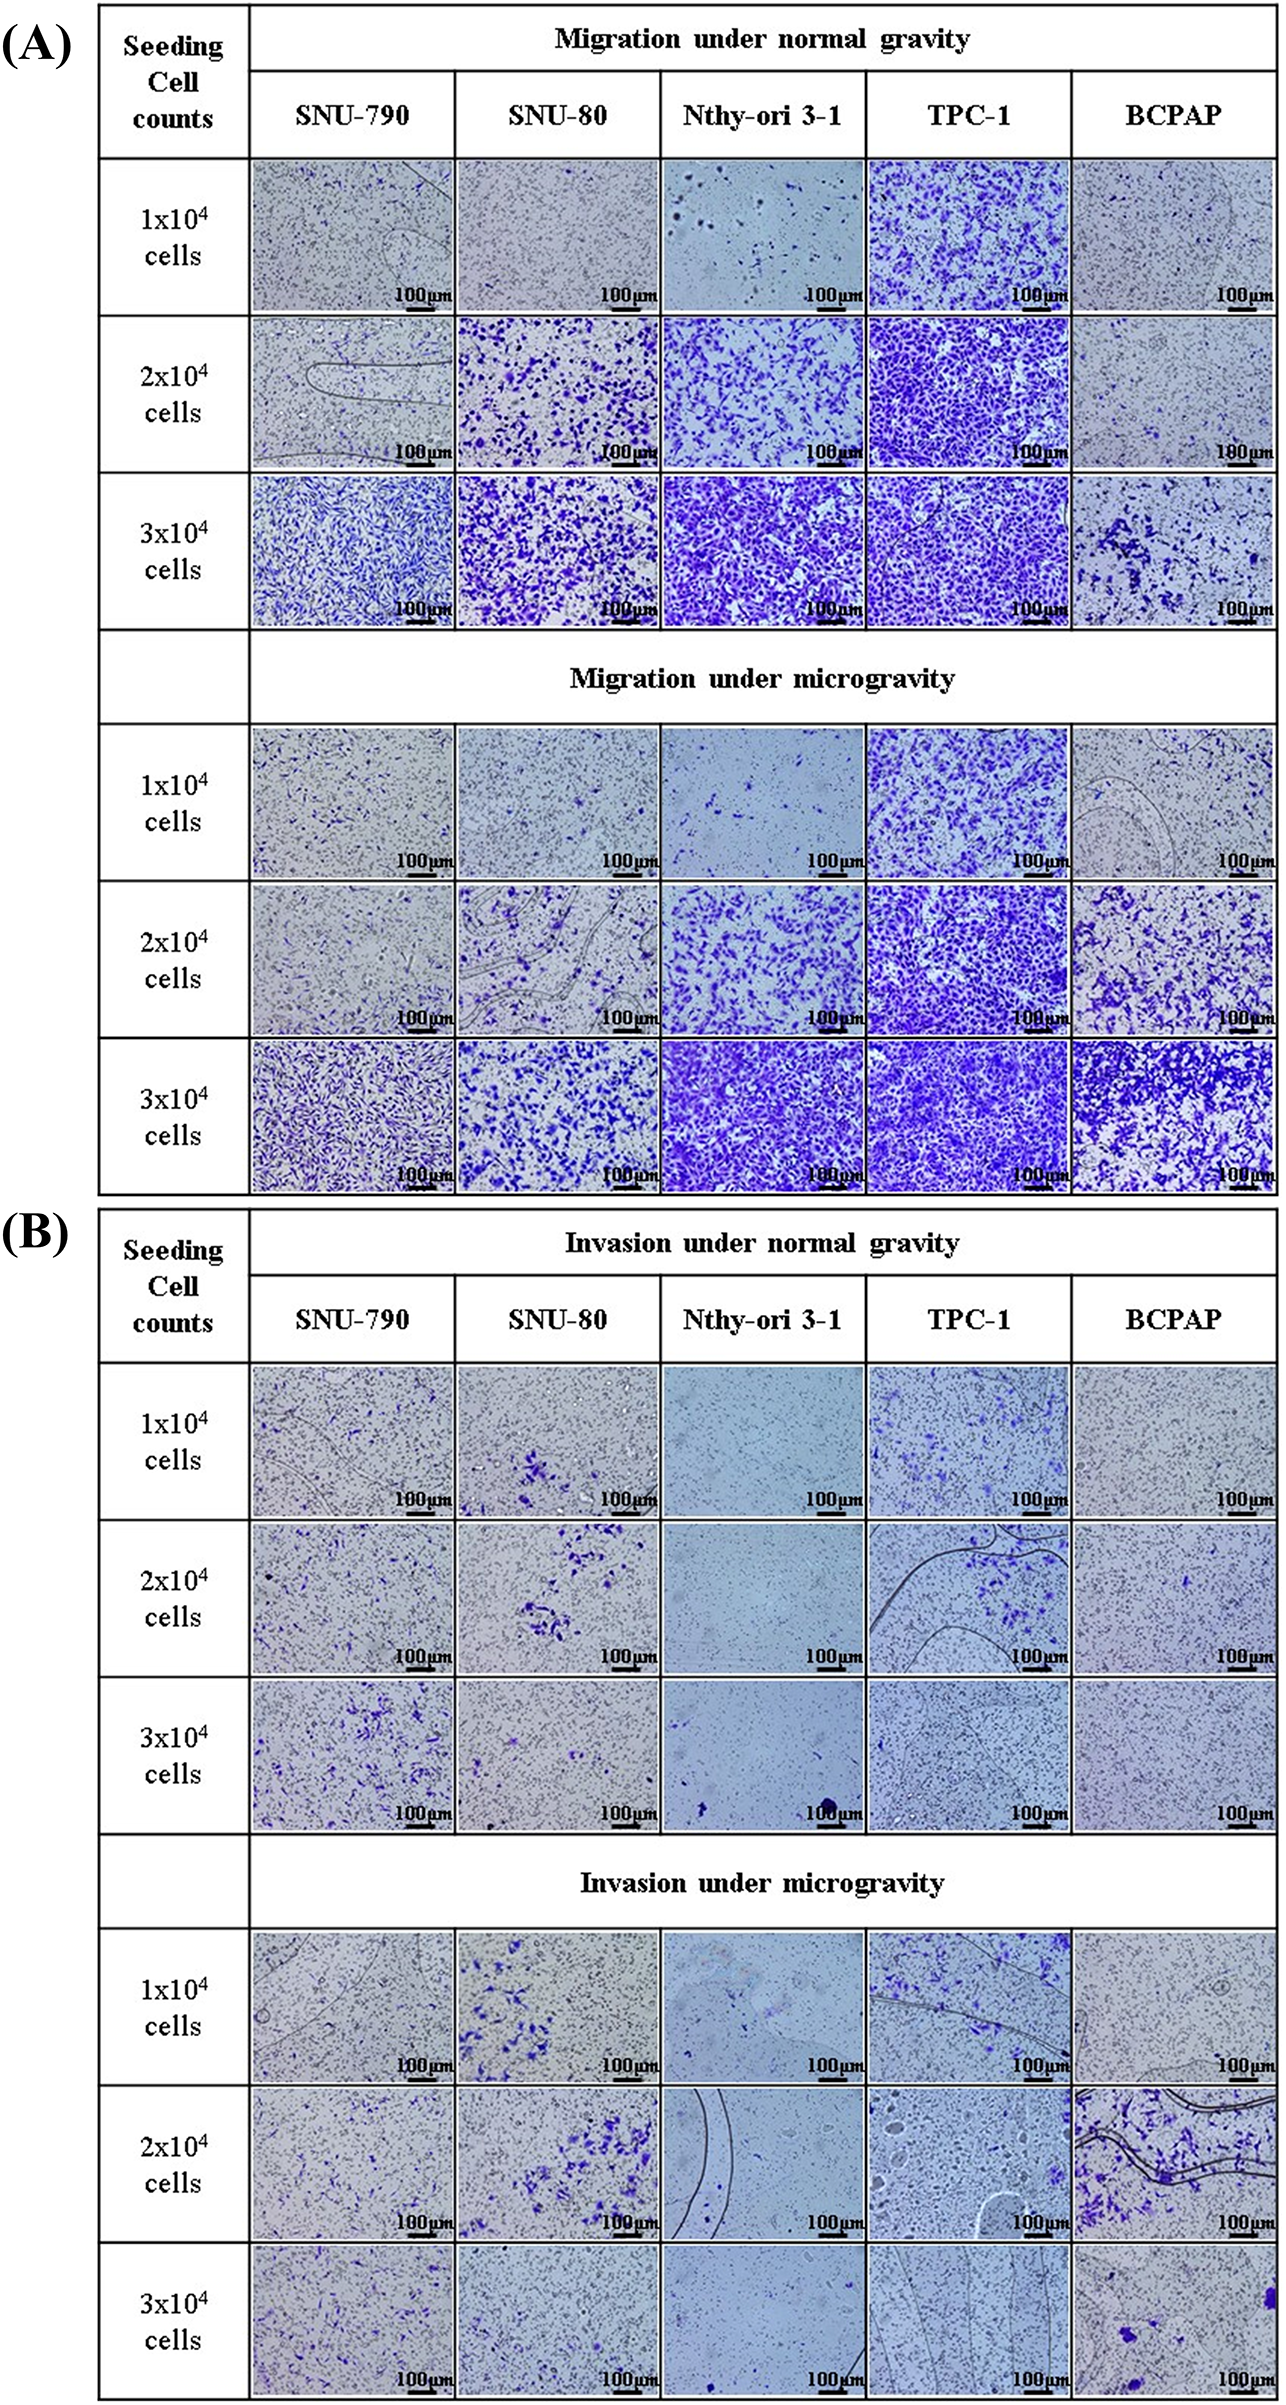
Figure 8: Microscopic images of transwell migration and invasion assays of thyroid-related cell lines under simulated microgravity and normal gravity conditions. After a five-day cultivation period, five different cell lines were seeded at densities of 1 × 10⁴, 2 × 10⁴, and 3 × 10⁴ cells per well. (A) Representative images of the transwell migration assay for each of the five cell lines (SNU-790, SNU-80, Nthy-ori 3-1, TPC-1, and BCPAP) under microgravity and normal gravity conditions at varying seeding densities. (B) Representative images of the transwell invasion assay under the same conditions as in (A), using Matrigel-coated inserts to assess invasive capacity. All images were captured at ×10 magnification. Scale bars represent 100 μm.
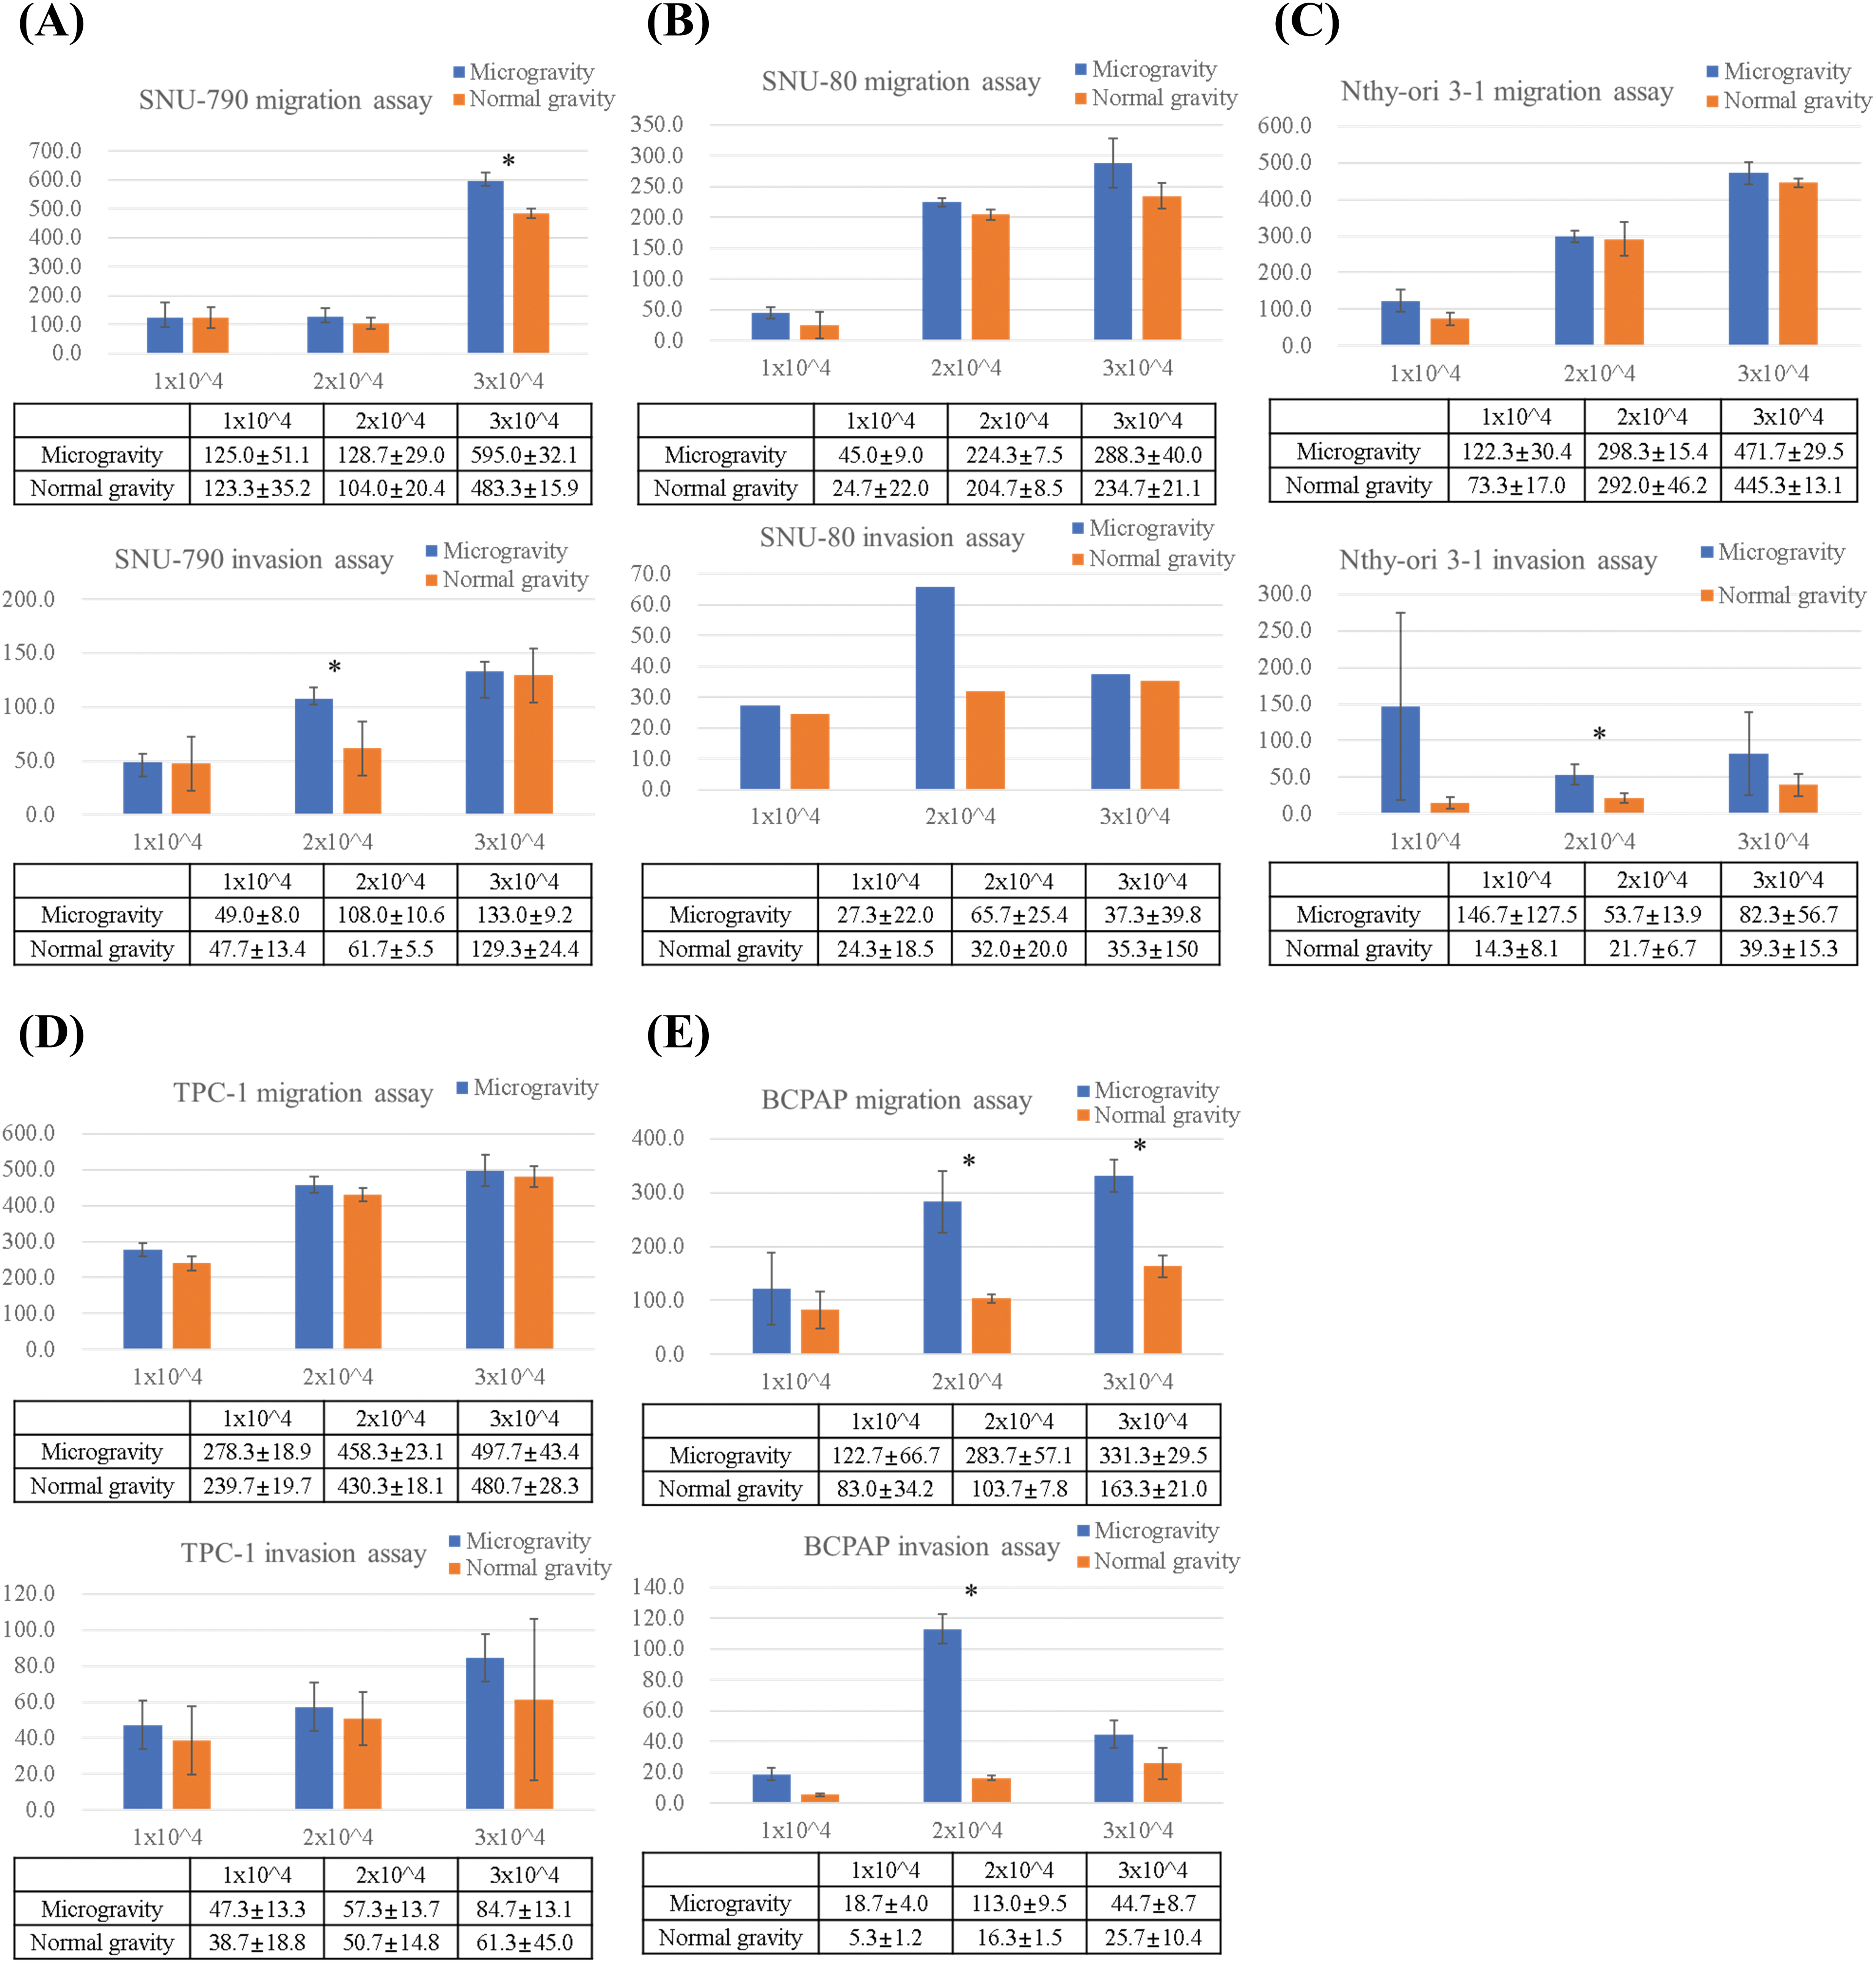
Figure 9: Comparison of migrated and invaded cell counts by transwell migration and invasion assays of thyroid-related cell lines under simulated microgravity and normal gravity conditions. After a five-day cultivation period, five different cell lines were seeded at densities of 1 × 10⁴, 2 × 10⁴, and 3 × 10⁴ cells per well. Quantitative comparative analysis of migration and invasion assays across five different thyroid-related cell lines: (A) SNU-790, (B) SNU-80, (C) Nthy-ori 3-1, (D) TPC-1, and (E) BCPAP. Y-axis indicates the number of cells counted. * indicate statistically significant differences with a p < 0.05.
In SNU-80 cells, migration under microgravity was 45.0 ± 9.2, 220.3 ± 19.5, and 288.1 ± 28.7 at 1 × 10⁴, 2 × 10⁴, and 3 × 10⁴ cells, respectively, compared to 28.7 ± 8.4, 204.7 ± 28.5, and 224.4 ± 25.3 under normal gravity. Invasion values were 27.3 ± 5.1, 65.7 ± 8.1, and 36.5 ± 7.2 under microgravity versus 23.6 ± 4.6, 30.5 ± 9.8, and 33.2 ± 6.1 under normal gravity, respectively. None of these differences were statistically significant (Fig. 9B).
In Nthy-ori 3-1 cells, invasion at 2 × 10⁴ cells was significantly increased under microgravity (83.1 ± 9.2) compared to normal gravity (32.8 ± 5.7) (p < 0.05). Migration values at 1 × 10⁴, 2 × 10⁴, and 3 × 10⁴ cells were 122.3 ± 9.5, 286.1 ± 14.7, and 471.7 ± 29.5 under microgravity, versus 86.7 ± 8.4, 268.1 ± 17.2, and 460.3 ± 27.4 under normal gravity. Invasion at 1 × 10⁴ and 3 × 10⁴ was 145.7 ± 98.5 and 73.6 ± 12.3 under microgravity, compared to 18.7 ± 5.2 and 30.9 ± 15.3 under normal gravity. These differences were not statistically significant (Fig. 9C).
For TPC-1 cells, migration under microgravity was 279.7 ± 18.3, 459.8 ± 20.4, and 509.2 ± 21.5 at 1 × 10⁴, 2 × 10⁴, and 3 × 10⁴ cells, respectively, compared to 239.9 ± 17.2, 448.3 ± 22.4, and 487.6 ± 20.8 under normal gravity. Invasion values were 43.7 ± 10.1, 51.3 ± 12.2, and 84.3 ± 13.5 under microgravity versus 33.5 ± 12.8, 47.8 ± 10.4, and 61.7 ± 18.6 under normal gravity. No statistically significant differences were observed (Fig. 9D).
In the BCPAP cell line, a significant increase in migration was observed under microgravity at both 2 × 10⁴ and 3 × 10⁴ cells (2 × 10⁴: 283.5 ± 7.1 vs. 179.0 ± 9.5; 3 × 10⁴: 331.3 ± 29.5 vs. 174.3 ± 8.6; p < 0.05). At 1 × 10⁴ cells, migration was 122.7 ± 16.4 under microgravity and 80.3 ± 14.2 under normal gravity; this difference was not statistically significant. Invasion was also significantly higher under microgravity at 2 × 10⁴ cells (113.9 ± 5.1 vs. 63.0 ± 4.3) (p < 0.05). At 1 × 10⁴ and 3 × 10⁴ cells, invasion values were 18.7 ± 4.2 and 45.7 ± 8.7 under microgravity, and 13.6 ± 3.1 and 25.7 ± 10.4 under normal gravity, respectively, with no statistically significant differences (Fig. 9E).
As space exploration advances, it is essential to understand how microgravity affects radiosensitive organs like the thyroid. While previous studies have explored thyroid cancer cell behavior in microgravity, most focused on a single cell line and lacked functional analysis. To address this, we investigated five thyroid-related cell lines—including those from Korean populations and PTC—and assessed both gene expression and cell aggressiveness using transcriptomic profiling and transwell migration and invasion assays under simulated microgravity. Our findings revealed distinct gene expression patterns when five different thyroid-related cell lines were cultured in microgravity. In the present study, the genes associated with the cell cycle (SNU-790 and TPC-1) were upregulated, and the genes related to the HIF-1 signaling pathway (SNU-80 and BCPAP) were downregulated. The upregulated genes were linked to the innate immune system (SNU-80, BCPAP, and Nthy-ori 3-1). To the best of the authors’ knowledge, this is the first study to investigate the properties of five different thyroid cell lines in a microgravity environment, providing a comprehensive perspective on how simulated microgravity impacts thyroid cells.
This study found no common DEG changes among the five thyroid cell lines. Notably, the ATC and PDTC cells exhibited DEG expression patterns similar to those of normal thyrocytes, while the PTC cells displayed distinct characteristics. The ATC and PDTC cells have poorly differentiated features, lose normal thyroid characteristics, and are associated with invasiveness and poor prognosis [2]. Mutations in genes, such as TP53 and TERT promoter, are more prevalent in ATC and PDTC, contributing to their higher mutation burden compared to well-differentiated thyroid cancer. These mutations activate various downstream signaling pathways, significantly increasing the hazard ratio for overall survival (TERT promoter mutation 1.492, and TP53 alteration 2.205) [22,23]. Previous studies reported that various cancer cells and stem cells undergo differentiation and redifferentiation under microgravity conditions [24]. Therefore, microgravity may have a more pronounced effect on ATC and PDTC cells, which have a higher genetic alteration burden. This could explain why ATC and PDTC cells showed DEG expression patterns more closely to those of normal thyrocytes.
Mechanotransduction is the process where changes in mechanical forces, such as gravity, are perceived as danger signals and are converted into biosignals that trigger immune responses [25]. In the present study, the overexpression of genes related to TLRs was observed when SNU-80, BCPAP, and Nthy-ori 3-1 cells were cultured in a microgravity environment. TLRs function as pathogen recognition receptors, identifying pathogen-associated molecular patterns and activating the innate immune system [26]. This activation promotes cytokine release and modulates the adaptive immune system [27]. However, it is well known that microgravity adversely affects the human immune system. Various studies have shown that microgravity can cause abnormalities in adaptive immunity, leading to latent virus reactivation and allergic reactions [28,29]. One study analyzing human peripheral blood mononuclear cells in microgravity reported that cytoskeletal changes impair the functional immune response, even though changes in gene expression related to acute immune response and chemokines were observed [29]. Interestingly, the immune activation induced by microgravity varies over time. In CTLA-4 cells, short-term exposure (24 h) increased IL-2 activity, whereas prolonged culture (96–120 h) led to reduced IL-2 production and T-cell exhaustion, suggesting a shift from immune activation to suppression over time [30]. T-cell exhaustion is one of the immunological states associated with aging, indicating that prolonged exposure to microgravity may eventually lead to an immunosuppressive state [31]. Therefore, the effects of microgravity on immune cells can be influenced by a range of factors, including time, gene expression, epigenomic alterations, and cellular processes. Further research will be needed to explore these variables.
In SNU-80 and BCPAP cells, the cellular response to hypoxia-related genes was downregulated. Hypoxia is a challenging tumor microenvironment with insufficient oxygen supply that cancer cells must overcome to sustain growth. In response to hypoxia, cancer cells often undergo metabolic reprogramming through the Warburg effect, bypassing the TCA cycle to survive under harsh conditions. In this process, Hypoxia-Inducible Factor 1-alpha (HIF-1α) acts as a key transcriptional regulator, modulating angiogenesis, metabolism, and cell survival. A previous study using MDA-MB-468 (human breast cancer cells) reported that gravitational changes suppress the expression of hypoxia-inducible genes caused by cytoskeleton-dependent nuclear translocation of HIFs. Macromolecules are transported and function within the cell via the cytoskeleton, but gravitational changes disrupt cytoskeletal connections. Consistently, in the present study, hypoxia-related cellular response genes were downregulated, suggesting that the reduced cellular response required for thyroid cancer cell growth could inhibit tumor progression.
In SNU-790 and TPC-1, PTC cell lines, simulated microgravity upregulated the genes associated with the cell cycle, particularly those involved in the G2-M checkpoint and mitotic spindle. The G2-M checkpoint ensures that DNA replication is complete and free of damage. If errors are detected, the cell either repairs the damage or triggers apoptosis before mitosis begins in cases of severe damage. In the present study, two key genes associated with the G2-M phase, CDK1 and TTK, were upregulated. CDK1 regulates mitotic entry by interacting with cyclins during the G2-M phase and is implicated in oncogenic pathways. TTK, a dual-specificity kinase, plays a role in the spindle assembly checkpoint to ensure accurate chromosome segregation during cell cycle checkpoints. Similarly, cyclin B expression increased when C2C12 mouse muscle cells were cultured in simulated microgravity, reflecting a higher proportion of cells in the G2-M phase. This resulted in delayed progression through the G2-M phase and slower proliferation. Comparable findings have been observed in human lymphocytes and breast cancer cells, where microgravity-induced cytoskeleton organization issues led to delays in the G2-M phase. Therefore, changes in the cytoskeleton may cause G2-M phase arrest in a microgravity environment, potentially inhibiting the proliferation of cancer cells.
All cell types cultured under simulated microgravity showed a tendency towards increased migration and invasion. Nevertheless, only some of these results were statistically significant, making it difficult to conclude that simulated microgravity enhances cell aggressiveness. A previous study reported increased migration in non-small cell lung cancer cells under microgravity conditions [32]. In contrast, other research observed reduced migration and invasion potential in human glioblastoma cells, indicating conflicting effects of microgravity on migration and invasion [33]. Changes in the cytoskeleton induced by microgravity can alter the cellular structures, such as the basement membrane or extracellular matrix, and may cause the cells to form 3-dimensional multicellular spheroids [4,19,32]. Although our study did not directly measure time-dependent effects, previous research suggests that cytoskeletal adaptation under microgravity may influence migration and invasion [4,34]. Since assays were conducted under normal gravity for 24 h, this transitional environment may have impacted the observed results. In addition to gene expression, factors such as cell-matrix interactions, cell-cell interactions, cytokines, mechanical forces, and cell adhesion molecules can also influence migration and invasion. Therefore, further research will be needed to clarify the conflicting findings observed in various studies and to understand the precise mechanisms through which microgravity affects cellular migration and invasion potential.
This study had certain limitations. This study implemented a simulated gravity of approximately 10e−3 g because the clinostat device cannot fully replicate true microgravity. Despite the limitation stemming from the inability to recreate microgravity conditions on Earth perfectly, experimental methods consistent with the existing literature were used to ensure that this study can serve as a valuable reference for future research in actual microgravity environments.
Additionally, this study focused only on adhesive cells. In microgravity, however, cells often grow into a 3D structure called a multicellular spheroid, which is important for replicating the tumor microenvironment because of its increased cell-to-cell interactions. Therefore, to understand the effects of microgravity, future studies should also analyze cells in the multicellular spheroid form, which can provide more realistic insights into tumor growth and drug responses.
Importantly, the findings presented here reflect correlations based on observed gene expression differences and phenotypic behaviors under different gravity conditions, and do not imply causality. While mechanotransduction, Toll-like receptor signaling, hypoxia-inducible factors, and G2–M phase regulation were proposed as potential mechanisms, this study did not directly investigate the causative roles or underlying pathways involved. Further research is required to confirm whether these pathways functionally mediate the observed changes in cellular responses under microgravity.
Furthermore, it is difficult to understand all the characteristics of cancer because this study only conducted gene expression analysis. Accordingly, additional research, such as proteomics, epigenomics, genomic instability, metabolomics, and studies on cell-to-cell interactions, will be needed to characterize cancer and validate the results of this study.
This study provides new insights into the effects of simulated microgravity on various thyroid cancer cell lines, revealing distinct changes in gene expression and cellular behaviors. In particular, the cell cycle-related genes, particularly in SNU-790 and TPC-1 PTC cell lines, were upregulated. In addition, microgravity leads to the downregulation of the genes related to the HIF-1α signaling pathway in SNU-80 and BCPAP cells, while enhancing the expression of genes involved in the innate immune system in Nthy-ori 3-1, SNU-80, and BCPAP cells. Furthermore, microgravity-induced changes in gene expression could influence migration and invasion, but the precise mechanisms are unclear and appear to be time-dependent. These findings offer valuable insights into how thyroid cancer cells behave under altered gravity conditions and could have significant implications for cancer research and developing novel therapeutic strategies. Future research should aim to validate these findings, explore the underlying causal mechanisms, and assess the impact of actual microgravity on cellular behavior and other organ systems.
Acknowledgement: Not applicable.
Funding Statement: The authors received no specific funding for this study.
Author Contributions: Conceptualization, Jin Wook Yi and Jong-hyuk Ahn; methodology, Jin Wook Yi; validation, Jin Wook Yi and Jong-hyuk Ahn; formal analysis, Jong-hyuk Ahn; investigation, Jin Wook Yi; resources, Jin Wook Yi; data curation, Jin Wook Yi; writing—original draft preparation, Jong-hyuk Ahn; writing—review and editing, Jin Wook Yi and Jong-hyuk Ahn; visualization, Jong-hyuk Ahn; supervision, Jin Wook Yi; project administration, Jin Wook Yi. All authors reviewed the results and approved the final version of the manuscript.
Availability of Data and Materials: The data that support the findings of this study are available from the corresponding author, Jin Wook Yi, upon reasonable request.
Ethics Approval: This study did not require approval from an Institutional Review Board or Institutional Animal Care and Use Committee because it did not involve human or animal subjects.
Informed Consent: Not applicable.
Conflicts of Interest: The authors declare no conflicts of interest to report regarding the present study.
Declaration of Generative AI in Scientific Writing: During the preparation of this paper, the authors utilized ChatGPT and an English editing service to enhance readability and language. After using this tool/service, the authors reviewed and edited the content as needed and took full responsibility for the content of the publication.
References
1. Cialdai F, Bolognini D, Vignali L, Iannotti N, Cacchione S, Magi A, et al. Effect of space flight on the behavior of human retinal pigment epithelial ARPE-19 cells and evaluation of coenzyme Q10 treatment. Cell Mol Life Sci. 2021;78(23):7795–812. doi:10.21203/rs.3.rs-675406/v1. [Google Scholar] [CrossRef]
2. Lv H, Yang H, Jiang C, Shi J, Chen RA, Huang Q, et al. Microgravity and immune cells. J R Soc Interface. 2023;20(199):20220869. [Google Scholar] [PubMed]
3. Cogoli A, Tschopp A. Lymphocyte reactivity during spaceflight. Immunology Today. 1985;6(1):1–4. doi:10.1016/0167-5699(85)90151-3. [Google Scholar] [PubMed] [CrossRef]
4. Kruger M, Melnik D, Kopp S, Buken C, Sahana J, Bauer J, et al. Fighting thyroid cancer with microgravity research. Int J Mol Sci. 2019;20(10):2553. doi:10.3390/ijms20102553. [Google Scholar] [PubMed] [CrossRef]
5. Melnik D, Kruger M, Schulz H, Kopp S, Wehland M, Bauer J, et al. The CellBox-2 mission to the international space station: thyroid cancer cells in space. Int J Mol Sci. 2021;22(16):8777. doi:10.3390/ijms22168777. [Google Scholar] [PubMed] [CrossRef]
6. Kim H, Shin Y, Kim DH. Mechanobiological implications of cancer progression in space. Front Cell Dev Biol. 2021;9:740009. doi:10.3389/fcell.2021.740009. [Google Scholar] [PubMed] [CrossRef]
7. Topal U, Zamur C, Sorrenti V. Microgravity, stem cells, and cancer: a new hope for cancer treatment. Stem Cells Int. 2021;2021(1):5566872–9. doi:10.1155/2021/5566872. [Google Scholar] [PubMed] [CrossRef]
8. Chen DW, Lang BHH, McLeod DSA, Newbold K, Haymart MR. Thyroid cancer. Lancet. 2023;401(10387):1531–44. doi:10.1016/s0140-6736(23)00020-x. [Google Scholar] [PubMed] [CrossRef]
9. Saenko V, Mitsutake N. Radiation-related thyroid cancer. Endocr Rev. 2024;45(1):1–29. [Google Scholar] [PubMed]
10. Liu GS, Cook A, Richardson M, Vail D, Holsinger FC, Oakley-Girvan I. Thyroid cancer risk in airline cockpit and cabin crew: a meta-analysis. Cancers Head Neck. 2018;3(1):7. doi:10.1186/s41199-018-0034-8. [Google Scholar] [PubMed] [CrossRef]
11. Park S, Lee GB, Lee D, Cha ES, Han K, Cho M, et al. Cancer risk among air transportation industry workers in Korea: a national health registry-based study. BMC Public Health. 2024;24(1):2435. doi:10.1186/s12889-024-19904-w. [Google Scholar] [PubMed] [CrossRef]
12. Infanger M, Kossmehl P, Shakibaei M, Bauer J, Kossmehl-Zorn S, Cogoli A, et al. Simulated weightlessness changes the cytoskeleton and extracellular matrix proteins in papillary thyroid carcinoma cells. Cell Tissue Res. 2006;324(2):267–77. doi:10.1007/s00441-005-0142-8. [Google Scholar] [PubMed] [CrossRef]
13. Kopp S, Warnke E, Wehland M, Aleshcheva G, Magnusson NE, Hemmersbach R, et al. Mechanisms of three-dimensional growth of thyroid cells during long-term simulated microgravity. Sci Rep. 2015;5(1):16691. doi:10.1038/srep16691. [Google Scholar] [PubMed] [CrossRef]
14. King SA, Kutz CJ, Chough NG. Spaceflight environment. Emerg Med Clin North Am. 2024;42(3):695–709. doi:10.1016/j.emc.2024.02.023. [Google Scholar] [PubMed] [CrossRef]
15. Koh CS, Ku JL, Park SY, Kim KH, Choi JS, Kim IJ, et al. Establishment and characterization of cell lines from three human thyroid carcinomas: responses to all-trans-retinoic acid and mutations in the BRAF gene. Mol Cell Endocrinol. 2007;264(1–2):118–27. doi:10.1016/j.mce.2006.10.017. [Google Scholar] [PubMed] [CrossRef]
16. Ishizaka Y, Ushijima T, Sugimura T, Nagao M. cDNA cloning and characterization of ret activated in a human papillary thyroid carcinoma cell line. Biochem Biophys Res Commun. 1990;168(2):402–8. doi:10.1016/0006-291x(90)92335-w. [Google Scholar] [PubMed] [CrossRef]
17. Kim BA, Jee HG, Yi JW, Kim SJ, Chai YJ, Choi JY, et al. Expression profiling of a human thyroid cell line stably expressing the BRAFV600E mutation. Cancer Genom Proteom. 2017;14(1):53–67. doi:10.21873/cgp.20018. [Google Scholar] [PubMed] [CrossRef]
18. Dettori T, Frau DV, Garcia JL, Pierantoni G, Lee C, Hernandez JM, et al. Comprehensive conventional and molecular cytogenetic characterization of B-CPAP, a human papillary thyroid carcinoma-derived cell line. Cancer Genet Cytogenet. 2004;151(2):171–7. doi:10.1016/j.cancergencyto.2003.09.023. [Google Scholar] [PubMed] [CrossRef]
19. Ahn JH, Park S, Hwang YM, Choi YS, Yi JW. Morphologic and genomic changes of thyroid cancer cell lines exposed to conditions of simulated microgravity. npj Microgravity. 2024;10(1):8. doi:10.1038/s41526-024-00346-y. [Google Scholar] [PubMed] [CrossRef]
20. Eiermann P, Kopp S, Hauslage J, Hemmersbach R, Gerzer R, Ivanova K. Adaptation of a 2-D clinostat for simulated microgravity experiments with adherent cells. Microgravity Sci Tec. 2013;25(3):153–9. doi:10.1007/s12217-013-9341-1. [Google Scholar] [CrossRef]
21. Chomczynski P, Sacchi N. The single-step method of RNA isolation by acid guanidinium thiocyanate-phenol-chloroform extraction: twenty-something years on. Nat Protoc. 2006;1(2):581–5. doi:10.1038/nprot.2006.83. [Google Scholar] [PubMed] [CrossRef]
22. Elia G, Patrizio A, Ragusa F, Paparo SR, Mazzi V, Balestri E, et al. Molecular features of aggressive thyroid cancer. Front Oncol. 2022;12:1099280. doi:10.3389/fonc.2022.1099280. [Google Scholar] [PubMed] [CrossRef]
23. Toda S, Hiroshima Y, Iwasaki H, Masudo K. Genomic landscape and clinical features of advanced thyroid carcinoma: a national database study in Japan. J Clin Endocrinol Metab. 2024;109(11):2784–92. doi:10.1210/clinem/dgae271. [Google Scholar] [PubMed] [CrossRef]
24. Grimm D, Wehland M, Corydon TJ, Richter P, Prasad B, Bauer J, et al. The effects of microgravity on differentiation and cell growth in stem cells and cancer stem cells. Stem Cells Transl Med. 2020;9(8):882–94. doi:10.1002/sctm.20-0084. [Google Scholar] [PubMed] [CrossRef]
25. Du H, Bartleson JM, Butenko S, Alonso V, Liu WF, Winer DA, et al. Tuning immunity through tissue mechanotransduction. Nat Rev Immunol. 2023;23(3):174–88. doi:10.1038/s41577-022-00761-w. [Google Scholar] [PubMed] [CrossRef]
26. Fan L, Sui XY, Jin X, Zhang WJ, Zhou P, Shao ZM. High expression of TLR3 in triple-negative breast cancer predicts better prognosis-data from the Fudan University Shanghai Cancer Center cohort and tissue microarrays. BMC Cancer. 2023;23(1):298. doi:10.1186/s12885-023-10721-9. [Google Scholar] [PubMed] [CrossRef]
27. Chen X, Zhang Y, Fu Y. The critical role of Toll-like receptor-mediated signaling in cancer immunotherapy. Med Drug Discov. 2022;14(6):100122. doi:10.1016/j.medidd.2022.100122. [Google Scholar] [CrossRef]
28. Crucian BE, Chouker A, Simpson RJ, Mehta S, Marshall G, Smith SM, et al. Immune system dysregulation during spaceflight: potential countermeasures for deep space exploration missions. Front Immunol. 2018;9:1437. doi:10.3389/fimmu.2018.02024. [Google Scholar] [PubMed] [CrossRef]
29. Wu F, Du H, Overbey E, Kim J, Makhijani P, Martin N, et al. Single-cell analysis identifies conserved features of immune dysfunction in simulated microgravity and spaceflight. Nat Commun. 2024;15(1):4795. doi:10.1038/s41467-023-42013-y. [Google Scholar] [PubMed] [CrossRef]
30. Bradley JH, Stein R, Randolph B, Molina E, Arnold JP, Gregg RK. T cell resistance to activation by dendritic cells requires long-term culture in simulated microgravity. Life Sci Space Res. 2017;15(1):55–61. doi:10.1016/j.lssr.2017.08.002. [Google Scholar] [PubMed] [CrossRef]
31. Hicks J, Olson M, Mitchell C, Juran CM, Paul AM. The impact of microgravity on immunological states. Immunohorizons. 2023;7(10):670–82. [Google Scholar] [PubMed]
32. Ahn CB, Lee JH, Han DG, Kang HW, Lee SH, Lee JI, et al. Simulated microgravity with floating environment promotes migration of non-small cell lung cancers. Sci Rep. 2019;9(1):14553. doi:10.1038/s41598-019-50736-6. [Google Scholar] [PubMed] [CrossRef]
33. Shi ZX, Rao W, Wang H, Wang ND, Si JW, Zhao J, et al. Modeled microgravity suppressed invasion and migration of human glioblastoma U87 cells through downregulating store-operated calcium entry. Biochem Biophys Res Commun. 2015;457(3):378–84. doi:10.1016/j.bbrc.2014.12.120. [Google Scholar] [PubMed] [CrossRef]
34. Thiel CS, Tauber S, Lauber B, Polzer J, Seebacher C, Uhl R, et al. Rapid morphological and cytoskeletal response to microgravity in human primary macrophages. Int J Mol Sci. 2019;20(10):2402. doi:10.3390/ijms20102402. [Google Scholar] [PubMed] [CrossRef]
Appendix A
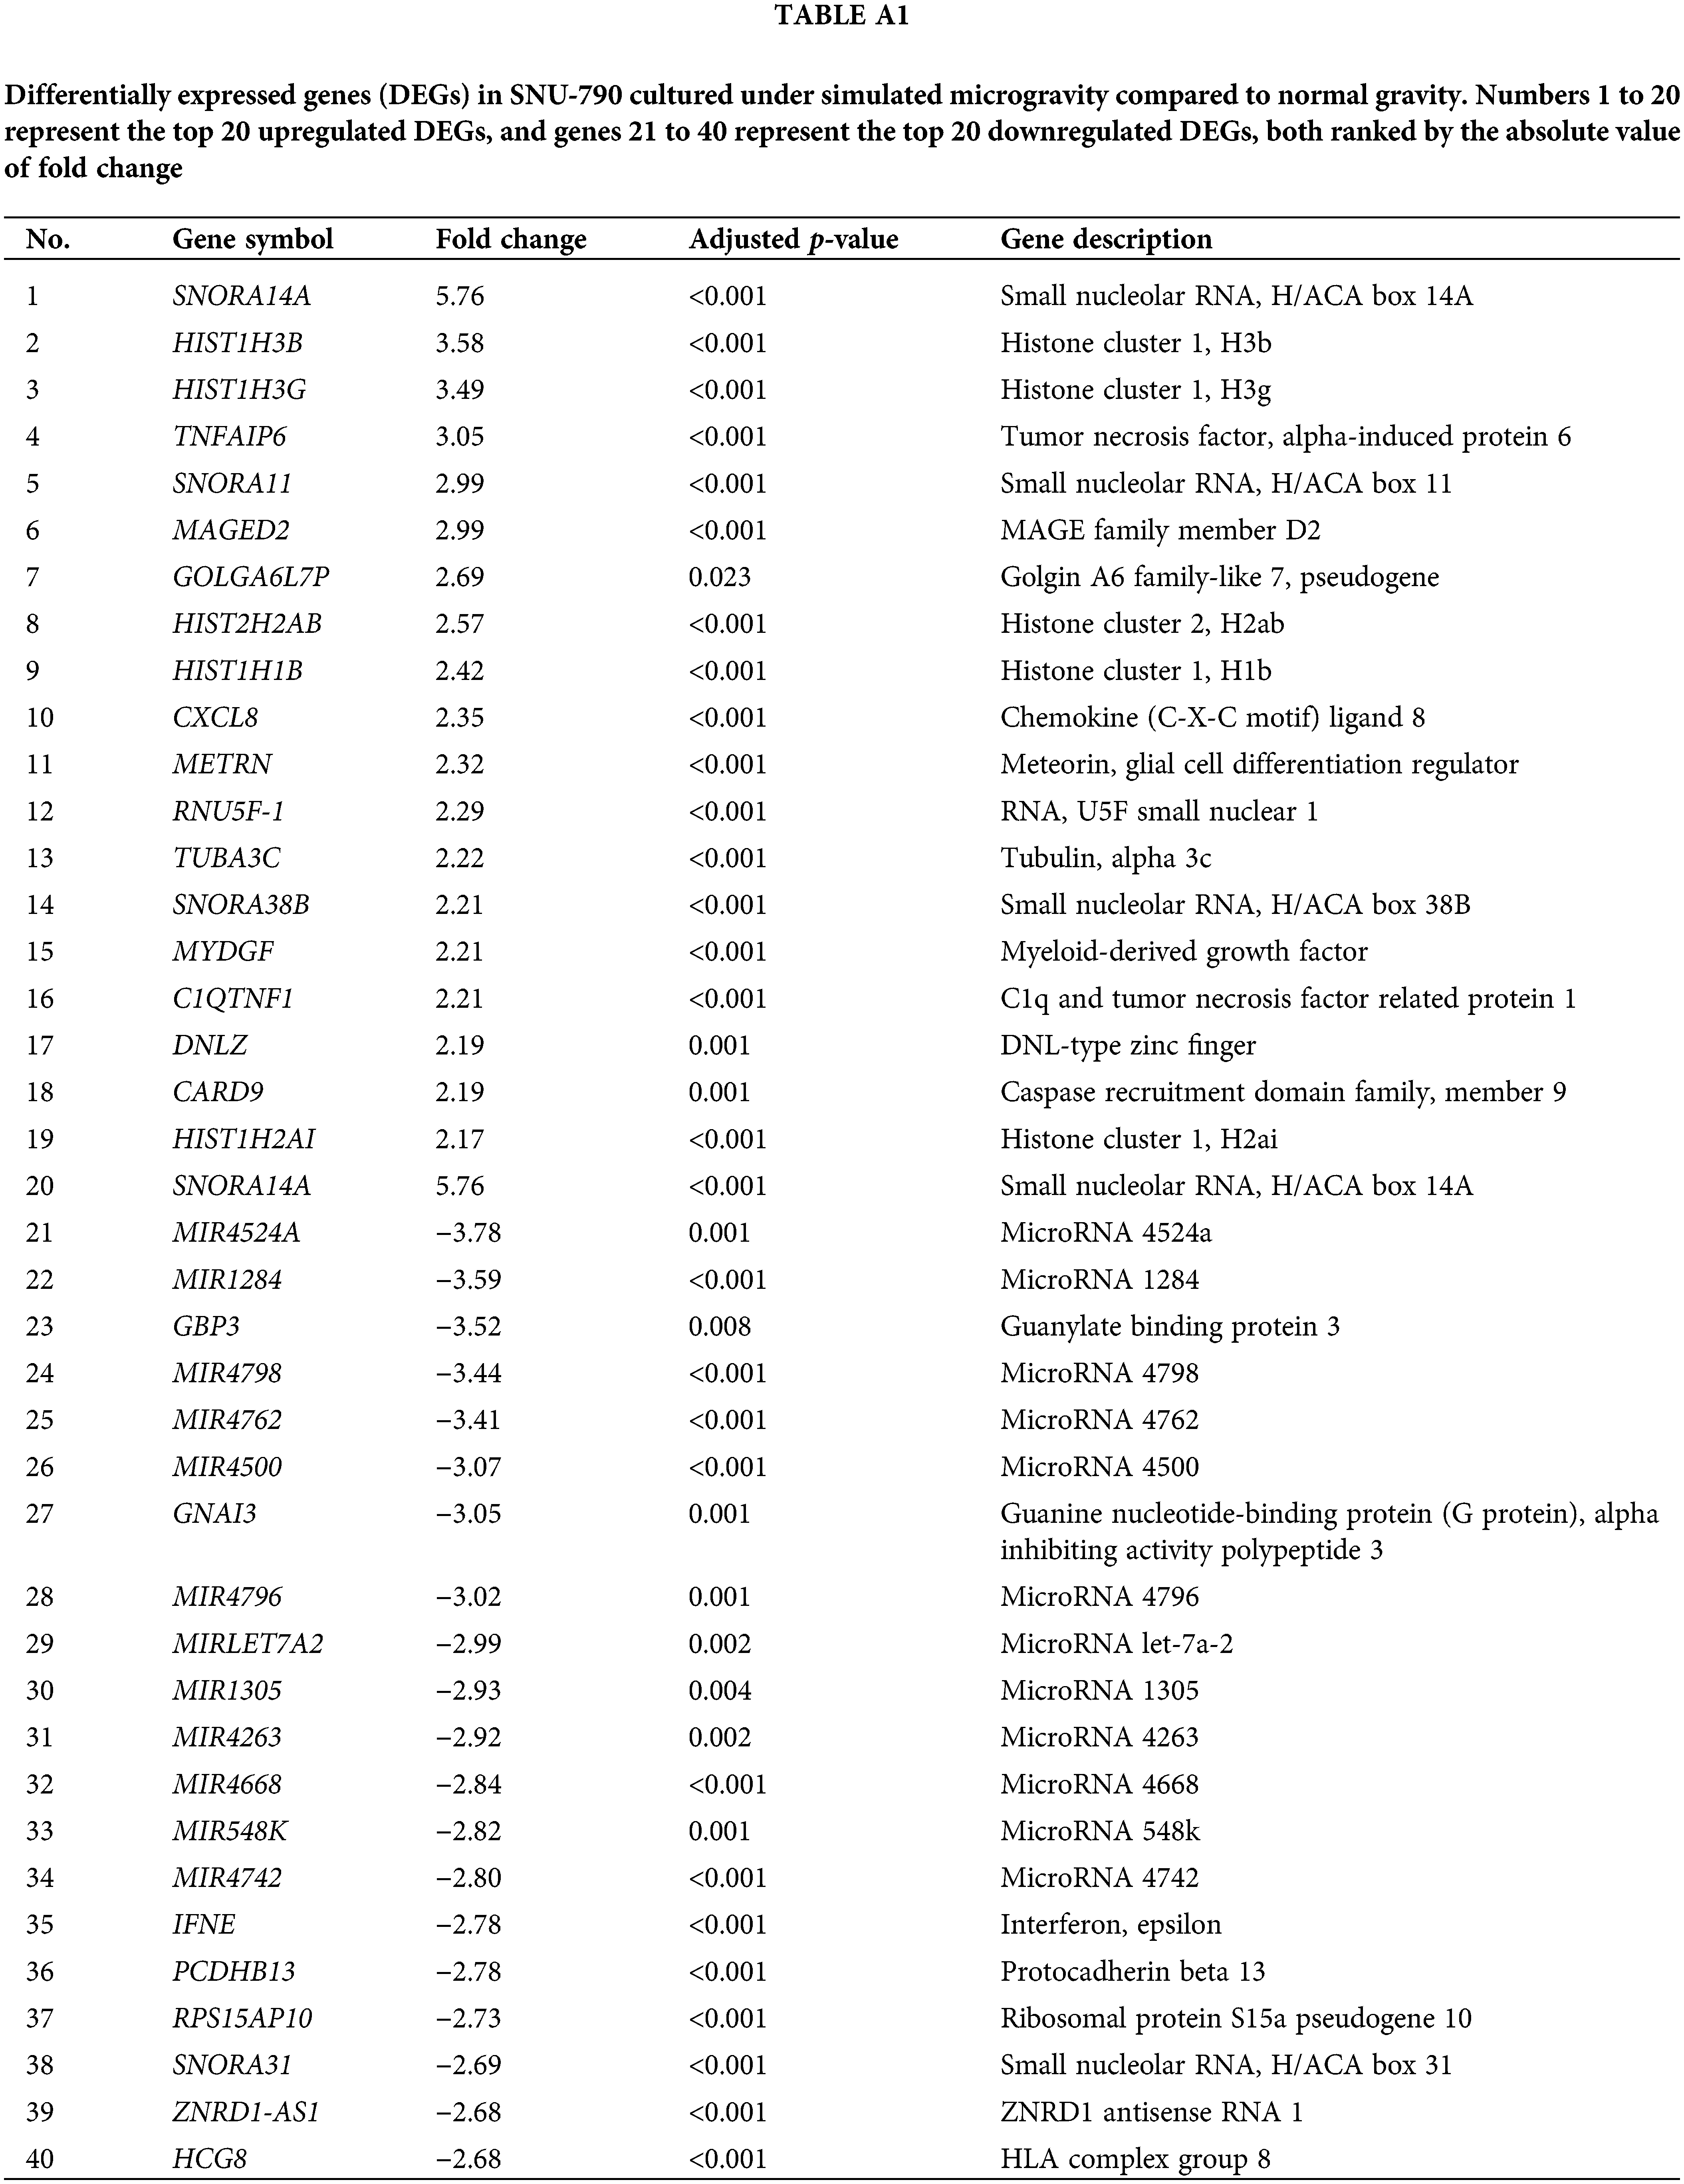
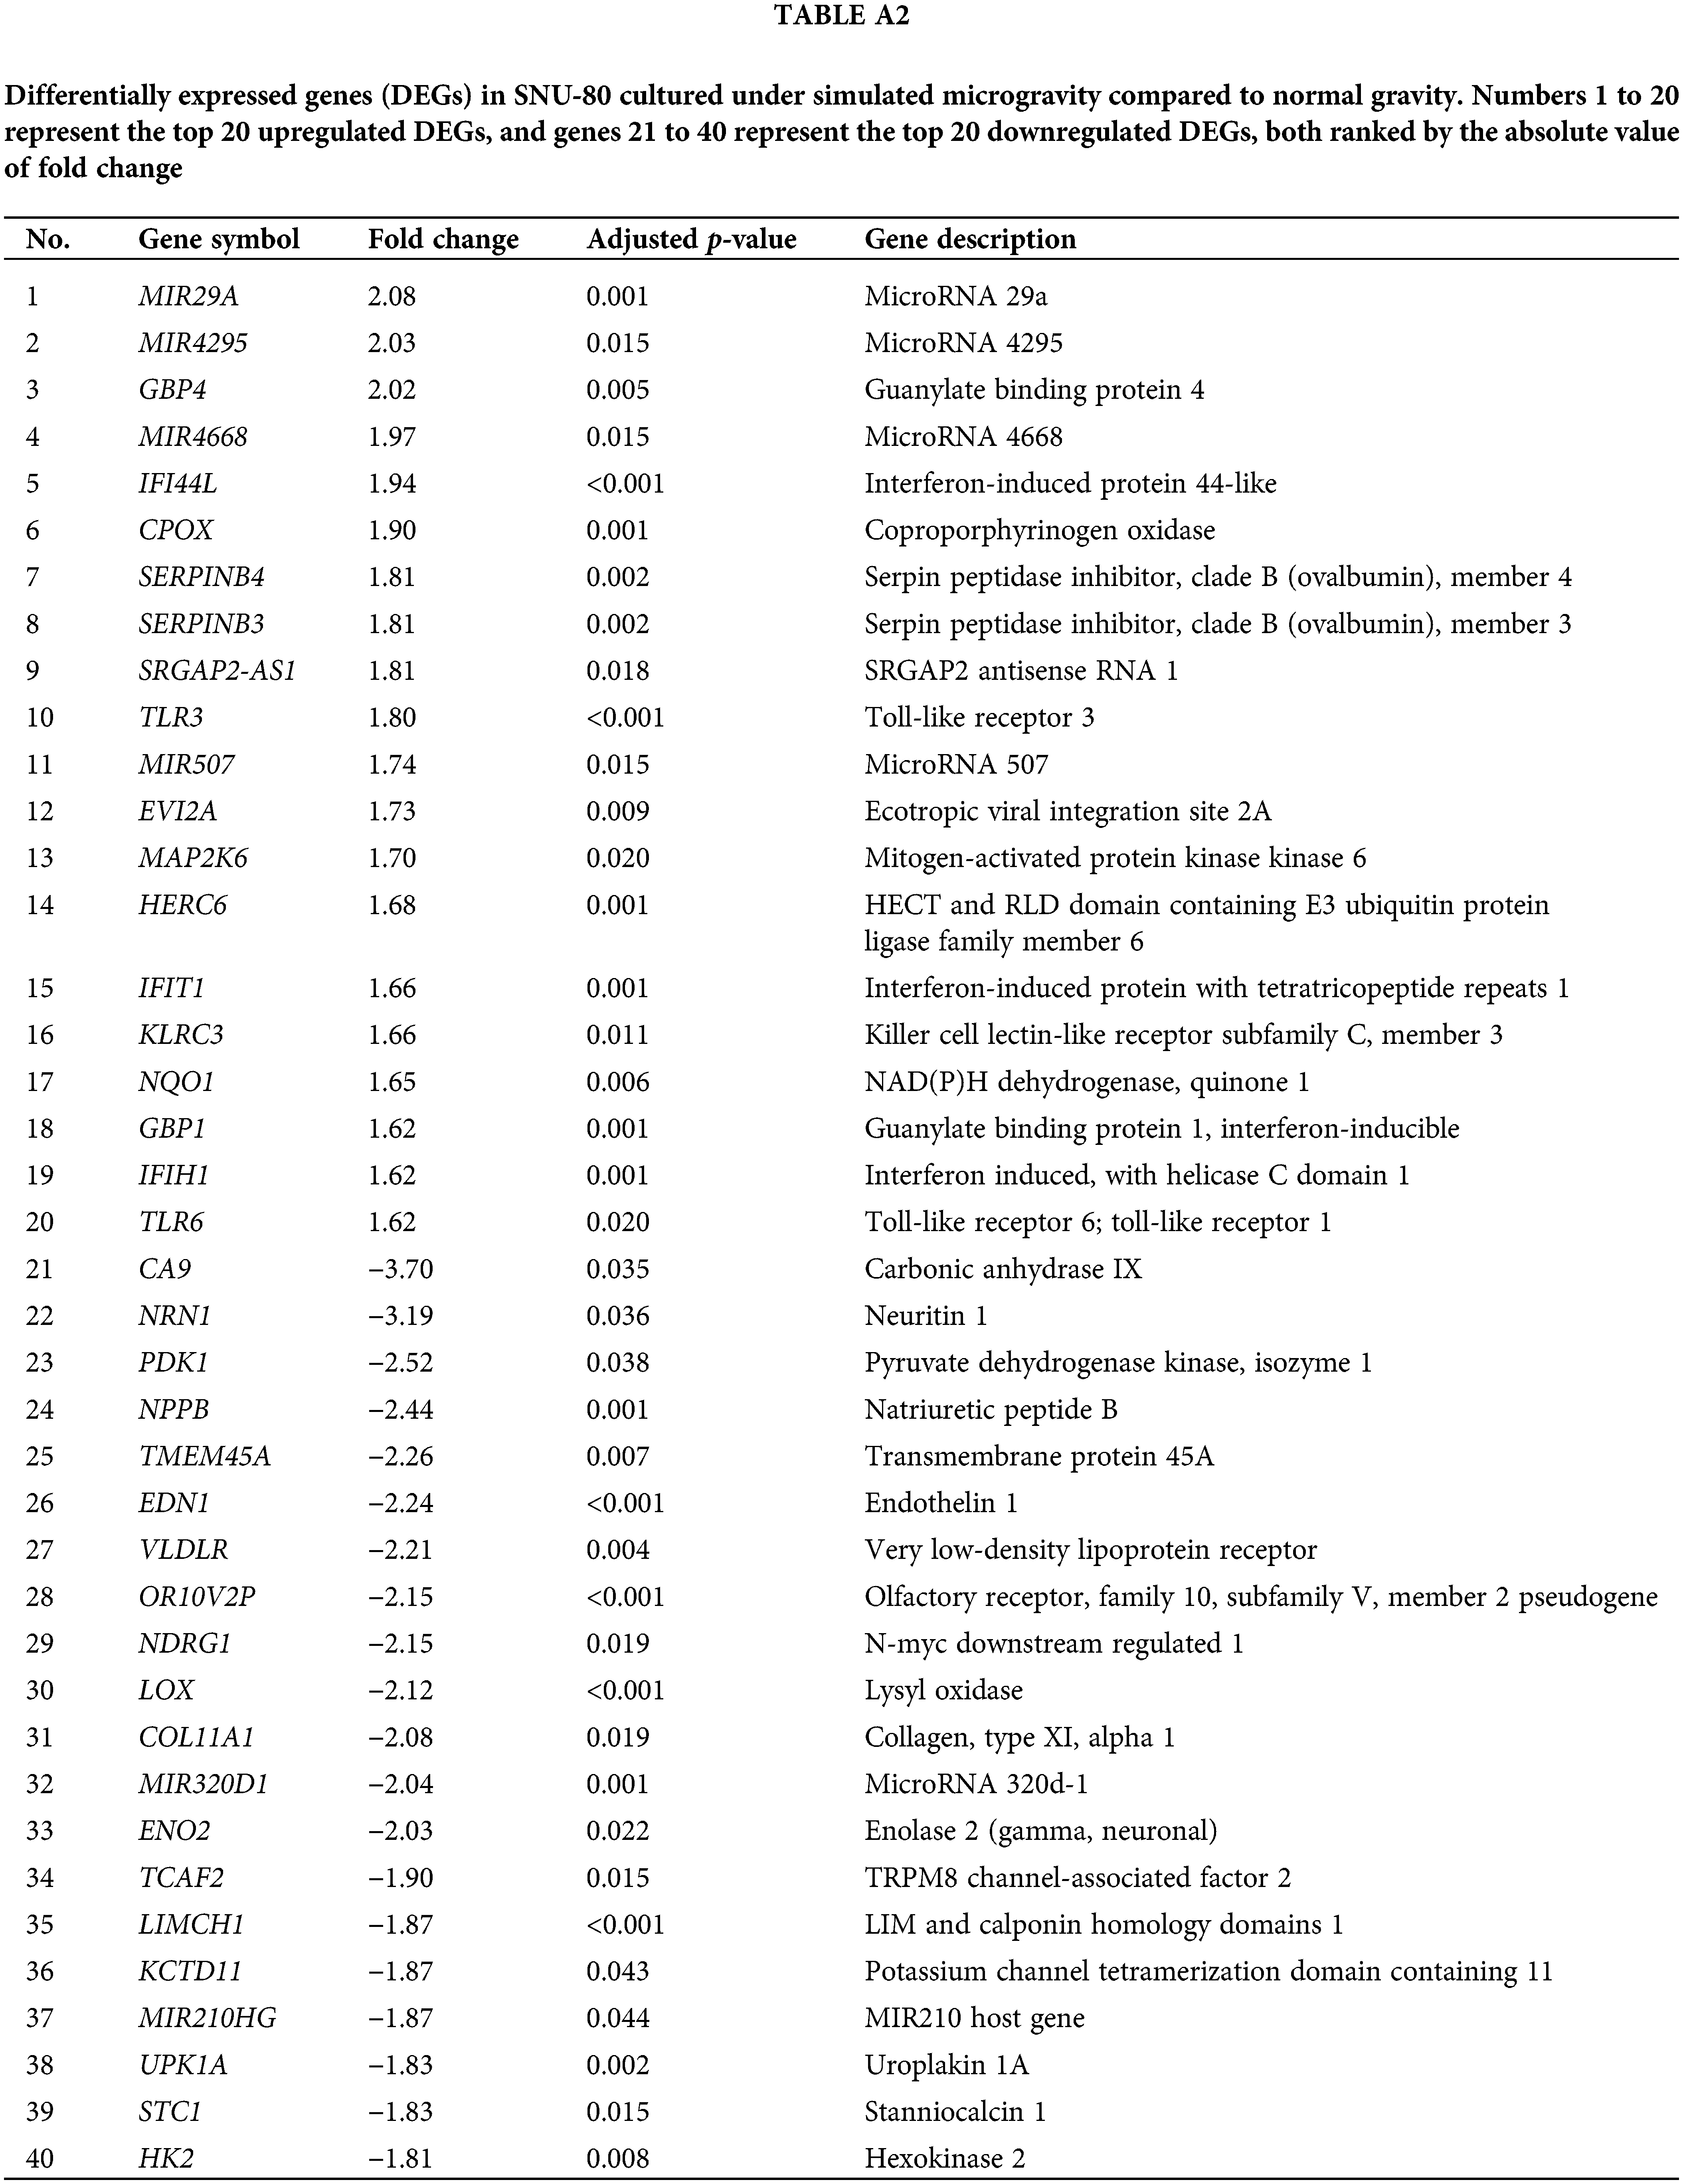
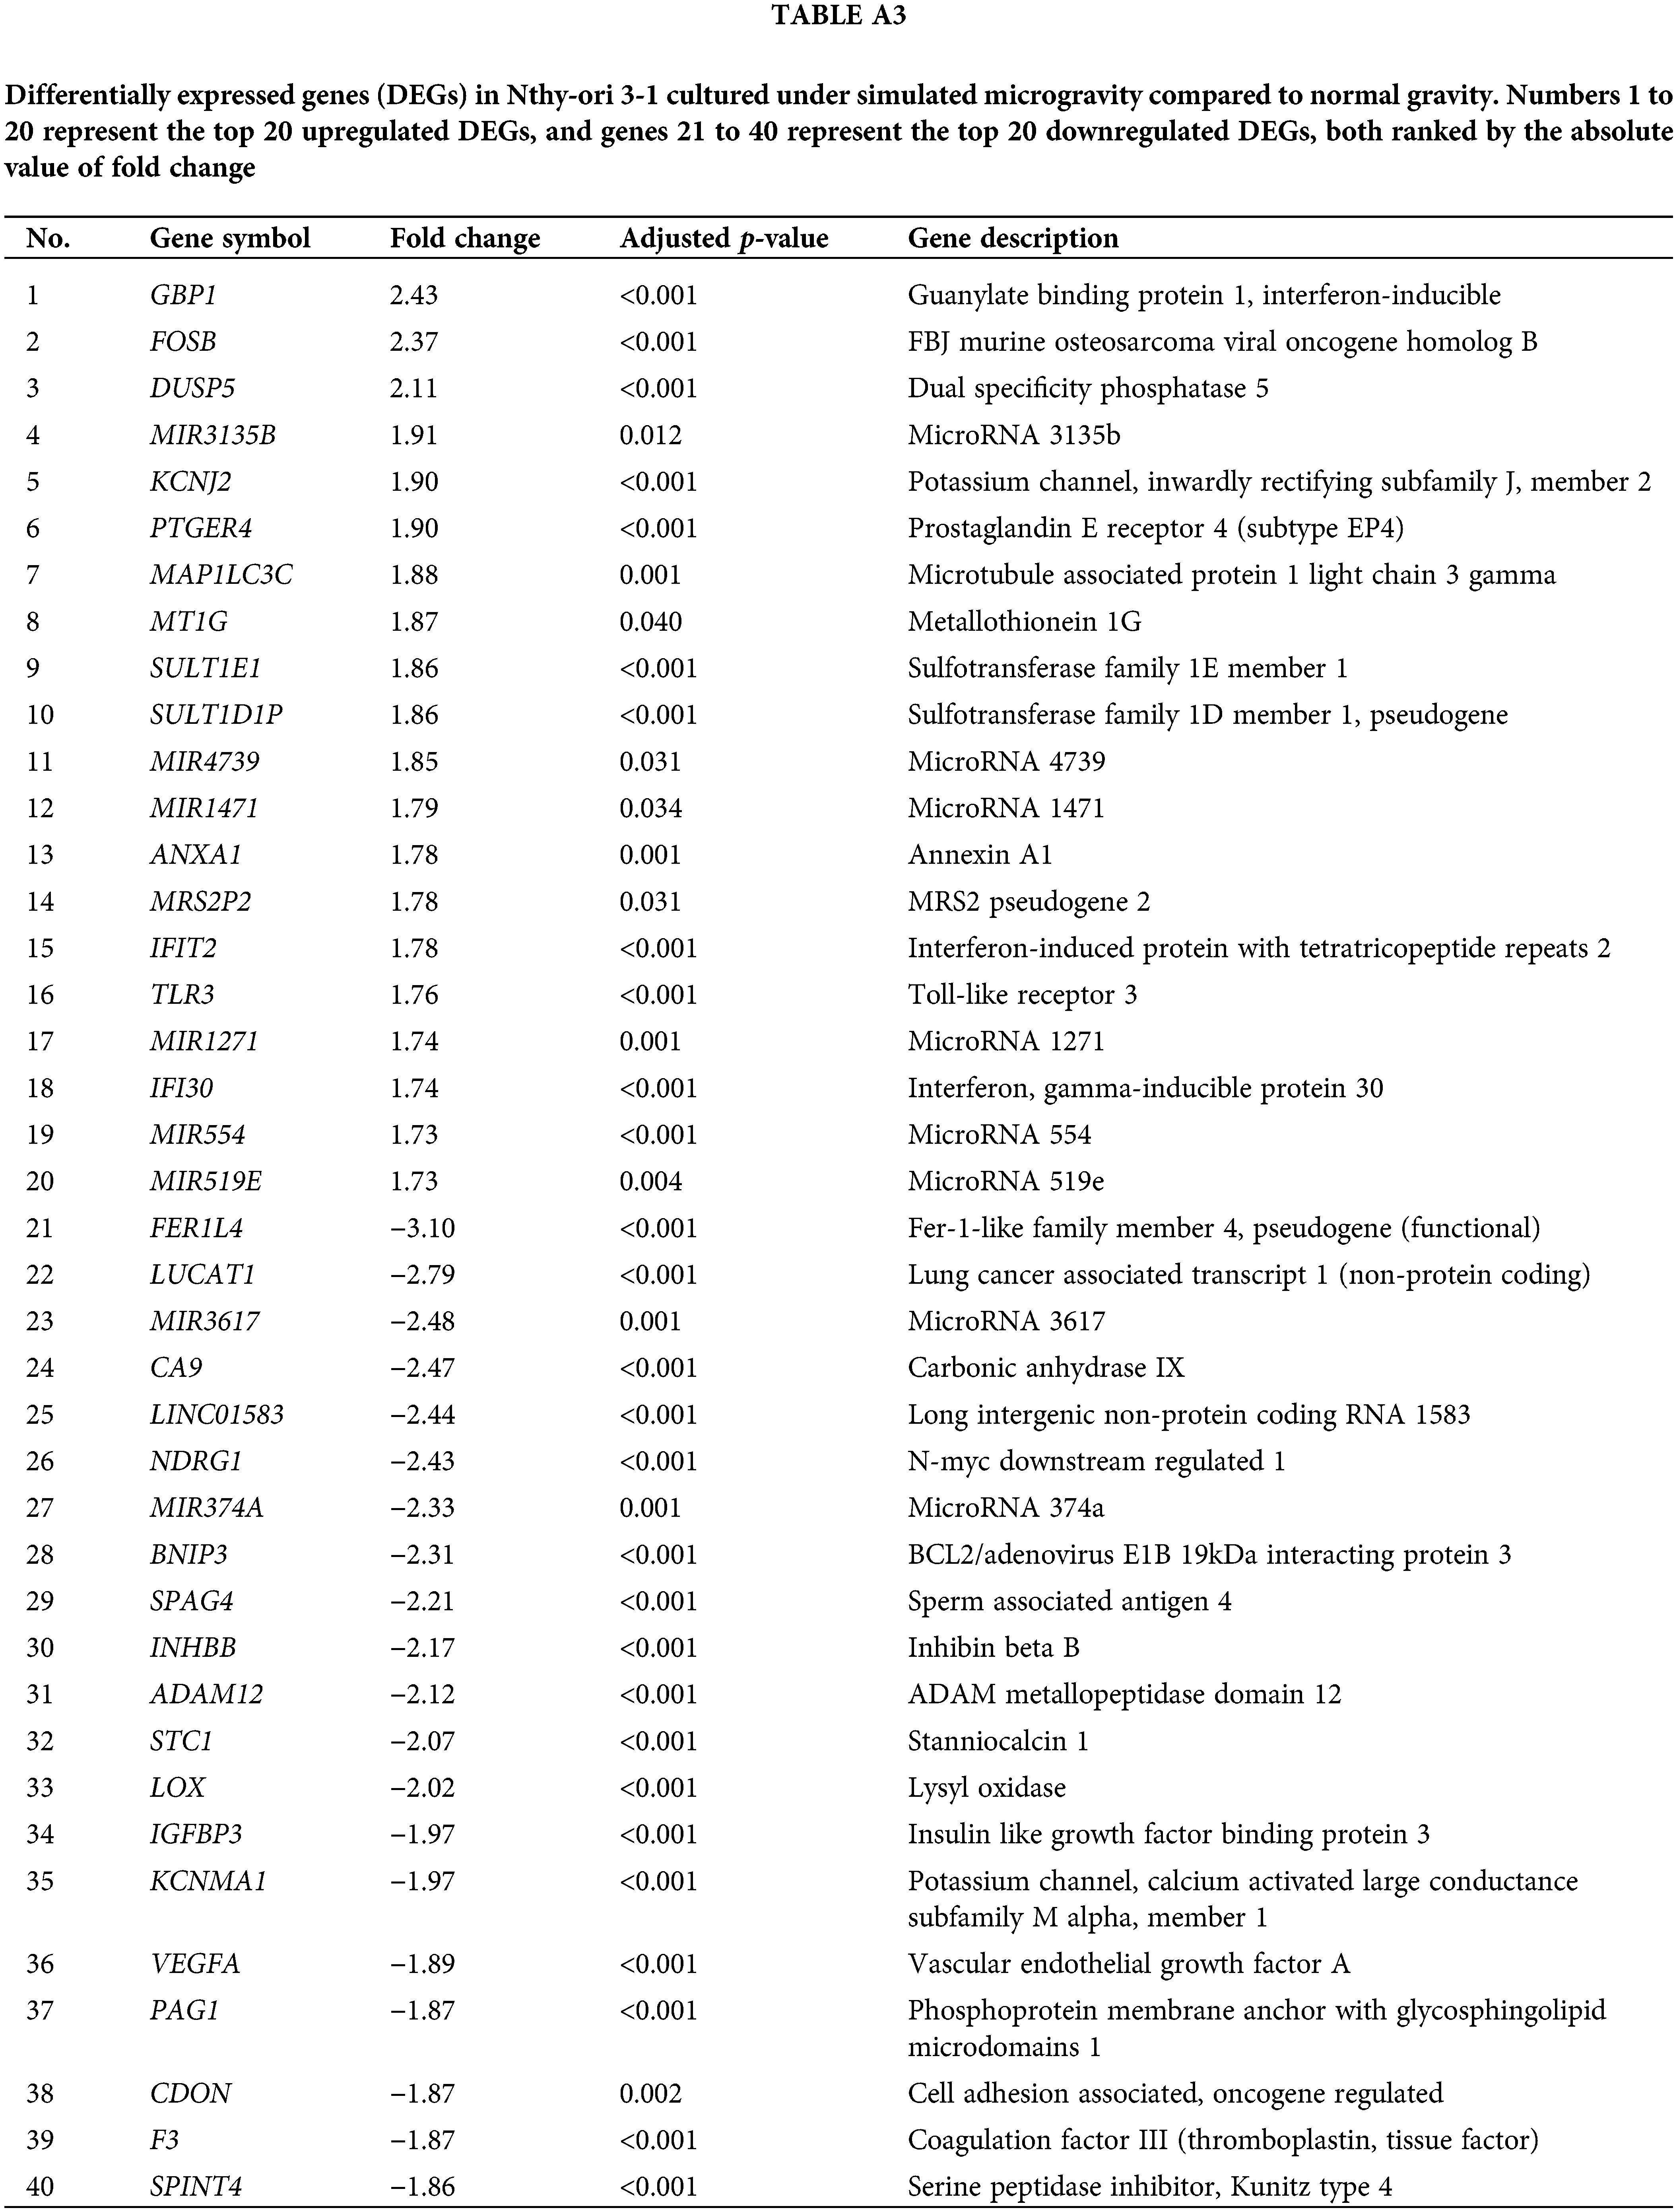
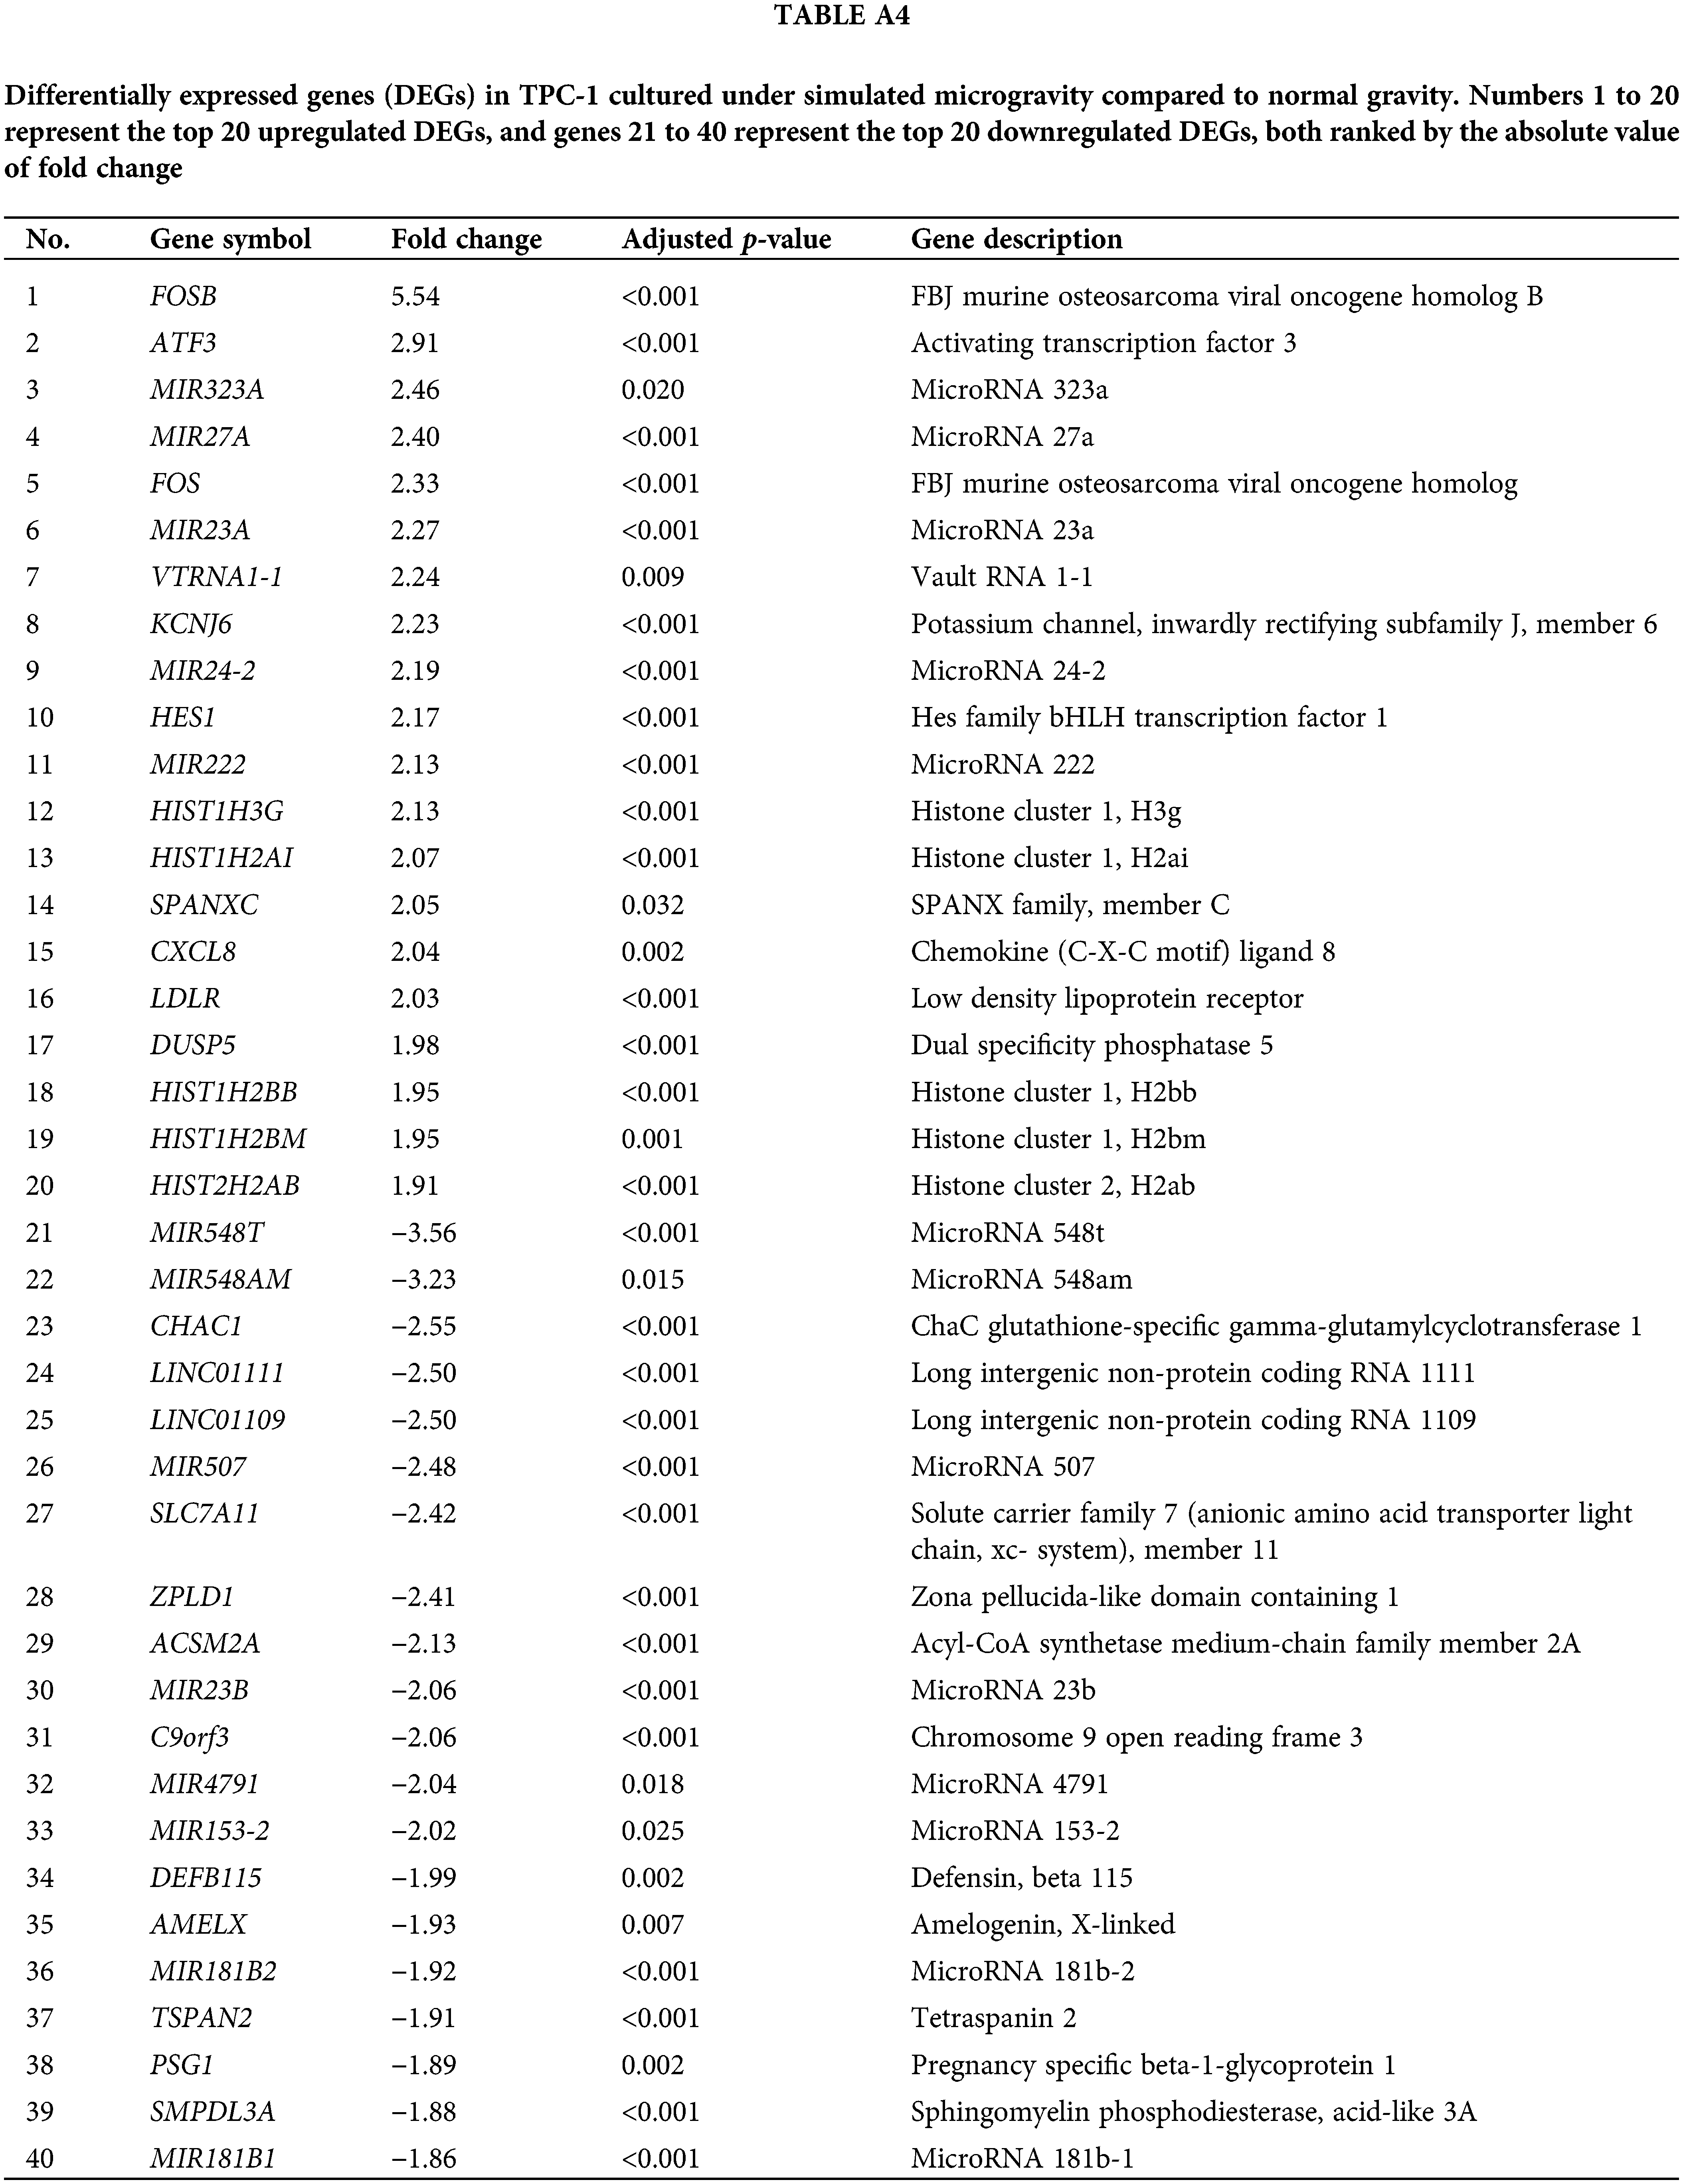
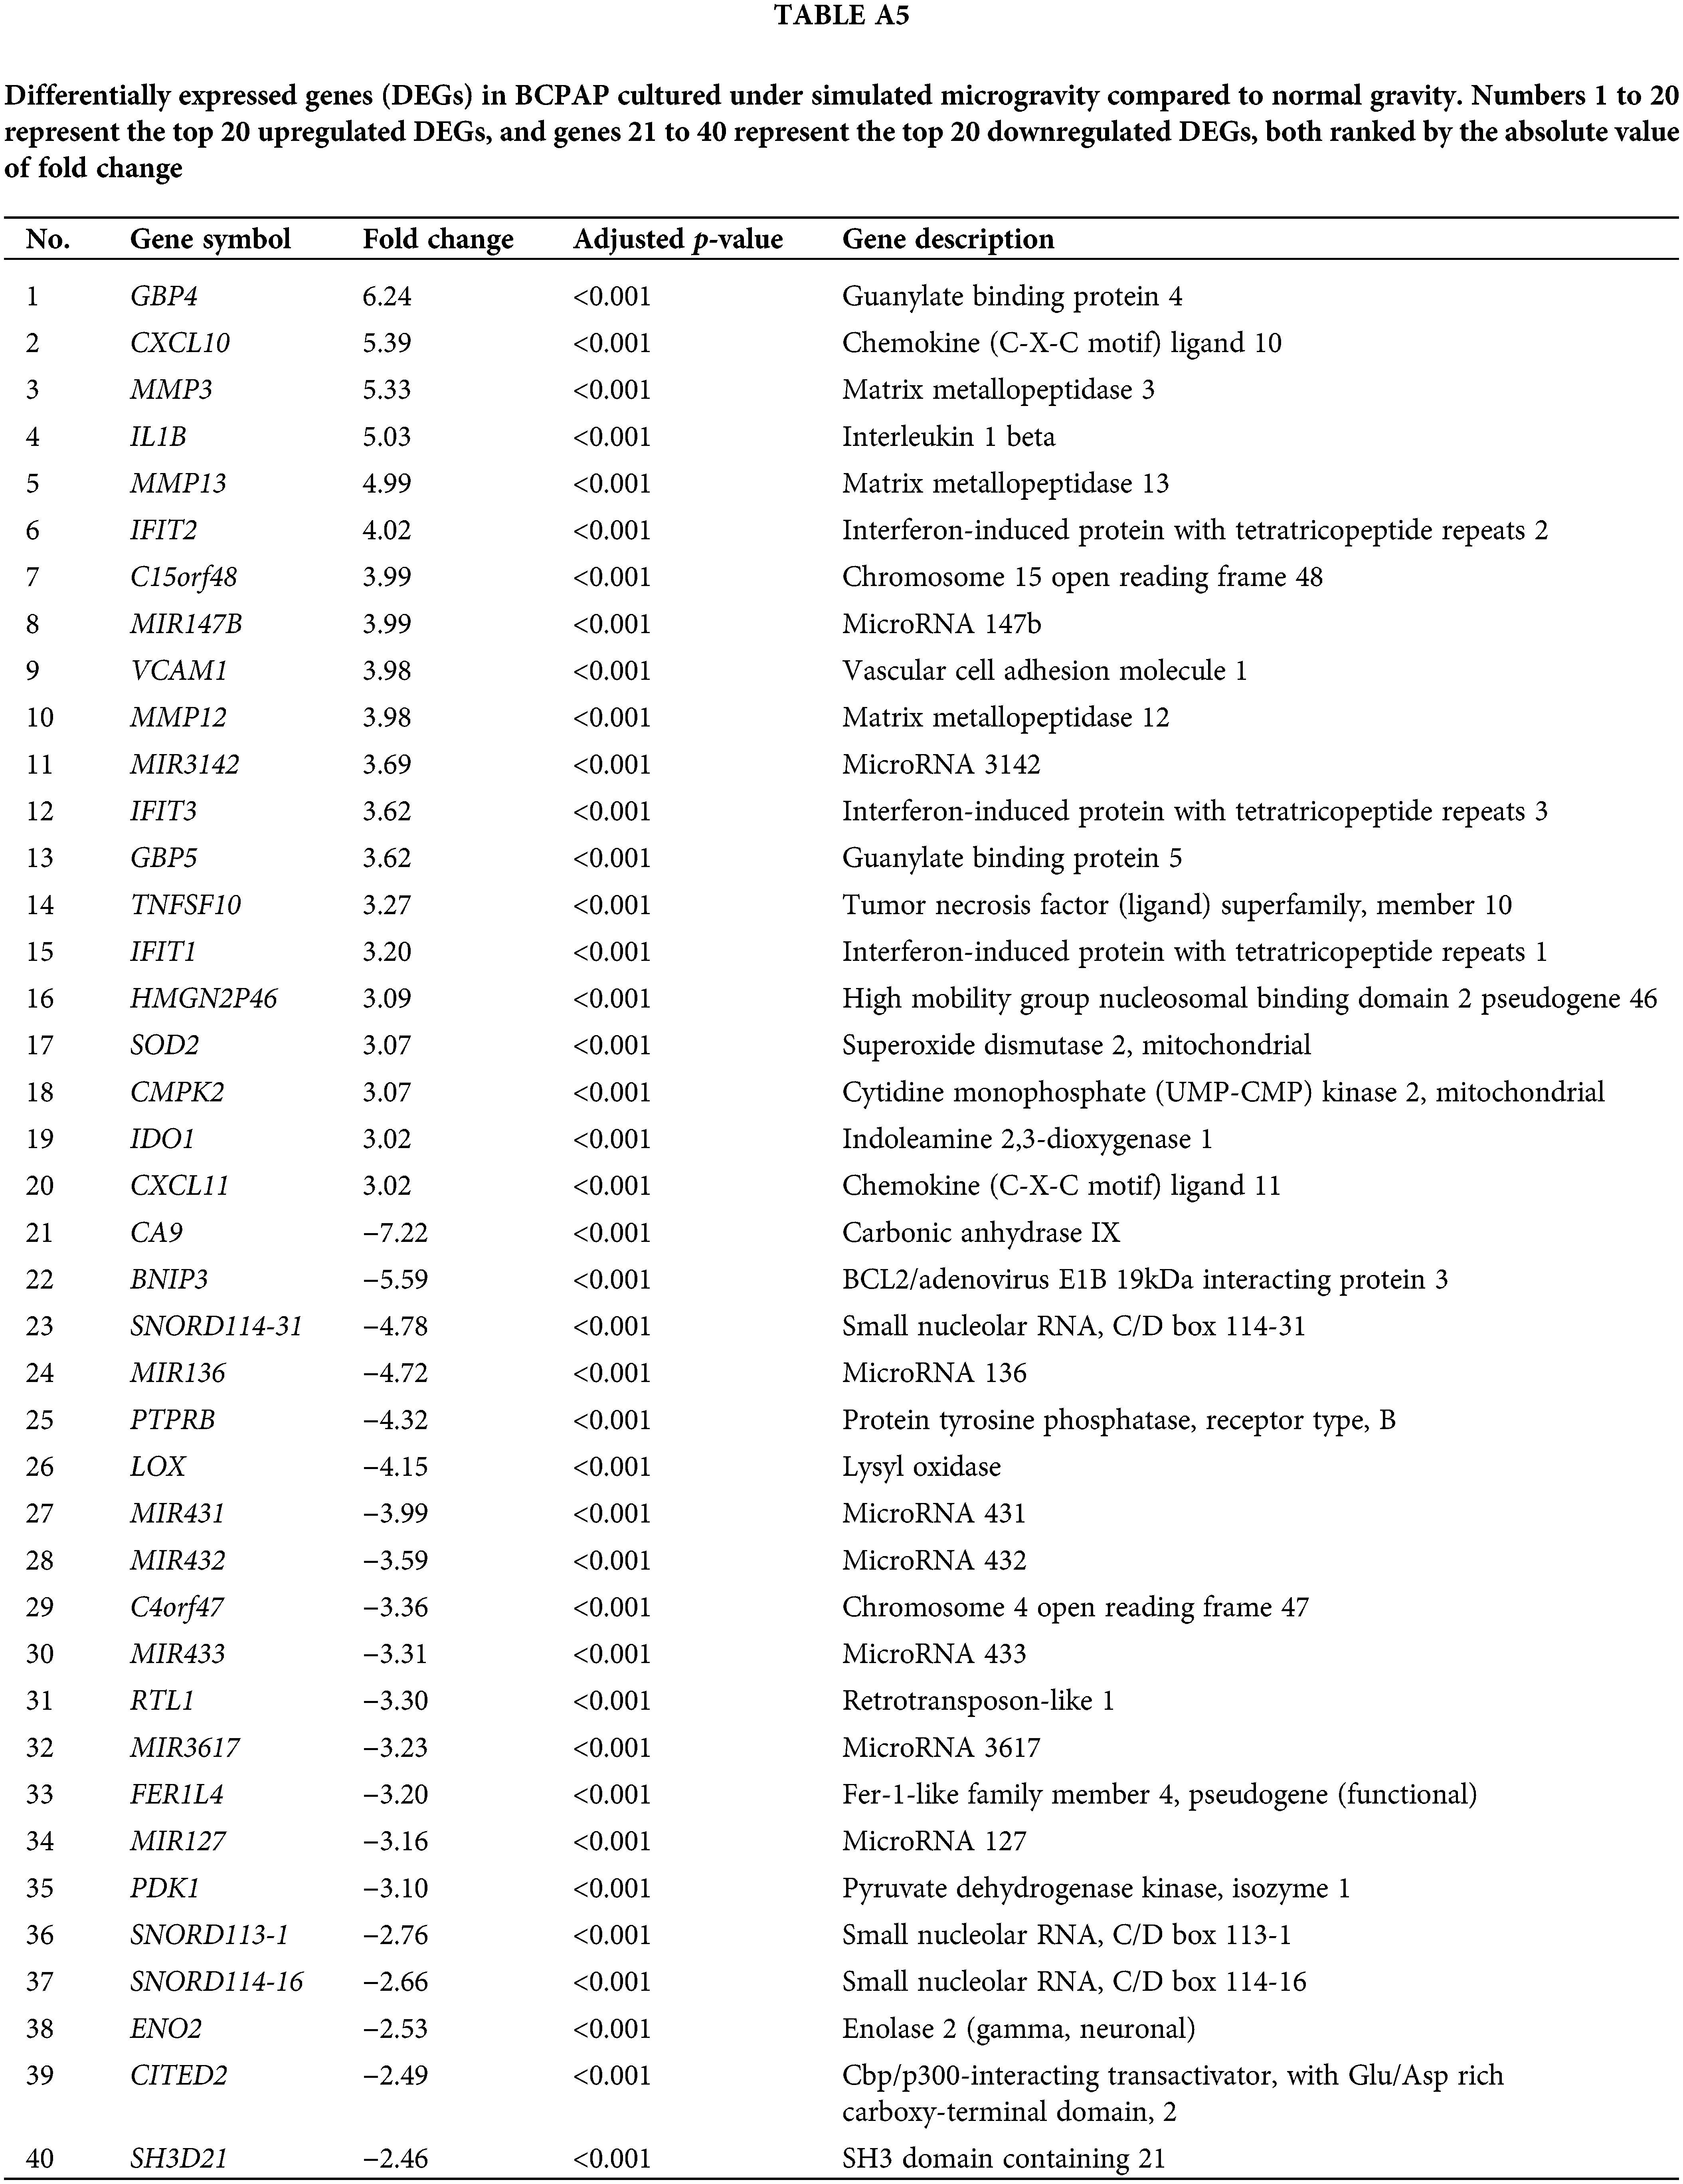
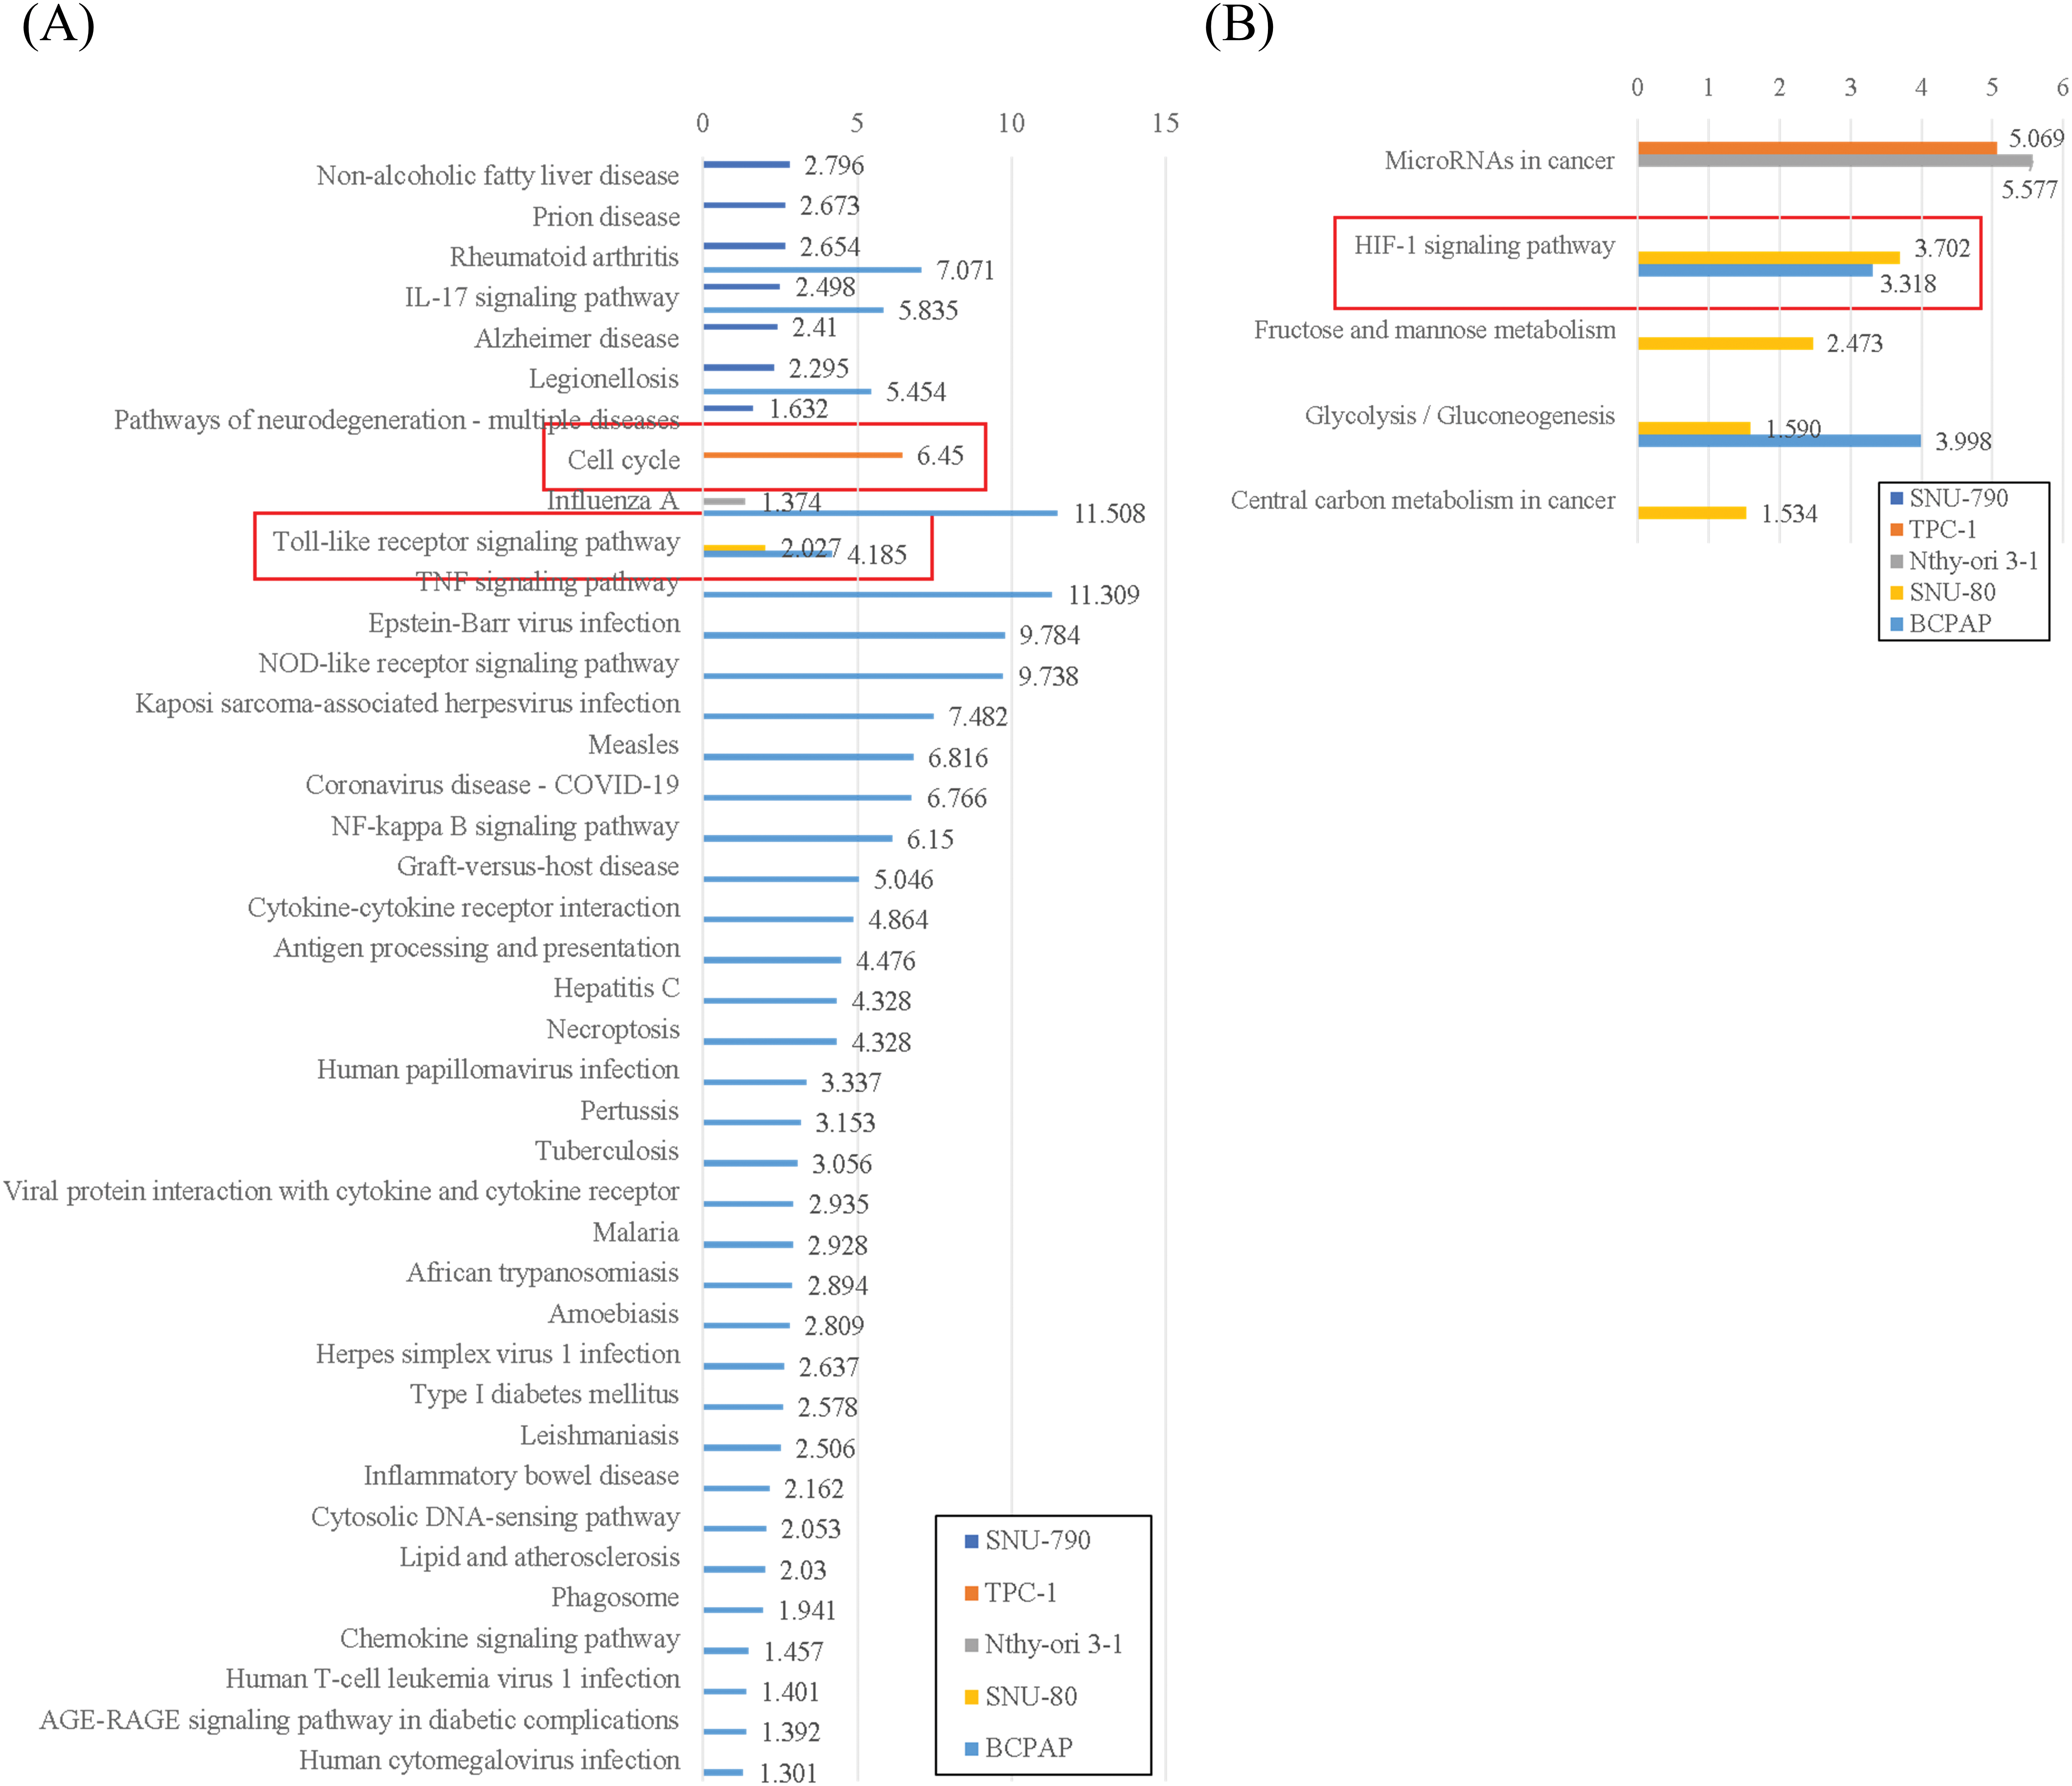
Figure A1: KEGG enrichment analysis of differentially expressed genes in five thyroid-related cell lines cultured under microgravity compared to normal gravity. (A) KEGG enrichment analysis of upregulated differentially expressed genes. (B) KEGG enrichment analysis of down-regulated differentially expressed genes. All results are negative values of log10 of adjusted p-value. The red box shows the significant findings of the study
Cite This Article
 Copyright © 2025 The Author(s). Published by Tech Science Press.
This work is licensed under a Creative Commons Attribution 4.0 International License , which permits unrestricted use, distribution, and reproduction in any medium, provided the original work is properly cited.
 Downloads
 Citation Tools