
 Submit a Paper
 Propose a Special lssue
 Open Access
ARTICLE
S100A14 Facilitates Pancreatic Cancer Progression via S100A16-Mediated p53 Suppression
1 Department of Hepatopancreatobiliary Surgery, The First People’s Hospital of Yunnan Province, Kunming, 650032, China
2 Department of Hepatopancreatobiliary Surgery, The Affiliated Hospital of Kunming University of Science and Technology, Kunming, 650032, China
* Corresponding Author: Yun Jin. Email:
# These authors contributed equally to this work
(This article belongs to the Special Issue: Advances in Cancer Therapeutics)
Oncology Research 2026, 34(3), 24 https://doi.org/10.32604/or.2025.070207
Received 10 July 2025; Accepted 05 December 2025; Issue published 24 February 2026
 View Full Text
 Download PDF
Abstract
Objectives: Pancreatic cancer (PC) is characterized by poor prognosis due to its limited treatment choices and delayed detection. S100A14 has been implicated in tumor progression, yet its regulatory hierarchy and functional interplay in PC remain unclear. This study aimed to define the role of S100A14 in PC progression. Methods: Integrated bioinformatic analyses of TCGA-PAAD and GSE22780 datasets identified candidate hub genes. Prognostic relevance was assessed via Kaplan-Meier and ROC analyses. Functional experiments were performed in PANC-1 and BxPC-3 cells, including qRT-PCR, CCK-8 assay, Western blotting, Transwell assay, and apoptosis assay. Co-immunoprecipitation (Co-IP) was used to verify S100A14–S100A16 interaction. CHX chase and dual-luciferase assays were employed to assess protein stability and transcriptional activity. Results: S100A14 was markedly upregulated in PC tissues and cell lines and identified as a key prognostic gene. Silencing S100A14 suppressed EMT, proliferation, invasion, and migration, while reversing S100A16-mediated p53 inhibition and enhancing apoptosis. Mechanistically, Co-IP assay confirmed the protein interaction between S100A14 and S100A16; S100A14 stabilized S100A16 protein through post-translational modification without transcriptional regulation; the S100A14/S100A16 axis reduced p53 protein stability and inhibited its transcriptional activity as well as the downstream p21 expression. Critically, knockdown of S100A14 abrogated the pro-metastatic phenotype of cancer cells. Conclusion: This study identifies S100A14 promotes PC progression by stabilizing S100A16 and suppressing the tumor-suppressive p53/p21 pathway; knockdown of S100A14 can reverse the above effects, restore p53 function, and enhance cancer cell apoptosis. Targeting the S100A14/S100A16/p53 regulatory axis could represent a promising therapeutic approach for PC.Keywords
Pancreatic cancer (PC) is among the most deadly cancers, characterized by a steadily increasing incidence and mortality worldwide [1]. Notably, over 90% of PC cases are pancreatic ductal adenocarcinoma (PDAC), a highly aggressive subtype that drives the majority of its poor prognosis [2]. Epidemiological studies predict that over the next decade, the age-standardized mortality rate (ASMR) for PC will continue to rise significantly. By 2050, the global incidence is expected to reach 18.6 cases per 100,000 individuals [3]. Multiple risk factors contribute to the development of PC, including chronic pancreatitis, smoking, obesity, diabetes mellitus, and genetic predispositions [4,5]. Despite advances in surgical techniques, chemotherapy, and radiotherapy, the overall prognosis remains dismal due to the typically late-stage diagnosis and high metastatic potential [6]. Only approximately 12% of patients achieve a five-year survival, underscoring the limited survival benefits of current therapeutic strategies. The above issues show how urgently improved early detection techniques are needed to enhance therapeutic results.
S100A14, a calcium-binding protein that belongs to the S100 protein family, has been implicated in diverse roles across various cancer types [7]. This protein is known to modulate key signaling pathways such as EGFR, MAPK/ERK, tumor suppressor p53, and NF-κB [8]. S100A14 plays a key role in a predictive model for PC based on seven immune-related genes, according to a new investigation. Its high expression is associated with higher M0 macrophage presence and lower CD8+ T cell infiltration [9]. Zhu et al. demonstrated that S100A14 is overexpressed in PC, promoting tumor proliferation, migration, invasion, and chemoresistance, with elevated levels associated with advanced tumor stage and poor prognosis [10]. A previous study reported high expression levels of S100A14 and S100A16 in tumor tissues of breast cancer patients, suggesting that these proteins may promote breast cancer invasion by modulating the cytoskeleton [11]. Additionally, according to Tu et al., S100A16 is upregulated in PC tissues and linked to poor patient outcomes, as well as immune cell infiltration, supported by a prognostic scoring system incorporating S100A16 [12]. These findings underscore the importance of recognizing the molecular processes of S100A14 and S100A16 concerning PC, which may provide novel therapeutic targets.
Although several S100 proteins have been implicated in tumor progression, the regulatory hierarchy and mechanistic interplay among them in PC remain poorly defined. In particular, how specific S100 family members influence key tumor suppressors such as p53 is not fully understood. Previous studies suggest diverse interactions between S100 proteins and p53, yet the upstream modulators and post-translational mechanisms governing this axis are largely unexplored.
This study aims to delineate the S100A14/S100A16/p53 regulatory cascade, with an emphasis on post-translational control and functional consequences for cellular proliferation, invasion, and epithelial–mesenchymal transition (EMT). By elucidating this axis, we seek to uncover novel therapeutic targets that may restore p53 function and constrain the aggressive phenotype of PC.
2.1 Differential Expression Analysis and Overlapping Differentially Expressed Genes (DEGs) Identification
In this study, the Cancer Genome Atlas (TCGA)-Pancreatic adenocarcinoma (PAAD) dataset was downloaded from the ASSISTANT for Clinical Bioinformatics (https://www.aclbi.com), which included 179 tumor samples and 4 adjacent normal tissue samples. The GSE22780 dataset, comprising 8 PC samples and 8 normal pancreatic samples, was retrieved from the Gene Expression Omnibus (GEO, https://www.ncbi.nlm.nih.gov/gds/) database. Differential gene expression analysis between tumor and normal tissues was conducted independently for both datasets using the “limma” package in R software (version 4.2.0), this package is commonly used for differential expression analysis of microarray and RNA-seq data and can efficiently identify differentially expressed genes based on linear models. Only the log2 transformation was applied, as the GEO microarray data were already normalized by the original study. Genes with p < 0.05 and |log2FC| ≥ 0.38 (corresponding to fold change (FC) > 1.3 for upregulation or FC < 0.77) were considered differentially expressed, and no additional multiple-testing or batch-effect correction was applied, consistent with the exploratory nature of the analysis. The Bioinformatics & Evolutionary Genomics tool (https://bioinformatics.psb.ugent.be/webtools/Venn/) was utilized to perform Venn diagram analysis in order to find overlapping upregulated and downregulated DEGs between the GSE22780 and TCGA-PAAD datasets.
2.2 Protein-Protein Interaction (PPI) Network Construction and Hub Gene Identification
The STRING database (https://string-db.org/, version 12.0) was utilized to build a PPI network in order to investigate possible functional relationships between the overlapping upregulated and downregulated DEGs. The minimum required interaction score was set to 0.40 (medium confidence), as recommended by the STRING Consortium (ELIXIR core data resource, Switzerland). For additional investigation, the generated PPI network was loaded into the Cytoscape program (version 3.10.2; Cytoscape Consortium, San Diego, CA, USA). The cytoHubba plugin (version 0.1) was utilized to identify important hub genes, which ranks nodes based on network topology. Two independent algorithms, Maximum Clique Centrality (MCC) and EcCentricity, were employed to ensure the robustness of candidate hub gene selection. The ten genes that each algorithm evaluated highest were taken out and subjected to topological analysis to screen for candidate hub genes.
2.3 Prognostic Analysis and Receiver Operating Characteristic (ROC) Curve Evaluation
Utilizing Kaplan-Meier survival analysis and the Kaplan-Meier Plotter online tool (https://kmplot.com/analysis/), the prognostic significance of hub genes was evaluated. Overall survival (OS) information and gene expression data were obtained from the TCGA-PAAD cohort. Based on each gene’s median expression level, patients were divided into groups with high and low expression. The period of time between diagnosis and death from any cause was referred to as OS. To determine statistical significance, log-rank p-values and hazard ratios (HR) with 95% confidence interval (CI) were computed. To analyze the ROC curve, the R package “timeROC” was used to evaluate the predictive performance of each candidate gene. Area under the curve (AUC) values at 1-, 3-, and 5-year OS were calculated to compare the prognostic accuracy across genes.
2.4 Gene Expression Validation of Hub Genes
The Assistant for Clinical Bioinformatics (https://www.aclbi.com) provided the TCGA-PAAD dataset, which was utilized to analyze the expression levels of candidate hub genes in tumor and normal tissues. For consistency, we also evaluated candidate hub genes expression in the GSE22780 dataset. For both datasets, we analyzed gene expression levels using TPM normalization and assessed statistical differences between tumor and normal tissues using the Wilcoxon rank-sum test. Results are presented as boxplots generated using the Sangerbox platform (version 3.0, http://vip.sangerbox.com/home.html).
2.5 Cell Lines and Culture Conditions
Biovector NTCC (Beijing, China, http://www.biovector.net/) provided the human pancreatic ductal epithelial cell line HPDE6-C7, which was cultivated in MEM (Gibco, Thermo Fisher Scientific, Inc., Waltham, MA, USA; 11095080) with 10% FBS (Gibco, 10099141) added. We bought human PC cell lines from Procell (Wuhan, China, https://www.procell.com.cn/category/cytokines), which included Capan-1 (CL-0708), Capan-2 (CL-0709), PANC-1 (CL-0184), MiaPaca-2 (CL-0627), and BxPC-3 (CL-0042). All cell lines were authenticated using short tandem repeat (STR) profiling and confirmed to be free of mycoplasma contamination. The RPMI-1640 medium (Gibco, 31800022) supplemented with 10% FBS (Gibco, 10099141) and 1% penicillin-streptomycin (P/S; Gibco, 15140122) was used to cultivate all cancer cell lines. Every cell was kept in a humidified incubator with 5% CO2 at 37°C.
2.6 Cell Transfection and Treatment
PANC-1 and BxPC-3 cells were cultivated until they reached 70%–80% confluency after being seeded onto 6-well plates at a density of 5 × 10⁵ cells/well. Following the manufacturer’s instructions, Lipofectamine™ 2000 (Invitrogen, Thermo Fisher Scientific, Inc., Waltham, MA, USA; 11668019) was utilized for transfection. For knockdown experiments, 50 nM negative control siRNA (si-NC) or specific small interfering RNAs (siRNAs) targeting S100A14 (si-S100A14-1 and si-S100A14-2) were transfected into cells using 10 μL of Lipofectamine™ 2000 per well. The siRNA sequences were as follows: si-S100A14-1 forward, 5′-CCCAUCUCAUGCCGAGCAACU-3′, and reverse, 5′-AGUUGCUCGGCAUGAGAUGGG-3′; si-S100A14-2 forward, 5′-CCUCAUCAAGAACUUUCACCA-3′, and reverse, 5′-UGGUGAAAGUUCUUGAUGAGG-3′; and si-NC forward, 5′-UUCUCCGAACGUGUCACGU-3′, and reverse, 5′-ACGUGACACGUUCGGAGAATT-3′. For overexpression experiments, cells were transfected with 2 μg S100A14 overexpression vector, S100A16 overexpression vector, or empty vector (negative control). Cells were collected at 24 h post-transfection for subsequent analyses. Following transfection, cycloheximide (CHX, Sigma-Aldrich, St. Louis, MO, USA; C4859) at a concentration of 20 μg/mL to inhibit protein synthesis was administered to the cells. Cells were collected at the indicated time points (0, 30, 60, 90, and 120 min) post-CHX treatment for protein stability analysis.
2.7 Quantitative Real-Time PCR (qRT-PCR)
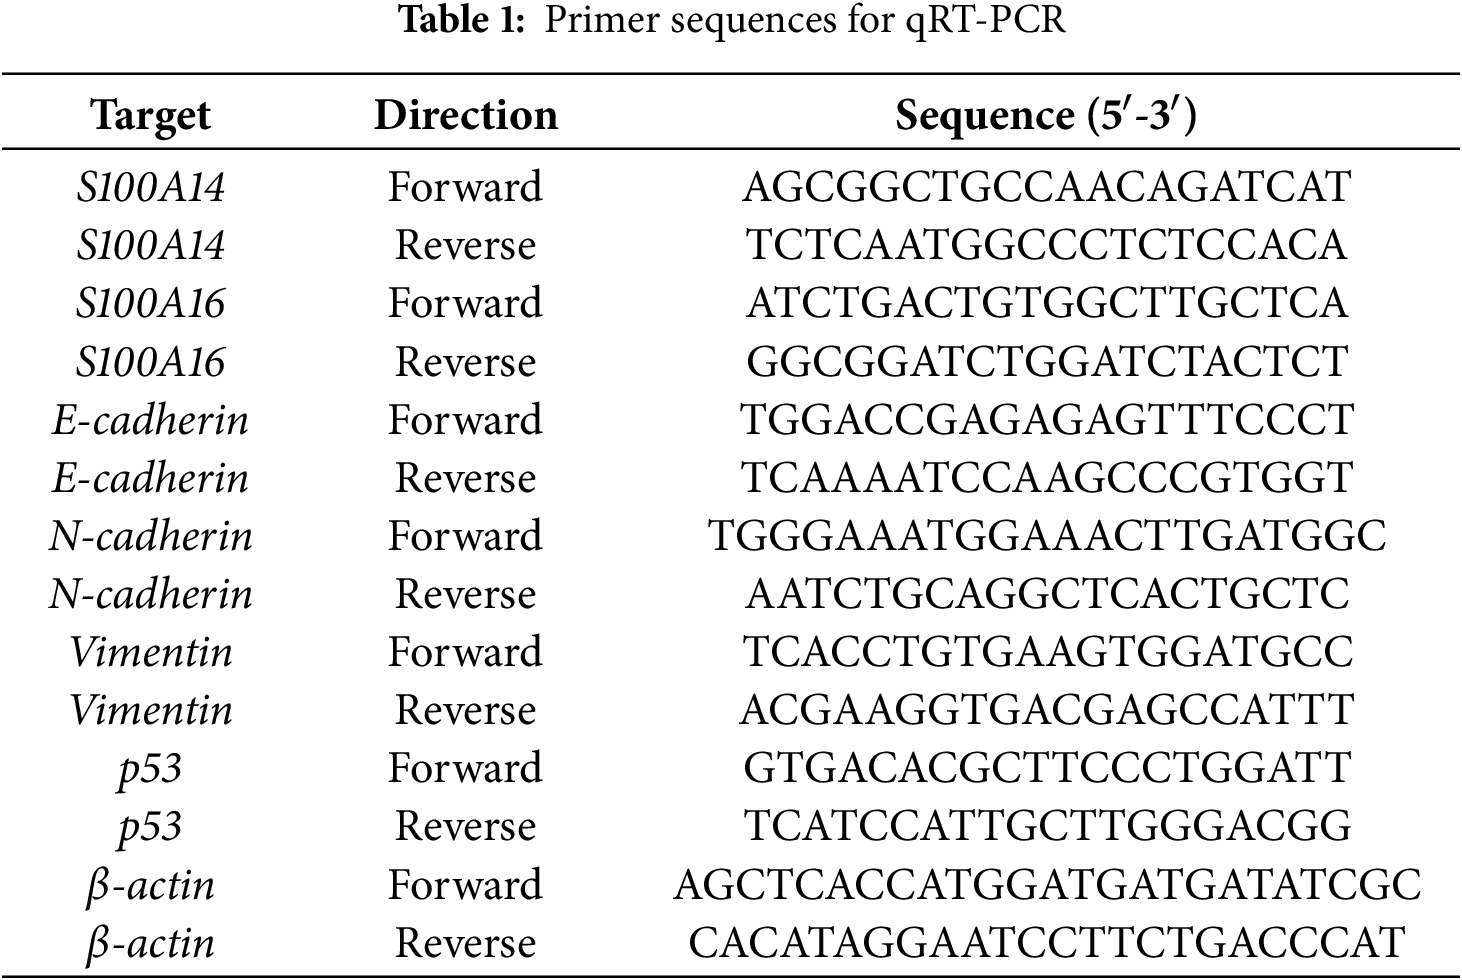
The TRIzol reagent (Tiangen, China; DP405) was applied to extract total RNA from cells in accordance with the manufacturer’s instructions. For cDNA synthesis, 1 μg of total RNA was reverse-transcribed using the PrimeScript RT Reagent Kit (Takara, Shiga, Japan; RR037A) in a 20 μL reaction system. qRT-PCR was performed utilizing a StepOnePlus Real-Time PCR System (Thermo Fisher Scientific, Inc., Waltham, MA, USA) with the SYBR Green PCR Master Mix (Vazyme, Nanjing, China). Each qPCR reaction was carried out in a 10 μL volume containing 5 μL SYBR Green Master Mix, 0.4 μL forward primer, 0.4 μL reverse primer, 1 μL cDNA template, and 3.2 μL nuclease-free water. The thermocycling procedure was as follows: 95°C for 30 s, followed by 40 cycles of 95°C for 10 s and 60°C for 30 s. Utilizing β-actin as the internal control, the 2−ΔΔCt technique was utilized to quantify relative gene expression [13]. Table 1 contains primer sequences.
2.8 Western Blot (WB) Analysis
Protease and phosphatase inhibitor cocktails made of ice-cold RIPA buffer (Beyotime, Shanghai, China; P0013B) were utilized to lyse the cells. The BCA Protein Assay Kit (Beyotime, P0010) was applied to measure the protein concentrations. Proteins in equal quantities (20–30 μg per lane) were separated on 10% SDS-PAGE gels and then transferred utilizing a wet transfer technique (Bio-Rad) to PVDF membranes (Immobilon-P, Millipore, Billerica, MA, USA; IPVH00010). Membranes were blocked with 5% non-fat milk in Tris-buffered saline containing 0.1% Tween-20 (TBST) for 1 h at room temperature. Subsequently, membranes were incubated overnight at 4°C with the following primary antibodies diluted in 5% BSA/TBST: S100A14 (1:2000, ab233189), S100A16 (1:1000, ab240572), E-cadherin (1:1000, ab314063), N-cadherin (1:1000, ab245117), Vimentin (1:2000, ab92547), p53 (1:1000, ab26), p21 (1:1000, ab109199), β-actin (1:1000, ab8227) were primary antibodies (all purchased from Abcam, Cambridge, UK) diluted in 5% BSA/TBST were utilized to block the membranes for one hour at room temperature utilizing 5% non-fat milk in Tris-buffered saline with 0.1% Tween-20 (TBST) for an overnight incubation at 4°C. Membranes were then incubated with HRP-conjugated secondary antibodies (goat anti-rabbit, 1:2000, ab6721, Abcam) for one hour at room temperature following three rounds of TBST washing. Protein bands were seen employing an ECL detection method (Beyotime, P0018S). ImageJ software (version 2.0.0; National Institutes of Health, Bethesda, MD, USA) was utilized to take and analyze the images.
Cell proliferation was measured using Cell Counting Kit-8 (CCK-8, Dojindo, Kumamoto, Japan; CK04). Transfected cells were seeded into 96-well plates at a density of 5 × 10³ cells per well in 100 μL of complete medium. At 0, 12, 24, 48, and 72 h, each well received 10 μL of CCK-8 reagent, which was then incubated for 2 h. A Multiskan FC microplate reader (Thermo Fisher Scientific, Inc., Waltham, MA, USA) was employed to detect absorbance at 450 nm.
Transwell assays were applied to assess the ability of cells to invade and migrate. The upper chambers of Transwell inserts (8-μm pore size; Corning Costar, Corning, NY, USA) were filled with 5 × 10⁴ PANC-1 or BxPC-3 cells suspensions in serum-free media for the migration test, while the lower chambers contained 500 μL of serum-containing medium. The cells that remained in the upper chamber after 48 h of incubation at 37°C and did not migrate or invade were carefully removed utilizing a cotton swab. To see the nuclei, the cells on the membrane’s underside were fixed with 4% paraformaldehyde and labeled with DAPI (Beyotime, C1006). The stained cells were then counted and photographed in 5 randomly selected fields under an IX71 inverted microscope (Olympus, Tokyo, Japan; ×200). Prior to cell seeding, a basement membrane matrix (Matrigel; Corning, NY, USA; 354234; diluted 1:8 in serum-free medium) was applied to the Transwell inserts for the invasion experiment, and subsequent procedures were conducted similarly to the migration assay. Two types of experimental groups were included: (1) siRNA knockdown groups (si-NC, si-S100A14-1, si-S100A14-2); (2) overexpression + siRNA rescue groups (vector + si-NC, over-S100A16 + si-NC, over-S100A16 + si-S100A14-1).
2.11 Dual-Luciferase Reporter Assay
The luciferase assay was carried out in compliance with the guidelines provided by the manufacturer (Cignal p53 Reporter Assay Kit, SABiosciences, Frederick, MD, USA; CCS-004L). For assessing p53 transcriptional activity, pcDNA3.1-S100A16 overexpressing plasmid–transfected cells (constructed by GeneChem, Shanghai, China) andtheir corresponding empty pcDNA3.1 vector controls, and/or S100A14-knockdown cells were plated at a density of 1 × 10⁵ cells per well in 12-well plates. By applying Lipofectamine 2000, these cells were transfected with a Renilla luciferase control plasmid and a p53-responsive firefly luciferase reporter plasmid (SABiosciences, Frederick, MD, USA). The transfection medium was swapped out for new complete media after 16 h. Luciferase activity was measured 72 h post-transfection following the aforementioned procedure using the Dual-Luciferase® Reporter Assay System on a GloMax 20/20 luminometer (Promega, Madison, WI, USA), and firefly luciferase activity was normalized to Renilla luciferase activity.
2.12 Co-Immunoprecipitation (Co-IP) Assay
Cell lysates of PANC-1 and BxPC3 cells were prepared using lysis buffer supplemented with protease inhibitors. The protein concentration was determined with a BCA protein assay kit. For each Co-IP reaction, 200 μg of total protein was pre-incubated with Protein A/G PLUS-agarose beads (Santa Cruz Biotechnology, Dallas, TX, USA) at 4°C for 1 h with gentle rotation. The pre-incubated lysates were then incubated overnight at 4°C with gentle rotation in the presence of 2 μg of anti-S100A14 antibody (ab233189, Abcam) and 2 μg anti-S100A16 antibody (ab240572, Abcam). In parallel, normal rabbit IgG (Abcam, ab172730) was used as an IgG isotype negative control (IP:IgG) to confirm the specificity of the immunoprecipitation. After adding Protein A/G PLUS-agarose beads to the lysates, the mixture was further incubated at 4°C for 2 h. Following three washes with ice-cold lysis buffer, the beads were boiled in 2× SDS-PAGE loading buffer to elute the bound proteins. The eluted proteins were separated by SDS-PAGE and analyzed by WB using specific antibodies against S100A14, S100A16, and p53.
PANC-1 cells were separated using trypsin-EDTA (Life Technologies, Beijing, China) for flow cytometry analysis and then cleaned with PBS. As directed by the manufacturer, cell apoptosis was detected using an Annexin V-FITC/PI Apoptosis Detection Kit (Beyotime, C1062M). Briefly, approximately 1 × 10⁵ cells were resuspended in binding buffer and incubated with Annexin V-FITC and propidium iodide (PI) for 15 min at room temperature in the dark, and dual staining channels (FITC and PI) were collected to distinguish between live, apoptotic, and necrotic cells. A CyFlow Cube 8 flow cytometer (Sysmex Partec GmbH, Görlitz, Germany) was used for the flow cytometry, and FlowJo software (version 10.8.1; FlowJo, LLC, Ashland, OR, USA) was used for data analysis to calculate the cell apoptosis rate.
Utilizing the R language program (version 4.0.3), the statistical analysis was conducted. The data are shown as mean ± standard deviation (SD), with each experiment being conducted three times. The student’s t-test was used for comparisons between two groups, with this t-test was used for continuous values and to compare the means between the two groups. Tukey’s post hoc tests were utilized after a one-way ANOVA for comparisons involving several groups. Statistical significance was defined as a p-value of less than 0.05.
3.1 Analysis of DEGs and Candidate Hub Genes Screening in PC-Related Datasets
The TCGA-PAAD dataset yielded a total of 1456 downregulated and 488 upregulated DEGs (Fig. 1A), identified using the same criteria described in the Methods section (p < 0.05 and |log2FC| ≥ 0.38, corresponding to FC > 1.3 or FC < 0.77). In parallel, analysis of the GSE22780 dataset, using the identical thresholds, yielded 462 upregulated and 591 downregulated DEGs (Fig. 1B). Comparative analysis identified 84 overlapping upregulated DEGs and 67 overlapping downregulated DEGs between the two datasets (Fig. 1C). A PPI network was built in order to investigate the significance of these overlapping DEGs in more detail. Based on network connection measures, the top 10 hub genes were determined using the MCC and EcCentricity algorithms (Fig. 1D,E). As shown in Fig. 1F, subsequent topological analysis of the two algorithm-derived gene sets revealed six candidate hub genes (MUC5AC, TFF1, AGR2, S100A14, CEACAM6, MUC13).
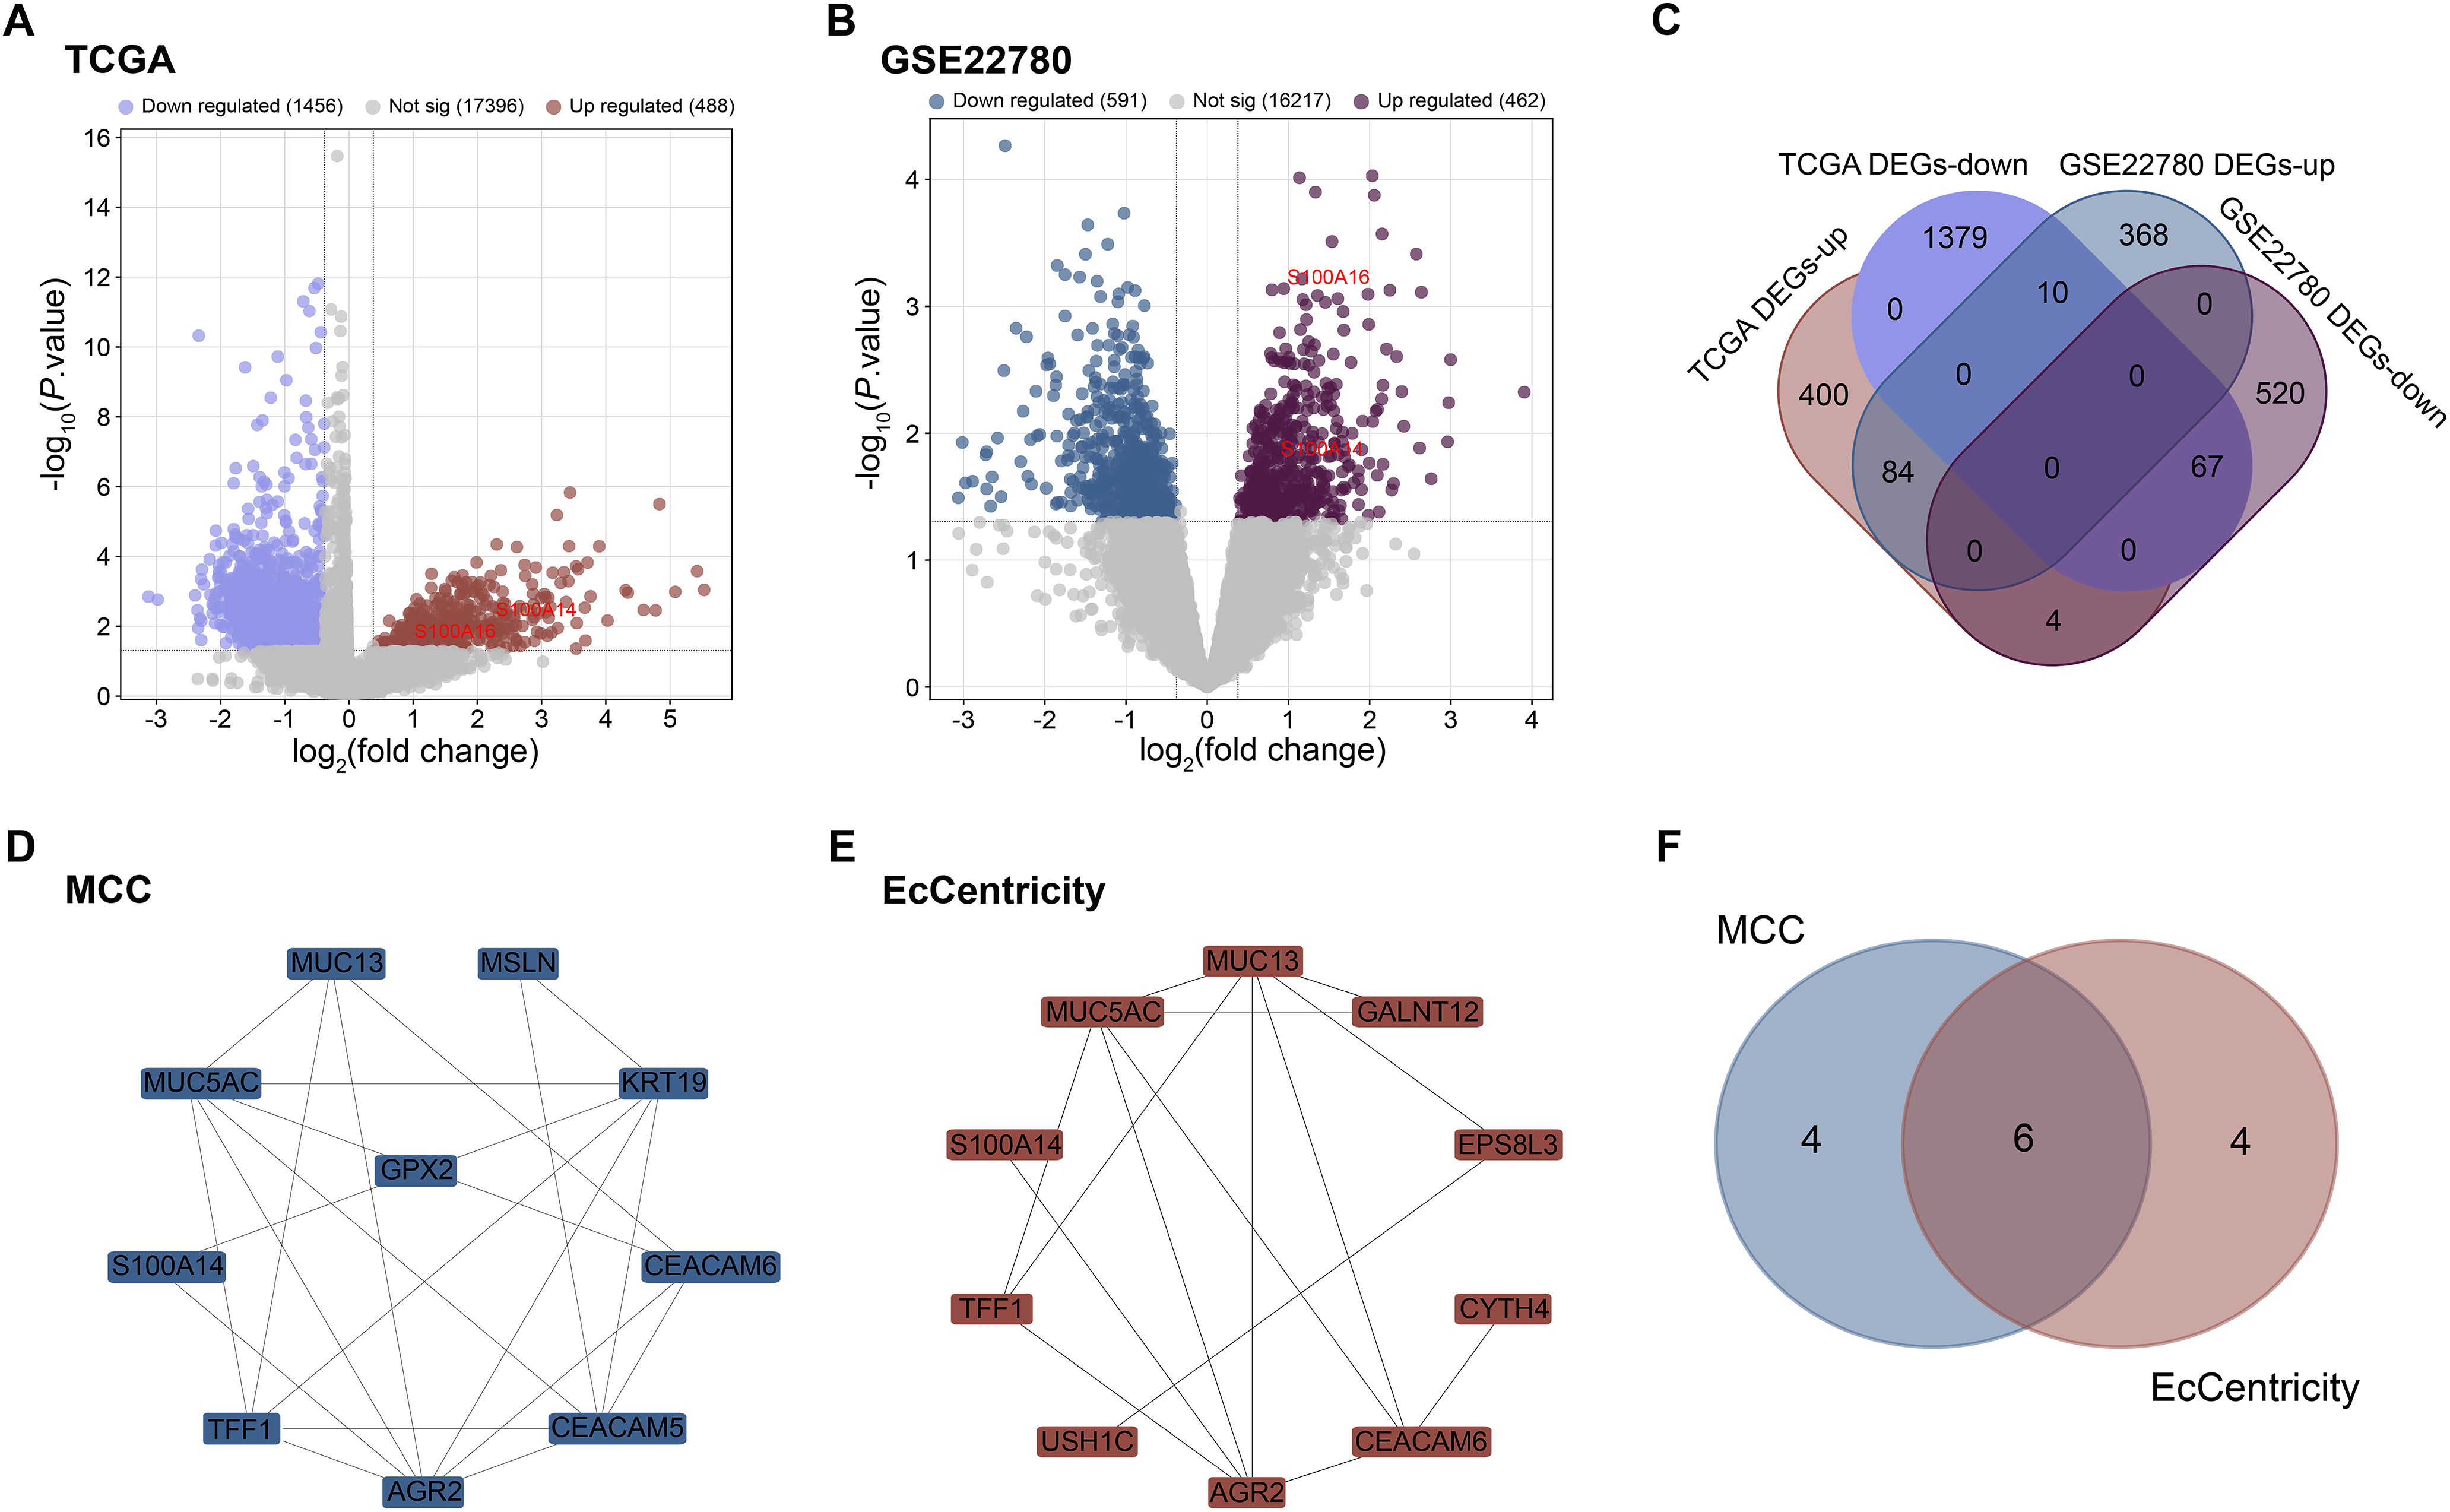
Figure 1: Identification of differentially expressed genes and hub genes in pancreatic cancer. (A) Volcano plot displaying DEGs from TCGA-PAAD dataset. Red dots represent significantly upregulated genes, blue dots indicate significantly downregulated genes. (B) Volcano plot showing DEGs from the GSE22780 dataset. Purple dots represent significantly upregulated genes, dark blue dots indicate significantly downregulated genes. (C) Venn diagram illustrating the number of overlapping upregulated and downregulated DEGs between TCGA-PAAD and GSE22780 datasets. (D) PPI network of DEGs with top 10 hub genes identified using the MCC. (E) PPI network showing top 10 hub genes identified by the EcCentricity algorithm. (F) Venn diagram depicting the intersection of hub genes derived from MCC and EcCentricity analyses. DEGs: Differentially Expressed Gene; PPI: Protein-Protein Interaction; TCGA-PAAD: The Cancer Genome Atlas-Pancreatic Adenocarcinoma; MCC: Maximal Clique Centrality
3.2 Prognostic Evaluation and Expression Analysis of S100A14 as a Hub Gene in PC
Survival analysis of the six candidate hub genes revealed that only MUC5AC (Log-rank p = 0.00797) and S100A14 (Log-rank p = 0.00693) exhibited statistically significant associations with OS. Subgroup stratification analysis further demonstrated that high-risk patients groups stratified by MUC5AC and S100A14 expression levels showed significantly shortened OS compared to their low-risk counterparts (Fig. 2A,B). ROC curve analysis comparing the predictive efficacy of MUC5AC and S100A14 revealed that S100A14 demonstrated a significantly higher area under the curve (AUC = 0.859), indicating superior discriminative power for outcome prediction (Fig. 2C). Based on these findings, S100A14 was selected as the hub gene for further investigation. In addition to S100A14, the remaining five candidate hub genes (AGR2, CEACAM6, MUC13, MUC5AC, and TFF1) also underwent expression validation. As shown in Fig. A1A,B, all five genes displayed significantly elevated expression in pancreatic tumor tissues compared with normal pancreatic tissues in both the TCGA-PAAD and GSE22780 datasets, supporting their potential involvement in pancreatic cancer pathogenesis. Finally, expression analysis of S100A14 in the TCGA-PAAD and GSE22780 datasets showed upregulation in tumor tissues compared to normal controls (Fig. 2D,E).
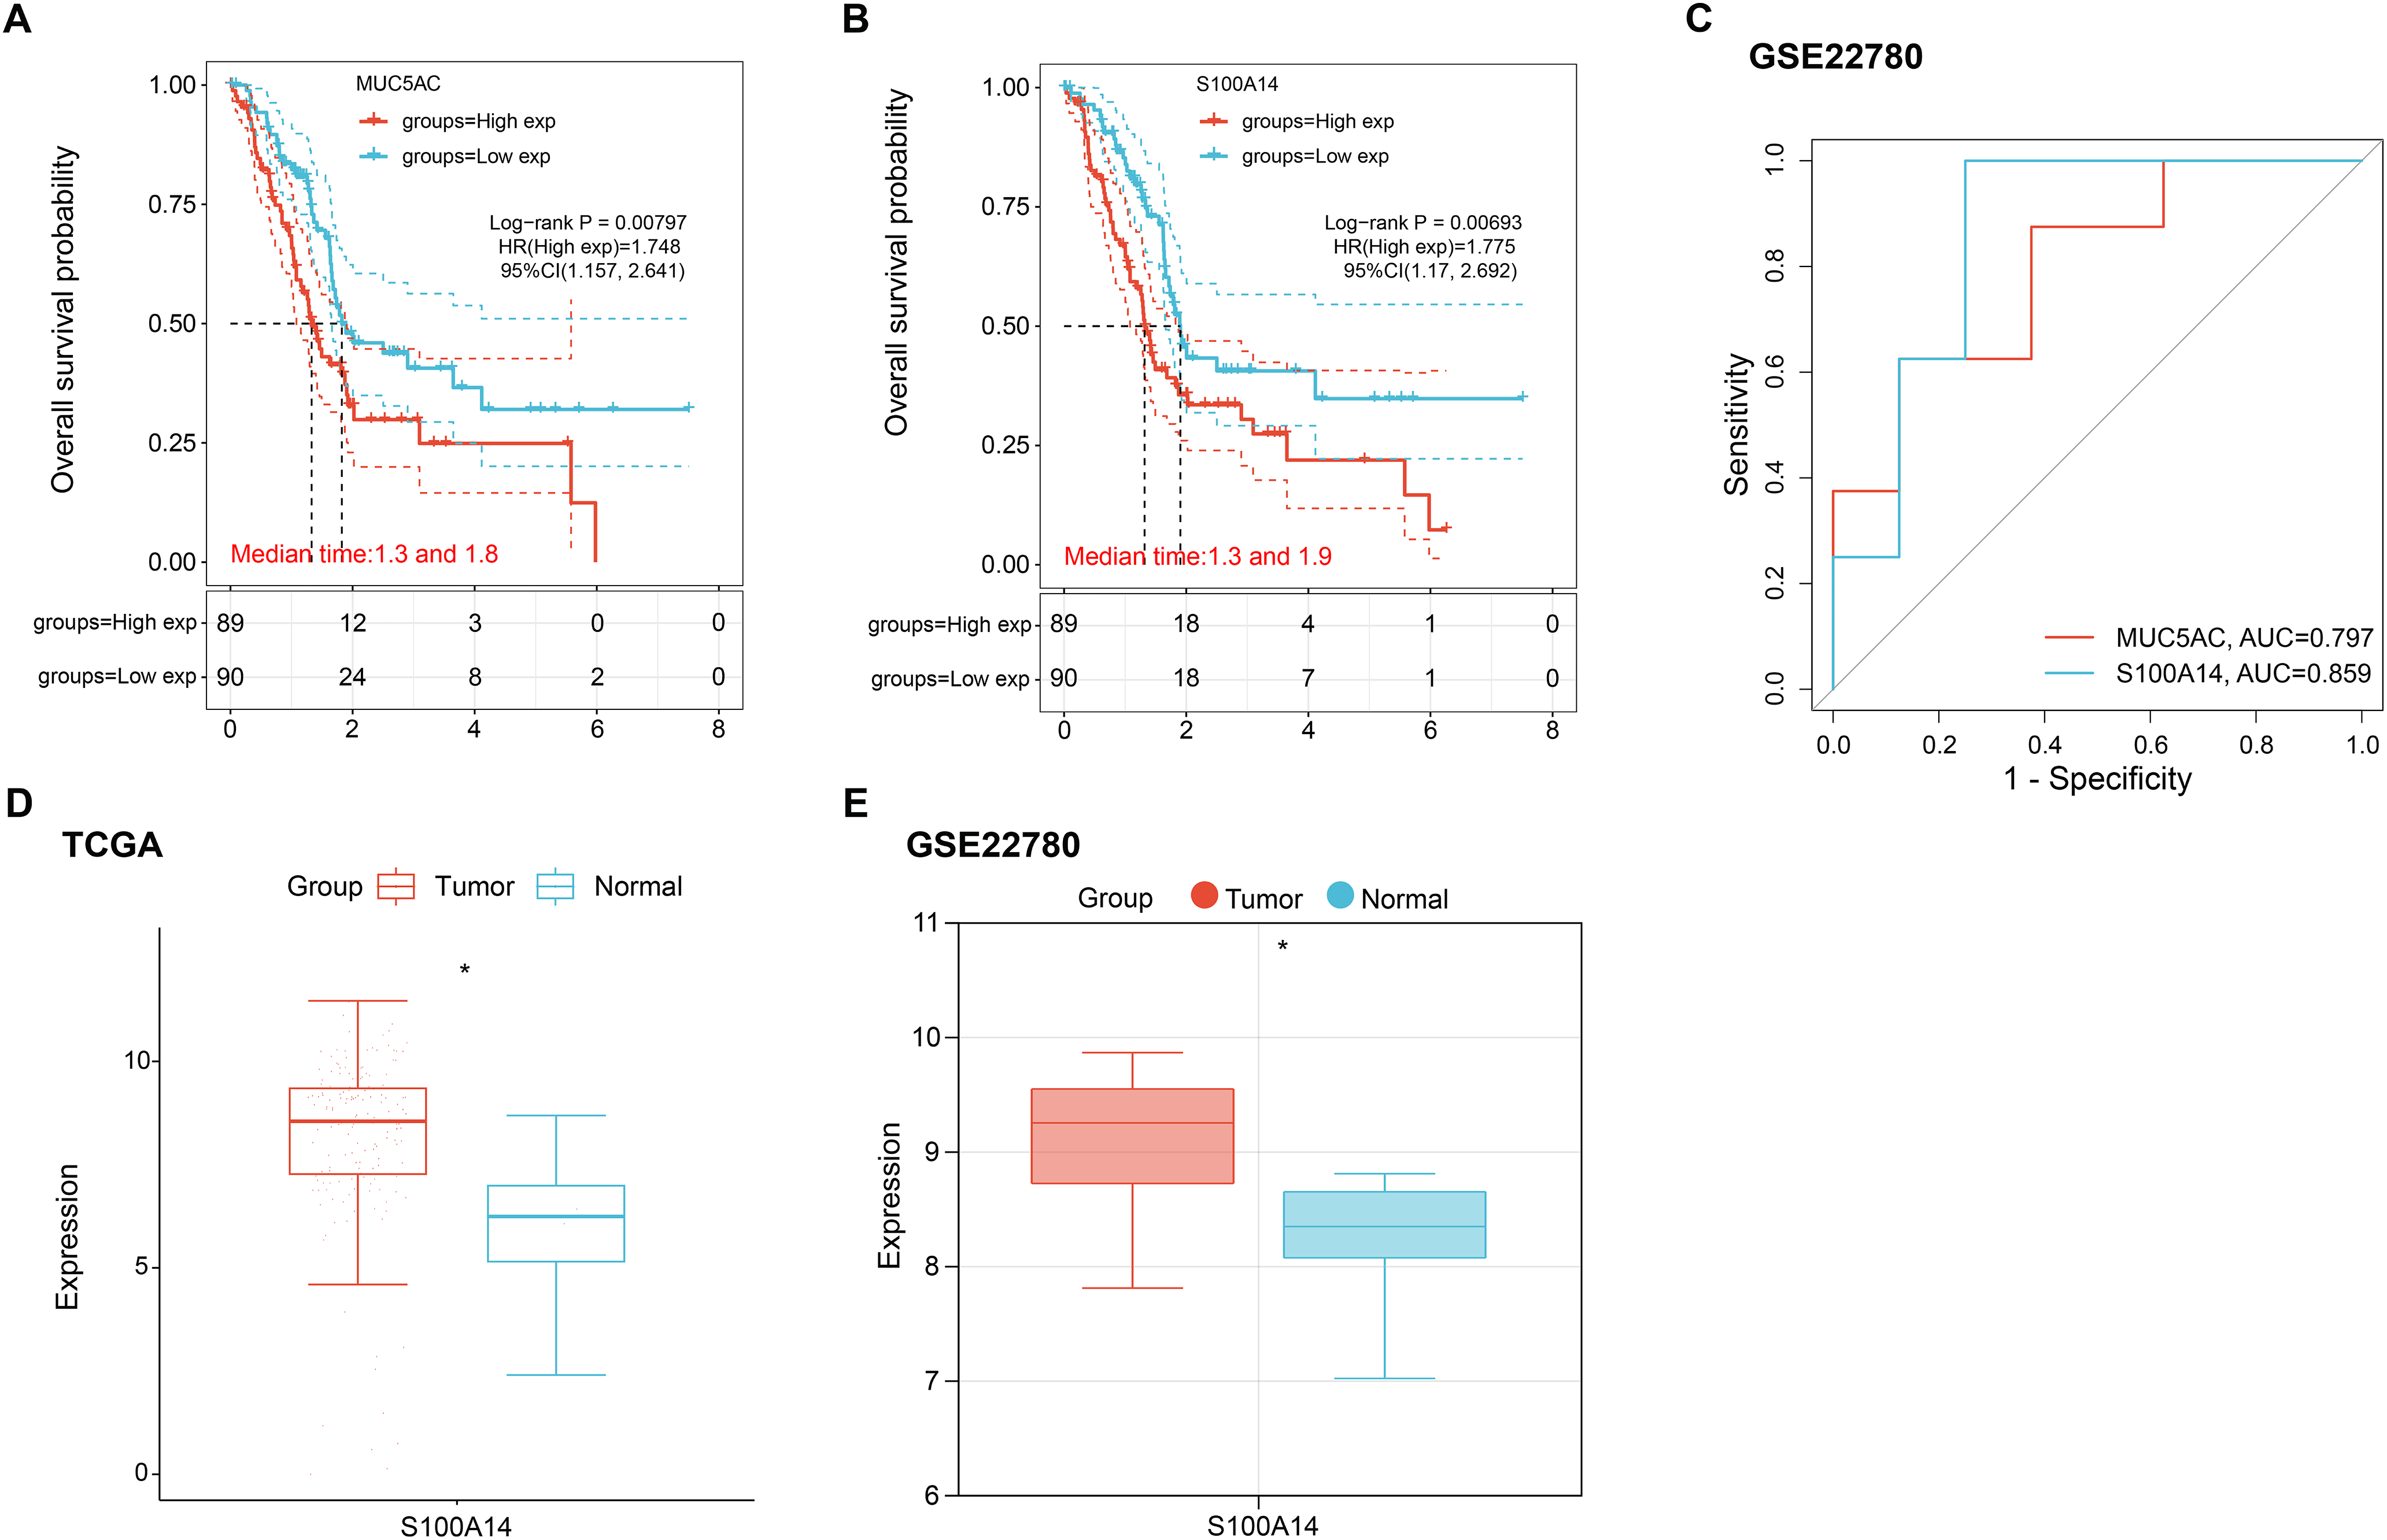
Figure 2: Prognostic and expression profiles of selected hub genes in pancreatic cancer. (A,B) Kaplan–Meier OS curves comparing high- and low-expression groups for MUC5AC (A) and S100A14 (B). Log-rank tests were applied to assess statistical significance. (C) ROC curves assessing 1-year survival predictive accuracy for MUC5AC and S100A14; the area under the curve (AUC) values are indicated. (D,E) Boxplots showing S100A14 mRNA expression levels in pancreatic tumor and normal tissue samples from TCGA-PAAD (D) and GSE22780 (E) datasets. OS: Overall Survival; TCGA-PAAD: The Cancer Genome Atlas-Pancreatic Adenocarcinoma; ROC: Receiver Operating Characteristic. *p < 0.05
3.3 Elevated Expression of S100A14 in PC Cell Lines and Its Functional Role in Regulating Cell Proliferation
To validate the expression of S100A14, qRT-PCR and WB analyses were conducted in normal HPDE cells and a panel of PC cell lines, including Capan-1, MiaPaCa-2, Capan-2, PANC-1, and BxPC3. As shown in Fig. 3A–C, S100A14 was markedly upregulated in all PC cell lines relative to HPDE cells, with MiaPaCa-2 exhibiting the highest expression. PANC-1 and BxPC-3 showed moderately high, but not saturated, S100A14 expression, making them suitable for both gain and loss-of-function manipulation; therefore, these two cell lines were selected for subsequent functional experiments. Following transfection with si-S100A14-1 and si-S100A14-2, a significant downregulation of S100A14 expression was observed in both cell lines, as confirmed by qRT-PCR and WB assays (Fig. 3D–G). Using the CCK-8 test, the effect of S100A14 knockdown on cell proliferation was evaluated. S100A14 knockdown significantly decreased the ability of PANC-1 and BxPC3 cells to proliferate (Fig. 3H,I).
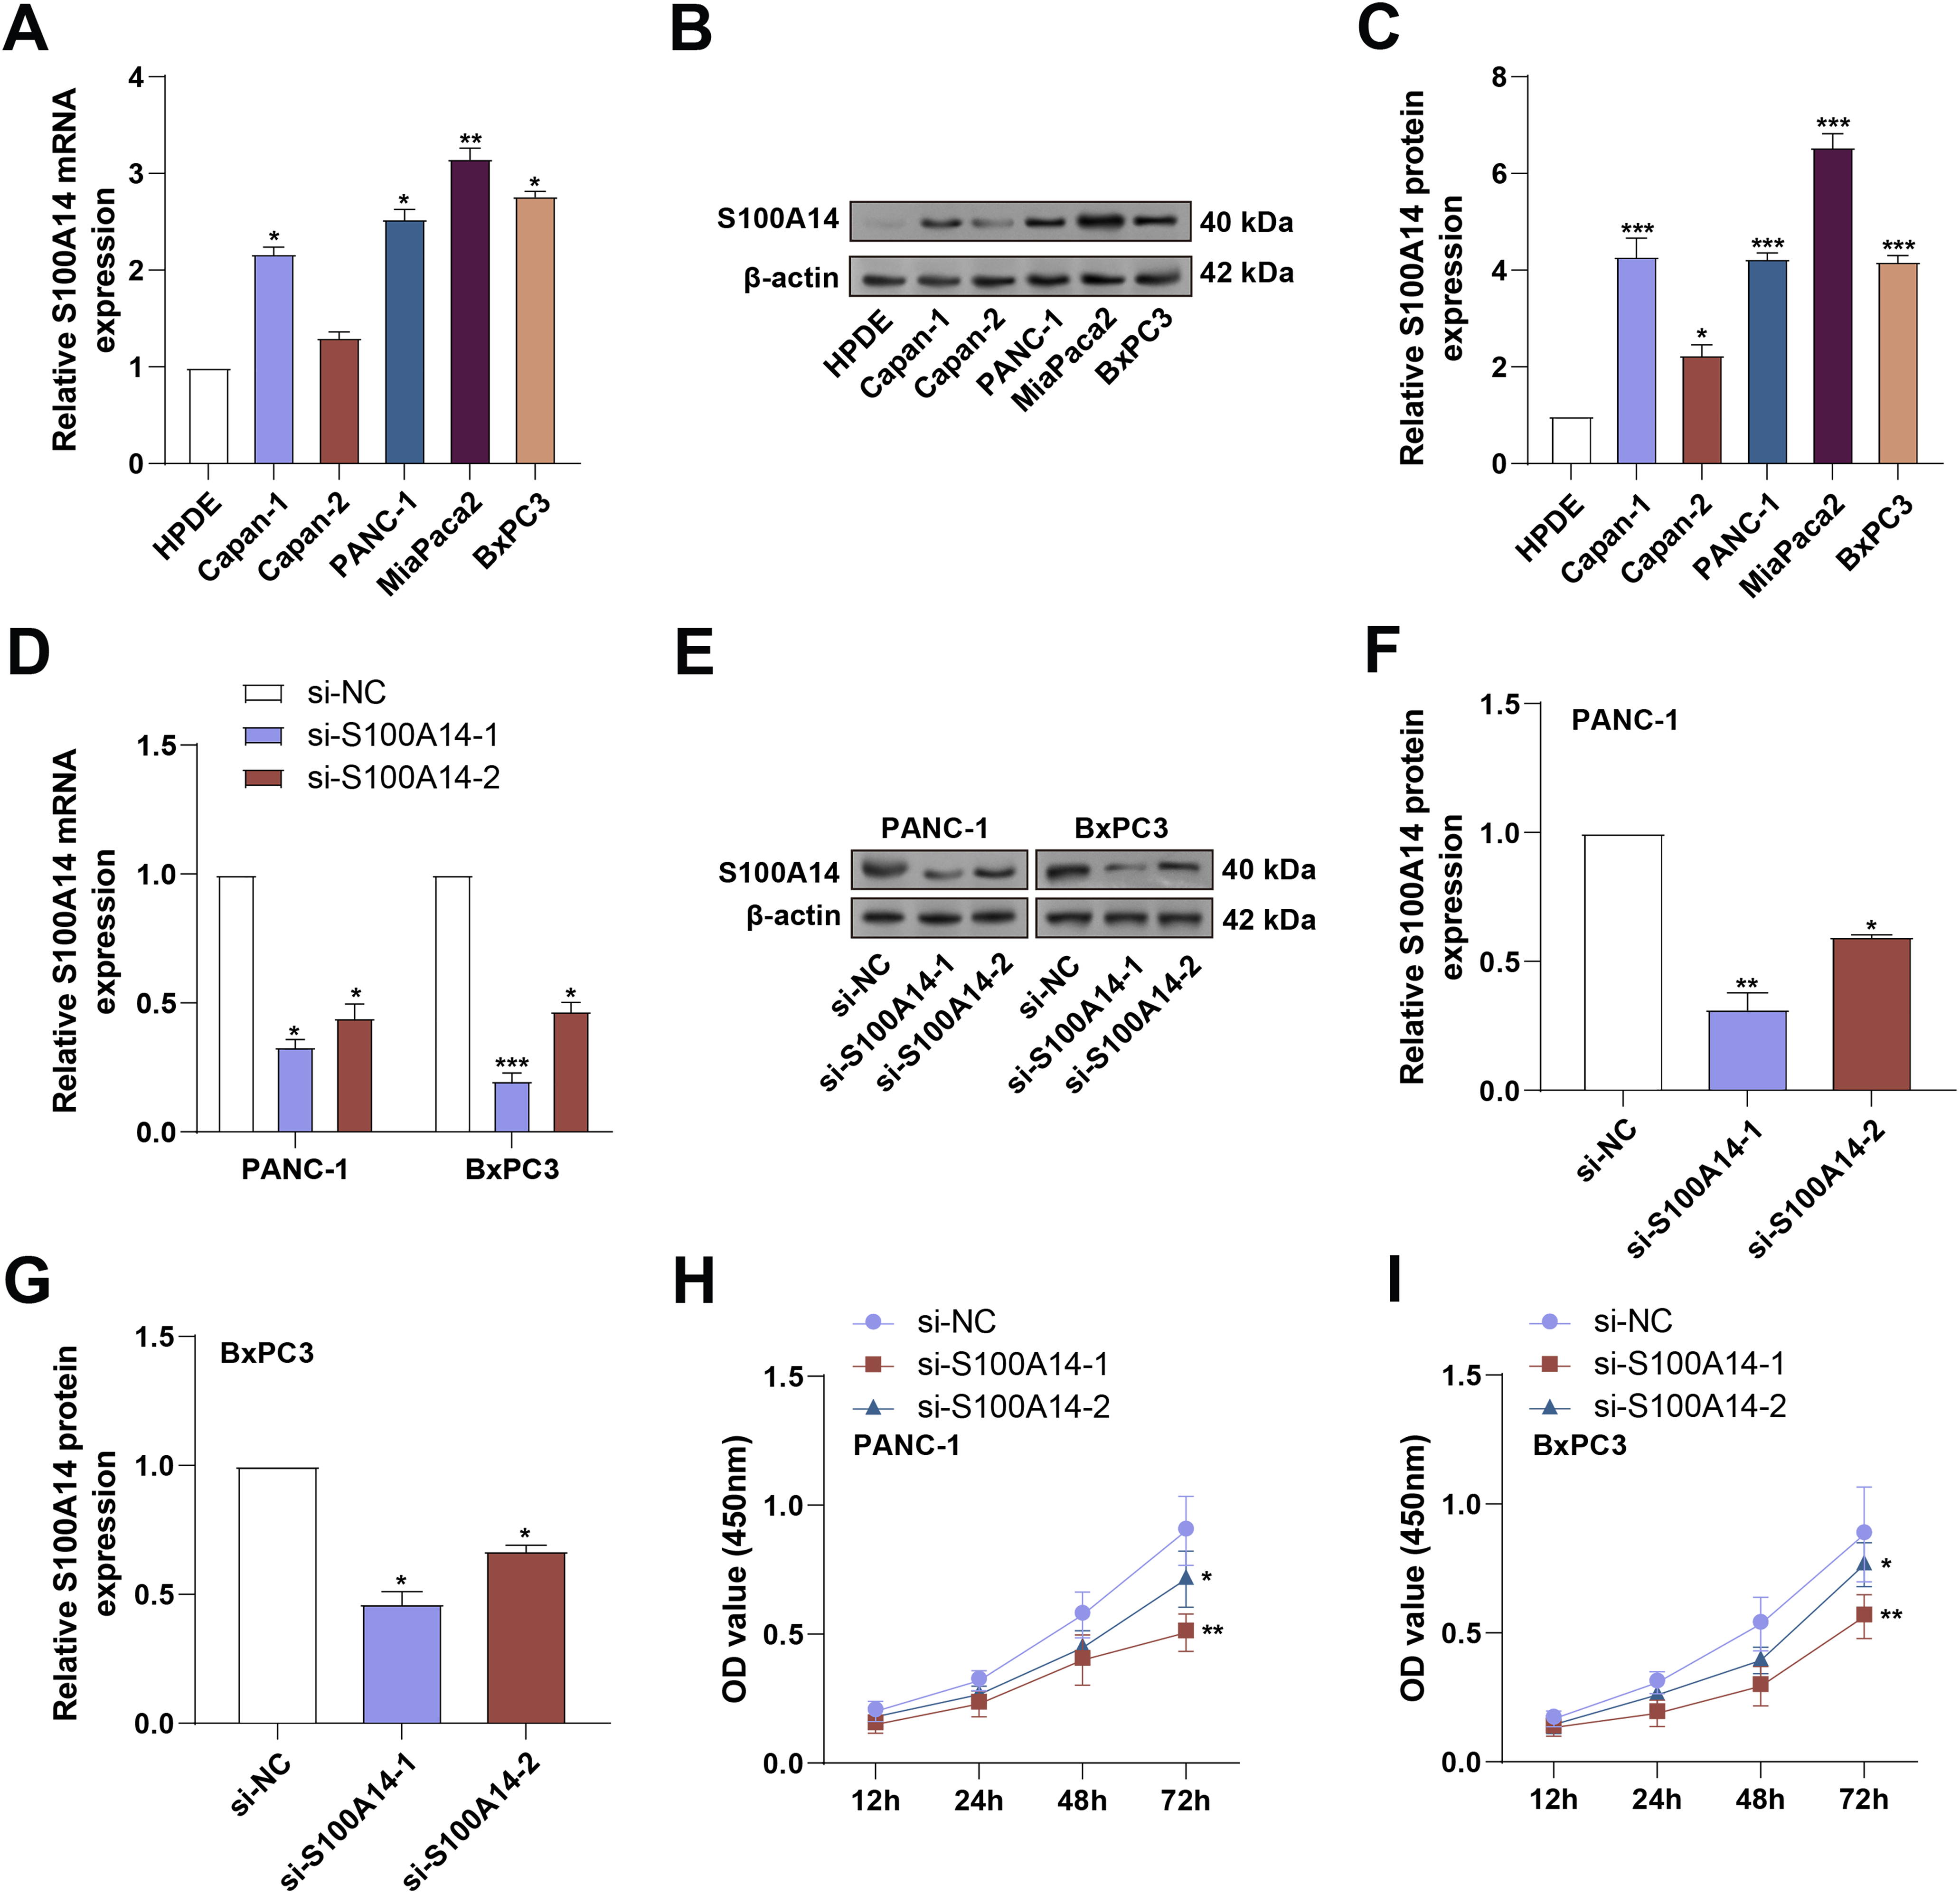
Figure 3: Expression validation and knockdown efficiency of S100A14 in pancreatic cancer cell lines. (A) qRT-PCR analysis of S100A14 mRNA expression in normal pancreatic ductal epithelial (HPDE) cells and PC cell lines (Capan-1, Capan-2, PANC-1, MiaPaCa-2, BxPC3). (B) WB analysis of S100A14 protein expression in HPDE, Capan-1, Capan-2, PANC-1, MiaPaCa-2, BxPC3. (C) Quantification of the relative S100A14 protein levels corresponding to panel B. Bars represent normalized densitometry values. (D,E) Knockdown efficiency of two independent siRNAs targeting S100A14 (si-S100A14-1 and si-S100A14-2) in PANC-1 and BxPC3 cells was confirmed by qRT-PCR (D) and WB (E). (F,G) Quantification of WB results showing reduced S100A14 protein levels in PANC-1 (F) and BxPC3 (G) cells following siRNA transfection. (H,I) CCK-8 assay results showing relative proliferative capacity of PANC-1 (H) and BxPC3 (I) cells following S100A14 knockdown; absorbance measured at 450 nm. qRT-PCR: Quantitative Real-Time Polymerase Chain Reaction; WB: Western Blotting; CCK-8: Cell Counting Kit-8. *p < 0.05, **p < 0.01, ***p < 0.001
3.4 S100A14 Knockdown Suppresses Migration, Invasion, and EMT in PC Cells
To investigate the role of S100A14 in PC cell motility, Transwell assays were conducted following S100A14 knockdown in PANC-1 and BxPC3 cells. As shown in Fig. 4A,B, silencing S100A14 significantly impaired both invasive and migratory capacities of the two cell lines, indicating its promotive function in PC cell dissemination. Subsequently, applying qRT-PCR and WB analysis, the expression of markers linked to EMT was investigated. E-cadherin was significantly upregulated when S100A14 was knocked down, although N-cadherin, Vimentin, and S100A14 itself were all expressed less in both cell types (Fig. 4C–G). These findings suggest that S100A14 may facilitate EMT in PC cells, thereby contributing to their migratory and invasive behavior.
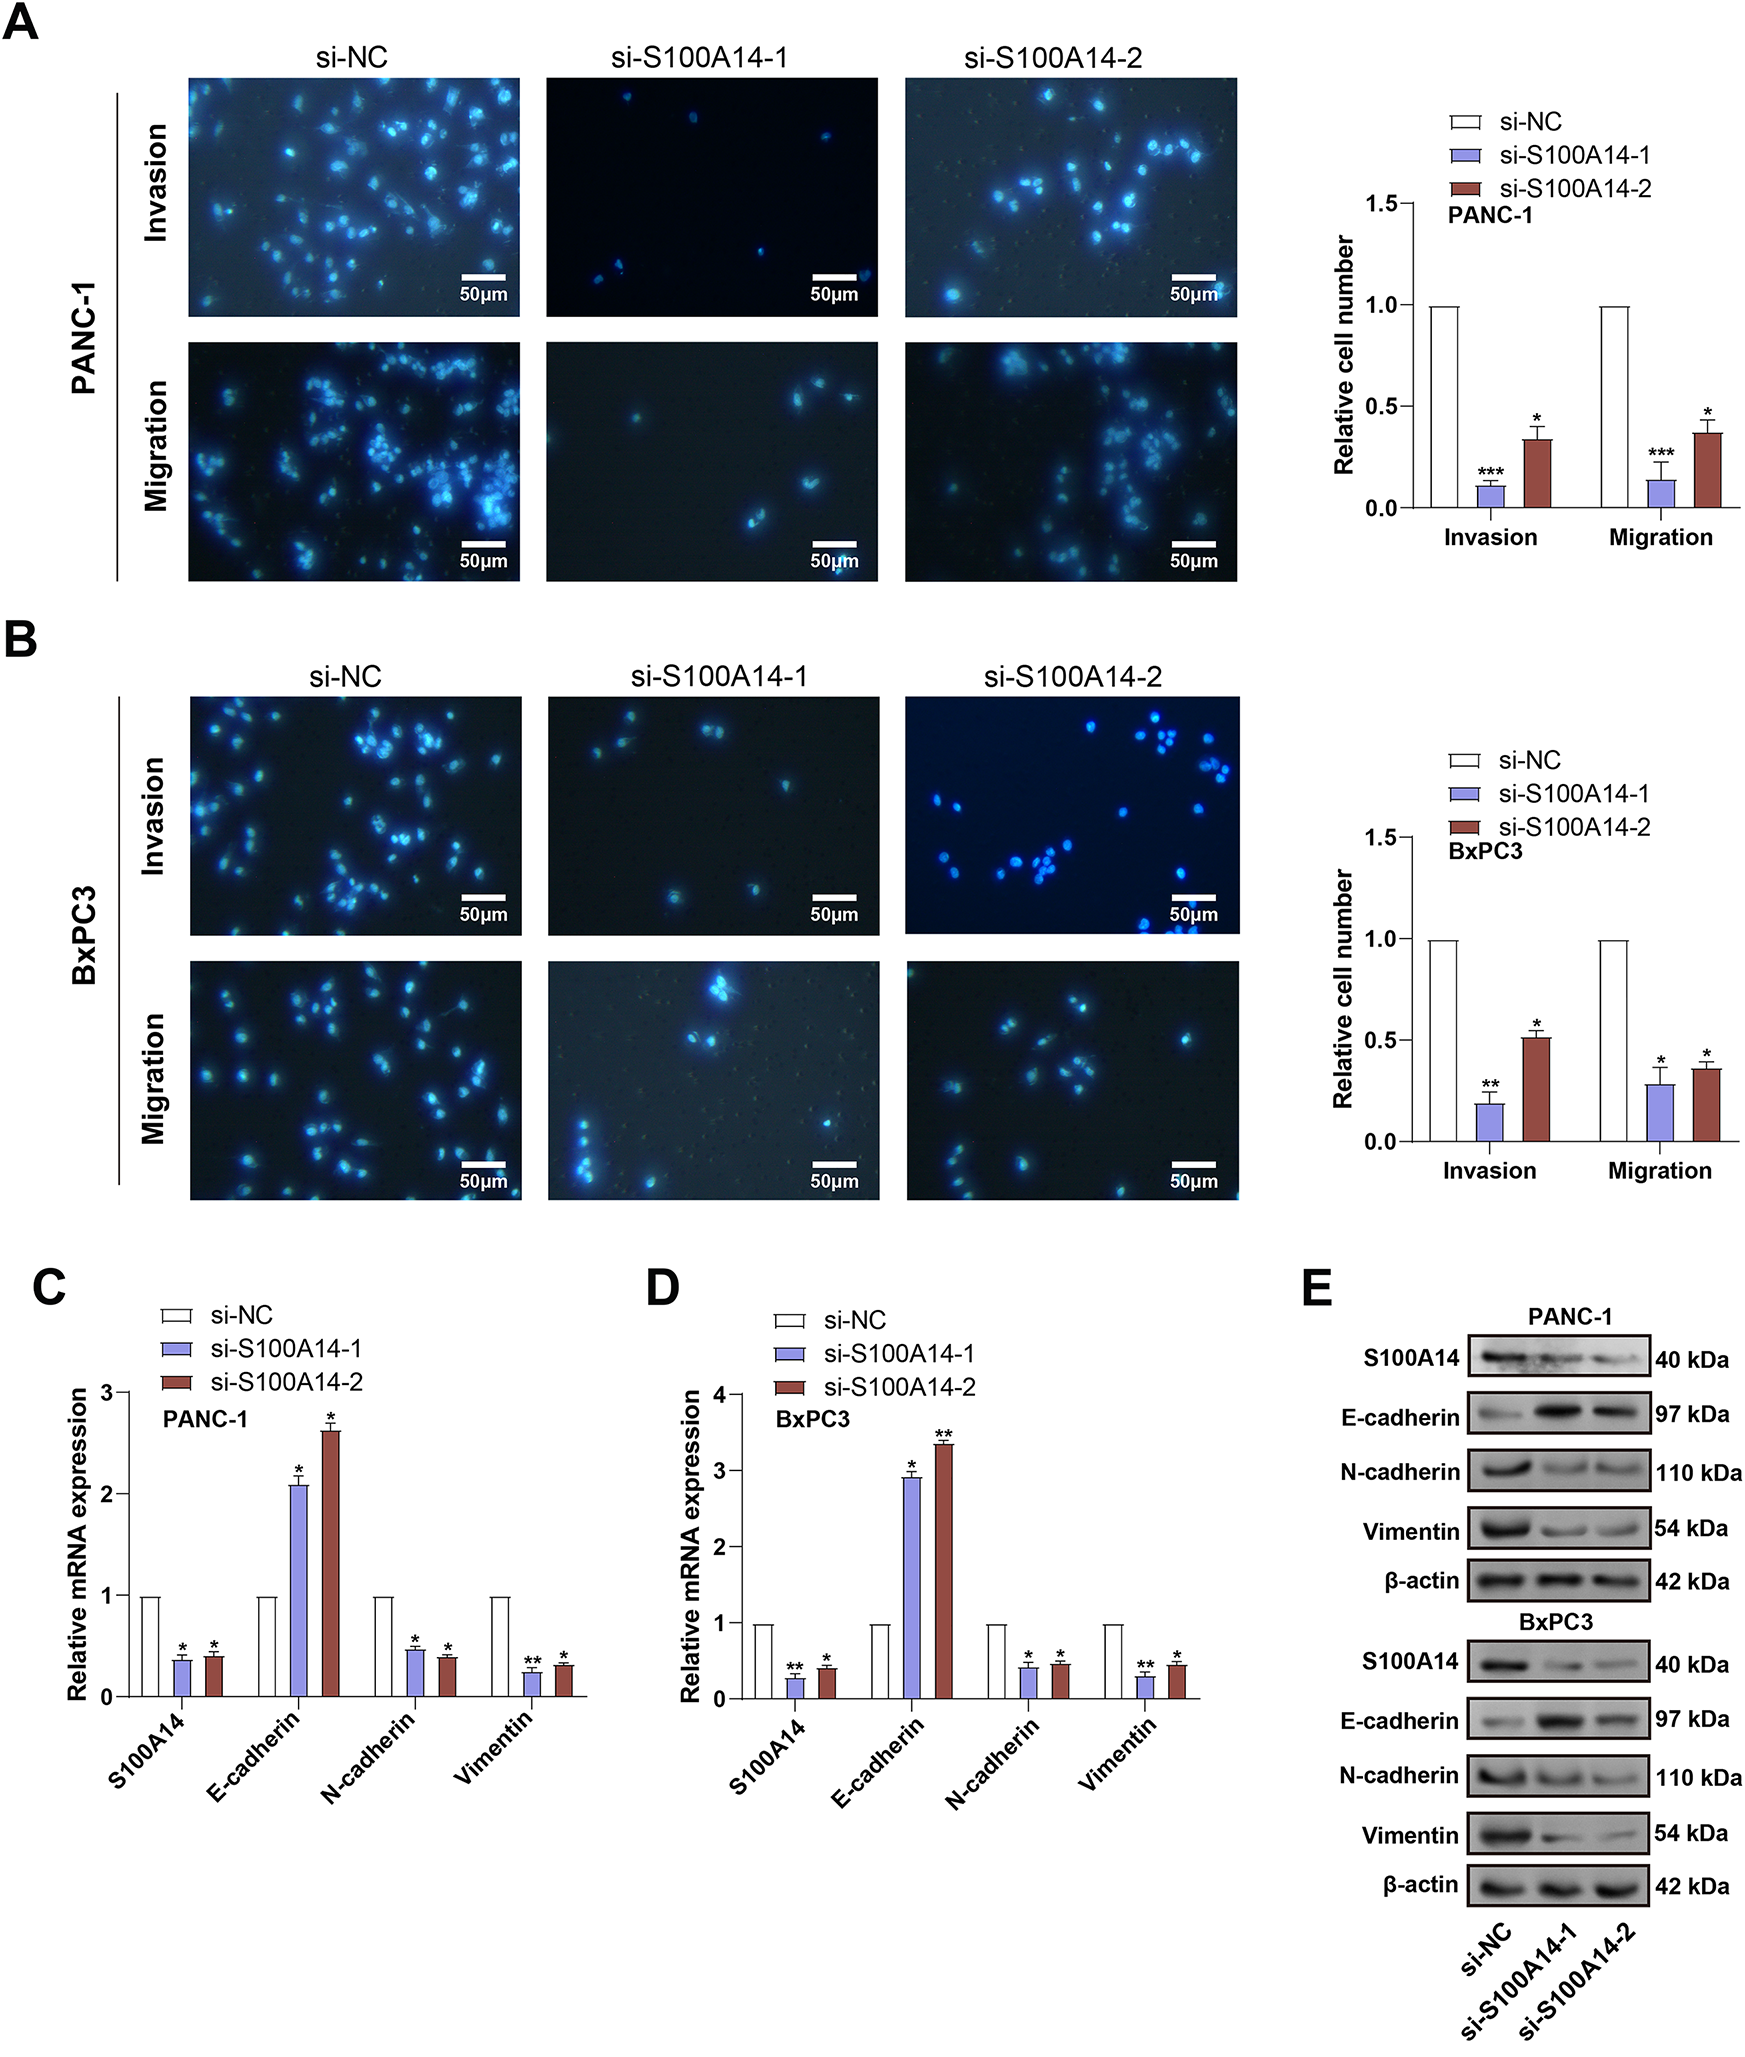
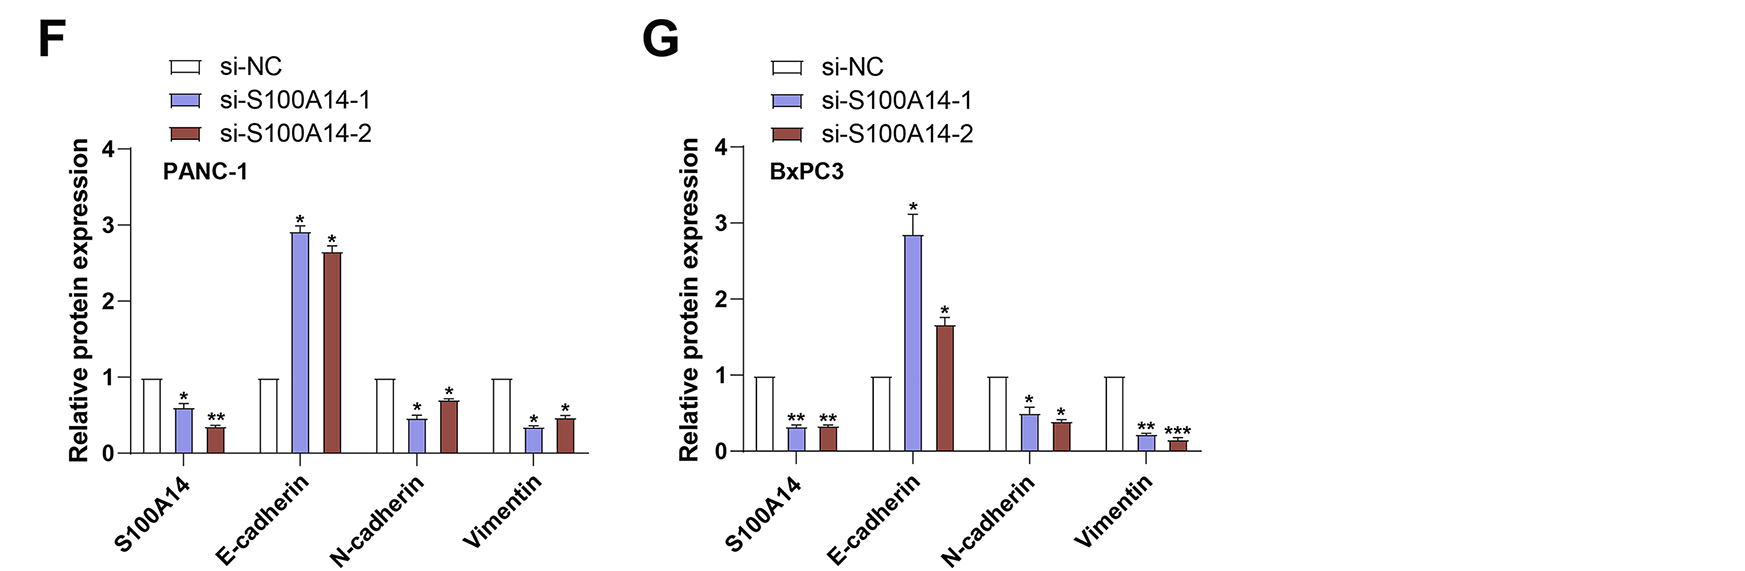
Figure 4: Impact of S100A14 knockdown on migration, invasion, and EMT markers in pancreatic cancer cells. (A,B) Transwell assays quantifying migrated and invaded PANC-1 (A) and BxPC3 (B) cells with or without S100A14 silencing. Magnification: 200×, scale bar = 50 μm. (C) Relative mRNA expression levels of S100A14, E-cadherin, N-cadherin, and Vimentin in PANC-1 cells after transfection with si-NC, si-S100A14-1, or si-S100A14-2, as determined by qRT-PCR. (D) Relative mRNA expression of the same genes in BxPC-3 cells treated as in (C). (E) Representative Western blot images showing S100A14 and EMT-related proteins (E-cadherin, N-cadherin, and Vimentin) in PANC-1 and BxPC-3 cells following S100A14 knockdown; β-actin served as the loading control. (F) Densitometric analysis of protein expression in PANC-1 cells corresponding to the Western blots in (E). (G) Densitometric analysis of protein expression in BxPC-3 cells corresponding to the Western blots in (E). EMT: epithelial-mesenchymal transition. *p < 0.05, **p < 0.01, ***p < 0.001
3.5 S100A14 Regulates S100A16 Protein but Not mRNA Expression in PC Cells
A previous study has identified S100A14 and S100A16 as interacting partners, with evidence suggesting that S100A14 regulates S100A16 protein expression through a non-transcriptional mechanism [14]. Both proteins undergo time-dependent degradation that appears independent of classical proteasomal or lysosomal pathways. To assess the clinical relevance of S100A16 in PC, expression analysis using the TCGA-PAAD and GSE22780 datasets was performed. It was discovered that tumor tissues have much higher levels of S100A16 than normal groups (Fig. 5A,B). To verify the direct interaction between S100A14 and S100A16, we performed co-immunoprecipitation (Co-IP) assays in PANC-1 and BxPC3 cells. In PANC-1 cells, following immunoprecipitation with an anti-S100A16 antibody, a co-precipitated band of S100A14 was detected. In BxPC3 cells, immunoprecipitation with an anti-S100A14 antibody also resulted in the detection of a co-precipitated band of S100A16 (Fig. 5C). These results demonstrate that S100A14 and S100A16 directly interact within cells. To investigate the regulatory relationship between S100A14 and S100A16, qRT-PCR was performed to assess the mRNA levels of both genes in PANC-1 and BxPC3 cells following S100A14 overexpression or knockdown. As expected, overexpression of S100A14 markedly increased S100A14 mRNA expression, while knockdown significantly decreased its mRNA levels. Interestingly, modulation of S100A14 expression did not affect the mRNA expression of S100A16 (Fig. 5D–G). Further, Under the same circumstances, WB analysis was performed to assess the protein expression levels of S100A14 and S100A16. Notably, in PANC-1 and BxPC3 cells, overexpression of S100A14 resulted in a large rise in the levels of both S100A14 and S100A16 proteins (Fig. 5H–J), whereas knockdown of S100A14 led to a marked decrease in both proteins (Fig. 5K–M). These experimental results show that S100A14 and S100A16 have a direct interaction in cells. Meanwhile, the mRNA level of S100A16 remains stable, whereas its protein level changes with the expression of S100A14. Notably, this finding is consistent with previous research conclusions: S100A14 and S100A16 are directly interacting proteins; the former can regulate the protein expression of the latter through a non-transcriptional mechanism; and the degradation processes of both proteins are independent of the classical proteasomal or lysosomal pathways. Based on this, we hypothesize that in pancreatic cancer cells, S100A14 most likely achieves specific regulation of S100A16 protein levels by directly binding to S100A16 protein, and this regulatory process is not associated with the transcriptional process of S100A16.
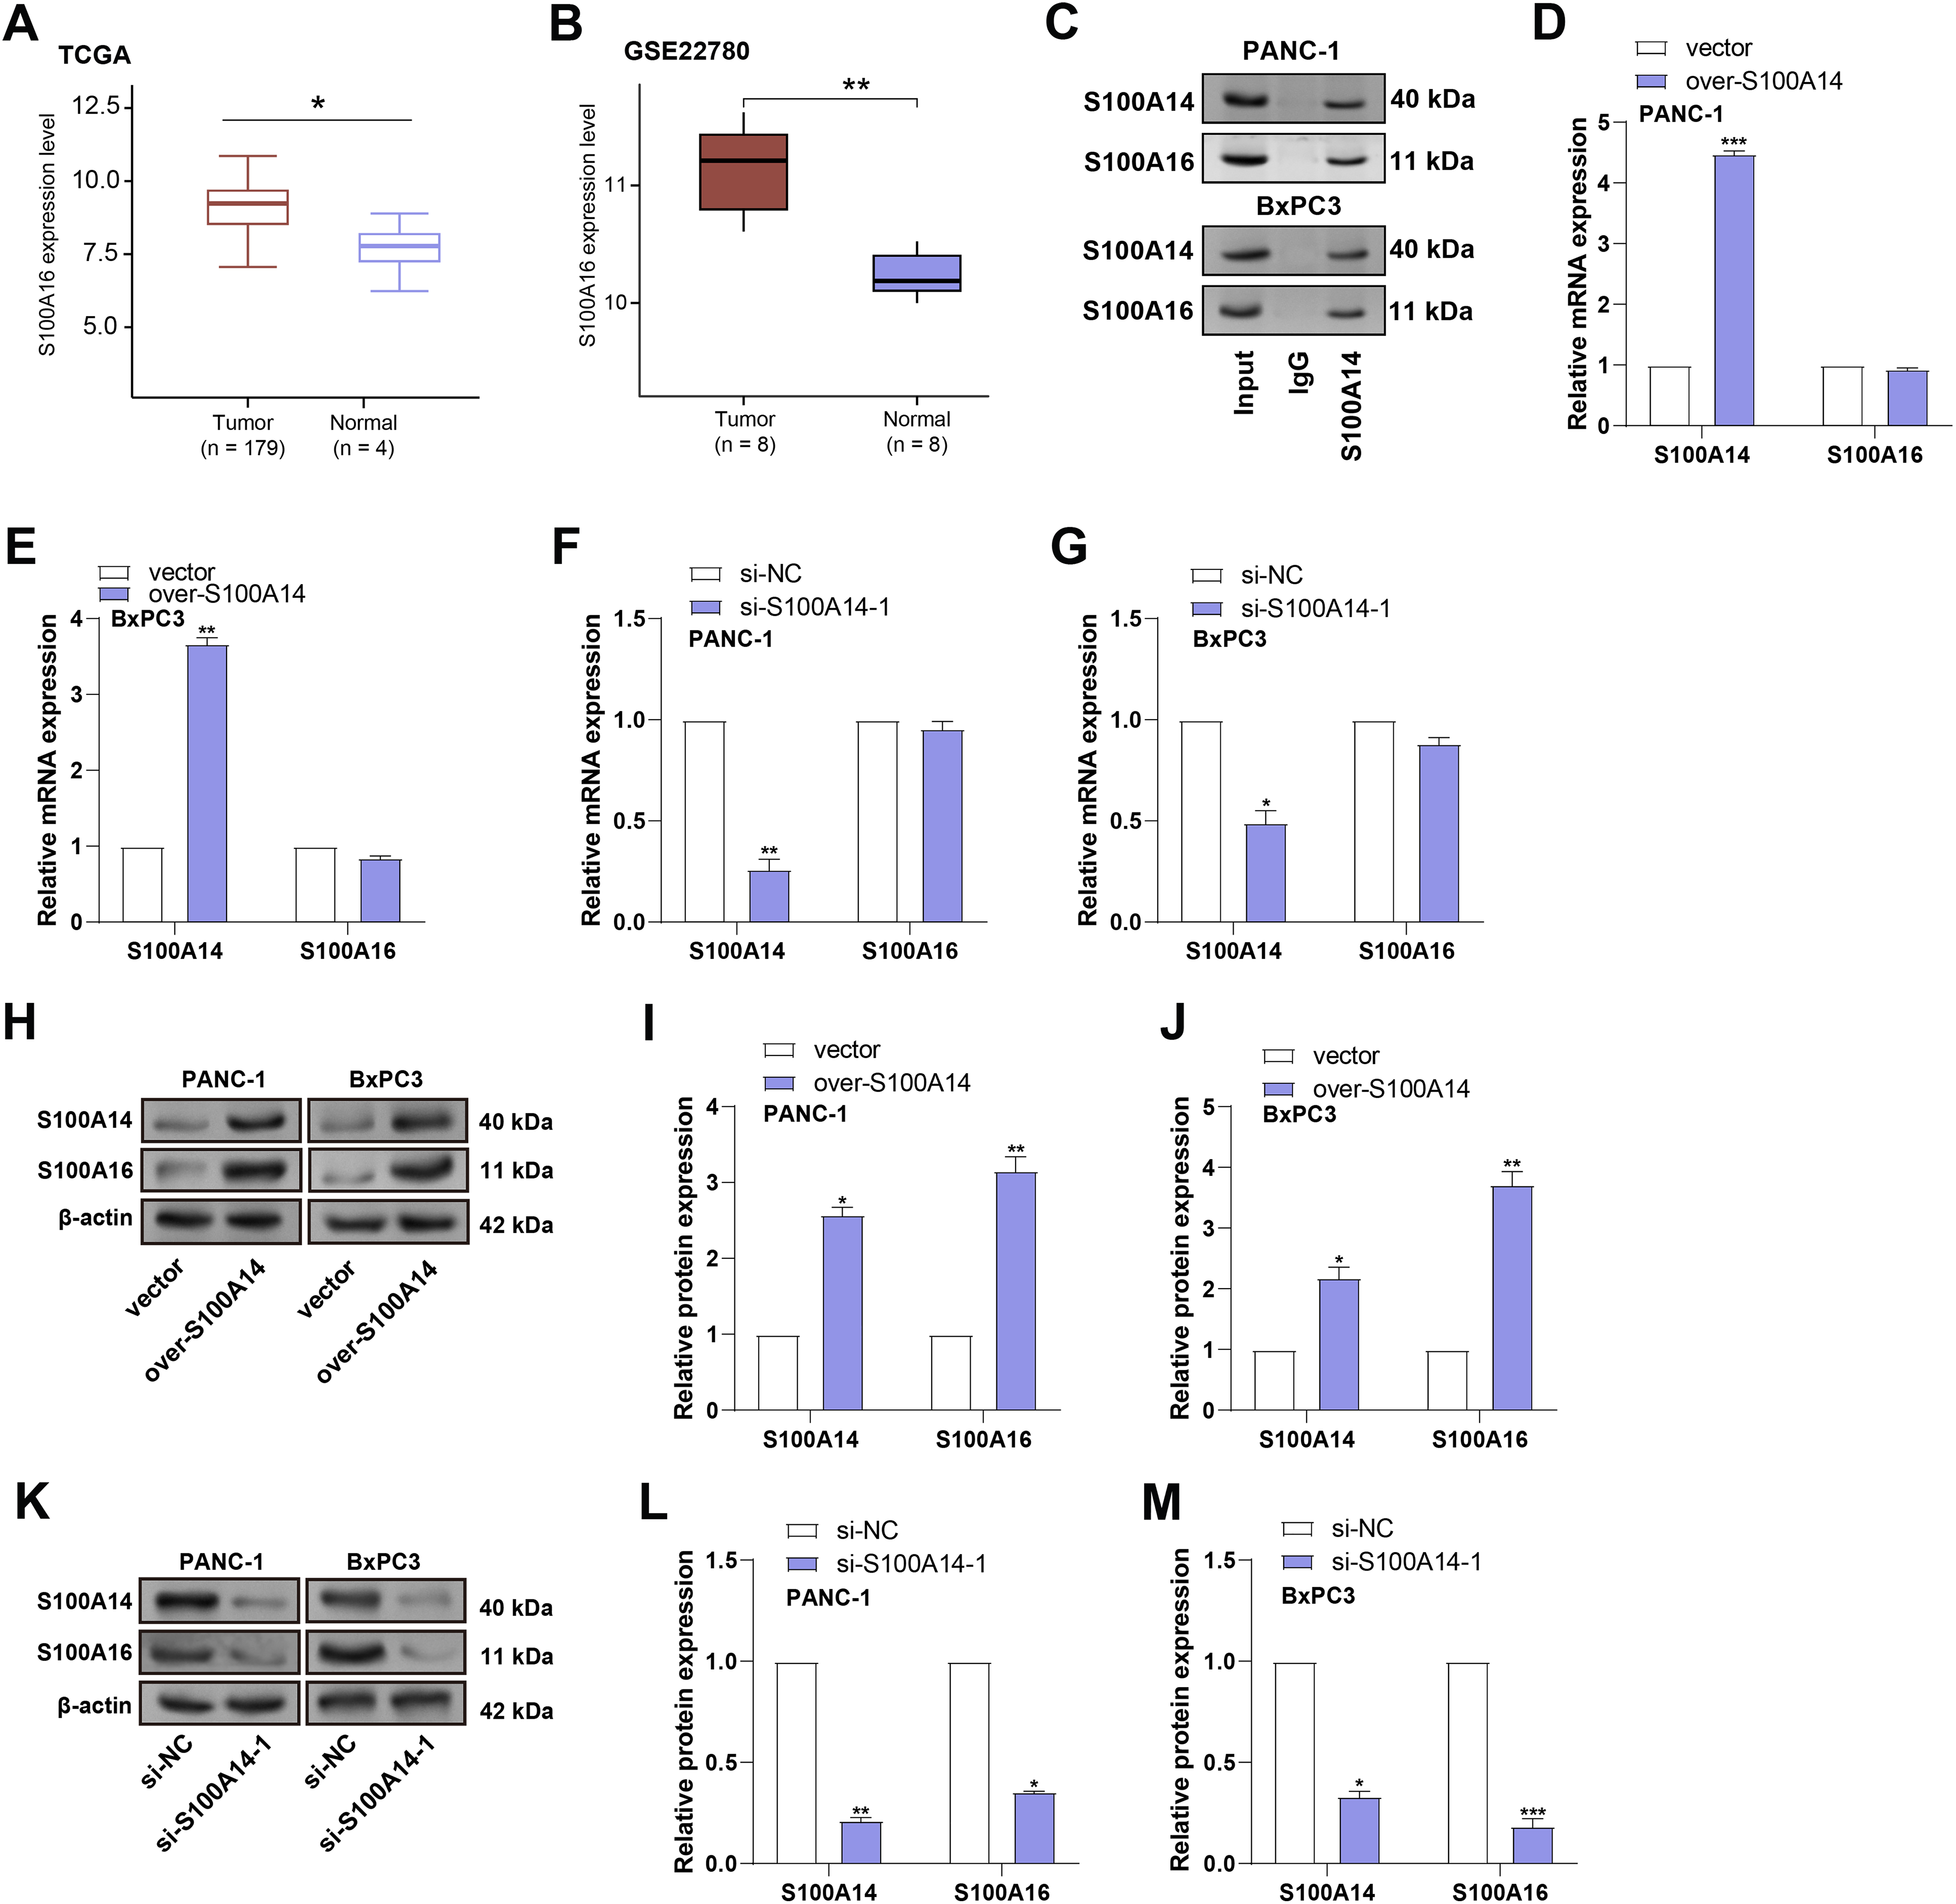
Figure 5: Post-transcriptional regulation of S100A16 protein expression by S100A14 in pancreatic cancer cells. (A) Boxplot representing S100A16 expression in TCGA-PAAD tumor vs. normal tissues. (B) Boxplot representing S100A16 expression in GSE22780 tumor vs. normal tissues. (C) Co-IP assay verifies the direct interaction between S100A14 and S100A16 in PANC-1 and BxPC3 cells. (D,E) qRT-PCR analysis of S100A14 and S100A16 mRNA expression after S100A14 overexpression in PANC-1 (D) and BxPC3 (E) cells. (F,G) qRT-PCR assessment of S100A14 and S100A16 mRNA levels following S100A14 knockdown in PANC-1 (F) and BxPC3 (G) cells. (H) Representative WB images showing that S100A14 overexpression markedly increased S100A16 protein levels in both PANC-1 and BxPC-3 cells, while β-actin served as a loading control. (I) Quantification of Western blots showing increased S100A14 and S100A16 protein expression in PANC-1 cells upon S100A14 overexpression. (J) Quantitative analysis showing that S100A14 overexpression significantly upregulated S100A16 protein expression in BxPC-3 cells. (K) WB analysis showing that S100A14 knockdown decreased S100A16 protein expression in both PANC-1 and BxPC-3 cells. (L) Quantification of Western blots showing that si-S100A4-1 significantly reduced S100A14 and S100A16 protein levels in PANC-1 cells. (M) Quantitative analysis showing that S100A14 knockdown markedly decreased S100A16 protein expression in BxPC-3 cells. Co-IP: Co-immunoprecipitation. *p < 0.05, **p < 0.01, ***p < 0.001
3.6 S100A14 Unidirectionally Regulates the Expression of S100A16
To further evaluate the regulatory relationship between S100A14 and S100A16, PANC-1 and BxPC3 cells were transfected with S100A16-overexpressing plasmids. Following transfection, S100A16 was shown to be markedly increased at both the mRNA and protein levels by qRT-PCR and WB studies (Fig. 6A–C), validating the transfection efficiency. Subsequently, the impact of S100A16 overexpression on S100A14 expression was assessed. Neither the mRNA nor protein levels of S100A14 were altered in response to elevated S100A16 expression in either cell line (Fig. 6D–F). These results, in conjunction with earlier findings, support a unidirectional regulatory relationship, whereby S100A14 modulates S100A16 protein expression without reciprocal regulation.
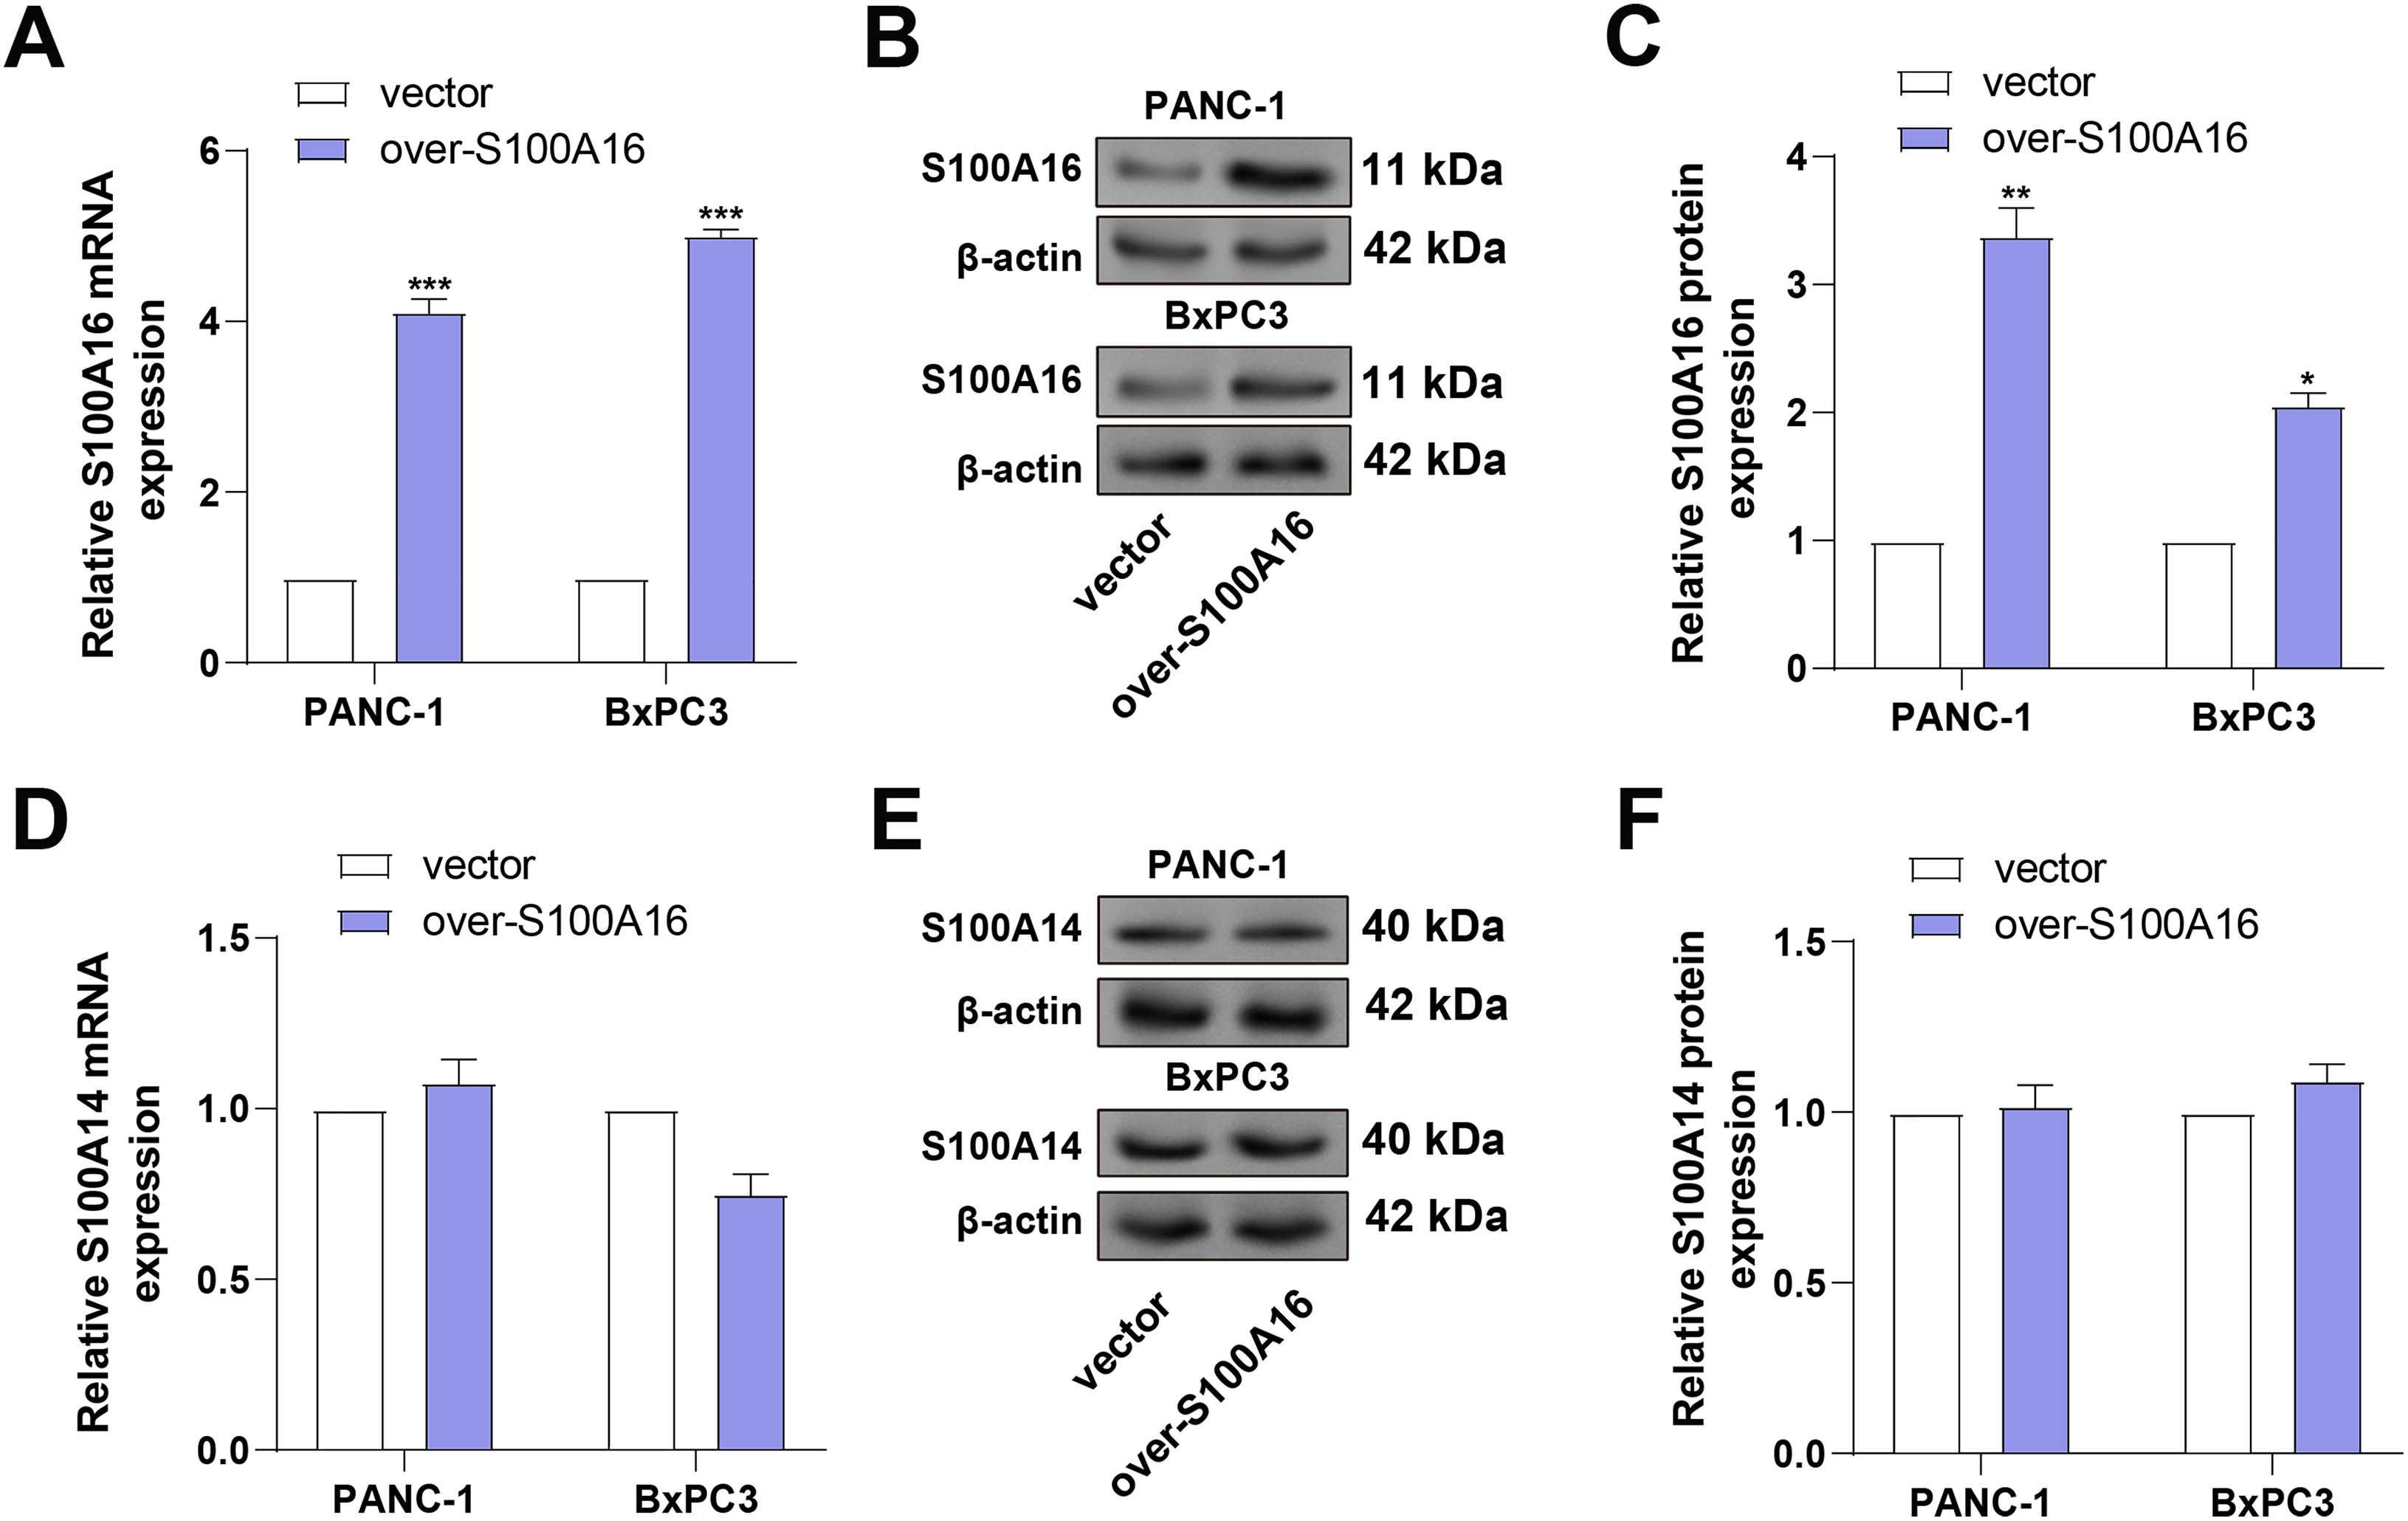
Figure 6: Validation of S100A16 overexpression and evaluation of its effect on S100A14 expression. (A) qRT-PCR quantification of S100A16 mRNA levels in PANC-1 and BxPC3 cells after transfection with S100A16 overexpression plasmids. (B,C) WB analysis confirming increased S100A16 protein expression post-transfection. (D) qRT-PCR analysis of S100A14 mRNA expression in PANC-1 and BxPC3 cells following S100A16 overexpression. (E) WB showing S100A14 protein levels after S100A16 overexpression in PANC-1 and BxPC3 cell lines. (F) Quantification of S100A14 protein expression corresponding to (E), showing that S100A14 protein levels were not significantly altered by S100A16 overexpression. *p < 0.05, **p < 0.01, ***p < 0.001
3.7 S100A14 Knockdown Abrogates S100A16-Induced Migration, Invasion, and EMT in PC Cells
To clarify S100A14 and S100A16 contribute to PC cell motility, Transwell assays were performed in PANC-1 and BxPC3 cells following S100A16 overexpression or combined S100A16 overexpression and S100A14 knockdown. As shown in Fig. 7A,B, overexpression of S100A16 markedly enhanced both migratory and invasive capacities in both cell lines. Notably, these pro-metastatic effects were reversed upon concurrent knockdown of S100A14. Subsequently, EMT marker expression was evaluated using qRT-PCR and WB analysis. Vimentin and N-cadherin levels rose in response to overexpression of S100A16, but E-cadherin expression decreased, indicative of EMT induction. However, co-silencing of S100A14 restored E-cadherin level and suppressed Vimentin and N-cadherin (Fig. 7C–G).
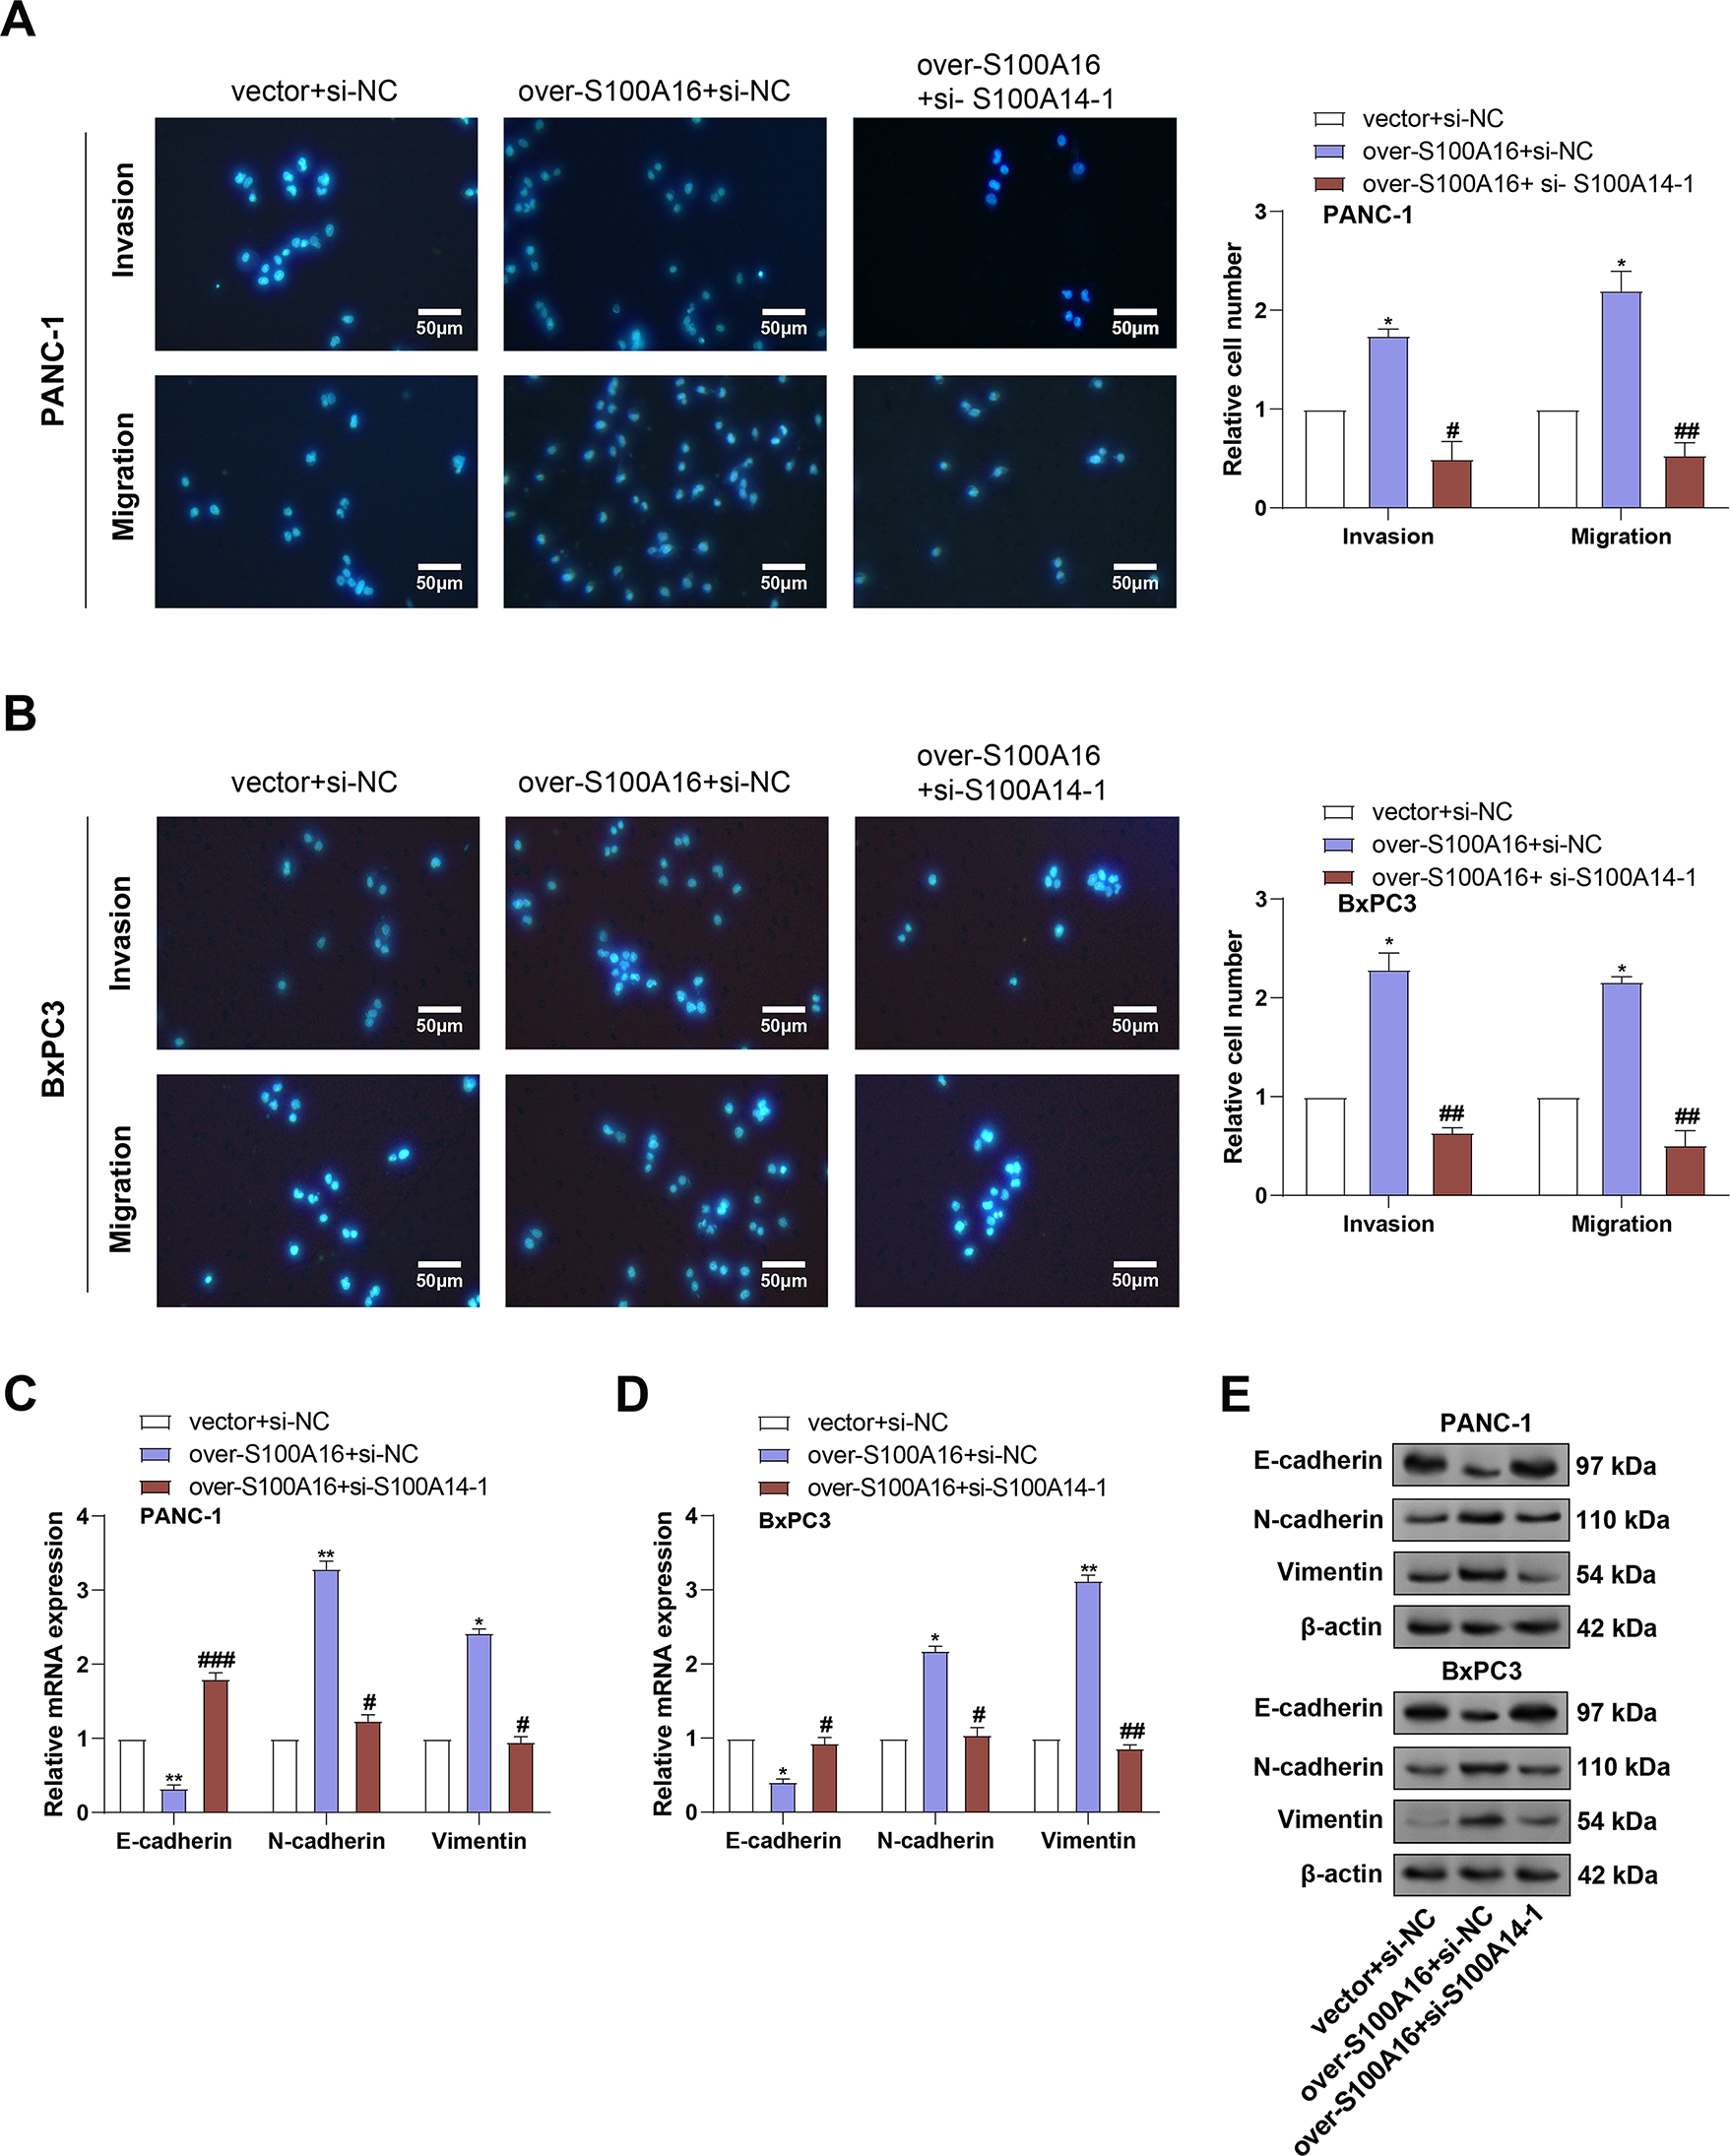
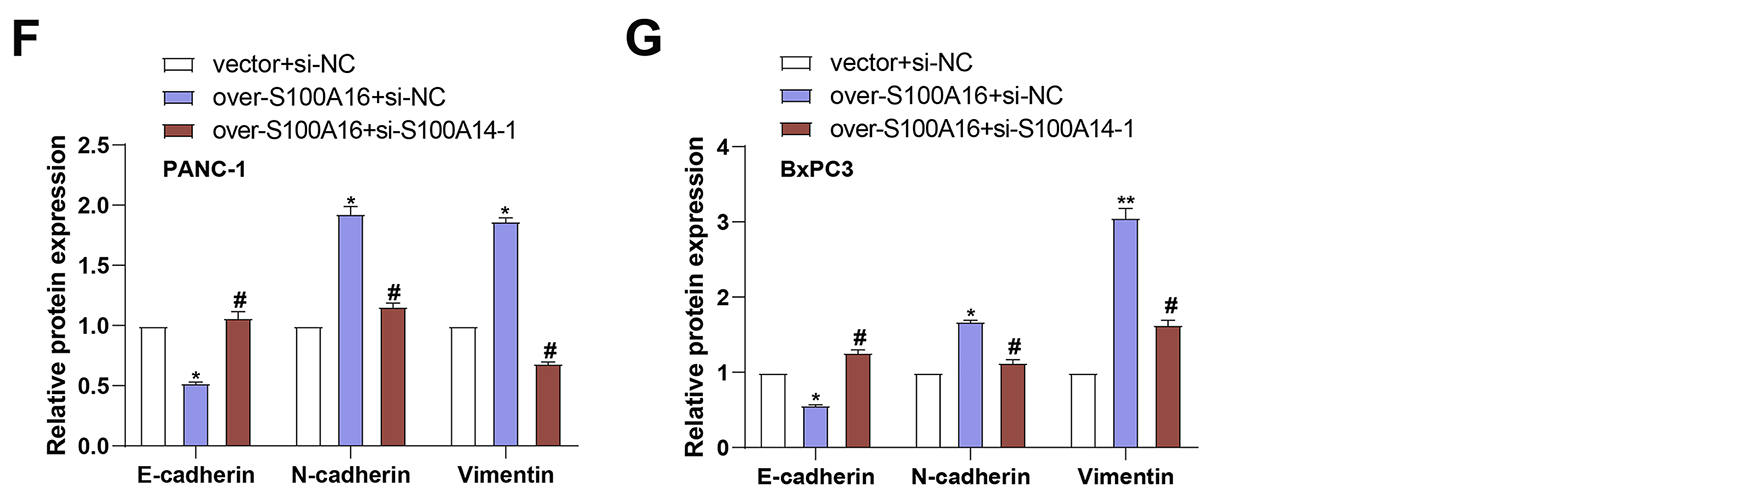
Figure 7: Effects of S100A16 overexpression and combined S100A14 knockdown on PC cell migration, invasion, and EMT marker expression. (A,B) Transwell assays assessing migration and invasion of PANC-1 (A) and BxPC3 (B) cells under S100A16 overexpression alone or combined with S100A14 knockdown. Magnification: 200×, scale bar = 50 μm. (C) qRT-PCR quantification of E-cadherin, N-cadherin, and Vimentin mRNA expression in PANC-1 cells. (D) Quantification of E-cadherin, N-cadherin, and Vimentin mRNA expression in BxPC3 cells. (E) WB analysis of E-cadherin, N-cadherin, and Vimentin protein levels under the indicated conditions. (F) Densitometric quantification of E-cadherin, N-cadherin, and Vimentin protein levels in PANC-1 cells corresponding to the Western blots in (E). (G) Densitometric quantification of E-cadherin, N-cadherin, and Vimentin protein levels in BxPC-3 cells corresponding to the Western blots in (E). qRT-PCR: Quantitative real-time polymerase chain reaction; WB: Western blotting. *p < 0.05 or **p < 0.01 vs. vector+si-NC group, #p < 0.05 or ##p < 0.01 or ###p < 0.001 vs. over-S100A16+si-NC group
3.8 S100A14 Overexpression Reduces p53 Protein Expression by Inhibiting Its Transcriptional Activity and Promoting Degradation
p53 is a critical tumor suppressor that maintains genomic stability by preventing the proliferation of damaged cells, thereby inhibiting tumorigenesis [15]. In addition, studies have found that p53 interacts with multiple members of the S100 protein family, which can regulate the transcriptional activity and biological functions of p53 in various ways [16,17]. To examine S100A14’s regulatory role in p53 expression, WB analysis was performed in PANC-1 cells following S100A14 overexpression. As shown in Fig. 8A,B, S100A14 overexpression led to a marked increase in its own protein level, accompanied by a notable reduction in p53 protein expression. To ascertain whether transcriptional regulation was involved, qRT-PCR was conducted. While S100A14 mRNA expression was significantly upregulated, no significant change in p53 mRNA levels was observed (Fig. 8C), suggesting a post-transcriptional regulatory mechanism. As shown by dual-luciferase reporter experiments, overexpression of S100A14 markedly reduced p53 transcriptional activity (Fig. 8D), indicating suppression of p53 function. To further explore whether S100A14 affects p53 protein stability, cycloheximide (CHX) chase assays were conducted. As shown in Fig. 8E, S100A14 overexpression accelerated the degradation of p53 protein over time in contrast to the control group. These results suggest that S100A14 suppresses p53 expression primarily through inhibition of its transcriptional activity and promotion of proteasome-mediated degradation.
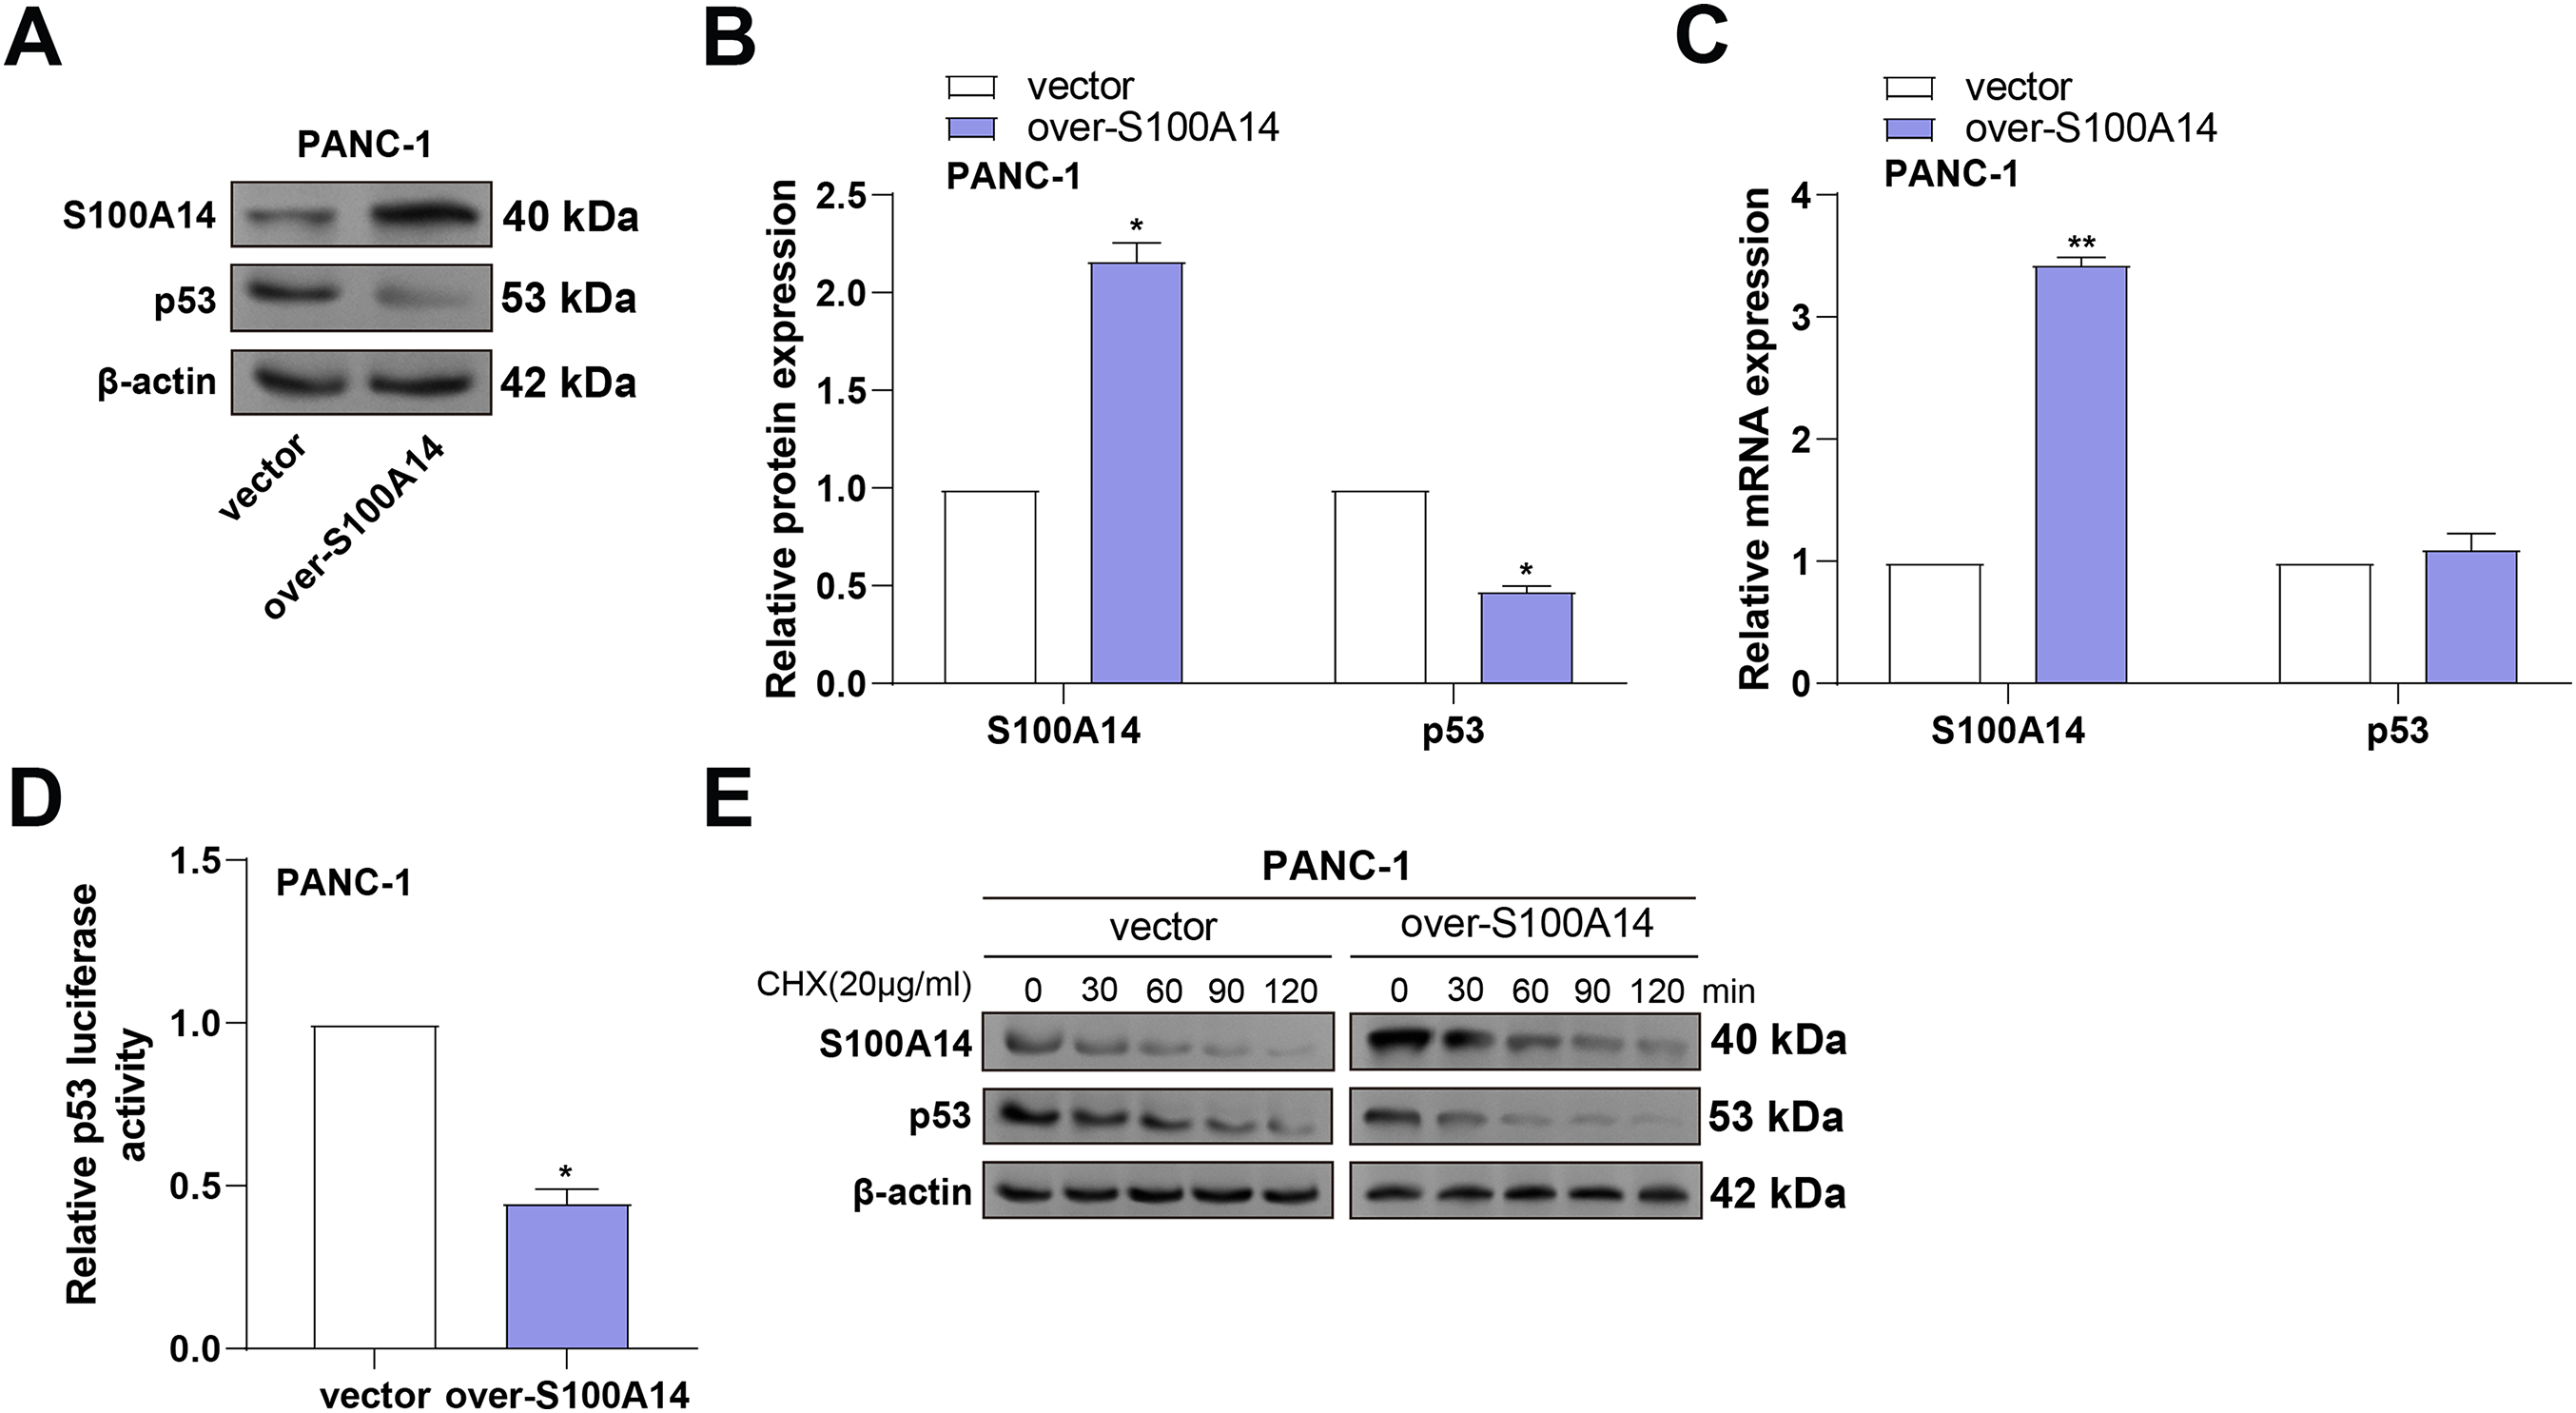
Figure 8: S100A14 overexpression suppresses p53 protein levels by reducing protein stability in PANC-1 cells. (A) WB analysis showing increased S100A14 and decreased p53 protein expression after S100A14 overexpression. (B) Quantification of S100A14 and p53 protein expression normalized to β-actin. (C) qRT-PCR measurement of S100A14 and p53 mRNA levels in control and S100A14-overexpressing cells. (D) Dual-luciferase reporter assay measuring transcriptional activity of p53 using a p53-responsive luciferase plasmid; relative luciferase units normalized to control. (E) Western blot analysis of p53 protein stability in control and S100A14-overexpressing PANC-1 cells treated with cycloheximide (CHX, 20 μg/mL) for the indicated time points (0–120 min). *p < 0.05, **p < 0.01
3.9 S100A14 Knockdown Reverses S100A16-Mediated Suppression of the p53/p21 Pathway in PC Cells
To determine whether S100A14 modulates the regulatory effects of S100A16 on the p53 signaling pathway and cell apoptosis, we performed rescue experiments in PANC-1 cells. WB analysis was conducted to assess the effects of S100A16 overexpression and/or S100A14 knockdown on the protein levels of S100A14, S100A16, and p53 in PANC-1 cells. Overexpression of S100A16 significantly increased S100A16 protein expression while reducing p53 protein levels without altering S100A14 expression. Conversely, combined S100A16 overexpression and S100A14 knockdown resulted in decreased protein levels of both S100A16 and S100A14, accompanied by an increase in p53 protein expression (Fig. 9A,B). Co-immunoprecipitation assays confirmed a direct interaction between S100A16 and p53 in PANC-1 cells (Fig. 9C). To investigate the functional consequence of this interaction, p53 transcriptional activity was evaluated using a p53-responsive luciferase reporter assay. Knockdown of S100A14 significantly promoted p53-driven luciferase activity, while S100A16 overexpression significantly suppressed p53-driven luciferase activity, and this suppression was restored by concurrent S100A14 knockdown (Fig. 9D). Further WB analysis revealed that overexpression of S100A16 decreased the expression of p21, a canonical downstream target of p53, and this reduction was reversed when S100A14 was simultaneously knocked down (Fig. 9E,F). Meanwhile, cell apoptosis was detected by flow cytometry: the apoptosis rate was significantly increased in the si-S100A14+si-NC group, decreased in the over-S100A16+si-NC group, and the over-S100A16+si-S100A14 group reversed the apoptosis inhibition mediated by over-S100A16 (Fig. 9G,H). In conclusion, S100A14 is involved in S100A16-mediated regulation of the p53/p21 tumor suppressor axis and cell apoptosis. Knockdown of S100A14 can alleviate the inhibitory effect of S100A16 on the p53/p21 pathway and promote cancer cell apoptosis.
Figure 9: Modulation of p53 and p21 expression by S100A16 overexpression and S100A14 knockdown in PC cells. (A) WB analysis of S100A14, S100A16, and p53 protein levels in PANC-1 cells transfected with S100A14 knockdown plasmid alone, S100A16 overexpression plasmid alone, or in combination with S100A14 knockdown. (B) Quantification of S100A16, S100A14, and p53 protein expression normalized to β-actin. (C) Co-IP assay confirming physical interaction between S100A16 and p53 proteins. (D) Luciferase reporter assay evaluating p53 transcriptional activity in cells with S100A14 knockdown, S100A16 overexpression, or S100A16 overexpression combined with S100A14 knockdown. (E) WB analysis of p21 protein expression following the indicated treatments. (F) Quantification of p21 protein expression normalized to β-actin. (G) Flow cytometry was used to detect the apoptosis of PANC-1 cells in different treatment groups. (H) Statistical analysis of apoptosis rates in PANC-1 cells. Co-IP: Co-immunoprecipitation. *p < 0.05 or ***p < 0.001 vs. vector+si-NC group, #p < 0.05 or ##p < 0.05 vs. over-S100A16+si-NC group
PC is frequently diagnosed at advanced stages, which severely limits therapeutic options and contributes to its poor survival rates [18]. Increasing evidence underscores the significant clinical and prognostic relevance of the S100 protein family in pancreatic ductal adenocarcinoma (PDAC) [19,20]. One example is the thorough examination of six members of the S100A family (S100A2, S100A4, S100A6, S100A10, S100A14, and S100A16) by Li et al., revealing their marked overexpression and reduced methylation levels in PDAC tissues, with elevated expression correlating negatively with patient survival [21]. Similarly, High expression of various S100A members, such as S100A14 and S100A16, has been linked by Zhuang et al. to advanced tumor stage, poor histological grade, and an adverse prognosis, highlighting their roles in tumor progression and immune regulation [22]. Bioinformatics analysis in this study revealed that only MUC5AC and S100A14 were significantly associated with overall survival. Moreover, S100A14 demonstrated excellent predictive performance with AUC = 0.859 and was consistently upregulated in tumor tissues across two pancreatic cancer-related datasets.
The role of S100A14 has been explored in various malignancies with diverse outcomes. For instance, Jiang et al. reported that Prostate cancer tissues and cell lines have downregulated expression of S100A14, which slows tumor growth by upregulating FAT1 and triggering the Hippo signaling pathway. This activation promotes apoptosis while inhibiting cell migration, proliferation, and EMT [23]. Zhang et al. further showed that ZHX2 inhibits thyroid carcinoma migration and EMT through the transcriptional repression of S100A14, which is notably overexpressed in thyroid tumors and inversely correlated with ZHX2 levels [24]. In colorectal cancer, according to one study, S100A4 is substantially expressed and linked to distant metastases, brain invasion, lymph node involvement, and advanced TNM stage, whereas reduced S100A14 expression facilitates EMT, proliferation, migration, and invasion [25]. Despite these findings, the molecular mechanisms underlying S100A14’s function in pancreatic cancer remain insufficiently characterized, highlighting the need for further investigation. In this study, we confirmed that S100A14 is upregulated in PC cells. Functional assays demonstrated that knockdown of S100A14 significantly inhibited proliferation, migration, invasion, and EMT of PC cells.
A previous study has identified a functional link between S100A14 and S100A16, it is known that two S100 protein family members may form heterodimers [26,27]. S100A16 has been extensively studied in PC, where it is aberrantly overexpressed and associated with poor patient prognosis. S100A16 has also been extensively studied in PC, with accumulating evidence highlighting its oncogenic role. Li et al. reported that S100A16 is aberrantly overexpressed in PDAC, correlating with poor patient prognosis. Mechanistically, S100A16 promotes EMT by upregulating TWIST1 and activating the STAT3 signaling pathway, thereby facilitating tumor metastasis [28]. Similarly, Fang et al. demonstrated that S100A16 significantly enhances PC cell proliferation, invasion, and migration through fibroblast growth factor 19 (FGF19)-dependent stimulation of the ERK1/2 and AKT pathways. Knockdown of S100A16 induced cell cycle arrest and apoptosis, underscoring its potential as a therapeutic target [29]. Both S100A14 and S100A16 belong to the S100 protein family and can form heterodimers. Our findings reveal that S100A14 and S100A16 have a protein-protein interaction, and modulation of S100A14 expression alters S100A16 protein levels post-transcriptionally without affecting its mRNA expression, whereas overexpression of S100A16 does not reciprocally influence S100A14 levels. Functionally, S100A16 overexpression promotes PC cell migration, invasion, and EMT, and inhibits cell apoptosis, effects that are reversed by S100A14 knockdown, suggesting a hierarchical regulatory axis critical for PC progression.
Cellular homeostasis is crucially regulated by the tumor suppressor p53 via controlling the expression and stability of downstream targets such as p21 [30]. Its interaction with S100 family proteins further suggests a complex regulatory network influencing cancer invasion and migration, highlighting significant research potential. Previous studies have demonstrated that overexpression of S100A14 enhances migration and invasion in esophageal squamous cell carcinoma, with its regulation of matrix metalloproteinase 2 (MMP2) being dependent on functional p53 [31]. Specifically, p53 represses MMP2 transcription, indicating that S100A14 promotes tumor invasiveness through a p53-dependent mechanism. In PC, Chen et al. reported that ZWINT interacts with p53, facilitating its ubiquitination and degradation, thereby inhibiting the p53/p21 signaling axis and promoting cell proliferation and cell cycle progression [32]. The current investigation revealed that S100A14 decreases p53 protein stability, suppressing both its expression and transcriptional activity, which attenuates p53 tumor suppressive functions. Furthermore, S100A16 overexpression also inhibits p53 and its downstream effector p21, yet simultaneous knockdown of S100A14 reverses this inhibition. These findings suggest that S100A14 and S100A16 have a protein-protein interaction and coordinately modulate the p53/p21 axis, influencing the malignant phenotype of PC cells.
However, this study still has limitations: it only verifies the function of S100A14 at the cellular level (e.g., proliferation, migration, and invasion assays), without establishing pancreatic cancer nude mouse models or orthotopic models, and lacks tumor-bearing mouse experiments to verify the role of the S100A14/S100A16/p53 axis in tumor growth or metastasis in vivo; clinical samples only rely on data from public databases such as TCGA and GSE22780, with no inclusion of solid clinical samples from pancreatic cancer patients—it neither verifies the expression levels and tissue-level expression patterns of S100A14/S100A16 in cancer tissues and adjacent tissues via techniques like immunohistochemistry (IHC) nor analyzes their association with patients’ clinicopathological characteristics (e.g., tumor stage, differentiation degree), which significantly impairs the clinical translational value of the study conclusions, and the prognostic value of S100A14 has not been verified through independent multi-center cohorts; at the molecular mechanism level, conclusions regarding p53 protein stability remain vague, with no investigation into whether it involves MDM2-mediated ubiquitination or related mechanisms, and the specific molecular events (such as details of ubiquitination and phosphorylation modifications) underlying S100A14-mediated stabilization of S100A16 and the interaction between S100A16 and p53 are also unclear. Future studies need to use in vivo xenograft/orthotopic tumor models to verify the impact of the S100A14/S100A16/p53 axis on tumor growth and metastasis, validate the study conclusions and the prognostic value of S100A14 through large-sample clinical cohorts and independent multi-center cohorts, conduct in-depth investigations into MDM2-mediated ubiquitination or related mechanisms in the regulation of p53 protein stability, and further explore the molecular modification mechanisms of this regulatory axis, so as to lay a foundation for the development of therapeutic strategies targeting the S100A14/S100A16/p53 axis in pancreatic cancer.
In summary, this study establishes S100A14 as a critical hub gene driving pancreatic cancer progression. Beyond its significant prognostic value and tumor-specific overexpression characteristics, S100A14 functionally regulates the proliferation, migration, invasion, apoptosis, and EMT of pancreatic cancer cells. Mechanistically, S100A14 interacts with S100A16 protein and specifically stabilizes S100A16 protein through post-translational regulatory mechanisms without affecting its mRNA expression. Crucially, this S100A14-S100A16 axis actively suppresses the p53 tumor suppressor pathway. S100A14 knockdown destabilizes S100A16 protein, subsequently restoring p53 protein stability, transcriptional activity, and expression of its downstream effector p21. These findings elucidate a novel axis involving S100A14, S100A16, and p53 that contributes to PC malignancy. From a translational perspective, this identified axis holds promising implications for developing targeted therapeutic strategies against pancreatic cancer—for instance, it could serve as a potential drug target to restore p53-mediated tumor suppression or as a prognostic biomarker to stratify high-risk patients. However, further studies are urgently needed to validate these findings: preclinical investigations using in vivo models (such as PC patient-derived xenografts or genetically engineered mouse models) should confirm the functional relevance of the S100A14-S100A16-p53 axis in tumor progression, while clinical cohort studies are required to verify its prognostic and predictive value in larger patient populations.
Acknowledgement: None.
Funding Statement: This research was supported by the Yunnan Province Liu Liang Expert Workstation (No. 202305AF150148), Famous Doctor Projects of Yunnan Province (No. XDYC-MY-2022-0032), Yunnan Health Training Project of High Level Talents (No. L-2024029) and Innovation Team Special Program of Yunnan (No. 202505AS350004).
Author Contributions: Conception and design of the research: Pingping Hu, Zhenhao Fei, Yun Jin; Acquisition of data: Pingping Hu, Zhenhao Fei; Analysis and interpretation of data: Pingping Hu, Zhenhao Fei, Jianhua Bai, Zhiwen Wang; Statistical analysis: Jianhua Bai, Zhiwen Wang; Drafting the manuscript: Pingping Hu, Zhenhao Fei; Revision of manuscript for important intellectual content: Yun Jin. All authors reviewed the results and approved the final version of the manuscript.
Availability of Data and Materials: The datasets used and/or analyzed during the current study are available from the corresponding author upon reasonable request.
Ethics Approval: Not applicable.
Conflicts of Interest: The authors have no conflicts of interest to declare.
Appendix A
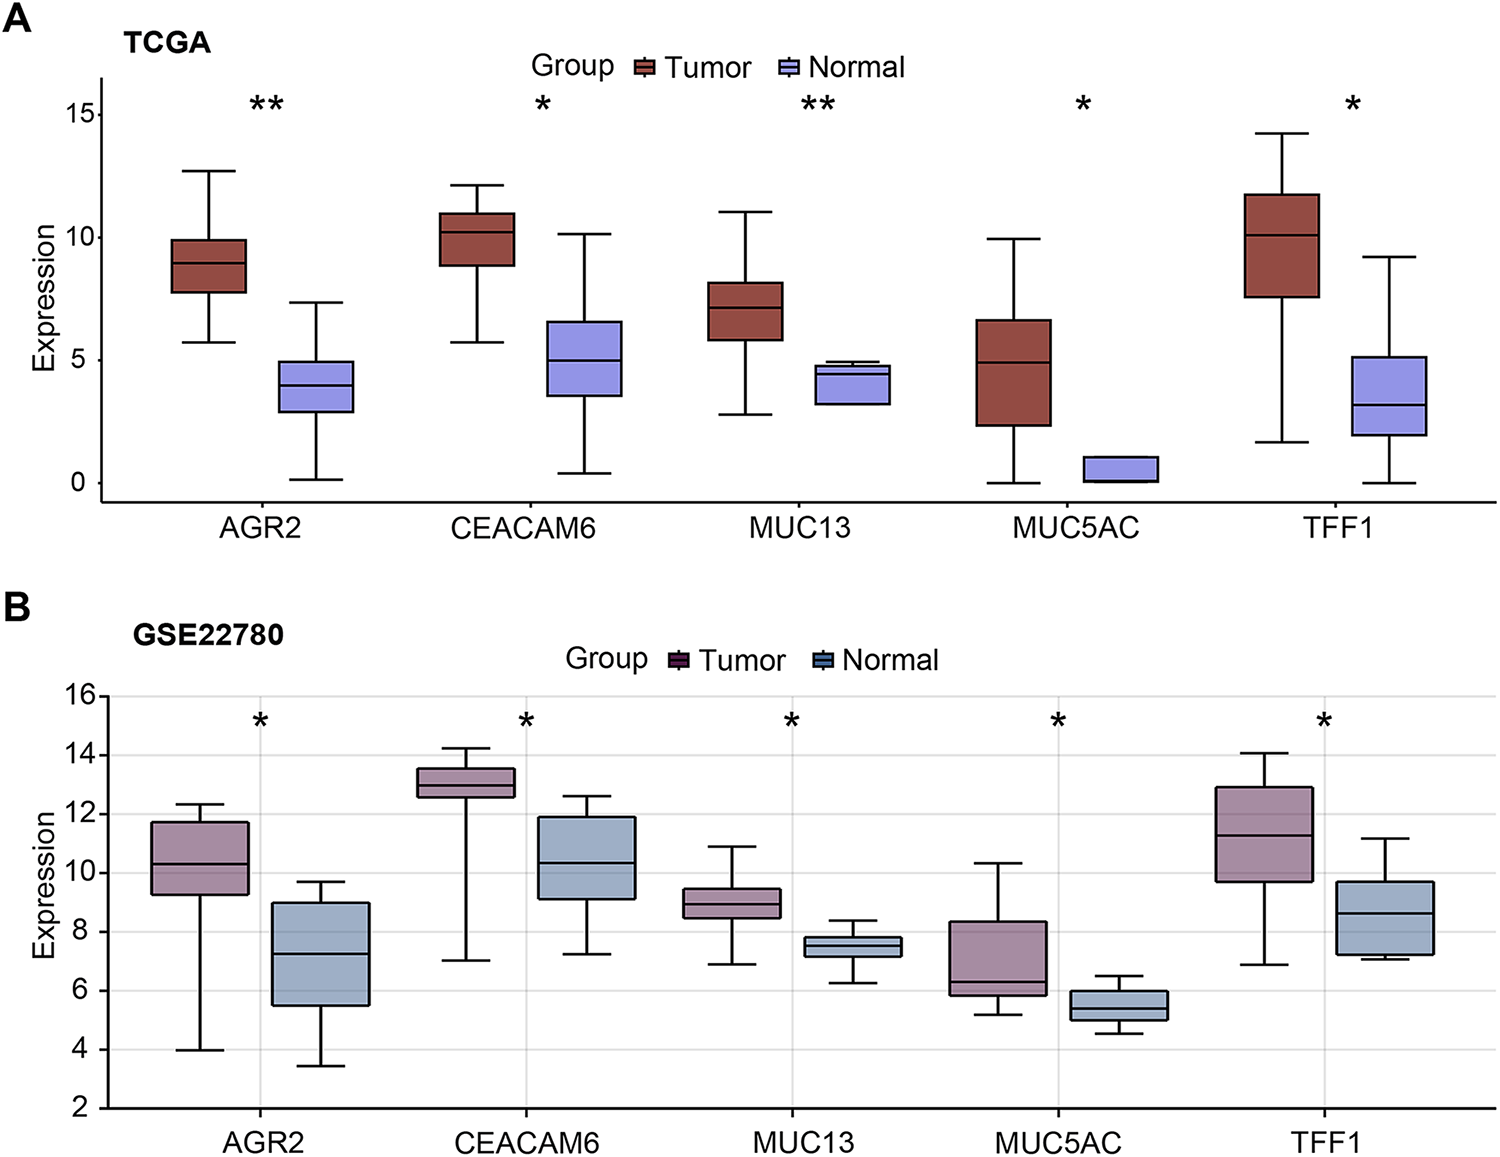
Figure A1: Expression profiles of hub genes in pancreatic cancer. (A,B) Boxplots showing AGR2, CEACAM6, MUC13, MUC5AC, and TFF1 mRNA expression levels in pancreatic tumor and normal tissue samples from TCGA-PAAD (A) and GSE22780 (B) datasets. TCGA-PAAD: The Cancer Genome Atlas-Pancreatic Adenocarcinoma. *p < 0.05, **p < 0.01
References
1. Lippi G, Mattiuzzi C. The global burden of pancreatic cancer. Arch Med Sci. 2020;16(4):820–4. doi:10.5114/aoms.2020.94845. [Google Scholar] [PubMed] [CrossRef]
2. Park W, Chawla A, O’Reilly EM. Pancreatic cancer: a review. JAMA. 2021;326(9):851. doi:10.1001/jama.2021.13027. [Google Scholar] [PubMed] [CrossRef]
3. Cho J, Petrov MS. Pancreatitis, pancreatic cancer, and their metabolic sequelae: projected burden to 2050. Clin Transl Gastroenterol. 2020;11(11):e00251. doi:10.14309/ctg.0000000000000251. [Google Scholar] [PubMed] [CrossRef]
4. Lang J, Kunovský L, Kala Z, Trna J. Risk factors of pancreatic cancer and their possible uses in diagnostics. Neoplasma. 2021;68(2):227–39. doi:10.4149/neo_2020_200706N699. [Google Scholar] [PubMed] [CrossRef]
5. Klein AP. Pancreatic cancer epidemiology: understanding the role of lifestyle and inherited risk factors. Nat Rev Gastroenterol Hepatol. 2021;18(7):493–502. doi:10.1038/s41575-021-00457-x. [Google Scholar] [PubMed] [CrossRef]
6. Mohammed S, Van Buren G II, Fisher WE. Pancreatic cancer: advances in treatment. World J Gastroenterol. 2014;20(28):9354–60. [Google Scholar] [PubMed]
7. Hua X, Zhang H, Jia J, Chen S, Sun Y, Zhu X. Roles of S100 family members in drug resistance in tumors: status and prospects. Biomed Pharmacother. 2020;127:110156. doi:10.1016/j.biopha.2020.110156. [Google Scholar] [PubMed] [CrossRef]
8. Gonzalez LL, Garrie K, Turner MD. Role of S100 proteins in health and disease. Biochim Biophys Acta Mol Cell Res. 2020;1867(6):118677. doi:10.1016/j.bbamcr.2020.118677. [Google Scholar] [PubMed] [CrossRef]
9. Wang C, Chen Y, Yin X, Xu R, Song J, Ruze R, et al. Construction of immune-related signature and identification of S100A14 determining immune-suppressive microenvironment in pancreatic cancer. BMC Cancer. 2022;22(1):879. doi:10.1186/s12885-022-09927-0. [Google Scholar] [PubMed] [CrossRef]
10. Zhu H, Gao W, Li X, Yu L, Luo D, Liu Y, et al. S100A14 promotes progression and gemcitabine resistance in pancreatic cancer. Pancreatology. 2021;21(3):589–98. doi:10.1016/j.pan.2021.01.011. [Google Scholar] [PubMed] [CrossRef]
11. Tanaka M, Ichikawa-Tomikawa N, Shishito N, Nishiura K, Miura T, Hozumi A, et al. Co-expression of S100A14 and S100A16 correlates with a poor prognosis in human breast cancer and promotes cancer cell invasion. BMC Cancer. 2015;15(1):53. doi:10.1186/s12885-015-1059-6. [Google Scholar] [PubMed] [CrossRef]
12. Tu G, Gao W, Li Y, Dian Y, Xue B, Niu L, et al. Expressional and prognostic value of S100A16 in pancreatic cancer via integrated bioinformatics analyses. Front Cell Dev Biol. 2021;9:645641. doi:10.3389/fcell.2021.645641. [Google Scholar] [PubMed] [CrossRef]
13. Ni L, Zheng YX, Gong TT, Xiu CM, Li K, Saijilafu, et al. Proinflammatory macrophages promote degenerative phenotypes in rat nucleus pulpous cells partly through ERK and JNK signaling. J Cell Physiol. 2019;234(5):5362–71. doi:10.1002/jcp.27507. [Google Scholar] [PubMed] [CrossRef]
14. Sapkota D, Costea DE, Ibrahim SO, Johannessen AC, Bruland O. S100A14 interacts with S100A16 and regulates its expression in human cancer cells. PLoS One. 2013;8(9):e76058. doi:10.1371/journal.pone.0076058. [Google Scholar] [PubMed] [CrossRef]
15. Janic A, Abad E, Amelio I. Decoding p53 tumor suppression: a crosstalk between genomic stability and epigenetic control? Cell Death Differ. 2025;32(1):1–8. doi:10.1038/s41418-024-01259-9. [Google Scholar] [PubMed] [CrossRef]
16. Patil MR, Bihari A. A comprehensive study of p53 protein. J Cell Biochem. 2022;123(12):1891–937. doi:10.1002/jcb.30331. [Google Scholar] [PubMed] [CrossRef]
17. Dowarha D, Chou RH, Yu C. S100A1 blocks the interaction between p53 and mdm2 and decreases cell proliferation activity. PLoS One. 2020;15(6):e0234152. doi:10.1371/journal.pone.0234152. [Google Scholar] [PubMed] [CrossRef]
18. Caban M, Małecka-Wojciesko E. Gaps and opportunities in the diagnosis and treatment of pancreatic cancer. Cancers. 2023;15(23):5577. doi:10.3390/cancers15235577. [Google Scholar] [PubMed] [CrossRef]
19. Wu Y, Zhou Q, Guo F, Chen M, Tao X, Dong D. S100 proteins in pancreatic cancer: current knowledge and future perspectives. Front Oncol. 2021;11:711180. doi:10.3389/fonc.2021.711180. [Google Scholar] [PubMed] [CrossRef]
20. Lin H, Yang P, Li B, Chang Y, Chen Y, Li Y, et al. S100A10 promotes pancreatic ductal adenocarcinoma cells proliferation, migration and adhesion through JNK/LAMB3-LAMC2 axis. Cancers. 2022;15(1):202. doi:10.3390/cancers15010202. [Google Scholar] [PubMed] [CrossRef]
21. Li HB, Wang JL, Jin XD, Zhao L, Ye HL, Kuang YB, et al. Comprehensive analysis of the transcriptional expressions and prognostic value of S100A family in pancreatic ductal adenocarcinoma. BMC Cancer. 2021;21(1):1039. doi:10.1186/s12885-021-08769-6. [Google Scholar] [PubMed] [CrossRef]
22. Zhuang H, Chen X, Dong F, Zhang Z, Zhou Z, Ma Z, et al. Prognostic values and immune suppression of the S100A family in pancreatic cancer. J Cell Mol Med. 2021;25(6):3006–18. doi:10.1111/jcmm.16343. [Google Scholar] [PubMed] [CrossRef]
23. Jiang S, Zhu Y, Chen Z, Huang Z, Liu B, Xu Y, et al. S100A14 inhibits cell growth and epithelial-mesenchymal transition (EMT) in prostate cancer through FAT1-mediated Hippo signaling pathway. Hum Cell. 2021;34(4):1215–26. doi:10.1007/s13577-021-00538-8. [Google Scholar] [PubMed] [CrossRef]
24. Zhang Y, Sun M, Gao L, Liang X, Ma C, Lu J, et al. ZHX2 inhibits thyroid cancer metastasis through transcriptional inhibition of S100A14. Cancer Cell Int. 2022;22(1):76. doi:10.1186/s12935-022-02499-w. [Google Scholar] [PubMed] [CrossRef]
25. Huang LY, Xu Y, Cai GX, Guan ZQ, Sheng WQ, Lu HF, et al. S100A4 over-expression underlies lymph node metastasis and poor prognosis in colorectal cancer. World J Gastroenterol. 2011;17(1):69–78. doi:10.3748/wjg.v17.i1.69. [Google Scholar] [PubMed] [CrossRef]
26. Wang H, Mao X, Ye L, Cheng H, Dai X. The role of the S100 protein family in glioma. J Cancer. 2022;13(10):3022–30. doi:10.7150/jca.73365. [Google Scholar] [PubMed] [CrossRef]
27. Basnet S, Vallenari EM, Maharjan U, Sharma S, Schreurs O, Sapkota D. An update on S100A16 in human cancer. Biomolecules. 2023;13(7):1070. doi:10.3390/biom13071070. [Google Scholar] [PubMed] [CrossRef]
28. Li T, Ren T, Huang C, Li Y, Yang P, Che G, et al. S100A16 induces epithelial-mesenchymal transition in human PDAC cells and is a new therapeutic target for pancreatic cancer treatment that synergizes with gemcitabine. Biochem Pharmacol. 2021;189:114396. doi:10.1016/j.bcp.2020.114396. [Google Scholar] [PubMed] [CrossRef]
29. Fang D, Zhang C, Xu P, Liu Y, Mo X, Sun Q, et al. S100A16 promotes metastasis and progression of pancreatic cancer through FGF19-mediated AKT and ERK1/2 pathways. Cell Biol Toxicol. 2021;37(4):555–71. doi:10.1007/s10565-020-09574-w. [Google Scholar] [PubMed] [CrossRef]
30. Muñoz-Fontela C, Mandinova A, Aaronson SA, Lee SW. Emerging roles of p53 and other tumour-suppressor genes in immune regulation. Nat Rev Immunol. 2016;16(12):741–50. doi:10.1038/nri.2016.99. [Google Scholar] [PubMed] [CrossRef]
31. Chen H, Yuan Y, Zhang C, Luo A, Ding F, Ma J, et al. Involvement of S100A14 protein in cell invasion by affecting expression and function of matrix metalloproteinase (MMP)-2 via p53-dependent transcriptional regulation. J Biol Chem. 2012;287(21):17109–19. doi:10.1074/jbc.M111.326975. [Google Scholar] [PubMed] [CrossRef]
32. Chen P, He Z, Wang J, Xu J, Jiang X, Chen Y, et al. Hypoxia-induced ZWINT mediates pancreatic cancer proliferation by interacting with p53/p21. Front Cell Dev Biol. 2021;9:682131. doi:10.3389/fcell.2021.682131. [Google Scholar] [PubMed] [CrossRef]
Cite This Article
 Copyright © 2026 The Author(s). Published by Tech Science Press.
This work is licensed under a Creative Commons Attribution 4.0 International License , which permits unrestricted use, distribution, and reproduction in any medium, provided the original work is properly cited.
 Downloads
 Citation Tools