
 Submit a Paper
 Propose a Special lssue
 Open Access
ARTICLE

Growth and Transcriptomics Analysis of Michelia macclurei Dandy Plantlets with Different LED Quality Treatments
Research Institute of Tropical Forestry, Chinese Academy of Forestry, Guangzhou, 510520, China
* Corresponding Author: Ying Liu. Email:
Phyton-International Journal of Experimental Botany 2023, 92(10), 2891-2906. https://doi.org/10.32604/phyton.2023.030664
Received 17 April 2023; Accepted 17 July 2023; Issue published 15 September 2023
 View Full Text
 Download PDF
Abstract
Michelia macclurei Dandy is a significant tree species that has extensive cultivation for forestry and horticulture purposes in southern China, owing to its economic and practical importance. Light quality influences plantlet growth and development during tissue culture. However, the growth characteristic and molecular regulation of M. macclurei under different light quality conditions are not well understood yet. In this study, we investigated the morphological, chlorophyll content, and transcriptomic responses of M. macclurei plantlets under different light-emitting diode (LED) qualities, including white, blue, and red light. The results showed that blue light significantly increased plant height (21.29%) and leaf number (18.65%), while red light decreased plant height and leaf number by 7.53% and 16.49%, respectively. In addition, the plantlets’ chlorophyll content and etiolation rate were significantly reduced by blue and red light quality compared to white light. Compared to white light, blue light had a negative effect, leading to decreased rooting rate (64.28%), root number (72.72%), and root length (75.86%). Conversely, red light had a positive effect, resulting in increased rooting rate (24.99%), root number (109.58%), and root length (72.72%). Transcriptome analysis identified 54 differentially expressed genes (DEGs) in three groups that consisted of blue light vs. white light (BL-vs-WL), red light vs. white light (RL-vs-WL), and red light vs. blue light (RL-vs-BL). Specifically, 21, 7, and 41 DEGs were identified in the three groups, respectively. The DEGs found in the RL-vs-WL and BL-vs-WL groups were involved in plant hormone signaling, nitrogen metabolism, and phenylpropanoid biosynthesis pathways, which suggests that M. macclurei plantlets adapt to the changes of light quality via modulating gene expression. Overall, our study provides valuable insights for understanding the molecular and morphological responses of M. macclurei plantlets under different light qualities.Keywords
Supplementary Material
Supplementary Material FileLight is a crucial environmental factor that strongly influences the growth and development of plants, determining both the external morphology and internal structure of plant organs [1,2]. One of the most important mechanisms for light regulation of plant growth and development is the selective activation of light receptors, such as red and far-red light activate the activity of phytochrome, and blue light activates the activity of cryptochrome and phototropin [3,4]. Light quality is a key aspect of the light environment, affecting various physiological processes including photosynthesis, photomorphogenesis, and regulation of growth and development. In recent years, numerous studies have investigated the effects of different light qualities on plant growth and development, among which red and blue light are the most extensively researched [5,6]. For example, a study has demonstrated that red light inhibits shoot development in Petunia hybrida, while blue light considerably promotes the development of shoot [7]. Inversely, red light significantly stimulates plant height in tomatoes, while blue light results in the compact size of shoots [8]. Research on lettuce has shown that both fluorescent lights plus blue light and fluorescent light plus red light can improve aboveground biomass, while they are most inhibited under monochromatic blue light compared to fluorescent light [9]. Taken together, these studies suggeste that the effects of light quality on different plant species or cultivars are different [10].
The use of light-emitting diode (LED) technology in plant growth regulation has become increasingly popular due to its numerous advantages, such as its lightweight and compact design, long service lifespan, and high photosynthetically effective radiation [11]. Despite its high cost and limited irradiation angles, LED technology is still considered a suitable artificial light source for plant breeding. As a result, it has been widely applied in this field. A previous study has demonstrated that prolonged exposure to specific light conditions can indirectly influence the critical biological process of energy conversion and plant biomass accumulation by affecting the plant chloroplast properties [12]. Photosynthetic pigments including chlorophyll, reaction center pigments, and accessory pigments, play a vital role in the absorption, transmission, and conversion of light energy in plants. Research has indicated that the chlorophyll content of potato plantlets was reduced when exposed to pure red or blue LEDs, in comparison to a combination of red and blue LEDs [13]. Moreover, the study has reported that the chlorophyll content of Plectranthus scutellarioides shoots significantly increased when exposed to blue light or a combination of red, green, and blue light [14].
Michelia macclurei Dandy is an evergreen tree species of the Magnoliaceae family that is widely used for landscaping, soil improvement, and plantations in tropical and subtropical regions of China due to its economic and ecological importance [15]. M. macclurei is a valuable species for reforestation and ecological restoration because of its strong adaptability, rapid growth, ability to maintain soil fertility, and resist fire [16,17]. The in vitro breeding of M. macclurei is carried out using tissue culture and detoxification technology, which is an essential method for the propagation of noble species. To obtain robust seedlings and excellent cultivars of M. macclurei plantlets, it is necessary to artificial regulation the light conditions to promote growth.
Light quality can potentially affect plant phenotype by modifying physiological, biochemical, and molecular pathways. Recently, RNA-seq has proven to be a valuable method for investigating molecular level changes in plant growth and development under diverse light qualities [18,19]. For instance, Chen et al. observed different gene expression patterns in potatoes in response to different light qualities, which had impacts on various metabolic pathways [20]. Similarly, Huang et al. found that the primary metabolic processes of pitaya (Hylocereus undatus) seedlings were significantly affected under red and blue light quality, such as glucose metabolism and photosynthesis [21]. They observed that red light treatment reduced gene expression and metabolite accumulation in these metabolic pathways, while blue light was able to reverse this trend. In Arabidopsis seedlings exposed to dim blue light, several members of the cell wall-modifying xyloglucan endotransglucosylase/hydrolase (XTH) protein family were regulated, leading to a reduction in blue light-induced phenotypic traits, such as shoot elongation to consolidate light uptake [22,23]. However, the molecular mechanisms regulating the growth and development of M. macclurei plantlets under different light qualities are still poorly understood.
Based on the information presented above, we propose three hypotheses concerning the response of M. macclurei plantlets to various light quality treatments: (1) blue and red light qualities inhibit the growth and development of aboveground parts in comparison to white light; (2) blue and red light qualities reduce the chlorophyll content of the leaves compared to white light; (3) the expression patterns of genes closely related to the physiological metabolic pathways in the roots of M. macclurei plantlets change under different LED light quality treatments. To validate the hypotheses, the effect of different light qualities on the growth and chlorophyll characteristics of M. macclurei seedlings were investigated using red, blue, and white LED light sources. In addition, the molecular mechanisms underlying the response of M. macclurei seedlings to different light qualities were investigated utilizing RNA-seq technology. To the best of our knowledge, this study is the first to provide comprehensive data on the morphology and transcriptome of M. macclurei plantlets in response to various light quality treatments. The findings of this study have potential economic benefits and practical value by providing a reference for optimizing the cultivation conditions of M. macclurei in forestry and horticulture. Moreover, this study also contributes to our understanding of the molecular basis of woody plant responses to changes in light quality.
2.1 Experimental Design and Growth Conditions
These experiments were carried out at the Research Institute of Tropical Forestry, Chinese Academy of Forestry, China. M. macclurei plantlets were maintained in our laboratory. The seedlings were grown under controlled conditions using tissue culture techniques within an energy-efficient framework with LED lighting. The tissue culture frame comprised five layers, and each layer measures 130 cm × 70 cm × 35 cm (length × width × height), with two 130 cm long LED lights per layer positioned 25 cm away from the plantlets. LEDs emitted red light with wavelengths from 620 to 720 nm, blue light with wavelengths from 450 to 500 nm, and full-spectrum white light within the 390 to 780 nm wavelength range. Using a spectroradiometer (Type specification: HP350PM, Tuodapu., Dongguan, China) to assess the spectral properties of LED lamps, blue light peaks at 469.3 nm and red light peaks at 669.7 nm. Light intensity was 8500 lux, and the photosynthetic photon flux density (PPFD) was 99.5 μmol m−2 s−1. M. macclurei plantlets were cultivated on solid Murashige and Skoog (MS) medium [24] supplemented with sucrose (30 g∙L−1) and agar (7.5 g∙L−1). Starting from November 8, 2018, the plantlets were subjected to a culture room with a relative humidity of 36% for an 8-h dark period at 16°C and a 16-h light period at 25°C. A total of 315 seedlings with a plant height of 3.5 cm and three fully developed leaves. These seedlings were randomly divided into three different light quality treatments, with each treatment having 105 plants distributed among 21 bottles. Each treatment contained three replicates, with each consisting of 35 plants that were placed in seven bottles. After 47 days of treatment, three replicates per experiment were collected, immediately frozen in liquid nitrogen, and stored at −80°C until further analysis.
2.2 Measurements of Seedling Growth Traits
After 47 days of three different in vitro light treatments, 180 M. macclurei plantlets (60 plants of 12 bottles per treatment) were randomly selected to assess their growth and chlorophyll content. Plant height, leaf number, leaf length, and leaf width (the widest part of the leaves) were measured with a ruler, and the etiolation rate of leaves was calculated as follows: Leaves etiolation rate (%) = number of plant yellow leaves ÷ total number of plant leaves. Then, the main root length was measured with a ruler and the number of roots was counted. The rooting rate for each treatment was calculated as follows:
2.3 Total RNA Extraction and RNA-Seq Analysis
Root samples of M. macclurei from three light treatment groups (white, red, and blue) were collected after 47 days. The total RNA of each sample was extracted separately utilizing the TIANDZ Plant RNA Kit (TIANDZ column type RNAout 2.0, Beijing), and its amount and purity were evaluated by agarose gel electrophoresis and the Nanodrop 2100 (Agilent, USA). Sequencing libraries of three biological replicates per treatment were then prepared from each of the nine samples and analyzed on an Illumina HiSeq™ 4000 (150-bp, Illumina, USA) platform at Wuhan Frasergen Information Co., Ltd. (Wuhan, China). Quality control was performed by removing reads with adaptor sequences, N’s greater than 10% and some low-quality reads (Qphred ≤ 20 for >50% reads). The transcriptome was assembled using Trinity software with default parameters [25], and open reading frames (ORFs) were predicted using a trans Decoder [26]. Expression abundance was quantified and normalized to expected fragments per kilobase per million mapped reads (FPKM) of transcript sequences [27].
2.4 DEG Identification and Functional Annotation
Normalization of gene expression levels was performed by calculating FPKM [27]. Differentially expressed genes (DEGs) were identified using the edgerR package by first analyzing the Pearson correlation between samples [28], and then adjusting the resulting p-values to control for the false discovery rate (FDR) using the method of Benjamini et al. [29]. DEGs were determined by edgerR as genes with adjusted p-values less than 0.05 and log2FC (fold change) greater than 1 or less than −1. Enrichment analyses of Gene Ontology (GO) and Kyoto Encyclopedia of Genes and Genomes (KEGG) were then performed using the Goseq R package [30] and KOBAS software [31] for functional annotation of DEGs. Statistical significance was determined using corrected p-values less than 0.05.
2.5 qRT-PCR Validation and Expression Analysis
Quantitative real-time PCR (qRT-PCR) was performed with the same total RNA and cDNA samples (WL-1, WL-2, WL-3; BL-1, BL-2, BL-3; RL-1, RL-2, RL-3) for transcriptome sequencing. The qRT-PCR assays were performed using TB Green Premix Ex TaqTM (RR820, TaKaRa, China). The qRT-PCR reaction system and procedures were performed according to the kit requirements. All qRT-PCR amplifications were repeated three times according to the standard procedure. Beta-tubulin (TUB2, TRINITY_DN696_c0_g1) was used as an internal control. The relative abundance of transcripts was calculated using the 2-ΔΔCT method [32]. The details of the gene-specific primers used in qRT-PCR are listed in Table S1.
Data were processed using Microsoft Excel 2016 and presented as the means along with the standard deviation (SD). All statistical analyses were performed using IBM Statistical Product and Service Solutions for Windows, version 26 (IBM SPSS26, Chicago, IL, USA). Specifically, a one-way analysis of variance (ANOVA) was performed on the data for each treatment, and the significance of mean differences was tested by applying Tukey’s test (p-values < 0.05).
The light quality of different wavelengths serves as an environmental signal factor, providing the main energy source for plants and greatly influencing their production status. An appropriate light environment can effectively increase plant production. However, specific light wavelengths may lead to different morphological and physiological responses in plants, with red and blue light being among the most consequential colors for plant growth and development. Red light stimulates nutrient synthesis and cell division, while blue light promotes plant development and formation [33]. During photosynthesis in plant production, chlorophyll a and chlorophyll b efficiently absorb blue and red light, respectively. Therefore, examining the alterations in plant morphology, physiology, and gene expression levels induced by red and blue light in plant production and tissue culture, and then regulating light quality according to the response of the plant, can enhance plant growth and development, as well as improve yield and quality. LED is a new type of artificial light source that can precisely modulate light quality and intensity, and plants can complete the entire growth process under LED lighting conditions. Consequently, the growth and development of M. macclurei plantlets under different LED light qualities have been extensively discussed. Nevertheless, research on how light quality affects the growth and development of M. macclurei plantlets at the phenotypic and molecular levels is still limited. In this study, we investigated the effects of three different light qualities on the morphology, physiology, and transcriptome of M. macclurei plantlets.
3.1 Effects of Light Quality on Aboveground Growth
In this study, we investigated the effects of varying light qualities on the aboveground growth of M. macclurei plantlets and found that light quality had a significant effect on their growth. Specifically, compared to white light, blue light led to a substantial increase of 21.29% in plant height and 18.65% in leaf number, while red light resulted in a decrease in plant height (7.53%) and leaf number (16.49%) (Figs. 1A and 1B). However, leaf dimensions, such as length and width, did not demonstrate any remarkable alterations under different light quality conditions (Figs. 1C and 1D). These findings demonstrated that blue light enhances the expansion of M. macclurei plantlets by increasing plant height and leaf number, while red light negatively affects morphology, making the plant shorter and thicker. In contrast, red light was found to augment plant height and leaf area in Sarcandra glabra and ramie (Boehmeria nivea), compared to blue and white light [8,34]. The difference in response to red and blue light among different plant species suggested species-specificity in the effects of light quality on plant growth and development. This specificity is further supported by the higher shoot growth of tomatoes [8] and Welsh onions [35] under blue light than other light qualities. The promotion or inhibition of shoot growth is heavily dependent on the synergistic interaction between blue and red light receptors (cryptochromes and phytochromes), so further investigation of this underlying mechanism is necessary.
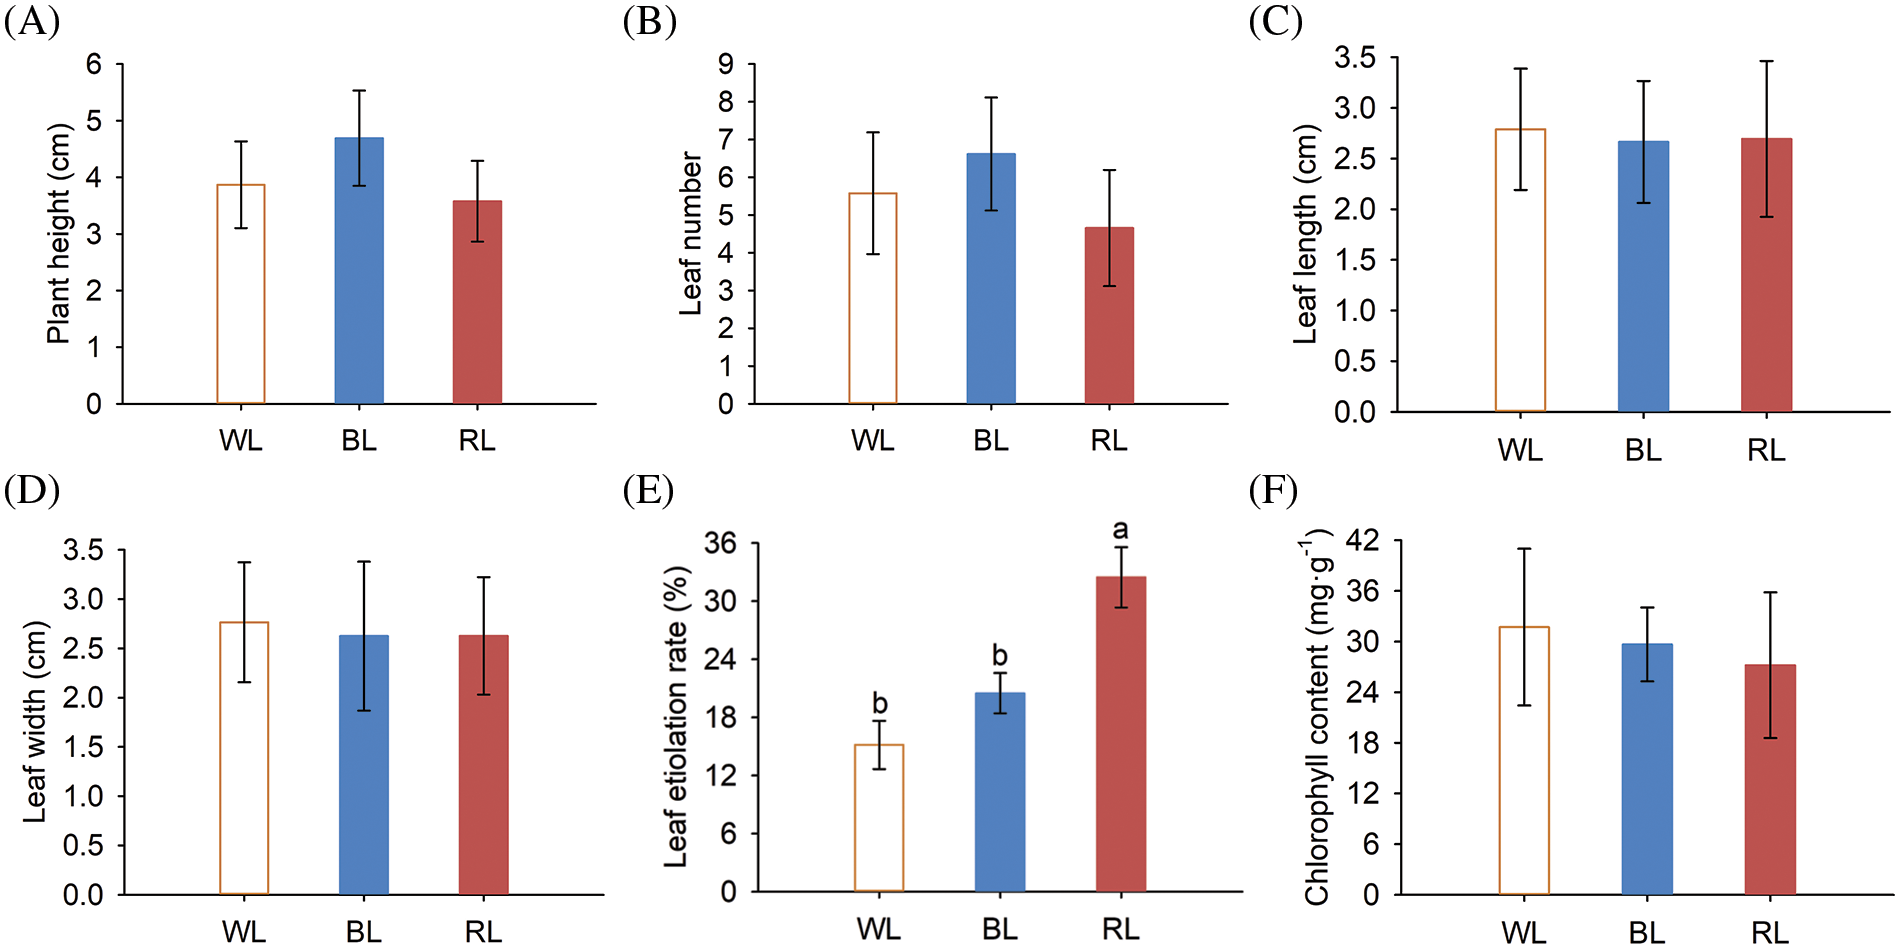
Figure 1: Aboveground part growth phenotypes and chlorophyll content of M. macclurei plantlets under white, blue, and red light quality treatments. A: plant height of M. macclurei; B: leaf number of M.macclurei; C: leaf length of M. macclurei; D: leaf width of M. macclurei; E: leaf etiolation rate of M.macclurei; F: chlorophyll content of M. macclurei leaves. WL means white light, RL means red light, and BL means blue light. The values for each column represent the means of three replicates, and the error bar in each column represents the standard deviation between repetitions. Different letters represent significant differences between groups (p-values < 0.05)
Plants respond to diverse light qualities through two systems: photoreceptors and chloroplasts [36]. Chlorophyll is an essential pigment that converts light into chemical energy and is crucial for photosynthesis. Unsuitable light quality caused plant stress with adaptive responses. Changes in the etiolation rate and chlorophyll content constitute of leaves constitute the adaptation of plants to different light qualities. Leaf etiolation rates of M. macclurei plantlets increased by 35.31% and 114.26% under blue and red light, respectively (Fig. 1E). Correspondingly, the chlorophyll content decreased by 6.47% and 35.31% under blue and red light (Fig. 1F). Compared to white light, both blue and red light led to leaf etiolation and reduced chlorophyll content, with the inhibitory effect of red light was more significant than that of blue light. These results indicated that red and blue light reduced the photosynthetic capacity of plants. Similar findings have been reported in tomato and leaf lettuce seedlings under different lighting conditions [8,34].
3.2 Effects of Light Quality on Root Growth
Light can transmit signals to the root system through aerial parts, indirectly modulating root growth. We investigated the effects of various light quality conditions on the root characteristics of M. macclurei plantlets and found that root characteristics varied significantly under different light quality conditions. Notably, compared with the white light treatment, the rooting rate (24.99%), root number (109.58%), and root length (14.90%) of the red light treatment increased significantly. In contrast, the rooting rate (64.28%), root number (72.72%), and root length (75.86%) of plantlets treated with blue light were substantially decreased, compared with those exposed to white light (Figs. 2A–2C). These results suggested that red light fosters the root growth of M. macclurei, while blue light inhibits it. For most plants, the proportion of red light in the light quality requirements for root growth was greater than that of blue light [37–39]. However, Rehmannia glutinosa responded differently to light quality, as blue LED light can enhance root growth compared with red light, revealing the species-specificity of light quality on plant development [40].
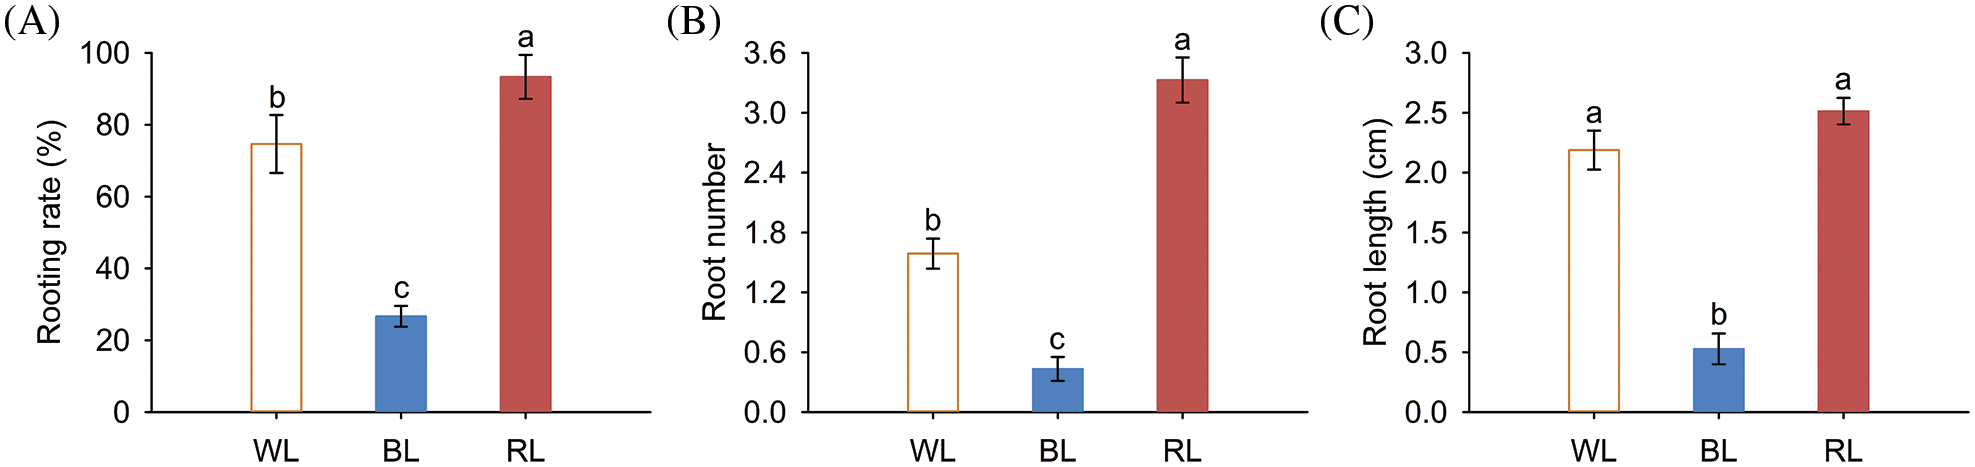
Figure 2: Underground growth phenotypes of M. macclurei plantlets under white, blue, and red light quality treatments. A: rooting rate of M. macclurei; B: root number of M. macclurei; C: root length of M. macclurei. WL means white light, RL means red light, and BL means blue light. The values for each column represent the means of three replicates, and the error bar in each column represents the standard deviation between repetitions. Different letters represent significant differences between groups (p-values < 0.05)
3.3 RNA-Seq, de novo Transcriptome Assembly and Functional Annotation Analysis
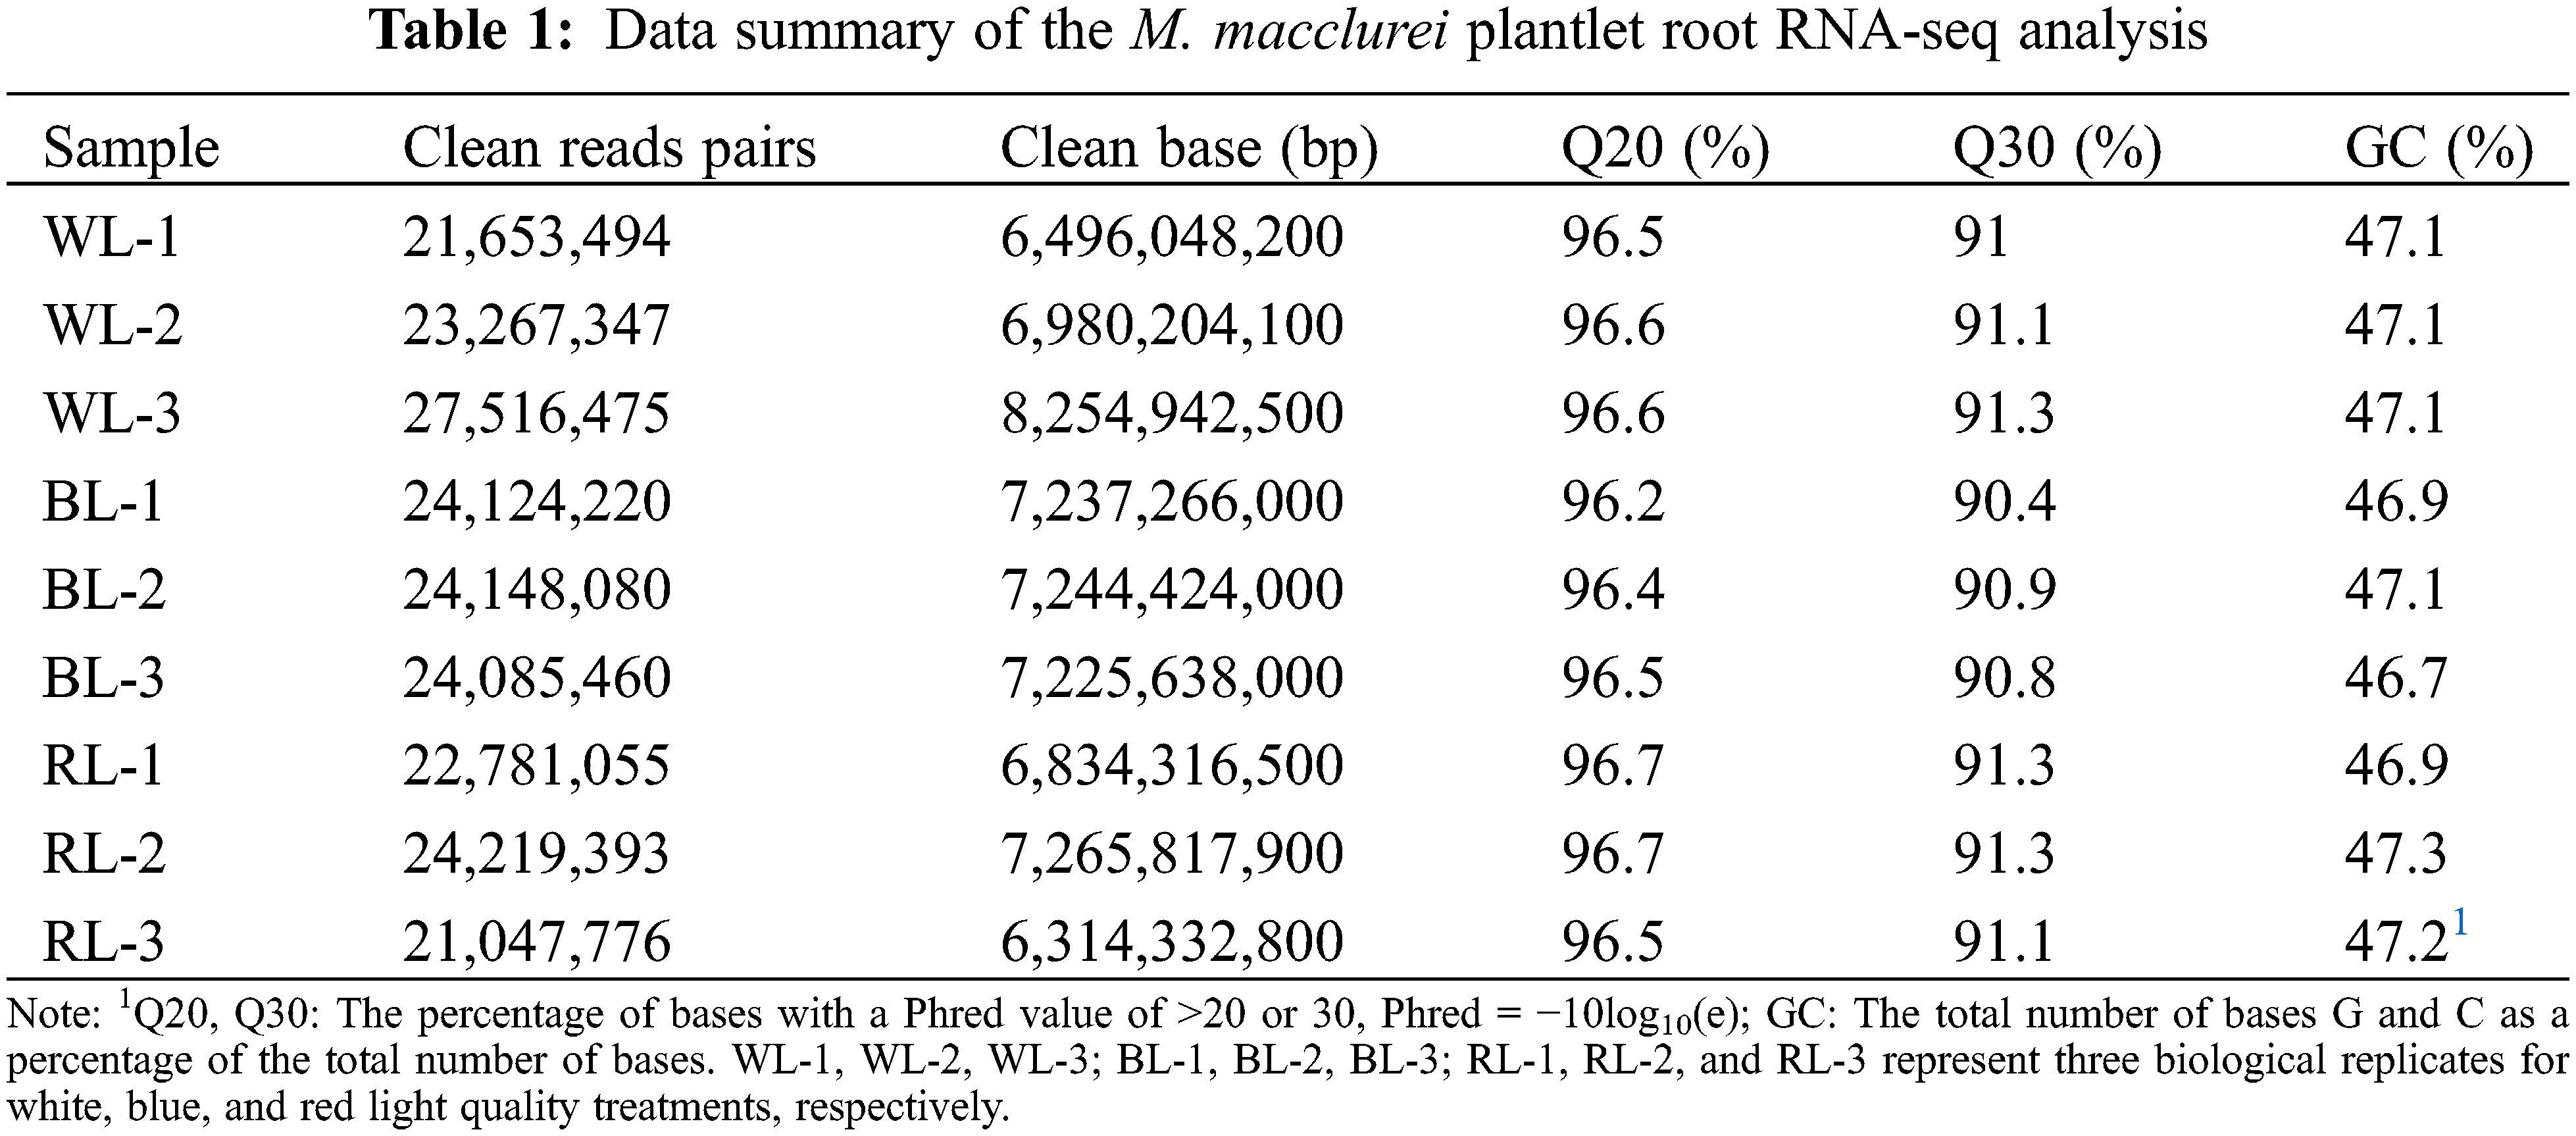
The gene expressions can be modulated by light quality, thereby initiating specific signaling cascades mediated by photoreceptors [41]. Given the documented impacts of red and blue light on the root growth of M. macclurei plantlets, RNA-seq analysis of their root tissues was performed using the Illumina HiSeqTM 4000 platform to identify potential genes involved in the light response. As presented in Table 1, each sample generated at least 6,314,332,800 base pairs of clean data. The quality of the RNA-seq data was evidenced by the high percentage of Q20 and Q30 bases, exceeding 96.2% and 90.4%, respectively. Reads were combined and assembled into 121,201 isoforms and 83,798 uniform genes, with an average length of 977 base pairs.
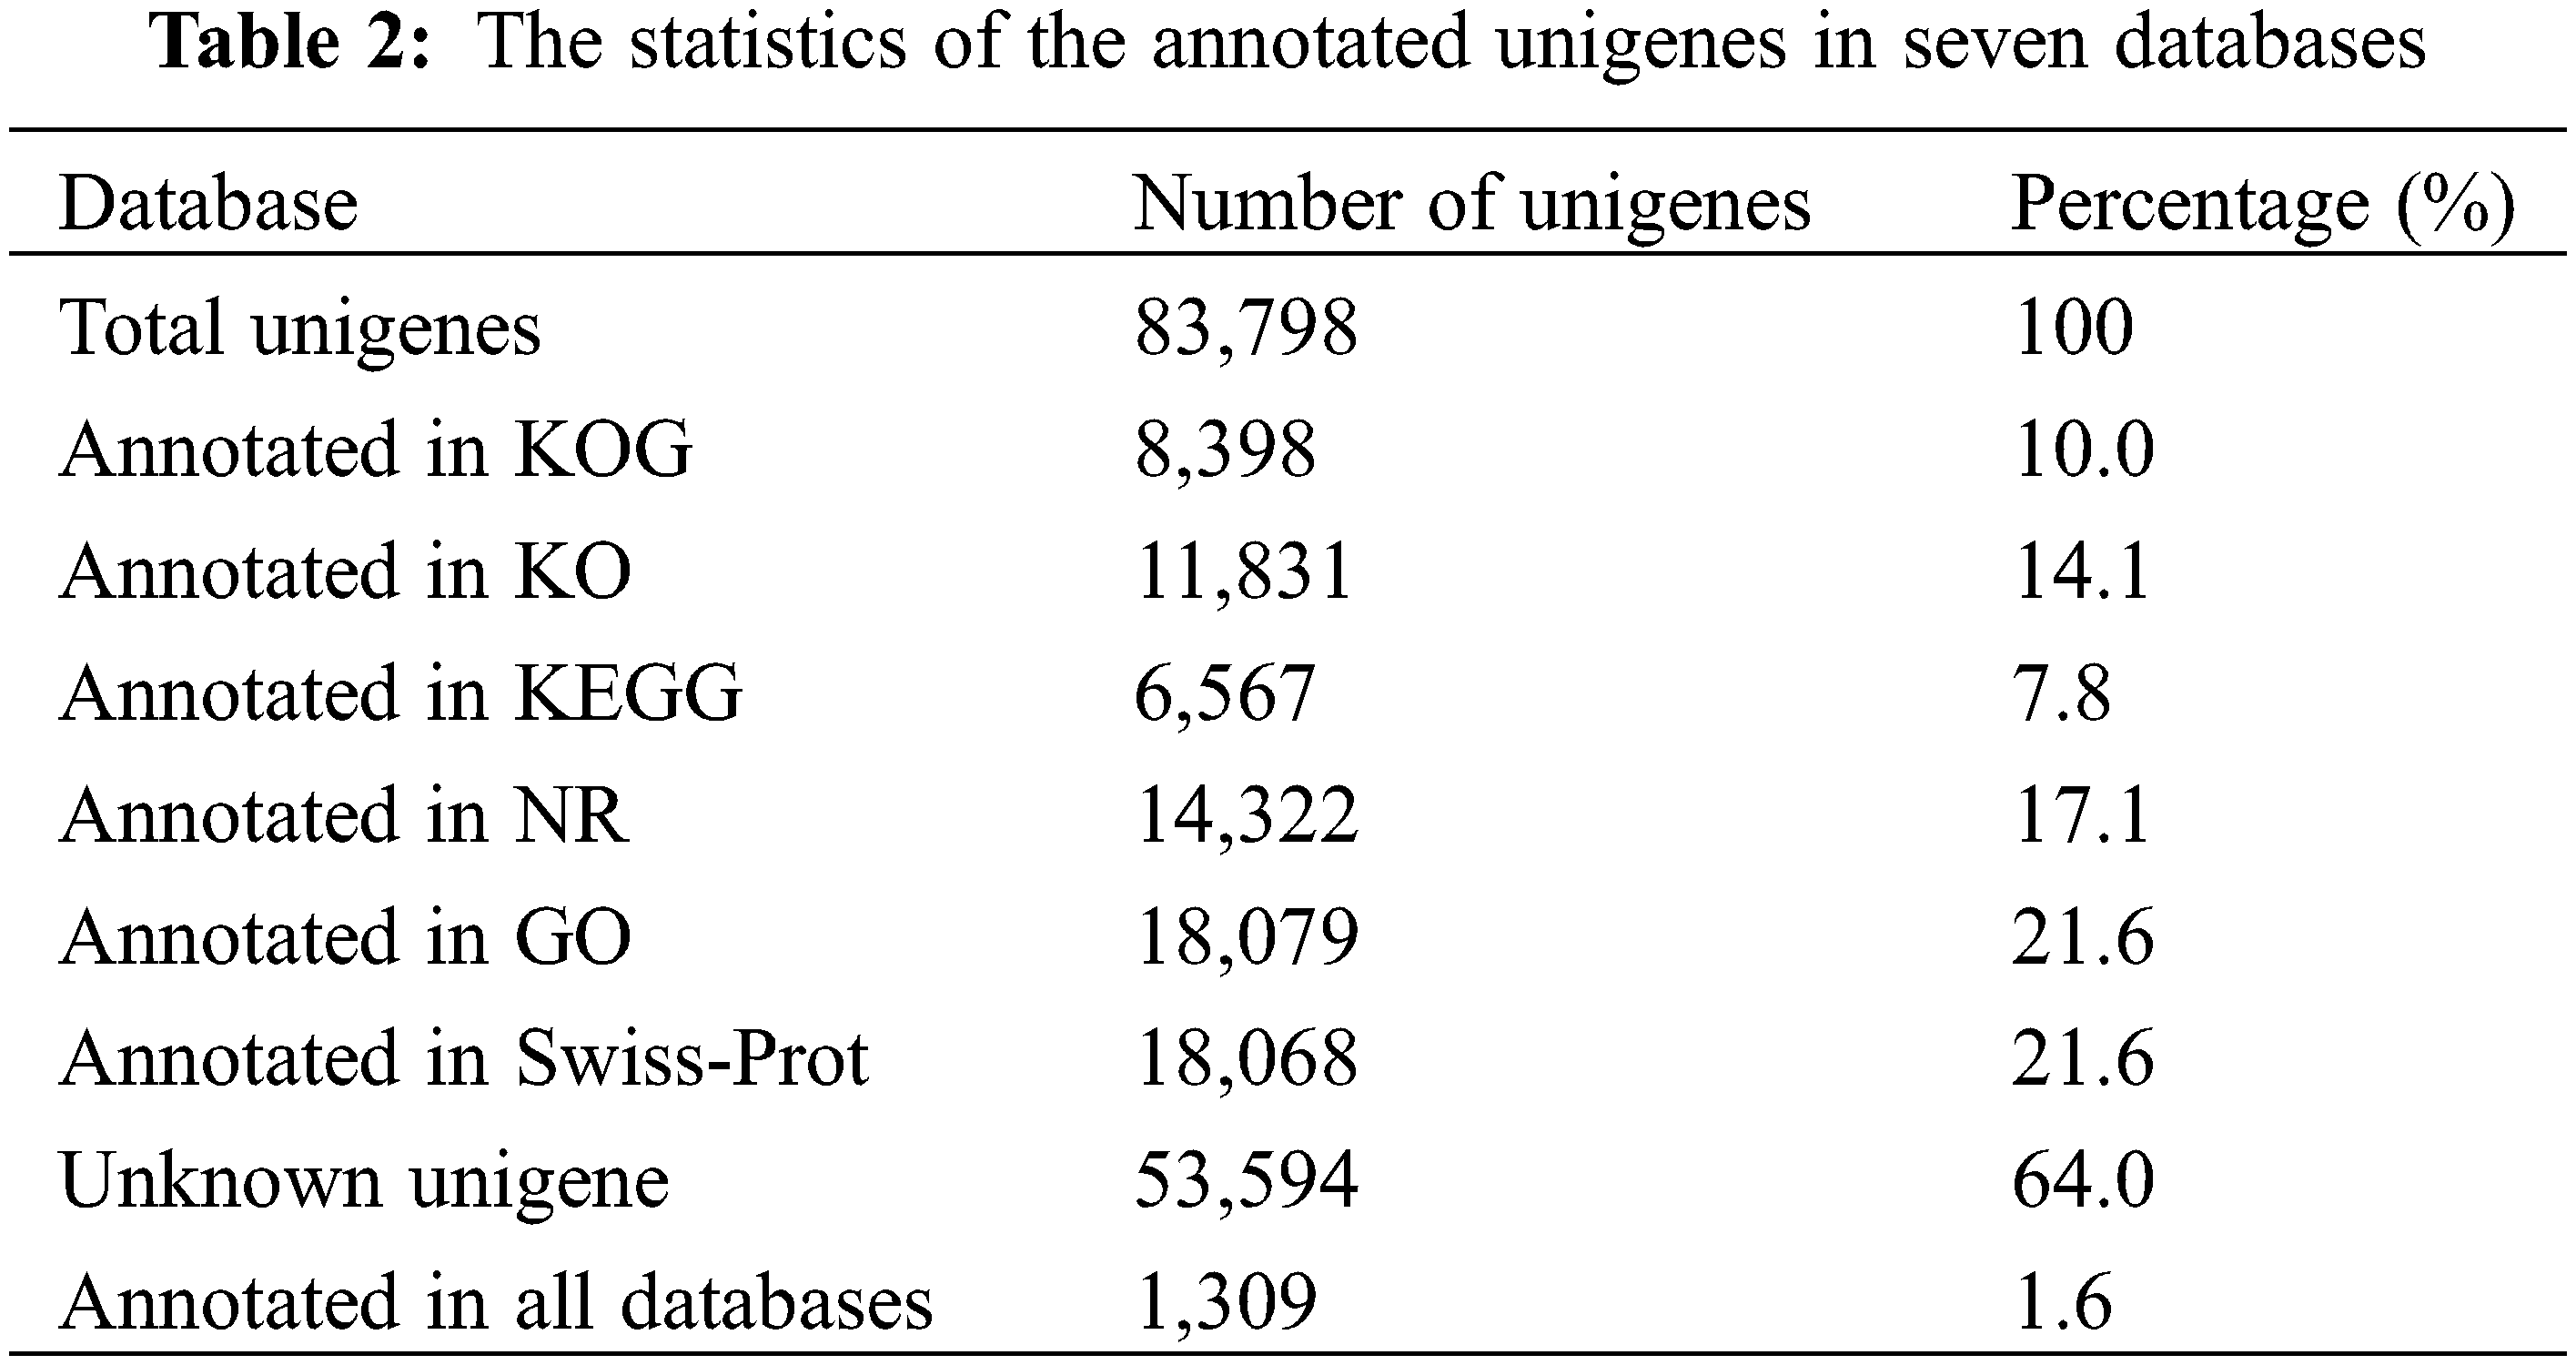
Next, we functionally annotated the unigenes using six public databases (Table 2). Specifically, we searched for matches of unigenes with an E value of 1 × e−5 in the NCBI nonredundant protein database (NR) and the Swiss-Prot database using Diamond software. Our results indicated that 14,322 (17.1%) unigenes were matched in the NCBI-NR database, while 18,068 (21.6%) unigenes were matched in the Swiss-Prot database. Furthermore, functional annotations revealed that 53,594 (64.0%) unigenes were not annotated in any database, while only 1,309 (1.6%) unigenes were annotated in all six databases. We also performed GO assignments to functionally categorize these annotated unigenes. Among the annotated unigenes, 18,079 were assigned to at least one GO term. Additionally, we used assignments from the KEGG to obtain alternative functional annotations of enzymes involved in biochemical processes and their respective Enzyme Commission (EC) numbers. Our results showed that 6,567 (7.8%) unigenes were assigned to at least one KEGG pathway.
3.4 Differentially Expressed Genes Analysis
We identified DEGs among different comparison groups, including blue light-treated samples compared to white light-treated samples (BL-vs-WL), red light-treated samples compared to white light-treated samples (RL-vs-WL), and red light-treated samples compared to blue light-treated samples (RL-vs-BL). A total of 54 DEGs were identified, with 21 DEGs in the BL-vs-WL comparison set, including 16 up-regulated and 5 downregulated genes (Fig. 3A and Table S2). In the RL-vs-WL comparison set, 7 DEGs were identified, including 4 upregulated and 3 downregulated genes (Fig. 3A and Table S2). Moreover, the RL-vs-BL comparison set exhibited 41 DEGs, of which 5 genes were upregulated, and 36 genes were downregulated (Fig. 3A and Table S2). Venn diagram analysis revealed that 7, 2, and 30 DEGs were uniquely expressed in the BL-vs-WL, RL-vs-WL, and RL-vs-BL comparison sets, respectively (Fig. 3B and Table S2). Notably, the RL-vs-BL comparison set exhibited more DEGs than the BL-vs-WL or RL-vs-WL comparison sets, suggesting that red and blue light treatments had distinct effects on the gene expression pattern of roots.
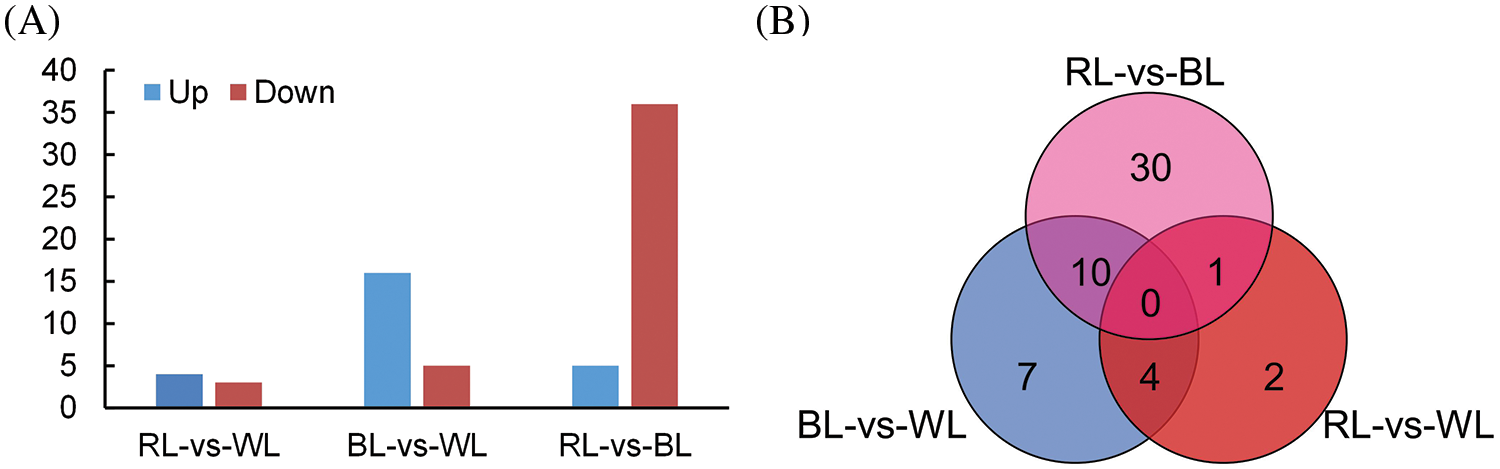
Figure 3: Differentially expressed genes (DEGs) in M. macclurei roots under different comparison groups. A: the number of upregulated and downregulated DEGs under three comparison groups; BL-vs-WL means blue light vs. white light, RL-vs-WL means red light vs. white light, and RL-vs-BL means red light vs. blue light. B: The differentially expressed genes from M. macclurei plantlets in each comparison
To verify the authenticity and repeatability of the transcriptome data, ten DEGs were randomly selected and their expression profiles in WL, BL, and RL samples were analyzed using qRT-PCR. The relative expression levels obtained by qRT-PCR were compared with the RNA-Seq data. The results demonstrated that the qRT-PCR expression profiles of the selected DEGs were consistent with those obtained through high-throughput sequencing (as shown in Fig. 4), thus demonstrating the reliability of the transcriptome sequencing results in the study.
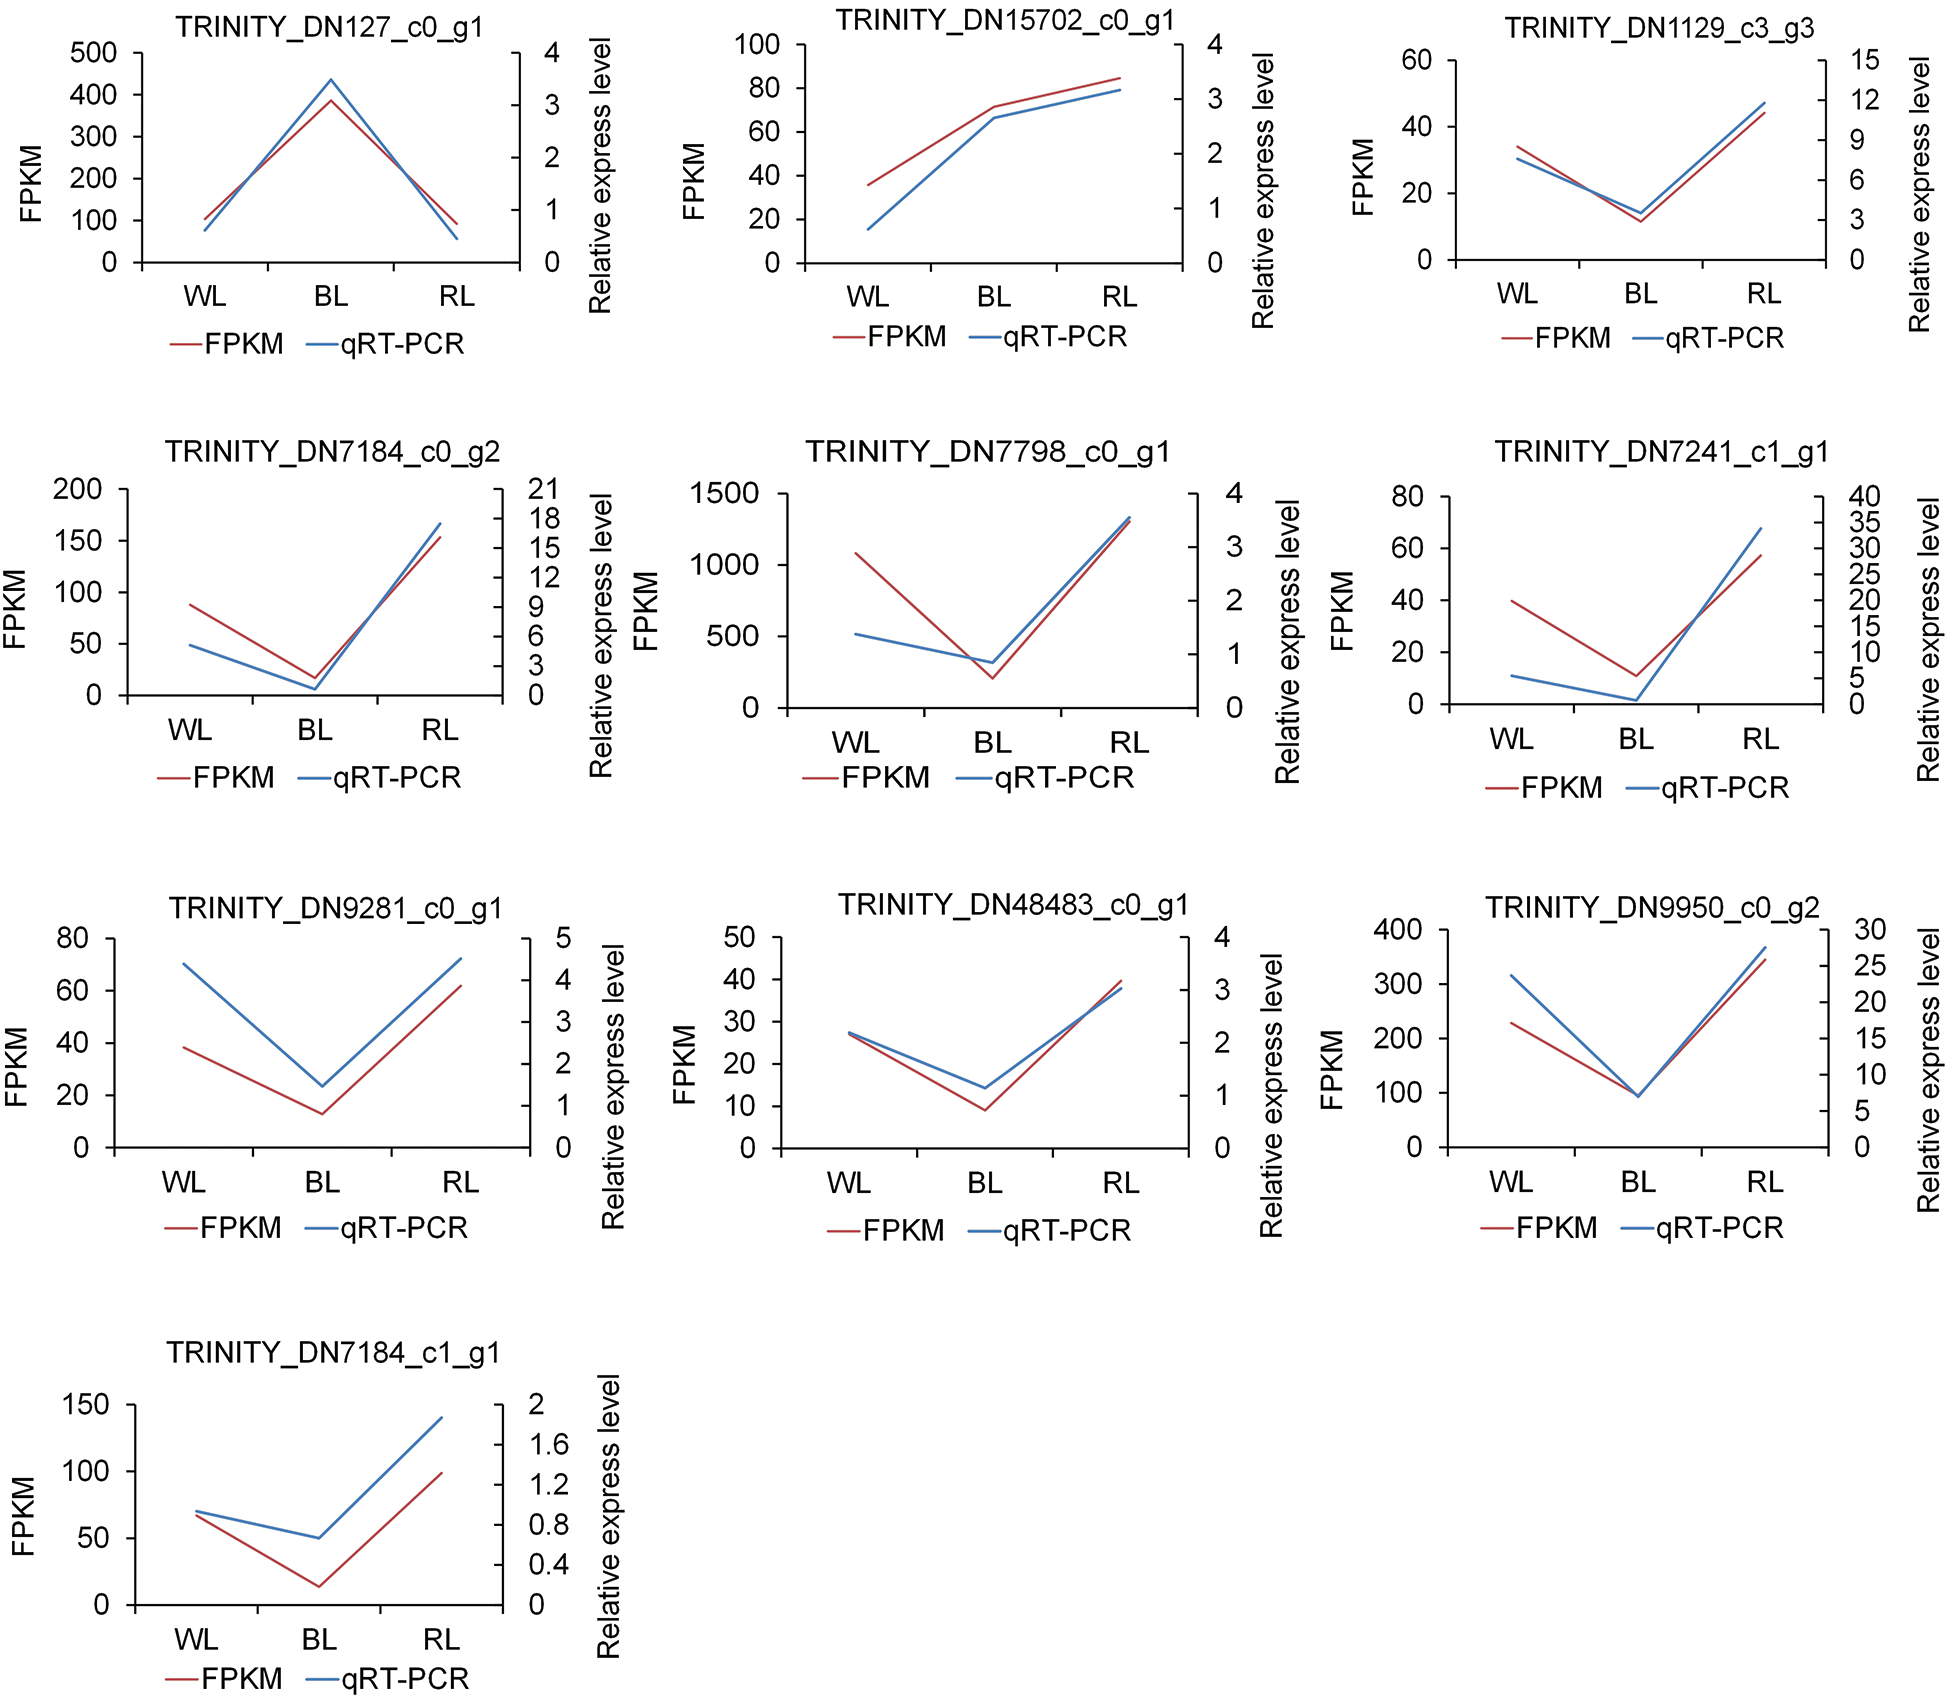
Figure 4: qRT-PCR validation of ten differentially expressed genes (DEGs). The gene-specific primers used for qRT-PCR are listed in Table S1
3.6 Functional Annotation and Pathway Analysis
The DEGs identified from the three comparison sets (BL-vs-WL, RL-vs-WL, and RL-vs-BL) underwent gene annotation analysis to determine the function and metabolic pathways involved in regulating light quality. GO terms were interpreted in this analysis, and the results are presented in Fig. 5, Tables S3, S4, and S5. The analysis identified 20, 11, and 53 significant GO terms from the BL-vs-WL, RL-vs-WL, and RL-vs-BL, respectively (p-values < 0.05, Figs. 5A–5C). Red light and blue light treatments significantly affected transporter activity, inorganic anion transmembrane transporter activity, nitrate transmembrane transporter activity, inorganic anion transport, and nitrate transport.
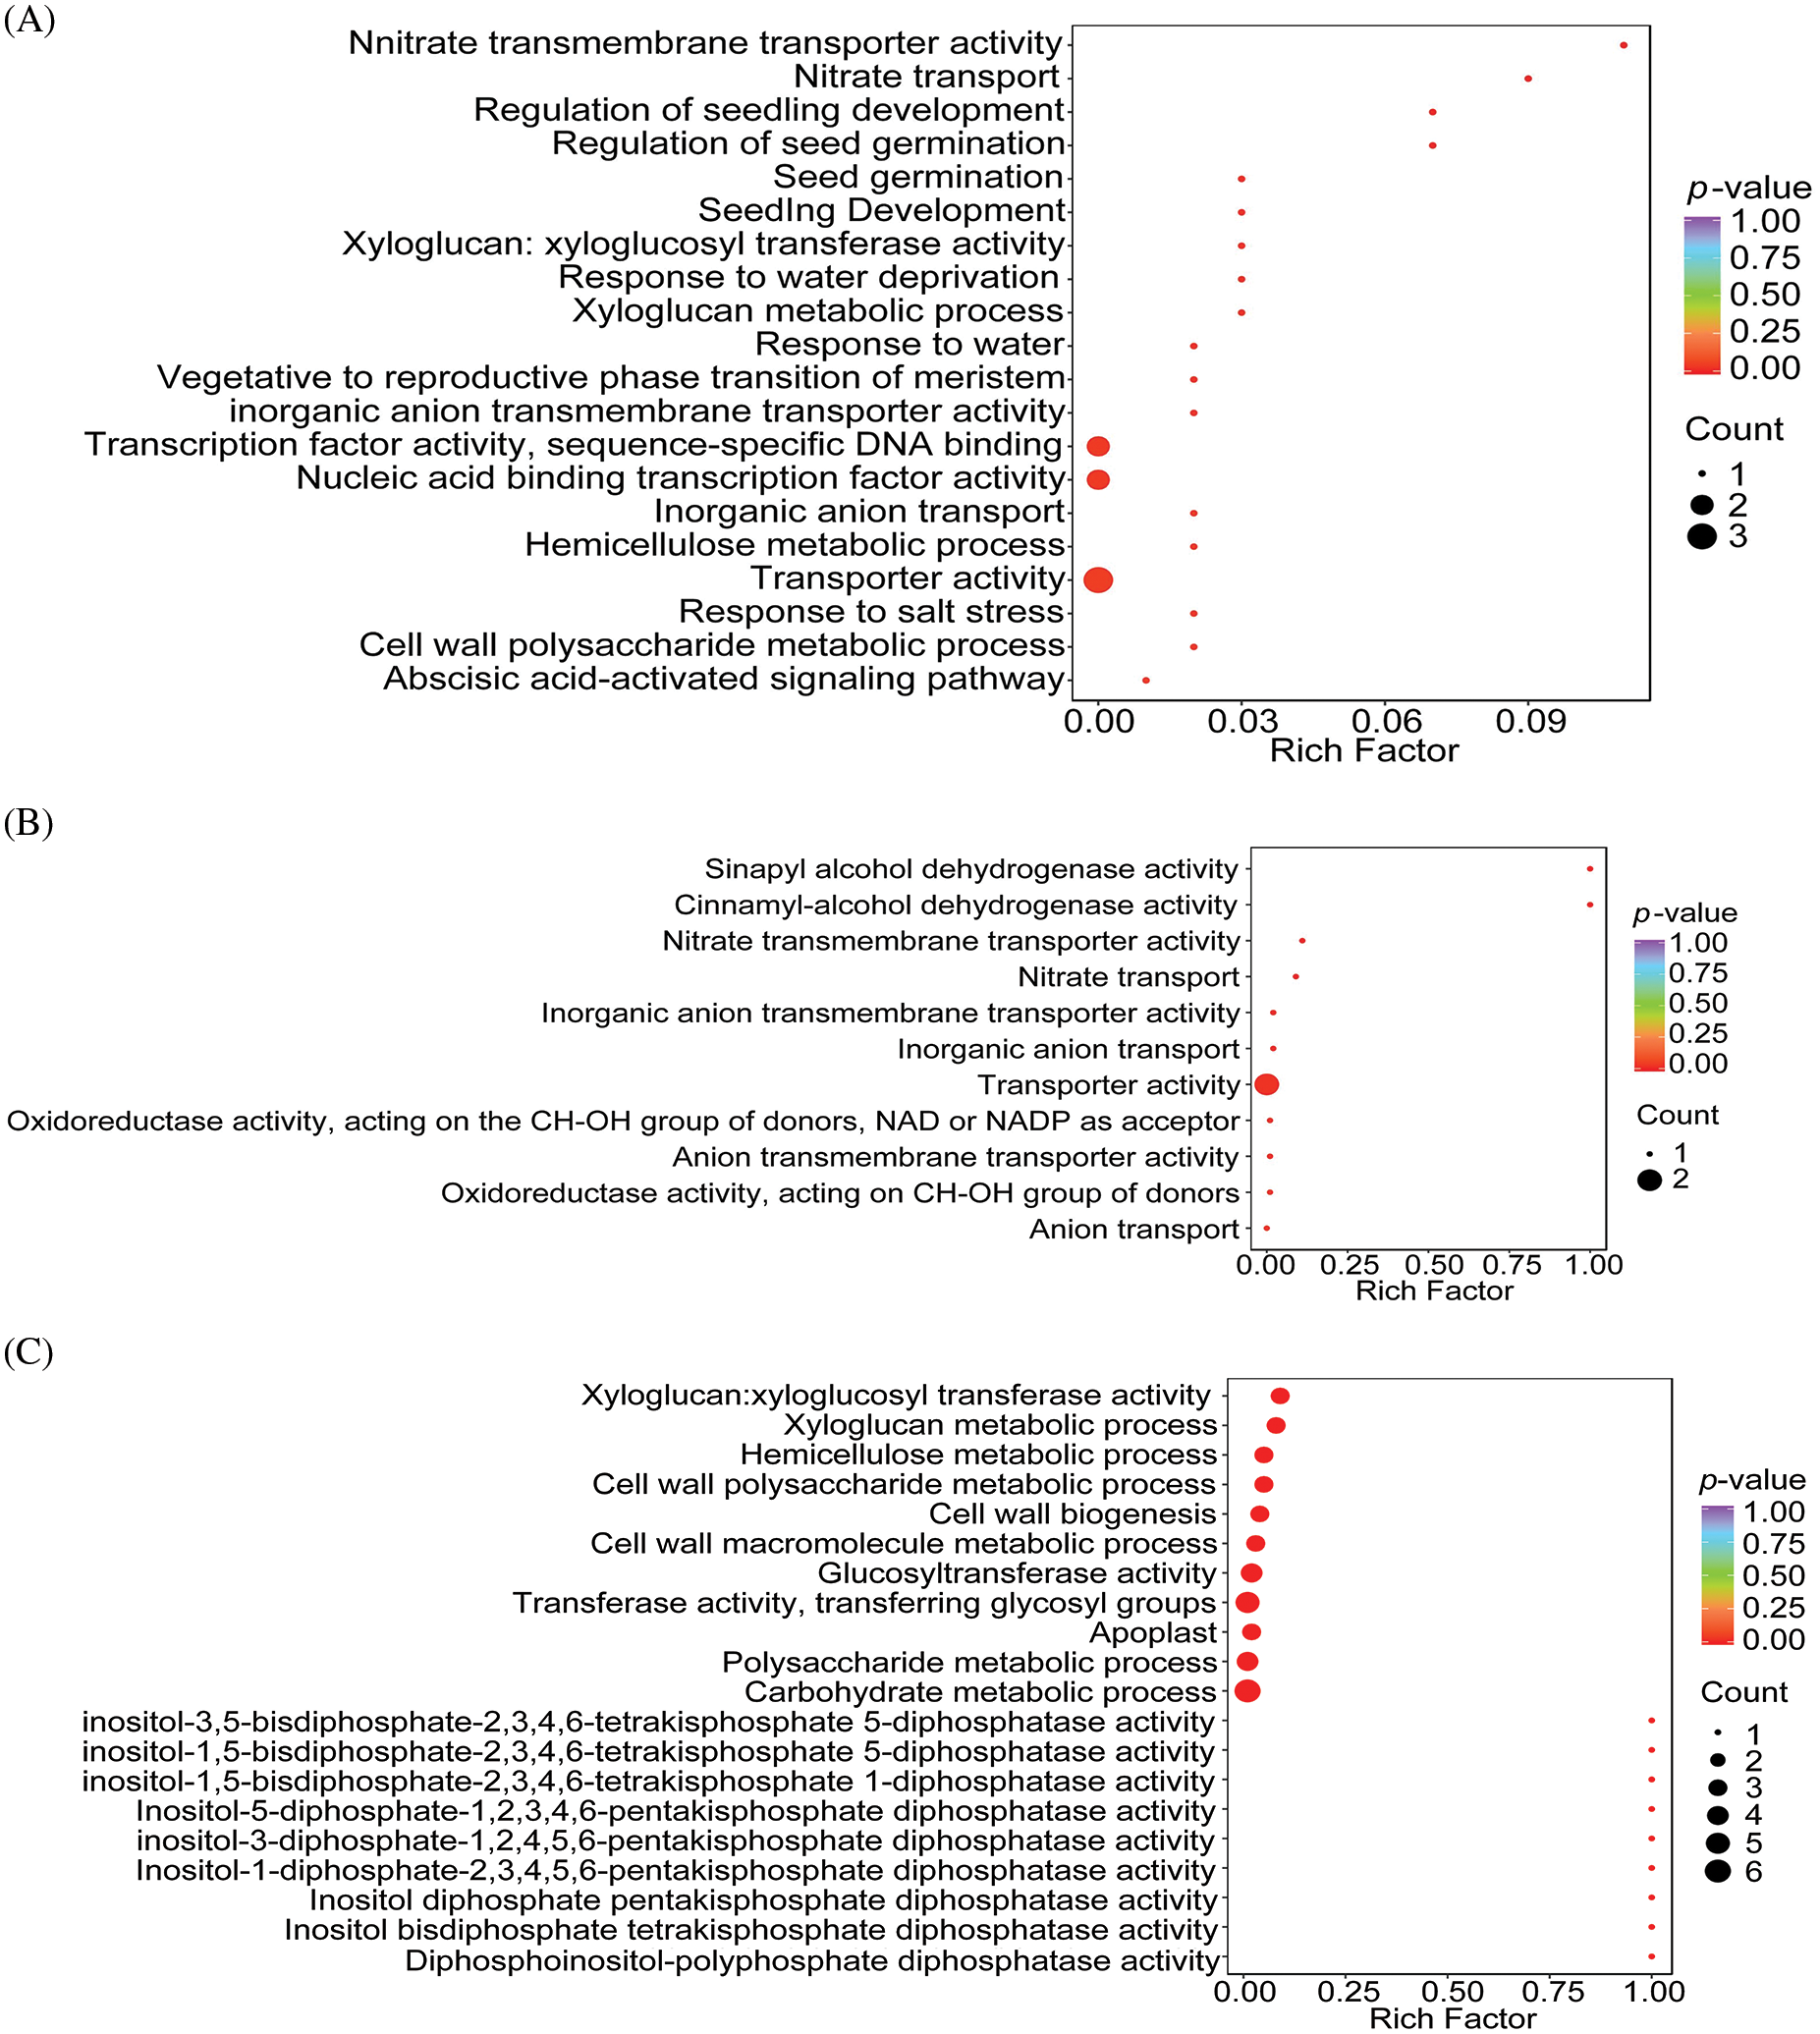
Figure 5: GO analysis of molecular function and biological process enrichment analyses for DEGs in M.macclurei roots under different comparison groups. A: BL-vs-WL means blue light vs. white light; B: RL-vs-WL means red light vs. white light; C: RL-vs-BL means red light vs. blue light
The DEGs identified from the three comparison sets (BL-vs-WL, RL-vs-WL, and RL-vs-BL) were subjected to KEGG enrichment analysis to identify the metabolic pathways associated with light quality regulation. The enrichment results are presented in Fig. 6. In the DEGs of RL-vs-BL, three KEGG pathways, plant-pathogen interaction, amino sugar and nucleotide sugar metabolism, and plant hormone signal transduction, were significantly enriched (Table S6). Two KEGG pathways, nitrogen metabolism, and phenylpropanoid biosynthesis, were significantly enriched in the DEGs of RL-vs-WL (Table S7). Furthermore, four KEGG pathways were significantly enriched including flavonoid biosynthesis, stilbenoid, diarylheptanoid and gingerol biosynthesis, nitrogen metabolism, plant hormone signal transduction, and phenylpropanoid biosynthesis were significantly enriched in the DEGs of BL-vs-WL(Table S8). These results indicated that the red and blue light treatments significantly altered the molecular functions and metabolic pathways of M. macclurei plantlets compared to the white light treatment. As a key environmental factor, light quality affected plant growth by influencing biosynthetic, metabolic, and signal transduction pathways. Furthermore, light qualities can influence the production of endogenous hormones, thereby affecting plant growth [42–44]. Research has shown that the effects of light quality on plant hormone production vary with a single light quality or a combination of different LED colors. For instance, blue light conditions can stimulate jasmonic acid biosynthesis in barley leaves more efficiently than far-red light [45]. In M. macclurei, our morphological and transcriptome sequencing results suggested that different light qualities regulated the root growth of M. macclurei plantlets by altering the expression of genes involved in brassinosteroid signaling pathways. For example, the expression of MmXTH22 (TRINITY_DN7184_c1_g1) was downregulated under blue light compared to red and white light treatments.
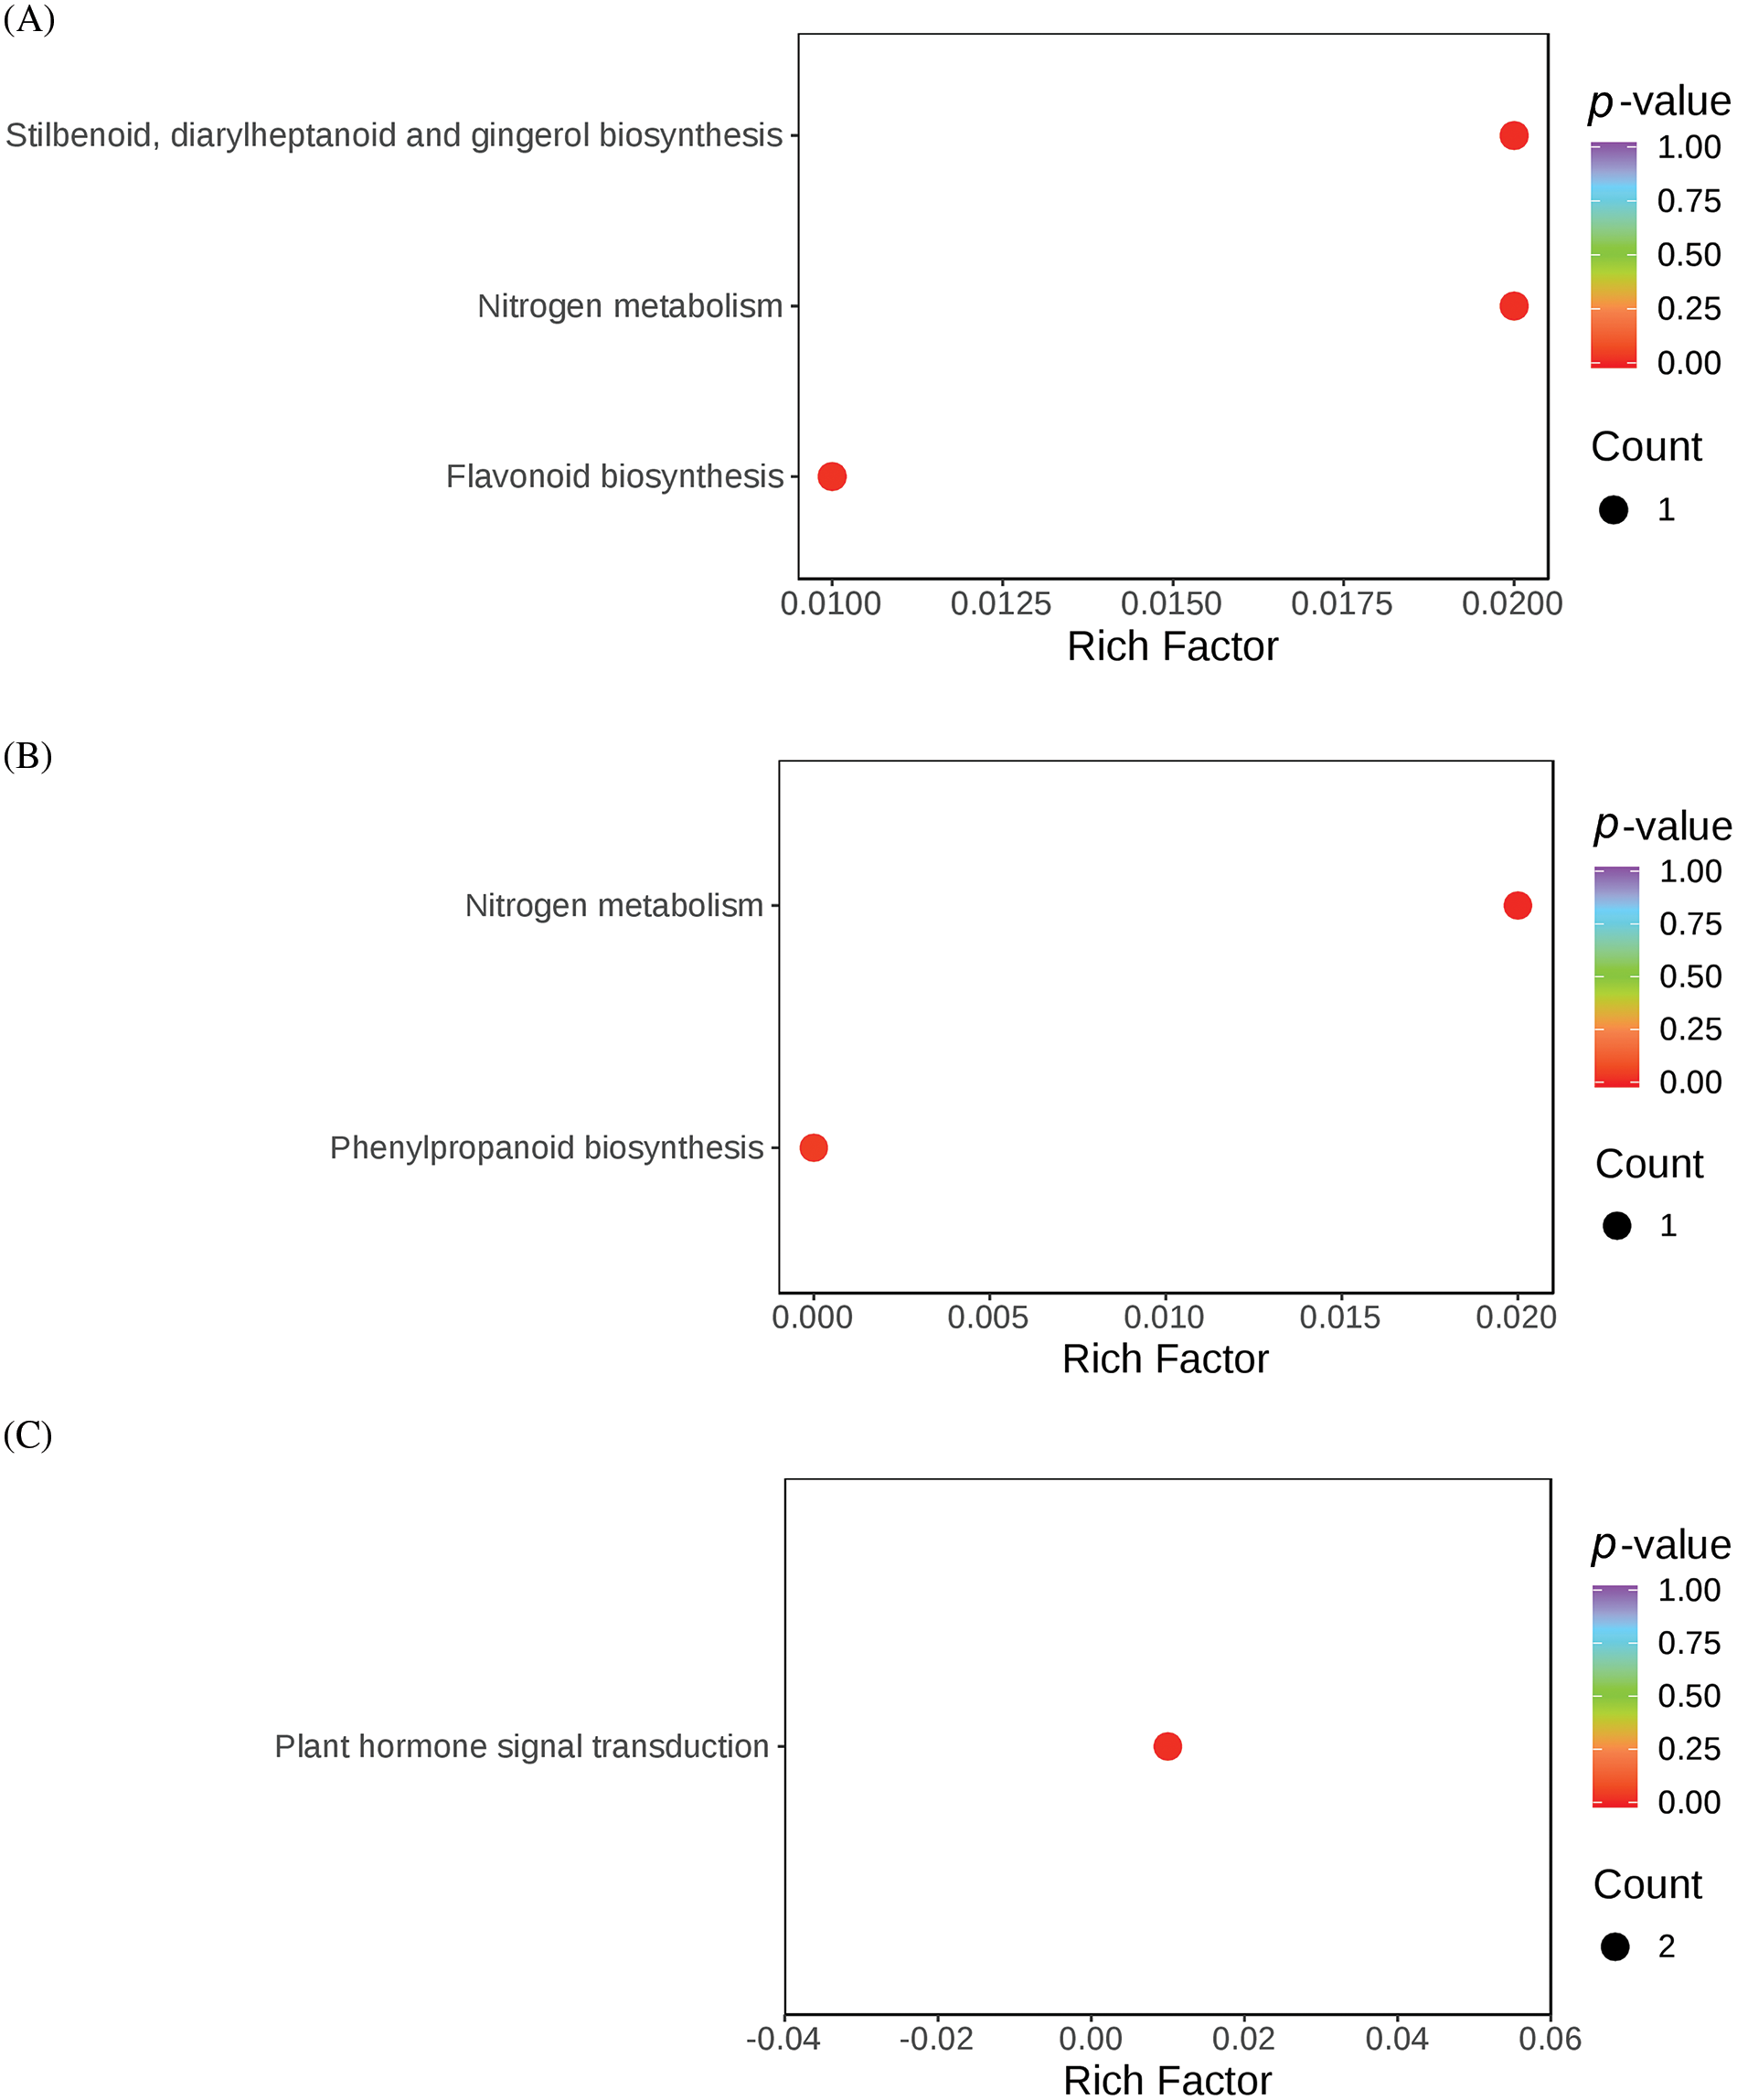
Figure 6: KEGG analysis of molecular function and biological process enrichment analyses for DEGs in M.macclurei roots under different comparison groups. A: BL-vs-WL means blue light vs. white light; B: RL-vs-WL means red light vs. white light; C: RL-vs-BL means red light vs. blue light
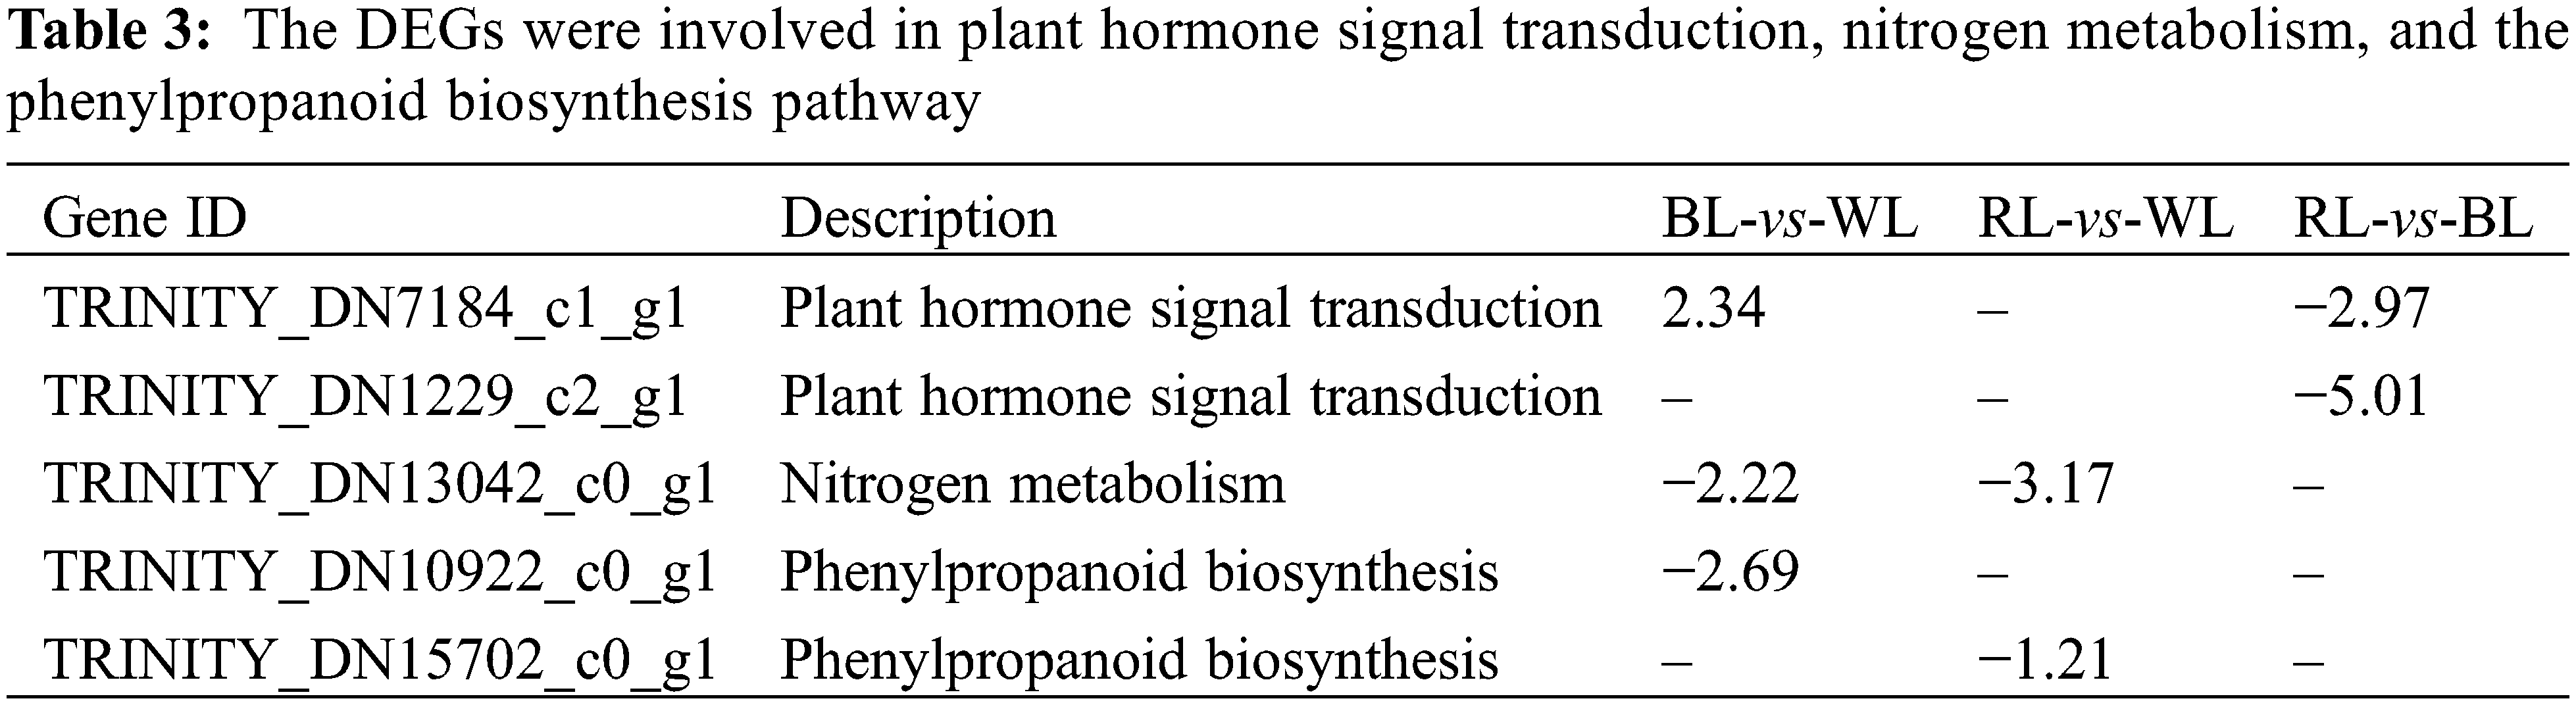
3.7 Analysis of DEGs Related to Plant Hormone Signal Transduction, Nitrogen Metabolism, and Phenylpropanoid Biosynthesis
The regulation of plant root formation is mediated by various factors, including plant hormone signal transduction, nitrogen metabolism, and the phenylpropanoid biosynthesis pathway. Functional classification and enrichment analysis of DEGs using the GO and KEGG databases identified five DEGs associated with these pathways (Table 3). Among them, MmXTH22 (TRINITY_DN7184_c1_g1) involved in the plant hormone signal transduction pathway was upregulated under blue light compared to white light and red light. The pivotal role of MmXTH22 (TRINITY_DN7184_c1_g1) in promoting cell wall relaxation and cell elongation highlights its significance in brassinosteroid synthesis. Previous studies have shown that AtXTH22 was upregulated under green light conditions [46], while the MmXTH22 was upregulated in response to blue light qualities compared to white and red light qualities. This observation strongly suggested that the MmXTH22 plays a vital role in regulating the photoresponse signaling pathway. Furthermore, different light qualities can considerably influence the activities of key enzymes involved in nitrogen metabolism, as well as the expression of genes that control this process. Previous research has revealed that a light source consisting of purple, blue, red, and red-blue combinations can enhance nitrogen assimilation in lettuce [47]. Our study found that compared with white light, blue and red light resulted in the downregulation of high-affinity nitrate transporter (MmNRT22, TRINITY_DN13042_c0_g1), a gene involved in nitrogen metabolism. In addition, we discovered that tryptamine hydroxycinnamoyl transferase (MmTHT1, TRINITY_DN10922_c0_g1) participated in the biosynthesis pathways of various secondary metabolites, such as flavonoids, phenylpropanoids, stilbenoids, diarylheptanoids, and gingerols. The reason was that light quality is also a crucial environmental factor affecting the biosynthesis of secondary metabolite biosynthesis in plants. Numerous studies have proven that specific wavelengths of light have substantial impacts on the production of secondary metabolites, including chlorogenic acid, flavonoids, rosmarinic acid, and carotenoids, as well as on antioxidant activity and DPPH radical scavenging capacity [39,48]. For example, in Stevia rebaudiana, different combinations of LED wavelengths have been shown to increase the content of phenolics and flavonoids [49]. Similarly, in Salvia miltiorrhiza, different combinations of LED wavelengths were found to modulate the accumulation of phenolic acids and other secondary metabolites [50]. In our study, tryptamine hydroxycinnamoyl transferase (MmTHT1, TRINITY_ DN10922_c0_g1) and cinnamyl alcohol dehydrogenase (MmCADH2, TRINITY_DN15702_c0_g1) involved in phenylpropanoid biosynthesis pathway were downregulated under blue and red light compared with white light. These observations suggested that the roots of M. macclurei plantlets modulate their secondary metabolite pathways according to light quality to maintain a balance between environmental stimuli and their growth and development. These observations also underscore the importance of comprehending the molecular mechanisms underlying the regulation of plants’ secondary metabolite biosynthesis and their reaction to environmental factors, particularly light quality.
The present study has some limitations that should be acknowledged. Firstly, our investigation on plants was limited to growth phenotype and chlorophyll content, and we did not explore the effects of different light quality treatments on the biomass and cell morphology of M. macclurei plantlets. Secondly, we only investigated the effects of three different LED qualities, namely white, blue, and red light. The impacts of other light qualities, such as pure yellow light and combinations of different proportions of red and blue light, should be explored in future studies. Lastly, this study primarily focused on the phenotype and transcriptome levels, and future research is necessary to explore the molecular mechanisms involved in regulating the observed responses.
This study aimed to investigate the effects of different light qualities, including white, red, and blue light, on M. macclurei plantlets. The study evaluated growth parameters, chlorophyll content, and transcriptomic analysis to identify the molecular mechanisms of phenotypic changes under different light quality treatments. The results demonstrated that blue light quality increased stem elongation, plant height, and leaf number, but decreased root growth, while red light treatment had the opposite effect. Both red and blue light qualities resulted in a lower chlorophyll content compared to white light quality. Additionally, the transcriptome analysis revealed that gene expression in M. macclurei roots was differentially regulated under different light conditions. Pathway analysis further indicated that plant hormone signal transduction, nitrogen metabolism, and phenylpropanoid biosynthesis were associated with different light quality responses in M. macclurei roots. In short, this result suggests that blue and red light qualities can promote the growth and development of shoot and root, respectively, and significantly alter root gene expression levels. Identifying the molecular mechanisms underlying light quality responses in M. macclurei plantlets provides valuable insights into optimizing the production processes of high-quality plants.
Acknowledgement: None.
Funding Statement: This research was funded and supported by Fundamental Research Funds of the Chinese Academy of Forestry, No. CAFYBB2017MB10.
Author Contributions: The authors confirm their contribution to the paper as follows: study conception and design: Y.L. and B.Z.; data collection: Y.L., Z.C., Q.J., S.W., and X.L.; analysis and interpretation of results: Z.C. and B.Z.; draft manuscript preparation: Z.C. All authors reviewed the results and approved the final version of the manuscript.
Availability of Data and Materials: The transcriptome raw data that has been used is confidential. The other datasets supporting the conclusions of this article are included within the article and its supplementary materials.
Ethics Approval: Not applicable.
Conflicts of Interest: The authors declare that they have no conflicts of interest to report regarding the present study.
Supplementary Materials: The supplementary material is available online at https://doi.org/10.32604/phyton.2023.030664.
References
1. Poorter, H., Niinemets, Ü., Ntagkas, N., Siebenkäs, A., Matsubara, S. et al. (2019). A meta-analysis of plant responses to light intensity for 70 traits ranging from molecules to whole plant performance. New Phytologist, 223(3), 1073–1105. https://doi.org/10.1111/nph.15754 [Google Scholar] [PubMed] [CrossRef]
2. Paradiso, R., Proietti, S. (2022). Light-quality manipulation to control plant growth and photomorphogenesis in greenhouse horticulture: The state of the art and the opportunities of modern LED systems. Journal of Plant Growth Regulation, 41(2), 742–780. https://doi.org/10.1007/s00344-021-10337-y [Google Scholar] [CrossRef]
3. Folta, K. M., Carvalho, S. D. (2015). Photoreceptors and control of horticultural plant traits. HortScience, 50(9), 1274–1280. https://doi.org/10.21273/HORTSCI.50.9.1274 [Google Scholar] [CrossRef]
4. Legris, M., Ince, Y. Ç., Fankhauser, C. (2019). Molecular mechanisms underlying phytochrome-controlled morphogenesis in plants. Nature Communications, 10(1), 5219. https://doi.org/10.1038/s41467-019-13045-0 [Google Scholar] [PubMed] [CrossRef]
5. Karimi, M., Ahmadi, N., Ebrahimi, M. (2022). Red LED light promotes biomass, flowering and secondary metabolites accumulation in hydroponically grown Hypericum perforatum L. (cv. Topas). Industrial Crops and Products, 175, 114239. https://doi.org/10.1016/j.indcrop.2021.114239 [Google Scholar] [CrossRef]
6. Samuolienė, G., Viršilė, A., Miliauskienė, J., Haimi, P. J., Laužikė, K. et al. (2021). The physiological response of lettuce to red and blue light dynamics over different photoperiods. Frontiers in Plant Science, 11, 610174. https://doi.org/10.3389/fpls.2020.610174 [Google Scholar] [PubMed] [CrossRef]
7. Fukuda, N., Ajima, C., Yukawa, T., Olsen, J. E. (2016). Antagonistic action of blue and red light on shoot elongation in petunia depends on gibberellin, but the effects on flowering are not generally linked to gibberellin. Environmental and Experimental Botany, 121, 102–111. https://doi.org/10.1016/j.envexpbot.2015.06.014 [Google Scholar] [CrossRef]
8. Izzo, L. G., Mele, B. H., Vitale, L., Vitale, E., Arena, C. (2020). The role of monochromatic red and blue light in tomato early photomorphogenesis and photosynthetic traits. Environmental and Experimental Botany, 179, 104195. https://doi.org/10.1016/j.envexpbot.2020.104195 [Google Scholar] [CrossRef]
9. Chen, X., Guo, W., Xue, X., Wang, L., Qiao, X. (2014). Growth and quality responses of ‘Green Oak Leaf’ lettuce as affected by monochromic or mixed radiation provided by fluorescent lamp (FL) and light-emitting diode (LED). Scientia Horticulturae, 172, 168–175. https://doi.org/10.1016/j.scienta.2014.04.009 [Google Scholar] [CrossRef]
10. Dougher, T. A., Bugbee, B. (2001). Differences in the response of wheat, soybean and lettuce to reduced blue radiation. Photochemistry and Photobiology, 73(2), 199–207. https://doi.org/10.1562/0031-8655(2001)073<0199:DITROW>2.0.CO;2 [Google Scholar] [PubMed] [CrossRef]
11. Cavallaro, V., Pellegrino, A., Muleo, R., Forgione, I. (2022). Light and plant growth regulators on in vitro proliferation. Plants, 11(7), 844. https://doi.org/10.3390/plants11070844 [Google Scholar] [PubMed] [CrossRef]
12. Guo, Q. Q., Li, H. E., Gao, C., Yang, R. (2019). Leaf traits and photosynthetic characteristics of endangered Sinopodophyllum hexandrum (Royle) Ying under different light regimesin Southeastern Tibet Plateau. Photosynthetica, 57(2), 548–555. https://doi.org/10.32615/ps.2019.080 [Google Scholar] [CrossRef]
13. Jiang, L., Wang, Z., Jin, G., Lu, D., Li, X. (2019). Responses of favorita potato plantlets cultured in vitro under fluorescent and light-emitting diode (LED) light sources. American Journal of Potato Research, 96(4), 396–402. https://doi.org/10.1007/s12230-019-09725-8 [Google Scholar] [CrossRef]
14. Cho, K. H., Laux, V. Y., Wallace-Springer, N., Clark, D. G., Folta, K. M. et al. (2019). Effects of light quality on vegetative cutting and in vitro propagation of coleus (Plectranthus scutellarioides). HortScience, 54(5), 926–935. https://doi.org/10.21273/HORTSCI13903-19 [Google Scholar] [CrossRef]
15. Wei, S., Luo, S., Zhong, Y., Zhou, Y., Song, Z. (2022). The complete chloroplast genome sequence of Michelia macclurei (Dandy, 1928) (Magnoliaceaean important fire-resistant tree species. Mitochondrial DNA Part B, 7(11), 1933–1935. https://doi.org/10.1080/23802359.2022.2057251 [Google Scholar] [PubMed] [CrossRef]
16. Wang, Q., Wang, S., Huang, Y. (2008). Comparisons of litterfall, litter decomposition and nutrient return in a monoculture Cunninghamia lanceolata and a mixed stand in Southern China. Forest Ecology and Management, 255(3–4), 1210–1218. https://doi.org/10.1016/j.foreco.2007.10.026 [Google Scholar] [CrossRef]
17. Niu, D., Wang, S., Ouyang, Z. (2009). Comparisons of carbon storages in Cunninghamia lanceolata and Michelia macclurei plantations during a 22-year period in Southern China. Journal of Environmental Sciences, 21(6), 801–805. https://doi.org/10.1016/S1001-0742(08)62344-X [Google Scholar] [PubMed] [CrossRef]
18. Zhang, Y., Lin, L., Long, Y., Guo, H., Wang, Z. et al. (2019). Comprehensive transcriptome analysis revealed the effects of the light quality, light intensity, and photoperiod on phlorizin accumulation in Lithocarpus polystachyus rehd. Forests, 10(11), 995. https://doi.org/10.3390/f10110995 [Google Scholar] [CrossRef]
19. Chen, L., Wang, H., Gong, X., Zeng, Z., Xue, X. et al. (2021). Transcriptome analysis reveals effects of red and blue light-emitting diodes (LEDs) on the growth, chlorophyll fluorescence and endogenous plant hormones of potato (Solanum tuberosum L.) plantlets cultured in vitro. Journal of Integrative Agriculture, 20(11), 2914–2931. https://doi.org/10.1016/S2095-3119(20)63393-7 [Google Scholar] [CrossRef]
20. Chen, L., Yang, Y., Jiang, Y., Zhao, J., Zang, H. et al. (2019). RNA-seq analysis reveals differential responses of potato (Solanum tuberosum L.) plantlets cultured in vitro to red, blue, green, and white light-emitting diodes (LEDs). Journal of Plant Growth Regulation, 38(4), 1412–1427. https://doi.org/10.1007/s00344-019-09944-7 [Google Scholar] [CrossRef]
21. Huang, W., Yang, G., Liu, D., Li, Q., Zheng, L. et al. (2022). Metabolomics and transcriptomics analysis of vitro growth in pitaya plantlets with different LED light spectra treatment. Industrial Crops and Products, 186(10), 115237. https://doi.org/10.1016/j.indcrop.2022.115237 [Google Scholar] [CrossRef]
22. Sasidharan, R., Chinnappa, C. C., Staal, M., Elzenga, J. T. M., Yokoyama, R. et al. (2010). Light quality-mediated petiole elongation in Arabidopsis during shade avoidance involves cell wall modification by xyloglucan endotransglucosylase/hydrolases. Plant Physiology, 154(2), 978–990. https://doi.org/10.1104/pp.110.162057 [Google Scholar] [PubMed] [CrossRef]
23. Keuskamp, D. H., Sasidharan, R., Vos, I., Peeters, A. J. M., Voesenek, L. A. C. J. et al. (2011). Blue-light-mediated shade avoidance requires combined auxin and brassinosteroid action in Arabidopsis seedlings. The Plant Journal, 67(2), 208–217. https://doi.org/10.1111/j.1365-313X.2011.04597.x [Google Scholar] [PubMed] [CrossRef]
24. Murashige, T., Skoog, F. (1962). A revised medium for rapid growth and bio assays with tobacco tissue cultures. Physiologia Plantarum, 15(3), 473–497. https://doi.org/10.1111/j.1399-3054.1962.tb08052.x [Google Scholar] [CrossRef]
25. Haas, B. J., Papanicolaou, A., Yassour, M., Grabherr, M., Blood, P. D. et al. (2013). De novo transcript sequence reconstruction from RNA-seq using the trinity platform for reference generation and analysis. Nature Protocols, 8(8), 1494–1512. https://doi.org/10.1038/nprot.2013.084 [Google Scholar] [PubMed] [CrossRef]
26. Langmead, B. (2010). Aligning short sequencing reads with bowtie. Current Protocols in Bioinformatics, 32, 11.7.1–11.7.14. https://doi.org/10.1002/0471250953.bi1107s32 [Google Scholar] [PubMed] [CrossRef]
27. Trapnell, C., Williams, B. A., Pertea, G., Mortazavi, A., Kwan, G. et al. (2010). Transcript assembly and quantification by RNA-seq reveals unannotated transcripts and isoform switching during cell differentiation. Nature Biotechnology, 28(5), 511–515. https://doi.org/10.1038/nbt.1621 [Google Scholar] [PubMed] [CrossRef]
28. Robinson, M. D., McCarthy, D. J., Smyth, G. K. (2010). edgeR: A bioconductor package for differential expression analysis of digital gene expression data. Bioinformatics, 26(1), 139–140. https://doi.org/10.1093/bioinformatics/btp616 [Google Scholar] [PubMed] [CrossRef]
29. Benjamini, Y., Hochberg, Y. (1995). Controlling the false discovery rate: A practical and powerful approach to multiple testing. Journal of the Royal Statistical Society: Series B (Methodological), 57(1), 289–300. https://doi.org/10.1111/j.2517-6161.1995.tb02031.x [Google Scholar] [CrossRef]
30. Young, M. D., Wakefield, M. J., Smyth, G. K., Oshlack, A. (2010). Gene ontology analysis for RNA-seq: Accounting for selection bias. Genome Biology, 11(2), R14. https://doi.org/10.1186/gb-2010-11-2-r14 [Google Scholar] [PubMed] [CrossRef]
31. Xie, C., Mao, X., Huang, J., Ding, Y., Wu, J. et al. (2011). KOBAS 2.0: A web server for annotation and identification of enriched pathways and diseases. Nucleic Acids Research, 39(suppl_2), W316–W322. https://doi.org/10.1093/nar/gkr483 [Google Scholar] [PubMed] [CrossRef]
32. Livak, K. J., Schmittgen, T. D. (2001). Analysis of relative gene expression data using real-time quantitative PCR and the 2−ΔΔCT method. Methods, 25(4), 402–408. https://doi.org/10.1006/meth.2001.1262 [Google Scholar] [PubMed] [CrossRef]
33. Jung, W. S., Chung, I. M., Hwang, M. H., Kim, S. H., Yu, C. Y. et al. (2021). Application of light-emitting diodes for improving the nutritional quality and bioactive compound levels of some crops and medicinal plants. Molecules, 26(5), 1477. https://doi.org/10.3390/molecules26051477 [Google Scholar] [PubMed] [CrossRef]
34. Azad, M. O. K., Kjaer, K. H., Adnan, M., Naznin, M. T., Lim, J. D. et al. (2020). The evaluation of growth performance, photosynthetic capacity, and primary and secondary metabolite content of leaf lettuce grown under limited irradiation of blue and red LED light in an urban plant factory. Agriculture, 10(2), 28. https://doi.org/10.3390/agriculture10020028 [Google Scholar] [CrossRef]
35. Gao, S., Liu, X., Liu, Y., Cao, B., Chen, Z. et al. (2020). Photosynthetic characteristics and chloroplast ultrastructure of welsh onion (Allium fistulosum L.) grown under different LED wavelengths. BMC Plant Biology, 20(1), 78. https://doi.org/10.1186/s12870-020-2282-0 [Google Scholar] [PubMed] [CrossRef]
36. Roeber, V. M., Bajaj, I., Rohde, M., Schmülling, T., Cortleven, A. (2021). Light acts as a stressor and influences abiotic and biotic stress responses in plants. Plant, Cell & Environment, 44(3), 645–664. https://doi.org/10.1111/pce.13948 [Google Scholar] [PubMed] [CrossRef]
37. Liu, Q., Huang, Z., Ma, X., Tigabu, M., Xing, X. et al. (2022). Phenotypic plasticity of Cunninghamialanceolata (Lamb.) hook. Seedlings in response to varied light quality treatments. Forests, 13(2), 201. https://doi.org/10.3390/f13020201 [Google Scholar] [CrossRef]
38. Pandey, D. M., Yu, K. W., Wu, R. Z., Hahn, E. J., Paek, K. Y. (2006). Effects of different irradiances on the photosynthetic process during ex-vitro acclimation of Anoectochilus plantlets. Photosynthetica, 44(3), 419–424. https://doi.org/10.1007/s11099-006-0045-2 [Google Scholar] [CrossRef]
39. Klem, K., Gargallo-Garriga, A., Rattanapichai, W., Oravec, M., Holub, P. et al. (2019). Distinct morphological, physiological, and biochemical responses to light quality in barley leaves and roots. Frontiers in Plant Science, 10, 1026. https://doi.org/10.3389/fpls.2019.01026 [Google Scholar] [PubMed] [CrossRef]
40. Manivannan, A., Soundararajan, P., Halimah, N., Ko, C. H., Jeong, B. R. (2015). Blue LED light enhances growth, phytochemical contents, and antioxidant enzyme activities of Rehmannia glutinosa cultured in vitro. Horticulture, Environment, and Biotechnology, 56(1), 105–113. https://doi.org/10.1007/s13580-015-0114-1 [Google Scholar] [CrossRef]
41. Kurilčik, A., Miklušytė-Čanova, R., Dapkūnienė, S., Žilinskaitė, S., Kurilčik, G. et al. (2008). In vitro culture of Chrysanthemum plantlets using light-emitting diodes. Open Life Sciences, 3(2), 161–167. https://doi.org/10.2478/s11535-008-0006-9 [Google Scholar] [CrossRef]
42. Hahn, E., Kozai, T., Paek, K. (2000). Blue and red light-emitting diodes with or without sucrose and ventilation affect in vitro growth of Rehmannia glutinosa plantlets. Journal of Plant Biology, 43(4), 247–250. https://doi.org/10.1007/BF03030425 [Google Scholar] [CrossRef]
43. Dutta Gupta, S., Jatothu, B. (2013). Fundamentals and applications of light-emitting diodes (LEDs) in in vitro plant growth and morphogenesis. Plant Biotechnology Reports, 7(3), 211–220. https://doi.org/10.1007/s11816-013-0277-0 [Google Scholar] [CrossRef]
44. Olle, M., Viršile, A. (2013). The effects of light-emitting diode lighting on greenhouse plant growth and quality. Agricultural and Food Science, 22(2), 223–234. https://doi.org/10.23986/afsci.7897 [Google Scholar] [CrossRef]
45. Brini, F., Mseddi, K., Brestic, M., Landi, M. (2022). Hormone-mediated plant responses to light quality and quantity. Environmental and Experimental Botany, 202(3), 105026. https://doi.org/10.1016/j.envexpbot.2022.105026 [Google Scholar] [CrossRef]
46. Kumari, S., Panigrahi, K. C. S. (2019). Light and auxin signaling cross-talk programme root development in plants. Journal of Biosciences, 44(1), 26. https://doi.org/10.1007/s12038-018-9838-2 [Google Scholar] [CrossRef]
47. Biswal, D. P., Panigrahi, K. C. S. (2020). Light- and hormone-mediated development in non-flowering plants: An overview. Planta, 253(1), 1. https://doi.org/10.1007/s00425-020-03501-3 [Google Scholar] [PubMed] [CrossRef]
48. Wang, C., Chen, Y., Cui, C., Shan, F., Zhang, R. et al. (2023). Blue light regulates cell wall structure and carbohydrate metabolism of soybean hypocotyl. International Journal of Molecular Sciences, 24(2), 1017. https://doi.org/10.3390/ijms24021017 [Google Scholar] [PubMed] [CrossRef]
49. Zhang, T., Shi, Y., Piao, F., Sun, Z. (2018). Effects of different LED sources on the growth and nitrogen metabolism of lettuce. Plant Cell, Tissue and Organ Culture, 134(2), 231–240. https://doi.org/10.1007/s11240-018-1415-8 [Google Scholar] [CrossRef]
50. Alrifai, O., Hao, X., Marcone, M. F., Tsao, R. (2019). Current review of the modulatory effects of LED lights on photosynthesis of secondary metabolites and future perspectives of microgreen vegetables. Journal of Agricultural and Food Chemistry, 67(22), 6075–6090. https://doi.org/10.1021/acs.jafc.9b00819 [Google Scholar] [PubMed] [CrossRef]
Cite This Article
 Copyright © 2023 The Author(s). Published by Tech Science Press.
This work is licensed under a Creative Commons Attribution 4.0 International License , which permits unrestricted use, distribution, and reproduction in any medium, provided the original work is properly cited.
 Downloads
 Citation Tools