
 Submit a Paper
 Propose a Special lssue
 Open Access
ARTICLE

Functional Studies of Castor (Ricinus communis L.) PLC Family Genes in Arabidopsis Inflorescence Development
1
College of Life Science and Food Engineering, Inner Mongolia University for the Nationalities, Tongliao, 028000, China
2
Key Laboratory of Castor Breeding of the State Ethnic Affairs Commission, Inner Mongolia University for the Nationalities,
Tongliao, 028000, China
3
Inner Mongolia Industrial Engineering Research Center of Universities for Castor, Inner Mongolia University for the Nationalities,
Tongliao, 028000, China
4
Inner Mongolia Key Laboratory of Castor Breeding and Comprehensive Utilization, Inner Mongolia University for the
Nationalities, Tongliao, 028000, China
5
Inner Mongolia Engineering Research Center of Industrial Technology Innovation of Castor, Inner Mongolia University for the
Nationalities, Tongliao, 028000, China
* Corresponding Author: Fenglan Huang. Email:
# Yanpeng Wen and Rui Luo contributed equally to this work and shared co-first authorship
Phyton-International Journal of Experimental Botany 2023, 92(11), 3091-3112. https://doi.org/10.32604/phyton.2023.030960
Received 05 May 2023; Accepted 30 August 2023; Issue published 24 October 2023
 View Full Text
 Download PDF
Abstract
Castor (Ricinus communis L.) is one of the top 10 oil crops in the world, and inflorescence is a trait that directly affects its yield. Phospholipase C (PLCs) is involved in many plant activities and metabolic processes. To study the functions of PLC family genes in the regulation of the inflorescence development of the female line of Lm-type castor aLmAB2, we determined the expression levels of six PLC family genes of three types of inflorescences of aLmAB2 (isofemale line, female line, bisexual line) at different developmental stages. The results showed that the 6 genes of the castor PLC family had relative expression levels at different developmental stages of the three types of inflorescences. The subcellular location of all six protein products was the cell membrane. The six genes were heterologously overexpressed in Arabidopsis thaliana to obtain the T3 generation-resistant Arabidopsis thaliana plants. The results showed that the overexpression of six genes significantly promoted the maturation of Arabidopsis thaliana, the growth of lateral moss, and the development of flowers and pods, but the development of basal leaves and stem leaves of Arabidopsis thaliana was significantly inhibited. According to homology analysis, it is speculated that PLC2, PLC2M, PLC2N, PLC4, PLC4X2, and PLC6 genes have the same regulatory function.Keywords
Phospholipases (PL) are the main enzymes that catalyze the catabolism of membrane phospholipids and can produce a variety of lipid-derived second messengers in this process. According to the hydrolysis sites of phosphate ester bonds, PLs are divided into PLA1, PLA2, PLC, and PLD. Each group of PLs has different enzyme families or subfamilies, which differ in structure, substrate selectivity, cofactor requirements, and reaction conditions [1]. According to their hydrolysis substrate, PLCs can be divided into phosphatidylinositol-specific phospholipase C (PI-PLC) and nonspecific phospholipase C (NPC). The latter acts on common phospholipids, such as phosphatidylcholine, phosphatidylethanolamine, and phosphatidylserine, while the former only acts on phosphatidylinositol [2]. Five different types of PI-PLCs, i.e., β, γ, δ, ε, and ζ, have been identified in animal cells.
PLC is an important regulatory enzyme involved in a variety of lipid- and Ca2+-dependent signal transduction pathways. In animals, PLC selectively catalyzes the hydrolysis of phosphatidylinositol-4,5-bisphosphate (PIP2) on the glycerol side of a phosphodiester bond [3], which reaction produces two important secondary messengers, diacylglycerol (DAG) and inositol-1,4,5-triphosphate (IP3). DAG regulates the activities of many important enzymes and structural proteins by binding to the conserved C1 domain, while IP3 binds to and controls the gating of endoplasmic reticulum Ca2+ channels to finely regulate the cytoplasmic Ca2+ concentration. In mammals, G protein-coupled receptors receive ligand signals, activate PI-PLC through G proteins, and hydrolyze PIP2 to produce DAG and IP3. DAG and IP3 separately bind to and activate protein kinase C (PKC) and IP3 receptors (Ca2+ channel proteins on the endoplasmic reticulum membrane), and the latter releases Ca2+ into the cells [4]. Plants do not have IP3 receptors but have unique phosphoinositide signaling components and pathways [5].
Plant PLC genes are involved in cell growth and differentiation, hormone signal transduction, response to biotic and abiotic stresses, and regulation of polar growth, and Ca2+ plays an important role in various signal transduction pathways [6]. In plant cells, after entering the cytoplasm, water-soluble IP3 can be rapidly converted to IP6 under the action of a series of phosphokinases to promote Ca2+ influx into the intracellular calcium pool, thereby regulating the Ca2+ concentration and the activity of Ca2+-dependent enzymes or channels [6]. IP3 produced by the hydrolysis of PIP2 by PI-PLC can induce the activity of voltage-dependent Ca2+ channels on the plasma membrane of pollen tubes and rapidly increase the cytoplasmic Ca2+ concentration of pollen tubes, and the released Ca2+ can activate PLC to increase IP3 production. IP3 causes a second peak of cytoplasmic Ca2+ concentration, which in turn promotes the release of other Ca2+ ions from the calcium pool, forms a Ca2+ flow to generate a current, and continuously induces the activity of Ca2+ channels in pollen. Therefore, different Ca2+ gradients can accumulate at the top of the tube, where they regulate the polar growth of the pollen tube [7–10]. Overall, PLC family genes play an important role in the development of plant inflorescences.
Castor (Ricinus communis L.) is an annual or perennial herbaceous plant with high economic and ecological value. Because castor is rich in oils, it is known as one of the top 10 most important oil crops in the world [11–15]. Castor oil has a variety of industrial uses and is widely used in fields, such as agriculture, medicine, chemical engineering, aviation, navigation, electronics, and machinery manufacturing [16–18]. With the acceleration of economic globalization and international trade liberalization, the international competition for agricultural products is becoming increasingly fierce, and the demand for castor seeds/oil and their products in China and abroad is growing [19–21]. The growth and development of castor inflorescences is a key factor affecting its yield, so studying the influencing factors of castor inflorescence development can greatly improve its yield.
There are generally two types of inflorescences in the female lines of castor, namely, isofemale and bisexual lines [22]. The female line of Lm-type castor, i.e., the female castor line with iconic traits, was developed by Zhu, a researcher at the Tongliao Academy of Agricultural Sciences. Zhu treated the dry seeds of castor line Yong283 with 60Co γ-rays in 1985 and discovered the mutant in the M2 generation in 1986. There are three types of inflorescences in the female line of Lm-type castor, i.e., isofemale line, female line, and bisexual line [23–25].
There are few relevant studies on the PLC gene family in regulating castor inflorescence development. The purpose of this study is to clarify the functions of PLC family genes in regulating the inflorescence development of female lines of Lm-type castor and analyze the relationships between the six PLC family genes.
In this study, the gene and protein sequences of the castor PLC gene family were obtained from the NCBI database, and the gene nucleic acid and protein sequences of the Arabidopsis PLC gene family were obtained from the TAIR database (Table 1). The materials used in this study were the female line of Lm-type castor aLmAB2 (Fig. 1), the Colombia wild-type (WT) Arabidopsis thaliana, the overexpression vector pC1390U, the subcellular localization binary expression vector pBI121-GFP, and the PAD62 Agrobacterium, which were provided by the Key Laboratory of Castor Breeding of State Ethnic Affairs Commission of the Inner Mongolia University for Nationalities. The full-length coding sequence of each PLC family gene was synthesized by Beijing Qingke Xinye Biotechnology Co., Ltd. (China), and the restriction endonucleases BamHI and KpnI, a complementary DNA (cDNA) synthesis kit, and the fluorescent dye SYBR were purchased from Baori Medical Biotechnology Beijing Co., Ltd. (China). The GV3101 Agrobacterium strain and plant genomic DNA and RNA extraction kits were purchased from Beijing Zhuangmeng International Bio-Gene Technology Co. Ltd. (China).
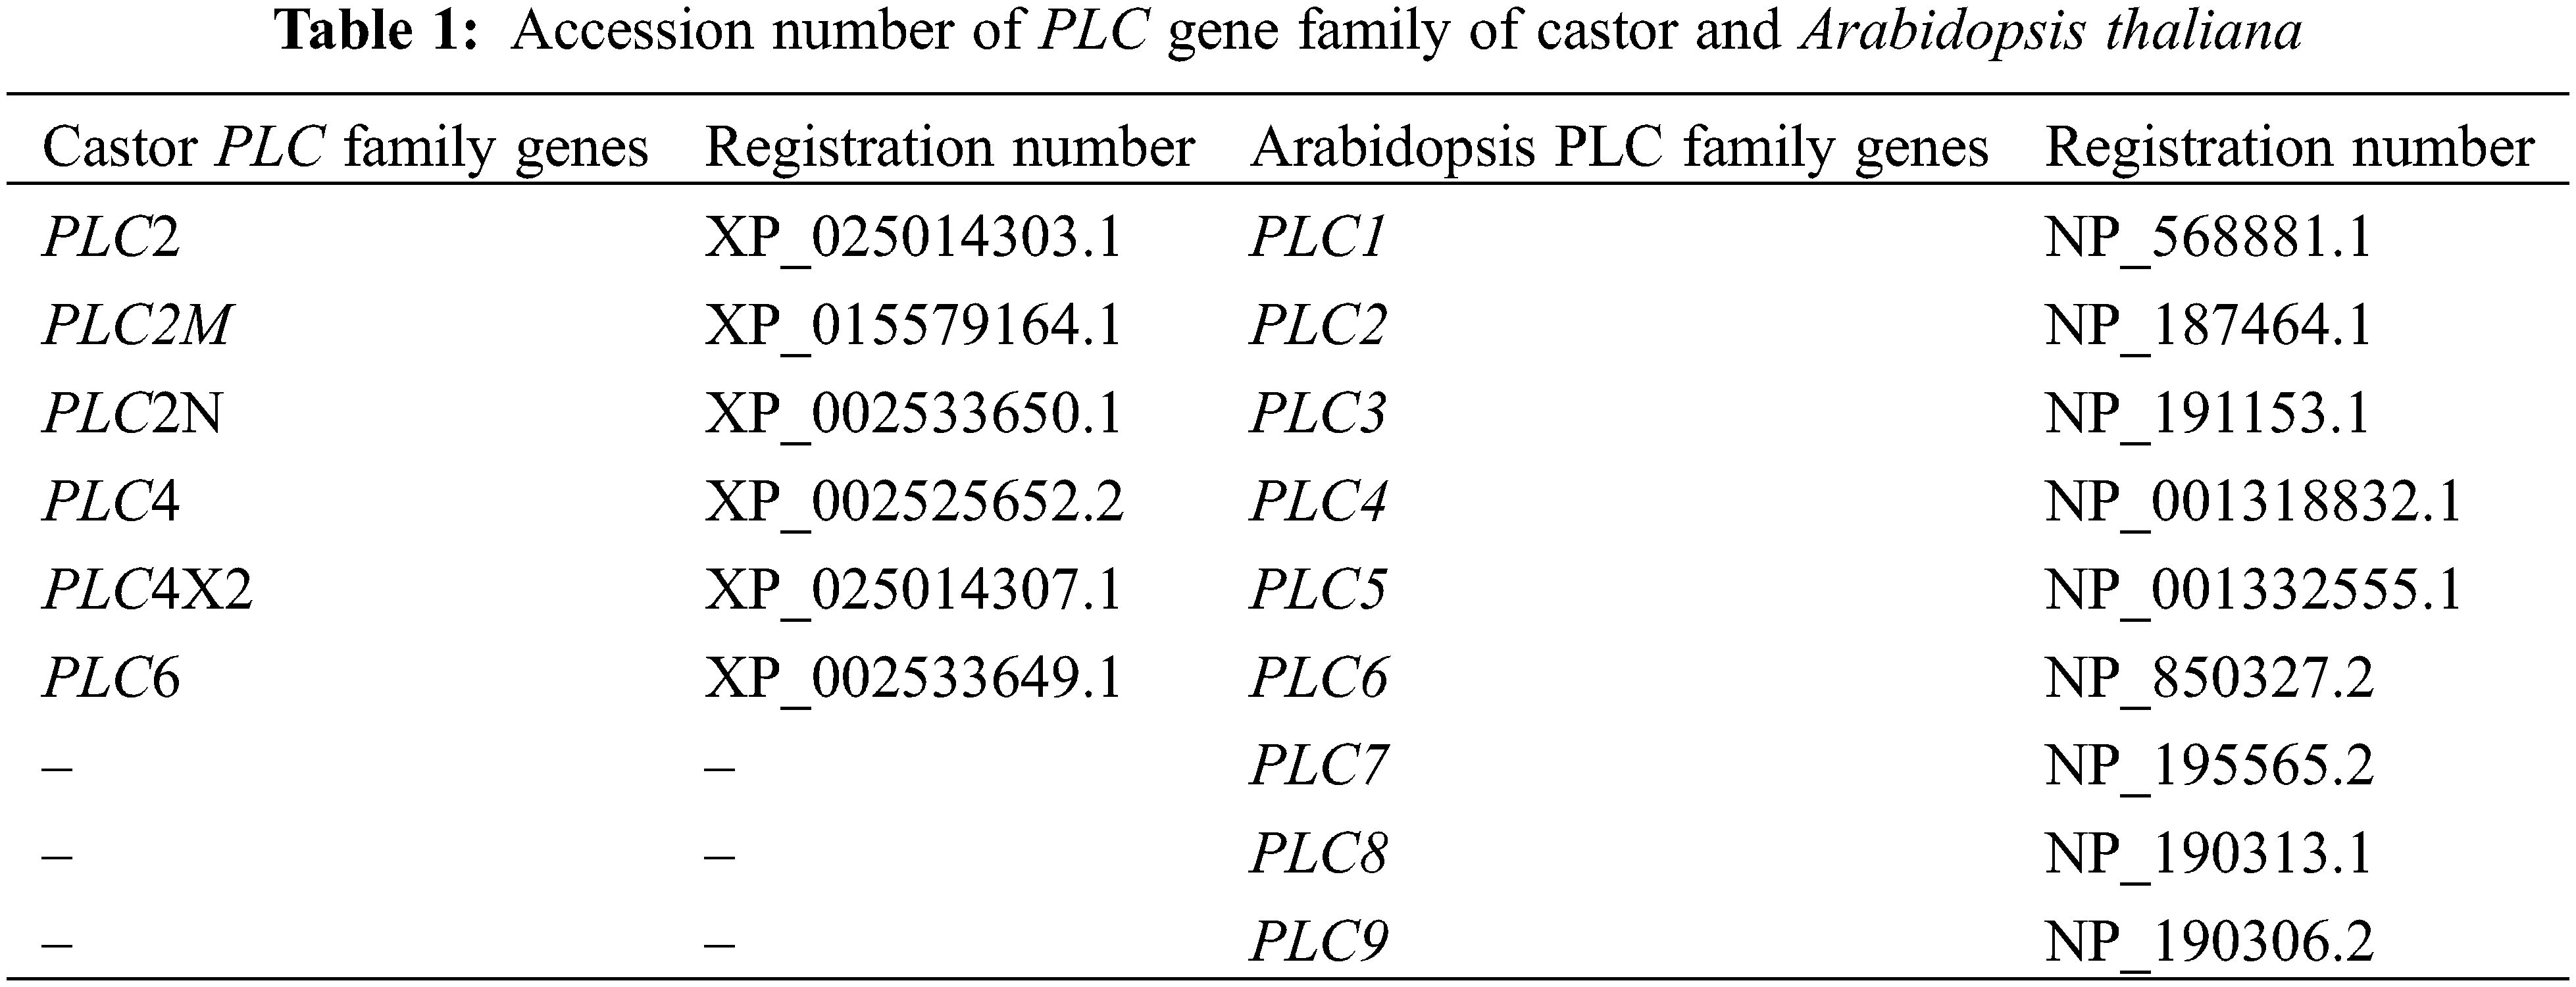
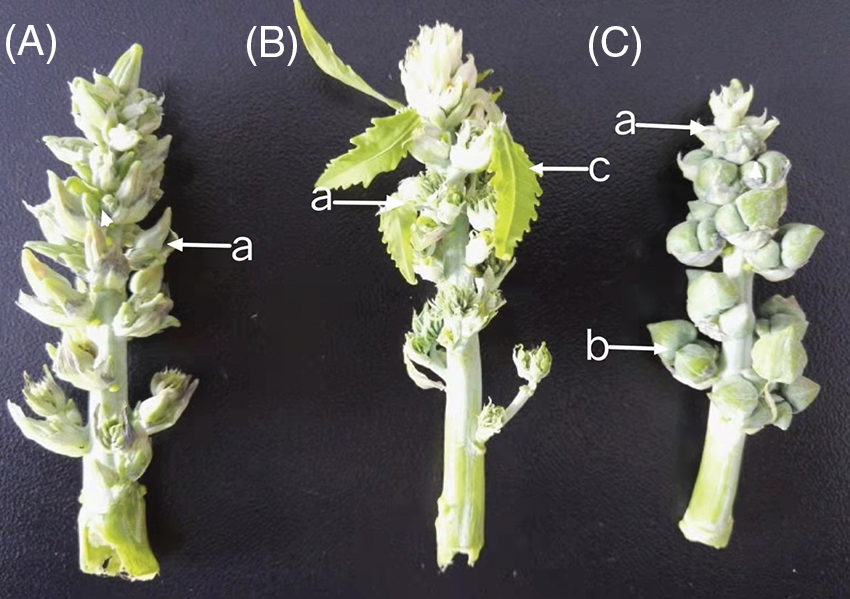
Figure 1: Inflorescence development of the female line of Lm-type castor
Note: A: isofemale inflorescence; B: female inflorescence; C: bisexual inflorescence; a: female flowers; b: male flowers; c: willow-like functional leaves.
2.2 Analysis of the Expression Levels of PLCs in Castor Inflorescences
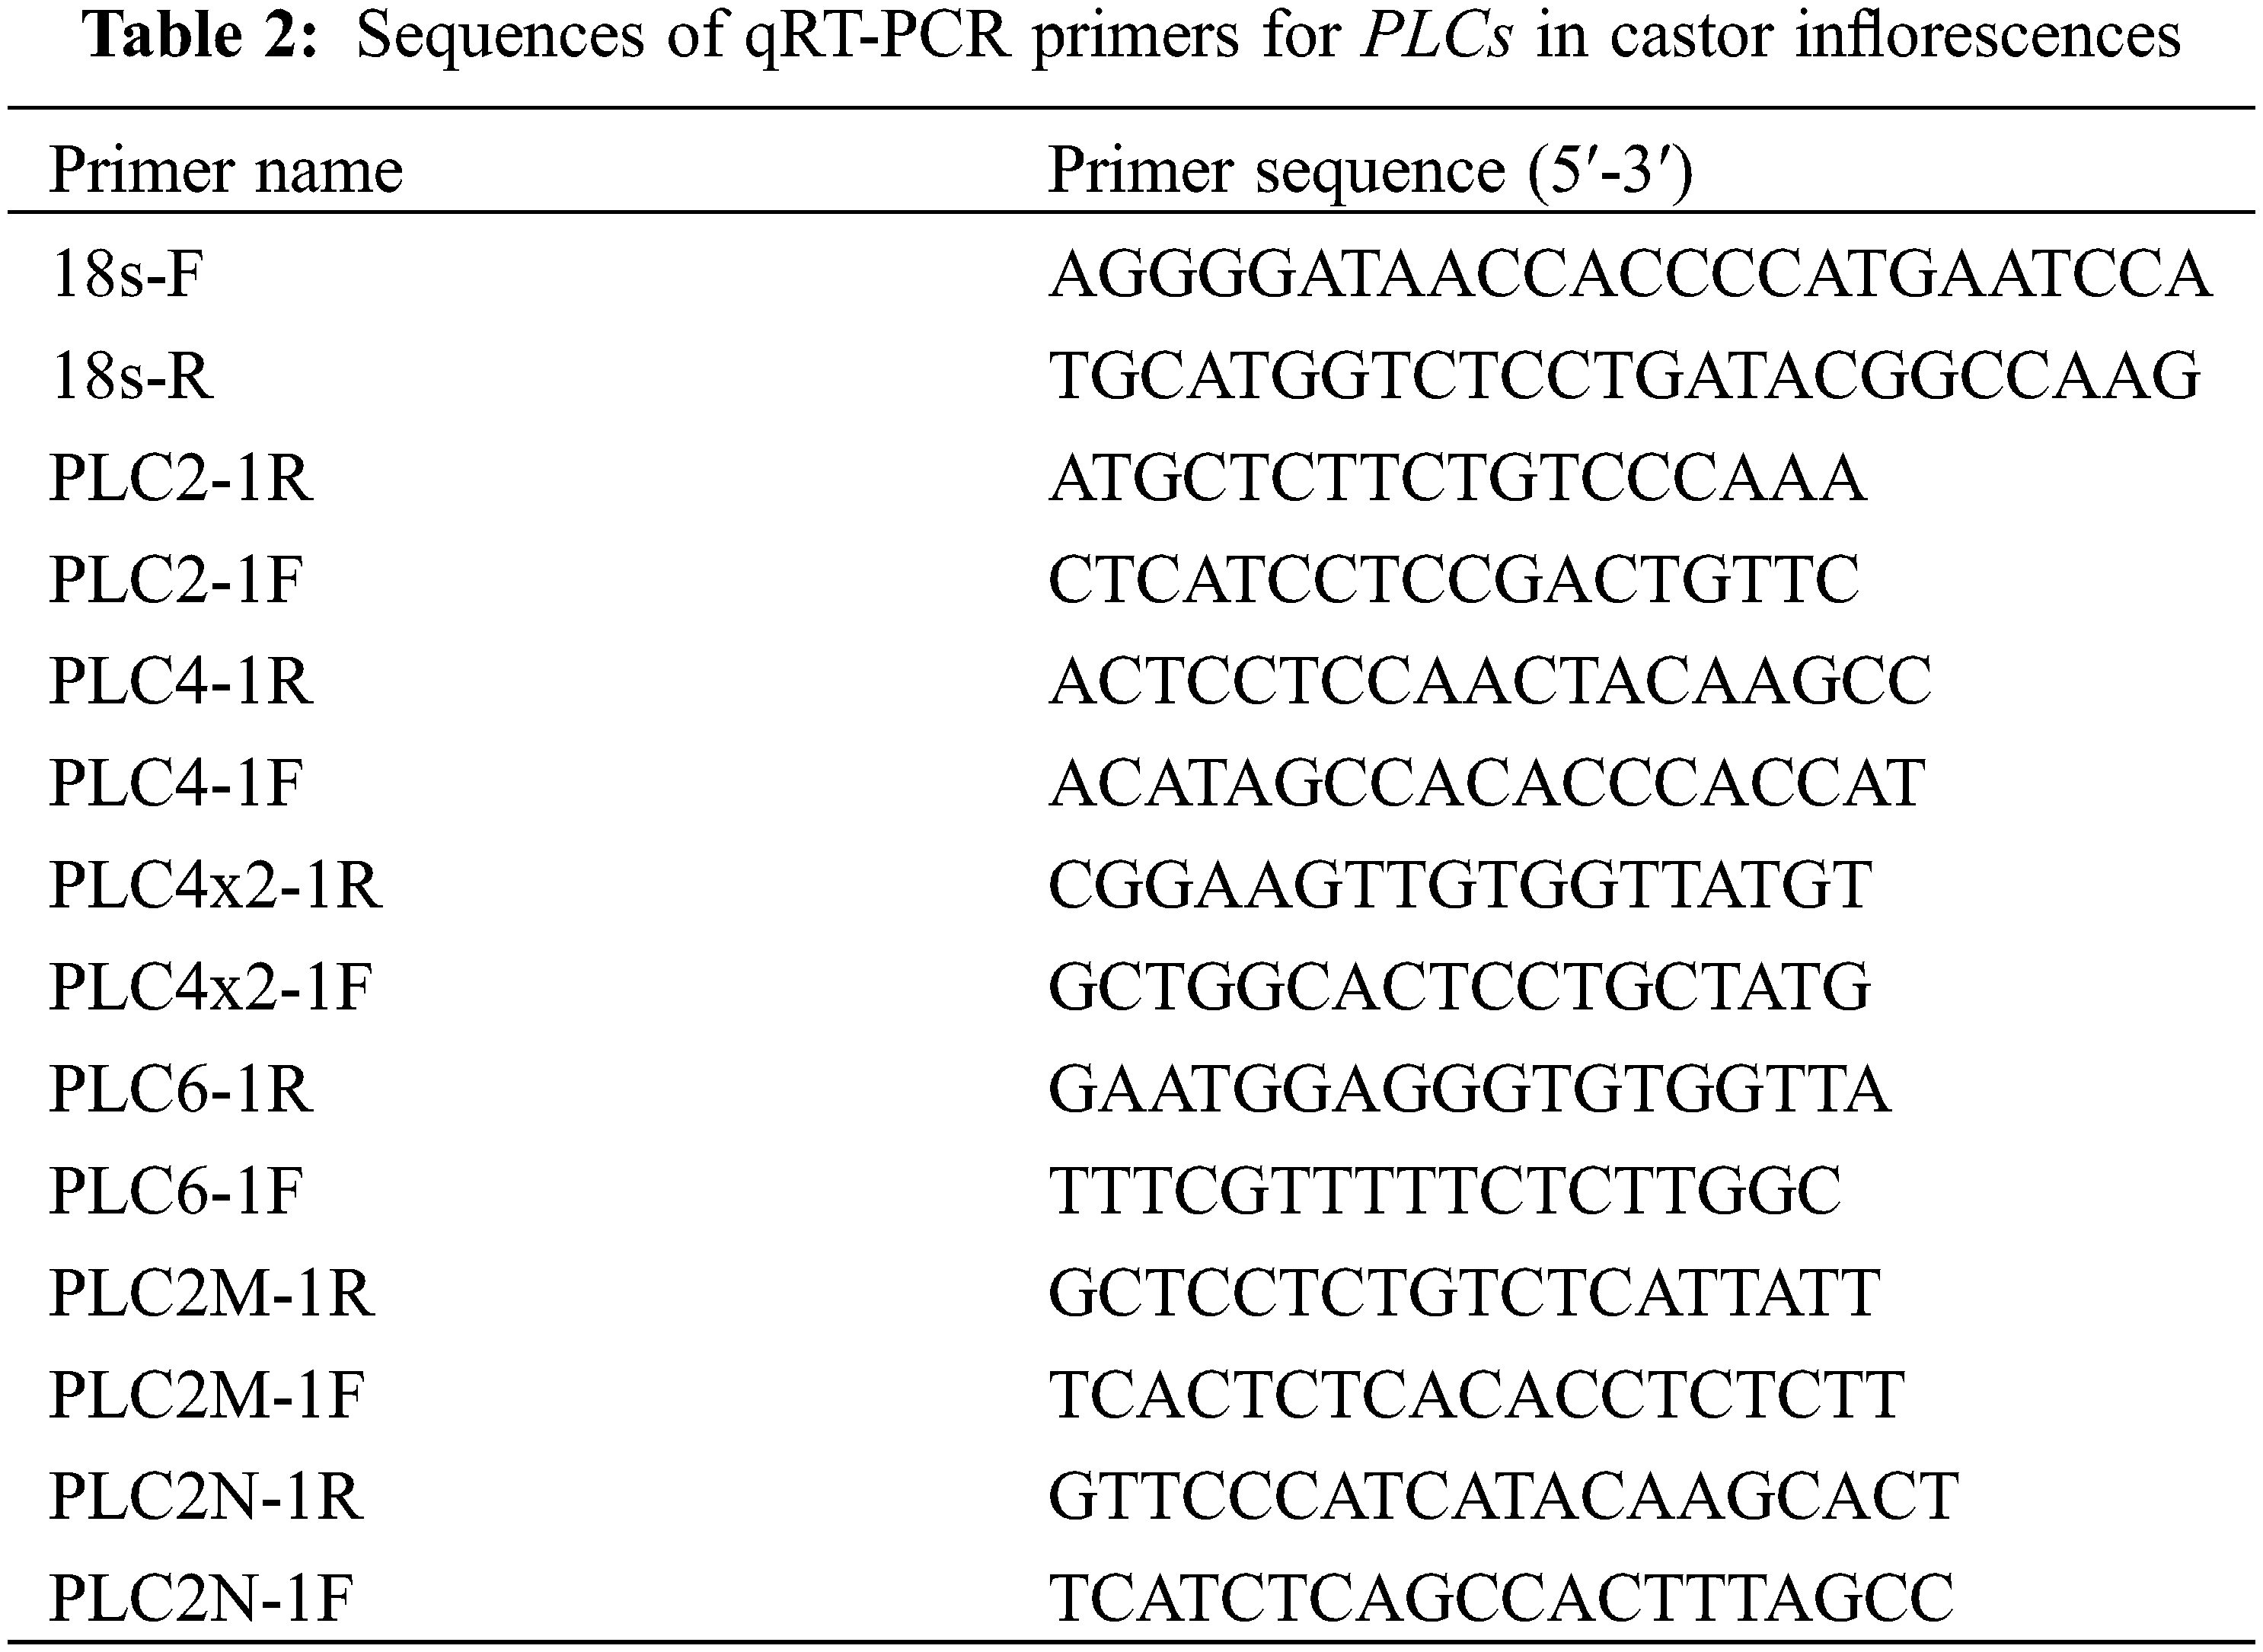
The plant total RNA extraction kit was used to extract the total RNA from the isofemale, female, and bisexual lines of aLmAB2 at the four-leaf stage, five-leaf stage, main stem spike flowering stage, and secondary branch flowering stage (a lot of 12 samples), in order to synthesize cDNA by reverse transcription. With cDNA as the template, reverse transcription–quantitative polymerase chain reaction (RT-qPCR) was performed using SYBR Green as the fluorescent dye and the primers listed in Table 2. The relative expression levels of PLC family genes in the Lm-type castor inflorescences were detected. The expression levels of the six genes were analyzed using the 18S rRNA gene as an internal reference. The experiment was repeated three times. The 2−ΔΔCt method was used for data processing, i.e., the expression of each target gene in different samples was investigated by calculating the F value of the gene’s relative expression level.
2.3.1 Cloning of the Target Genes and Construction of the Plant Binary Expression Vector pBI121-GFP-PLCs
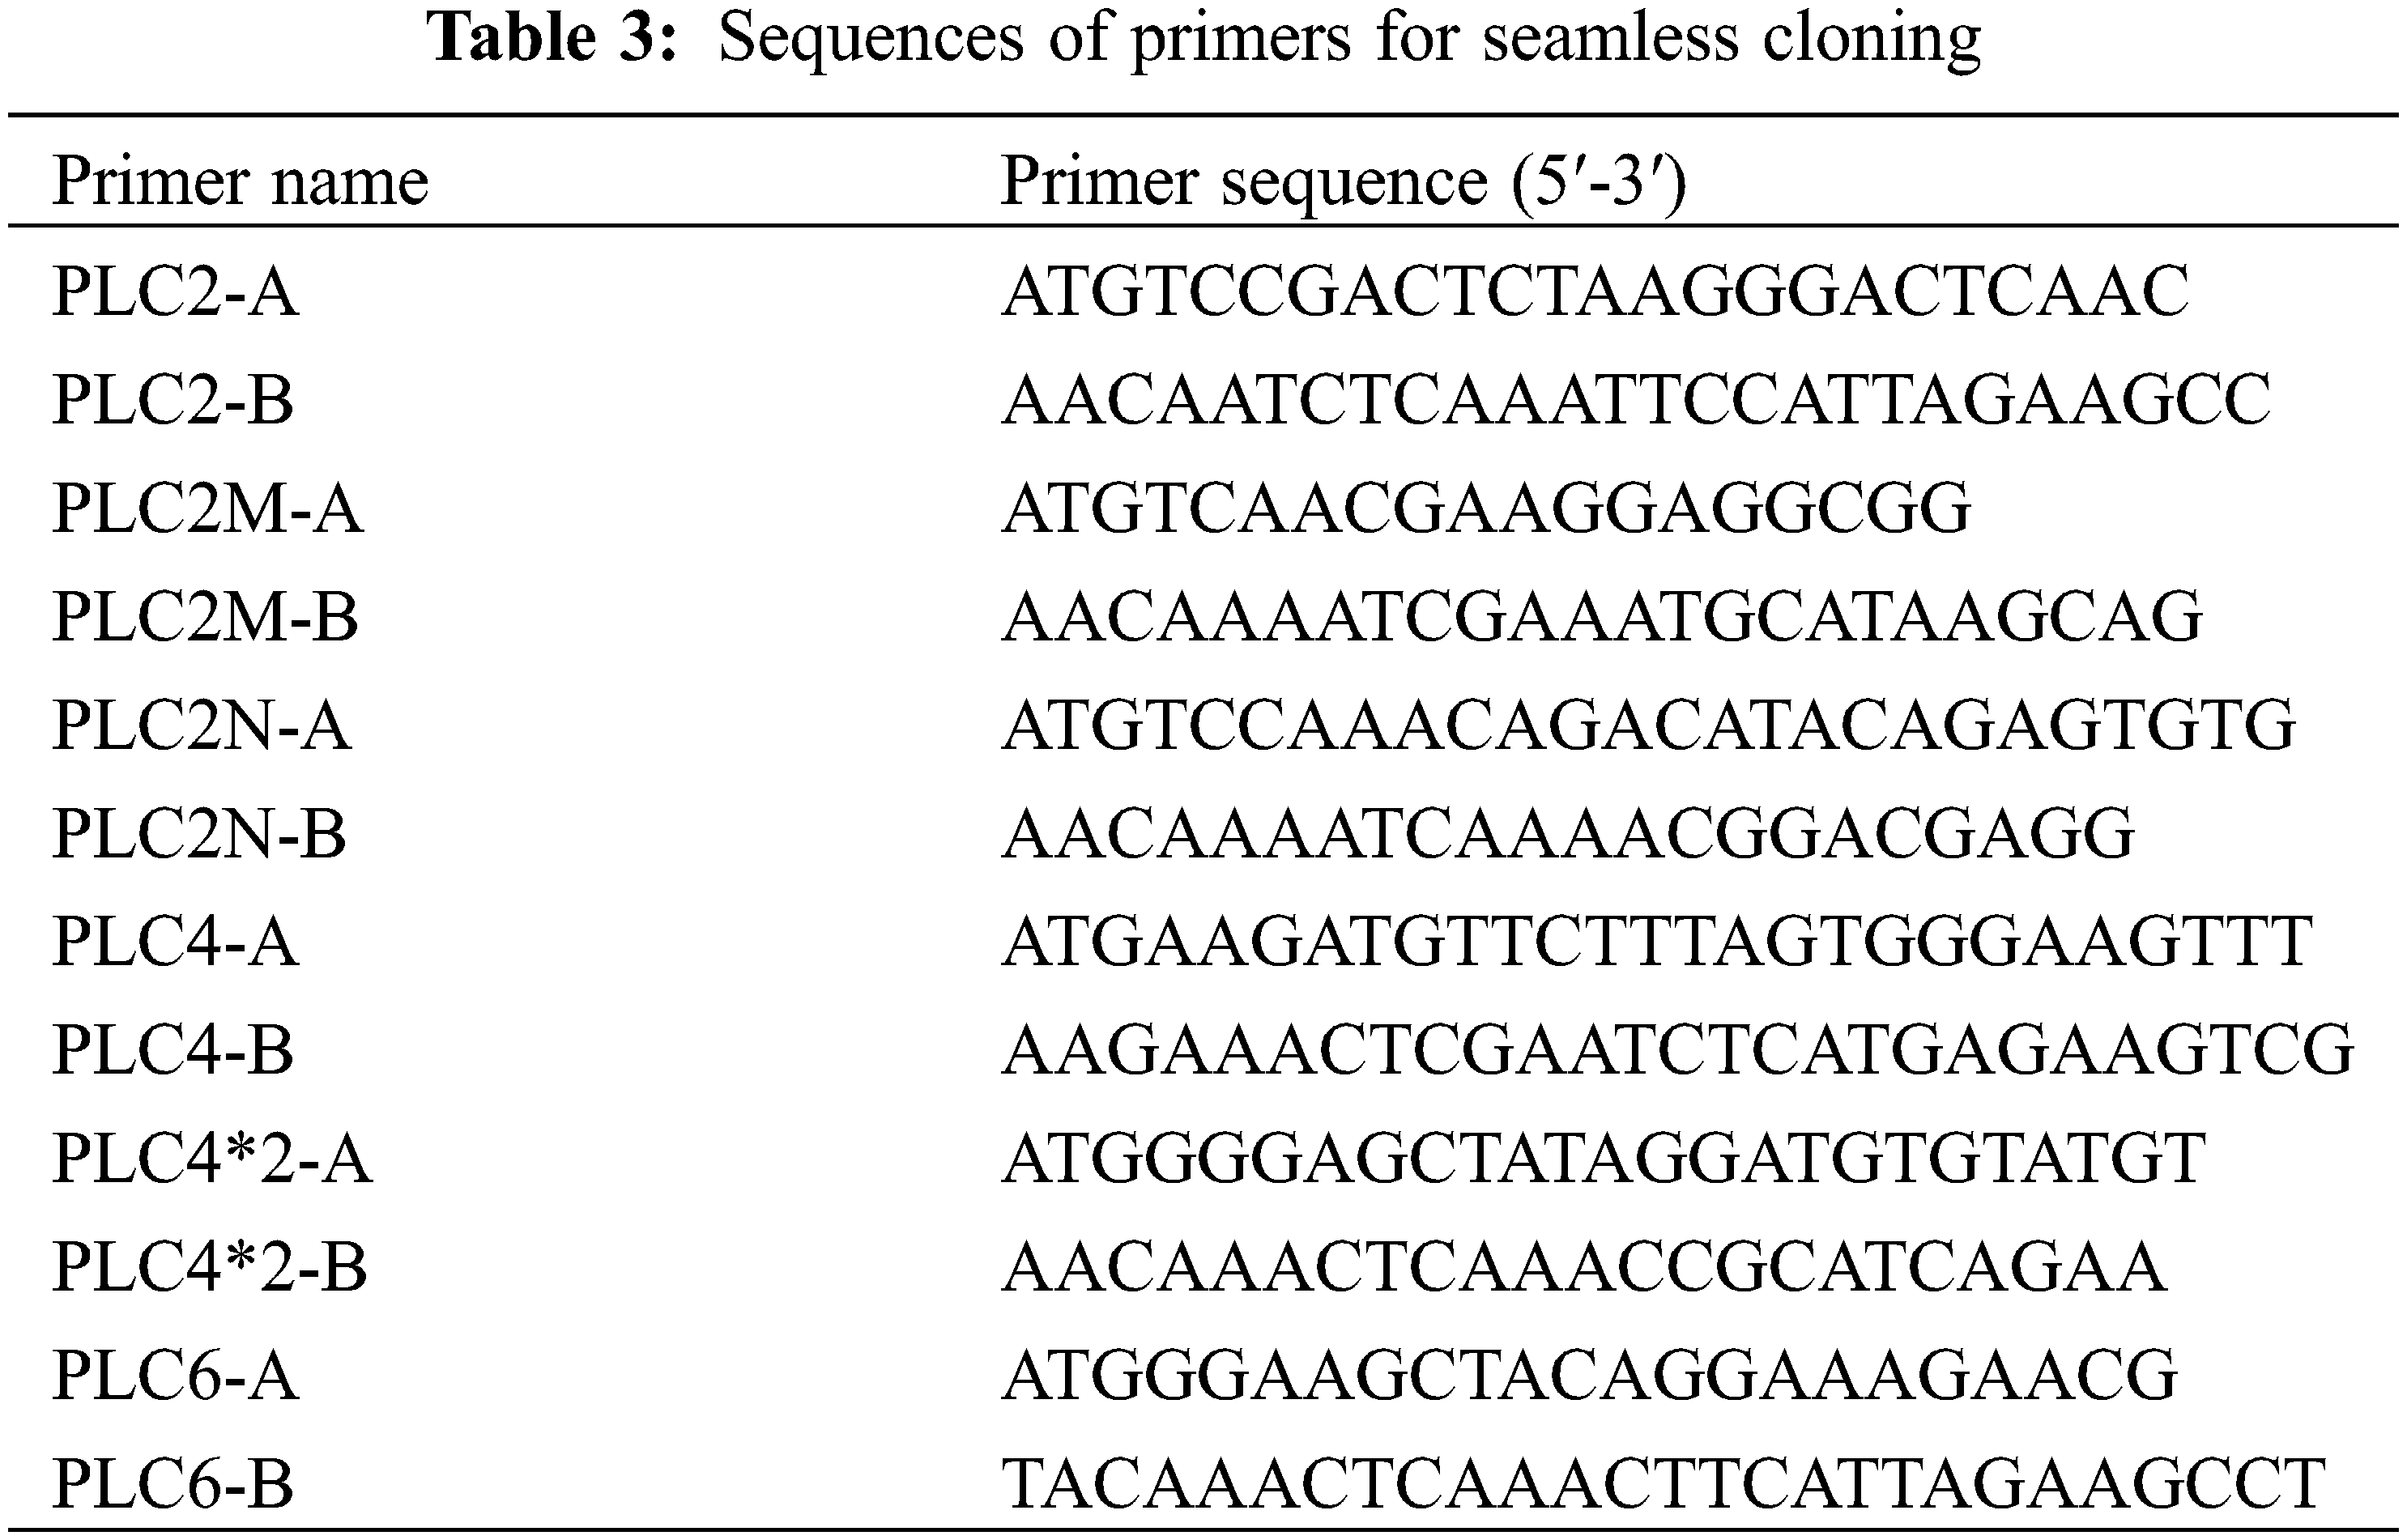
The coding sequence of each PLC gene was downloaded from the National Center for Biotechnology Information (NCBI) database, and the primers for the seamless cloning of the gene sequences were designed using CE Design V1.03 software (Table 3). The cDNA of castor leaves was used as the template for PCR amplification. The restriction enzymes BamH I and Kpn I were used to linearize pBI121-GFP, and the reaction condition was 37°C for 3 h. Double-digestion products and amplification products were purified and recovered through gel excision. The target gene fragment was ligated to the expression vector using the seamless cloning method to obtain the fused expression vector. The obtained recombinant vector was transformed into Agrobacterium GV3101 competent cells.
2.3.2 Transient Transformation and Observation of Onion Epidermal Cells
To produce the fusion protein of green fluorescent protein (GFP) with each PLC gene product, the gene downstream of the CaMV35S promoter was cloned in the pBI121-GFP vector. The plasmid pBI121-GFP-PLCs was confirmed by sequencing. The successfully constructed subcellular localization expression vector was used to transform onion epidermal cells using the Agrobacterium-mediated method. The cultured onion epidermal cells were observed under an inverted fluorescence microscope and photographed under natural light and fluorescence. The subcellular locations of the PLC proteins in castor cells were determined as described [26].
2.4 Heterologous Overexpression of Castor PLC Family Genes in A. thaliana
The overexpression vector pCAMBIA1390-PLCs was constructed by the method described in Section 2.3.1, and the obtained recombinant overexpression vector was transformed into Agrobacterium GV3101 competent cells. WT A. thaliana plants were genetically transformed with the Agrobacterium overexpression vectors of the six target genes using the A. thaliana floral dip transformation method. The T3 generation A. thaliana plants was obtained by inoculation, transplantation, dipping, resistance screening, and domestication, and the resistant A. thaliana plants expressing the six PLC family genes were obtained, i.e., AtPLCs+, AtPLC2+, AtPLC2M+, AtPLC2N+, AtPLC4+, AtPLC4X2+, AtPLC6+ plants (for the specific steps, please refer to the literature [27]).
2.5 Molecular Level Identification of AtPLCs+ Plants
Genomic DNA was extracted from the T3 generation AtPLCs+ and WT A. thaliana inflorescences. The recombinant plasmid of the plant overexpression vector pCAMBIA1390-PLCS was used as a positive control, the genomic DNA of the Columbia WT A. thaliana leaves was used as a negative control, and PCR analysis was performed. The reaction products were separated by agarose gel electrophoresis.
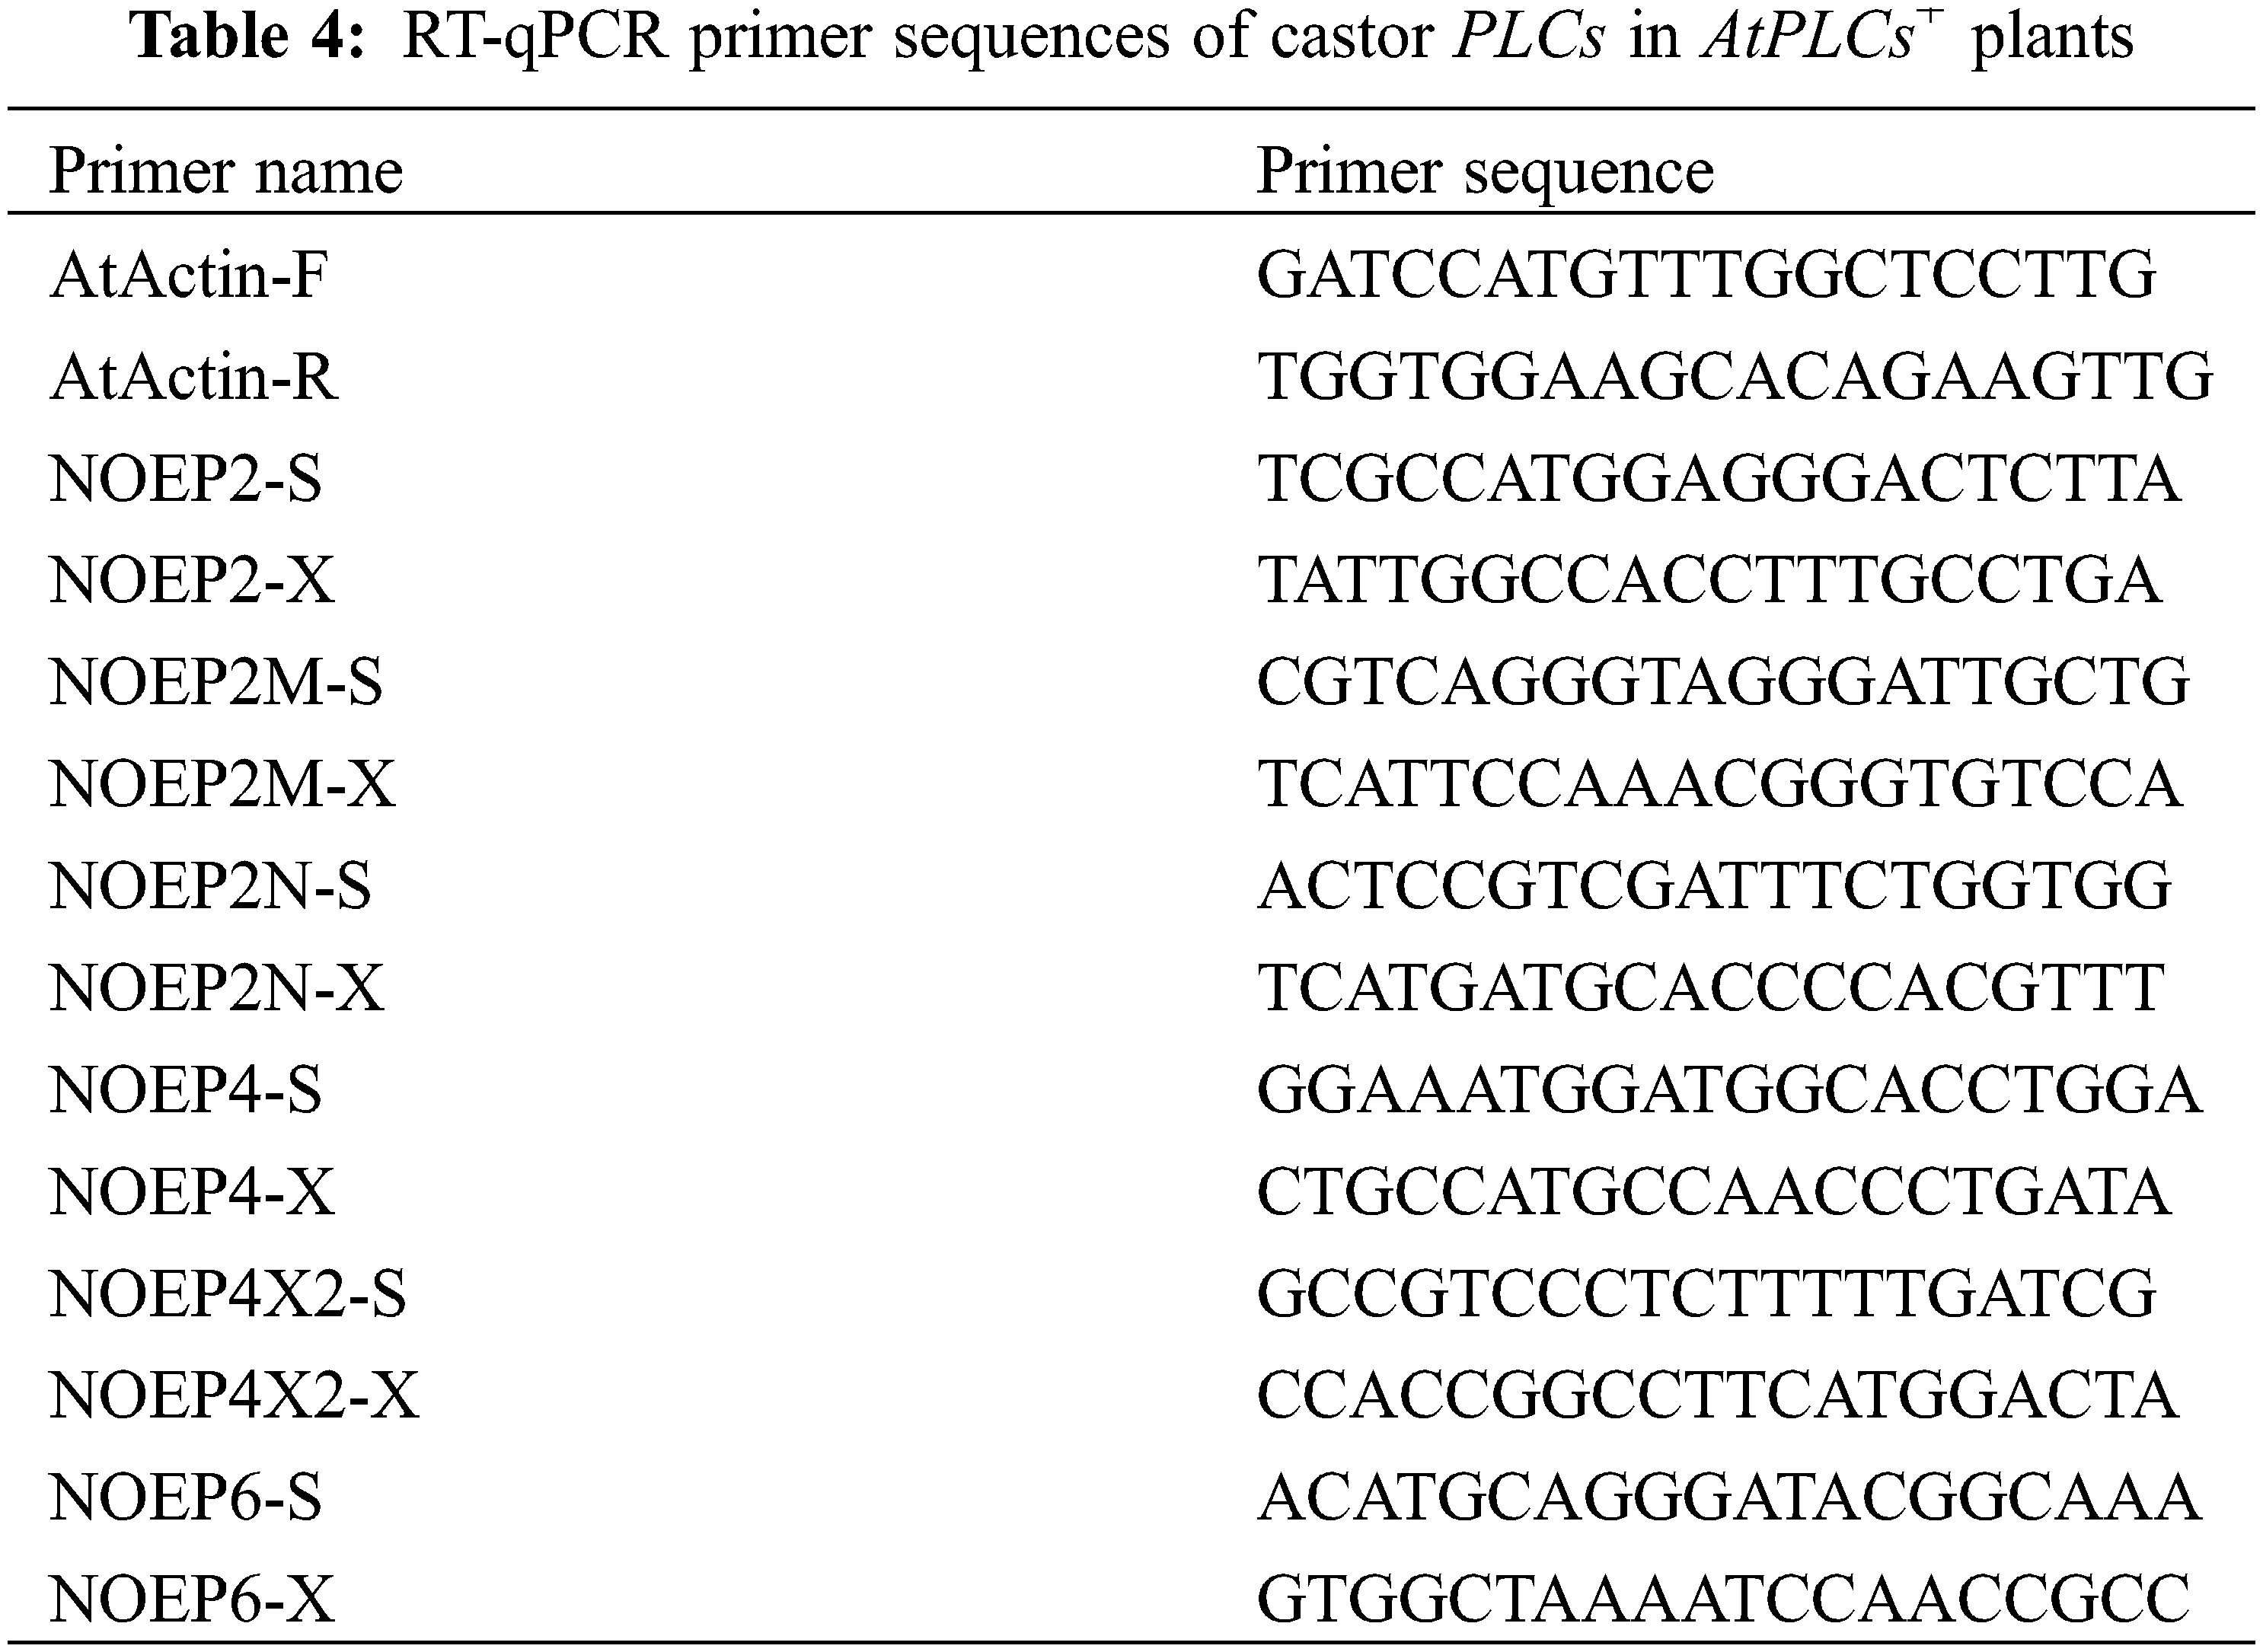
Total RNA of from the T3 generation AtPLCs+ and WT A. thaliana inflorescences was extracted and reverse-transcribed into cDNA. The cDNA samples of the T3 generation AtPLCs+ and WT A. thaliana inflorescences were used as templates, and SYBR Green was used as the fluorescent dye in RT-qPCR to detect the relative expression levels of PLC family genes in A. thaliana plants. The primer sequences are shown in Table 4. SPSS 19.0 software and GraphPad Prism were used for data processing and plotting, respectively. The significance analysis was performed by the independent-sample T-test on the averages, and the results are presented aa histograms of the relative expression levels.
2.6 Biological-Level Identification of AtPLCs+ Plants
The T3-generation AtPLCs+ plants were identified at the biological level. The growth and development of the plants were observed and measured, including the plant height, the number of florets, the bolting time of the main stem, the number of lateral stems, and the number of basal leaves and cauline leaves.
Both the WT A. thaliana plants and A. thaliana plants with heterologous overexpression (AtPLCs+, AtPLC2+, AtPLC2M+, AtPLC2N+, AtPLC4+, AtPLC4X2+, AtPLC6+ plants) at the four-leaf stage in the Murashige and Skoog (MS) solid medium were transplanted and cultured under the same conditions. For each type of plant (a total of seven types), the plants were cultured in 30 pots, and pictures of the representative plants with the similar growth state were taken. For the 30 plants of each type, phenotypic trait statistics were calculated, and the averages were used for statistical analysis.
2.7 Correlation Analysis of the Castor PLC Family Genes
Fluorescence quantification was performed on the T3-generation AtPLCs+ A. thaliana plants with stable heterologous overexpression of the six PLC family genes in order to determine the induced expression levels of the other five A. thaliana PLC family genes when one castor PLC gene was overexpressed. According to the homology comparison results between the castor and A. thaliana PLC gene sequences, the relationship between the PLC family genes was predicted.
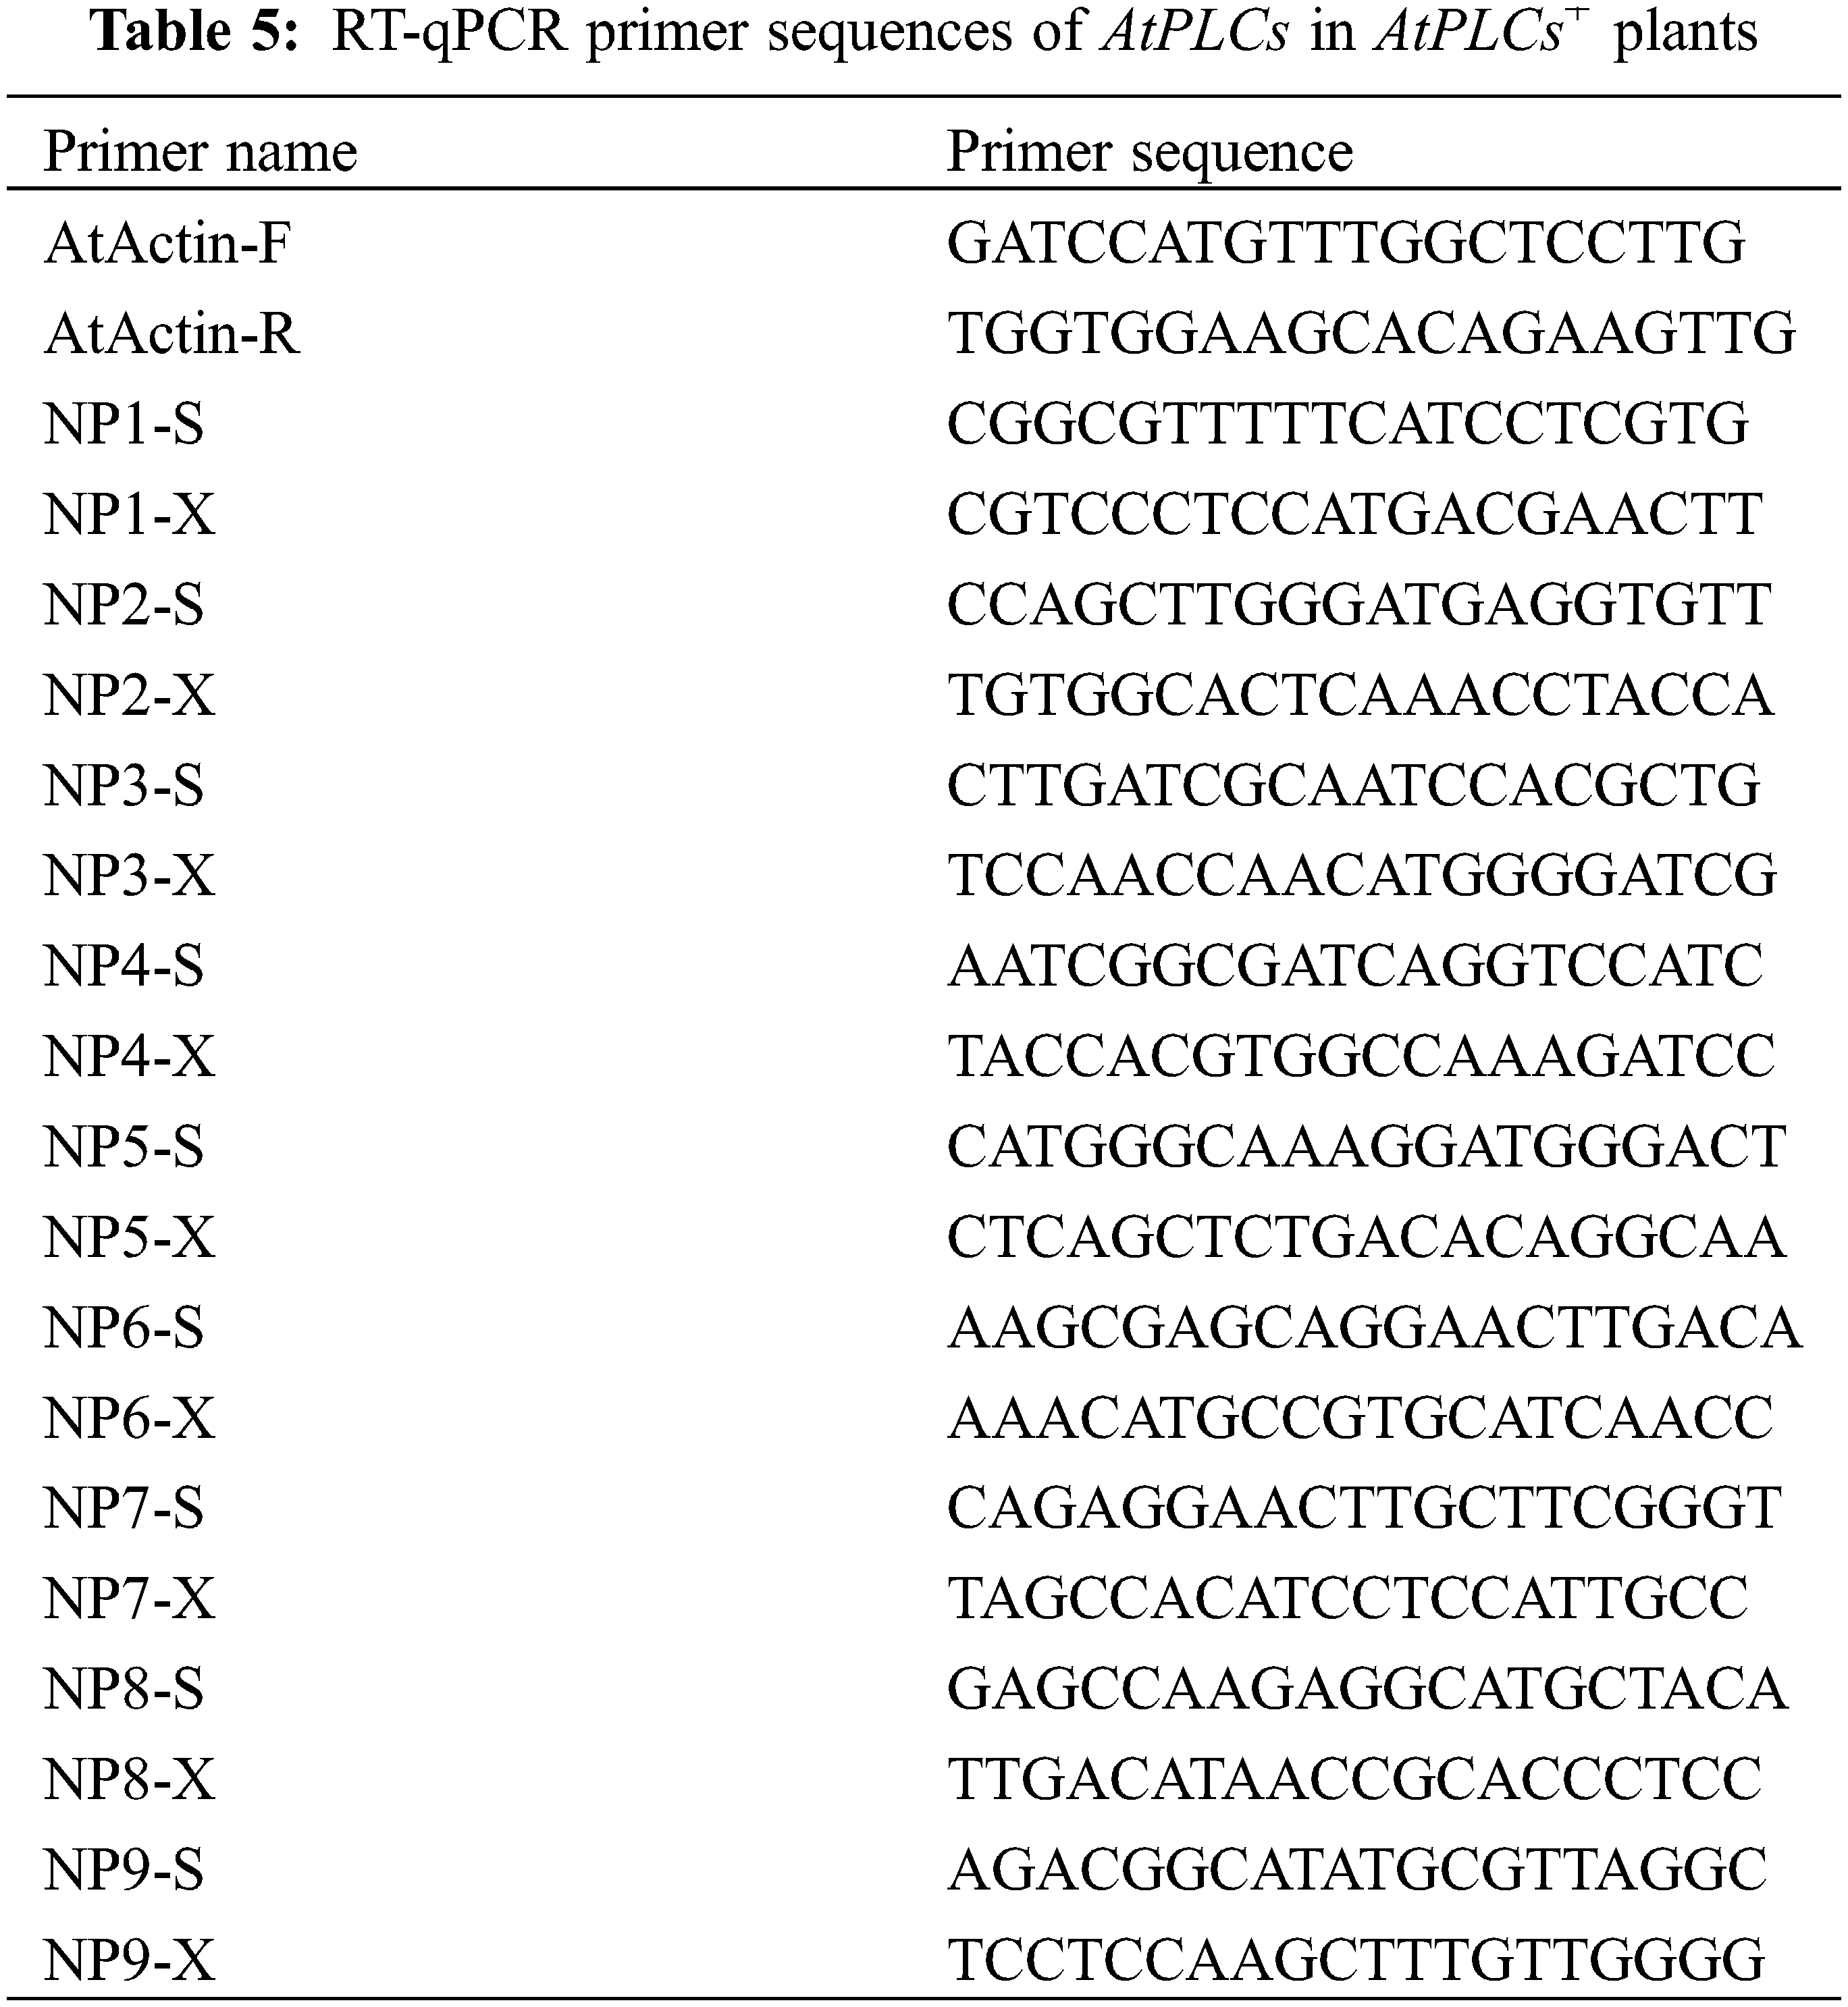
The messenger RNA (mRNA) sequences of A. thaliana PLCs were obtained from NCBI. The cDNA samples of the T3-generation AtPLCs+ and WT A. thaliana inflorescences were used as templates and SYBR Green was used as the fluorescent dye in the RT-qPCR to detect the relative expression levels of PLC family genes in A. thaliana plants. SPSS 19.0 software and GraphPad Prism were used for data processing and plotting, respectively. The significance analysis was performed by the independent-sample T-test on the means, and the results are presented as histograms of the relative expression levels. The primer sequences are shown in Table 5.
3.1 Analysis of the Expression Levels of PLC Family Genes at Different Developmental Stages of Different Types of Castor Inflorescences
The results of the RT-qPCR analysis of PLC2, PLC2M, PLC2N, PLC4, PLC4X2, and PLC6 in the three types of inflorescences of aLmAB2 (isofemale line, female line, bisexual line) at the four-leaf stage, five-leaf stage, main stem spike flowering stage, and secondary branch flowering stage are shown in Fig. 2.
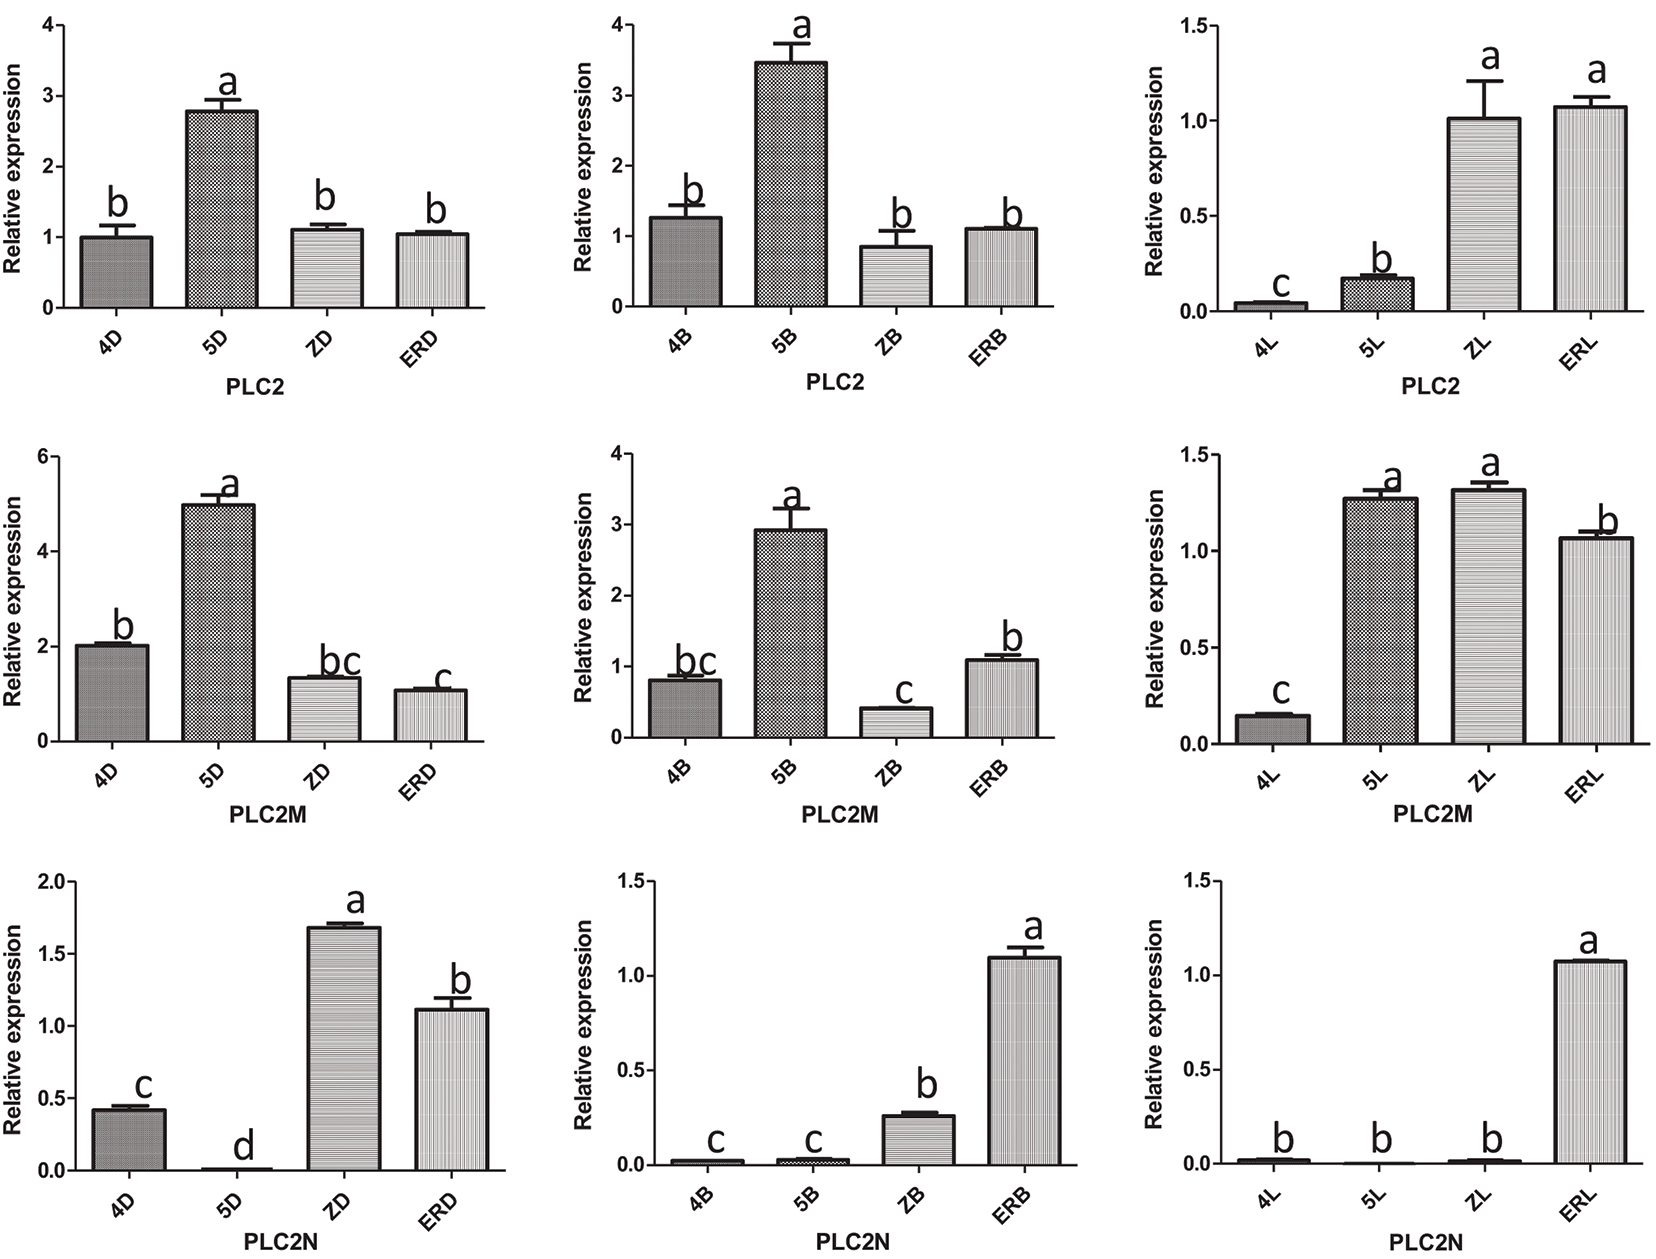
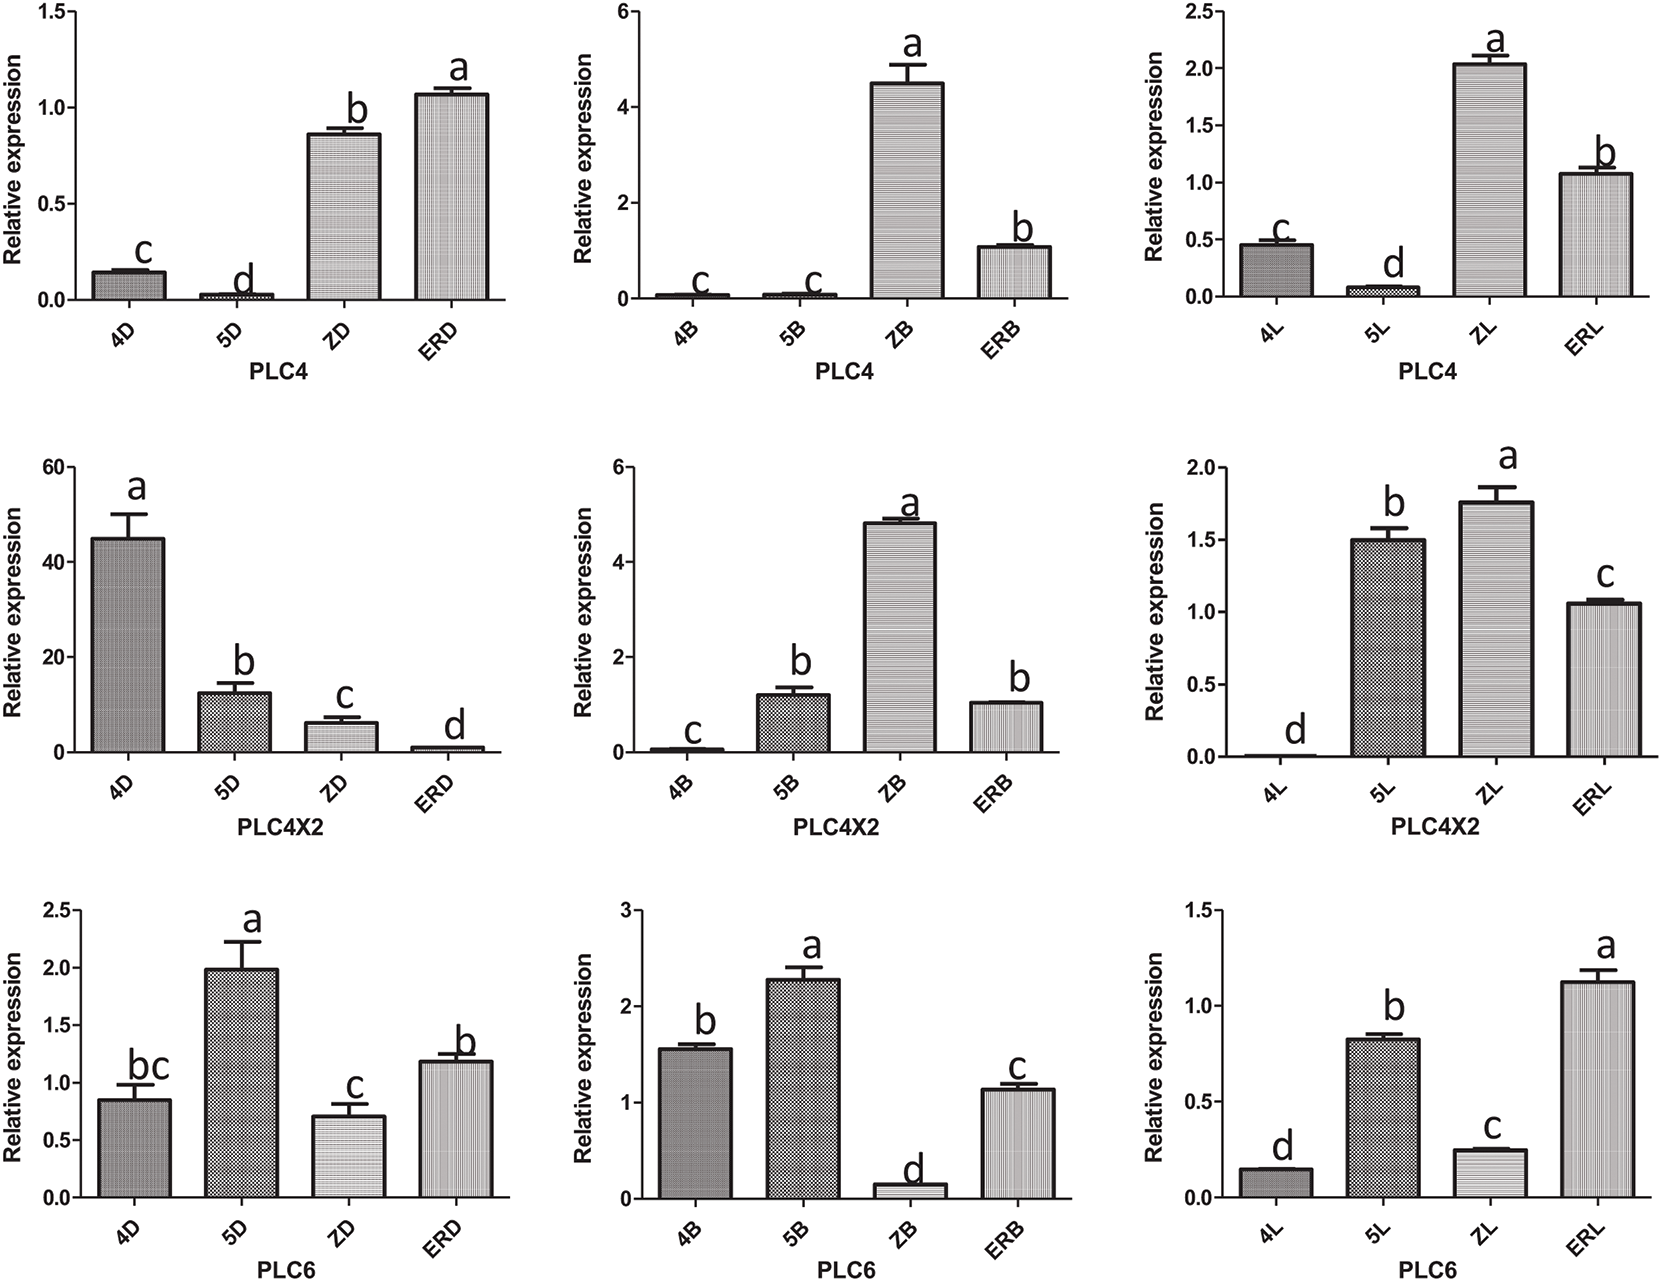
Figure 2: Analysis of the expression levels
Note: 4D: isofemale four-leaf stage; 5D: isofemale five-leaf stage; ZD: isofemle main stem spike flowering stage; ERD: isofemale secondary branch flowering stage; 4B: female four-leaf stage; 5B: female five-leaf stage; ZB: female main stem spike flowering stage; ERB: female secondary branch flowering stage; 4L: bisexual four-leaf stage; 5L: bisexual five-leaf stage; ZL: bisexual main stem spike flowering stage; ERL: bisexual secondary branch flowering period. Different letters indicated different differences, and the significance level was p < 0.05.
The PLC2 gene was highly expressed in the five-leaf stage of the isofemale inflorescence and the secondary branch flowering stage of the bisexual inflorescence. It had low expression in the four-leaf stage of the isofemale inflorescence, the main stem spike flowering stage of the female inflorescence, and the four-leaf stage of the bisexual inflorescence. Its relative expression level in the five-leaf stage of the female inflorescence was approximately 87.43 times that in the four-leaf stage of the bisexual inflorescence.
PLC2M was highly expressed in the five-leaf stage of the isofemale and female inflorescences and the main stem spike flowering stage of the bisexual inflorescence. Its relative expression was low in the secondary branch flowering stage of isofemale inflorescence, the main stem spike flowering stage of female inflorescence, and the four-leaf stage of bisexual inflorescence. Its relative expression level in the five-leaf stage of the isofemale inflorescence was approximately 32.45 times that in the four-leaf stage of the bisexual inflorescence.
PLC2N was highly expressed in the main stem spike flowering stage of the isofemale inflorescence and the secondary branch flowering stage of the female and bisexual inflorescences. It had low relative expression in the five-leaf stage of the three types of inflorescences. Its relative expression level in the main stem spike flowering stage of the isofemale inflorescence was approximately 126.24 times that in the main stem spike flowering stage of the bisexual inflorescence.
PLC4 was highly expressed in the secondary branch flowering stage of the isofemale inflorescence and the main stem spike flowering stage of the female and bisexual inflorescences. Its relative expression was low in the five-leaf stage of the three types of inflorescences. Its relative expression level in the main stem spike flowering stage of female inflorescence was approximately 202.25 times that in the five-leaf stage of the isofemale inflorescence.
PLC4X2 was highly expressed in the four-leaf stage of the isofemale inflorescence and the main stem spike flowering stage of the female and bisexual inflorescences but had low expression in the secondary branch flowering stage of the isofemale inflorescence and the four-leaf stage of the female and bisexual inflorescences. Its relative expression level in the four-leaf stage of the isofemale inflorescence was approximately 11190.6 times that in the four-leaf stage of the bisexual inflorescence.
PLC6 was highly expressed in the five-leaf stage of the isofemale and female inflorescences and the secondary branch flowering stage of the bisexual inflorescence, but it had low expression in the main stem spike flowering stage of isofemale and female inflorescences and the four-leaf stage of the bisexual inflorescence. Its relative expression level in the five-leaf stage of the female inflorescence was approximately 15.14 times that in the four-leaf stage of the bisexual inflorescence.
Overall, the PLC2, PLC4, and PLC6 genes showed relatively high expression levels in the female inflorescence; the PLC2M, PLC2N, and PLC4X2 genes showed relatively high expression in the isofemale inflorescence, while PLC4 showed relatively low expression in isofemale inflorescence; the PLC2, PLC2M, PLC2N, PLC4X2, and PLC6 genes showed relatively low expression levels in the bisexual inflorescence.
3.2 Comparison of the Expression Levels of Six PLC Family Genes in the Same Developmental Stage of the Same Type of Inflorescence
The expression levels of the six PLC family genes in the same developmental stage of the same type of inflorescence were analyzed. It can be seen from Fig. 3.
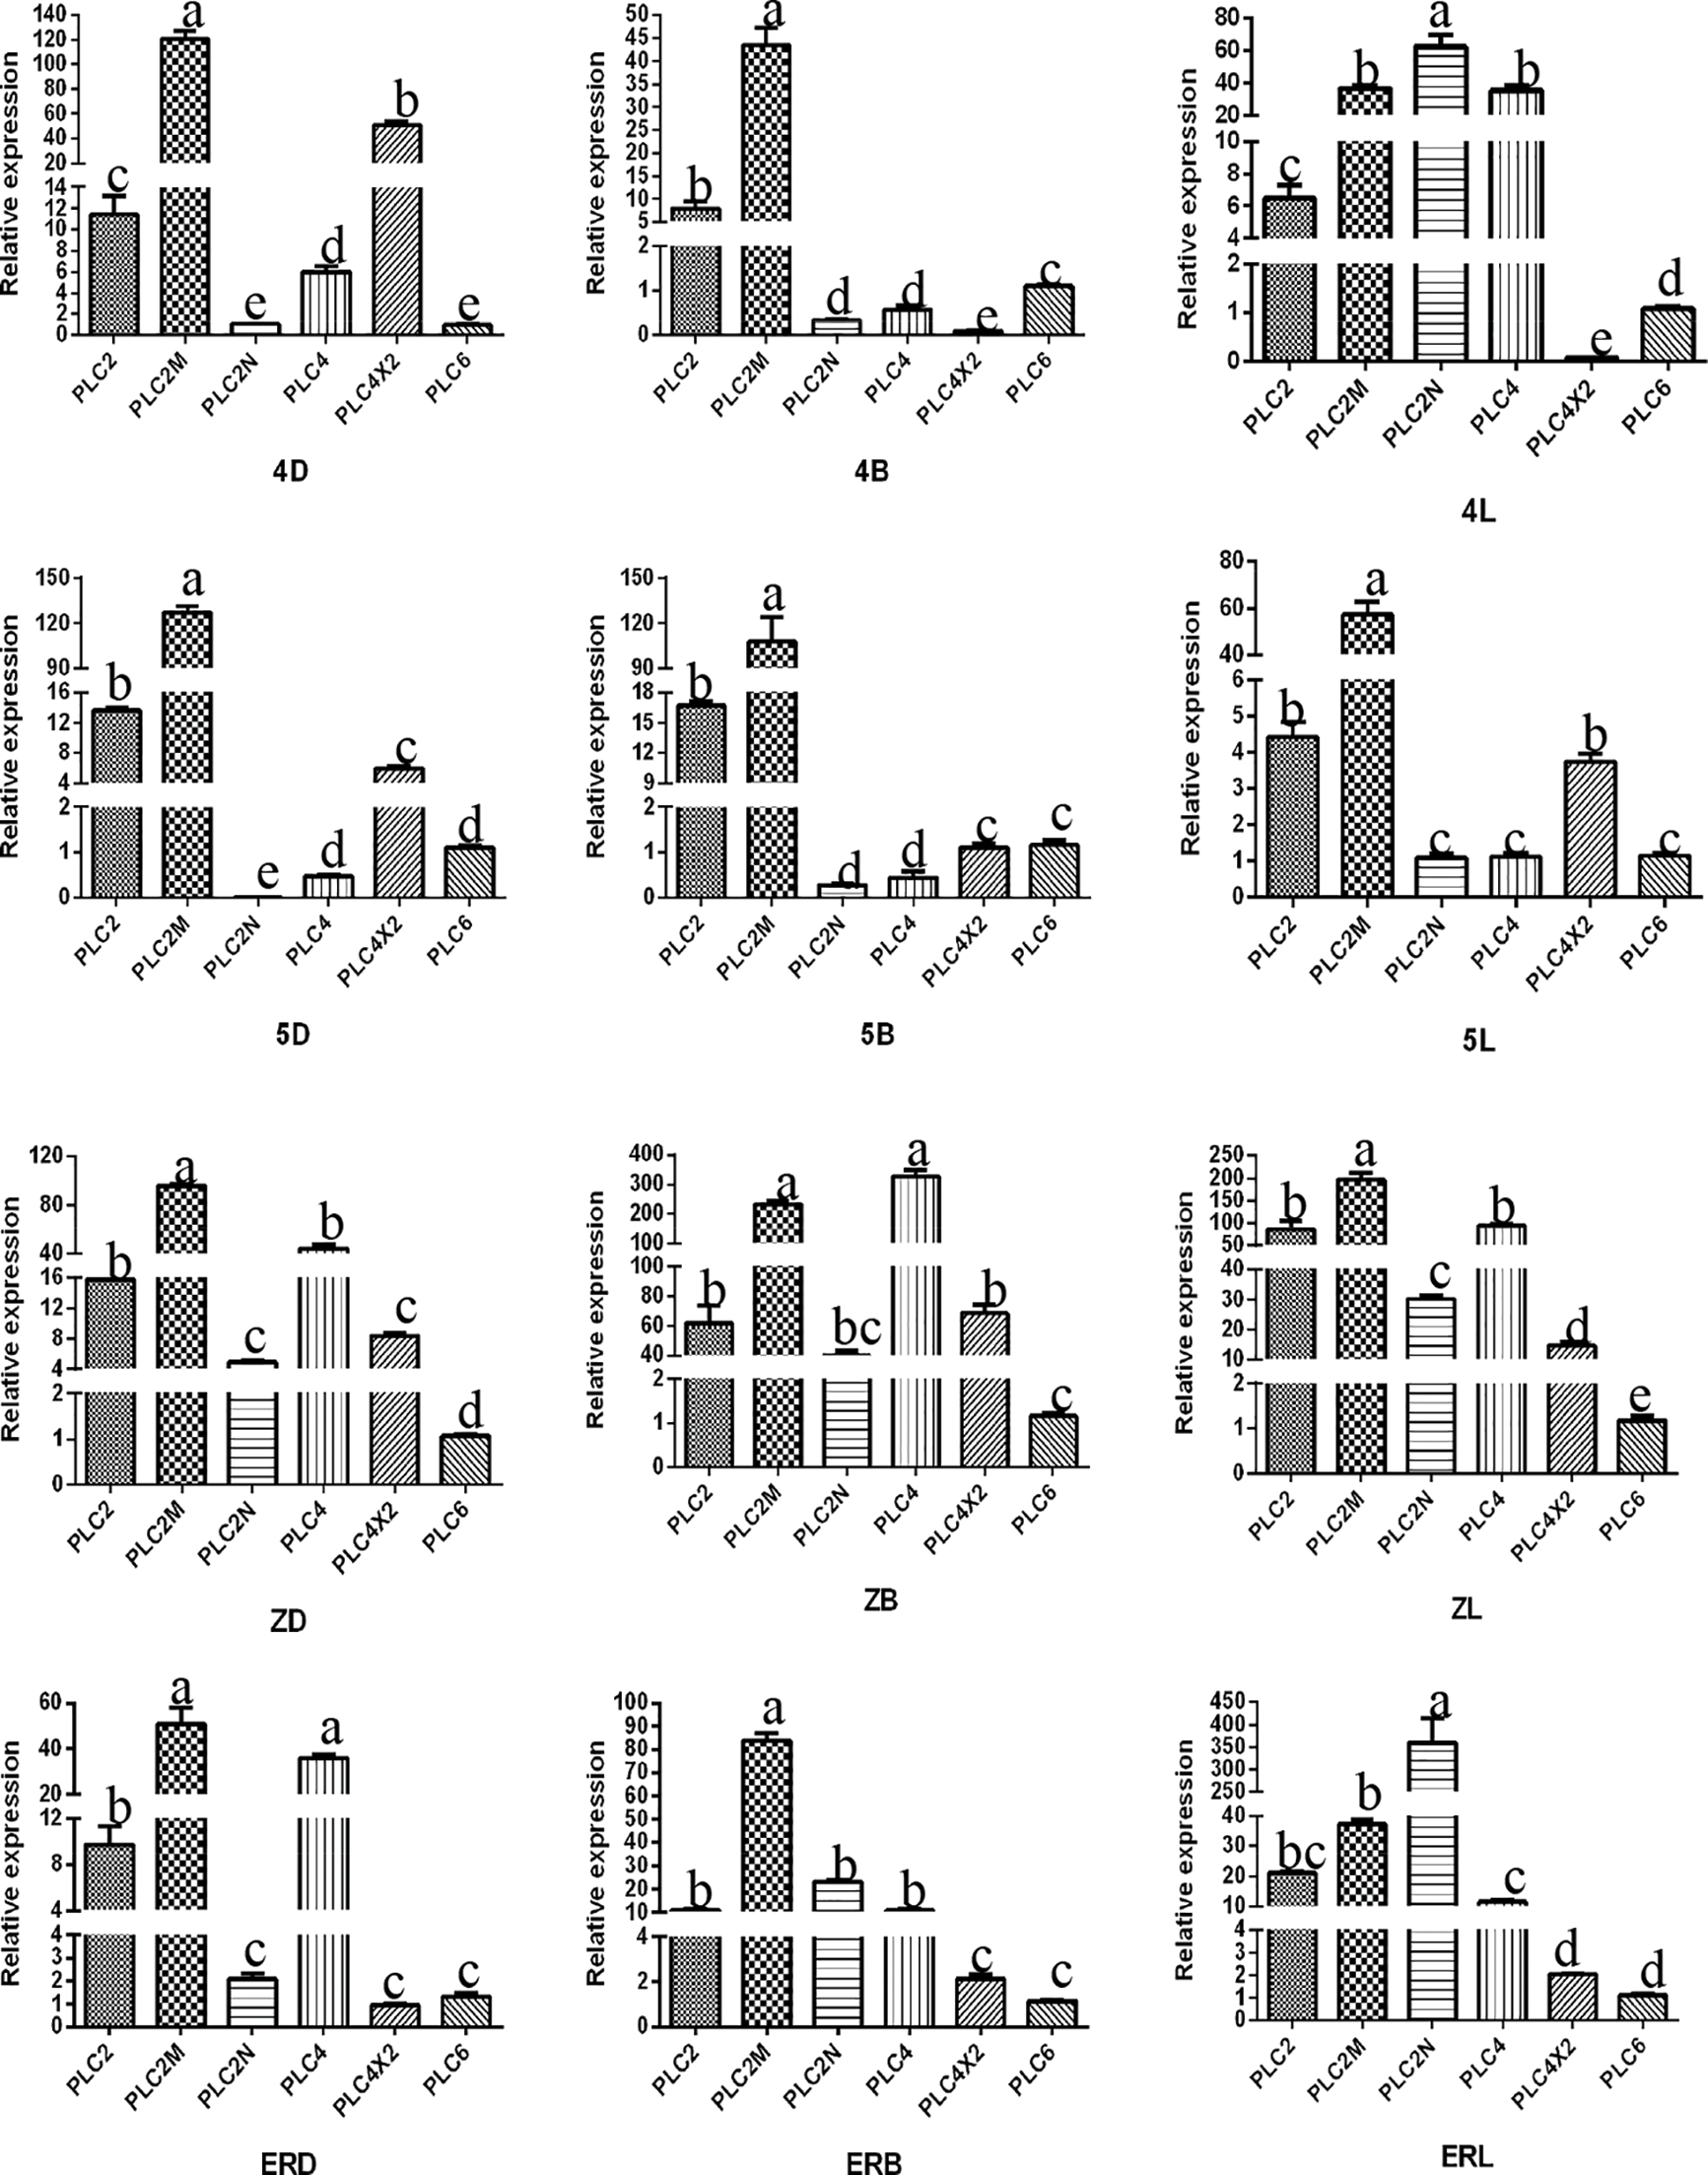
Figure 3: Analysis of the expression amount of the same type of inflorescence development time
Note: 4D: isofemale four-leaf stage; 5D: isofemale five-leaf stage; ZD: isofemale main stem spike flowering stage; ERD: isofemale secondary branch flowering stage; 4B: female four-leaf stage; 5B: female five-leaf stage; ZB: female main stem spike flowering stage; ERB: female secondary branch flowering stage; 4 L: bisexual four-leaf stage; 5 L: bisexual five-leaf stage; ZL: bisexual main stem spike flowering stage; ERL: bisexual secondary branch flowering period. Different letters indicated different differences, and the significance level was p ≤ 0.05.
In the isofemale inflorescence at the four-leaf stage, the expression levels of PLC2M and PLC4X2 were relatively high, and those of the PLC2N and PLC6 genes were relatively low. In the five-leaf stage, PLC2M and PLC2 were relatively high, and PLC2N and PLC4 were relatively low. In the main stem spike flowering stage, PLC2M and PLC4 were relatively high, and PLC6 and PLC2N were relatively low. In the secondary branch flowering stage, PLC2M and PLC4 were relatively high, and PLC4X2 and PLC6 were relatively low.
In the female inflorescence in the four-leaf and five-leaf stages, PLC2M and PLC2 genes were relatively highly expressed, and PLC4X2 and PLC2N were relatively low. In the main stem spike flowering stage, PLC4 and PLC2M were relatively high, and PLC6 and PLC2N were relatively low. In the secondary branch flowering stage, PLC2M and PLC2N were relatively high, and PLC6 and PLC4X2 were relatively low.
In the bisexual inflorescence at the four-leaf stage, the expression levels of the PLC2M and PLC2N genes were relatively high, and those of the PLC4X2 and PLC6 genes were relatively low. In the five-leaf stage, PLC2M and PLC2 were relatively high, and PLC2N and PLC4 were relatively low. In the main stem spike flowering stage, PLC2M and PLC4 were relatively high, and PLC6 and PLC4X2 were relatively low. In the secondary branch flowering stage, PLC2N and PLC2M were relatively high, and PLC6 and PLC4X2 were relatively low.
3.3 Subcellular Localization of the Castor PLC Family Genes
The expression of PLC family genes in the onion epidermis was observed under a fluorescence microscope. It can be seen from Fig. 4 that under the condition of bright field, the complete cell structure can be observed, and the expression of green fluorescent protein in the cell membrane and nucleus can be seen in the pBI121-GFP no-load plasmid control (Fig. 4A). Under the condition of green fluorescence, PLC family proteins are mainly accumulated on the cell membrane (Fig. 4B), indicating that castor PLC family genes are expressed in the cell membrane of onion epidermis cells.
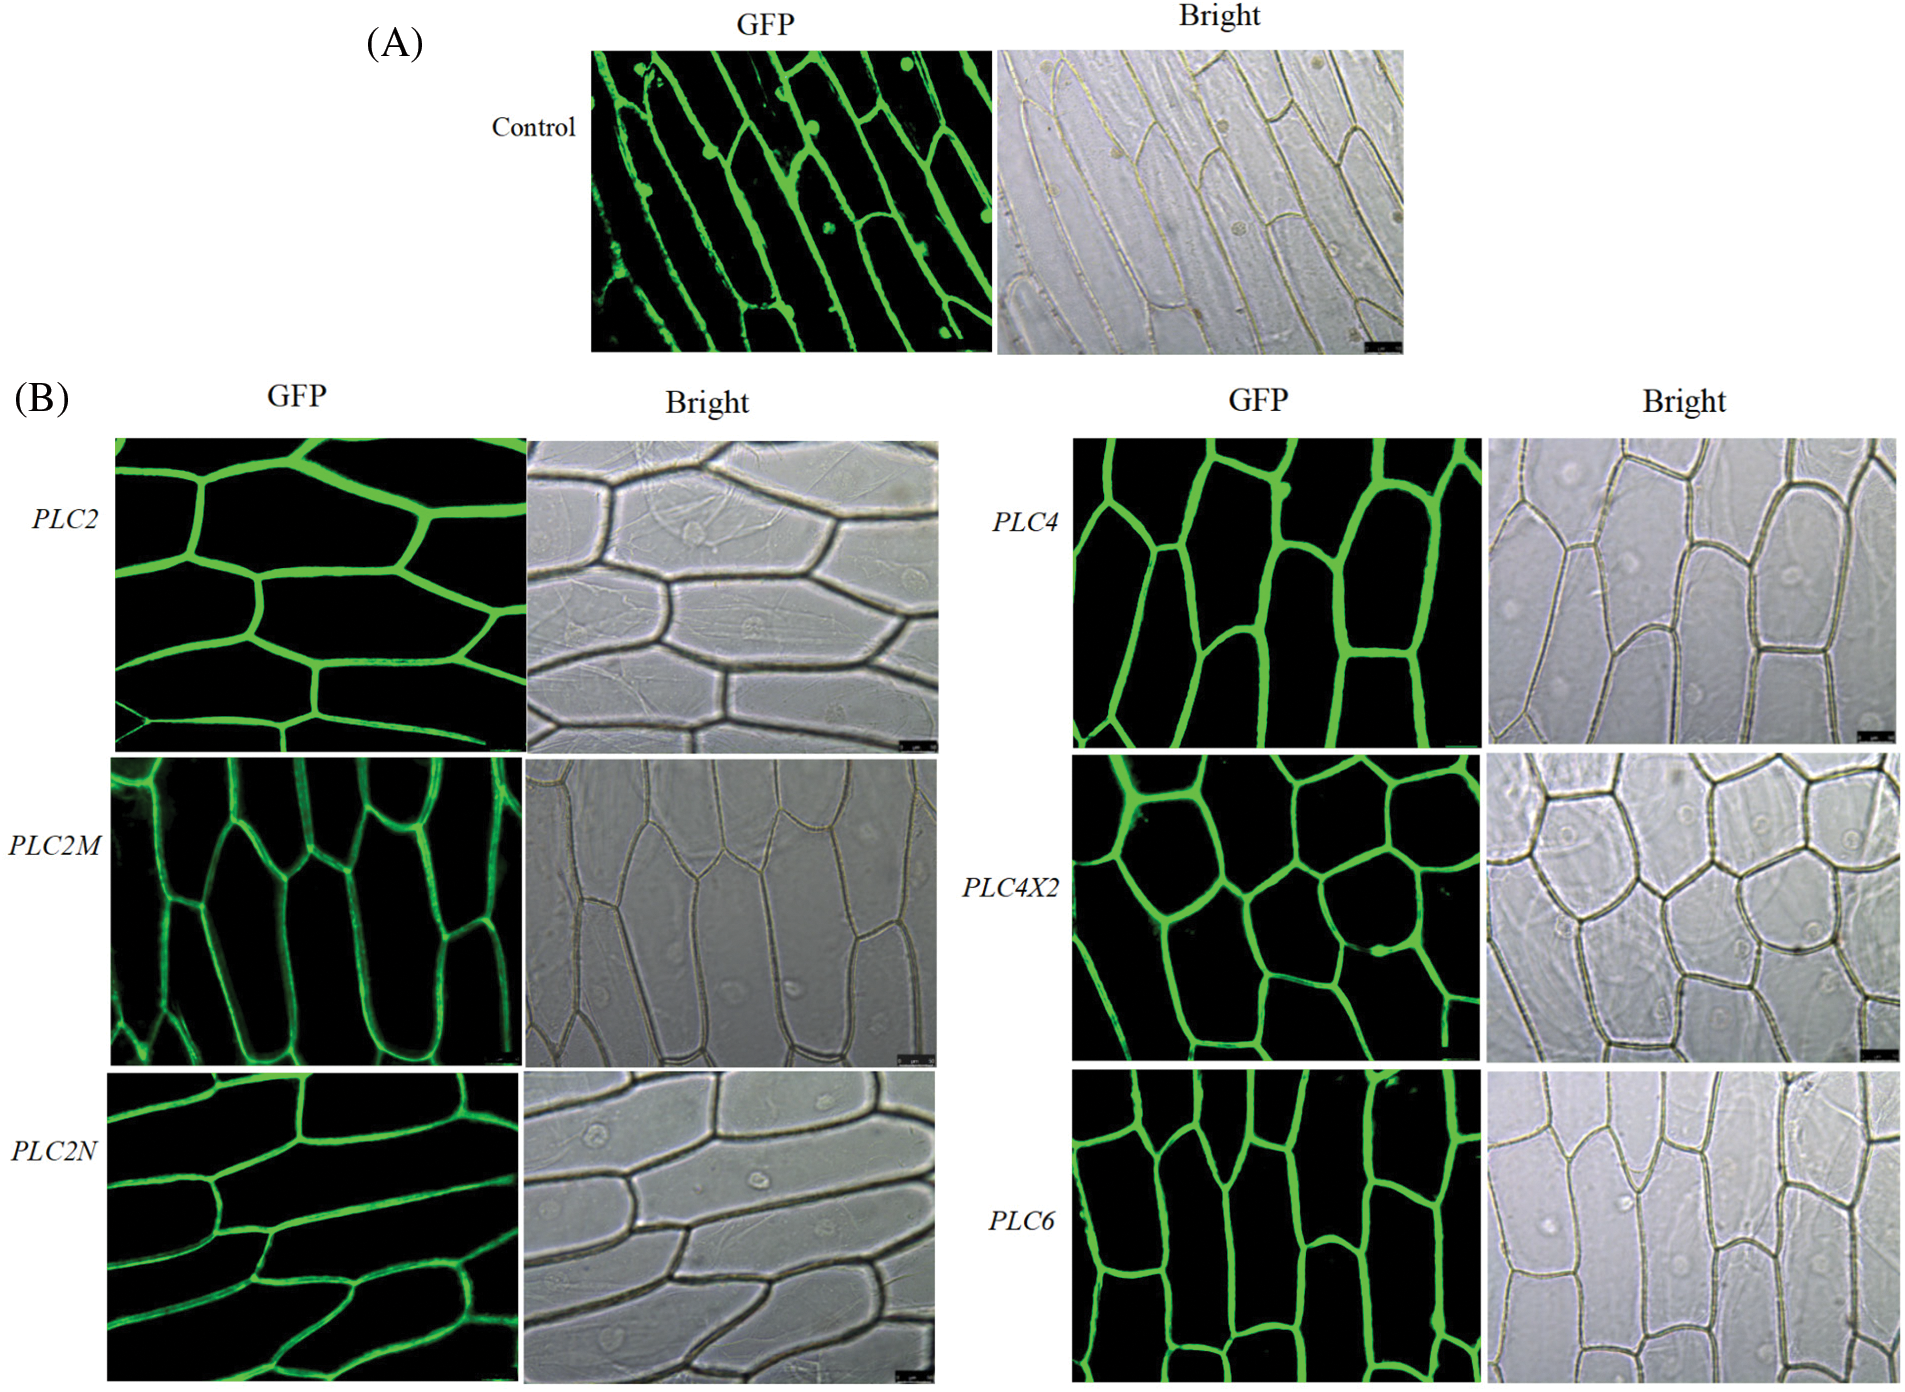
Figure 4: Subcellular localization of the castor PLC family genes
Note: A: Empty vector control transformation under bright field and fluorescent conditions B: Protein transformation of castor PLC family genes under bright field and fluorescent conditions.
3.4 Results of Genetic Transformation of A. thaliana Plants with Plant Overexpression Vectors
The screen of the T3 generation AtPLCs+ resistant plants is depicted in Fig. 5. The WT plants only grew to the two-leaf stage in MS medium supplemented with 50 mg/mL hygromycin, the root system was short, and the plants showed wilting signs, such as yellowing and transparency. Compared with WT plants, the T3-generation resistant AtPLC2+, AtPLC2M+, AtPLC2N+, AtPLC4+, AtPLC4X2+, and AtPLC6+ plants grew to the four-leaf stage in the MS medium supplemented with hygromycin, and the resistant plants showed a well-developed root system, with no wilting signs, such as yellowing and transparency.
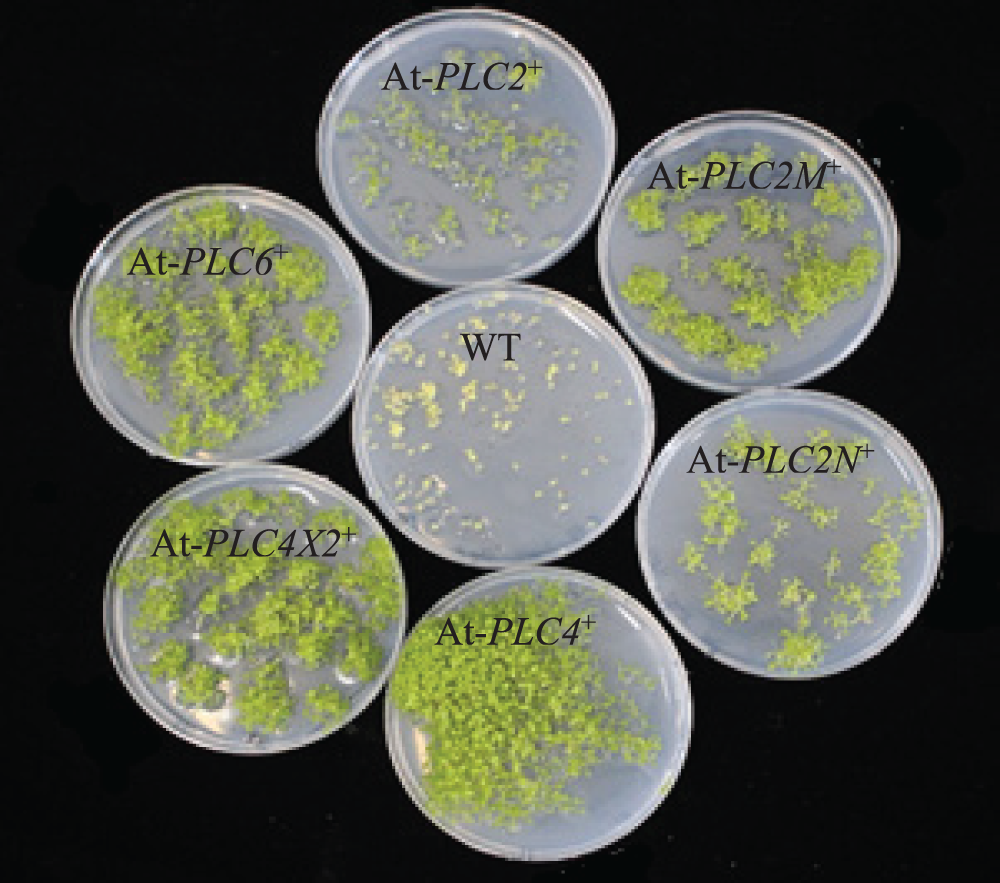
Figure 5: Screening of T3-generation AtPLCs+ resistant plants
Note: Comparison of T3 generation AtPLC2+, AtPLC2M+, AtPLC2N+, AtPLC4+, AtPLC4X2+, and AtPLC6+ plants with WT plants.
3.5 Molecular-Level Examination of the Castor PLC Family Genes in AtPLCs+ Resistant Plants
The genomic DNAs of the T3-generation AtPLCs+ resistant plants with the six genes were used as templates for PCR detection. The results of agarose gel electrophoresis are shown in Fig. 6. The size of the target bands was still approximately 1700 bp, which are consistent with the size of the castor PLC2, PLC2M, PLC2N, PLC4, PLC4X2, and PLC6 genes, indicating that the successful heterologous overexpression of the castor PLC genes in A. thaliana plants was preliminarily verified.
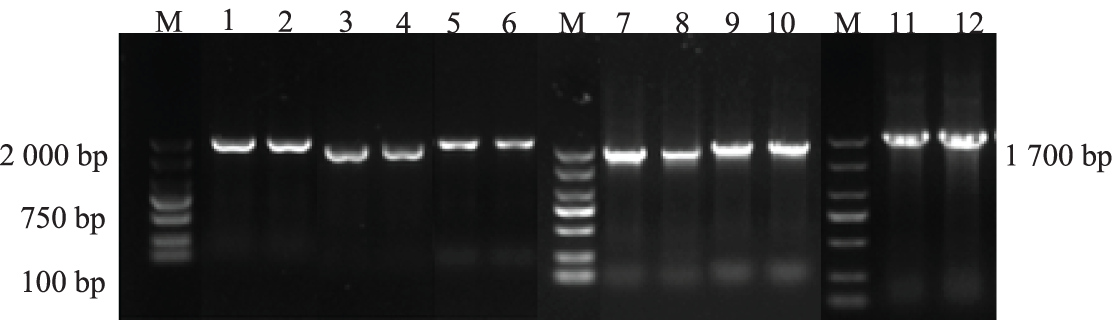
Figure 6: The PCR results in T3-generation AtPLCs+ resistant plants
Note: M: DL 2000 Marker; 1, 2: AtPLC2+ PCR products; 3, 4: AtPLC2M+ PCR products; 5, 6: AtPLC2N+ PCR products; 7, 8: AtPLC4 + PCR products; 9, 10: AtPLC4X2+ PCR products; 11, 12: AtPLC6+ PCR products.
Fig. 7 shows that the castor PLC family genes were not expressed in the WT plants but were all upregulated in the inflorescence samples of AtPLCs+ plants (AtPLC2+, AtPLC2M+, AtPLC2N+, AtPLC4+, AtPLC4X2+, and AtPLC6+), indicating that the transgene was successfully integrated.
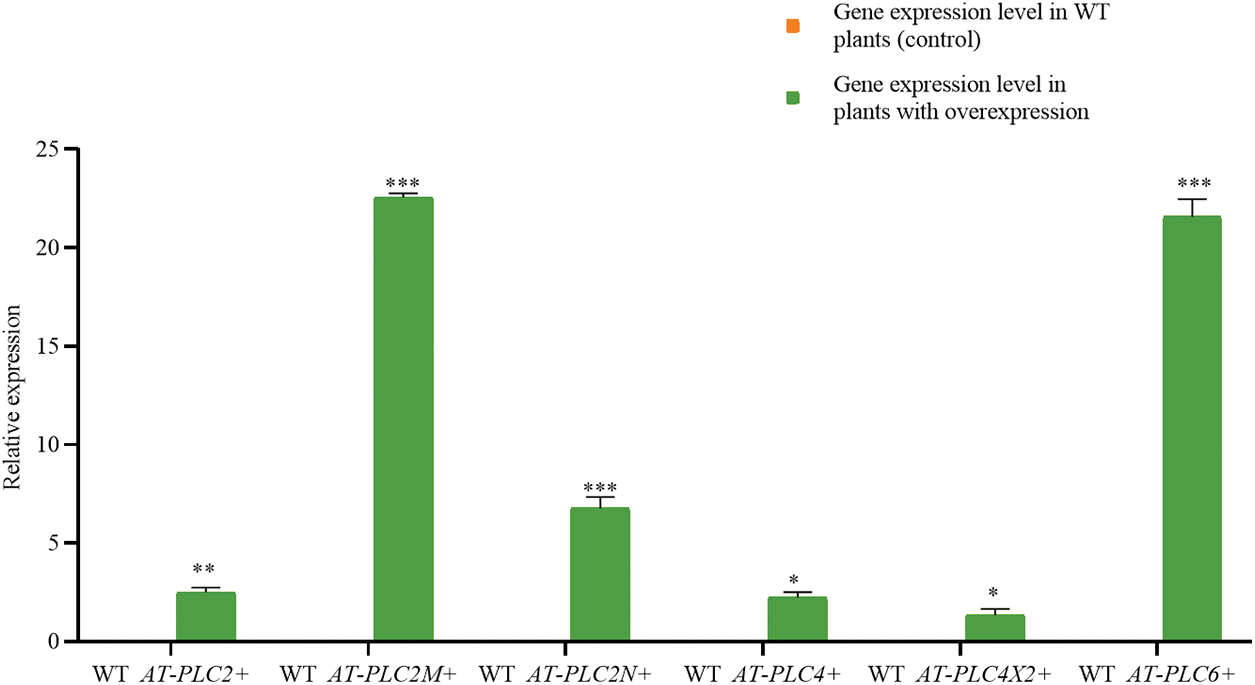
Figure 7: RT-qPCR RESULTS of AtPLCs+ resistant plants
Note: In the T3-generation A. thaliana resistant plants with heterologous overexpression (AtPLC2+, AtPLC2M+, AtPLC2N+, AtPLC4+, AtPLC4X2+, and AtPLC6+), the RT-qPCR detection of castor PLC family genes was performed. *significant difference, p ≤ 0.01; **significant difference, p ≤ 0.05; ***difference is extremely significant, p ≤ 0.01.
3.6 Biological-Level Examination of AtPLCs+ Resistant Plants
3.6.1 Phenotypes of AtPLCs+ Resistant Plants before Transplanting
Compared with the WT plants in Fig. 8, the AtPLC2+ and AtPLC4+ plants, i.e., the two A. thaliana resistant plants with heterologous overexpression, had significantly greater root length, while AtPLC2N+ and AtPLC6+ plants had significantly shorter root length, and AtPLC2M+ and AtPLC4X2+ plants had no difference.
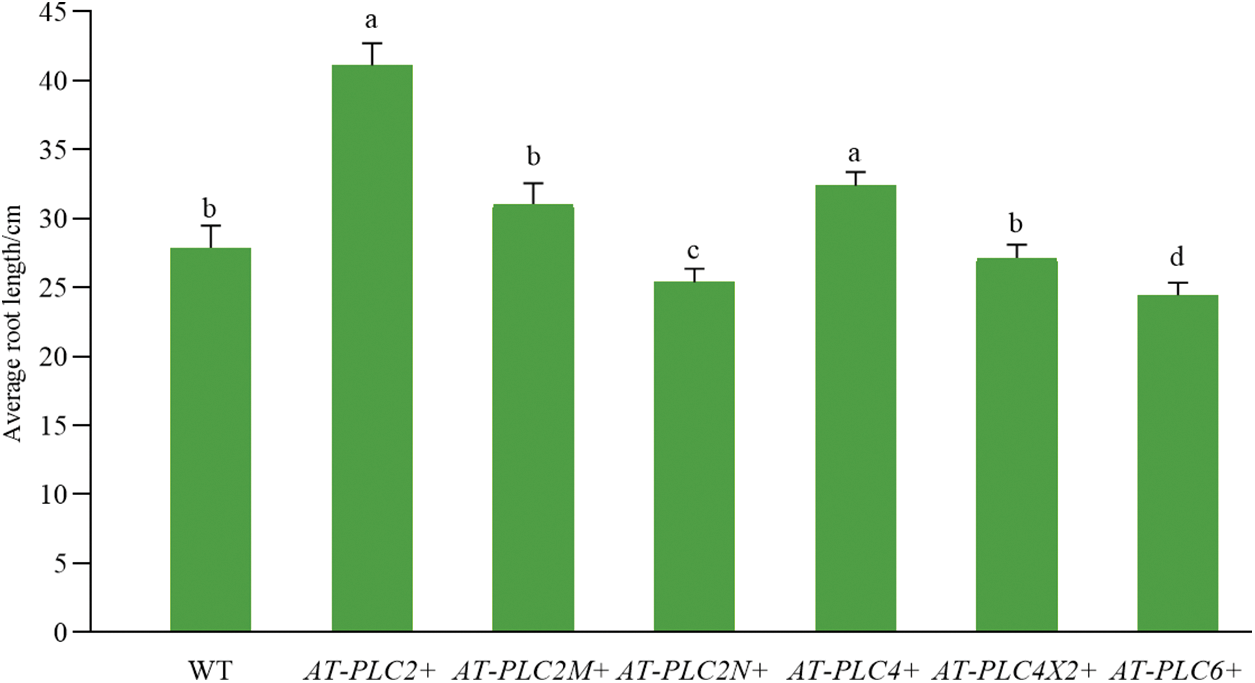
Figure 8: Root length statistics of AtPLCs+ resistant plants before transplanting
Note: For WT plants and six T3-generation AtPLCs+ resistant plants in the four-leaf stage (AtPLC2+, AtPLC2M+, AtPLC2N+, AtPLC4+, AtPLC4X2+, AtPLC6+), the root length was statistically analyzed.
3.6.2 Analysis of the Phenotypic Results of AtPLCs+ Resistant Plants at 15 d
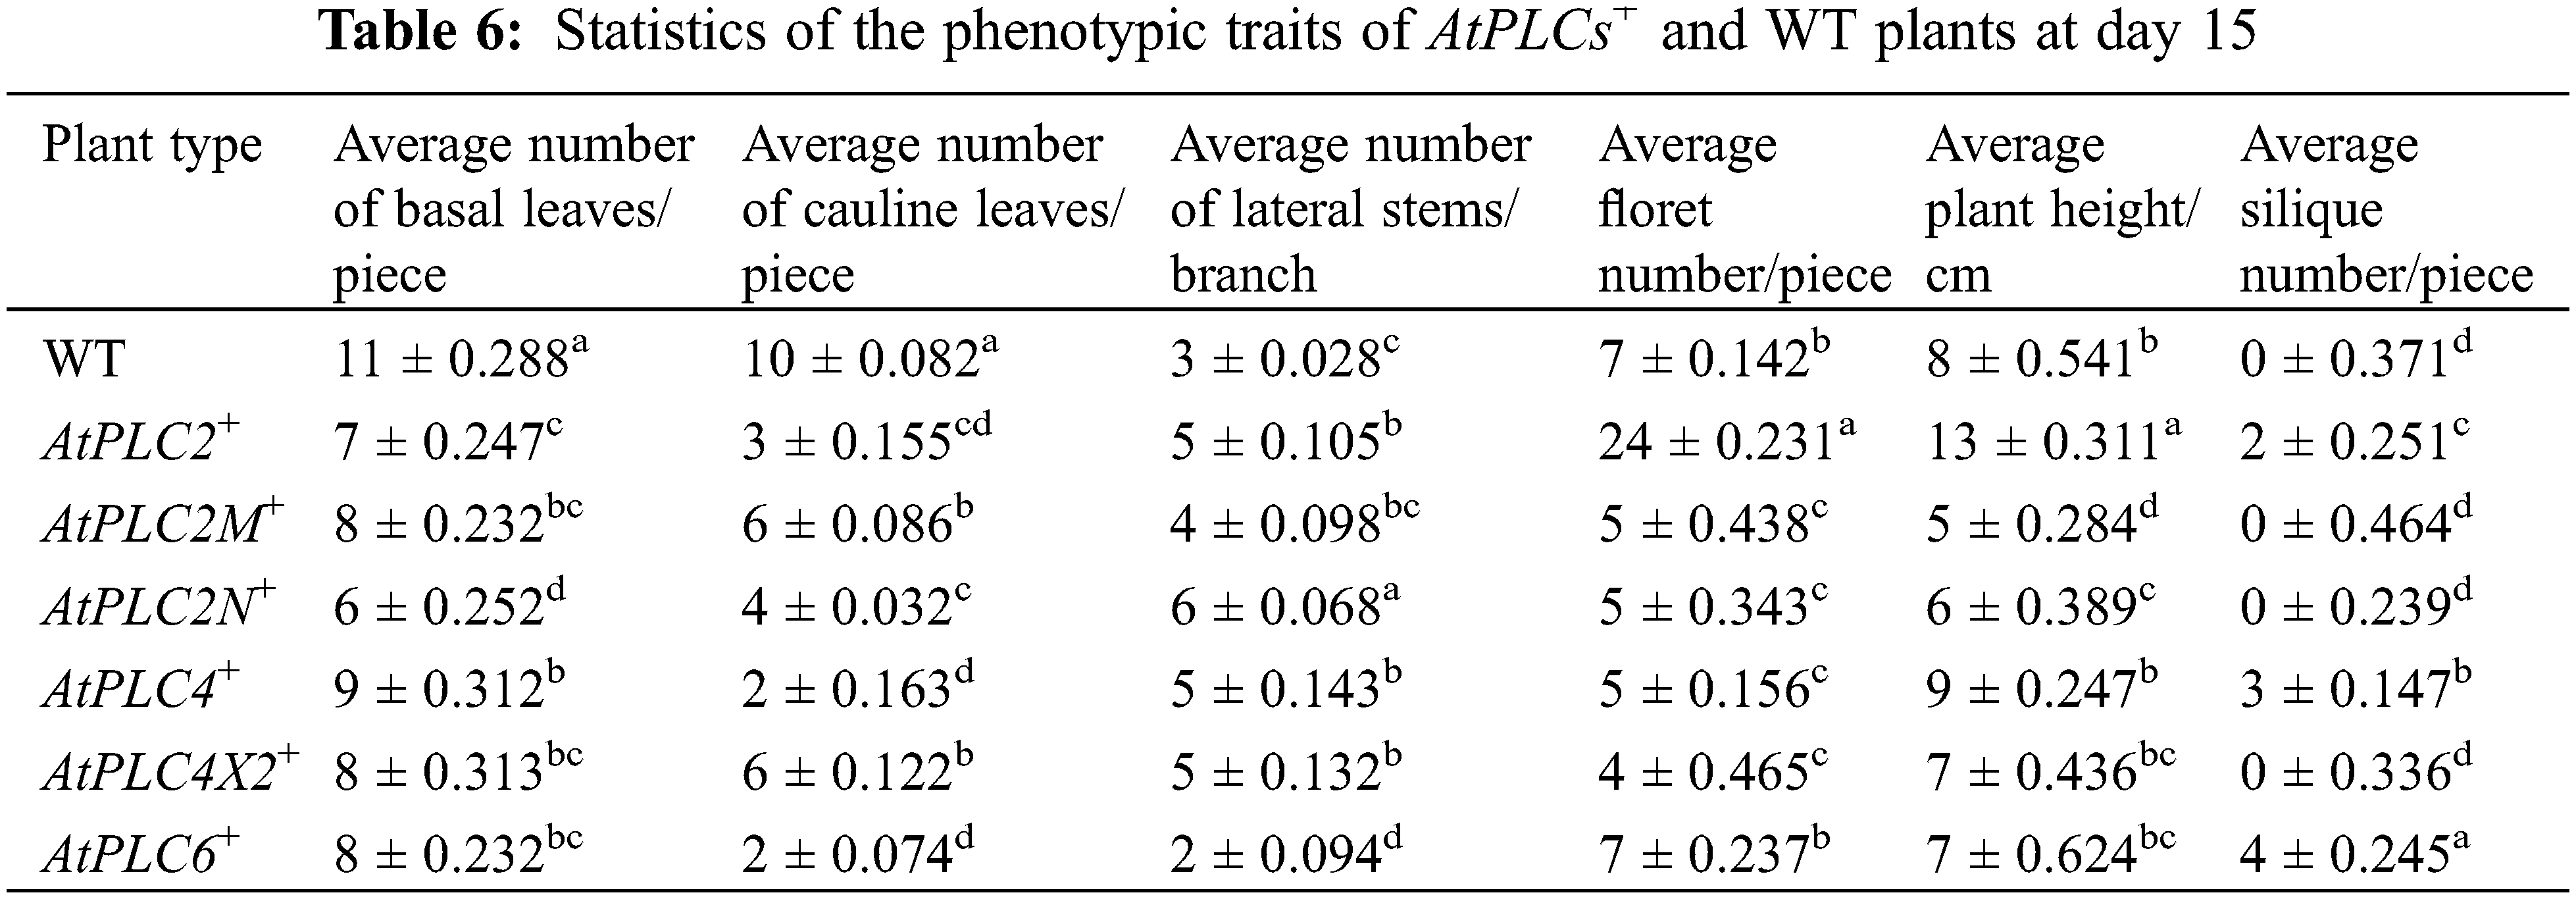
After the AtPLCs+ resistant plants had been cultured under the same conditions for approximately 8 d, the main stem was removed to promote the growth of the lateral stems. The phenotypic results of these plants and WT at 15 d are shown in Fig. 9, and the plant traits are listed in Table 6.
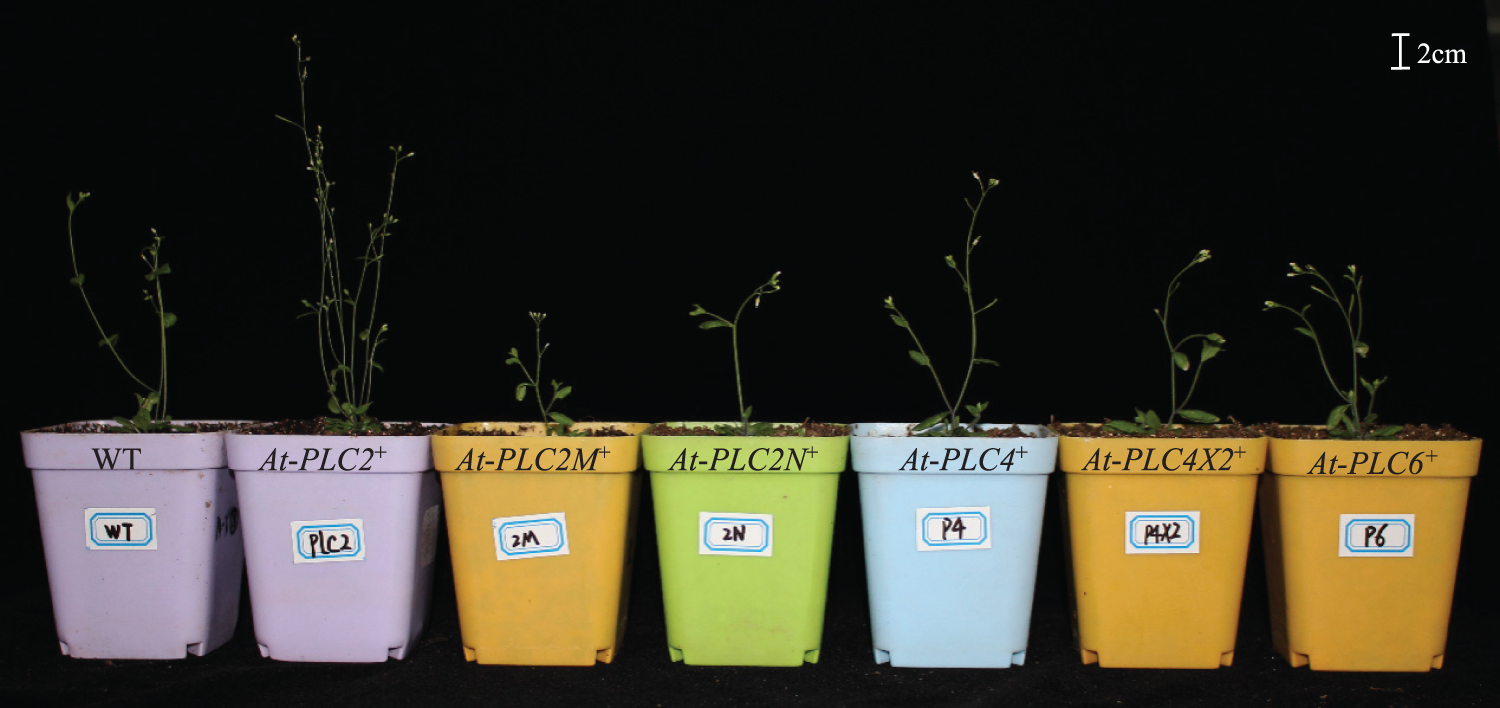
Figure 9: AtPLCs+ resistant plants at day 15 after transplanting scale
The average plant height of WT plants was approximately 8 cm. The average plant height of AtPLC2+ plants was significantly higher than that of WT plants. The plant height of AtPLC4+ plants (approximately 9 cm) was slightly higher than that of WT plants. The plant height of AtPLC4X2+ and AtPLC6+ plants was basically the same as that of WT plants. The plant height of AtPLC2M+ and AtPLC2N+ plants was significantly lower than that of WT plants.
WT plants had a high average number of basal leaves. AtPLC4+ plants had slightly fewer basal leaves on than WT plants on average. AtPLC2+, AtPLC2M+, AtPLC2N+, AtPLC4X2+, and AtPLC6+ plants had significantly fewer basal leaves than WT plants, and among them, AtPLC2N+ had the lowest average (approximately six leaves).
The average number of cauline leaves in AtPLC2+, AtPLC2M+, AtPLC2N+, AtPLC4+, AtPLC4X2+, and AtPLC6+ plants was significantly lower than that of WT plants, while AtPLC2M+ and AtPLC4X2+ had about the same number as WT. AtPLC4+ had the fewest on average (approximately two leaves).
The average number of lateral stems in AtPLC2+, AtPLC2M+, AtPLC2N+, AtPLC4+, AtPLC4X2+, and AtPLC6+ plants was higher than that of WT plants, AtPLC2+ plants having the most. AtPLC2N+ and AtPLC4X2+ plants had about the same number as WT, while AtPLC2M+, AtPLC4+, and AtPLC6+ plants had fewer.
There was no significant difference in the average floret number between WT and AtPLC6+ plants; the average floret number of AtPLC2+ plants was higher than that of WT plants; and the average floret number of AtPLC2M+, AtPLC2N+, AtPLC4+, and AtPLC4X2+ plants was lower than that of WT plants.
The WT, AtPLC2M+, AtPLC2N+, and AtPLC4X2+ plants did not grow siliques. Although the AtPLC2+, AtPLC4+, and AtPLC6+ plants all grew siliques, they only grew 2–4.
Statistical analysis showed that the overexpression of the PLC2, PLC2M, PLC2N, PLC4, PLC4X2, and PLC6 genes significantly promoted the growth of lateral stems and the development of flowers and siliques in A. thaliana.
3.6.3 Analysis of the Phenotypic Results of AtPLCs+ Resistant Plants at Day 35
AtPLCs+ resistant plants are compared with WT plants at 35 d in Table 7. The phenotypic results of these plants and WT at 35 d are shown in Fig. 10.

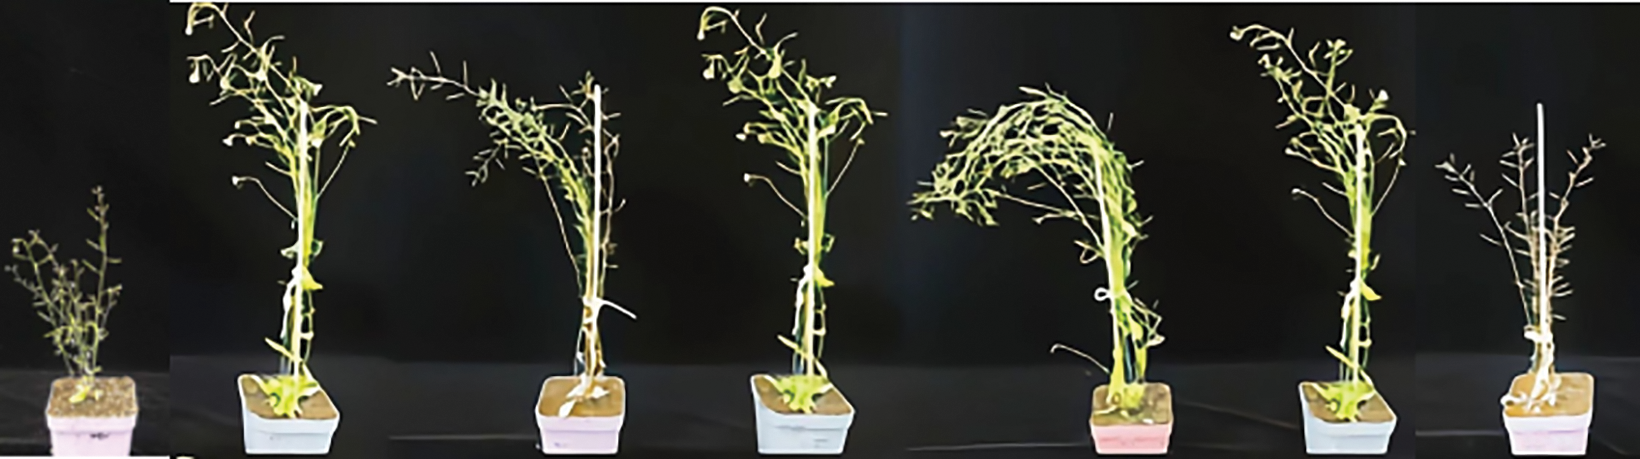
Figure 10: AtPLCs+ resistant plants at day 35 after transplanting
The plant height of WT, AtPLC2N+, and AtPLC4X2+ plants was similar, while the overall height of AtPLC2+, AtPLC2M+, AtPLC4+, and AtPLC6+ plants was greater. WT plants still had the highest average number of basal leaves, but all AtPLCs+ plants had more basal leaves than they had at day 15. The average number of basal leaves of AtPLC4+ plants increased the most. The average number of lateral stems in AtPLCs+ plants was higher than that of WT plants, and the average number of lateral stems in AtPLC2+ plants was the highest. With the increase in the number of lateral stems, the average number of cauline leaves in AtPLCs+ also increased but was still less than that of WT plants. Compared with 15 d, all AtPLCs+ groups had more florets and siliques at 35 d. In addition to the average floret number of AtPLCs+ plants was slightly higher than that of WT plants, the average floret number of AtPLC2N+, AtPLC4+, and AtPLC6+ plants was less than that in WT plants. The average silique number of AtPLC2+, AtPLC2M+, AtPLC2N+, AtPLC4+, AtPLC4X2+, and AtPLC6+ plants was higher than that of WT plants, and the AtPLCs+ plants matured significantly earlier than WT plants.
Statistical analysis showed that the overexpression of the PLC2, PLC2M, PLC2N, PLC4, PLC4X2, and PLC6 genes significantly promoted the maturation of A. thaliana and the growth of lateral stems but significantly inhibited the development of basal leaves and cauline leaves of A. thaliana.
3.7 Correlation Analysis of Castor PLC Family Genes
The homologous relationship between castor PLC family genes and Arabidopsis PLC family genes is shown in Fig. 11, and the results of fluorescence quantitative analysis are as shown in Fig. 12.
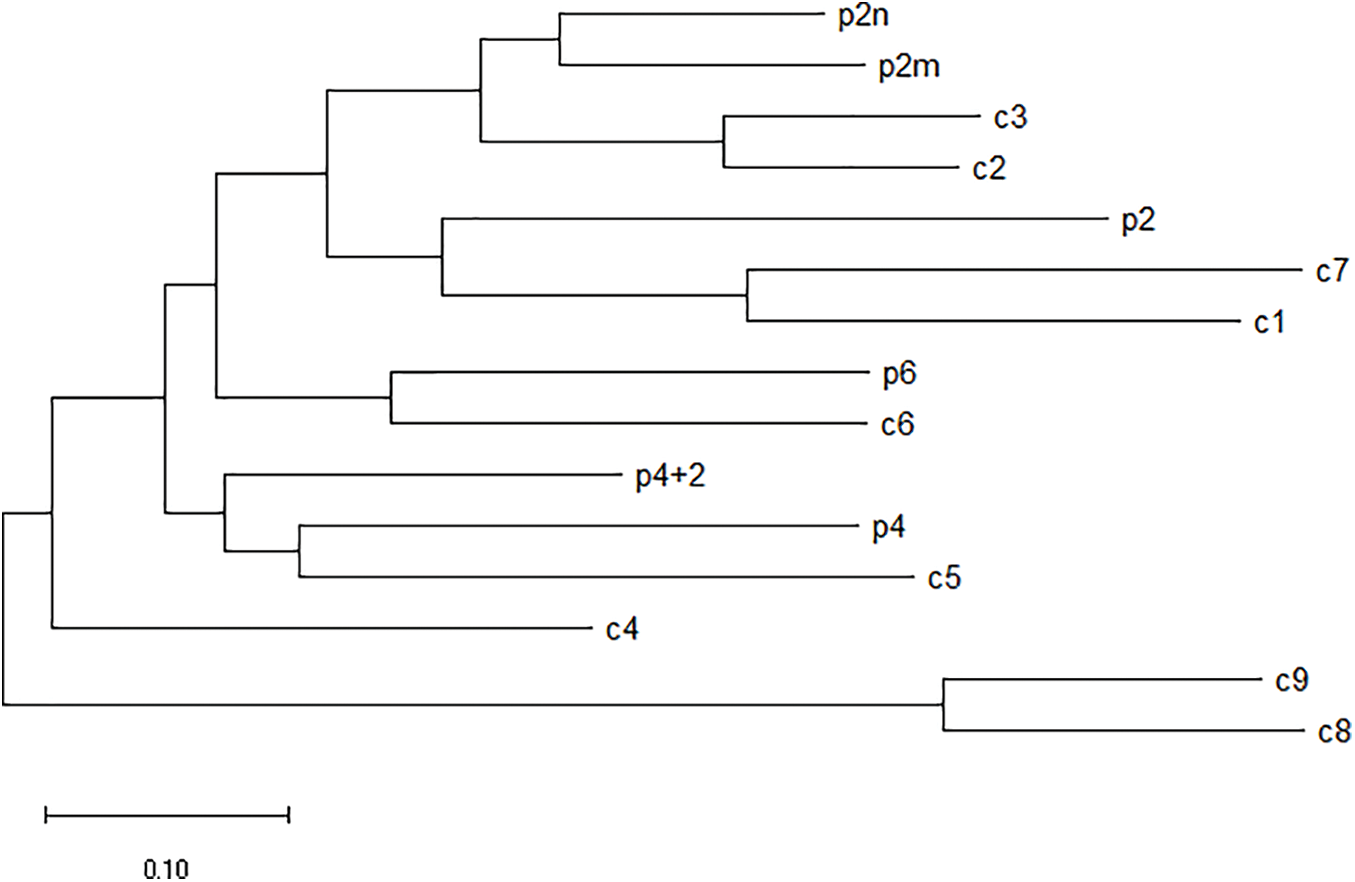
Figure 11: Homologous relationship between castor PLC family genes and Arabidopsis thaliana PLC family genes
Note: p2: Castor PLC2 (XP_025014303.1); p2m: Castor PLC2M (XP_015579164.1); p2n: Castor PLC2N (XP_002533650.1); p4: Castor PLC4 (XP_002525652.2); p4+2: Castor PLC4X2 (XP_025014307.1); p6: Castor PLC6 (XP_002533649.1); c1: Arabidopsis PLC1 (NP_568881.1); c2: Arabidopsis PLC2 (NP_187464.1); c3: Arabidopsis PLC3 (NP_191153.1). c4: Arabidopsis PLC4 (NP_001318832.1); c5: Arabidopsis PLC5 (NP_001332555.1); c6: Arabidopsis PLC6 (NP_850327.2); c7: Arabidopsis PLC7 (NP_195565.2); c8: Arabidopsis PLC8 (NP_190313.1); c9: Arabidopsis PLC9 (NP_190306.2).
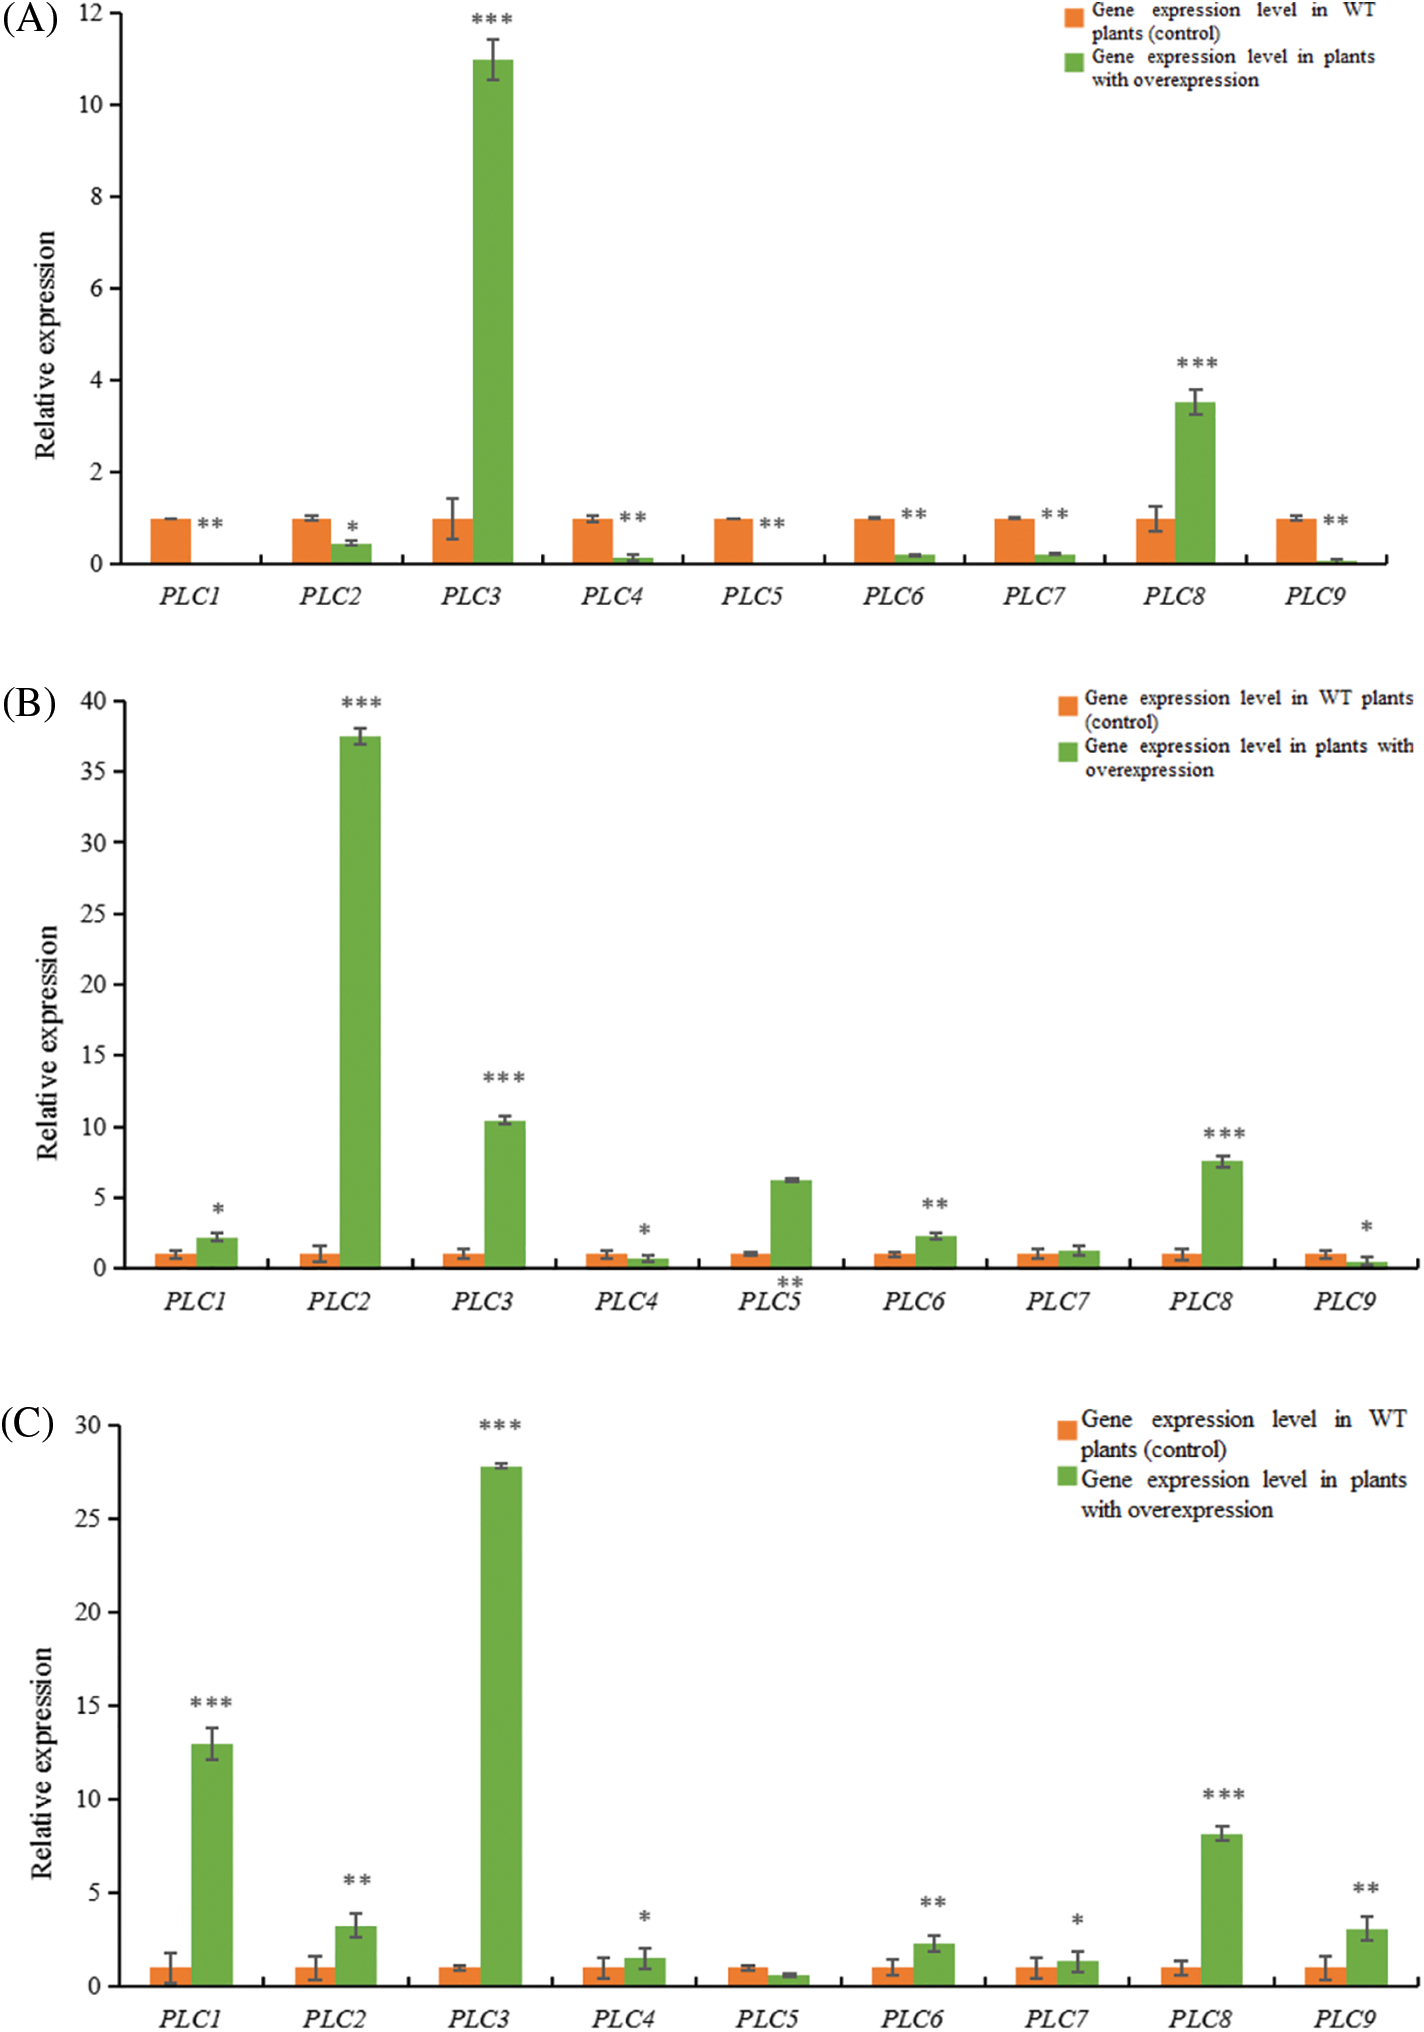
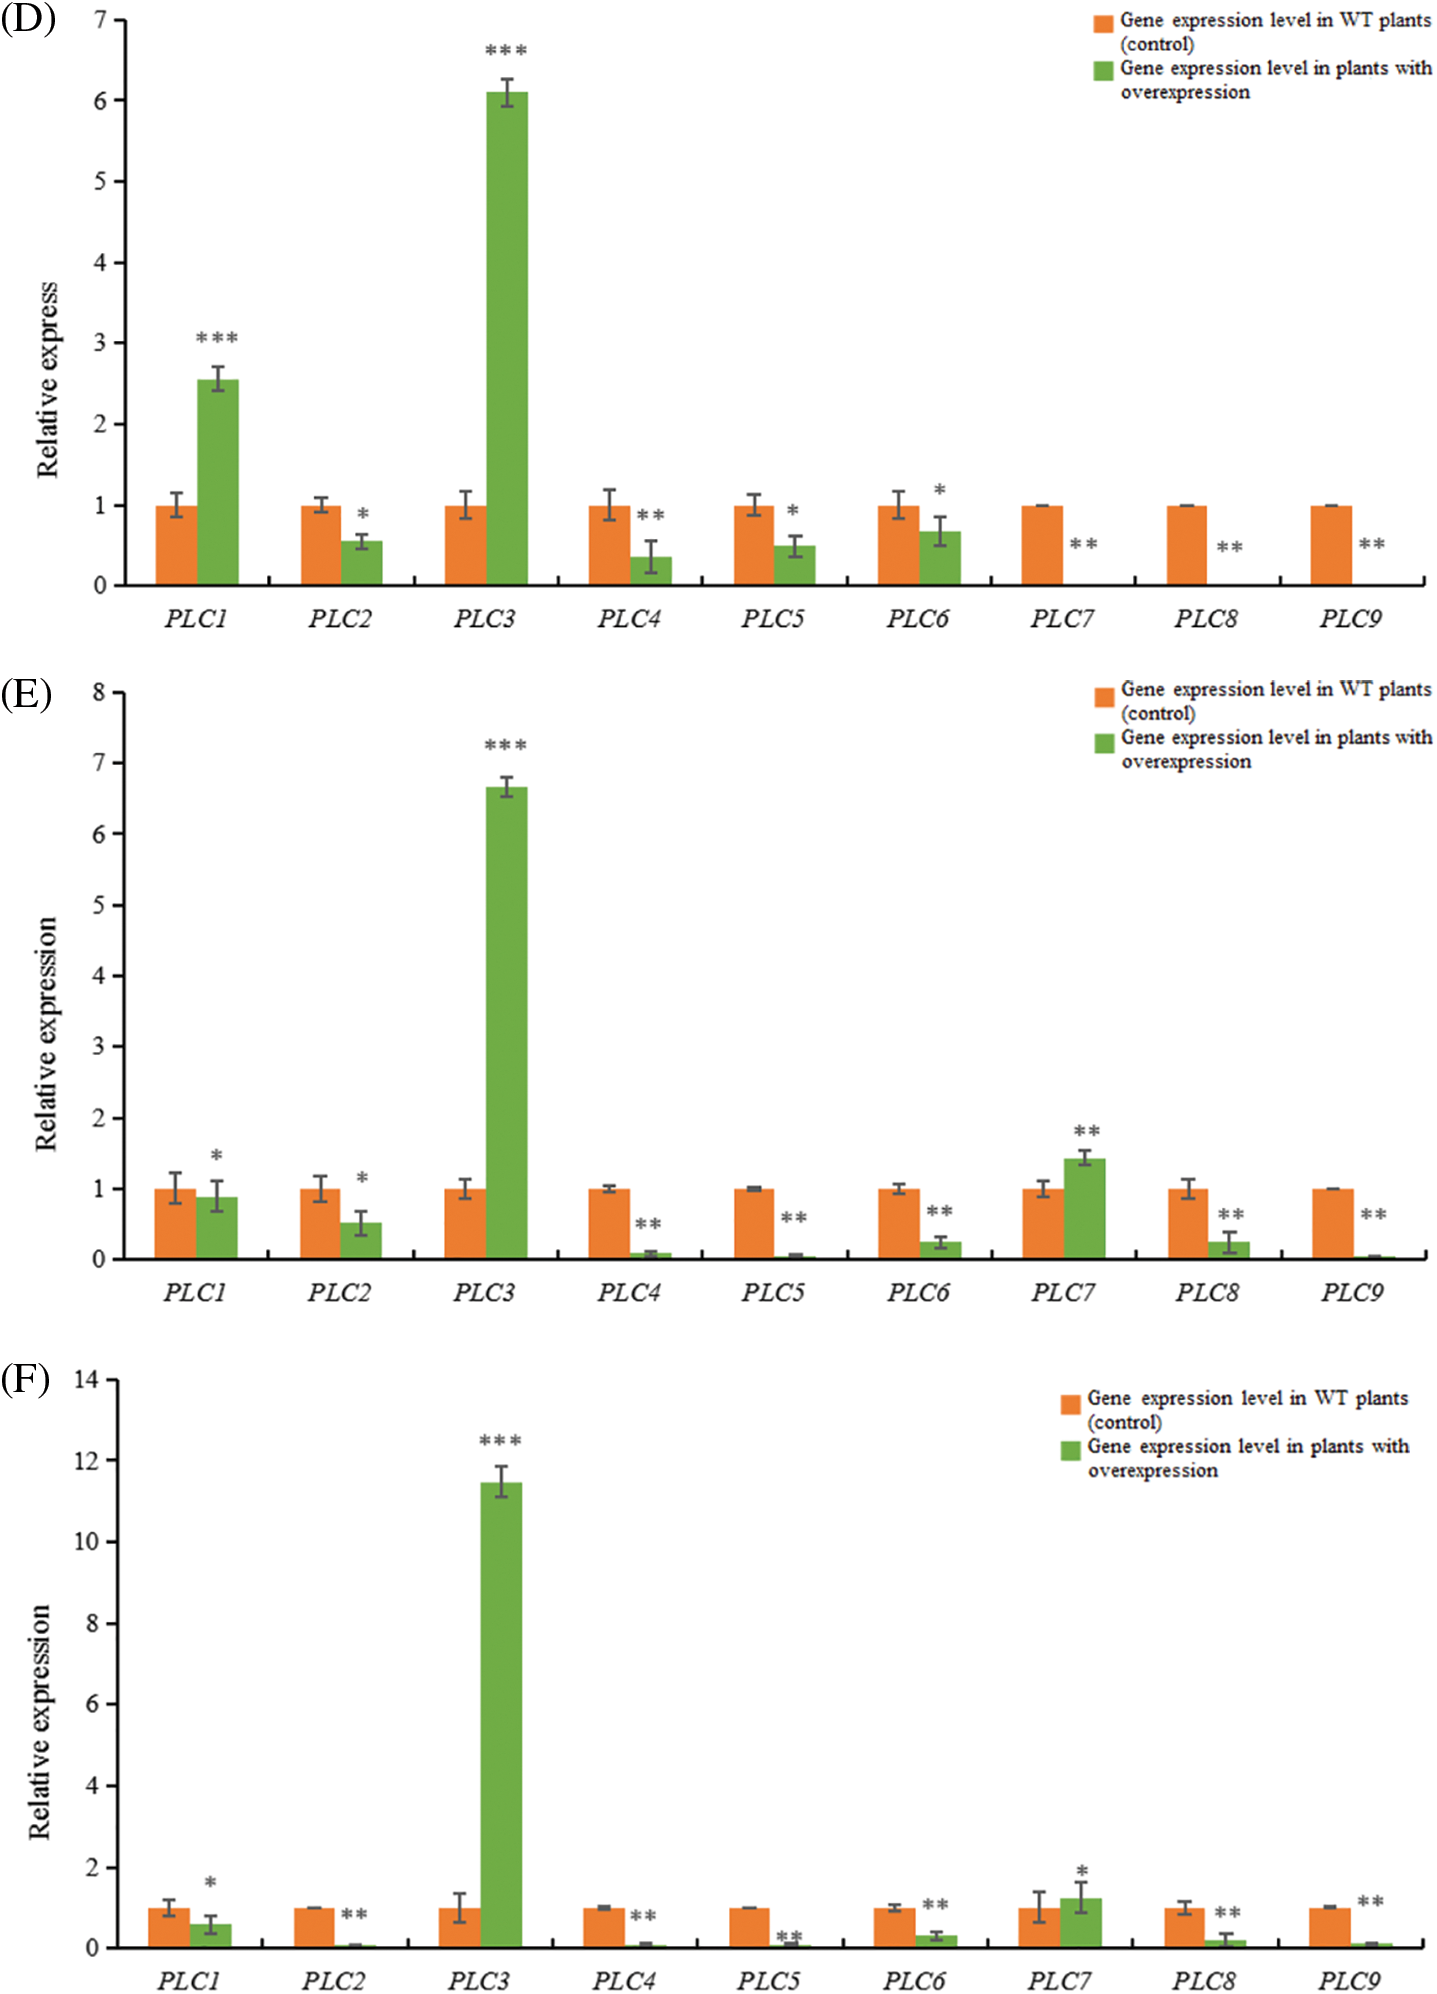
Figure 12: RT-qPCR results of A. thaliana plants with heterologous overexpression of the castor PLC family genes
Note: (A) AtPLC2+ plants with heterologous overexpression; (B) AtPLC2M+ plants with heterologous overexpression; (C) AtPLC2N+ plants with heterologous overexpression; (D) AtPLC4+ plants with heterologous overexpression; (E) AtPLC4X2+ plants with heterologous overexpression; (F) AtPLC6+ plants with heterologous overexpression; PLC1, PLC2, PLC3, PLC4, PLC5, PLC6, PLC7, PLC8, and PLC9 are thaliana PLC family genes; *significant difference, p ≤ 0.01; **significant difference, p ≤ 0.05; ***difference is extremely significant, p ≤ 0.01.
When the PLC2 gene of castor bean was heterologous overexpressed in Arabidopsis thaliana (Fig. 12A), the expression levels of PLC3 and PLC8 genes in Arabidopsis thaliana were significantly up-regulated compared with the wild type. The gene expressions of PLC1, PLC2, PLC4, PLC5, PLC6, PLC7 and PLC9 in Arabidopsis thaliana were significantly down-regulated.
When the PLC2M gene of castor bean was overexpressed heterogeneously in Arabidopsis thaliana (Fig. 12B), the expressions of PLC4 and PLC9 genes in Arabidopsis thaliana were down-regulated compared with the wild type, but the expressions of PLC1, PLC2, PLC3, PLC5, PLC6 and PLC8 genes in Arabidopsis thaliana were up-regulated.There was no significant change in PLC7 gene expression in Arabidopsis thaliana.
When castor PLC2N gene was overexpressed heterogeneously in Arabidopsis thaliana (Fig. 12C), the expression levels of PLC1, PLC2, PLC3, PLC4, PLC6, PLC7, PLC8, PLC9 genes in Arabidopsis thaliana were significantly up-regulated compared with the wild type, while the expression levels of PLC5 gene in Arabidopsis thaliana were not significantly changed.
When the PLC4 gene of castor was overexpressed heterogeneously in Arabidopsis thaliana (Fig. 12D), the expressions of PLC1, PLC2, PLC3 genes in Arabidopsis thaliana were significantly up-regulated compared with the wild type, while the expressions of PLC4, PLC5, PLC6, PLC7, PLC8, PLC9 genes were down-regulated.
When castor PLC4X2 gene was overexpressed heterogeneously in Arabidopsis thaliana (Fig. 12E), the expressions of PLC3 and PLC7 genes in Arabidopsis thaliana were significantly up-regulated compared with the wild type, while the expressions of PLC1, PLC2, PLC4, PLC5, PLC6, PLC8 and PLC9 genes in Arabidopsis thaliana were down-regulated.
When castor PLC6 gene was heterologous overexpressed in Arabidopsis thaliana (Fig. 12F), the expressions of PLC3 and PLC7 genes in Arabidopsis thaliana were significantly up-regulated compared with the wild type, while the expressions of PLC1, PLC2, PLC4, PLC5, PLC6, PLC8 and PLC9 genes in Arabidopsis thaliana were down-regulated.
In summary, according to homology analysis, it is speculated that PLC2, PLC2M, PLC2N, PLC4, PLC4X2 and PLC6 genes of castor bean have the same regulatory function.
PLCs play key roles in the phosphatidylinositol signaling pathway. In recent years, an increasing number of plant PLC functions have been reported. Several PLC members are involved in the signaling events triggered by different abiotic stresses in many plants. The overexpression of PLCs in maize and tobacco brings increased drought resistance and salt tolerance to transgenic plants [28,29]. PLCs also play a role under heat stress in different plant species [30]. The PI-PLC protein can accumulate in pea plants under heat stress, and the activity of PI-PLC protein in the membrane increases within 40 min of heat treatment [31]. Similarly, the A. thaliana PI-PLC and PLC9 proteins are involved in the heat stress response. Genetic analysis has shown that the AtPLC9 mutant exhibits a hyperthermia phenotype after heat stress [32]. A similar and important role of AtPLC3 has been confirmed in the thermotolerance of A. thaliana, i.e., a heat-induced reduction in Ca2+ level in the AtPLC3 mutant has been detected, which could suggest a possible fundamental mechanism [33]. PLC is a multifunctional enzyme in plants and is also involved in different plant growth and development processes [34]. Pollen tube growth is an event of asymmetric cell division, and some key processes in cells include Ca2+ signal transduction, vesicle transport, and cytoskeletal rearrangement [35]. PI-PLC localizes to the plasma membrane of pollen tube, and during the process of pollen tube elongation, it is preferentially localized at the edge of the tip, and its substrate PIP2 always accumulates at the top of the pollen tube [36,37]. The catalytically inactive form of petunia PLC1 is expressed in the pollen tube and competes with its natural form for membrane localization, which results in changes in the Ca2+ gradient and cytoskeletal reorganization and causes the delocalized growth and enlarged pollen tube apex [36], thus showing that PLCs can regulate the pollen tube elongation. In addition, growing evidence indicates that PLCs are involved in the response to biotic and abiotic stresses. The promoter of the A. thaliana PLC genes [38] has cis-regulatory elements that can respond to external stress. The expression level of PI-PLC in rice and A. thaliana is increased under salt stress [39,40].
There have been many studies on plant PLCs, but they mainly focus on the relevant functions of PLC genes and their products, and their mechanisms of action still need in-depth study. Plant PLC proteins lack the pH domain, which plays an important role in the specific binding of enzymes to the substrate on the membrane [41,42]. Therefore, whether the specific binding of plant PLCs to membrane phospholipids is realized by other domains and the specific mechanisms need to be discovered.
This study determined the expression levels of six castor PLC family genes at different developmental stages in different types of castor inflorescences. The results showed that the PLC2, PLC4, and PLC6 genes had relatively high expression in the female inflorescence; the PLC2M, PLC2N, and PLC4X2 genes had relatively high expression in the isofemale inflorescence, while PLC4 a relatively low expression level in the isofemale inflorescence; and the PLC2, PLC2M, PLC2N, PLC4X2, and PLC6 genes had relatively low expression levels in the bisexual inflorescence. The subcellular localization results showed that the proteins of the six genes were all expressed on the cell membrane. Heterologous overexpression of the six genes in A. thaliana plants significantly promoted the maturation of A. thaliana, the growth of lateral stems, and the development of flowers and siliques. According to homology analysis, PLC2, PLC2M, PLC2N, PLC4, PLC4X2, and PLC6 genes were speculated to have the same regulatory function.
Acknowledgement: The authors thank the reviewers for their thoughtful comments to improve our manuscript, and AJE Academic Services (www.aje.cn) for English language editing and review services.
Funding Statement: This work was supported by the following agencies: National Natural Science Foundation of China (31860071); New Agricultural Research and Reform Practice Project of the Ministry of Education (2020114); Grassland Talent Innovation Team of Inner Mongolia Autonomous Region-Castor Molecular Breeding Research Innovative Talent Team (2022); Inner Mongolia University for Nationalities 2022 Basic Research Business Funds for Universities Directly under the Autonomous Region (237); the Natural Science Foundation of Inner Mongolia Autonomous Region (2021 MS03008); In 2023, the Department of Science and Technology of Inner Mongolia Autonomous Region Approved the Construction Project of Inner Mongolia Autonomous Region Key Laboratory of Castor Breeding and Comprehensive Utilization; Inner Mongolia Autonomous Region Castor Industry Collaborative Innovation Center Open Fund Project (MDK2021011, MDK2022014); the Natural Science Foundation of Inner Mongolia Autonomous Region (2021BS03036); Inner Mongolia University for Nationalities Doctoral Research Start-Up Fund (BS672); Castor Industry Technology Innovation Inner Mongolia Autonomous Region Engineering Research Center Open Project (MDK2021004); Inner Mongolia Autonomous Region Castor Industry Collaborative Innovation Center Open Project (MDK2022016).
Author Contributions: Fenglan Huang designed this research and guided data analysis and writing. Yanpeng Wen, Rui Luo, Lili Li, and Xiaotian Liang performed the experiments. Rui Luo and Lili Li guided the experimental process. Yanpeng Wen, Xuemei Hu, Ruxin Li, and Zhiyan Wang completed the data analysis and the writing of the first draft of the paper. All the authors read and agreed to the final text.
Availability of Data and Materials: The data that support the findings of this study are available from the corresponding author upon reasonable request.
Ethics Approval: Not applicable.
Conflicts of Interest: The authors declare that they have no conflicts of interest to report regarding the present study.
References
1. Hong, Y., Zhao, J., Guo, L., Kim, S. C., Deng, X. et al. (2016). Plant phospholipases D and C and their diverse functions in stress responses. Progress in Lipid Research, 62, 55–74. [Google Scholar] [PubMed]
2. Wang, X. (2001). Plant phospholipases. Annual Review of Plant Physiology and Plant Molecular Biology, 52, 211–231. [Google Scholar] [PubMed]
3. Kadamur, G., Ross, E. M. (2013). Mammalian phospholipase C. Annual Review of Physiology, 75, 127–154. [Google Scholar] [PubMed]
4. Berridge, M. J. (1993). Inositol trisphosphate and calcium signalling. Nature, 361, 315–325. [Google Scholar] [PubMed]
5. Li, L. (2015). Signal transduction by phosphoinositides and phospholipase C in plant cells. Journal of Plant Physiology, 51, 1590–1596. [Google Scholar]
6. Munnik, T., Testerink, C. (2009). Plant phospholipid signaling: “in a nutshell”. Journal of Lipid Research, 50, 260–265. [Google Scholar]
7. Li, H., Yang, N., Liu, R. R. (2020). The role of phosphoinositide-specific phospholipase C in plant growth and development. Chinese Journal of Cell Biology, 42, 2215–2226. [Google Scholar]
8. Huang, D., Wu, Y. (2017). Research progress on the function of plant phospholipase C. Life Science, 29, 575–581. [Google Scholar]
9. Sun, D. Q., Dong, J. Y., Li, Y. (2017). Research progress of phosphatidylinositol-specific phospholipase C gene. Biotechnology, 27, 92–97. [Google Scholar]
10. Zhao, A. H., Wang, X. G., Dong, J. (2021). Research progress of plant phospholipase C in response to stress. Chinese Journal of Biotechnology, 37, 154–164. [Google Scholar]
11. Zhang, Z. L., Wang, W. J., Ding, B. H. (2016). Identification and bioinformatic analysis of Riciuns communis L. steroleosin. Hubei Agricultural Sciences, 55, 2930–2933. [Google Scholar]
12. de Sousa Natália, L., Cabral Glaucia, B., Aragão Francisco, J. L. (2022). Herbicide tolerance and gene silencing stability over generations in the ricin bio-detoxicated castor bean. Journal of Genetic Engineering and Biotechnology, 20, 16. [Google Scholar]
13. Sánchez-Álvarez, A., Ruíz-López, N., Moreno-Pérez, A. J., Venegas-Calerón, M., Martínez-Force, E. et al. (2022). Meta-bolism and accumulation of hydroxylated fatty acids by castor (Ricinus comunis) seed microsomes. Plant Physiology and Biochemistry, 170, 266–274. [Google Scholar]
14. Huang, F., Peng, M., Chen, X., Li, G., Di, J. et al. (2018). Comparison of DNA methylation in developing seeds of Ricinus communis L. using MSAP analysis. Biotechnology & Biotechnological Equipment, 32, 858–864. [Google Scholar]
15. Chen, X., Peng, M., Huang, F., Luo, R., Zhao, Y. et al. (2016). A quantitative assay for fatty acid composition of castor seed in different developmental stages. Molecular Plant Breeding, 7, 1–8. [Google Scholar]
16. Wei, H. L., Li, X. M., Wang, X. H., Yang, J., Hang, H. (2019). Study on the relation between morphological structure and yield of castor. Hunan Forestry Science and Technology, 46, 65–71. [Google Scholar]
17. Zhao, X. P., Li, G. R., Di, J. J., Hang, F., Chen, Y. et al. (2019). Bioinformatic analysis of the castor LRR-RKsII family and LRR-RKsX family. Journal of Inner Mongolia University for Nationalities (Natural Science Edition), 34, 221–230. [Google Scholar]
18. Han, B., Wu, D., Zhang, Y., Li, D. Z., Xu, W. et al. (2022). Epigenetic regulation of seed-specific gene expression by DNA methylation valleys in castor bean. BMC Biology, 20, 1–18. [Google Scholar]
19. Chen, M., Fan, T., Zhang, L. L., Dai, J. J., Zhao, P. et al. (2018). Research advances in comprehensive utilization of Ricinus communis resources. Journal of Agriculture, 8, 58–63. [Google Scholar]
20. Tripathi, A. C., Gupta, R., Saraf, S. K. (2011). Phytochemical investigation characterisation and anticonvulsant activity of Ricinus communis seeds in mice. Natural Product Research, 25, 1881–1884. [Google Scholar] [PubMed]
21. Ferraz, A. C., Angelucci, M. E., da Costa, M. L., Batista, I. R., De Oliveira, B. H. et al. (1999). Pharmacological evaluation of ricinine, a central nervous system stimulant isolated from Ricinus communis. Pharmacology, Biochemistry and Behavior, 63, 367–375. [Google Scholar] [PubMed]
22. Tan, M., Xue, J., Wang, L., Huang, J., Fu, C. et al. (2015). Transcriptomic analysis for different sex types of Ricinus communis L. during development from apical buds to inflorescences by digital gene expression profiling. Frontiers in Plant Science, 6, 1208. [Google Scholar] [PubMed]
23. Huang, F., Peng, M., Chen, X., Li, G., Di, J. et al. (2018). cDNA-AFLP analysis of transcript derived fragments during seed development in castor bean (Ricinus communis L.). Biotechnology & Biotechnological Equipment, 32, 1119–1125. [Google Scholar]
24. Huang, F., Bao, C., Peng, M., Zhu, G., He, Z. et al. (2015). Chromatographic analysis of fatty acid composition in differently sized seeds of castor accessions. Biotechnology & Biotechnological Equipment, 29, 892–900. [Google Scholar]
25. Huang, F., Zhu, G., Chen, Y., Meng, F., Peng, M. et al. (2016). Seed characteristics and fatty acid composition of castor (Ricinus communis L.) varieties in Northeast China. Phyton-International Journal of Experimental Botany, 84, 26–33. https://doi.org/10.32604/phyton.2015.84.026 [Google Scholar] [CrossRef]
26. Zhu, D., Wang, X., Zhu, Y., Chen, C., Li, Y. et al. (2011). Construction and application of a plant subcellular localization vector box of pCEG. Journal of Northeast Agricultural University, 42, 83–87. [Google Scholar]
27. Ugalde, J. M., Rodriguez-Furlán, C., Rycke, R., Norambuena, L., Friml, J. et al. (2016). Phosphatidylinositol 4-phosphate 5-kinases 1 and 2 are involved in the regulation of vacuole morphology during Arabidopsis thaliana pollen development. Plant Science, 250, 10–19. [Google Scholar] [PubMed]
28. Dowd, P. E., Gilroy, S. (2010). The emerging roles of phospholipase C in plant growth and development. Lipid Signaling in Plants, 16, 23–37. [Google Scholar]
29. Zhai, S. M. (2005). Gene cloning and functional identification of enzymes in the maize phosphatidylinositol metabolic pathway. Shandong University, 7, 1–117. [Google Scholar]
30. Singh, A., Bhatnagar, N., Pandey, A., Pandey, G. K. (2015). Plant phospholipase C family: Regulation and functional role in lipid signaling. Cell Calcium, 58, 139–146. [Google Scholar] [PubMed]
31. Vermeer, J. E. M., van, L. W., Tobeña-Santamaria, R., Laxalt, A. M., Jones, D. R. et al. (2016). Visualization of PtdIns3P dynamics in living plant cells. The Plant Journal, 47, 687–700. [Google Scholar]
32. Zheng, S. Z. (2011). Role of phosphatidylinositol specific phospholipase C 9 (PI-PLC9) in heat tolerance and heat shock signal transduction in Arabidopsis thaliana, pp. 1–122. Hebei Normal University, China. https://kns.cnki.net/kcms/detail/detail.aspx?FileName=1016313485.nh&DbName=CDFDTEMP [Google Scholar]
33. Suh, P. G., Park, J. I., Manzoli, L., Cocco, L., Peak, J. C. et al. (2008). Multiple roles of phosphoinositide-specific phospholipase C isozymes. BMB Reports, 41, 415–434. [Google Scholar] [PubMed]
34. Wang, X., Wang, C., Sang, Y., Qin, C., Welti, R. (2001). Networking of phospholipases in plant signal transduction. Physiologia Plantarum, 115, 331–335. [Google Scholar]
35. Gao, K., Du, J., Hou, M., Zhao, J., Pan, Y. (2013). Research progress of inositol phospholipid signal components regulating pollen development and pollen tube growth. Journal of Botany, 48(2), 210–218. [Google Scholar]
36. Arisz, S. A., Testerink, C., Munnik, T. (2009). Plant PA signaling via diacylglycerol kinase. Biochimica et Biophysica Acta (BBA)—Molecular and Cell Biology of Lipids, 1791, 869–875. [Google Scholar] [PubMed]
37. Qu, H., Guan, Y., Wang, Y., Zhang, S. (2017). PLC-mediated signaling pathway in pollen tubes regulates the gametophytic self-incompatibility of pyrus species. Frontiers in Plant Science, 8, 1164. https://doi.org/10.3389/fpls.2017.01164 [Google Scholar] [PubMed] [CrossRef]
38. van Leeuwen, W., Vermeer, J. E. M., Gadella, T. W. J., Munnik, T. (2007). Visualization of phosphatidylinositol 4,5-bisphosphate in the plasma membrane of suspension-cultured tobacco BY-2 cells and whole Arabidopsis seedlings. The Plant Journal, 52, 1014–1026. [Google Scholar] [PubMed]
39. Li, L. (2015). Study on the mechanism of transduction of OsPLCl ginseng and salt stress signal in paddy rice. South Beijing Agricultural University, 12, 1–134. [Google Scholar]
40. Xia, K. (2016). Mechanism of Arabidopsis thaliana phosphatidylinositol specific phospholipase C 4 regulating seedling response to salt stress. China Agricultural University, 1, 1–98. [Google Scholar]
41. Otterhag, L., Sommarin, M., Pical, C. (2001). N-terminal EF-hand-like domain is required for phosphoinositide-specific phospholipase C activity in Arabidopsis thaliana. FEBS Letters, 497, 165–170. [Google Scholar] [PubMed]
42. Falasca, M., Logan, S. K., Lehto, V. P., Baccante, G., Lemmon, M. A. et al. (1998). Activation of phospholipase Cγ by PI 3-kinase-induced PH domain-mediated membrane targeting. The EMBO Journal, 17, 414–422. [Google Scholar] [PubMed]
Cite This Article
 Copyright © 2023 The Author(s). Published by Tech Science Press.
This work is licensed under a Creative Commons Attribution 4.0 International License , which permits unrestricted use, distribution, and reproduction in any medium, provided the original work is properly cited.
 Downloads
 Citation Tools