
 Submit a Paper
 Propose a Special lssue
 Open Access
ARTICLE

Genome-Wide Identification and Characterisation of Abiotic Stress Responsive mTERF Gene Family in Amaranthus hypochondriacus
Department of Field Crops, Faculty of Agriculture, Şirnak University, Sirnak, Turkiye
* Corresponding Author: Mortaza Hajyzadeh. Email:
(This article belongs to the Special Issue: Identification of Genetic/Epigenetic Components Responding to Biotic and Abiotic Stresses in Crops)
Phyton-International Journal of Experimental Botany 2023, 92(5), 1649-1664. https://doi.org/10.32604/phyton.2023.028028
Received 26 November 2022; Accepted 13 January 2023; Issue published 09 March 2023
 View Full Text
 Download PDF
Abstract
Abiotic stresses at different growth stages in the life of plants negatively affect yield productivity. Therefore, plants, including Amaranthus hypochondriacus, develop adaptive strategies to face the stresses and expand functional diversification. In plants, the mitochondrial transcription termination factors (mTERF) are essential functions in regulation, and organelles (mitochondria and chloroplasts) control gene expression (OGE) under several stress conditions. Based on the in-silico-wide genome and transcriptome analysis, twenty-four mTERF genes were detected in the main targeted mitochondria organelles clustered into three different main groups. The chromosomal location and gene duplication analysis indicated one segmental and one tandem duplication in the genome. The promoter region cis-elements assessment showed that there wasa high correlation between the growth and development process, stress, and hormone responses of these genes. Expression profiling of mTERF genes under salt stress revealed a total number of 24 gene families with seven upregulated and 6 down-regulated genes in drought and salt stress. However, Ah-mTERF-8 and 14 indicated up-regulation under drought stress. Ah-mTERF-4, 6, 14, 15, 17, and 20 were up-regulated under salt stress. Molecular characterization and identification through the in-silico study of the specific genes and their differential expression profiling demonstrated the role of mTERF proteins throughout their reaction to growth and development, during stress in A. hypochondriacus. These results demonstrated that mTERF genes were significantly related to the abiotic stress responses.Keywords
The Amaranthus hypochondriacus is an allotetraploid (2n = 4X = 32) and a C4 dicotyledonous plant. Since A. hypochondriacus is a protein-rich and gluten-free pseudocereal, it is considered a supplemental diet yield [1–3]. The grains are a source of various nutritional elements and green leaves contain several phenolics, hydroxyl-containing oxidants, and other phytochemicals like flavonoids like quercetin, apigenin, taxifolin (di-hydro quercetin), caffeic, ferulic, acids with medicinal and anti-nutraceutical properties important for celiac patients and are used in the manufacture of a gluten-free diet and are among highly nutritious pseudocereals having a high seed protein that is higher in fiber compared to most of the grain cereals [3–5].
All over the world species from the genus, Amaranthus is also evaluated as a leaf vegetable and ornamental plant [4,5]. Furthermore, it is a highly desirable agronomic crop that displays tolerance to heat, drought, salt, salinity, pests, and diseases [6]. Therefore, it can only offer a viable alternative to cereals and considerably withstand drought stress but also be helpful for the identification of candidate genes associated with adverse abiotic stress [7]. Very few studies are reported on the molecular level describing its defense mechanisms against abiotic stresses [8,9].
There are several complex molecular events with several mechanisms that involve the expression of genes responding to undesirable environmental conditions [10,11]. Recently, genome sequencing studies related to A. hypochondriacus have led to the establishment of the basics for genetic improvement, enhanced food security, and identification of gene families related to tolerance against different stresses [11]. Transcription factor (T.F.) gene families have vital functions in almost every plant to induce tolerance against stress-related biological operations, which are the main regulators of several signaling networks. In addition, the T.F. genes are also responsible for plant growth, development, and tolerance for biotic and abiotic stresses via binding promoter regions [12–14]. After identifying several T.F. gene families exclusively present in eukaryotes, the Mitochondrial Transcription Termination Factor (mTERF) family is specified in metazoans. They have four mTERF1-4 different subfamilies with these proteins identified and characterized by repetition of basic regions consisting of 30 conserved amino acid residues motif with several functions according to the number and location [15–17]. mTERF genes reside in the nucleus and encode proteins that target mitochondrial and chloroplast genomes to control transcription genes [18,19]. Due to the mitochondrial gene expression in plants, it is vital for photosynthesis, cellular respiration, and growth which are essential for increasing stress resistance [20,21].
Previous studies have illustrated that different plant species have several mTERF proteins, with genes regulated by stress, phytohormones, light/dark, and salt stress responses [22]. This research aims to define and characterize the mTERF gene family in A. hypochondriacus and recognize their role in defense under abiotic stress. The rest of the manuscript is organized as follows: Section 2, Materials and methods; Section 3, Results and Analysis; Section 4, Discussion; Section 5, Conclusion.
2.1 Identification of mTERF Proteins in A. hypochondriacus, Sequence Alignment
mTERF protein sequences in the A. hypochondriacus genome were attained from the Phytozome online database v13 using a keyword search tool with Pfam ID number PF02536 obtained from the link: “http://pfam.sanger.ac.uk”. To identify and characterize all mTERF sequences in the A. hypochondriacus genome [11], A. thaliana [23,24] and quinoa [25] genomes were screened using the blast in the Phytozome database v13. All possible mTERF proteins were searched with the Hidden Markov models (HMM) with known default parameters [14]. Whole predicted hit values of <1.0 were collected and all non-redundant nucleotides were noted using the EXPASY web tool.
Nonredundant protein was checked for the presence of mTERF conserved domain by using Pfam and SMART tools [26]. Molecular weight, isoelectric points range, and instability of protein index were estimated with ProtParam Web Tool.
2.2 Gene’s Structure, Duplication, Physical Location, and Phylogenetic Analysis, of Ah-mTERF
Characterization of the intron and exon organizations of mTERF genes were detected by comparing their genome and full-length cDNA, using the Gene Structure Display Server v2.0 tool (GSDS,) [27]. Genes duplication was detected according to Yang et al. [28], who noted that the coding sequences alignment covered 70% of the longest genes with the identification of 70% amino acids detecting sequences and possible segmental and tandem duplicated genes by utilizing Plant Genome Duplication Database tools [21]. Chromosomal locations of mTERF genes were identified by Phytozome database v13 and plotted on A. hypochondriacus chromosomes using MapChart [29].
Phylogenetic analysis and tree constructs were performed using MEGA v7 through Neighbor-joining Method (N.J.) and clustering was rated with 1000 bootstrap replicates followed by multiple sequence alignments by employing ClustalW [30–32].
2.3 Determination of the Conserved Motifs
To find conserved protein, Ah-mTERF motifs utilized the Multiple EM for Motif Elicitation (MEME) web tool [33]. The minimum/maximum boundaries, the motifs numbers, and the motif zone range were used as modification parameters defined by Ilhan et al. [34]. The scattering area was adjusted with random repeated numbers. The detected motifs were skimmed via InterPro online database with default settings [35]. Besides, the WEB LOGO online web tool was used to visualize the preserved section sequence analysis [36].
2.4 Promoter Analyzes and Subcellular Localization of Ah-mTERF Gene Family
Cis-acting component analysis of A. hypochondriacus mTERF gene family members was carried out within 5’ upstream gene regions comprising approximately 2 kb nucleotide sequences through the database of PlantCARE [37]. The phenogram was visualized using TBTools software [38]. WoLF PSORT online software was used for the prediction of their subcellular localization.
2.5 The Orthologous Relationships
The gene duplication events were investigated between A. hypochondriacs, A. thaliana, and C. quinoa by MCScanX (The Multiple Collinearity Scan Toolkit). The substitution rates of Ka (non-synonymous substitution rate), Ks (synonymous substitution rate), and Ka/Ks between duplicate pairs of mTERF genes were computed utilizing a synteny map via TBTools [38]. Formula T = Ks/2λ (λ = 6.56E-9) was employed for the estimation of the Time (million years ago, Mya) of divergence and duplication of each mTERF gene [39].
2.6 Transcriptome Data Analysis of mTERF Gene Expression Profiling
Expression profiling analysis of mTERF genes was performed by utilizing Roche 454 RNA-seq data, obtained from NCBI Sequence Read Archive (SRA) to evaluate the A. hypochondriacus mTERF gene expression profiles. Therefore, accession of SRR172678, SRR172677, and SRR172675, belonging to the salt stress, water deficit, and control groups, respectively, were used [40]. All raw readings were downloaded in an individual (single) SRA file split into 2 paired-end files, followed by conversion to fastq, data type via NCBI-SRA Toolkit. The quality control evaluation with FastQC and clear readings were obtained by discarding low-quality reads, followed by mapping the read to the A. hypochondriacus genome (PHYTOZOME v13.1). The gene expression values normalization was adjusted through Reads Per Kilobase of Exon Per Million Reads Mapped) (RPKM) algorithm [41], using CLC Genomics Workbench 21 tool. Finally, hierarchical clustering heat maps were produced using the CIMminer tool with log2 RPKM values.
3.1 Identification of the mTERF Gene Family
All putative mTERF protein sequences were obtained from A. hypochondriacus, Arabidopsis thaliana, and C. quinoa genomes from Phytozome Database v13. A total of 24 putative Ah-mTERF genes were detected in the genome of A. hypochondriacus. Additionally, the mTERF domain in the obtained peptide sequences was confirmed by HMM analyses and refined through Pfam and SMART conserved motif searches. This process led to confirming the presence of the mTERF domain. The total 24 identified Ah-mTERF gene family members were named from Ah-mTERF-1 to Ah-mTERF-24 as per their sequence on the chromosomes.
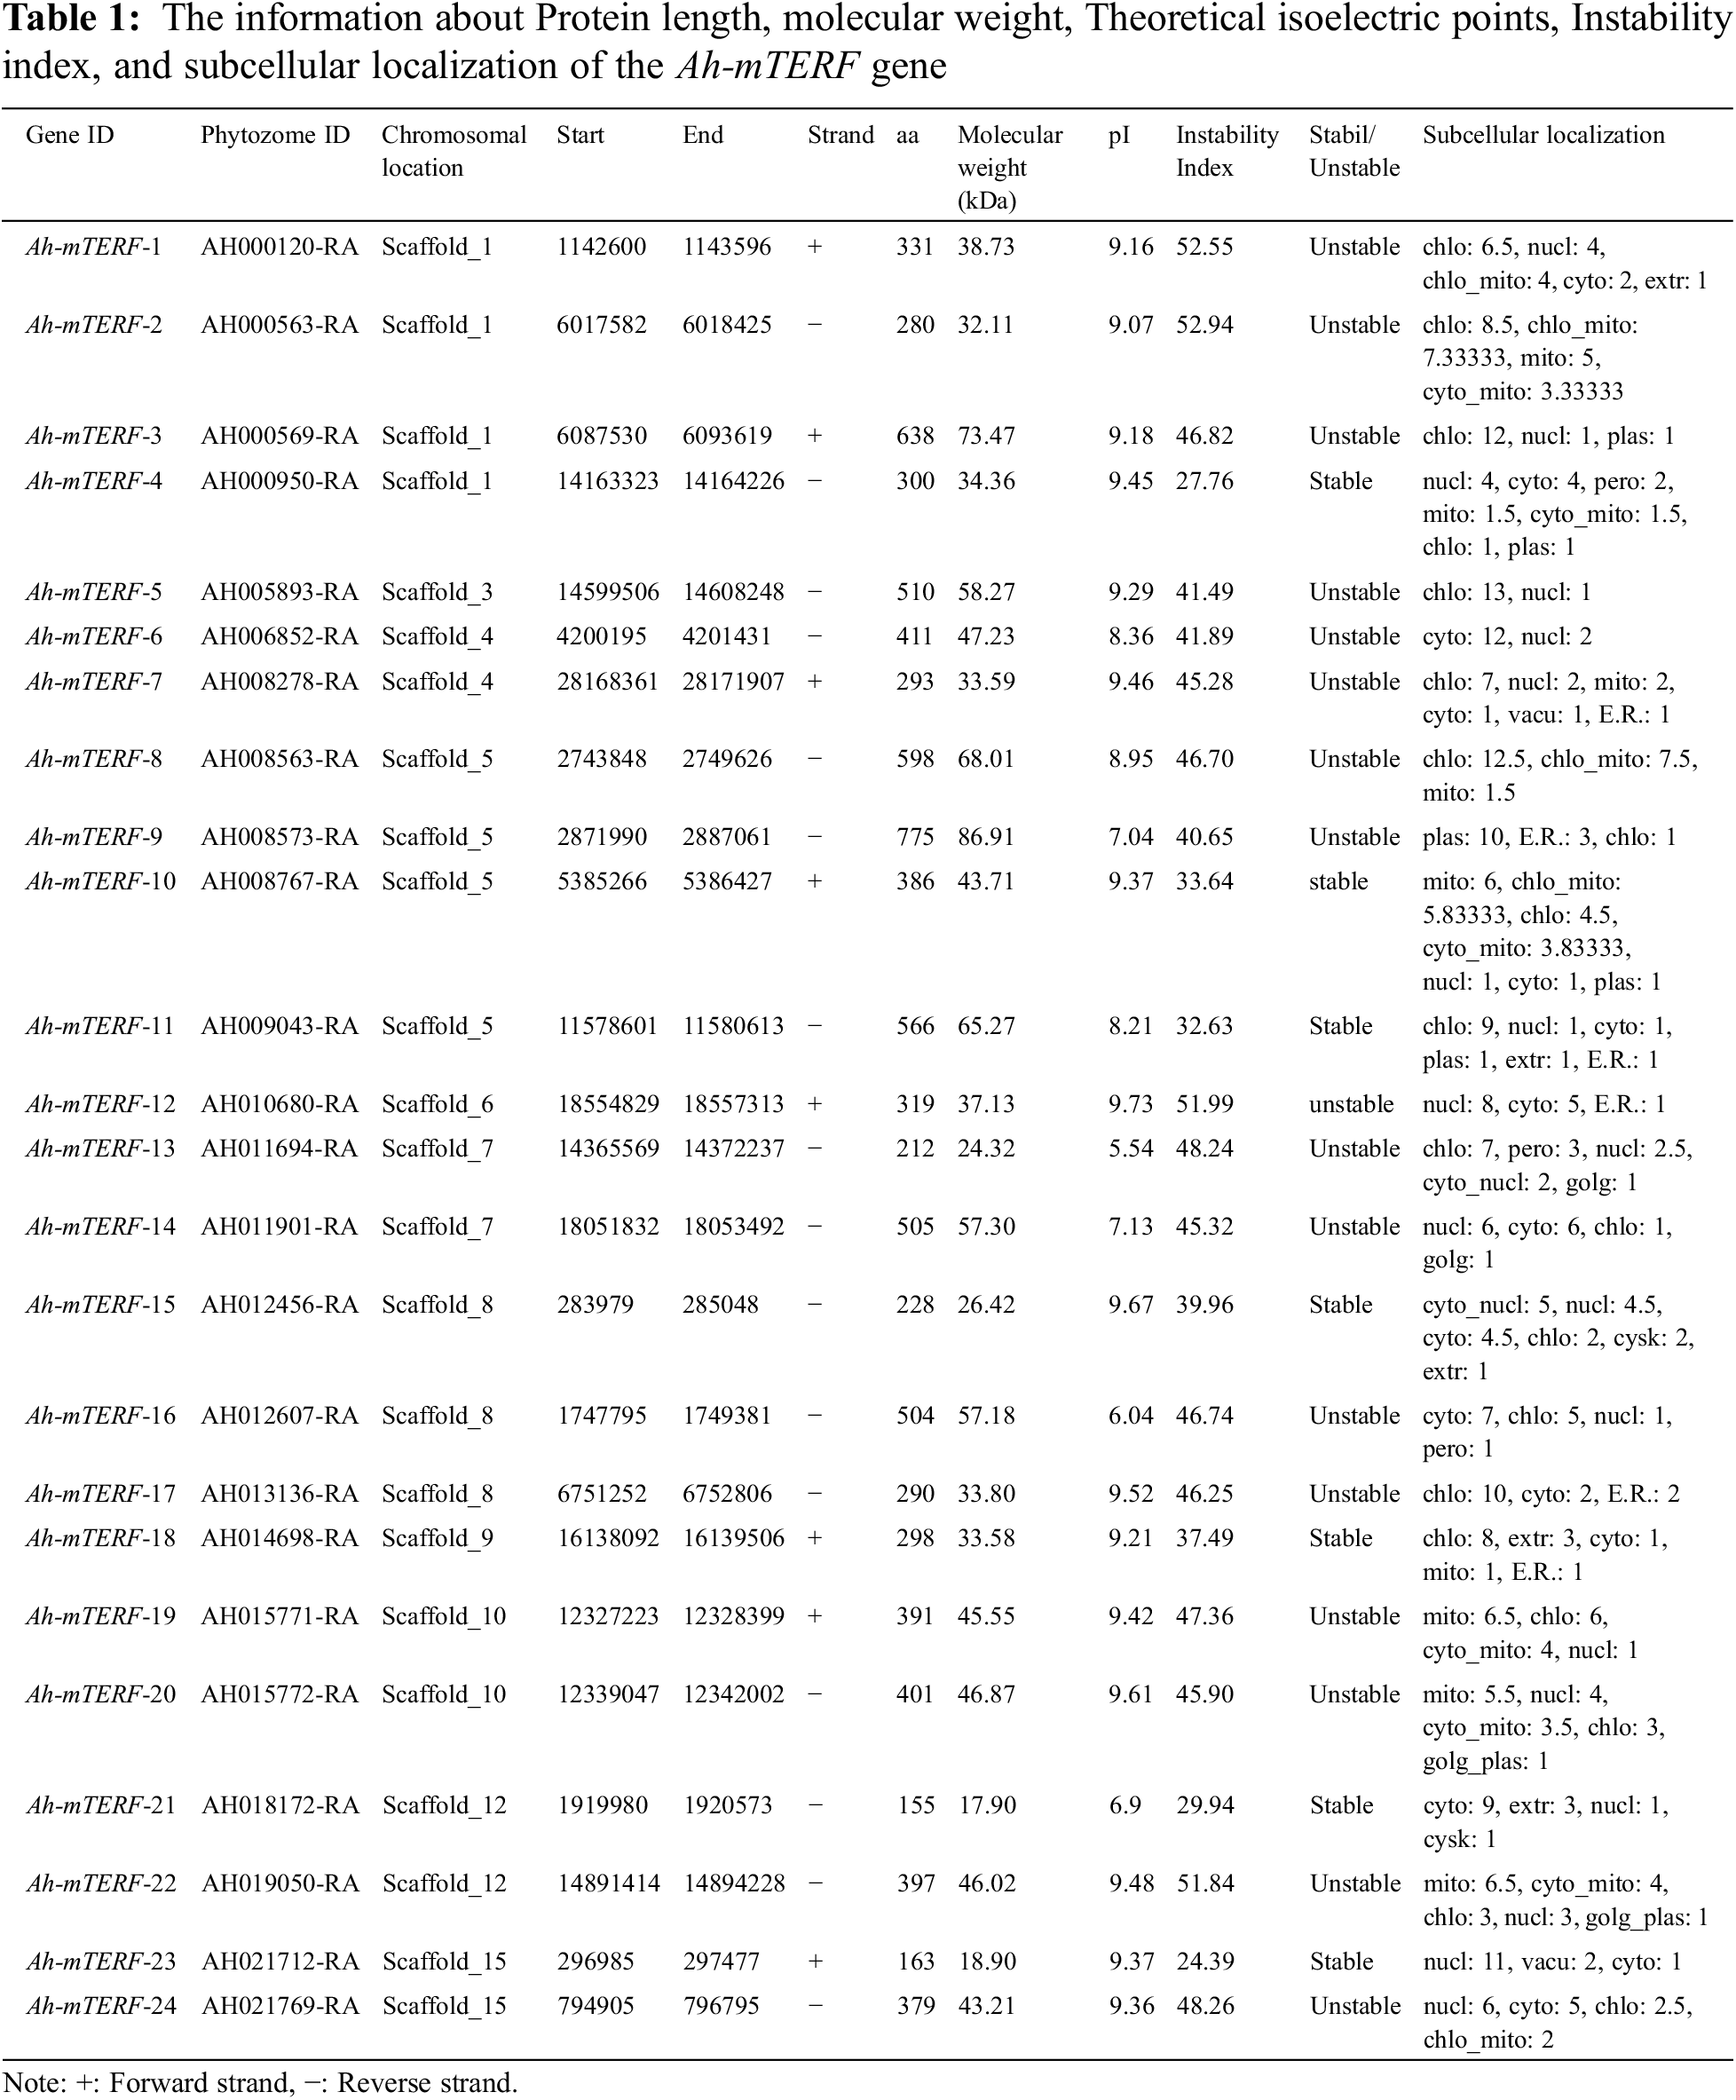
Furthermore, some important information about this gene family is given in Table 1. The length of the identified Ah-mTERF proteins ranged from 153 to 826 amino acid residues along with a molecular weight range of 18.03-94.35 kDa. The minimum and maximum theoretical isoelectric points (pI) of 24 putative Ah-mTERF proteins were 5.54 and 9.80, respectively. Finally, the instability index range was calculated between 26.17 and 53.07 (Table 1).
3.2 Genes Structure, Gene Duplication, Chromosomal Distribution, and Phylogenetic Analysis of Ah-mTERF
The Gene structure of 24 Ah-mTERF genes was analyzed by GSDS v2.0 and represented in Fig. 1. The results showed that the lowest and highest number of introns varied between one to nine; the lowest number of introns was determined in Ah-mTERF-7, 13, 14, 15, 16, and 21 while the highest number of 9 introns was present in Ah-mTERF-9 gene. Furthermore, through phylogenetic analysis, these 24 genes were accommodated under 3 clusters as A, B, C. Cluster A with 13 members is the most crowded group followed by the presence of 7 members in cluster B and 2 other members in cluster C (the smallest Ah-mTERF genes group). The highest number of exons were detected in cluster B-Ah-mTERF-9 gene as 10. While the lowest number of exons with a range of 1–3 was observed in cluster A having 14 mTERF genes. It was also observed that 13 mTERF genes did not employ any intron region among all clusters. The longest intron in terms of sequence length was present in group A and was named Ah-mTERF-17.
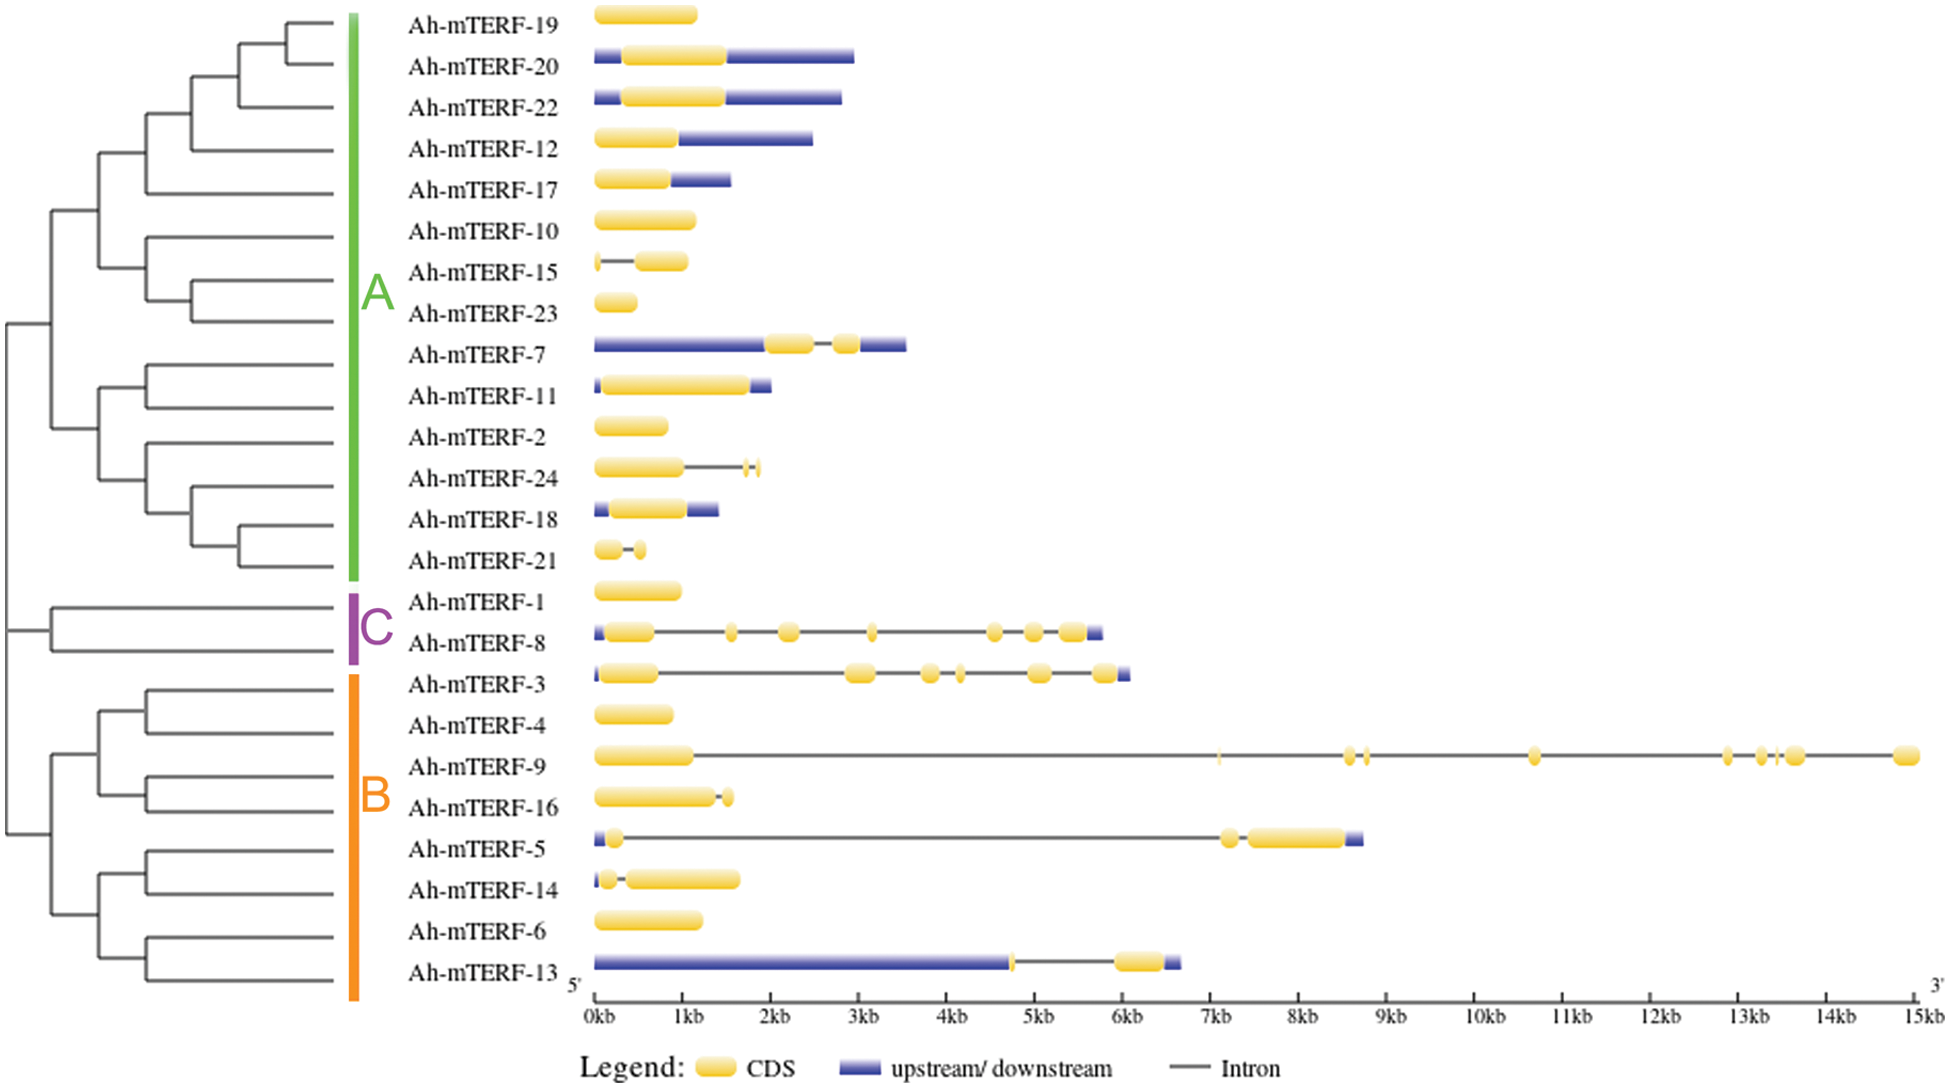
Figure 1: Phylogenetic relationship and Exon/intron organization in Ah-mTERF
The chromosome mapping analysis was performed on the MapChart tool to explore genetic variations in the Ah-mTERF gene family. The result indicated that all members were disproportionally distributed on 11 Scaffolds with the highest number of 4 genes equally distributed on Scaffolds 1 and 5, while the other 3 Ah-mTERF genes were distributed on Scaffold 8. It was followed equally by 2 genes each located on Scaffolds 4, 7, 10, 12, and 15, and at least one gene located on Scaffolds 9, 6, and 3 (Table 1, Fig. 2).
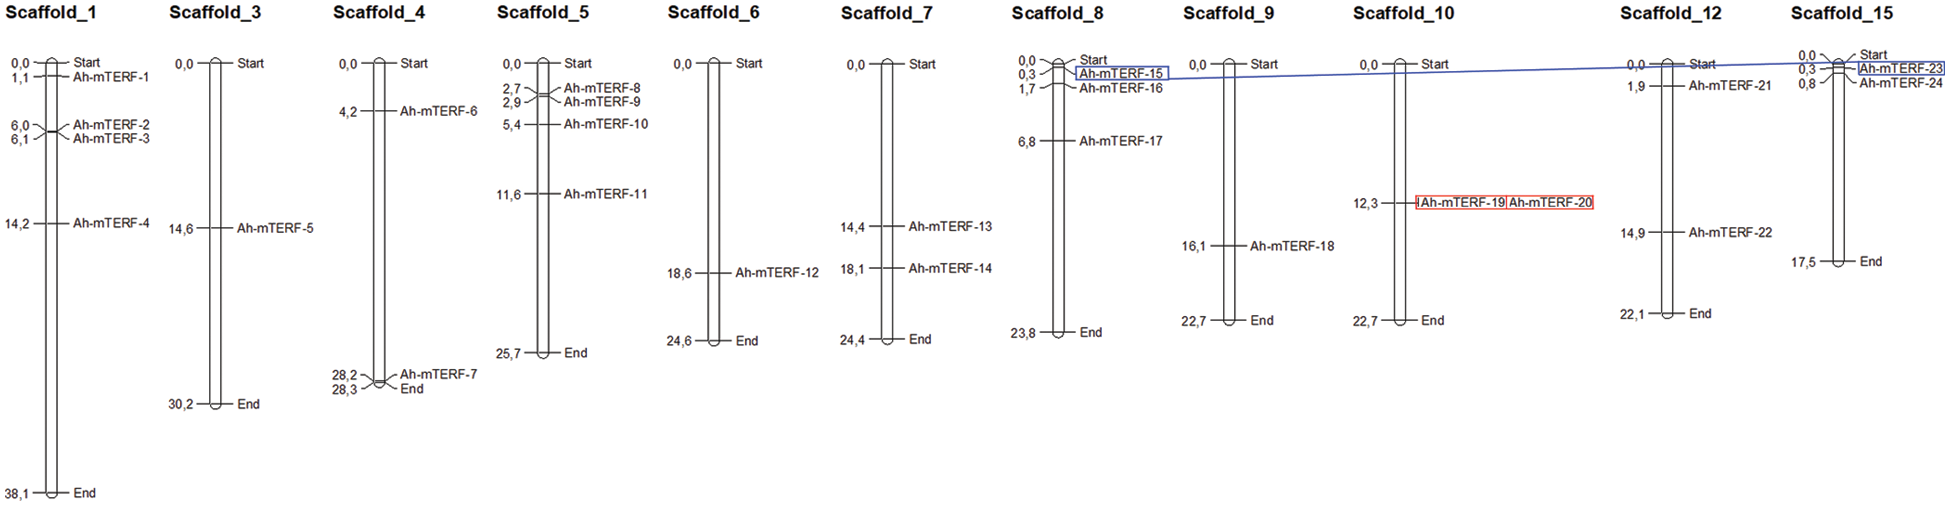
Figure 2: Chromosomal distribution of 24 Ah-mTERF genes and gene duplication events of Ah-mTERF genes. The red boxes indicate segmentally- and the blue boxes indicate tandemly duplicated genes
Gene or genome duplications contribute to genomic evolution. Both tandemly and segmentally duplicated gene pairs were identified among all Ah-mTERF genes during A. hypochondriacus evolution in this research (Table 2, Fig. 2). A tandemly duplicated gene pair (Ah-mTERF-19 and 20) was found on Scaffold 10. Besides, a segmental or whole genome duplication was determined between Ah-mTERF-15 and Ah-mTERF-4 gene pair (Fig. 2).
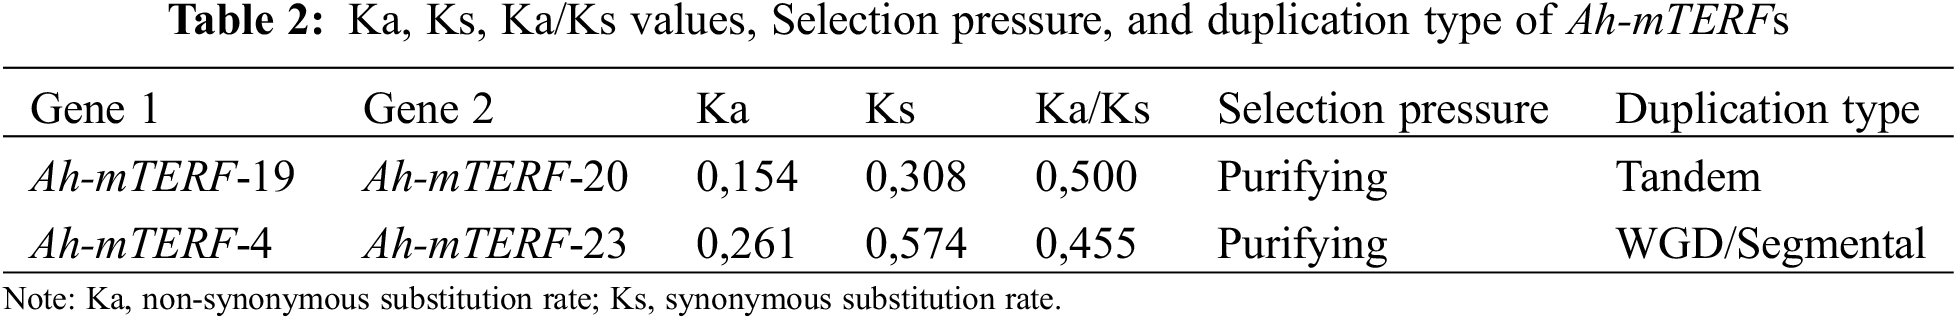
The ratio of Ka/Ks > 1 and Ka/Ks = 1 values show positive selection and neutral selection, respectively [42,43]. However, a ratio Ka/Ka < 1 value in duplication events indicates a purifying selection effect [44]. Ka/Ks values of duplicated mTERF gene pairs in A. hypochondriacus under purifying selection pressure were calculated using TBTools.
These results demonstrated that the Ka/Ks ratio in tandemly duplicated (Ah-mTERF-19 and Ah-mTERF-23) and segmentally duplicated gene pairs were calculated as 0,500 and 0,455, respectively. Since the average of the Ka/Ks < 1, Ah-mTERF genes were under purifying selection pressure (Table 2).
To analyze the mTERF genes’ phylogenetic relationship in A. hypochondriacus, Arabidopsis thaliana, and Chenopodium quinoa, a phylogenetic tree was formed utilizing the MEGA v7 (Neighbor-Joining) (Fig. 3). The mTERF genes were grouped into 11 distinct clusters. The structural features of these 11 clusters showed that cluster XI was the largest cluster with 33 members while the smallest clusters were I, II, III, and VII with 4 members. Moreover, cluster X contained the highest number of Ah-mTERF genes with 6 members.
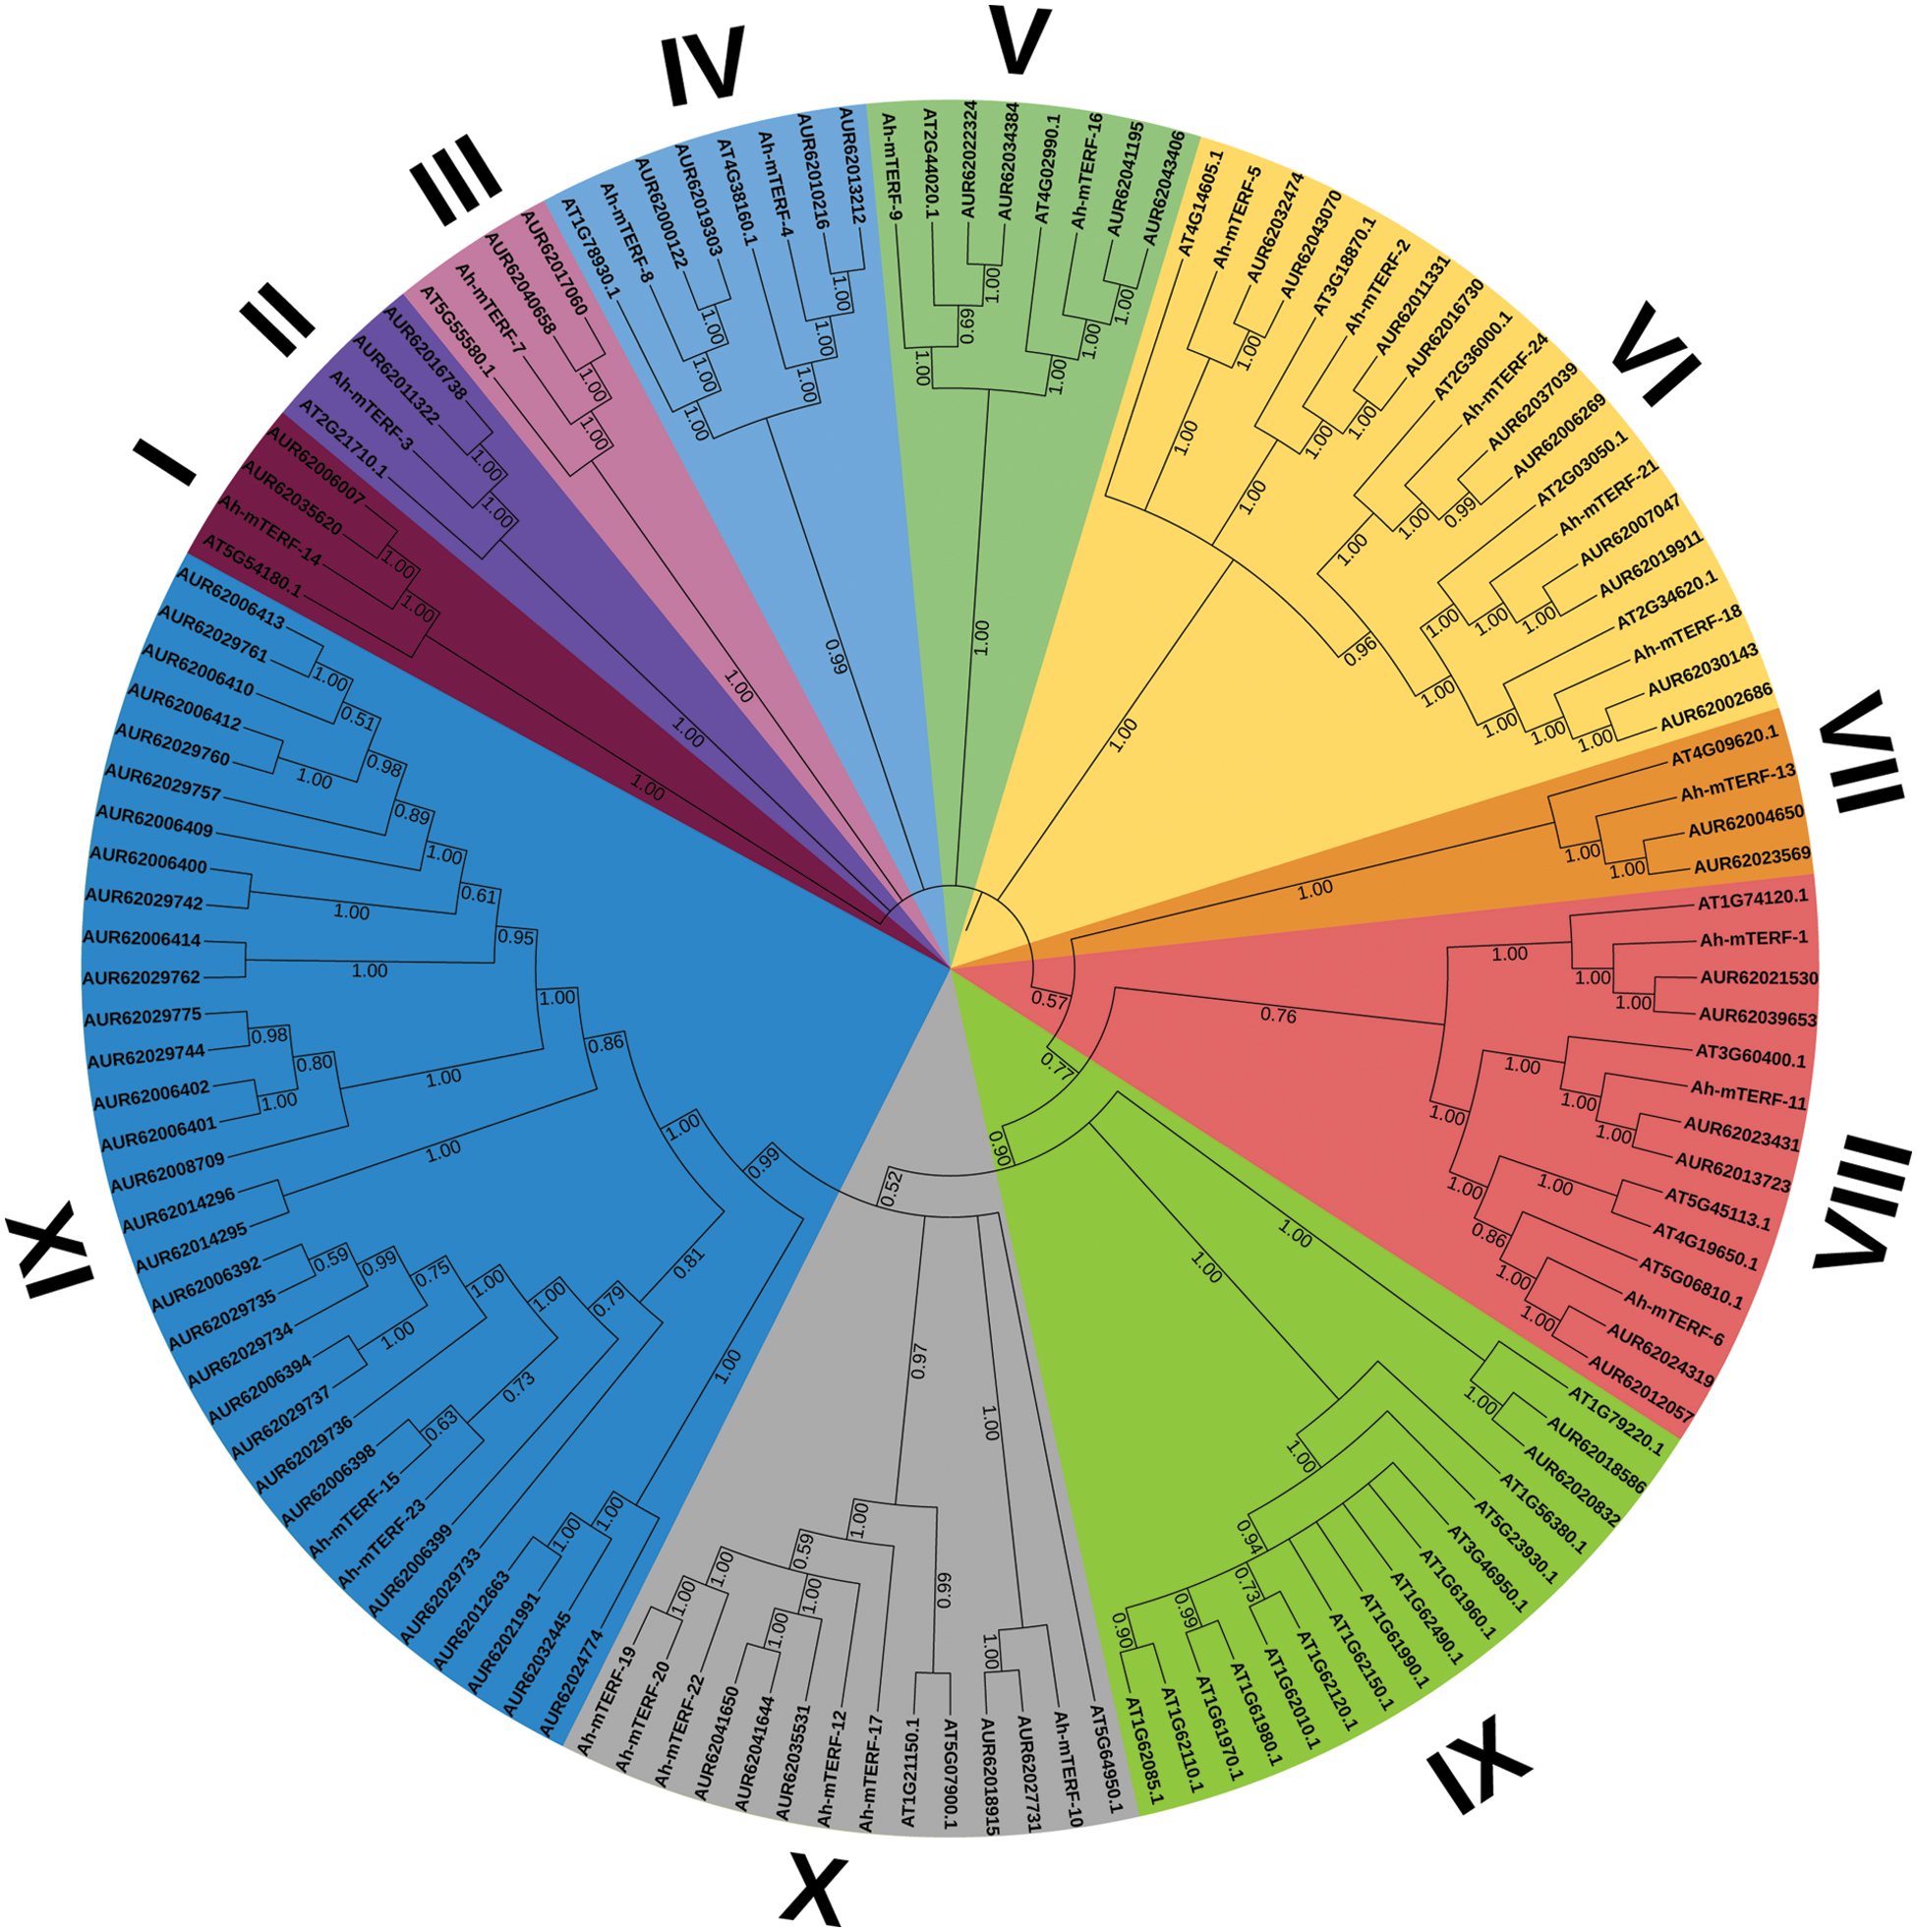
Figure 3: A phylogenetic tree of A. hypochondriacus, Arabidopsis thaliana, and Chenopodium quinoa Willd. mTERF proteins, Using MEGA v7 and Neighbor-joining (N.J.) algorithm with 1000 replicated-bootstrap values
The lowest number of Ah-mTERF protein was in Group IX. The mTERF proteins in the same Group were closely related in the evolutionary relationships. The subcellular localization analysis results showed that the locations of Ah-mTERF-1, 3, 5, 6, 11,12, 13, 14, 15, 16 proteins and Ah-mTERF-2, 8, 18 were found in the nucleus and mitochondria, respectively. Furthermore, some of them were located in others organe such as chloroplasts, endonuclease reticulum, Golgi and vacuoles. With cis-acting elements analysis result showed that different groups such as: response elements, (TGACG-motif and CGTCA-motif, ABA-responsive; ERE, ABRE), development and growth elements (CAT-box (meristem expression), RY-element (seed-regulation element), stress-related regulatory elements (TC-rich repeats (defense and stress), LTR (low-temperature), MYB, MBS (MYB binding sites involved in drought-inducibility), DRE core (DREB region binding sites related drought, low temperature, salt, ABA responses), MYC, W box, GC-motif (anoxic), and ARE (anaerobic)), light-response elements (ATCT-motif and AE-box) and motif elements associated with endosperm and meristem expression (GCN4_motif and CAT-box) in Ah-mTERF promotore region. According to the promotor analyses, the highest and the lowest number of cis-acting elements with 438 and 117 were noted in the Ah-mTERF-22 and Ah-mTERF-12, respectively (Fig. 4).
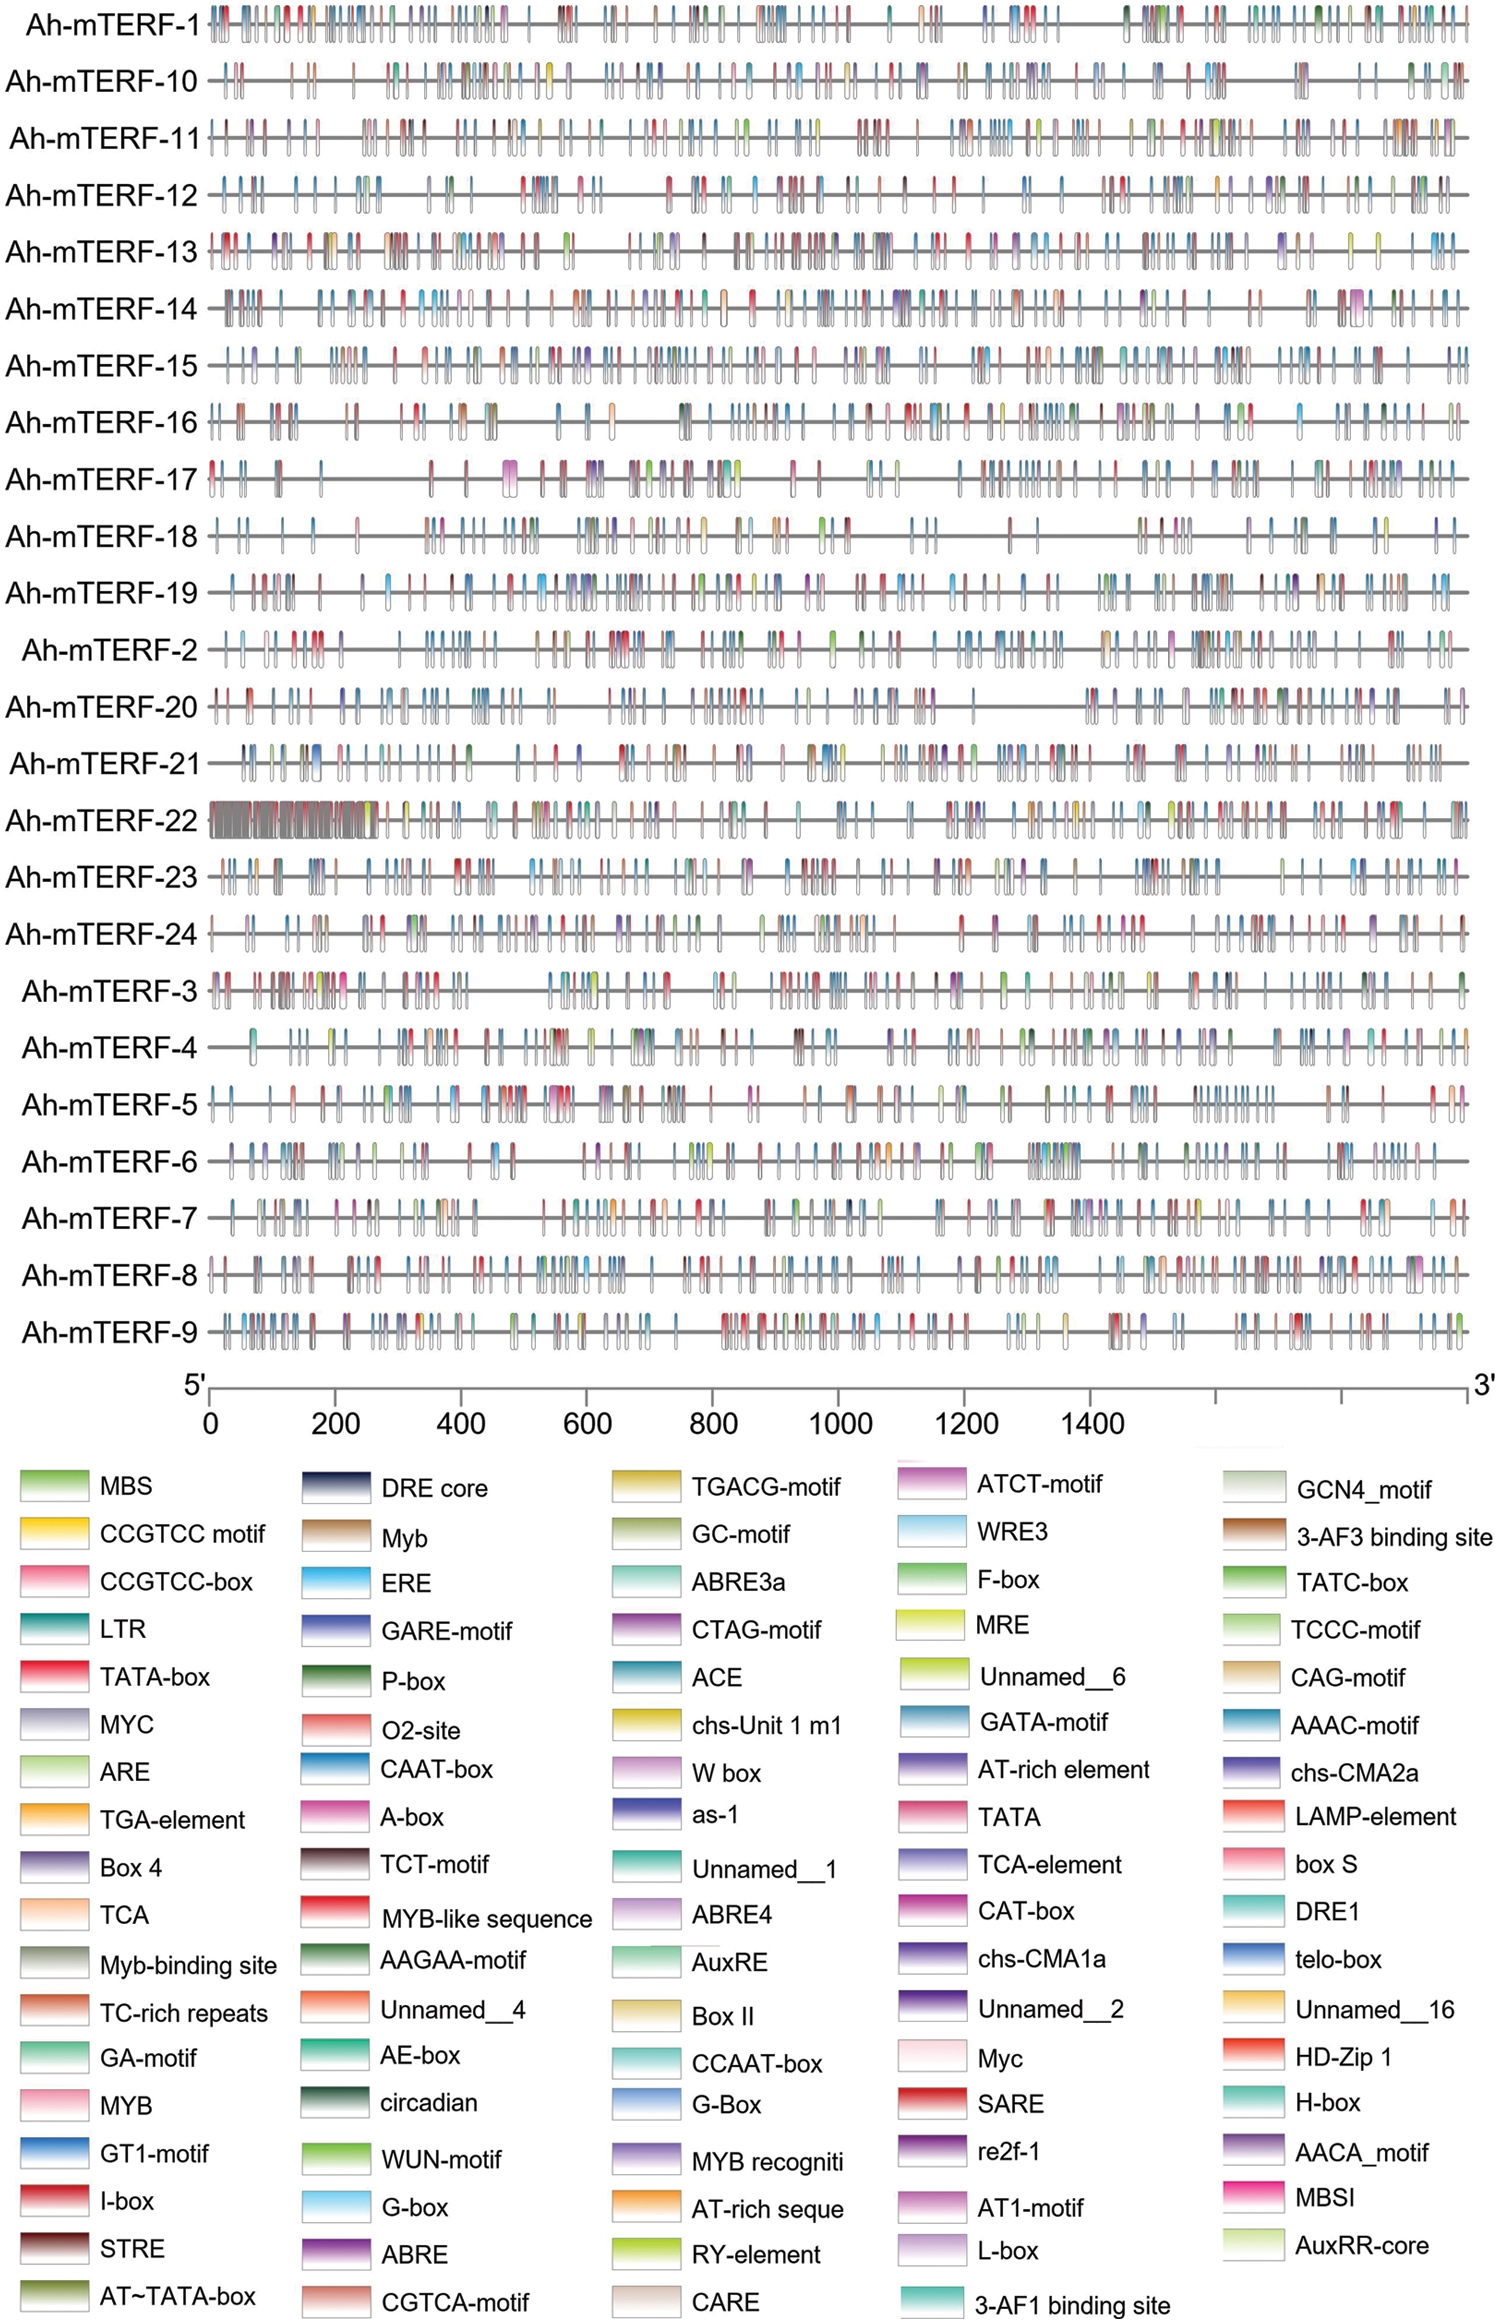
Figure 4: Promotor (Cis-acting element) analysis of Ah-mTERF genes
3.3 The Orthologous Relationships
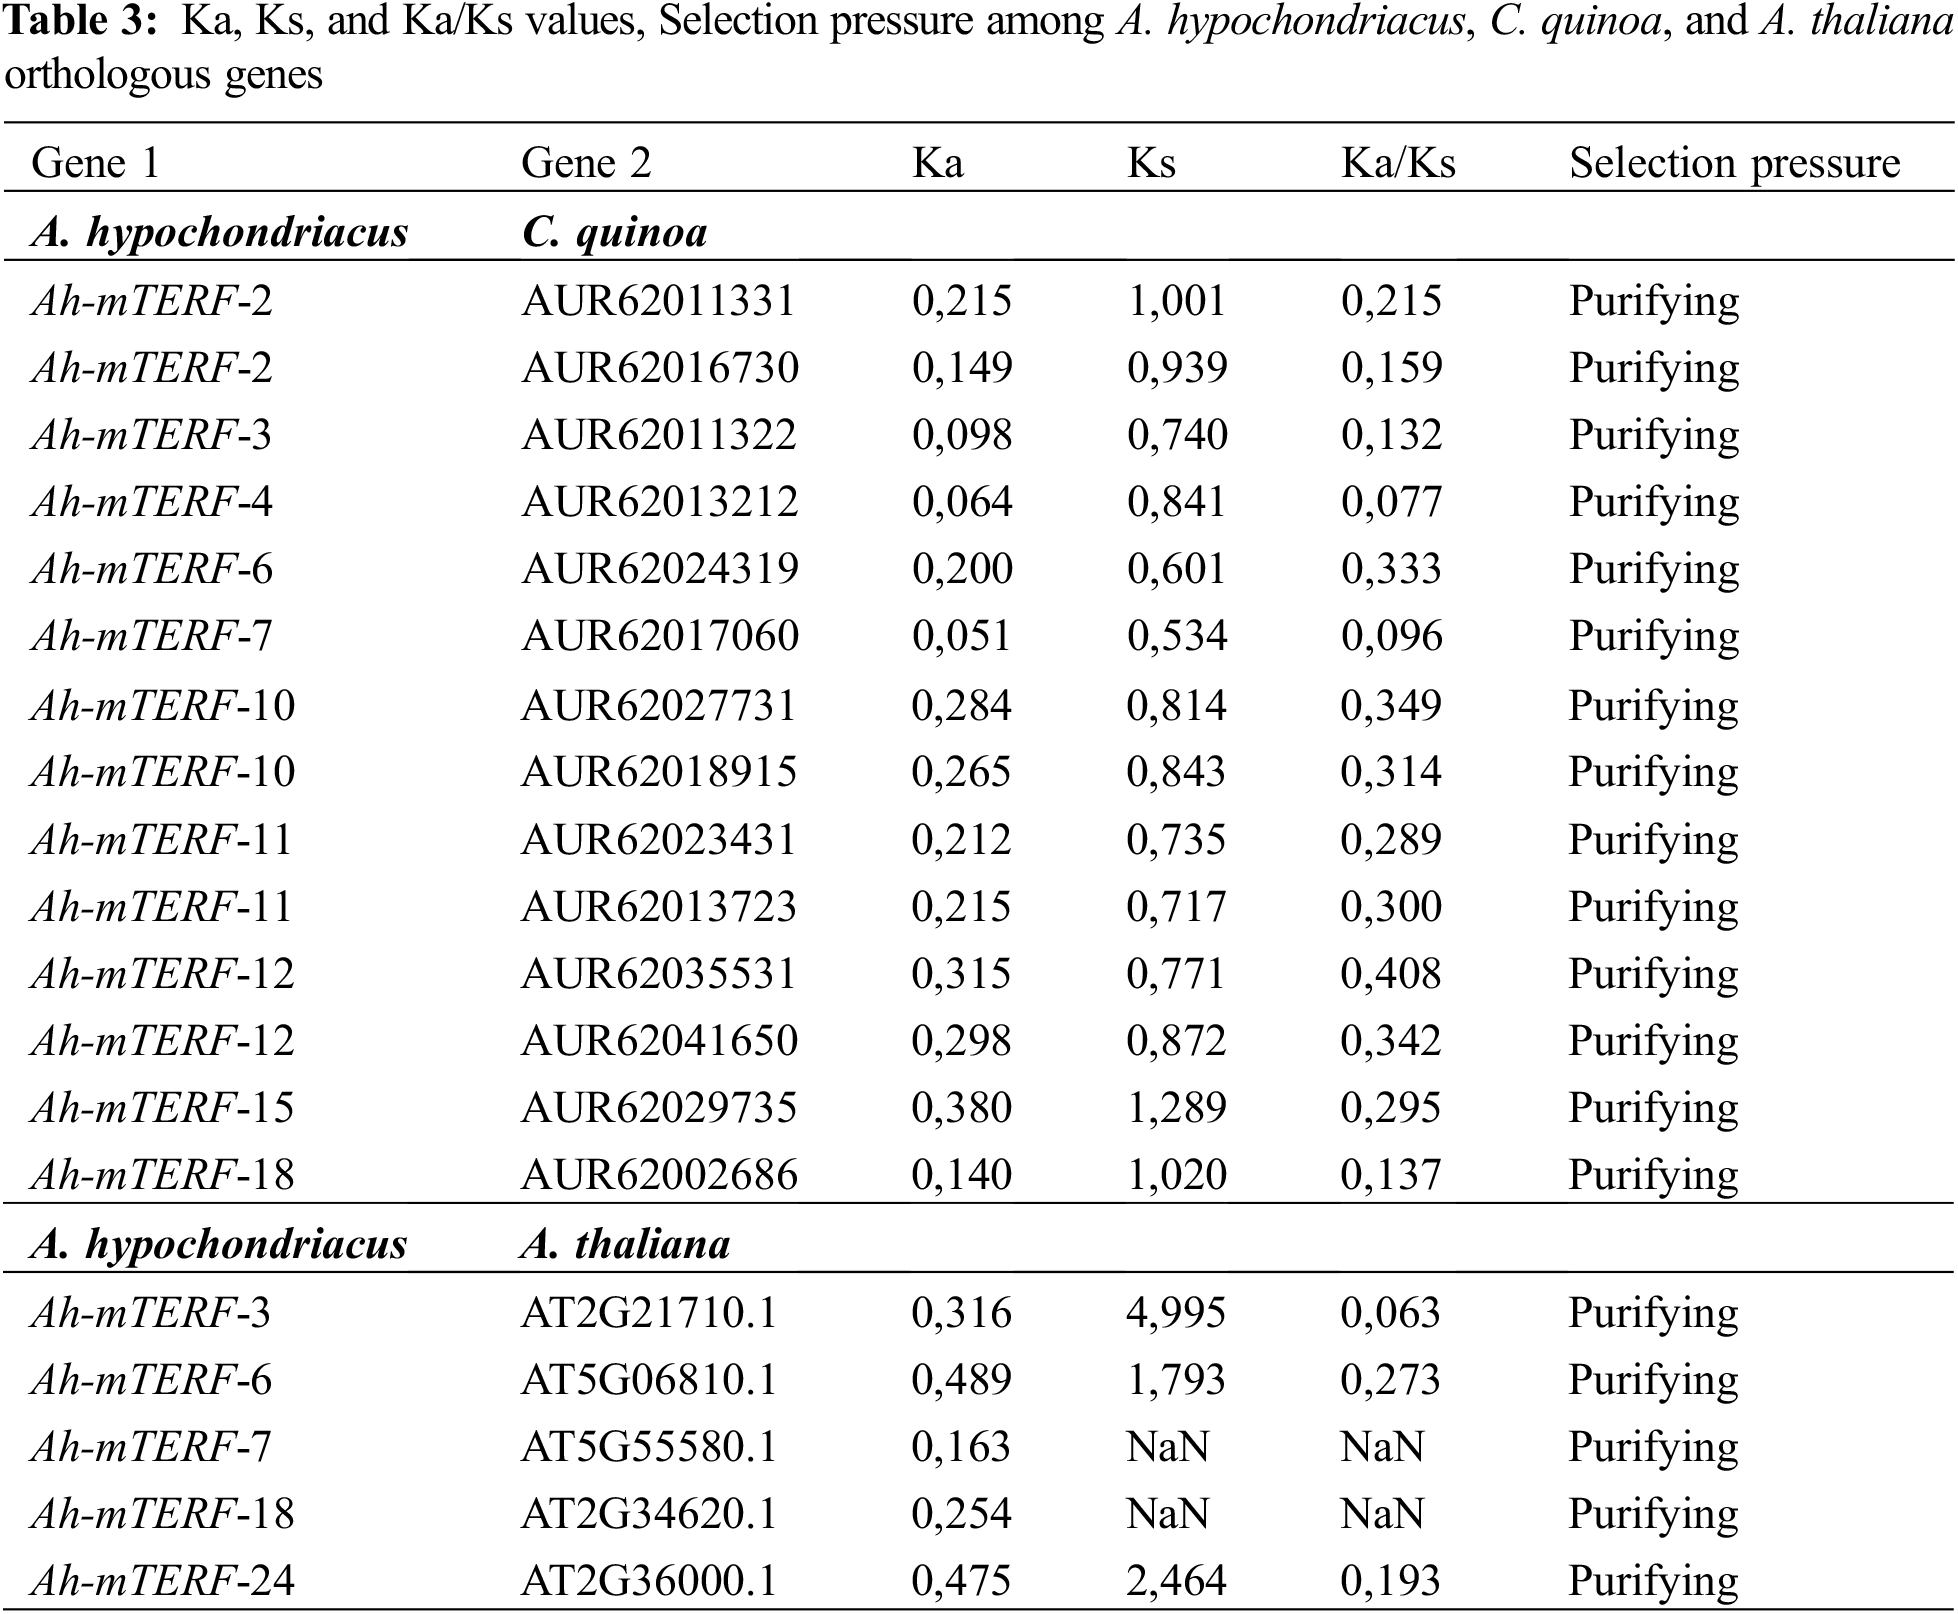
The orthologous association of A. hypochondriacus, Arabidopsis thaliana, and Quinoa (Chenopodium quinoa) in the mTERF genes was searched by the MCScanX using default parameters. To show the selection pressure in the evolutionary process, the Ka/Ks values of each orthologous gene pair were calculated. It can be said that they have ratios varying between 0.077 and 0.408 among the gene pairs with calculated values and strong purifying selection pressure. In addition, it seems like Amaranthus and Arabidopsis diverged from each other earlier in the evolutionary process. On the other hand, the high number of orthologous gene pairs between Amaranthus and quinoa could be these two species diverged more recently from each other in the evolutionary process and that these two species are in the same family taxonomically (Fig. 5, Table 3).
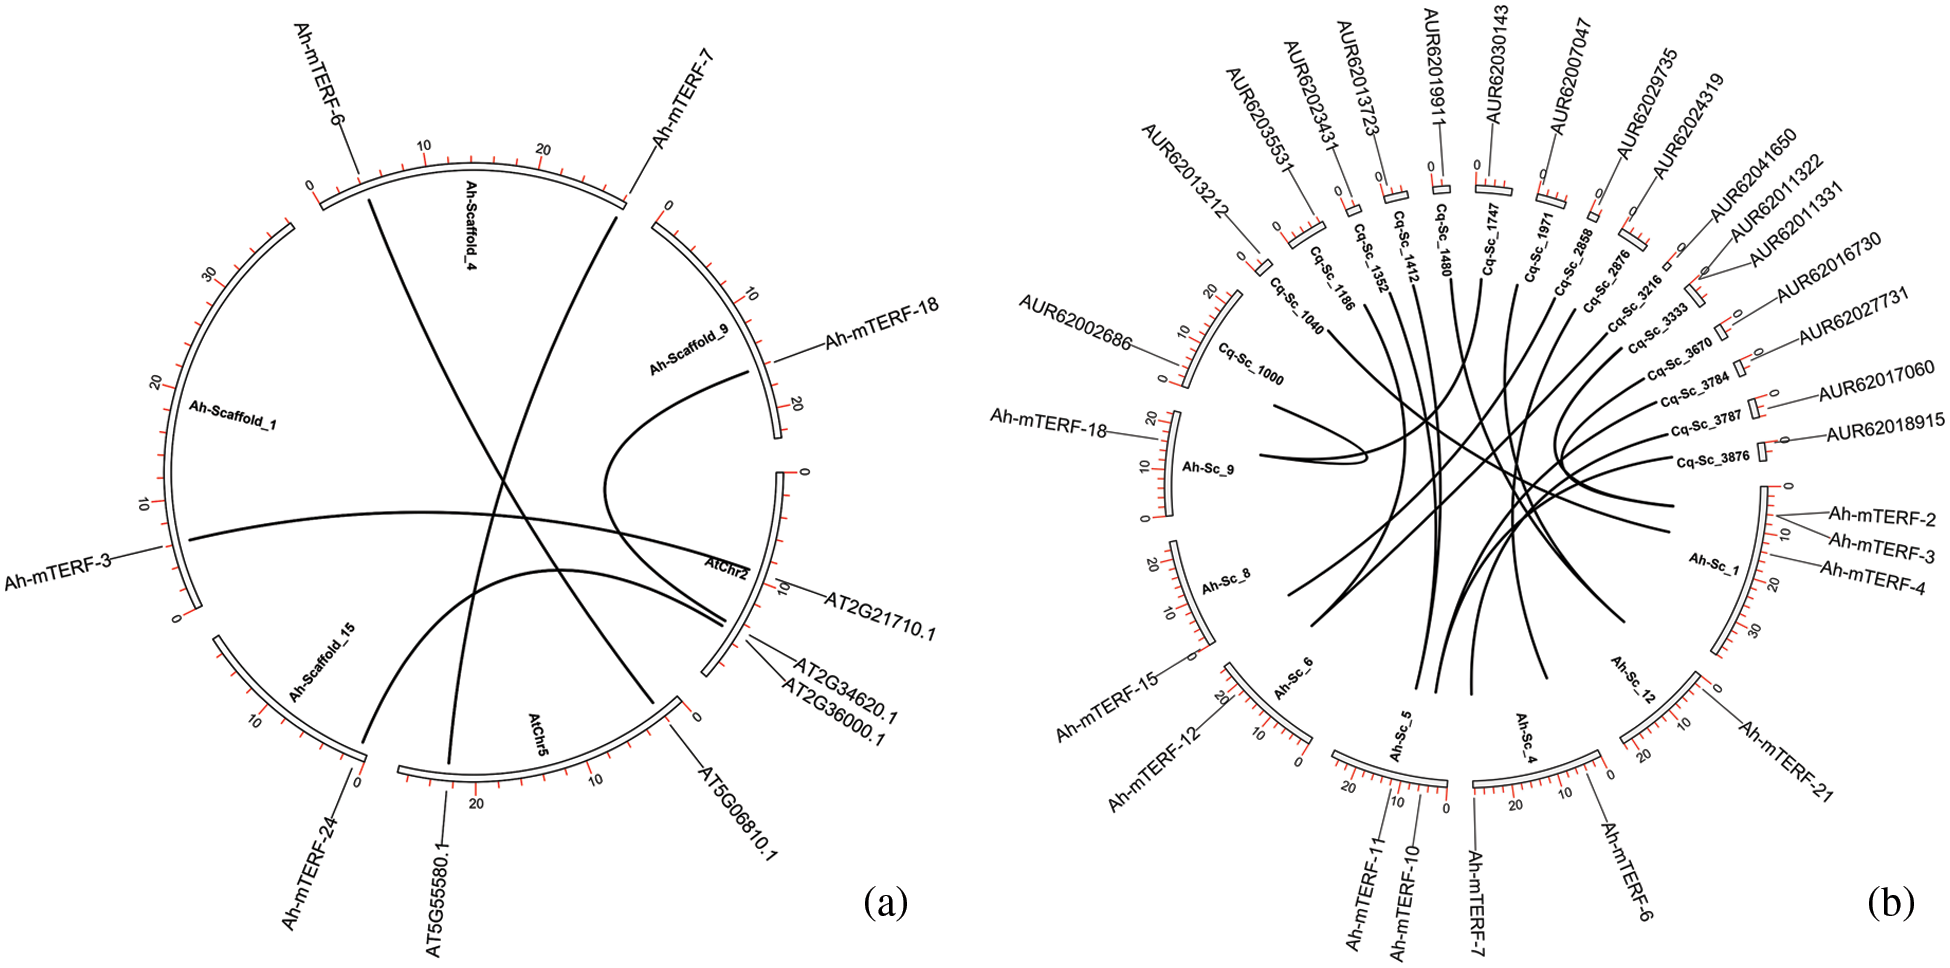
Figure 5: The orthologous relationships among A. hypochondriacus, A. thaliana (a) and A. hypochondriacus /C. quinoa (b). Black curves represented the syntenic relationships between A. hypochondriacus, C. quinoa, and A. thaliana mTERF genes
3.4 Identification of Conserved Motifs
The MEME 5.0.5 online tool was utilized to distinguish the conserved motifs of Ah-mTERF proteins [33]. The results indicated that a total of 10 conserved motifs with lengths in the range of 15 to 29 amino acids were observed. Motif 1 with Motif 2 were defined in all Ah-mTERF proteins except the Ah-mTERF- 6. Motif 10 was found in Ah-mTERF-1, 3, 9, 11, 14, 15, 16, and 23. Therefore, out of 24 proteins, 17 of them comprised a combination of motif 1, motif 2, and motif 10. According to this classification, Ah-mTERF-19, 20, and 22 included all motifs except motif 10.
Moreover, Ah-mTERF-12 and 17 included all motifs, except motifs 10 and 5. Motif number 9 with 29 amino acids was identified as the longest motif. It was the most repeated motif shown in 5 proteins with a single repeat (Table 4 and Fig. 6). The domains of these motifs could not be predicted in InterPro scans using the detected motif sequences.
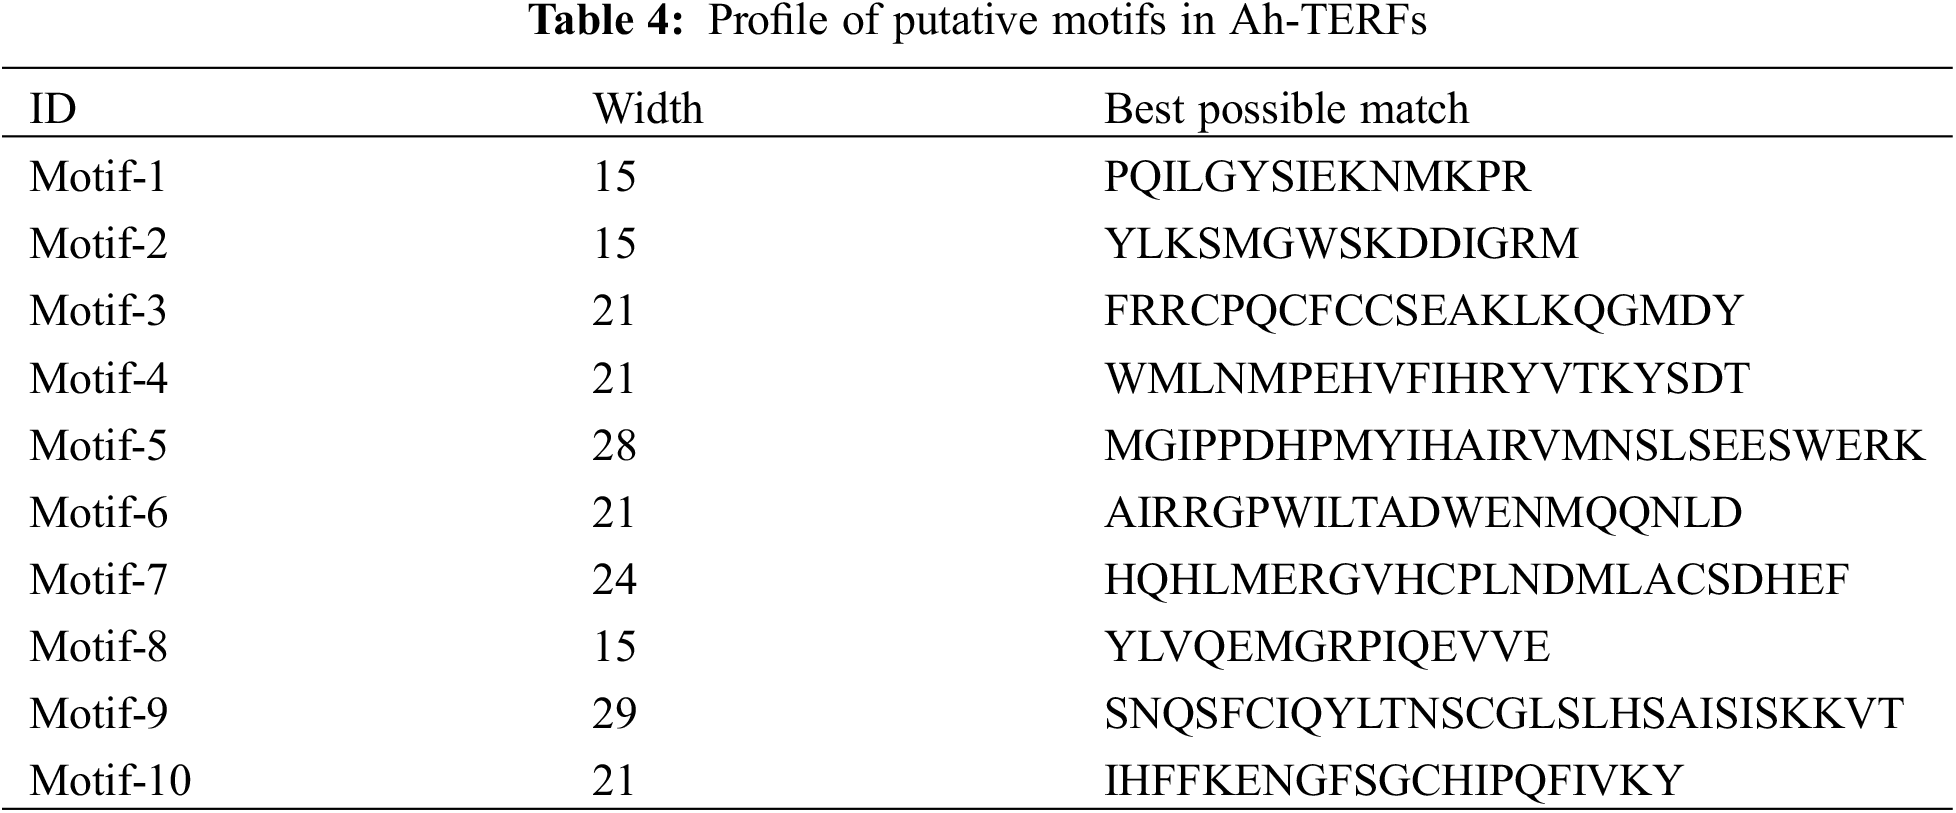
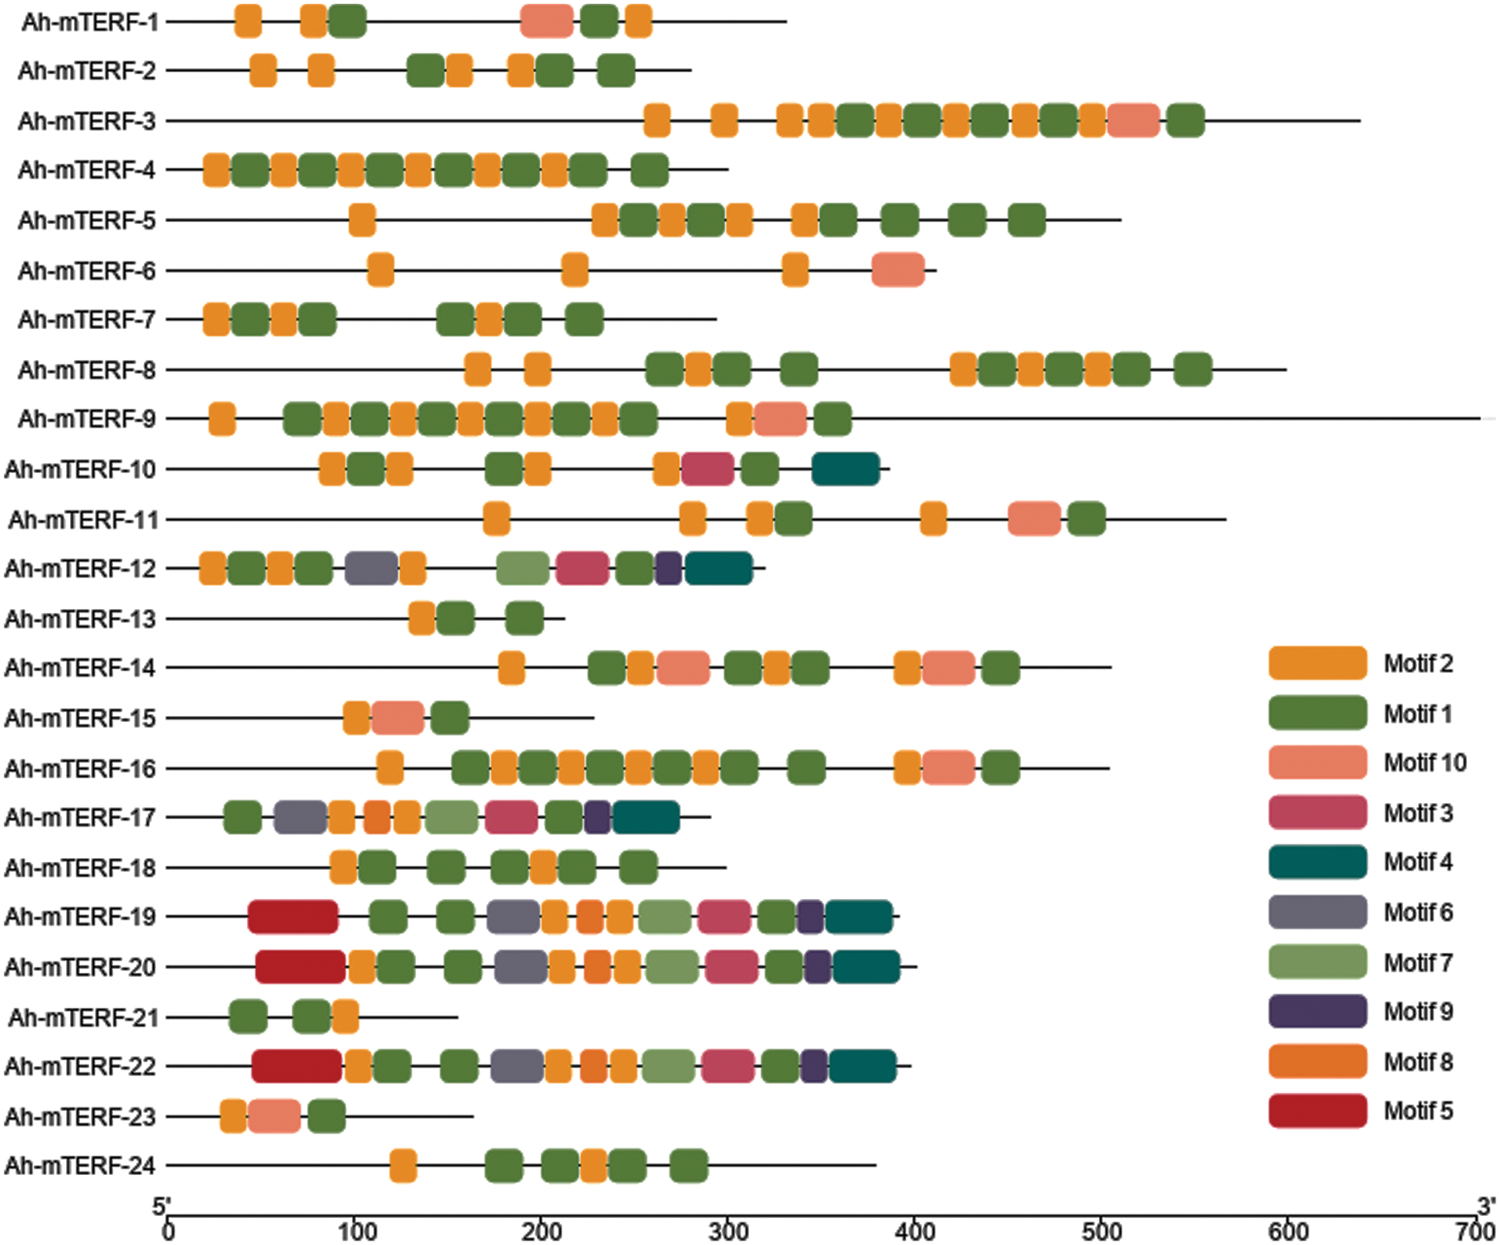
Figure 6: Conserved motif, and gene structure analysis of Ah-mTERFs
3.5 In Silico Ah-mTERF Stress-Responsive Gene Expression Analysis under Stresses
Previous studies showed that mTERF had an essential role in abiotic stress-responsive patterns in plants. For the comprehensive mTERF genes RNAseq data analysis of this research, the SRA database was utilized. The mTERF genes RNAseq results were gathered under a heat map. The heat map exhibited Ah-mTERF under drought and salt stresses (Fig. 7). The expression levels of 7 Ah-mTERF-3, 4, 5, 16, 18, and 24 were up-regulated and expression levels of 6 genes, such as Ah-mTERF-2, 9, 10, 11, 13, 21 were down-regulated and 5 of them Ah-mTERF-1, 7, 12, 19, 23 without any significant differential expression under both drought and salt stress conditions; whereas, 2 putative drought stress Ah-mTERF genes (namely Ah-mTERF-8 and 14) increased under drought stresses and these genes did not respond to salt stress. Additionally, Ah-mTERF-6, 15, 17, and 20 decreased under salt stresses compared to the control samples and did not respond to drought stress. Therefore, these genes were putative salt stress genes among them. The expression levels of the Ah-mTERF-22 gene were increased under drought stress and decreased under salt stress and were found related to both drought and salt stress (Fig. 7).
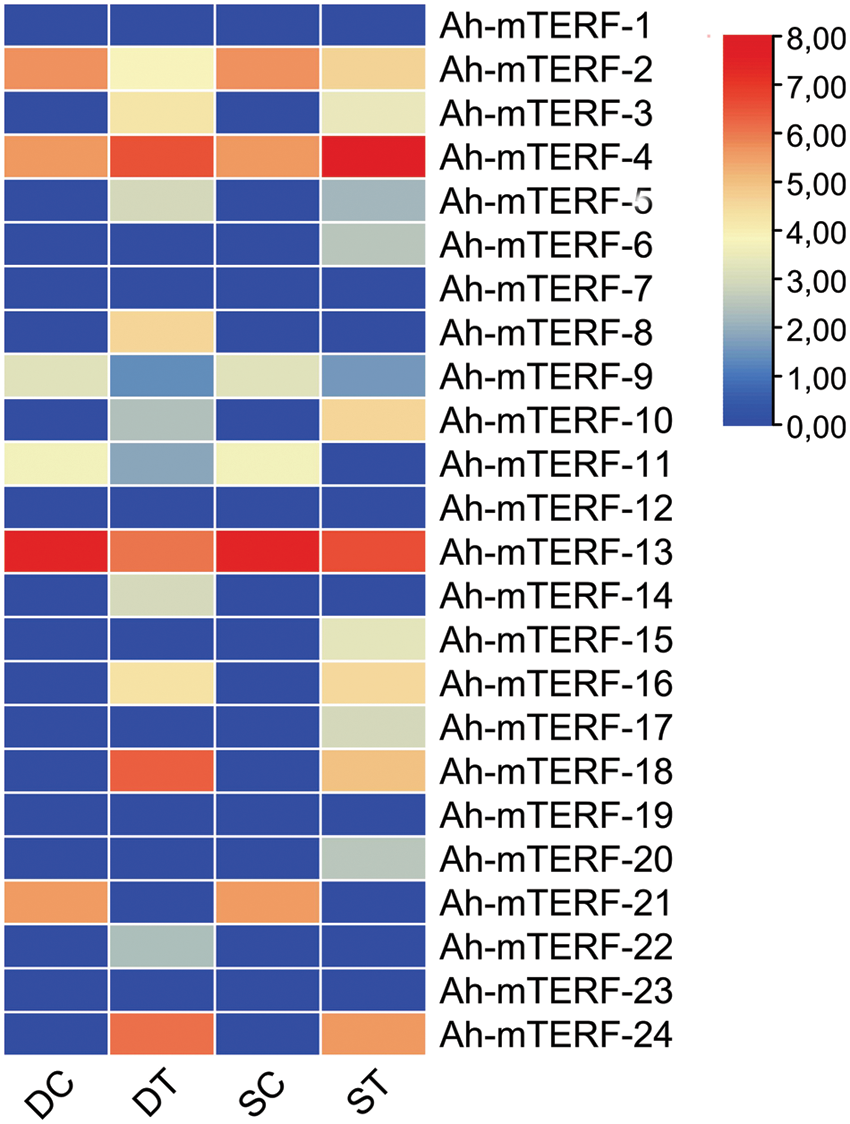
Figure 7: Expression profiles of Ah-mTERFs under the different stresses
While Families of plant mTERF genes have a crucial contribution to developmental processes [20] and stress responses, their primary roles are still ambiguous. Thus, it is essential to characterize and identify more of the mTERF gene family members for other species, including A. hypochondriacus. Identification and characterization of the mTERF transcription factors family in the A. hypochondriacus genome using bioinformatic techniques indicated that there are 24 potential mTERF genes at the genome level. The chromosomal distribution and location analysis showed that 24 potential mTERF genes were positioned on the 11th scaffold of A. hypochondriacus.
The mTERF gene family had been observed in various plant species, like Carica papaya [17], Arabidopsis thaliana [20], Capsicum annuum or pepper [18], Vitis vinifera [19], Zea mays and Oryza sativa [22], with the number of 21, 35, 35, 25, 31, 30 genes had been in the same sequence. The Maximum mTERF genes were detected with 51 genes in Populus trichocarpa [45]. Thus, the considerable number of mTERF variation motifs for diverse plant species may be associated with functional dissimilarities among mTERF gene family members.
Gene duplications are very important in the independent mechanisms ending up with segmental and tandem duplication, including novel functions, the evolution of related close genes, gene expansion, and enhancing stress tolerance [46,47]. Our results revealed that segmental and tandem duplication events contributed to mTERF gene expansion in the A. hypochondriacus genome, and similar results were examined for maize and other crops [20,22,47]. The Ka/Ks ratio indicates the gene selection pressure of the protein-coding. According to the Ka/Ks ratio, the gene pair duplication was less than 1, revealing the evolution of Ah-mTERF gene pairs through purifying selection.
Moreover, Ah-mTERF gene structure analysis showed that 13 out of 24 Ah-mTERF genes had 0 introns while 11 out of 24 Ah-mTERF genes had different numbers of introns which varies from 1 to 9. Previous studies had confirmed that many mTERF genes did not contain introns in maize which is compatible with our results [22]. Other studies had also reported that Vitis vinifera, Oryza sp., and Arabidopsis had introns similar to our results [19,48].
The cluster relationships analysis between mTERFs of A. hypochondriacus is also worth discussing. In our analysis, all Ah-mTERF genes were graded into three subclasses to observe highly conserved features of mTERFs within each subclass with similar functions. The genes detected in the subclass were identical to their structure, indicating high conservation. Furthermore, evolutionary relationships among phylogenetic trees were clustered into eight groups that shared a close evolutionary relationship with mTERF amino acid sequences with Quinoa in contrast to more distantly related Arabidopsis according to the phylogenetic tree. This indicated that Ah-mTERF genes were highly preserved throughout the evolutionary process. It was also noted that the Ah-mTERF proteins between the participants of the same cluster had similar preserved motifs, showing that Ah-mTERF proteins in the same cluster had identical functions.
The functions of several mTERFs in Arabidopsis, capsicum, and maize were approved. For example, Ah-mTERF-5, 9, 10, and 11 were noted to have participatory roles in resistance pathways for many abiotic stresses, and Ah-mTERF-5, 9, and 10 had functions during ABA regulation [49,15]. Ah-mTERF-1 and 6 were involved in the biogenesis of chloroplast with a role in the induction of leaf color [50], by removing the Ah-mTERF-18 loss of function, the mTERF mutant phenotype was detected inducing dark green laminal color, reduced ROS formation, high heat tolerance, upregulation of several mitochondrial respiratory functions and many genes involved in abiotic stress-response [51]. It was detected that the expression levels of 12 Ah-mTERFs as a Ah-mTERF-3, 4, 5, 16, 18, 24, 2, 9, 10, 11, 13, and 21 defining differential expression levels across drought stress and salt treatments. Kim et al. [52] had reported different functions and decreased expression profiles of Ah-mTERF-1 and 7 after subjecting them to biotic stresses. Yin et al. [53] had indicated that the Ah-m-TERF-21 gene was increased under salt and cold stress for RNA-seq studies in barley. Analysis in Fig. 7 has depicted tissue-specific expression of Ah-TERFs in plants subjected to different types of stresses. The expression level of several plant mTERFs had a role in regulatory functions related to responsive stress resistance genes and affected the overall plant stress; therefore, it was demonstrated to regulate ABA salt stress tolerance and pathways [15].
24 mTERF gene family members of the A. hypochondriacus genome were identified in this study using in silico methodologies. These weredistributed in 11 different scaffolds. The analysis of gene expression results performed under drought and salt conditions determined that Ah-mTERF genes may have different levels of expression under different kinds of stress treatments. The current study provided invaluable information to understand and classify the functions of mTERF genes in the A. hypochondriacus.
Funding Statement: The author received no specific funding for this study.
Conflicts of Interest: The author declares that they have no conflicts of interest to report regarding the present study.
References
1. Greizerstein, E. J., Poggio, L. (1994). Karyological studies in grain Amaranths. Cytology, 59(1), 25–30. https://doi.org/10.1508/cytologia.59.25 [Google Scholar] [CrossRef]
2. Bonasora, M. G., Poggio, L., Greizerstein, E. J. (2013). Cytogenetic studies in four cultivated Amaranthus (Amaranthaceae) species. Comparative Cytogenetics, 7(1), 53–61. https://doi.org/10.3897/CompCytogen.v7i1.4276 [Google Scholar] [PubMed] [CrossRef]
3. Alvarez-Jubete, L., Arendt, E. K., Gallagher, E. (2009). Nutritive value of pseudocereals and their increasing use as functional gluten free ingredients. International Journal of Food Sciences and Nutrition, 60(4), 240–257. [Google Scholar] [PubMed]
4. Finkel, T., Holbrook, N. J. (2000). Oxidants, oxidative stress and the biology of ageing. Nature, 408, 239–247. [Google Scholar] [PubMed]
5. Aditya, M., Bhattacharjee, S. (2018). Foliar anti-diabetic and antioxidant potential of a promising accession of Amaranthus hypochondriacus L.: GC-MS based evidence. The Journal of Phytopharmacology, 7, 121–126. [Google Scholar]
6. Joshi, R., Singla-Pareek, S. L., Pareek, A. (2018). Engineering abiotic stress response in plants for biomass production. The Journal of Biological Chemistry, 293(14), 5035–5043. https://doi.org/10.1074/jbc.TM117.000232 [Google Scholar] [PubMed] [CrossRef]
7. Vargas-Ortiz, E., Espitia-Rangel, E., Tiessen, A., Delano-Frier, J. P. (2013). Grain amaranths are defoliation tolerant crop species capable of utilizing stem and root carbohydrate reserves to sustain vegetative and reproductive growth after leaf loss. PLoS One, 8(7), e67879. https://doi.org/10.1371/journal.pone.0067879 [Google Scholar] [PubMed] [CrossRef]
8. Tucker, J. B. (1986). Amaranth-the once and future crop. Bioscience, 36(1), 9–13. https://doi.org/10.2307/1309789 [Google Scholar] [CrossRef]
9. Omami, E. N., Hammes, P. S., Robbertse, P. J. (2006). Differences in salinity tolerance for growth and water-use efficiency on some amaranth genotypes. New Zealand Journal of Crop and Horticultural Science, 34(2), 11–22. https://doi.org/10.1080/01140671.2006.9514382 [Google Scholar] [CrossRef]
10. Iturbide, G., Gispert, M. (1994). Grain amaranths (Amaranthus spp.). Rome, Italy: FAO. [Google Scholar]
11. Sunil, M., Hariharan, A. K., Nayak, S., Gupta, S., Nambisan, S. R. et al. (2014). The draft genome and transcriptome of Amaranthus hypochondriacus: A C4 dicot producing high-lysine edible pseudo-cereal. DNA Research, 21(6), 585–602. https://doi.org/10.1093/dnares/dsu021 [Google Scholar] [PubMed] [CrossRef]
12. Liu, J., Chen, N., Chen, F., Cai, B., Dal Santo, S. et al. (2014). Genome-wide analysis and expression profile of the bZIP transcription factor gene family in grapevine (Vitis vinifera). BMC Genomics, 15(1), 281. [Google Scholar] [PubMed]
13. Singh, K. B., Foley, R. C., Oñate-Sánchez, L. (2002). Transcription factors in plant defense and stress responses. Current Opinion in Plant Biology, 5(5), 430–436. [Google Scholar] [PubMed]
14. Baloglu, M. C., Eldem, V., Hajyzadeh, M., Unver, T. (2014). Genome-wide analysis of the bZIP transcription factors in cucumber. PLoS One, 9(4), e96014. [Google Scholar] [PubMed]
15. Robles, P., Micol, J. L., Quesada, V. (2012). Unveiling plant mTERF functions. Molecular Plant, 5(2), 294–296. [Google Scholar] [PubMed]
16. Linder, T., Park, C. B., Asin-Cayuela, J., Pellegrini, M., Larsson, N. G. et al. (2005). A family of putative transcription termination factors shared amongst metazoans and plants. Current Genetics, 48, 265–269. [Google Scholar] [PubMed]
17. Roberti, M., Polosa, P. L., Bruni, F., Manzari, C., Deceglie, S. et al. (2009). The MTERF family proteins: Mitochondrial transcription regulators and beyond. Biochimica et Biophysica Acta (BBA)–Bioenergetics, 1787(5), 303–311. https://doi.org/10.1016/j.bbabio.2009.01.013 [Google Scholar] [PubMed] [CrossRef]
18. Tang, B., Xie, L., Yi, T., Lv, J., Yang, H. et al. (2019). Genome-wide identification and characterization of the mitochondrial transcription termination factors (mTERF s) in Capsicum annuum L. International Journal of Molecular Sciences, 21(1), 269. https://doi.org/10.3390/ijms21010269 [Google Scholar] [PubMed] [CrossRef]
19. Inal, B., Ilhan, E., Ilker, B., Altıntas, S. (2019). Transcriptome wide characterization of water deficit responsive grape mTERF transcription Behcet. Journal of Plant Biochemistry and Biotechnology, 29(1), 102–113. DOI https://doi.org/10.1007/s13562-019-00520-4 [Google Scholar] [CrossRef]
20. Babiychuk, E., Vandepoele, K., Wissing, J., Garcia-Diaz, M., de Rycke, R. et al. (2011). Plastid gene expression and plant development require a plastidic protein of the mitochondrial transcription termination factor family. Proceedings of the National Academy of Sciences, 108(16), 6674–6679. https://doi.org/10.1073/pnas.1103442108 [Google Scholar] [PubMed] [CrossRef]
21. Tang, H., Bowers, J. E., Wang, X., Ming, R., Alam, M. et al. (2008). Synteny and collinearity in plant genomes. Science, 320(5875), 486–488. https://doi.org/10.1126/science.1153917 [Google Scholar] [PubMed] [CrossRef]
22. Zhao, Y., Cai, M., Zhang, X., Li, Y., Zhang, J. et al. (2014). Genome-wide identification, evolution and expression analysis of mTERF gene family in maize. PLoS One, 9(4), e94126. https://doi.org/10.1371/journal.pone.0094126 [Google Scholar] [PubMed] [CrossRef]
23. Kleine, T. (2012). Arabidopsis thaliana mTERF proteins: Evolution and functional classification. Frontiers in Plant Science, 3, 233. [Google Scholar] [PubMed]
24. Lamesch, P., Berardini, T. Z., Li, D., Swarbreck, D., Wilks, C. et al. (2012). The arabidopsis information resource (TAIRImproved gene annotation and new tools. Nucleic Acids Research, 40, 1202–1210. [Google Scholar]
25. Jarvis, D. E., Ho, Y. S., Lightfoot, D. J., Schmöckel, S. M., Li, B. et al. (2012). The genome of Chenopodium quinoa. Nature, 542(7641), 307–312. https://doi.org/10.1038/nature21370 [Google Scholar] [PubMed] [CrossRef]
26. Letunic, I., Doerks, T., Bork, P. (2012). SMART 7: Recent updates to the protein domain annotation resource. Nucleic Acids Research, 40, D302–D305. https://doi.org/10.1093/nar/gkr931 [Google Scholar] [PubMed] [CrossRef]
27. Hu, B., Jin, J. P., Guo, A. Y., Zhang, H., Luo, J. C. et al. (2015). GSDS 2.0: An upgraded gene features visualization server. Bioinformatics, 31(8), 1296–1297. [Google Scholar] [PubMed]
28. Yang, S., Arguello, J. R., Li, X., Ding, Y., Zhou, Q. et al. (2008). Repetitive element-mediated recombination as a mechanism for new gene origination in Drosophila. PLoS Genetics, 4(1), e3. https://doi.org/10.1371/journal.pgen.0040003 [Google Scholar] [PubMed] [CrossRef]
29. Voorrips, R. E. (2002). MapChart: Software for the graphical presentation of linkage maps and QTLs. The Journal of Heredity, 93(1), 77–78. https://doi.org/10.1093/jhered/93.1.77 [Google Scholar] [PubMed] [CrossRef]
30. Tamura, K., Peterson, D., Peterson, N., Stecher, G., Nei, M. et al. (2011). MEGA5: Molecular evolutionary genetics analysis using maximum likelihood, evolutionary distance, and maximum parsimony methods. Molecular Biology and Evolution, 28(10), 2731–2739. https://doi.org/10.1093/molbev/msr121 [Google Scholar] [PubMed] [CrossRef]
31. Hajyzadeh, M., Cavusoglu, A., Sulusoglu, M., Unver, T. (2013). DNA SSR fingerprinting analysis among cherry laurel (Prunus laurocerasus L.) types. Journal of Food, Agriculture, and Environment, 11(2), 630–638. [Google Scholar]
32. Yildiz, A., Hajyzadeh, M., Ozbek, K., Nadeem, M. A., Hunter, D. (2021). Molecular characterisation of the oldest domesticated Turkish einkorn wheat landraces with simple sequence repeat (SSR) markers. Biotechnology and Biotechnological Equipment, 35(1), 1291–1300. https://doi.org/10.1080/13102818.2021.1970023 [Google Scholar] [CrossRef]
33. Bailey, T. L., Williams, N., Misleh, C., Li, W. W. (2006). MEME: Discovering and analyzing DNA and protein sequence motifs. Nucleic Acids Research 1, 34, 369–373. https://doi.org/10.1093/nar/gkl198 [Google Scholar] [PubMed] [CrossRef]
34. Ilhan, E., Büyük, I., Inal, B. (2018). Transcriptome–Scale characterization of salt responsive bean TCP transcription factors. Gene, 642, 64–73. https://doi.org/10.1016/j.gene.2017.11.021 [Google Scholar] [PubMed] [CrossRef]
35. Quevillon, E., Silventoinen, V., Pillai, S., Harte, N., Mulder, N. et al. (2005). InterProScan: protein domains identifier. Nucleic Acids Research, 33, 116–120. https://doi.org/10.1093/nar/gki442 [Google Scholar] [PubMed] [CrossRef]
36. Crooks, G. E., Hon, G., Chandonia, J. M., Brenner, S. E. (2004). WebLogo: A sequence logo generator. Genome Research, 14(6), 1188–1190. https://doi.org/10.1101/gr.849004 [Google Scholar] [PubMed] [CrossRef]
37. Lescot, M., Dehais, P., Thijs, G., Marchal, K., Moreau, Y. et al. (2002). PlantCARE, a database of plant cis-acting regulatory elements and a portal to tools for in silico analysis of promoter sequences. Nucleic Acids Research, 30(1), 325–327. [Google Scholar] [PubMed]
38. Chen, C. J., Chen, H., Zhang, Y., Thomas, H. R., Frank, M. H. et al. (2020). TBtools: An integrative toolkit developed for interactive analyses of big biological data. Molecular Plant, 13(8), 1194–1202. [Google Scholar] [PubMed]
39. Yang, Z., Nielsen, R. (2000). Estimating synonymous and nonsynonymous substitution rates under realistic evolutionary models. Molecular Biology and Evolution, 17(1), 32–43. [Google Scholar] [PubMed]
40. Délano-Frier, J. P., Avilés-Arnaut, H., Casarrubias-Castillo, K., Casique-Arroyo, G., Castrillón-Arbeláez, P. A. et al. (2011). Transcriptomic analysis of grain amaranth (Amaranthus hypochondriacus) using 454 pyrosequencing: Comparison with A. tuberculatus, expression profiling in stems and in response to biotic and abiotic stress. BMC Genomics, 12(1), 363. https://doi.org/10.1186/1471-2164-12-363 [Google Scholar] [PubMed] [CrossRef]
41. Mortazavi, A., Williams, B. A., McCue, K., Schaeffer, L., Wold, B. (2008). Mapping and quantifying mammalian transcriptomes by RNA-Seq. Nature Methods, 5(7), 621–628. https://doi.org/10.1038/nmeth.1226 [Google Scholar] [PubMed] [CrossRef]
42. Zhu, H., Zhou, Y., Zhai, H., He, S., Zhao, N. et al. (2020). A novel sweetpotato WRKY transcription factor, IbWRKY2, positively regulates drought and salt tolerance in transgenic arabidopsis. Biomolecules, 10(4), 506. https://doi.org/10.3390/biom10040506 [Google Scholar] [PubMed] [CrossRef]
43. Dong, Q., Duan, D., Zheng, W., Huang, D., Wang, Q. et al. (2021). Overexpression of MdVQ37 reduces drought tolerance by altering leaf anatomy and SA homeostasis in transgenic apple. Tree Physiology, 42(1), 160–174. https://doi.org/10.1093/treephys/tpab098 [Google Scholar] [PubMed] [CrossRef]
44. Zhang, C., Wang, J., Long, M., Fan, C. (2013). gKaKs: The pipeline for genome-level Ka/Ks calculation. Bioinformatics, 29(5), 645–646. https://doi.org/10.1093/bioinformatics/btt009 [Google Scholar] [PubMed] [CrossRef]
45. Wang, J., Zhou, J., Zhang, B., Vanitha, J., Ramachandran, S. et al. (2011). Genomewide expansion and expression divergence of the basic leucine zipper transcription factors in higher plants with an emphasis on sorghum. Journal of Integrative Plant Biology, 53(3), 212–231. https://doi.org/10.1111/j.1744-7909.2010.01017.x [Google Scholar] [PubMed] [CrossRef]
46. Mehan, M. R., Freimer, N. B., Ophoff, R. A. (2004). A genome-wide survey of segmental duplications that mediate common human genetic variation of chromosomal architecture. Human Genomics, 1(5), 335–344. https://doi.org/10.1186/1479-7364-1-5-335 [Google Scholar] [PubMed] [CrossRef]
47. Magadum, S., Banerjee, U., Murugan, P., Gangapur, D., Ravikesavan, R. (2013). Gene duplication as a major force in evolution. Journal of Genetics, 92(1), 155–161. [Google Scholar] [PubMed]
48. Kleine, T. (2012). Arabidopsis thaliana mTERF proteins: Evolution and functional classification. Frontiers in Plant Science, 3, 233. [Google Scholar] [PubMed]
49. Lijavetzky, D., Carbonero, P., Vicente-Carbajosa, J. (2003). Genomewide comparative phylogenetic analysis of the rice and Arabidopsis Dof gene families. BMC Ecology and Evolution, 3(1), 17. https://doi.org/10.1186/1471-2148-3-17 [Google Scholar] [PubMed] [CrossRef]
50. Xu, D., Leister, D., Kleine, T. (2017). Arabidopsis thaliana mTERF10 and mTERF11, but not mTERF12, are involved in the response to salt stress. Frontiers in Plant Science, 8, 1213. [Google Scholar] [PubMed]
51. Huang, S. Y., Qiu, S. J., Che, J. Y., Chen, J. P., Li, X. Y. et al. (2016). Advances of mTERF protein family. Life Science Research, 20, 455–459. [Google Scholar]
52. Kim, M., Lee, U., Small, I., des Francs-Small, C. C., Vierling, E. (2012). Mutations in an Arabidopsis mitochondrial transcription termination factor-related protein enhance thermotolerance in the absence of the major molecular chaperone HSP101. Plant Cell, 24(8), 3349–3365. https://doi.org/10.1105/tpc.112.101006 [Google Scholar] [PubMed] [CrossRef]
53. Yin, X., Gao, Y., Song, S., Hassani, D., Lu, J. (2021). Identification, characterization and functional analysis of grape (Vitis vinifera L.) mitochondrial transcription termination factor (mTERF) genes in responding to biotic stress and exogenous phytohormone. BMC Genomics, 22(1), 136. https://doi.org/10.1186/s12864-021-07446-z [Google Scholar] [PubMed] [CrossRef]
Cite This Article
 Copyright © 2023 The Author(s). Published by Tech Science Press.
This work is licensed under a Creative Commons Attribution 4.0 International License , which permits unrestricted use, distribution, and reproduction in any medium, provided the original work is properly cited.
 Downloads
 Citation Tools