
 Submit a Paper
 Propose a Special lssue
 Open Access
ARTICLE
Quantitative Trait Loci (QTL) Mapping and Marker Analysis of Fatty Acids in Peanut
College of Agronomy, Jilin Agricultural University, Changchun, 130118, China
* Corresponding Authors: Jun Zhang. Email: ; Fenglou Ling. Email:
(This article belongs to the Special Issue: Integrating Agronomy and Plant Physiology for Improving Crop Production)
Phyton-International Journal of Experimental Botany 2023, 92(9), 2577-2589. https://doi.org/10.32604/phyton.2023.029440
Received 19 February 2023; Accepted 15 May 2023; Issue published 28 July 2023
 View Full Text
 Download PDF
Abstract
Peanut, with high oil content, has been a major oil and food crop globally. The compositions of the fatty acids are the common factors in determining the oil quality. In the present study, an F2 segregated population with 140 individuals derived from the cross of Weihua8 (a cultivar) and 12L49 (a line with high oleic acid concentration) was used to construct a genetic map and conduct QTL mapping analysis. A total of 103 polymorphic SSR primers were utilized for genotyping the RILs and finally generating the SSR loci. Within the 103 SSR loci, a genetic linkage map, covering a total length of 3592.35 cM of the whole peanut genome, was constructed. Based on the genetic map, sixteen QTLs located on nine linkage groups related to peanut fatty acids were finally identified. Among them, four QTLs were detected associated with various traits simultaneously, which showed genetic stability in relation to fatty acids of peanut. Except for the QTLs for oleic acid, linoleic acid, and linolenic acid, three novel QTLs for arachidic acid and behenic acid were also detected. These QTLs might be helpful for further fine mapping analysis and marker-assisted selection of fatty acids in peanut.Keywords
The cultivated peanut (Arachis hypogaea L., AABB 2n = 4x = 40) is a major oil crop mainly grown in semiarid tropic regions of the countries in Asia, Africa, and the Americas. Among them, China, India, and the United States are the leading producers, accounting for 70% of the total peanut production worldwide [1]. However, the principal usage of peanuts in different countries shows various significance. For instance, in China and India, peanuts are primarily used for crushing oil, and in the United States, they are mainly made into edible products [2]. Therefore, breeding specific peanut cultivars with appropriate oil content for diverse objectives can be of key importance in agricultural production.
Commonly, peanut seeds contain approximately 50% oil content and can also be lower than 40% [3]. The major fatty acids, including oleic (C18:1) and linoleic acid (C18:2), account for nearly 80% of the total peanut oil, while palmitic acid (C16:0), stearic acid (C18:0), arachidic acid (C20:0), gadoleic acid (C20:1), behenic acid (C22:0), and lignoceric acid (C24:0) are the minor fatty acids occupying the other 20% of the oil [4]. The reasonable composition of fatty acids (ratio of saturated, monounsaturated, and polyunsaturated lipids), to a large extent, determines the shelf life, stability, and nutritional quality of peanut and peanut-related products [5,6], further improving human health [7,8]. In general, a higher ratio of oleic to linoleic acid (O/L ratio) is the most desired quality trait not only for the manufacturers to increase the shelf life but also for the consumers in terms of its health benefits. In the 1980s, the first high oleic peanut lines (F435-2-1 and F435-2-2), with oleic levels comparable to that of olive oil, were identified, and till now, numerous high oleic cultivars have been developed, with F435 as the high oleic donor [9–12]. However, the challenge for the peanut breeding program still exists, especially for targeting the ratios of various fatty acids [13].
Recently, molecular markers have been used in discovering quantitative trait loci (QTL) or chromosomal regions for many agronomic, disease resistance, and quality‑related traits in peanuts for the development of marker-assisted selection (MAS) [1,14–20]. When molecular markers are enough for constructing genetic maps, linkage mapping on the basis of segregating populations derived from bi-parental crossing is still the most popular and successful strategy to identify QTLs in peanut. Among the markers, simple sequence repeat (SSR), with the features of codominant heritability, genome-wide dispersal, and simple amplification, was the best choice in QTL mapping [21]. Based on the SSR markers, Cherif et al. [13] detected 78 main-effect QTLs (M-QTLs) and 10 epistatic QTLs (E-QTLs) for oil content and oil quality traits. Wang et al. [1] used two recombinant inbred line (RIL) populations and identified 34 major QTLs (>10% of phenotypic variation (PVE) that were mapped on five linkage groups; additionally, 28 clusters containing more than three QTLs were also found.
In the present study, an F2 segregated population with 140 individuals derived from the cross of Weihua 8 (a cultivar) and 12L49 (a line with high oleic acid concentration) was used and aimed to (i) identify the correlations among saturated and unsaturated fatty acids, (ii) construct a molecular genetic map of peanut, and (iii) conduct QTL mapping for fatty acid-related traits.
2.1 Plant Materials, Phenotype Determination, and DNA Isolation
An F2 segregated population, derived from the cross of Weihua8 (a cultivar) and 12L49 (a line with high oleic acid concentration) was used to investigate phenotype and construct a linkage map. These samples were planted in a single 4.5 m long row with a 10 cm distance between plants and 0.65 m distance between the rows. Ten plants from each row were randomly collected and used to measure the oil, protein, and fatty acid levels using the near-infrared spectrum instrument (NIRS, NIRFIex N-500) when the seeds were fully mature. Each determination was repeated three times, with the mean value used as the content of each component. The basic statistics of the minimum, maximum, mean, standard deviation and coefficient of variation were analyzed in the parent and parent of the F2 population and the offspring, and the correlation between the fatty acid components using SPSS 19 software. The total genomic DNA was extracted from the young leaves of the two parents and 140 F2 RILs via a modified cetyltrimethyl ammonium bromide method [22]. The integrity and quality of the DNA were evaluated on a 1% agarose gel, and the purity and quantity were detected using the nucleic acid protein detector 0.
2.2 Marker Polymorphism and Polymerase Chain Reaction (PCR) Performance
In total, 429 SSR markers selected from the published research were used to screen the polymorphism between the two parental genotypes, and the identified polymorphic SSRs were subsequently used for genotyping the F2 population. The PCR reaction for SSR markers, each of 10 μl, contained 0.5 μl of genomic DNA (100 ng/μl), 5 μl of 2 × Taq PCR StarMix polymerase, 1 μl of both primers (10 μM), and 3.5 μl of double-distilled water. The cycling conditions were set as 94°C for 3 min, 35 cycles at 94°C for 1 min, 55°C for 1 min, and 72°C for 1.5 min and a final extension at 72°C for 10 min. The PCR products were then separated on a 6% polyacrylamide gel and visualized by silver staining [23].
2.3 Construction of a Genetic Linkage Map
When an SSR marker was co-dominant, the band type derived from the female parent was marked “A”, the one from the male parent was marked “B”, the heterozygous type was marked “H”, and the missing one was marked “-”. When an SSR marker was dominant and contributed by the female parent, the band type from the female parent was marked “D”, the one from the male parent was marked “B”, and the missing one was marked “-”. Similarly, when an SSR marker was dominant and contributed by the male parent, the band type from the male parent was marked “A”, the one from the female parent was marked “R”, and the missing one was marked “-”. A linkage map was obtained using the QTL IciMapping software [24]. The recombination ratio was converted to genetic distance using Kosambi’s mapping function [25].
2.4 QTL Analysis of Fatty Acids in Peanut
Based on the constructed genetic map, QTL analysis was carried out using QTL IciMapping4.1 software, and the LOD threshold value was set as 2.0. The QTL mapping of fatty acids was performed with the genotype data via the inclusive composite interval mapping (ICIM) method.
3.1 Phenotypic Characteristics and the Correlation among the Parents and F2 Separated Population
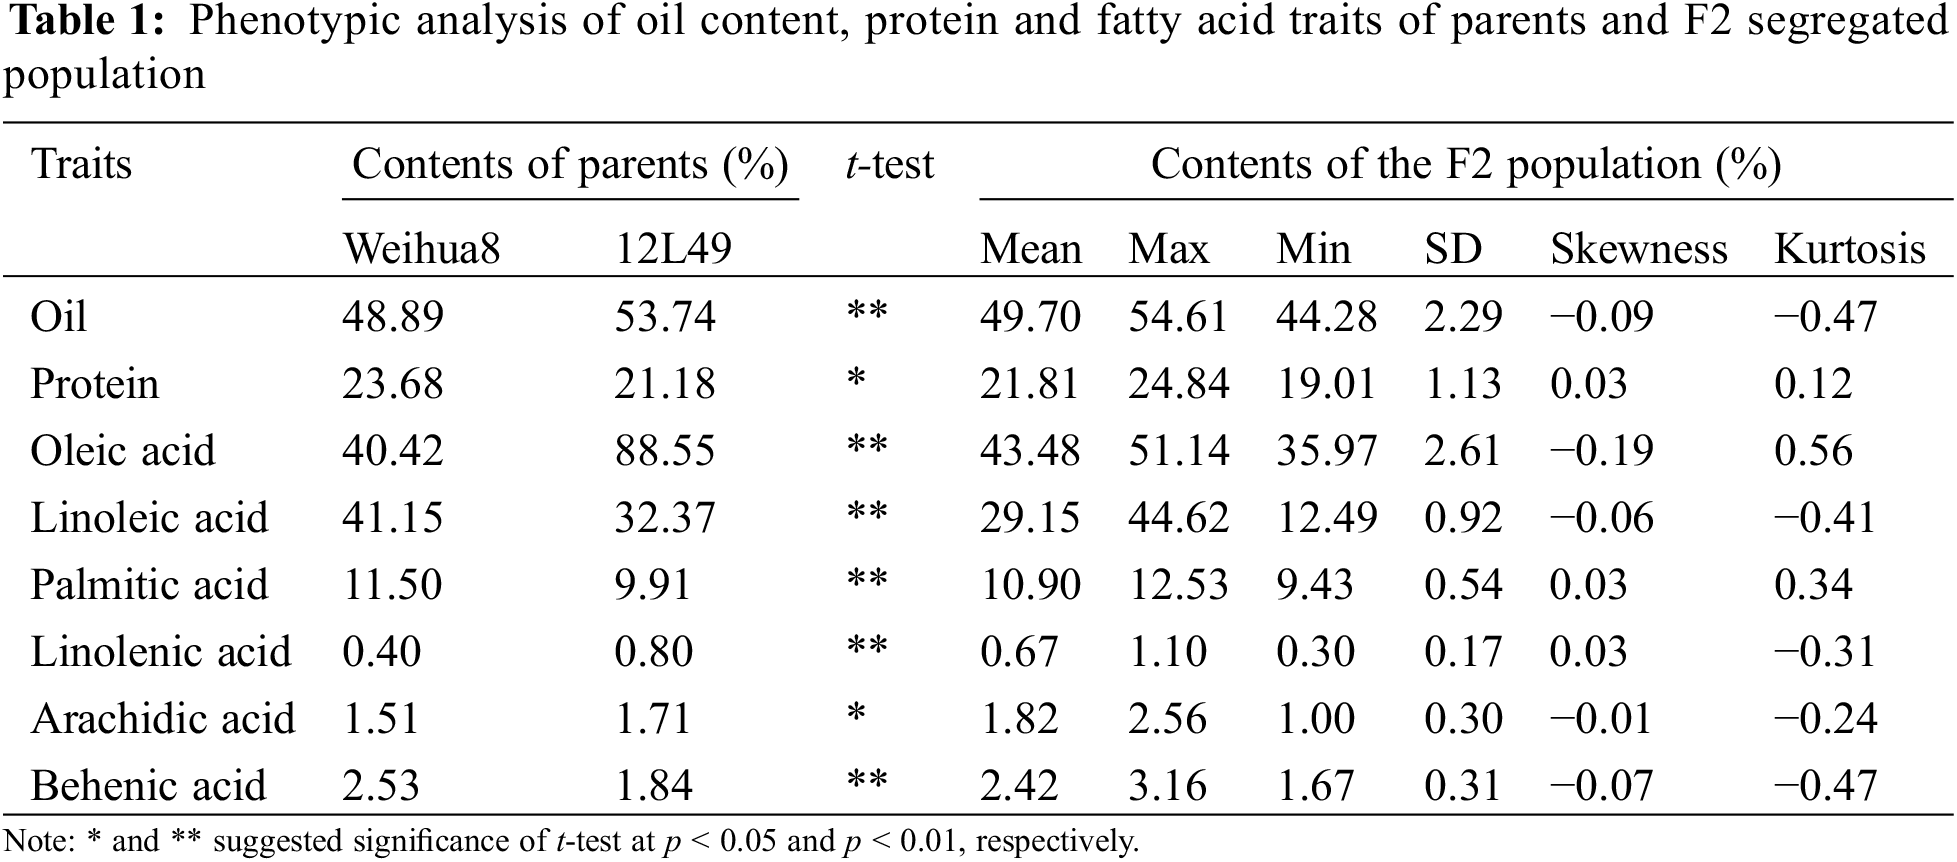
In this study, the oil, protein, and fatty acid contents (including oleic acid, linoleic acid, palmitic acid, linolenic acid, arachidic acid, and behenic acid) of the mature seeds among the two parents and the F2 segregated population were evaluated. As shown in Fig. 1 and Table 1, significant differences existed in these traits between Weihua8 and 12L49. In the F2 progeny population, the variations on these traits exceeded the parents, exhibiting transgressive segregation. Additionally, a continuous variation and a near-normal distribution with no significant skewness and kurtosis were observed among all the traits, indicating that these were the typical quantitative traits and that the results were suitable for the subsequent QTL analysis (Fig. 1 and Table 1).
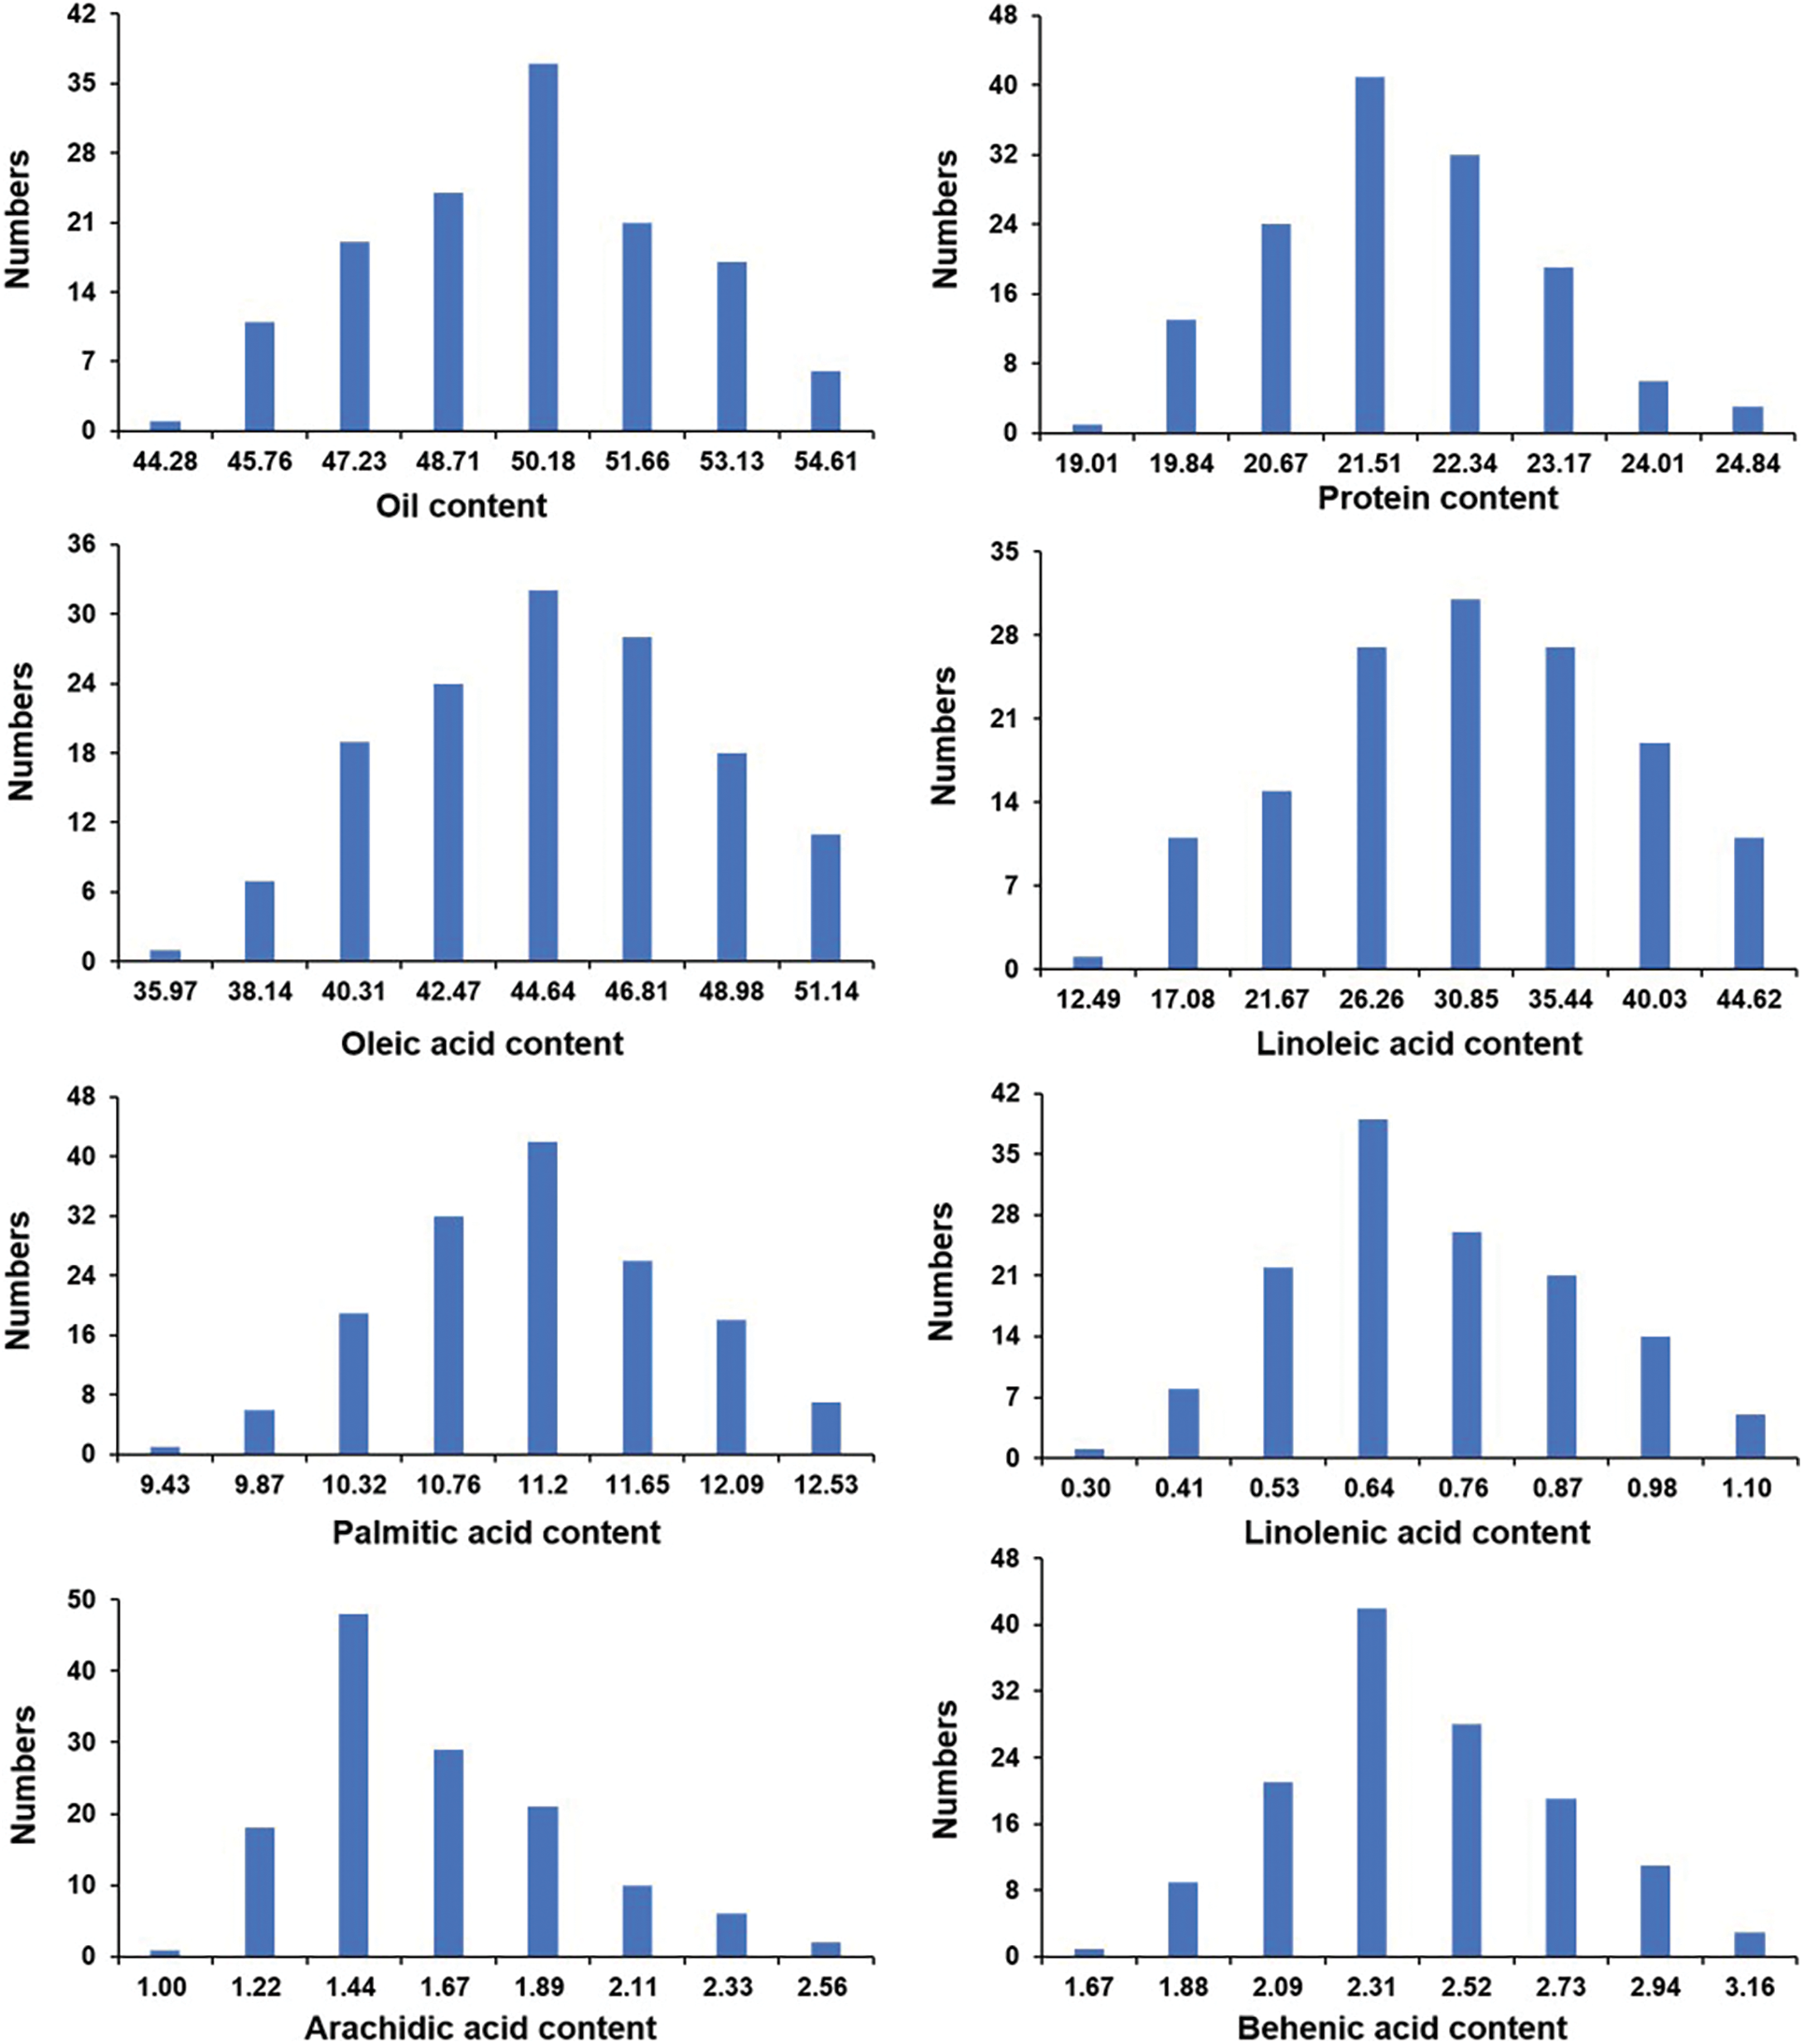
Figure 1: Distribution of fatty acids contents among F2 segregated population
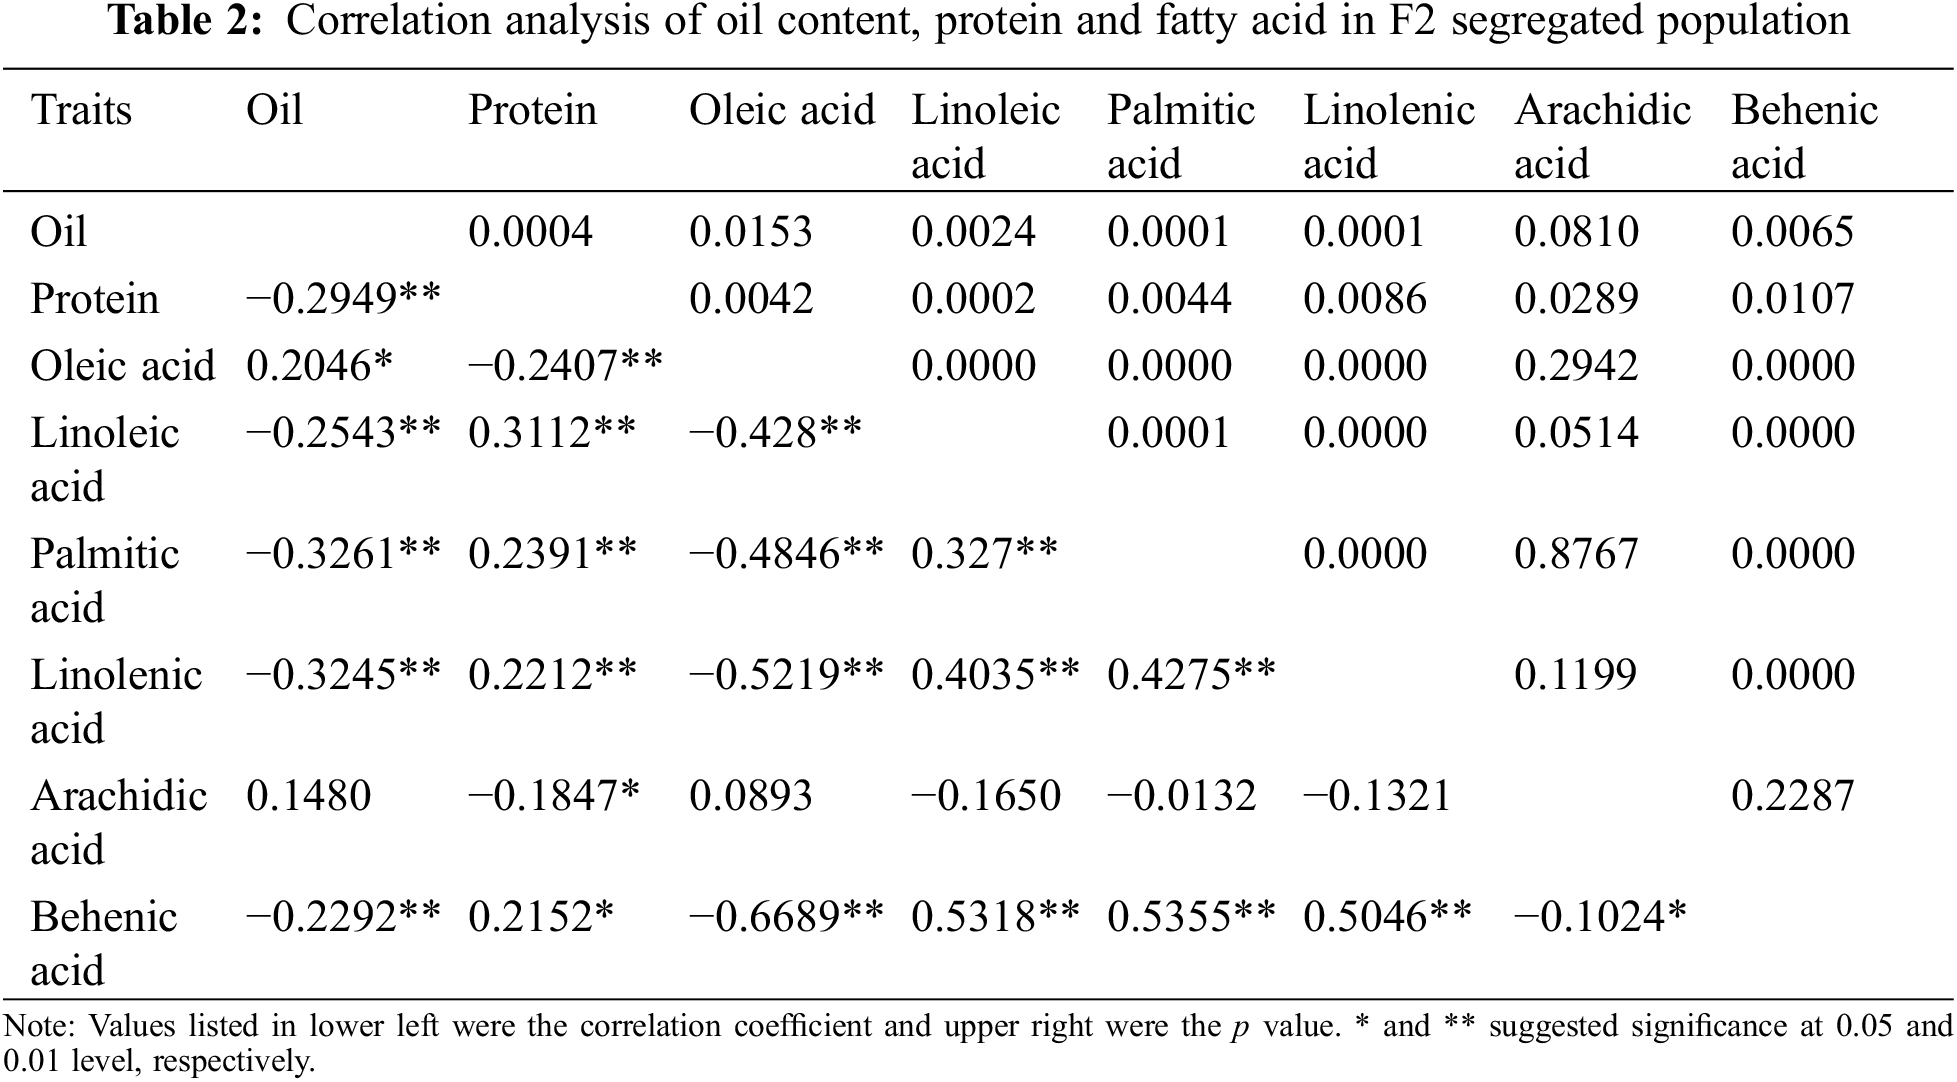
As summarized in Table 2, pairwise correlation analysis on these traits in the F2 population showed a similar trend in trait association (Table 2). Significant positive correlations were observed between linoleic acid and palmitic acid, linolenic acid, and behenic acid (r = 0.327, 0.4035, and 0.5318, respectively), as well as between oleic acid and oil content (r = 0.2046). Palmitic acid showed a positive correlation with linolenic acid (r = 0.4275) and behenic acid (r = 0.5355), and a positive correlation also existed between linolenic acid and behenic acid (r = 0.5046). On the other hand, significant negative correlations were found between oil content and linoleic acid, palmitic acid, linolenic acid, and behenic acid (r = −0.2543, −0.3261, −0.3245, and −0.2292, respectively). Additionally, oleic acid negatively correlated with linoleic acid, palmitic acid, linolenic acid, and behenic acid (r = −0.428, −0.4846, −0.5219, and −0.6689, respectively).
3.2 Marker Polymorphisms and Genetic Map Construction and Integration
Here, a total of 429 pairs of SSR primers were used to screen the marker polymorphism. Out of them, 103 pairs were polymorphic between the parents Weihua8 and 12L49, which accounted for 24.01% of the total primers (Fig. 2 and Table 3). These 103 polymorphic SSR primers were then used for genotyping the 140 F2 RILs and finally generating the SSR loci (Table 3). A genetic linkage map, including the 103 SSR loci, was constructed, and it covered a total length of 3592.35 cM of the whole peanut genome with an average distance of 34.88 cM between the flanking markers (Fig. 3 and Table 3). These markers were unevenly distributed across different chromosomes (Chr.), and the numbers.
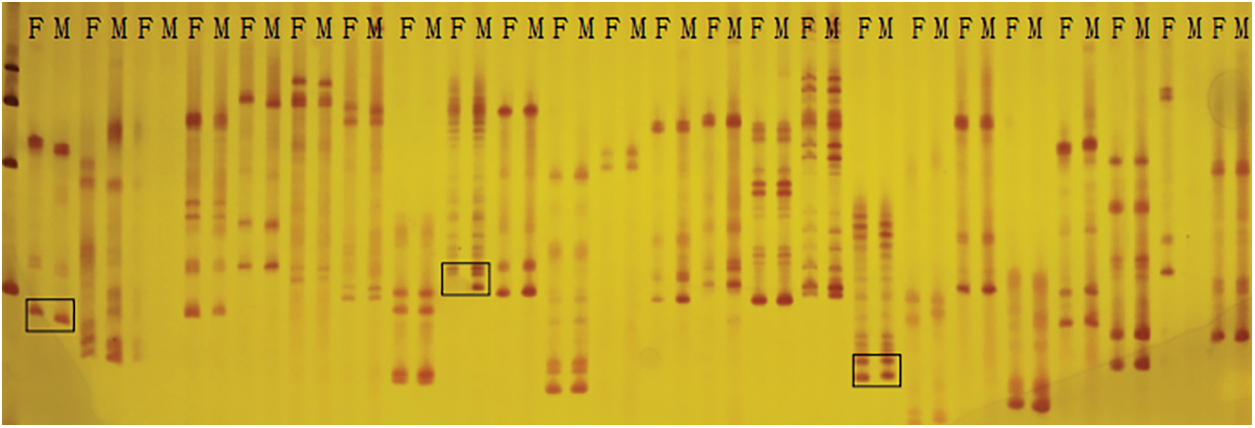
Figure 2: Part of screening results of SSR primers between parents
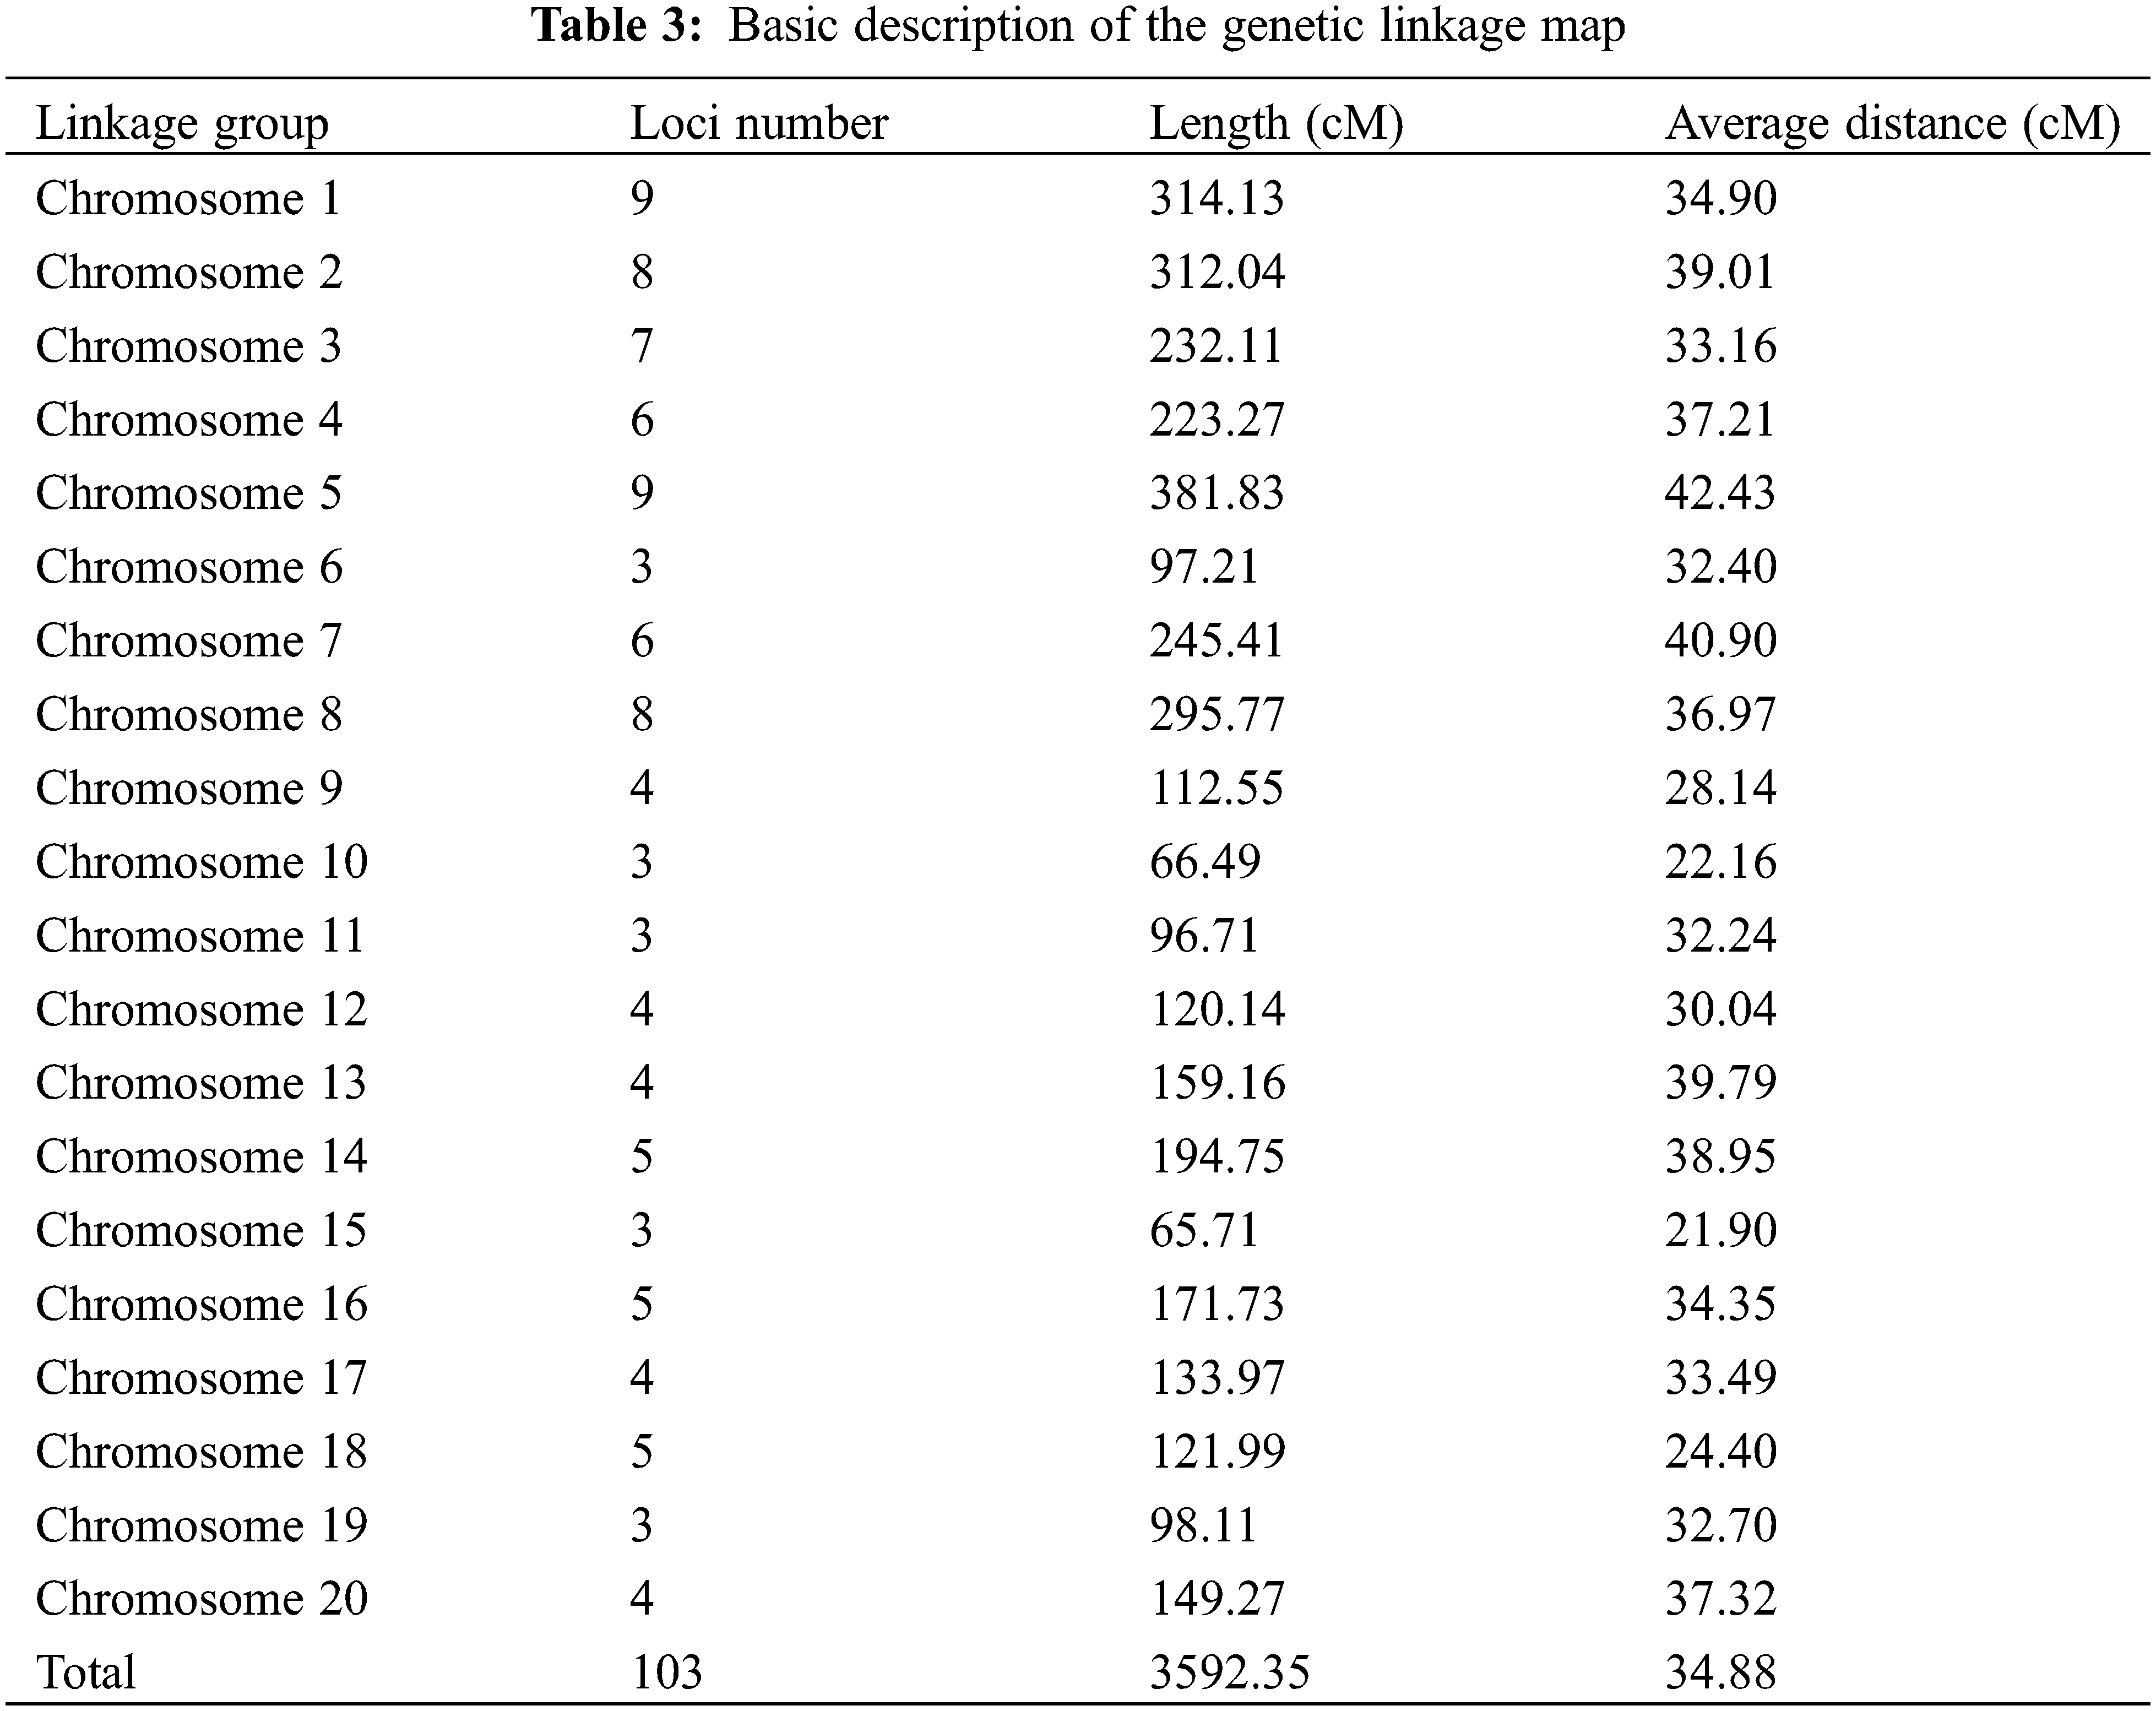
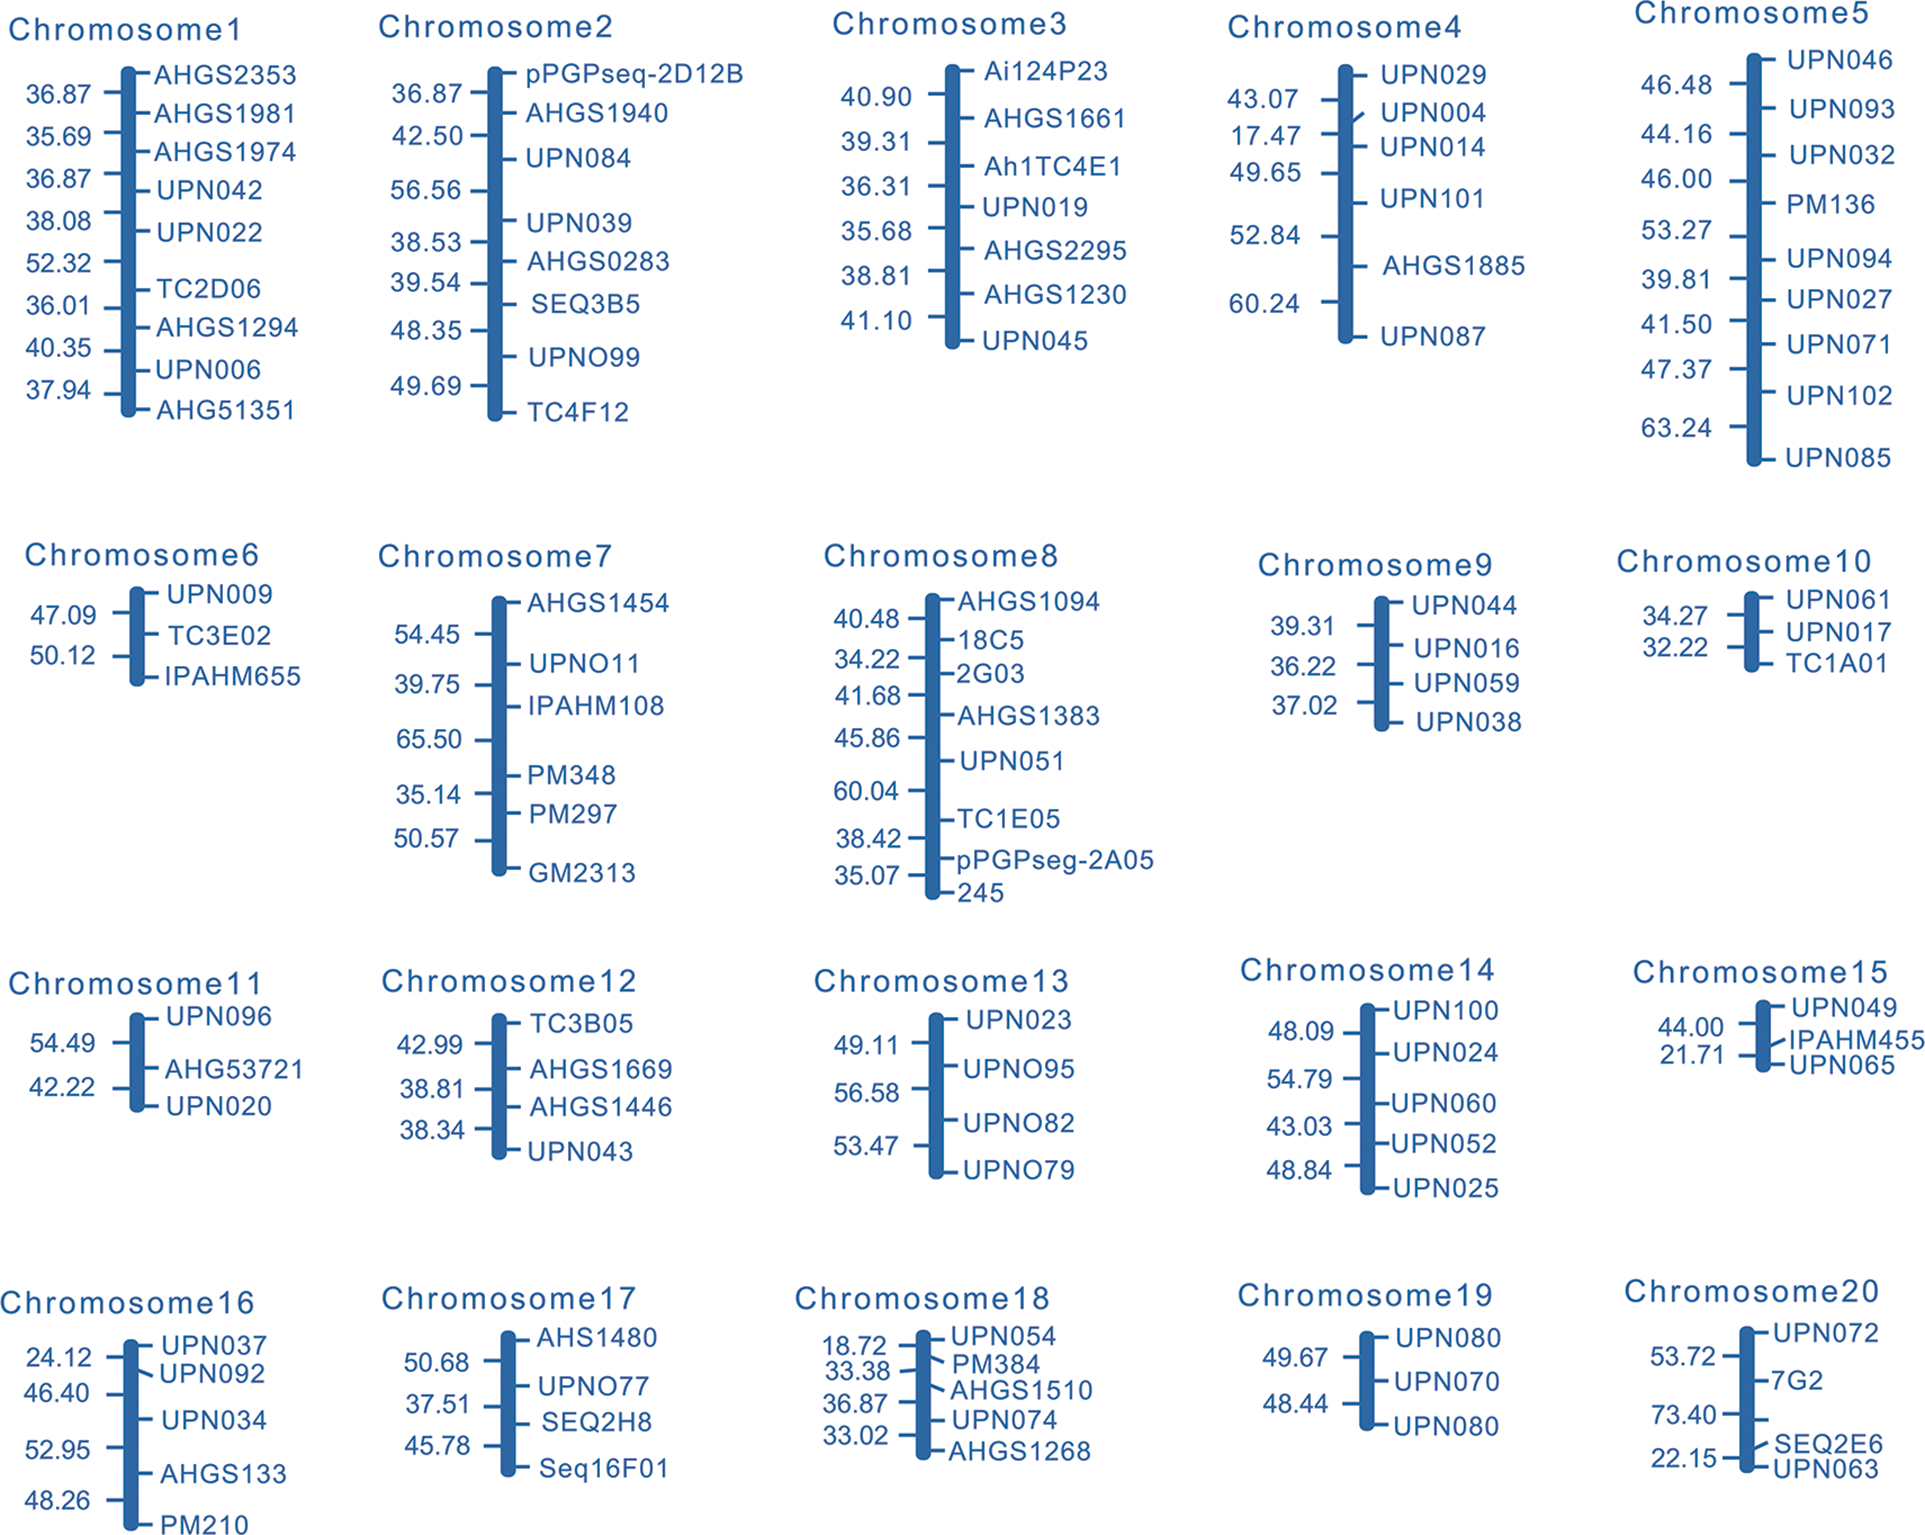
Figure 3: The genetic linkage map constructed in this study
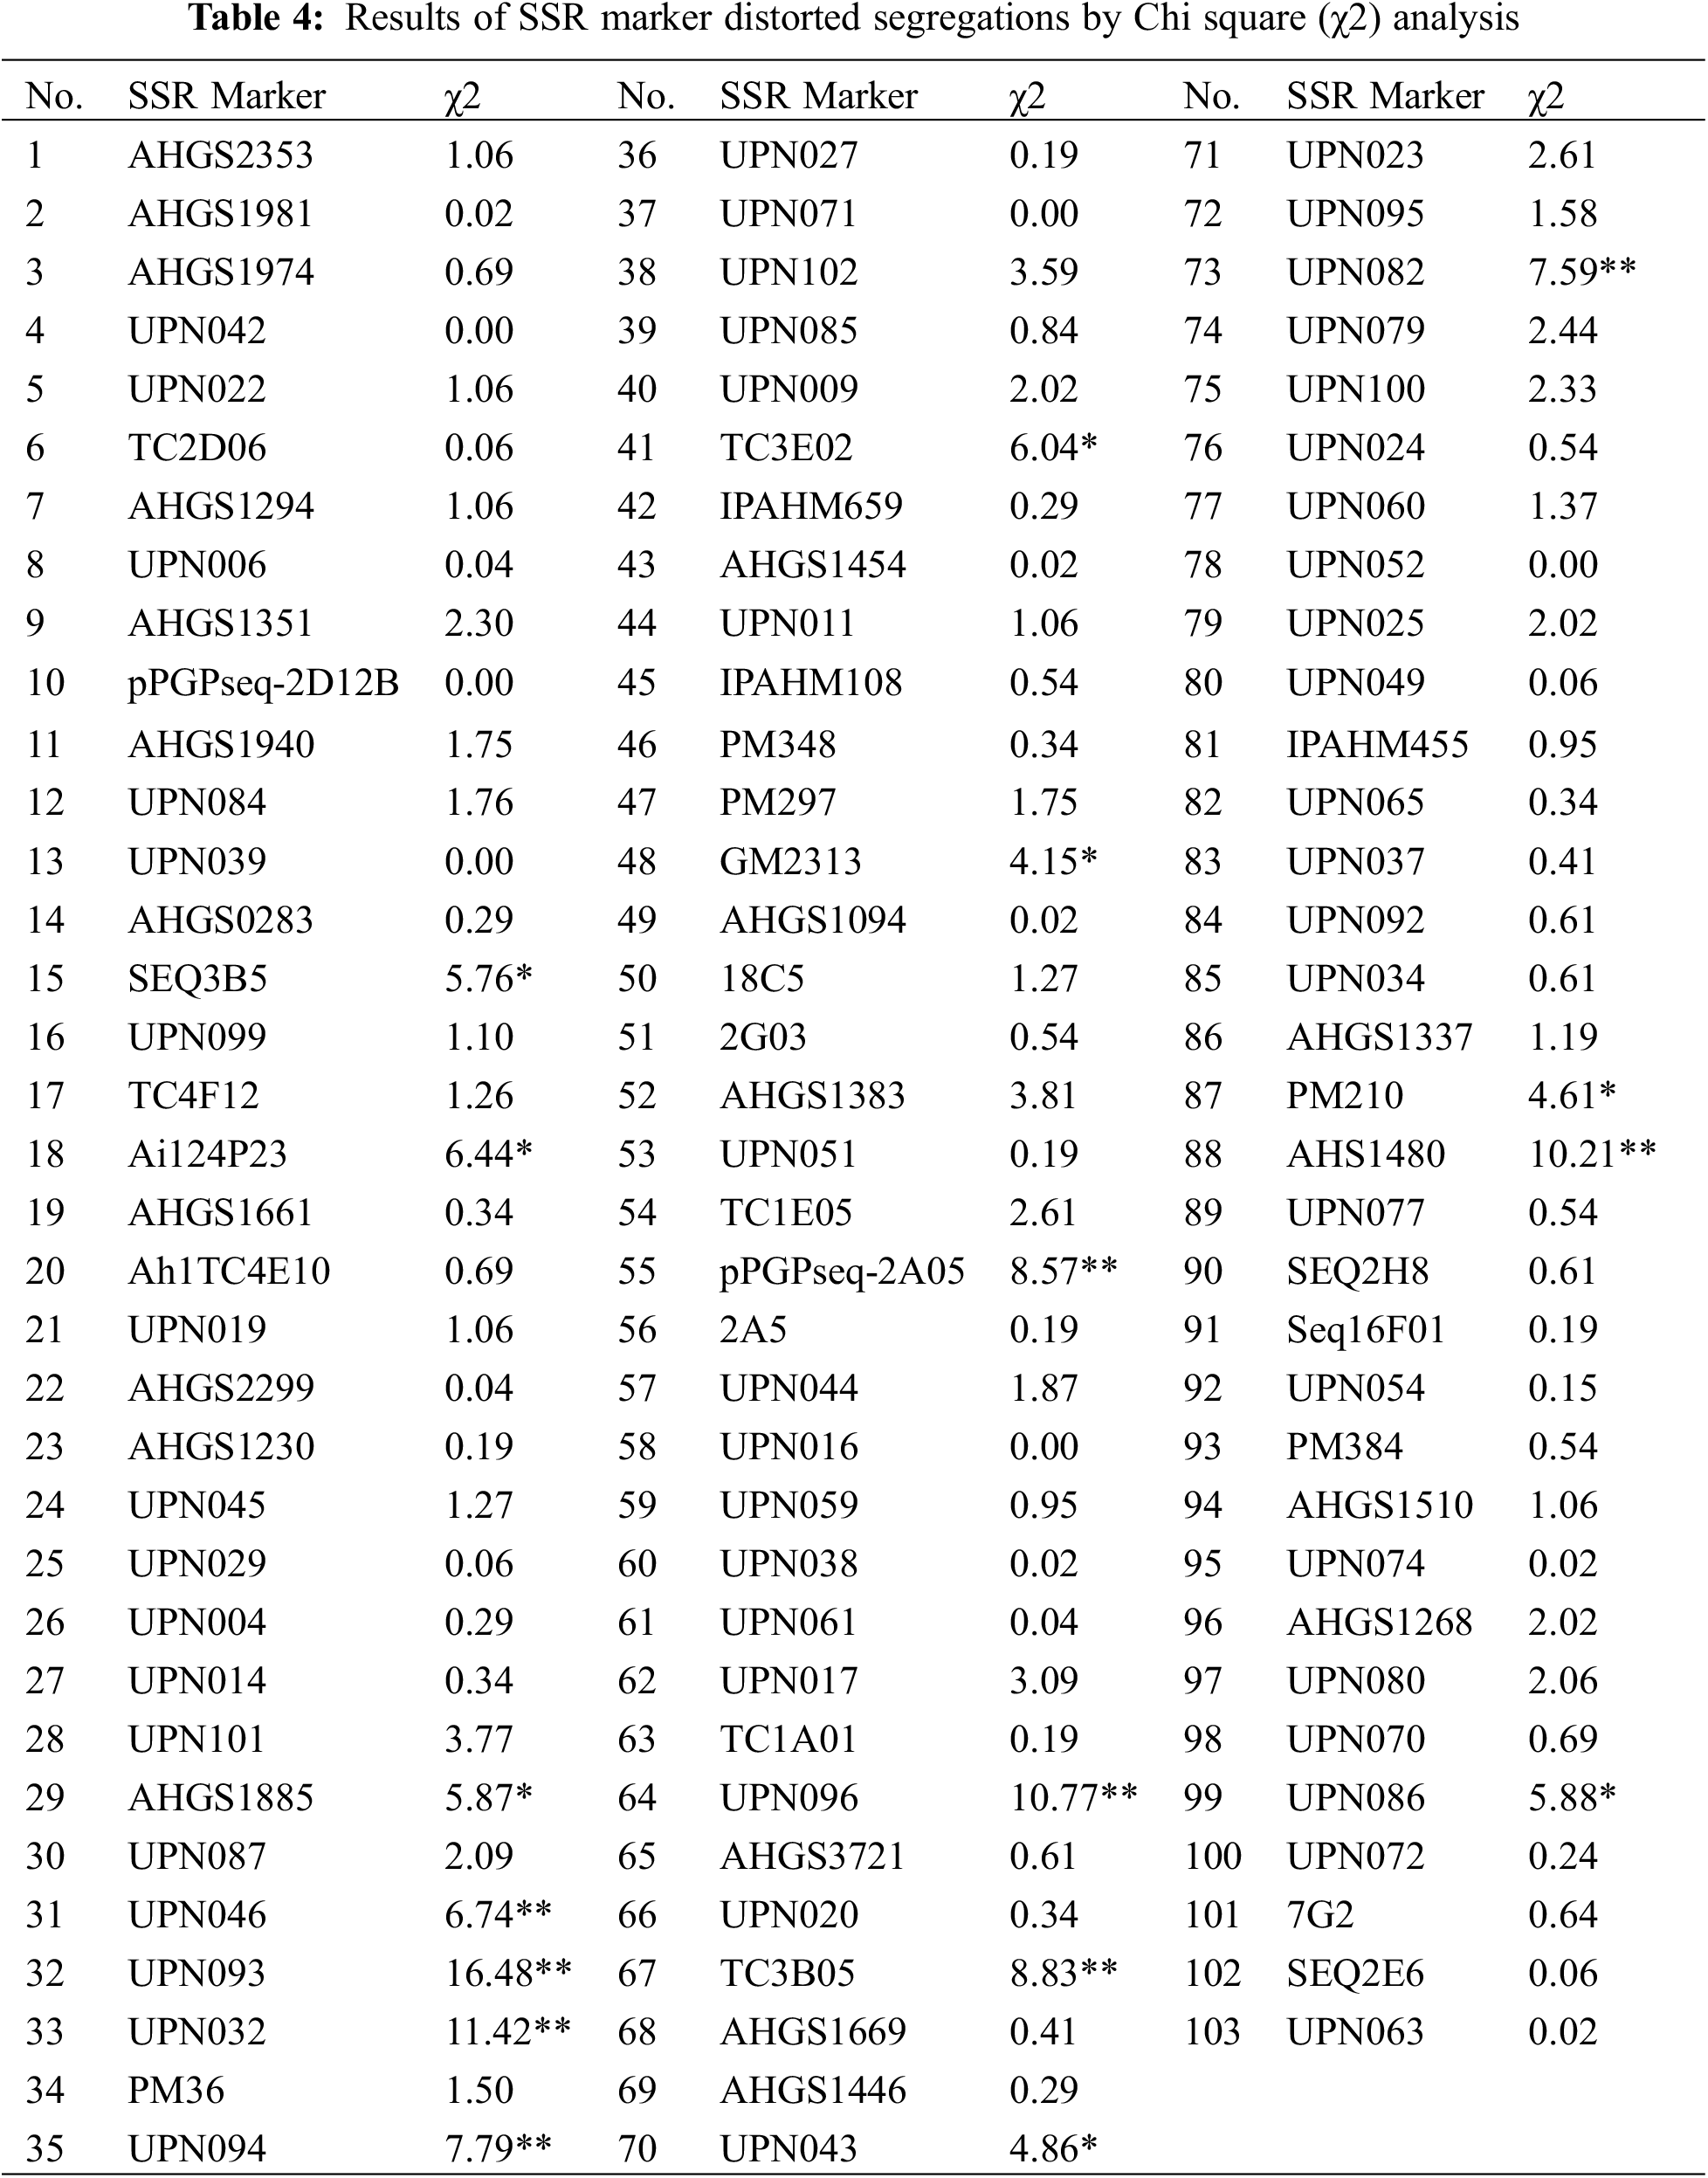
Were variant with the highest and lowest number of markers being nine (on Chr.01 and Chr.05) and three (on Chr.06, Chr.10, Chr.11, Chr.15, and Chr.19). In addition, the longest linkage group was on Chr.05 with a length of 381.83 cM, and the shortest one was on Chr.15 with 65.71 cM in length (Table 3). Compared with the published integrated genetic maps of peanut, the arrangement order of the markers on the linkage groups was generally consistent. Furthermore, a Chi-square (χ2) analysis for the goodness of fit was conducted to evaluate each SSR marker for the expected 1:1 segregation ratio (Table 4). The results showed that the segregation-distorted loci existed and varied among different linkage groups, except for the ones on Chr.01, Chr.09, Chr.10, Chr.14, Chr.15, Chr.18, and Chr.20. Among them, nine (p < 0.01) and seventeen (p < 0.05) segregation-distorted markers, which were either from the female or male parents, were tested and accounted for 8.74% and 16.50% of all the markers.
3.3 QTL Mapping for Fatty Acids of Peanut
Based on the genetic linkage map and associated phenotypic data, QTL analysis for fatty acids and other related traits of peanut was conducted via the inclusive composite interval mapping (ICIM) method implemented using QTL IciMapping4.1. A total of sixteen QTLs distributed on nine linkage groups were finally detected (Table 5). Among these QTLs, twelve of them were the fatty acid-related ones (oleic acid, 3 QTLs; linoleic acid, 2 QTLs; linolenic acid, 4 QTLs; arachidic acid, 2 QTLs; and behenic acid, 1 QTL), three QTLs were associated with oil content, and one QTL was related to protein. Moreover, some QTLs were simultaneously detected in various traits, which indicated that these QTLs might exhibit genetic stability in controlling fatty acid-related traits in peanut (Table 5). The PVE explained by these QTLs was analyzed, and for the fatty acids, the value was in the range of 2.62%–18.60% (Table 5). Additionally, LOD and additive effect analysis of one dimensional ICIM for fatty acid-related traits were also conducted. As shown in Fig. 4, most of the QTLs showed negative additive effects, except for the two loci (located on Chr.03 and Chr.05) associated with linolenic acid.
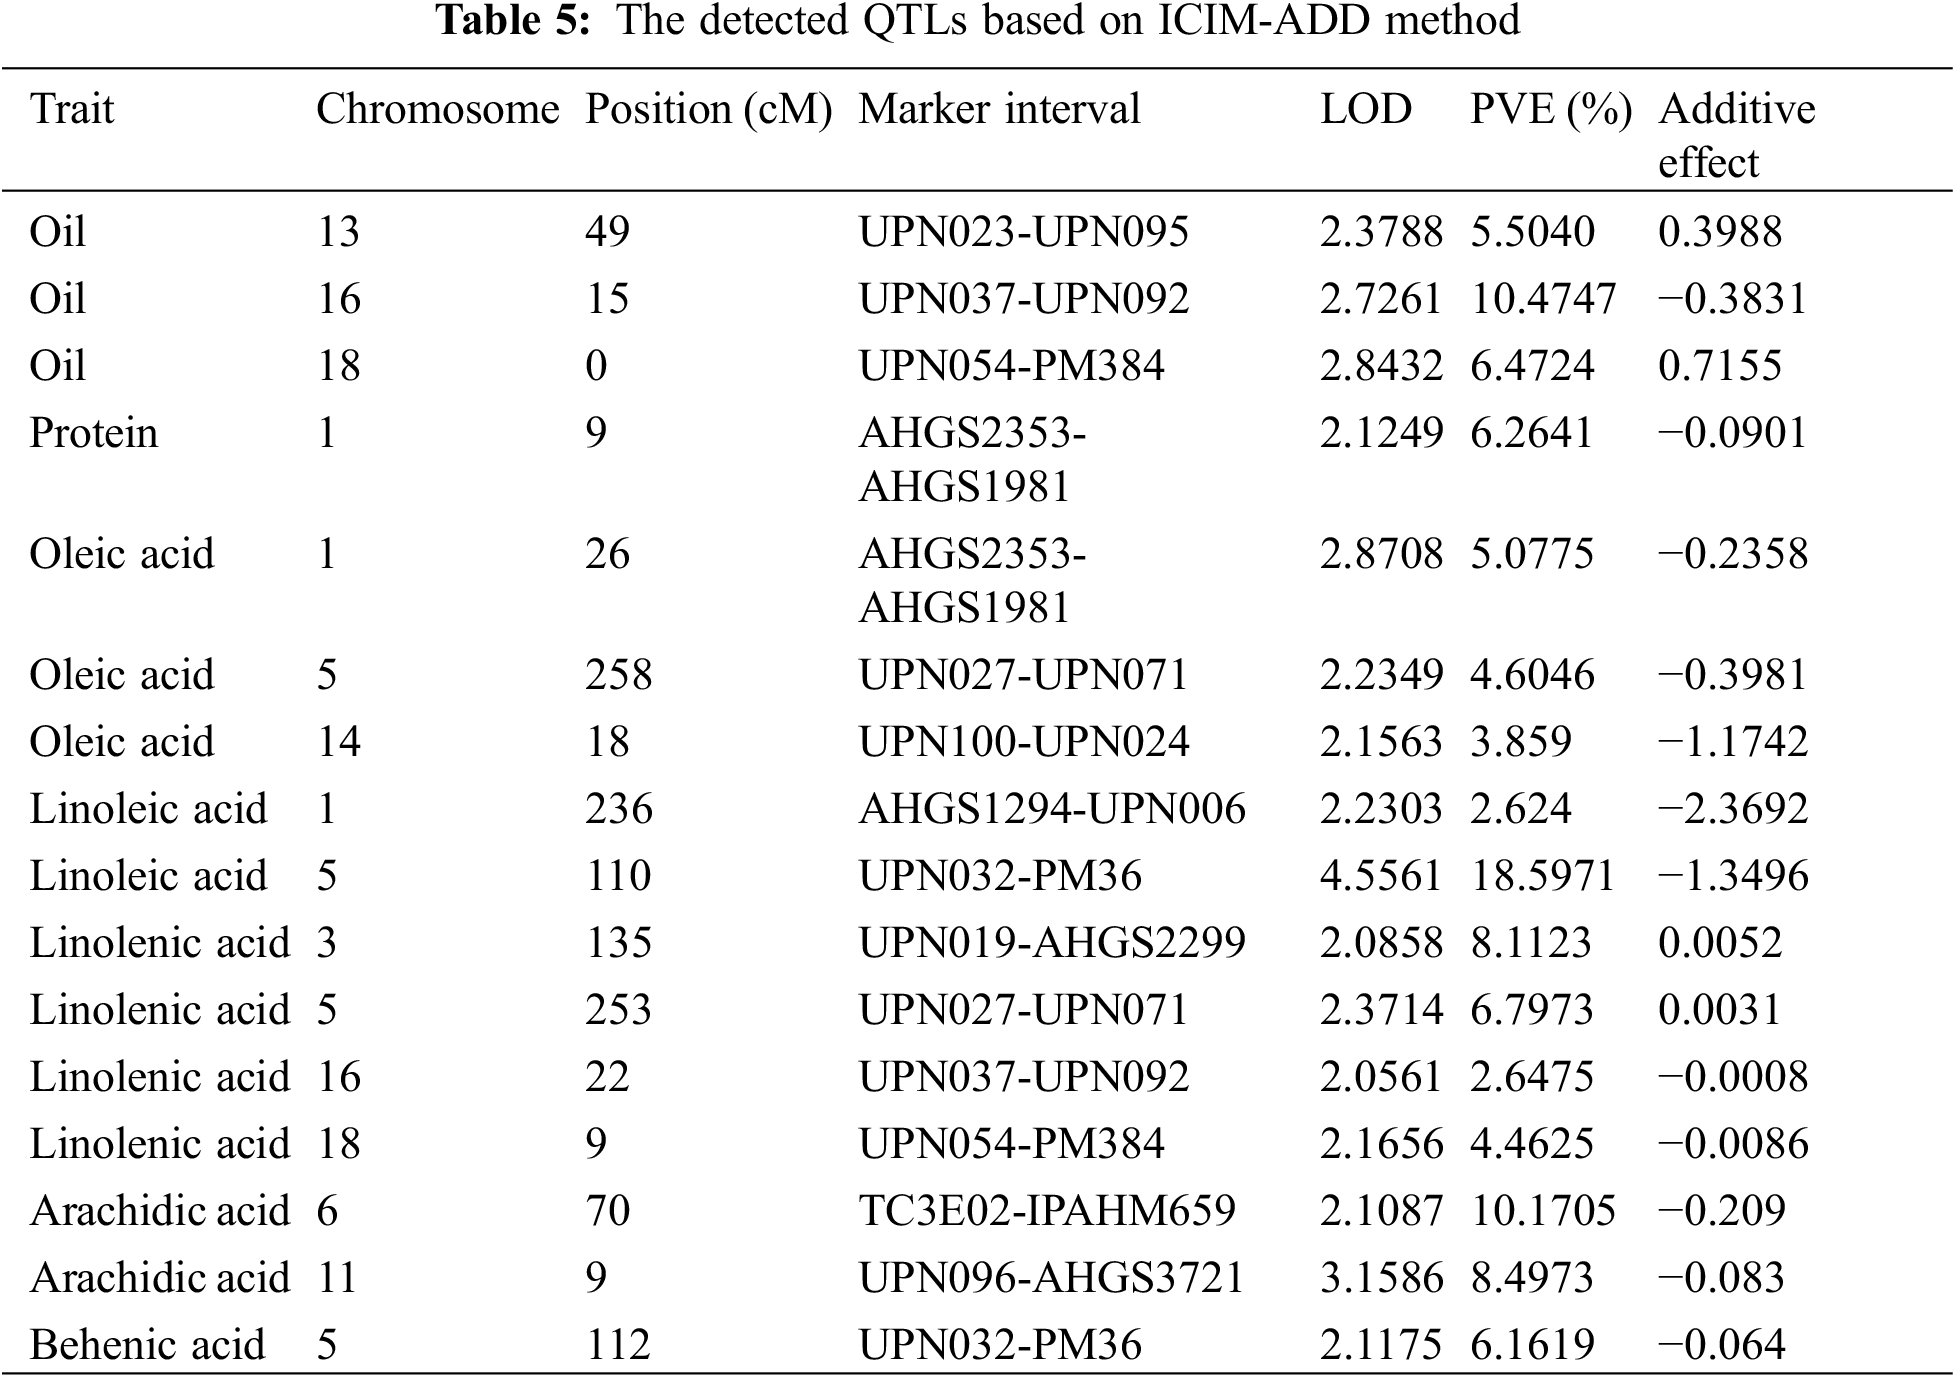
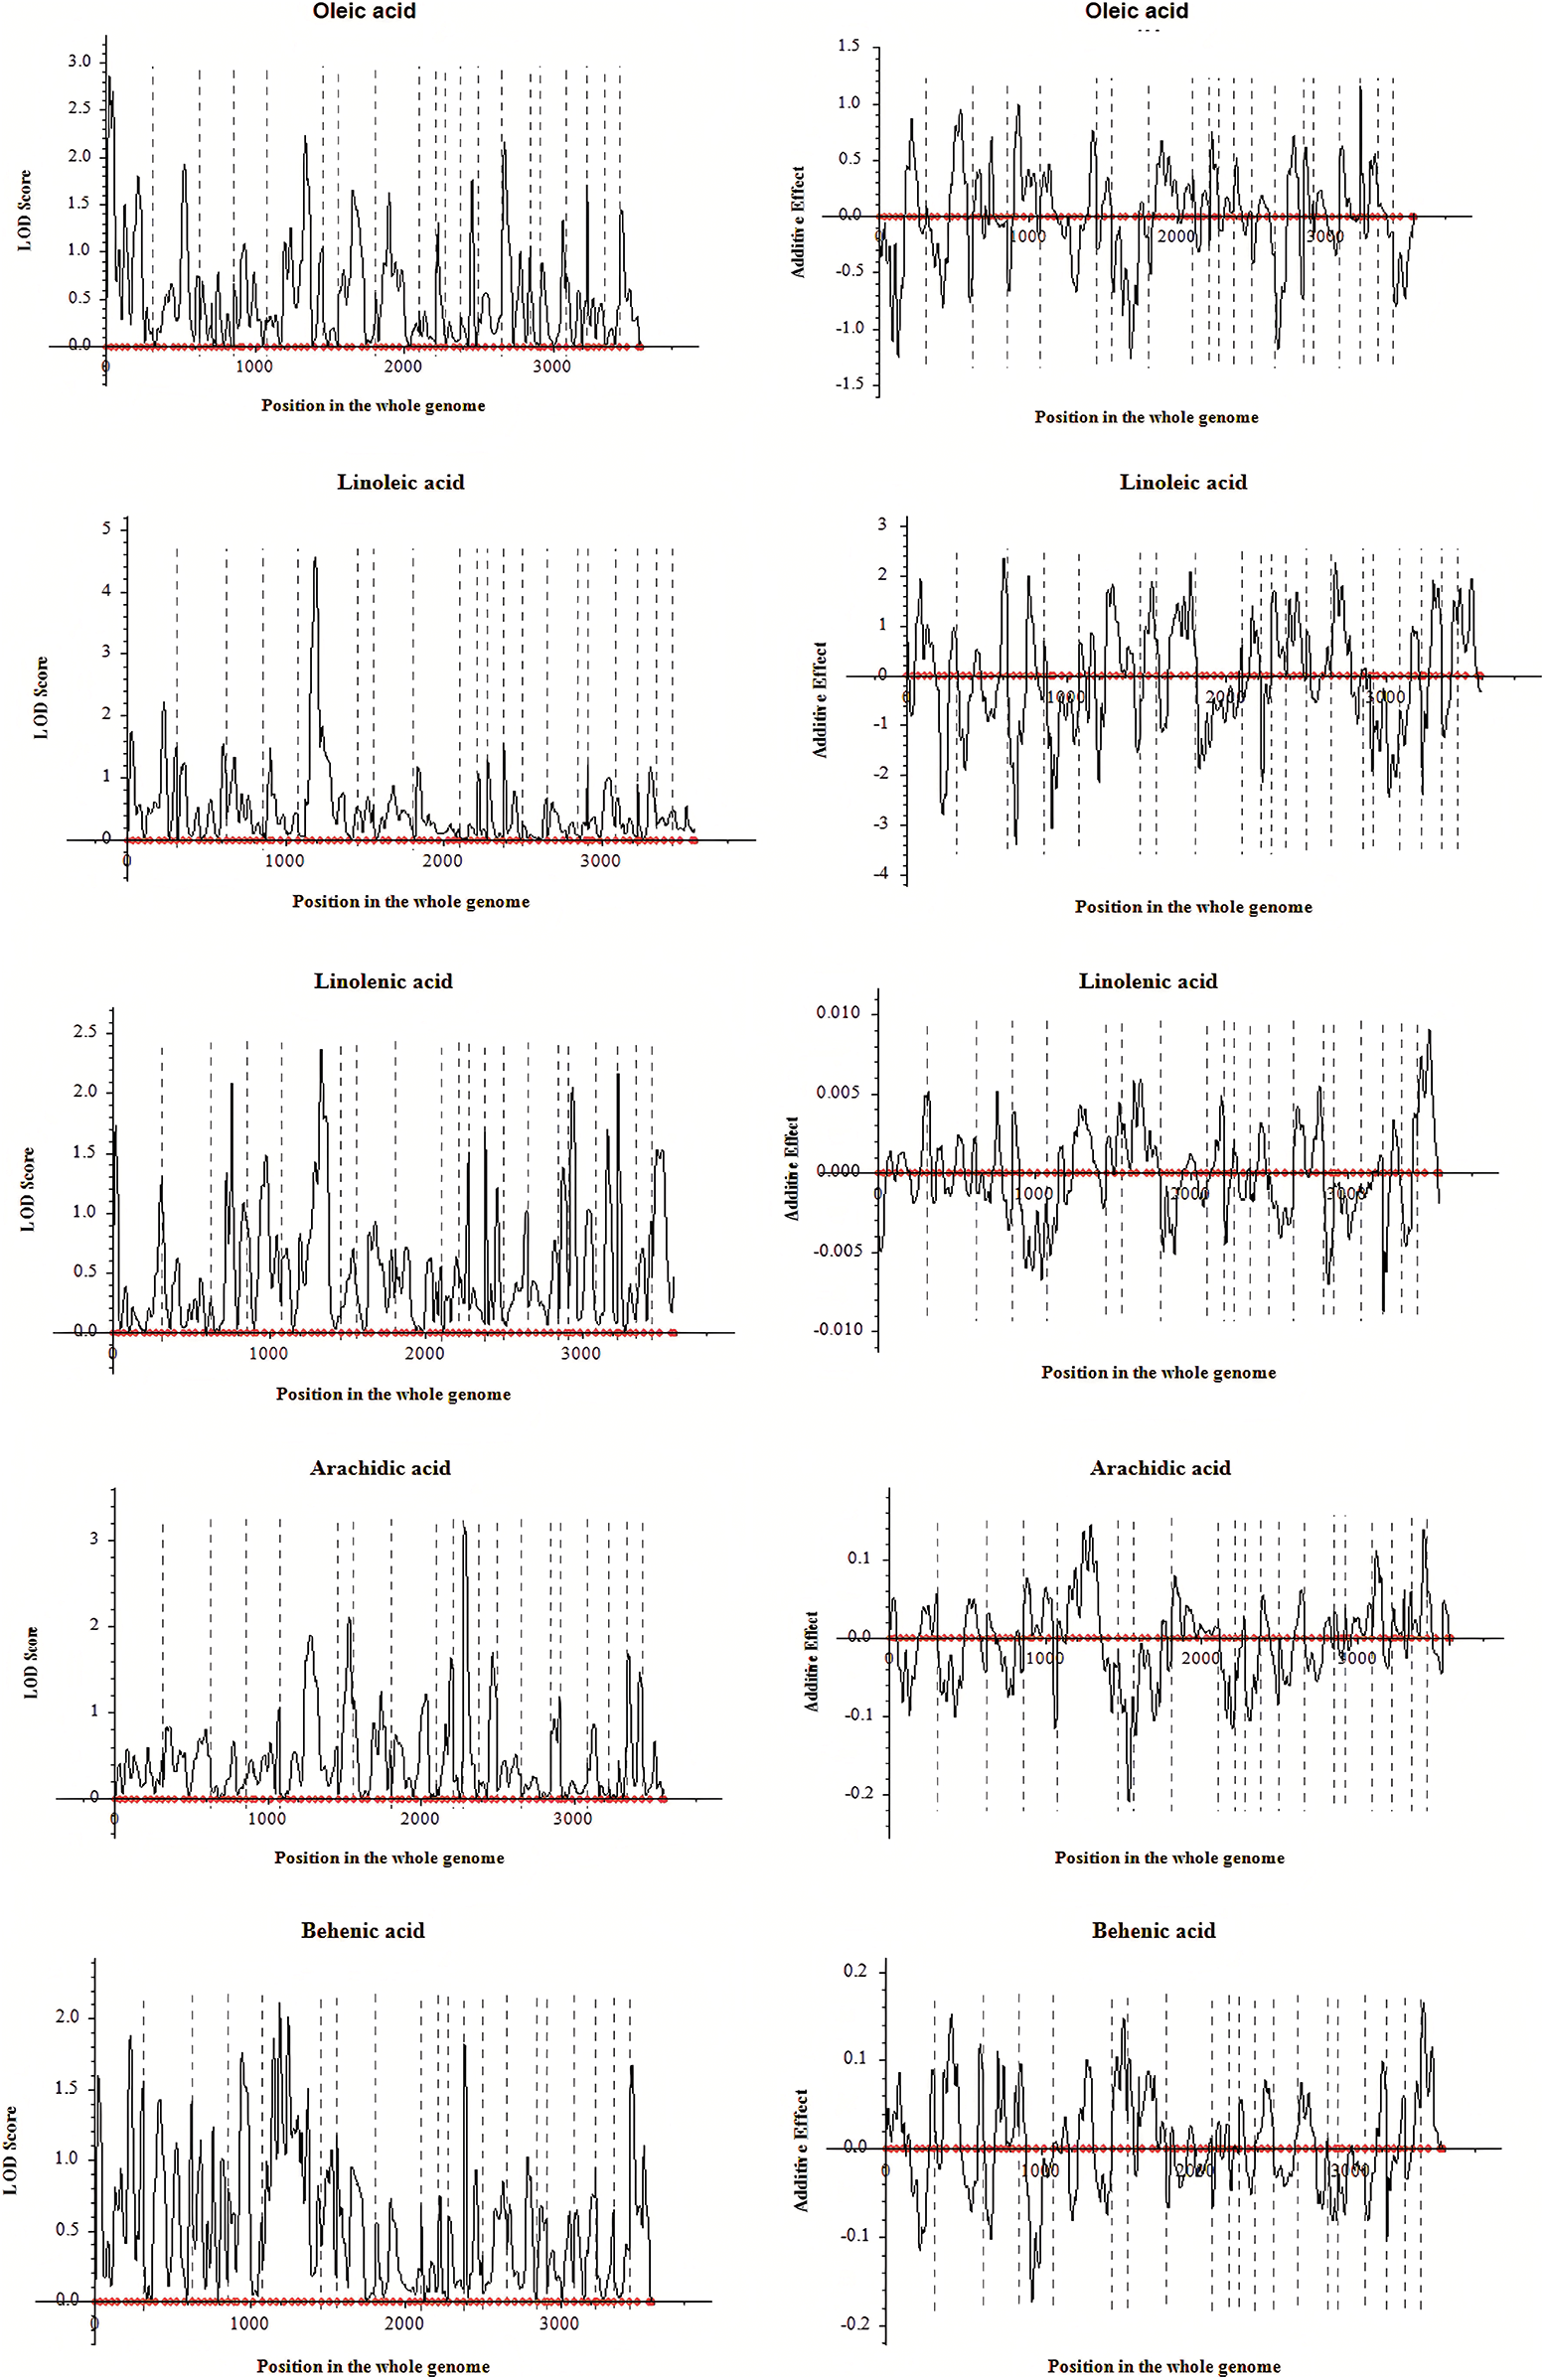
Figure 4: LOD and additive effects analysis of one dimensional ICIM for fatty acids in F2 segregated population
Peanut, a high-oil legume, has been an important oil and food crop worldwide. The oil quality is determined by the composition of the fatty acids. Commonly, two major fatty acids, oleic acid and linoleic acid, that occupy nearly 80% of the total fatty acids in peanut oil are essential; however, the nutritional quality of minor fatty acids that comprise the rest 20% of the fatty acids cannot be ignored [4,6,21]. Thus, a reasonable composition of fatty acids is critical and has always been a breeding objective for peanut cultivar development. As a typical quantitative trait, the fatty acid content of peanut is of great complexity and controlled by numerous major or minor loci [1]. A genetic linkage map is a prerequisite to effectively identify the molecular markers related to the aimed traits. With the increasing numbers of SSRs in peanut, more SSR-based genetic maps have been constructed for further enhancing MAS [1,17,20]. In the present study, an F2 segregated population with 140 individuals was used to construct a molecular genetic map containing 103 SSRs, and finally, sixteen fatty acid-related QTLs were found in peanut.
Increasing the content of peanut oleic acid and reducing the content of saturated fatty acids such as palmitic acid are the primary tasks to accelerate the breeding process. This study concluded that there was a negative correlation between peanut linoleic acid content and linoleic acid content and palmitic acid content.This is consistent with the results obtained by Wang et al. [1] through the correlation analysis of the fatty acid content in two peanut populations, which can be used as a reference object for the improvement of fatty acid traits in peanut.According to this study, there is a significant positive correlation between linoleic acid content and palmitic acid content and palmitate content. Pandey et al. [26] believed that palmitic acid content was positively correlated with linoleic acid content and negatively correlated with oleic acid content, thus indicating that the results of this study are the same as those of our predecessors. In this study, the correlation analysis between peanut oil content, protein and fatty acid components proved that there was a significant correlation between oil content and fatty acid content, which provided a theoretical basis for the development of peanut varieties with reasonable fatty acid levels. Moreover, transgressive separation of fatty acids was found in the F2 population, thus improving the idea of breeders cultivating new high-quality peanut germplasm by crossing materials from different genetic backgrounds.
Based on the 103 polymorphic SSRs, we constructed a genetic map with high integration. Compared with the genetic linkage map constructed by Leal-Bertioli et al. [27], a total of ten molecular markers located on the Chr.06, Chr.07, Chr.10, Chr.12, Chr.17, and Chr.20 were the same, and the arrangement orders on the linkage groups were also consistent. In this study, on the basis of this map, sixteen QTLs distributed on Chr.01, Chr.03, Chr.05, Chr.06, Chr.11, Chr.13, Chr.14, Chr.16, and Chr.18 were finally identified to be associated with fatty acids using ICIM method. Out of them, three QTLs with high contribution rates were detected, which were located in the UPN032-PM36 interval on Chr.05 for linoleic acid, UPN037-UPN092 interval on Chr.16 for oil content, and TC3 E02-IPAHM659 interval on Chr.06 for arachidic acid, and the contribution rates were 18.5971%, 10.4747%, and 10.1705%, respectively. Currently, many QTLs have been found in relation to oleic acid, linoleic acid, and linolenic acid [1,18,20]. However, only a few QTLs associated with arachidic acid and behenic acid have been identified. Here, two QTLs located in the interval of TC3E02-IPAHM659 and UPN096-AHGS3721 were found to be associated with arachidic acid, and one QTL located in UPN032-PM36 interval was related to behenic acid. Furthermore, four QTLs were detected in relation to different traits, including the QTL interval UPN027-UPN071 on Chr.05 for oleic acid and linolenic acid, UPN032-PM36 on Chr.05 for linoleic acid and behenic acid, and UPN037-UPN092 on Chr.16 and UPN054-PM384 on Chr.18 for linolenic acid and oil content, which exhibited genetic stability in controlling fatty acid-related traits in peanut. Our results might provide a theoretical basis for MAS in peanut fatty acids, and we could focus our efforts in fine mapping and functional gene mining in the future studies.
This study construct the F2 isolated population by crossing Weihua8 and 12L49 and perform QTL mapping analysis. Mapping of the 103 SSR marker loci yielded a genetic map associated with peanut fatty acids with nine linkage groups. Combining the phenotypic data of each component content of peanut fatty acids with the molecular data, 16 QTLs were detected by ICIM. Among these, four QTLs were tested simultaneously with different traits, indicating the associated genetic stability of peanut fatty acids. In addition to the QTLs of oleic acid, linoleic acid, and linolenic acid, three new QTLs of arachidonic acid and sugar beet acid were also detected. These QTLs may further contribute to fine-mapping analysis and MAS of peanut fatty acids.
Acknowledgement: We would like to thank Jilin Agricultural University.
Funding Statement: This work was supported by the Development Plan of Science and Technology Project of Jilin Province in China [20220508054RC].
Author Contributions: Study concept and design: Xiao Han, Jun Zhang; data collection: Fenglou Ling; analysis and interpretation of results: Songnan Yang, Xueying Li. Qiulin Wu; draft manuscript preparation: Yongyi Xing. All authors reviewed the results and approved the final version of the manuscript.
Conflicts of Interest: The authors declare that they have no conflicts of interest to report regarding the present study.
References
1. Wang, M. L., Khera, P., Pandey, M. K., Wang, H., Qiao, L. et al. (2015). Genetic mapping of QTLs controlling fatty acids provided insights into the genetic control of fatty acid synthesis pathway in peanut (Arachis hypogaea L.). PLoS One, 10(4), e0119454. https://doi.org/10.1371/journal.pone.0119454 [Google Scholar] [PubMed] [CrossRef]
2. Afifah, D. N., Ningrum, Y. P. A., Syahidah, T., Nuryanto, N., Ayustaningwarno, F. et al. (2022). Nutrient content, organoleptic quality, and shelf life of sagon substitute from lindur (Bruguiera gymnorrhiza L.) and soybean flour (Glycine max L.as an alternative emergency food. Frontiers in Nutrition, 9, 878539. https://doi.org/10.3389/fnut.2022.878539 [Google Scholar] [PubMed] [CrossRef]
3. Ojiewo, C. O., Janila, P., Bhatnagar-Mathur, P., Pandey, M. K., Desmae, H. et al. (2020). Advances in crop improvement and delivery research for nutritional quality and health benefits of groundnut (Arachis hypogaea L.). Frontiers in Plant Science, 11, 29. https://doi.org/10.3389/fpls.2020.00029 [Google Scholar] [PubMed] [CrossRef]
4. Otyama, P. I., Chamberlin, K., Ozias-Akins, P., Graham, M. A., Cannon, E. K. S. et al. (2022). Genome-wide approaches delineate the additive, epistatic, and pleiotropic nature of variants controlling fatty acid composition in peanut (Arachis hypogaea L.). G3 Genes|Genomes|Genetics, 12(1), jkab382. https://doi.org/10.1093/g3journal/jkab382 [Google Scholar] [PubMed] [CrossRef]
5. Houketchang Ndomou, S. C., Togyam, H., Njapndounke, B., Pougoue, A., Tiwo, C. T. et al. (2023). Optimization of the mixture of groundnut, palm, stearin, and sesame oils subjected to heat treatment and evaluation of their lipid quality. Heliyon, 9(1), e12813. https://doi.org/10.1016/j.heliyon.2023.e12813 [Google Scholar] [PubMed] [CrossRef]
6. Huang, Y., Liu, C., Huang, F., Zhou, Q., Zheng, C. et al. (2022). Quality evaluation of oil by cold-pressed peanut from different growing regions in China. Food Science & Nutrition, 10(6), 1975–1987. https://doi.org/10.1002/fsn3.2813 [Google Scholar] [PubMed] [CrossRef]
7. Moretzsohn, M. C., Dos Santos, J. F., Moraes, A. R. A., Custódio, A. R., Michelotto, M. D. et al. (2023). Marker-assisted introgression of wild chromosome segments conferring resistance to fungal foliar diseases into peanut (Arachis hypogaea L.). Frontiers in Plant Science, 14, 1139361. https://doi.org/10.3389/fpls.2023.1139361. [Google Scholar] [PubMed] [CrossRef]
8. Barbour, J. A., Howe, P. R. C., Buckley, J. D., Bryan, J., Coates, A. M. (2017). Cerebrovascular and cognitive benefits of high-oleic peanut consumption in healthy overweight middle-aged adults. Nutritional Neuroscience, 20(10), 555–562. https://doi.org/10.1080/1028415X.2016.1204744 [Google Scholar] [PubMed] [CrossRef]
9. Zhou, X., Luo, H., Yu, B., Huang, L., Liu, N. et al. (2022). Genetic dissection of fatty acid components in the Chinese peanut (Arachis hypogaea L.) mini-core collection under multi-environments. PLoS One, 17(12), e0279650. https://doi.org/10.1371/journal.pone.0279650 [Google Scholar] [PubMed] [CrossRef]
10. Barkley, N. A., Isleib, T. G., Wang, M. L., Pittman, R. N. (2013). Genotypic effect of ahFAD2 on fatty acid profiles in six segregating peanut (Arachis hypogaea L) populations. BMC Genetics, 14, 62. https://doi.org/10.1186/1471-2156-14-62 [Google Scholar] [PubMed] [CrossRef]
11. Jung, S., Powell, G., Moore, K., Abbott, A. (2000). The high oleate trait in the cultivated peanut [Arachis hypogaea L]. II. Molecular basis and genetics of the trait. Molecular & General Genetics: MGG, 263(5), 806–811. https://doi.org/10.1007/s004380000243 [Google Scholar] [PubMed] [CrossRef]
12. Pandey, M. K., Wang, M. L., Qiao, L., Feng, S., Khera, P. et al. (2014). Identification of QTLs associated with oil content and mapping FAD2 genes and their relative contribution to oil quality in peanut (Arachis hypogaea L.). BMC Genetics, 15, 133. https://doi.org/10.1186/s12863-014-0133-4 [Google Scholar] [PubMed] [CrossRef]
13. Cherif, A. O., Pepe, C., Messaouda, M. B. (2023). Fatty Acids profile of wild and cultivar tunisian peanut oilseeds (A. hypogaea L.) at different developmental stages. Journal of Oleo Science, 72(4), 379–387. https://doi.org/10.5650/jos.ess22400 [Google Scholar] [PubMed] [CrossRef]
14. Ahmad, S., Nawade, B., Sangh, C., Mishra, G. P., Bosamia, T. C. et al. (2020). Correction to: Identification of novel QTLs for late leaf spot resistance and validation of a major rust QTL in peanut (Arachis hypogaea L.). 3 Biotech, 10(12), 521. https://doi.org/10.1007/s13205-020-02503-y [Google Scholar] [PubMed] [CrossRef]
15. Zhang, H., Chu, Y., Dang, P., Tang, Y., Jiang, T. et al. (2020). Identification of QTLs for resistance to leaf spots in cultivated peanut (Arachis hypogaea L.) through GWAS analysis. Theoretical and Applied Genetics, 133(7), 2051–2061. https://doi.org/10.1007/s00122-020-03576-2 [Google Scholar] [PubMed] [CrossRef]
16. Luo, H., Pandey, M. K., Zhi, Y., Zhang, H., Xu, S. et al. (2020). Discovery of two novel and adjacent QTLs on chromosome B02 controlling resistance against bacterial wilt in peanut variety Zhonghua 6. Theoretical and Applied Genetics, 133(4), 1133–1148. https://doi.org/10.1007/s00122-020-03537-9 [Google Scholar] [PubMed] [CrossRef]
17. Jiang, Y., Luo, H., Yu, B., Ding, Y., Kang, Y. et al. (2021). High-density genetic linkage map construction using whole-genome resequencing for mapping QTLs of resistance to aspergillus flavus infection in peanut. Frontiers in Plant Science, 12, 745408. https://doi.org/10.3389/fpls.2021.745408 [Google Scholar] [PubMed] [CrossRef]
18. Yang, Y., Li, Y., Cheng, Z., Su, Q., Jin, X. et al. (2023). Genetic analysis and exploration of major effect QTLs underlying oil content in peanut. Theoretical and Applied Genetics, 136(5), 97. https://doi.org/10.1007/s00122-023-04328-8 [Google Scholar] [PubMed] [CrossRef]
19. Guo, J., Qi, F., Qin, L., Zhang, M., Sun, Z. et al. (2023). Mapping of a QTL associated with sucrose content in peanut kernels using BSA-seq. Frontiers in Genetics, 13, 1089389. https://doi.org/10.3389/fgene.2022.1089389 [Google Scholar] [PubMed] [CrossRef]
20. Huai, D., Wu, J., Xue, X., Hu, M., Zhi, C. et al. (2023). Red fluorescence protein (DsRed2) promotes the screening efficiency in peanut genetic transformation. Frontiers in Plant Science, 14, 1123644. https://doi.org/10.3389/fpls.2023.1123644 [Google Scholar] [PubMed] [CrossRef]
21. Varshney, R. K., Bertioli, D. J., Moretzsohn, M. C., Vadez, V., Krishnamurthy, L. et al. (2009). The first SSR-based genetic linkage map for cultivated groundnut (Arachis hypogaea L.). Theoretical and Applied Genetics, 118(4), 729–739. https://doi.org/10.1007/s00122-008-0933-x [Google Scholar] [PubMed] [CrossRef]
22. Krishna, G., Singh, B. K., Kim, E. K., Morya, V. K., Ramteke, P. W. (2015). Progress in genetic engineering of peanut (Arachis hypogaea L.)--A review. Plant Biotechnology Journal, 13(2), 147–162. https://doi.org/10.1111/pbi.12339 [Google Scholar] [PubMed] [CrossRef]
23. Wong, A. Y. H., Xie, S., Tang, B. Z., Chen, S. (2019). Fluorescent silver staining of proteins in polyacrylamide gels. Journal of Visualized Experiments, (146). https://doi.org/10.3791/58669 [Google Scholar] [PubMed] [CrossRef]
24. Zuo, J. F., Niu, Y., Cheng, P., Feng, J. Y., Han, S. F. et al. (2019). Effect of marker segregation distortion on high density linkage map construction and QTL mapping in Soybean (Glycine max L.). Heredity, 123(5), 579–592. https://doi.org/10.1038/s41437-019-0238-7 [Google Scholar] [PubMed] [CrossRef]
25. Schneider, M., Casale, F., Stich, B. (2022). Accurate recombination estimation from pooled genotyping and sequencing: A case study on barley. BMC Genomics, 23(1), 468. https://doi.org/10.1186/s12864-022-08701-7 [Google Scholar] [PubMed] [CrossRef]
26. Pandey, M. K., Monyo, E., Ozias-Akins, P., Liang, X., Guimarães, P. et al. (2012). Advances in Arachis genomics for peanut improvement. Biotechnology Advances, 30(3), 639–651. https://doi.org/10.1016/j.biotechadv.2011.11.001 [Google Scholar] [PubMed] [CrossRef]
27. Leal-Bertioli, S. C., Cavalcante, U., Gouvea, E. G., Ballén-Taborda, C., Shirasawa, K. et al. (2015). Identification of QTLs for rust resistance in the peanut wild species arachis magna and the development of KASP markers for marker-assisted selection. G3 Genes|Genomes|Genetics, 5(7), 1403–1413. https://doi.org/10.1534/g3.115.018796 [Google Scholar] [PubMed] [CrossRef]
Cite This Article
 Copyright © 2023 The Author(s). Published by Tech Science Press.
This work is licensed under a Creative Commons Attribution 4.0 International License , which permits unrestricted use, distribution, and reproduction in any medium, provided the original work is properly cited.
 Downloads
 Citation Tools