
 Submit a Paper
 Propose a Special lssue
 Open Access
ARTICLE
Retrieval of Winter Wheat Canopy Carotenoid Content with Ground- and Airborne-Based Hyperspectral Data
College of Artificial Intelligence, Hangzhou Dianzi University, Hangzhou, 310018, China
* Corresponding Author: Xianfeng Zhou. Email:
Phyton-International Journal of Experimental Botany 2023, 92(9), 2633-2648. https://doi.org/10.32604/phyton.2023.029259
Received 09 March 2023; Accepted 15 May 2023; Issue published 28 July 2023
 View Full Text
 Download PDF
Abstract
Accurate assessment of canopy carotenoid content (CCx+cC) in crops is central to monitor physiological conditions in plants and vegetation stress, and consequently supporting agronomic decisions. However, due to the overlap of absorption peaks of carotenoid (Cx+c) and chlorophyll (Ca), accurate estimation of carotenoid using reflectance where carotenoid absorb is challenging. The objective of present study was to assess CCx+cC in winter wheat (Triticum aestivum L.) with ground- and aircraft-based hyperspectral measurements in the visible and near-infrared spectrum. In-situ hyperspectral reflectance were measured and airborne hyperspectral data were acquired during major growth stages of winter wheat in five consecutive field experiments. At the canopy level, a remarkable linear relationship (R2 = 0.95, p < 0.001) existed between Cx+c and Ca, and correlation between CCx+cC and wavelengths within 400 to 1000 nm range indicated that CCx+cC could be estimated using reflectance ranging from visible to near-infrared wavebands. Results of Cx+c assessment based on chlorophyll and carotenoid indices showed that red edge chlorophyll index (CI red edge) performed with the highest accuracy (R2 = 0.77, RMSE = 22.27 μg/cm2 , MAE = 4.97 μg/cm2 ). Applying partial least square regression (PLSR) in CCx+cC retrieval emphasized the significance of reflectance within 700 to 750 nm range in CCx+cC assessment. Based on CI red edge index, use of airborne hyperspectral imagery achieved satisfactory results in mapping the spatial distribution of CCx+cC. This study demonstrates that it is feasible to accurately assess CCx+cC in winter wheat with red edge chlorophyll index provided that Cx+c correlated well with Ca+b at the canopy scale. it is therefore a promising method for CCx+cC retrieval at regional scale from aerial hyperspectral imagery.Keywords
Photosynthesis is the largest synthetic process on Earth [1]. Within the process, chlorophylls (Ca+b) that include chlorophyll a (Chl a) and chlorophyll b (Chl b) are mainly responsible for harvesting light and converting it into stored chemical energy [2,3]. Carotenoids (Cx+c), which comprise carotenes and xanthophylls, are in charge of antenna and photoprotective functions, including light harvesting via singlet state energy transfer, photoprotection via quenching of chlorophyll triplet states, singlet oxygen scavenging, excess energy dissipation as well as structure stabilization [4,5]. In addition to its function in photosynthesis, content of Cx+c provides complementary information on physiological status of vegetation [6] and changes in Cx+c content have been linked to plant stress symptoms [7]. Therefore, determination of Cx+c content is of great importance to monitor plant physiological status, detect vegetation stress and assess nutritional state, and consequently support decisions on agricultural practices.
Spectral absorption features of Cx+c in the visible spectrum make it possible to retrieve Cx+c content at both the leaf and canopy level using remote sensing techniques. Generally, there are three main nondestructive approaches for estimating leaf pigment contents: semi-empirical methods based on spectral indices, multivariate statistical methods based on linear and nonlinear regression models, and radiative transfer model (RTM) inversion [8,9]. Based on these methods, numerous advancements have been made in regard to Ca+b content estimation. Nevertheless, research on Cx+c assessment is relatively rare due to difficulties associated with overlapping absorption in the blue/green region by photosynthetic pigments such as Ca+b, Cx+c and anthocyanins (Anths) [10]. Among published studies, spectral index method is extensively used for Cx+c retrieval. In particular, Chappelle et al. [11] found that Cx+c showed a maximum absorption peak at 500 nm and proposed the ratio analysis of reflectance spectra algorithm (RARS, R760/R500) to retrieve Cx+c content at the leaf level. Gitelson et al. [12] found that sensitivity of reciprocal reflectance to leaf Cx+c content was maximal in a spectral range around 510 nm. To remove chlorophyll effect on reciprocal reflectance at 510 nm, they proposed the carotenoid reflectance index (CRI) as (1/R510) − (1/R550) and (1/R510) − (1/R700) for better estimation of leaf Cx+c content. To avoid structural effects, Hernández-Clemente et al. [13] proposed the simple ratio (SRcars, R515/R570), which showed good performance in estimating of Cx+c content at both leaf and canopy scales. Work conducted by Fassnacht et al. [7] concluded that combination of carotenoid angular vegetation index (AVIcar) and red edge carotenoid index (CARI red edge) was more sensitive to leaf Cx+c variations than previous Cx+c indices. Nevertheless, most of these studies have relied on leaf-level work and few of the published indices have aimed for canopy Cx+c assessment. Moreover, indices that have been identified as sensitive to leaf Cx+c require scaling up to canopy level to evaluate their applicability in Cx+c retrieval.
Assessment of canopy carotenoid content (CCx+cC) is quite difficult since reflectance of plant canopies within the visible and short infrared wave range (400 to 2500 nm) is influenced by multiple factors. Absorption features of Cx+c, structure of canopies and background effects also affect the reflectance features. Moreover, overlapping absorption peaks of Cx+c and Ca+b in blue region complicates retrieval of Cx+c using its own absorption characteristics [7]. Previous studies have indicated that a direct relationship existed between total Cx+c and Ca+b concentration and intercorrelation existed between concentration per unit area of Cx+c and Ca+b provided an indirect relationship between Cx+c and red reflectance [6,14]. Moreover, Cx+c indices generally could not reach similarly high accuracies in Cx+c retrieval as comparable approaches reached for the estimation of Ca+b content [7]. Therefore, CCx+cC might as well be estimated using canopy reflectance in the visible and near-infrared wavebands other than its own absorption features in the blue region. Besides this, hyperspectral reflectance of plant canopies contains abundant information related to canopy’s biophysical, physiological or biochemical properties using abundant narrow bands from the whole spectrum ranging from visible to infrared region, which offers great chances for multivariate statistical methods to produce accurate and consistent predictions of CCx+cC. Partial least squares regression (PLSR) is an effective approach that has been successfully applied in various disciplines and achieved satisfactory results [14–17]. Use of PLSR in CCx+cC estimation could help to comprehensively evaluate contribution of narrow bands in CCx+cC retrieval. Also, it might provide some comparison with spectral index methods. With the rapid development of airborne and unmanned air vehicle (UAV) techniques, various remote sensing datasets at regional level could then be obtained, thereby offering precious opportunities for remotely monitoring physiological conditions of crops and guiding appropriate management for farming industry. Assessment of CCx+cC at regional scale using airborne hyperspectral measurement is bound to contribute to diagnosing plant physiological state and could provide a reference for agricultural mapping and monitoring.
Therefore, compared with spectral methods proposed by previous researches that focused on carotenoid absorptions, this study tried to take advantage of hyperspectral reflectance ranged from visible to near-infrared region for CCx+cC retrieval, particularly spectrum from red-edge wavebands that are sensitive to CCa+bC variations provided that a good relationship existed between CCx+cC and CCa+bC, so as to improve CCx+cC estimation accuracy. The specific objectives were as follows: (i) analyzing relationship between CCx+cC and canopy reflectance ranging from visible to near-infrared wavebands; (ii) evaluating the performance of published chlorophyll indices, carotenoid indices and PLSR in CCx+cC retrieval; and (iii) assessing winter wheat CCx+cC with high-resolution aircraft-based hyperspectral data.
The data used in this study were obtained from five different experiments, which were conducted during three growing stages.
Experiments 1 and 2 (Exp. 1 & 2): these experiments were conducted in field plots in Changping District (40°13′N, 116°12′E), Shunyi District (40°08′N, 116°39′E) and Fangshan District (39°43′N, 115°59′E) of Beijing during wheat growth period in 2004 and 2005, respectively. two high-quality varieties 9428 and 9507 were adopted, and wheat planting management concerning normal irrigation and fertilization were carried out during the experiments. In 2004, 25 sampling plots with area more than 3.3 ha, and in which a single and uniform planting variety was planted were selected for field sampling during major growth periods, including April 1 (tillering), April 15 (stem elongation), May 18 (pollination) and June 2 (milk development).Similarly, 27 plots were selected for sampling during the growing stage of 2005, that is, April 03 (tillering), April 12 (stem elongation), April 21 (booting), May 08 (head emergence) and May 22 (pollination,).
Experiments 3 and 4 (Exp. 3 & 4): these experiments were carried out at the National Experimental Station for Precision Agriculture (40°10′N, 116°27′E) in Xiaotangshan, Changping District, Beijing during wheat growth period in 2004 and 2005. Crops in Exp. 3 & 4 were grown in normal conditions and comprised 18 cultivars (i.e., erective types Lumai 21, Jing 411, P7, Laizhou 3279, Nongda 3291 and I-93; medium types Zhongmai 16, Jingwang 10, CA16, 95128, Jingdong 8 and Chaoyou 66; and loose types 9507, Nongda 3214, 6211, 9428, Linkang 2 and 4P3). In Exp. 3, 21 plots, each 30 m × 5.4 m in area, were used for field measurements, and survey dates included April 21 (booting), April 28 (booting), May 11 (head emergence), May 19 (pollination), May 28 (pollination) and June 8 (milk development), while in in Exp. 4, 18 plots were selected for sampling on April 18 (stem elongation), April 26 (booting), May 9 (head emergence), May 19 (pollination) and May 30 (pollination).
Experiment 5 (Exp. 5): this experiment was conducted in 2002 at the National Experimental Station. Three winter wheat varieties (Jingdong 8, Jing 9428 and Zhongyou 9507) were planted in field with each sampling plot being 32.4 m × 30 m. four irrigation treatments and four nitrogen treatments were set to these three varieties; thus 48 control plots were coupled. For the control experiment, nitrogen fertilization process (0, 150, 300 and 450 kg ha−1 urea) was divided into three times and applied with one third before seeding, one third at tillering stage and one third for jointing stage; while irrigation process (0, 225, 450 and 675 m3 ha−1 water) was divided into two times and applied with one half at tillering stage and one half for jointing stage, respectively. Data collected from April 18 (booting) and May 31 (milk development) that corresponded to ground-based hyperspectral collections and simultaneous airborne hyperspectral imaging flight tests were used.
2.2.1 Canopy Reflectance Measurements
For field sampling, crop with uniform growth within 1 m × 1 m area was selected for canopy spectrum measurements. ASD FieldSpec Pro spectrometer (Analytical Spectral Devices, Boulder, CO, USA), with a spectral range of 350–2500 nm (3 nm spectral resolution in the range of 350–1000 nm, 10 nm in the range of 1000–2500 nm) and a probe field angle is 25°, was used for measuring canopy reflectance between 10:00 and 14:00 (Beijing local time) in cloudless weather. During each measurement (recorded as an average of 20 individual measurements), ASD probe was vertically downward, and the height was kept about 1.3 m above the ground. Winter wheat canopy reflectance were then calculated by the ratio of measured crop canopy radiance and reference panel radiance.
2.2.2 Agronomic Parameters Measurements
After spectrum measurements, all winter wheat plant from the 1 m × 1 m area were harvested, placed in fresh-keeping bags and transported to laboratory for biochemical and biophysical parameters analysis. Leaf area index (LAI), chlorophyll content, carotenoid content and dry biomass were measured according to standard procedures. LAI was measured based on the laboratory method using a CI-203 (CID Bio-Science, Inc., USA); leaf chlorophyll and carotenoid content were determined by spectrophotometric method. Two copies of a 0.25 dm2 leaf circle were acquired from each winter wheat sample; one was used for measuring leaf water content with drying weighing method, i.e., placing a plant sample in a drying box at 105°C for 15 min, and drying at 80°C for about 8 h to constant weight. Another representative leaf sample, was extracted with 80% acetone. The absorbance values at 663, 646 and 470 nm were determined by spectrophotometer according to the absorption spectrum of pigments in visible light. Chl a, Chl b and Cx+c were calculated by the following Eqs. (1)–(3): [18]:
where Chl a (mg/L), Chl b (mg/L) and Cx+c (mg/L) are chlorophyll a, chlorophyll b and total carotenoid concentrations; A663, A646 and A470 are absorbance of 80% acetone solution at 663, 646 and 470 nm wavelengths.
Then, leaf pigment content (a mass per unit leaf dry weight, mg/g) could be calculated with Eqs. (4) and (5):
where Ca+b (mg/L) is total chlorophyll concentration, VT (ml) is volume of leaf pigment extract solution and DW (g) is leaf dry weight used for determining pigment concentration.
In order to obtain pigment content at the canopy level to correspond with canopy reflectance, canopy chlorophyll and carotenoid content were calculated using Eqs. (6) and (7):
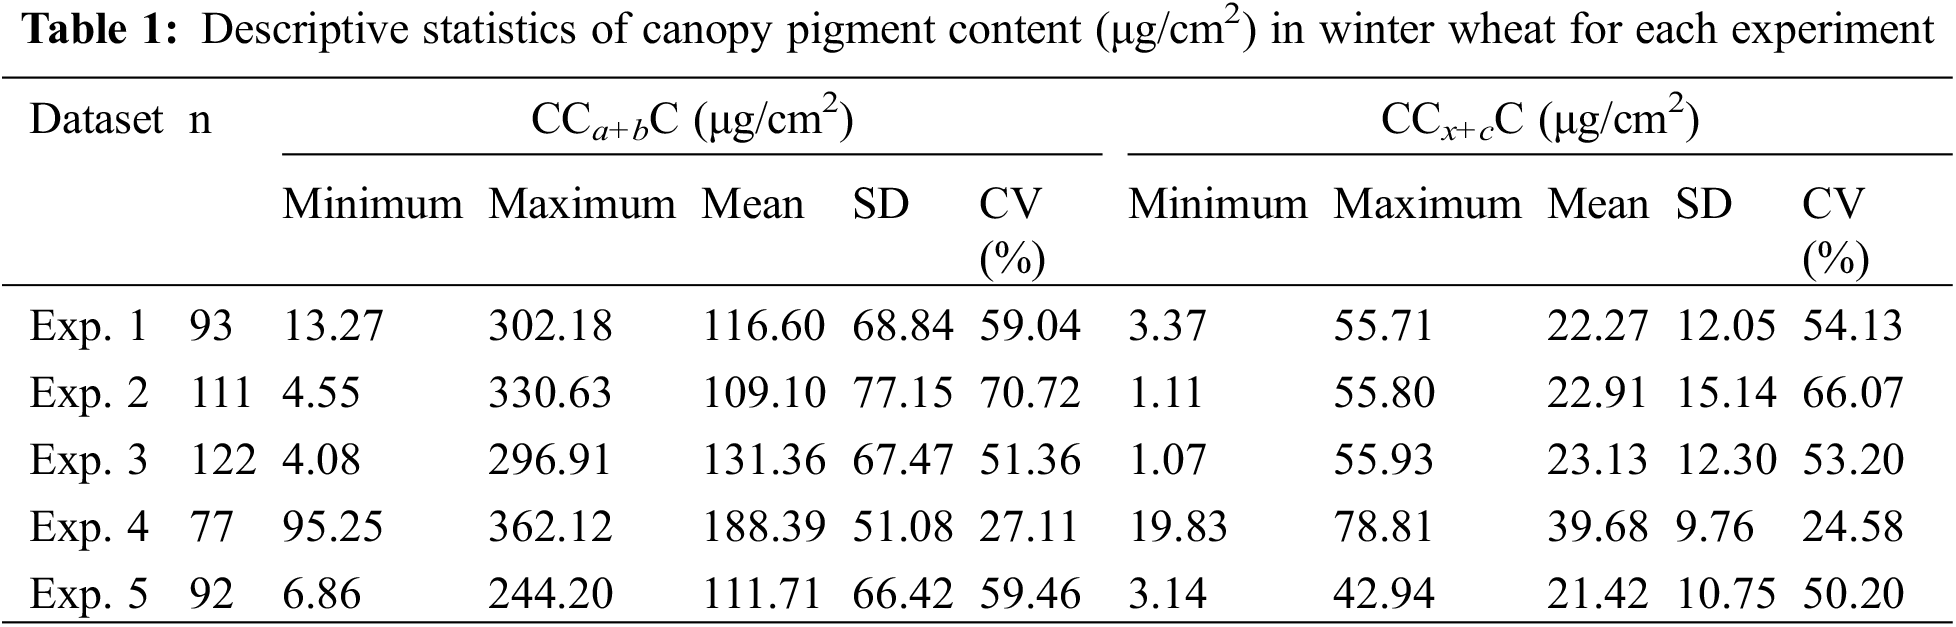
where SLW means specific leaf weight, defined as dry weight of leaves per unit area. Basic statistics for measurement of canopy pigment content are summarized in Table 1.
2.2.3 Airborne Hyperspectral Imagery Acquisition
Airborne hyperspectral imagery that corresponded to Exp. 5 filed survey were acquired with a Pushbroom Hyperspectral Imager (PHI) sensor, which was designed by Shanghai Institute of Technical Physics, Chinese Academy of Sciences (China). PHI device adopted a 780 × 244-pixel silicon array CCD made by Texas Instruments, which had the characteristics of high detection sensitivity, large area of photosensitive element, low thermal noise and good UV response. it had a series of parameter features, including instantaneous field of view was 1.5 m rad, field angle was 0.366 rad (21°), wavelength range was 400–850 nm, and spectral resolution was less than 5 nm. When flight altitude is 1 km, spatial resolution of lower point was about 1 m. In Exp. 5, a PHI sensor was installed onboard a “Yun 5” aircraft, with a flight height of 1 km and a corresponding ground width of about 380 m. Radiometric correction and reflectance conversion of PHI hyperspectral image data were carried out with black and white targets (5 m × 5 m) located at the boundaries of field site using empirical method, that is, mean value of 3 × 3 pixels in the middle region of the targets was selected as DN value of calibration point on images, and spectral reflectance of images were calculated using a linear interpolation method. Images were then geometrically corrected with ground control points.
2.3 Spectral Indices for Carotenoid Retrieval
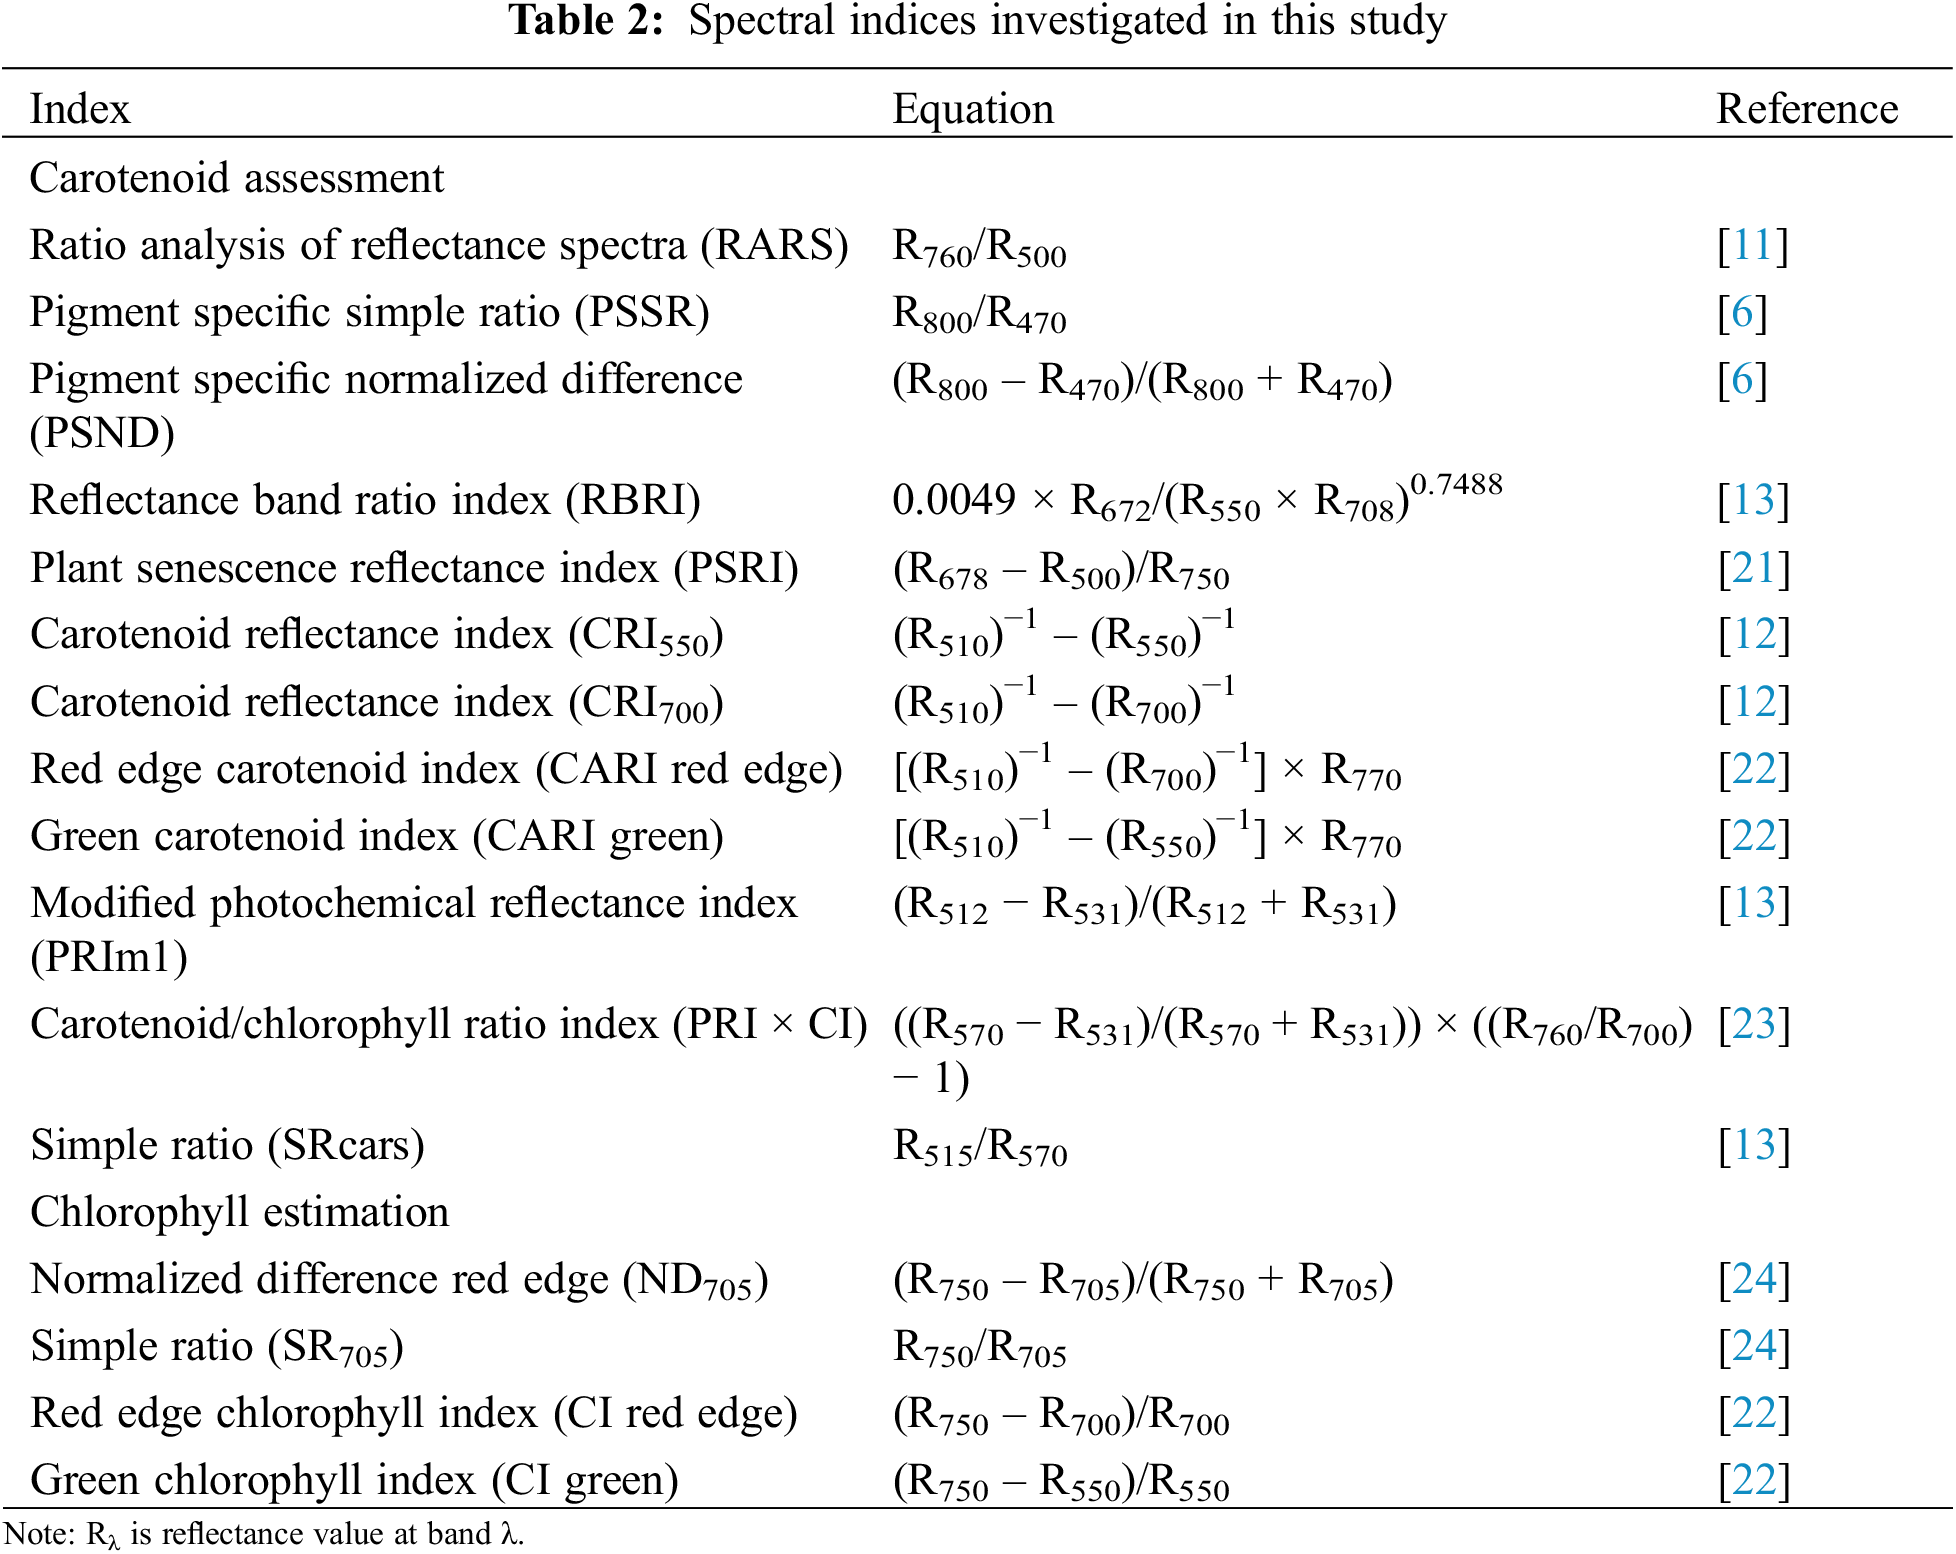
For carotenoid estimation, literature was reviewed to gather published carotenoid indices (Table 2). Among the tested indices, most were developed for carotenoid estimation at the leaf level except that pigment specific simple ratio (PSSR), pigment specific normalized difference (PSND), PRIm1 and SRcars were confirmed with satisfactory results for CCx+cC assessment [13]. In addition to these carotenoid indices, chlorophyll indices, including normalized difference red edge (ND705), simple ratio (SR705), red edge chlorophyll index (CI red edge) and green chlorophyll index (CI green), that showed good performance in chlorophyll retrieval [19,20] were also listed in Table 2.
2.4 Partial Least Squares Regression
PLSR is a bilinear calibration method using data compression by reducing large number of measured collinear spectral variables to a few non-correlated PLS factors (also known as principal components or latent variables), which could explain most of variation in both predictors and response variables. Unlike multiple linear regression (MLR), PLSR is able to avoid multi-collinearity in variables and simultaneously model several response variables [25]. Its equations are expressed as follows [15]:
where yi means target variable (dependent variable); xij means spectral reflectance (independent variables); m means number of spectral bands; n means number of samples; ei means error; βk means regression coefficients; Tik means latent variable; r means number of latent variables and ckj means coefficient for latent variables.
In the present study, measured canopy reflectance data within wavelength range from 400 to 1000 nm were used for PLSR analysis. The set of coefficients ckj was determined by maximizing the covariance between Tk and y; while a leave-one-out cross-validation (LOOCV) scheme was employed to determine the number of latent variables by minimizing predicted residual sums of squares (PRESS). PLSR analysis was carried out using Matlab 7.0 (MathWorks, Inc., Natick, MA).
Correlations between CCx+cC and spectral indices were analyzed using SPSS 18.0 software. Data collected from Exp. 1 and Exp. 2 were used to establish regression models, while data from Exp. 3 and Exp. 4 were used for validation. The overall performances of models based on published spectral indices and PLSR were evaluated by comparing differences in coefficient of determination (R2), root mean square error (RMSE) and mean absolute errors (MAE) for predictions of CCx+cC. RMSE and MAE values were calculated as follows:
where
3.1 Relationship between CCx+cC and Canopy Reflectance
R2 curves for canopy reflectance vs. CCx+cC (or CCa+bC) within wavelength ranged from 400 to 1000 nm were investigated to explore relationship between CCx+cC and canopy reflectance. Results in Fig. 1 show that an obvious linear correlation existed between CCx+cC and CCa+bC. Moreover, canopy pigment content has similar correlation with wavelength although some variations exist, and CCx+cC has obviously good correlations with red wavelengths (600 to 700 nm). Similarity in R2 curves for carotenoids and chlorophylls throughout 400 to 1000 nm spectrum range could be partly attributed to overlap of absorption features of different pigments. While, correlation between CCx+cC and reflectance in the red wavelengths could be explained by the intercorrelation between the CCx+cC and CCa+bC [6].
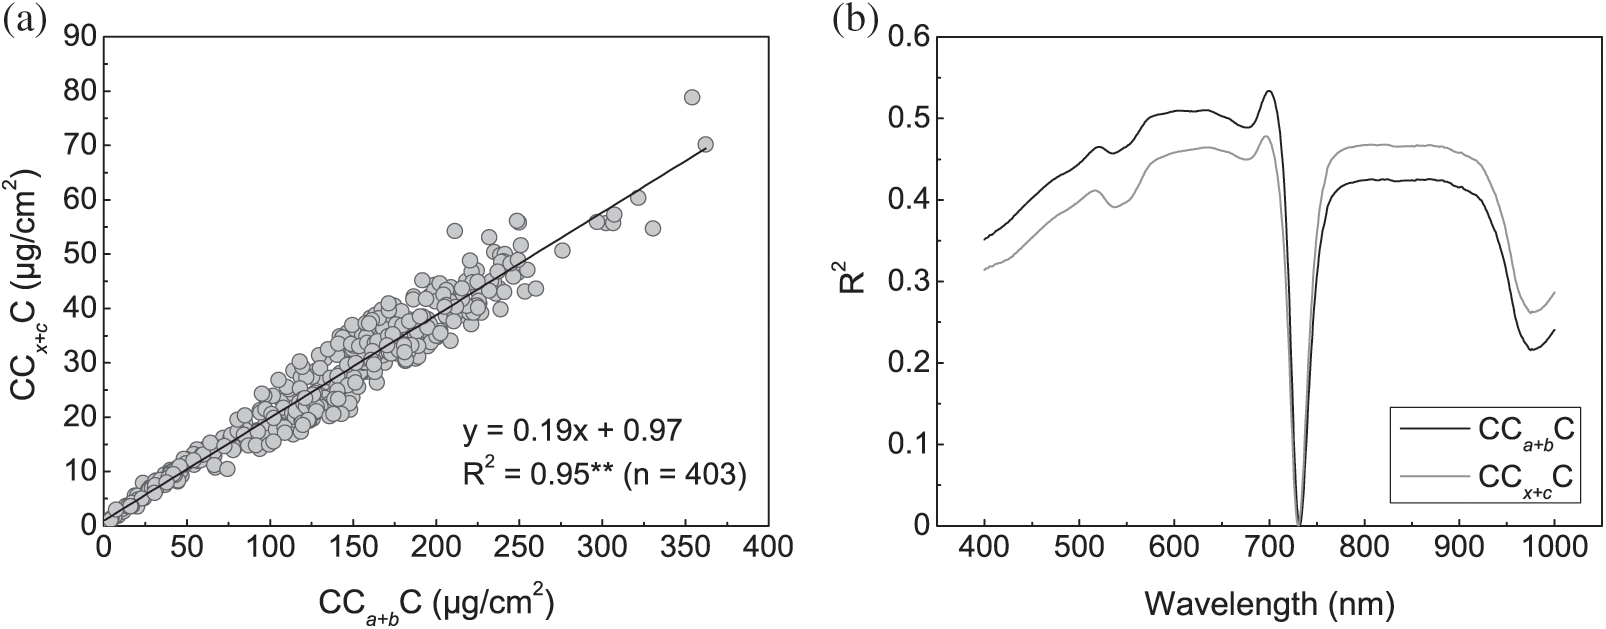
Figure 1: Relationship between CCx+cC and CCa+bC in winter wheat (a) and R2 curves for canopy reflectance vs. CCx+cC (or CCa+bC) within wavelength ranged from 400 to 1000 nm (b). Results were generated using 2004 and 2005 datasets (n = 403). ** indicates statistical significance at 0.001 (the same below)
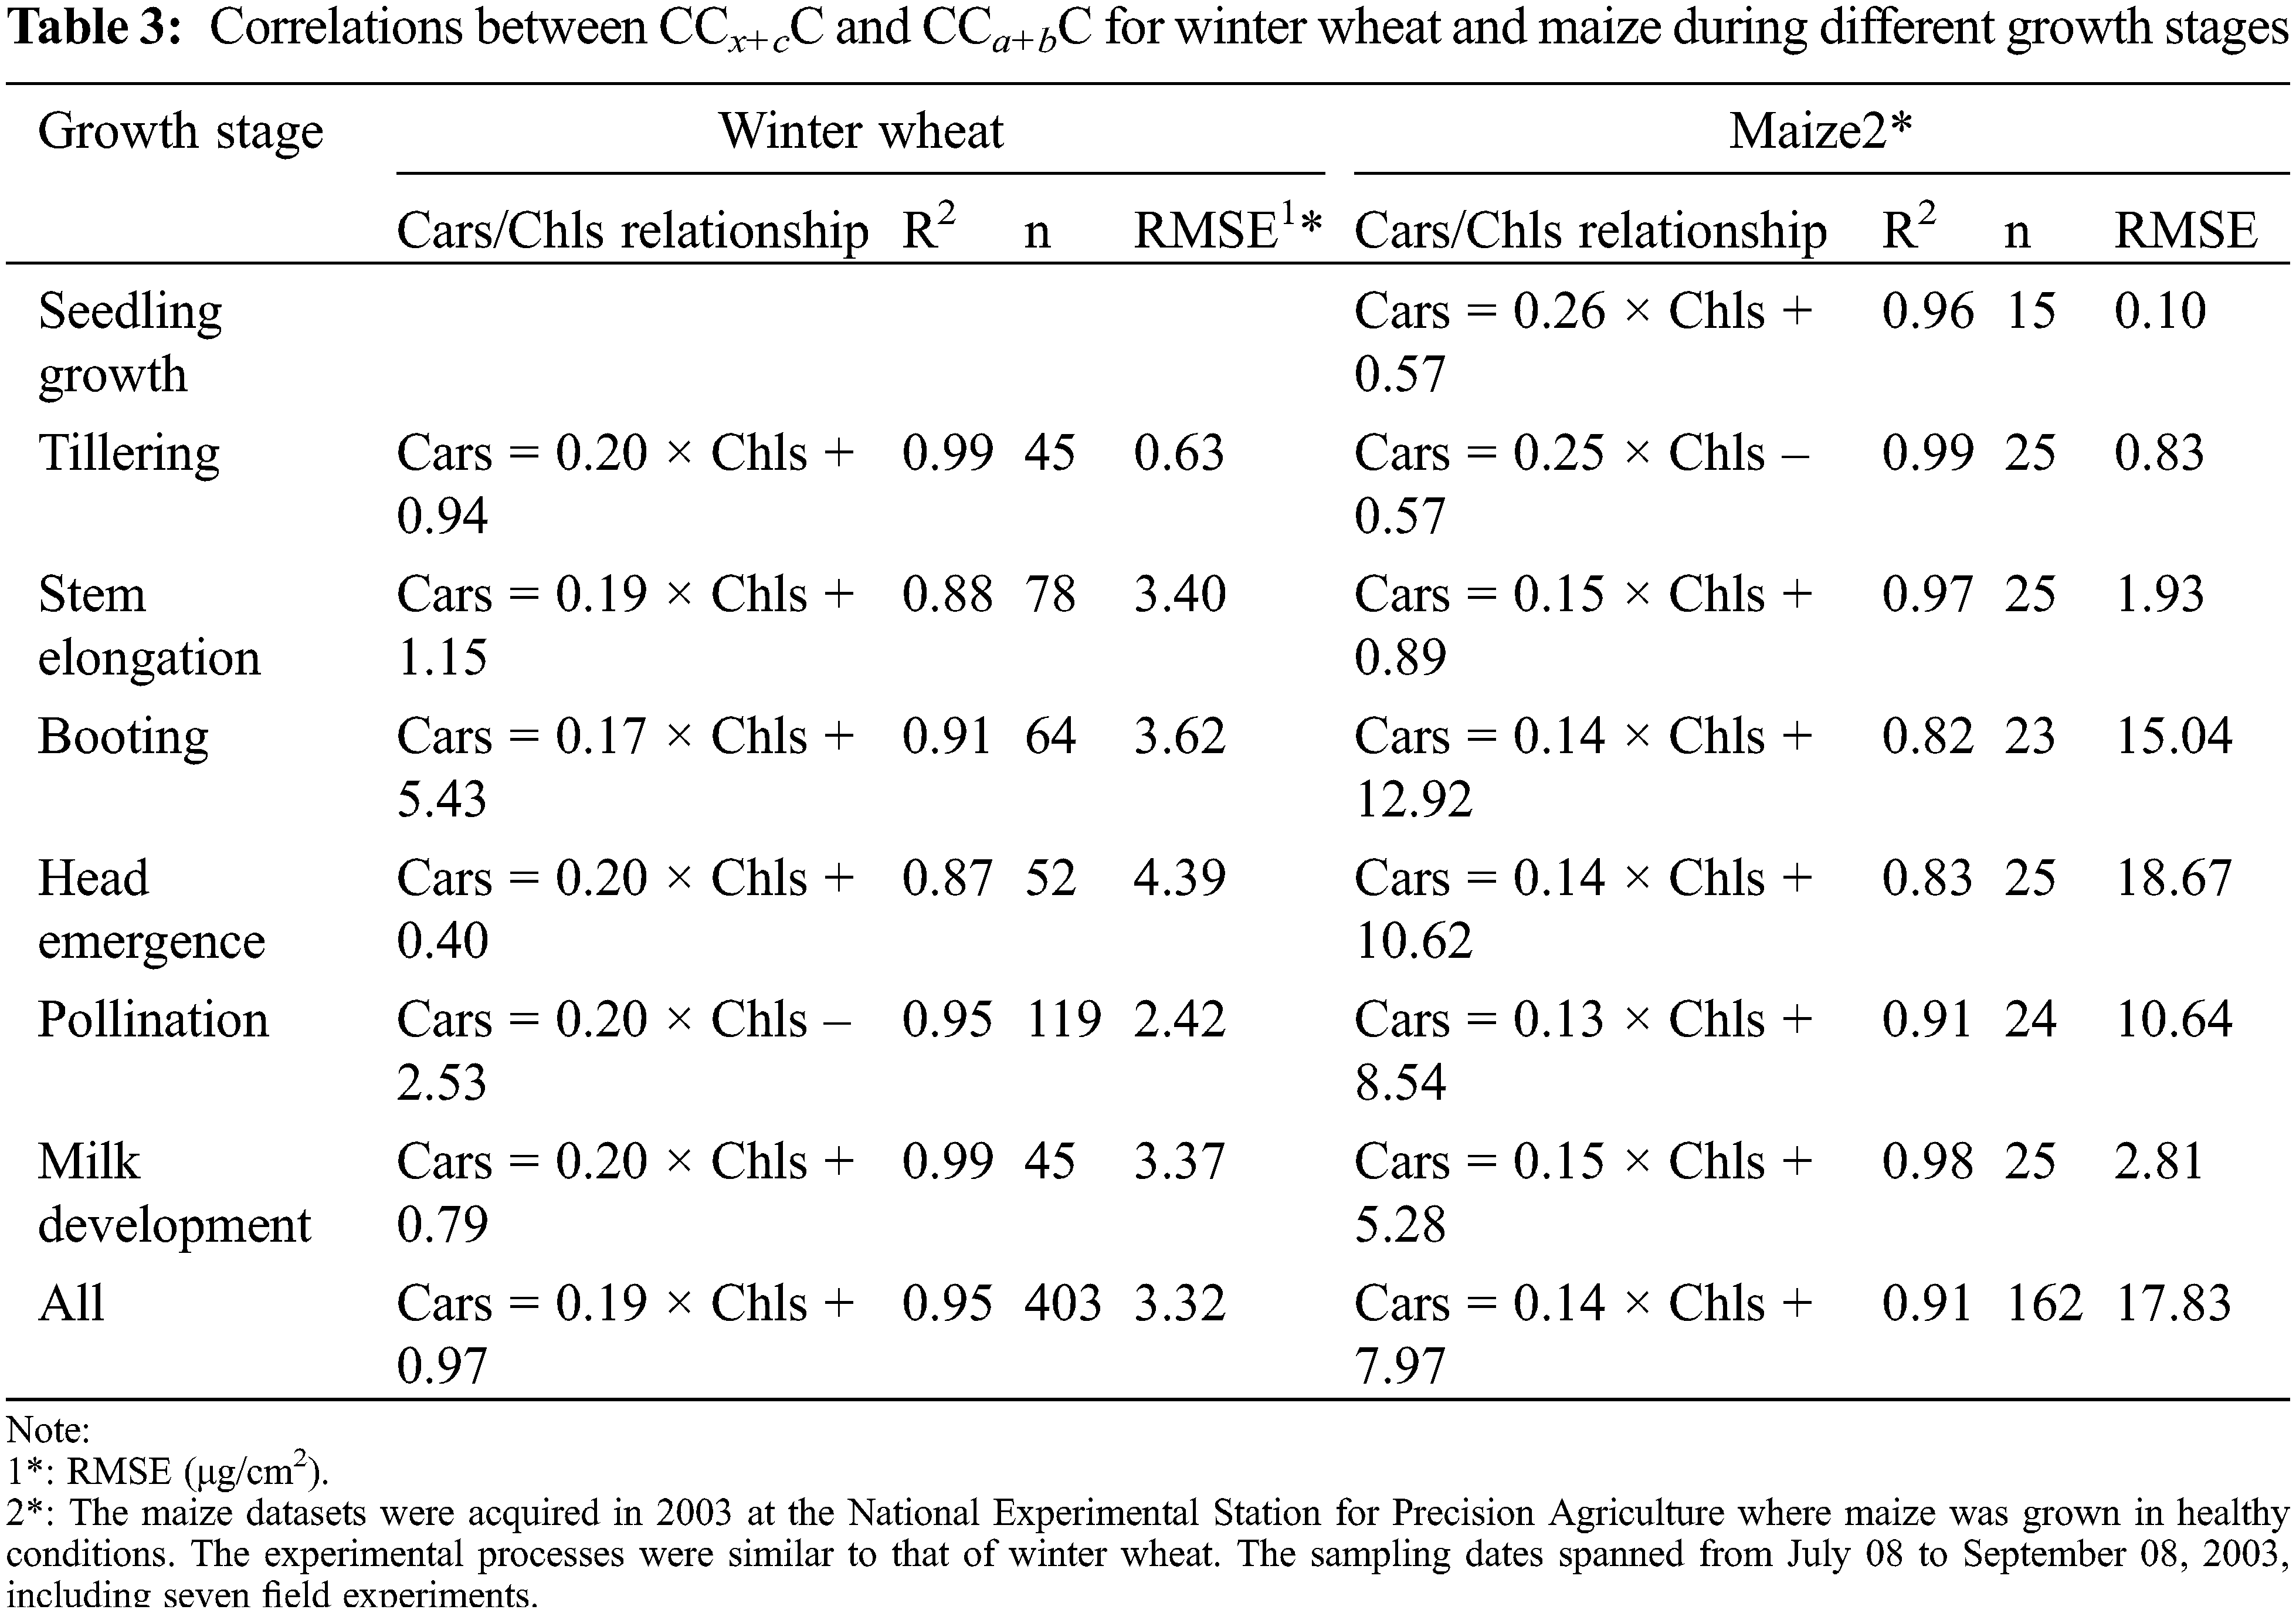
Many studies have suggested that correlation existed between carotenoid and chlorophyll content [6,14,26]. Here, we found that a remarkably linear relationship (p < 0.001) existed between the carotenoid and chlorophyll content at canopy level, with a coefficient of determination (R2) of 0.95. Furthermore, the linear relationship existed regardless of crop types, but it varied a little with growth stages (Table 3). Results in Table 3 show that during growing periods of winter wheat, slope of relationship between CCx+cC and CCa+bC was about 0.2 and varied little. The correlation was relatively poor when head emergence stage occurred, with R2 and SE at 0.87 and 9.81 μg/cm2, respectively. In contrast, slope of the relationship in maize was about 0.14 except for that slopes of the relationship during seedling growth and tillering stages were approximately 0.25. We inferred that in early stages of winter wheat growth process, excessive carotenoids could be produced to adapt to harsh environmental conditions, especially in summer days. The relatively poor correlation between CCx+cC and CCa+bC in maize occurred in head emergence stage as well, with R2 and SE at 0.83 and 18.67 μg/cm2, respectively, which suggests that earing process could affect relationship between CCx+cC and CCa+bC. Overall, CCx+cC correlated well with CCa+bC in both winter wheat and maize, which could support the use of canopy reflectance throughout 400 to 1000 nm range for estimation of Cx+c at the canopy scale to some extent.
3.2 Performances of Spectral Indices in CCx+cC Estimation
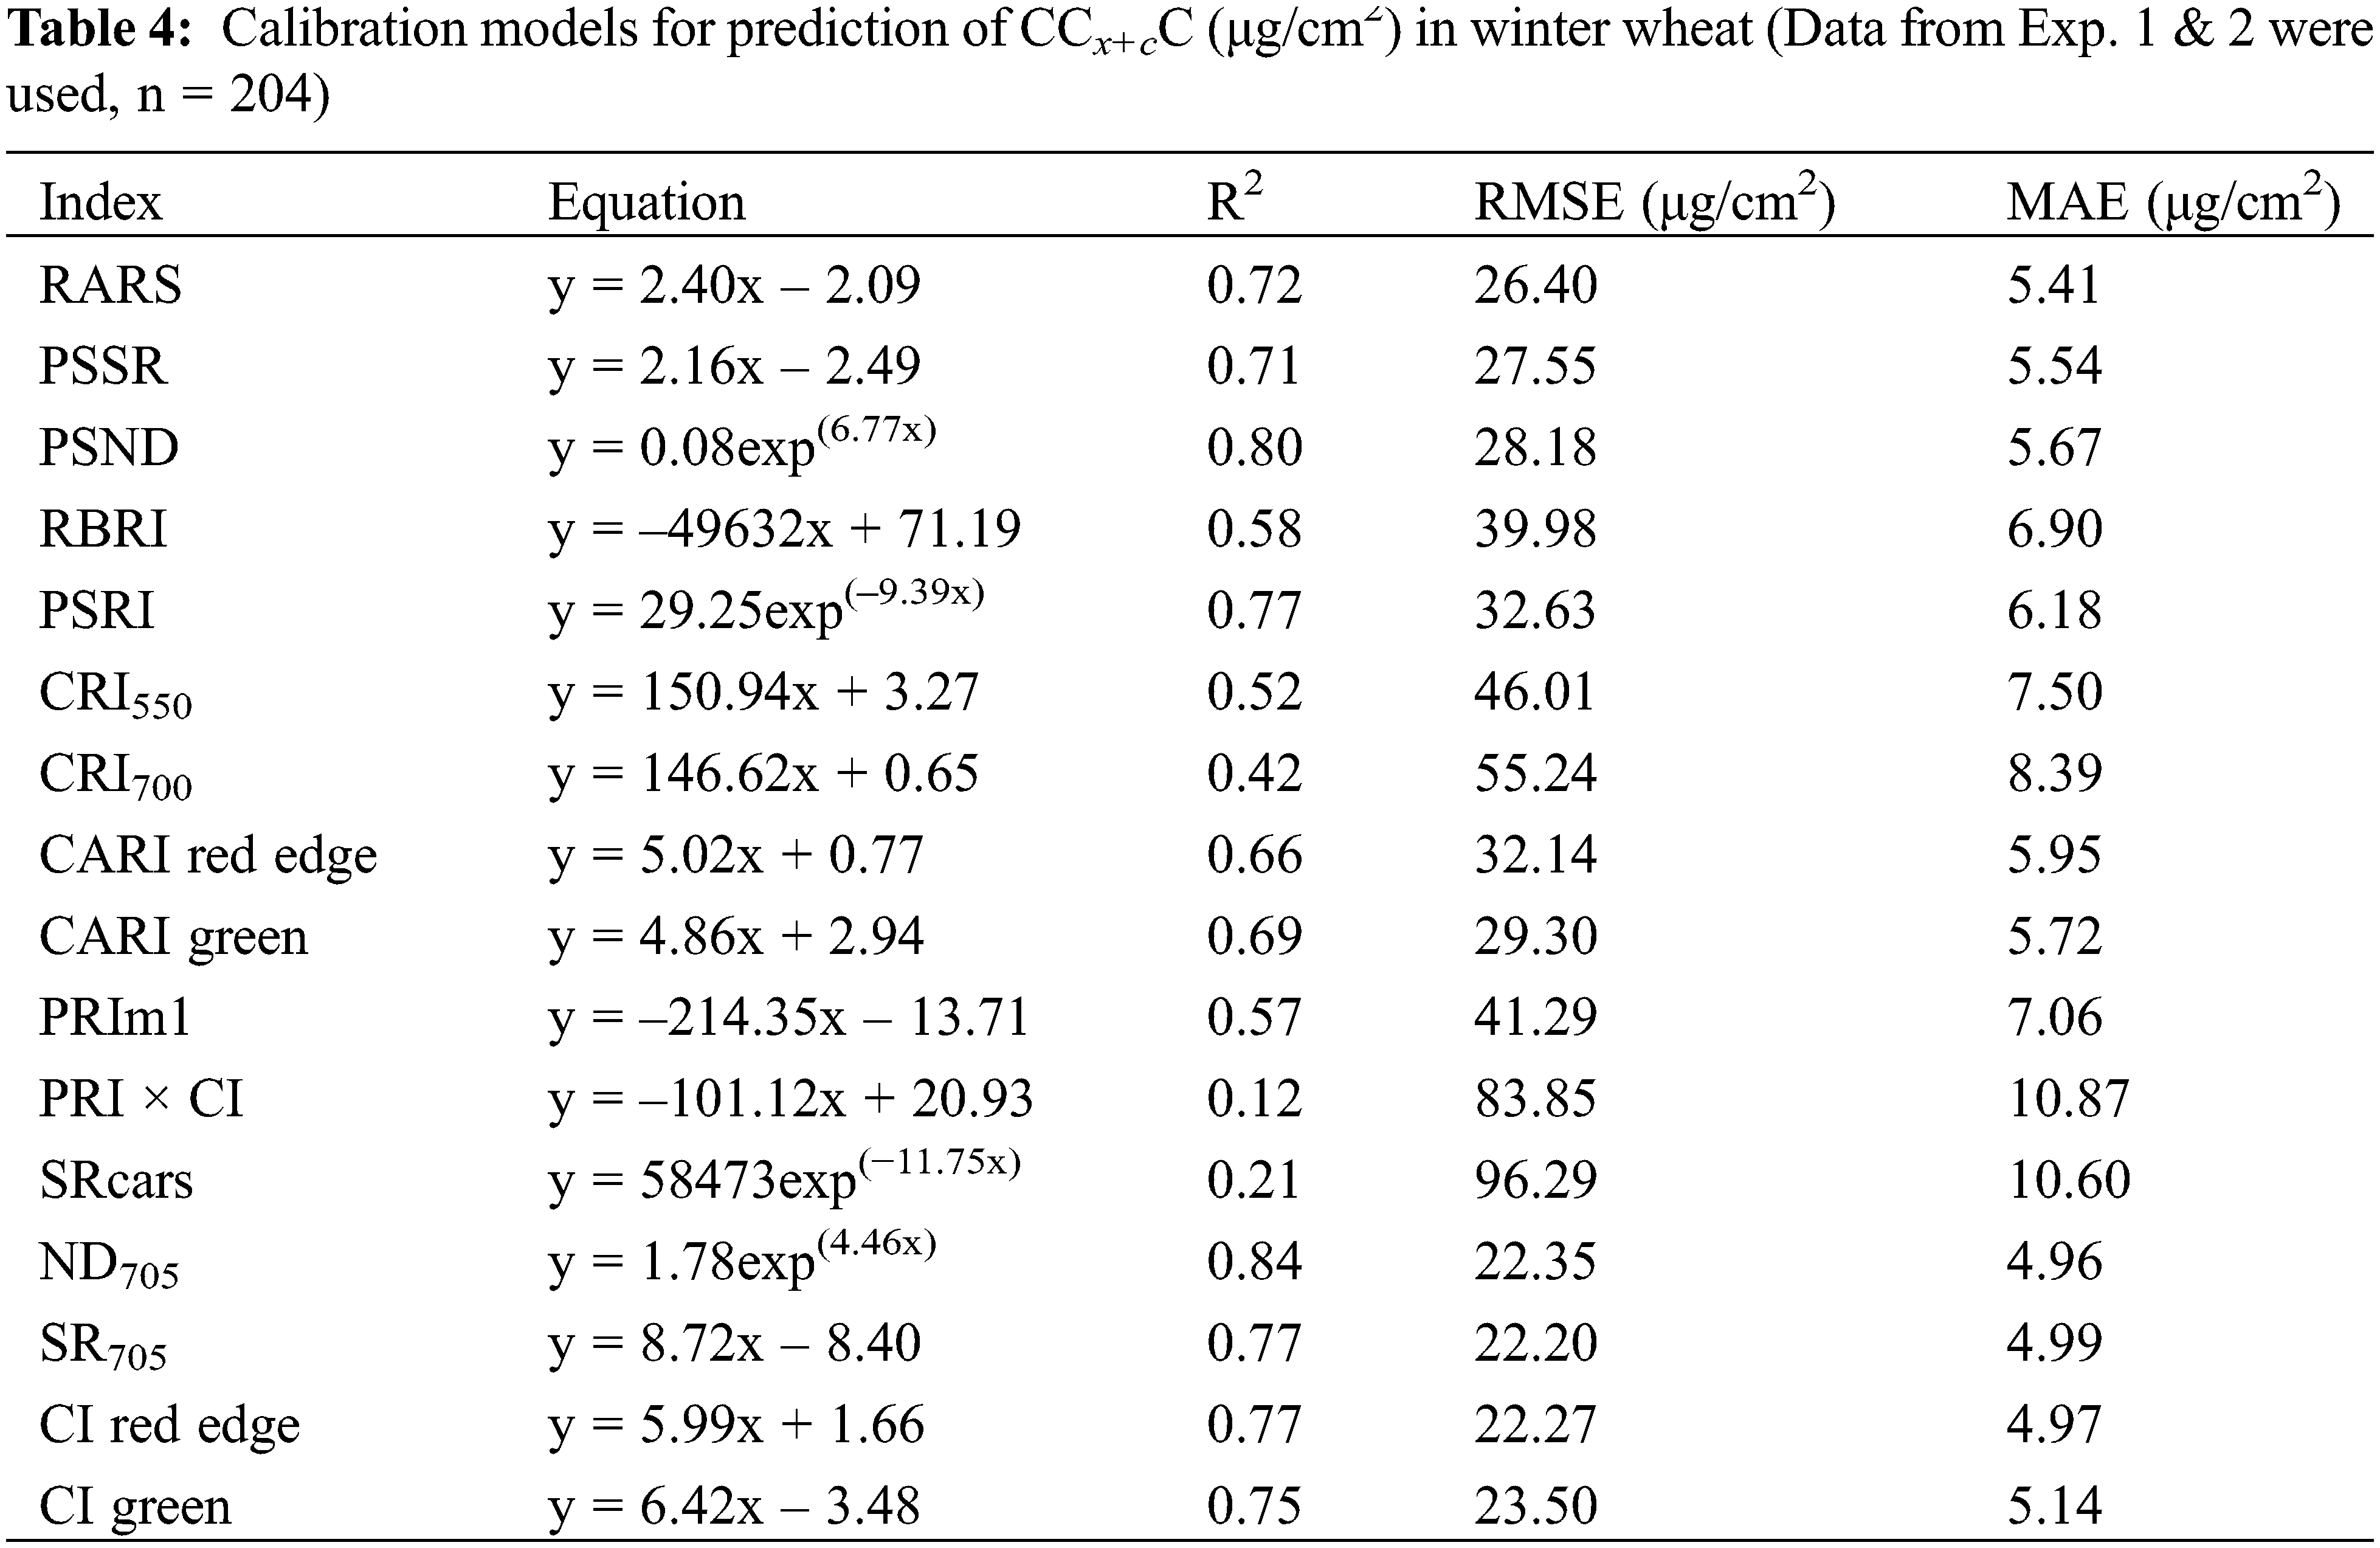
Calibration results of published carotenoid indices are shown in Table 4, indicating that these indices behaved differently in CCx+cC assessment. Among carotenoid indices, the best calibration models in estimating CCx+cC were obtained by RARS, PSSR, PSSND and PSRI with R2 values higher than 0.7, RMSE values lower than 33 μg/cm2 and MAE values lower than 6.2 μg/cm2. RARS and PSRI indices were devised based on leaf carotenoid content and spectra [11,21]. Their good performances in current study suggest that they could be used for carotenoid content estimation at the canopy level as well. Compared with CRI700 and CRI550, CARI red edge and CARI green indices showed better results in carotenoid assessment, which is largely due to addition of a near-infrared band [22]. PRI × CI and SRcars indices performed worst in carotenoids retrieval. Reasons for the former might be that PRI × CI was intended to weaken chlorophyll effect in leaf carotenoid estimation [23]. However, high correlation existed between CCx+cC and CCa+bC in the present study, which may disturb the performance of PRI × CI. According to R2 curves in Fig. 1b, 515 and 570 nm wavebands that constituted SRcars do not present high correlation with CCx+cC, which could explain the latter. In contrast to carotenoid indices, chlorophyll indices showed excellent performances in estimating Cx+c content at the canopy scale (Table 4). Amongst the performances of four chlorophyll indices, these indices showed consistent results with high R2 values and lower RMSE and MAE values than those of all carotenoid indices.
To further verify robustness of the calibration models based on carotenoid and chlorophyll indices, validation was conducted using Exp. 3 & 4 datasets. Validation results presented in Fig. 2 showed the consistency of calibration and validation results. Carotenoid indices such as RARS, PSSR, PSSND, PSRI, CARI red edge and CARI green showed satisfactory validation results, which further indicated their applicability in CCx+cC assessment. In validation results, CARI red edge and CARI green indices showed better precision than CRI550, and CRI700 also supported that addition of a near-infrared band could increase carotenoid estimation accuracy [22]. Compared to carotenoid indices, chlorophyll indices showed excellent performances in validation of carotenoids retrievals. Among which, ND705 performed with the highest R2 value (0.69), lowest RMSE (38.02 μg/cm2) and MAE (7.02 μg/cm2). These validation results further suggest that it is feasible for CCx+cC to be estimated with canopy reflectance ranging from 400 to 1000 nm, particularly with spectrum from red-edge wavebands.
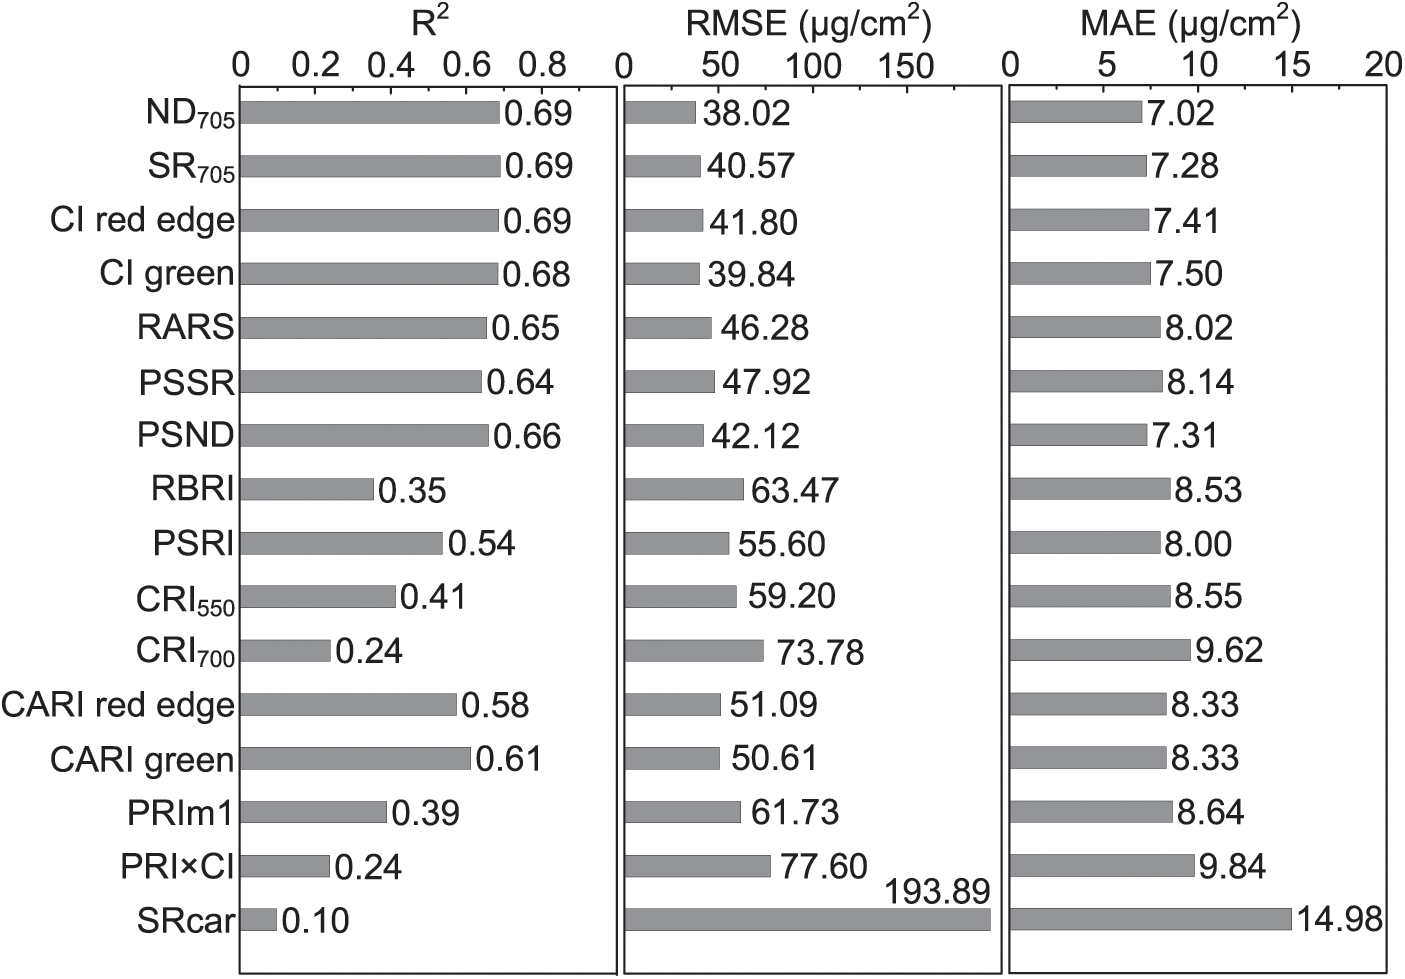
Figure 2: Comparison of validation results of spectral indices for CCx+cC (μg/cm2) estimation (Data from Exp. 3 & 4 were investigated, n = 199)
3.3 Assessment of CCx+cC Based on PLSR Method
Performance of PLSR model in estimating CCx+cC is shown in Fig. 3 to evaluate the contribution of narrow bands in CCx+cC retrieval. In order to avoid over-fitting, the number of latent variables in PLSR model was chosen to be three when PRESS value reached the minimum value (Fig. 3a). Regression coefficients of calibration model were plotted against waveband that ranged from 400 to 1000 nm in Fig. 3b to better know the importance of each spectral band in the model. Results showed that three zones-at approximately 550, 700 to 750 and 780 to 900 nm-of major importance for PLSR model could be identified. Among these zones, 700 to 750 nm waveband region had the highest numerical regression coefficient, which indicates the great importance of this range for PLSR model. In particular, optimal spectral index for CCx+cC estimation was based on 705 and 750 nm spectral bands, which means that the same wavelengths were important in both methods. Similar results were also obtained by Yi et al. [27]. Compared with the results of ND705 model, PLSR increased R2 value at 0.5 and lowered RMSE and MAE at 5.21 and 0.54 μg/cm2, respectively. Moreover, validation results shown in Fig. 3d also support the feasibility of PLSR in CCx+cC retrieval. Previous studies have suggested that PLSR analysis was a useful tool when applied to hyperspectral reflectance data for plant biochemical characteristics retrieval [15,27,28], which accords with our research.
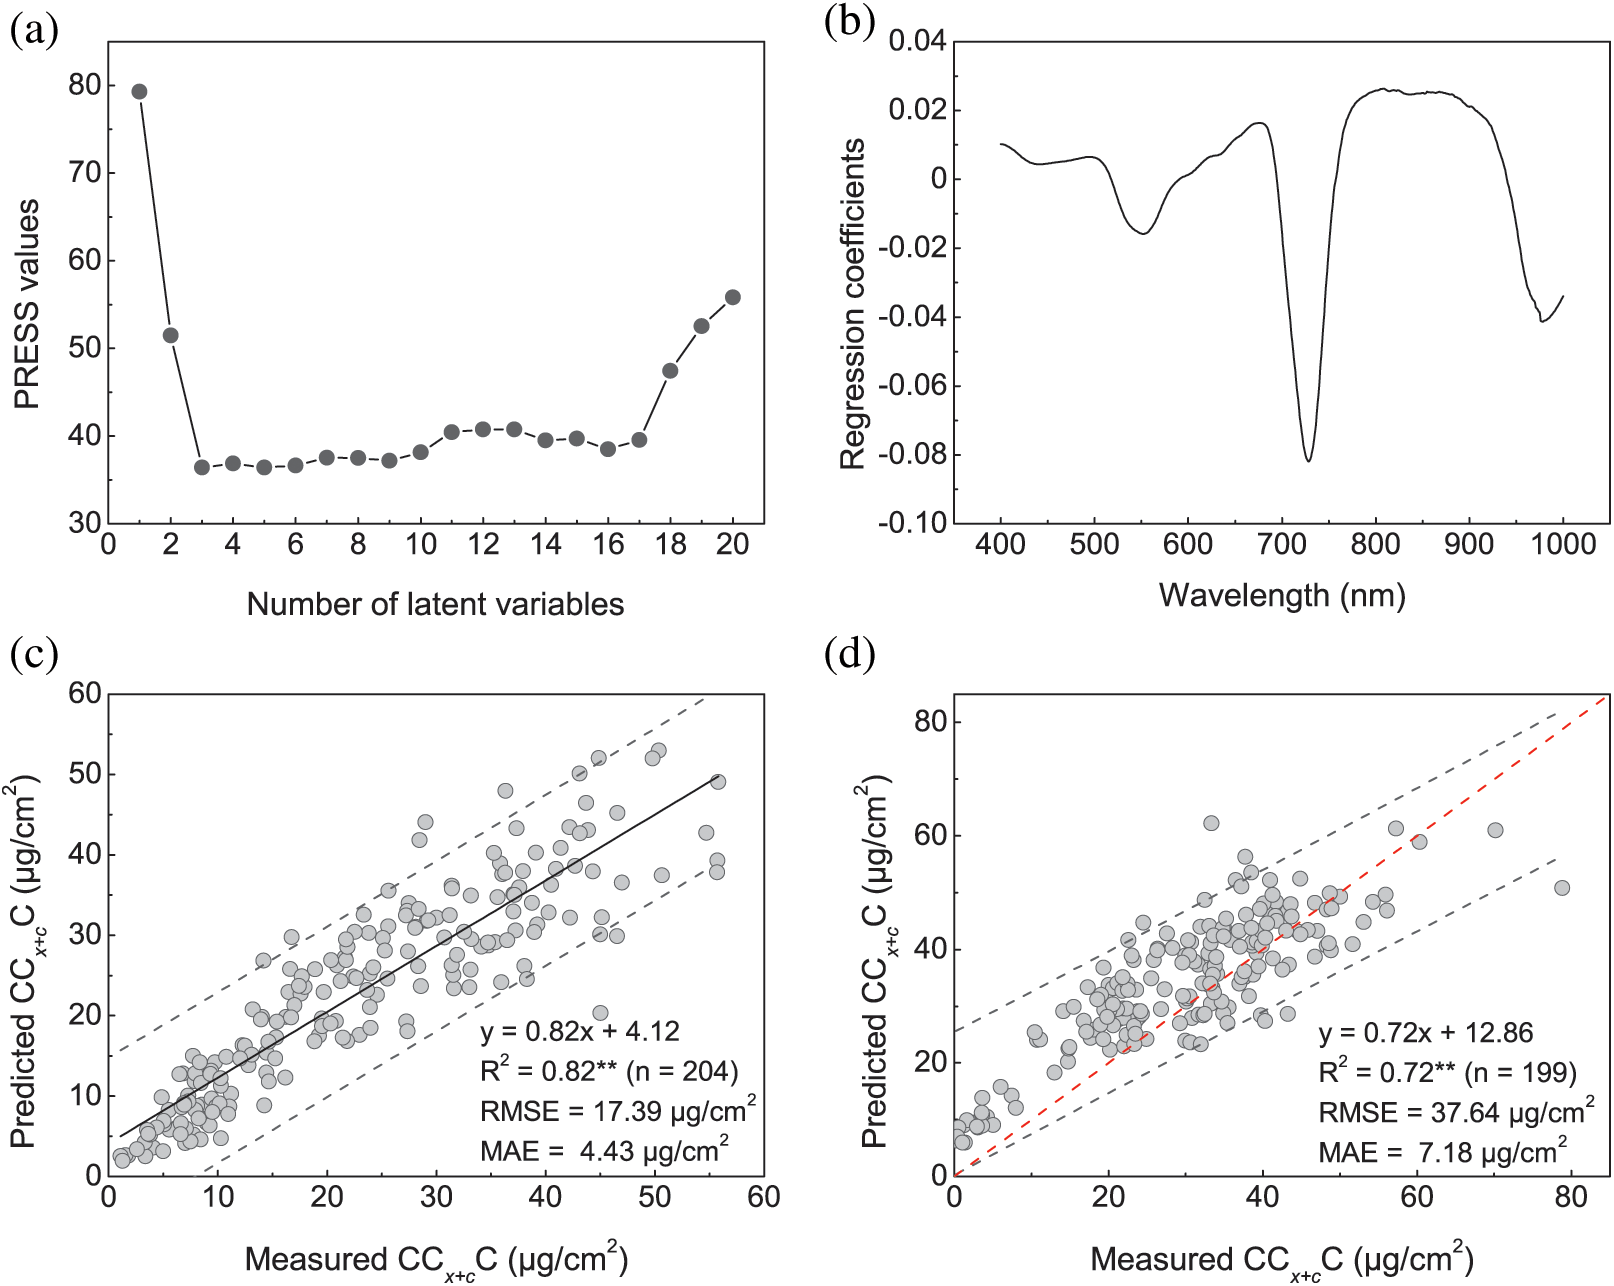
Figure 3: Relationship between numbers of latent variables and PRESS values (a), regression coefficients for PLSR calibration model for CCx+cC estimation (b), calibration result of PLSR model in CCx+cC assessment (c) and validation result of CCx+cC based on PLSR model (d). Solid and dash lines indicate the linear fit and 95% confidence intervals of prediction, respectively (the same below)
3.4 Mapping of CCx+cC Based on Airborne Hyperspectral Images
To better know the applicability of aerial remote sensing techniques in CCx+cC assessment, PHI hyperspectral datasets were used for mapping CCx+cC. First, relationship between CCx+cC and CCa+bC was investigated using Exp. 5 field survey data. Results in Fig. 4a show that a significant correlation exists between CCx+cC and CCa+bC (R2 = 0.96, p < 0.001). Since selected chlorophyll indices all performed well in CCx+cC assessment using ground-based data, here we chose CI red edge index for CCx+cC retrieval using PHI airborne hyperspectra on account of its good performance in CCa+bC assessment and robust application in satellite data, such as Sentinel-2/3 [19,20]. Results in Fig. 4b show that CCx+cC of sampling points could be estimated well using PHI airborne hyperspectra with an R2 value of 0.66. RMSE and MAE values of the estimation model were 20.71 and 4.53 μg/cm2, respectively. Nevertheless, some points in Fig. 4b with CCx+cC ranging from 30 to 40 μg/cm2 were estimated with poor accuracies. Reasons for this might be that data used in Exp. 5 was collected in booting and milk development stages, matured wheat ear in milk stage may largely influence PHI hyperspectral reflectance instead of pigment content, thus reducing the overall accuracy of CCx+cC.
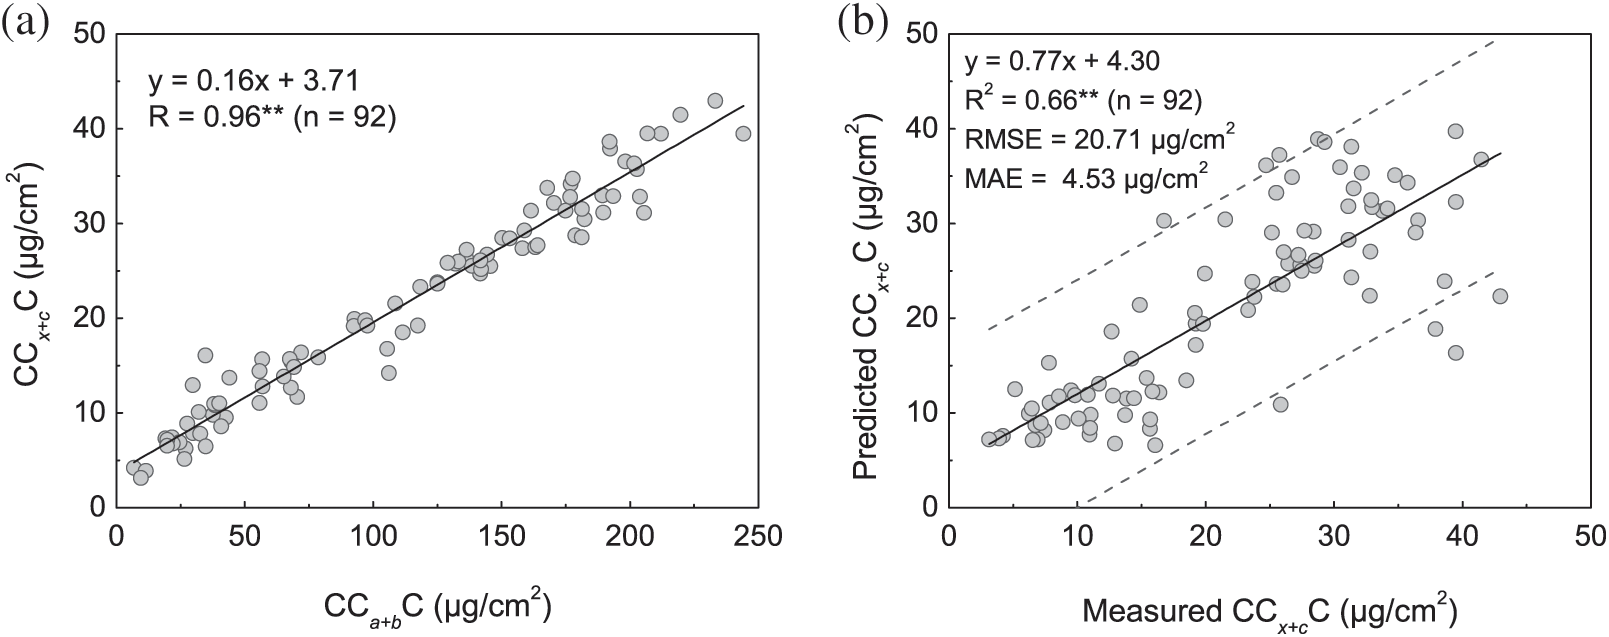
Figure 4: Relationship between CCx+cC and CCa+bC in winter wheat for 2002 datasets (a) and comparison between measured CCx+cC and predicted CCx+cC (b). Predicted CCx+cC was calculated using CI red edge index derived from PHI hyperspectra and the calibration model for CI red edge index in Table 4
The assessment model in Fig. 4b was then used to map spatial distribution of CCx+cC in winter wheat at regional scale. False color composite images of the study area presented in Figs. 5a and 5b show that growth conditions of winter wheat vary with growth stages. Spatial distribution of CCx+cC in Figs. 5c and 5d supports this view as well. In booting stage, reproductive growth of winter wheat could absorb plentiful nutrients to nourish the growth of winter wheat. Hence, CCx+cC was relatively high, with CCx+cC mostly ranging from 35 to 55 μg/cm2, and false color composite image appeared bright red in this stage. In contrast, winter wheat in milk development stage showed low CCx+cC, mainly varying from 8 to 18 μg/cm2, and image appeared dark red. Nevertheless, CCx+cC of sampling plots in milk development stage were extraordinarily higher than that of the adjacent area. Reasons for this phenomenon could be explained as follows: Experiment conducted in 2002 was composed of various water and nitrogen treatments. As mentioned in experiment section, nitrogen fertilizer and water were applied at different growth stages, CCx+cC of sampling plots did not show any abnormalities in booting stage due to water and nitrogen stressed condition was not obvious. In milk development stage, the rather high CCx+cC values of sampling plots was reaction of winter wheat to water or nitrogen stress. On the whole, assessment of CCx+cC using airborne hyperspectra is feasible and results of our study suggest that CCx+cC variations could provide some basis for monitoring crop stress.
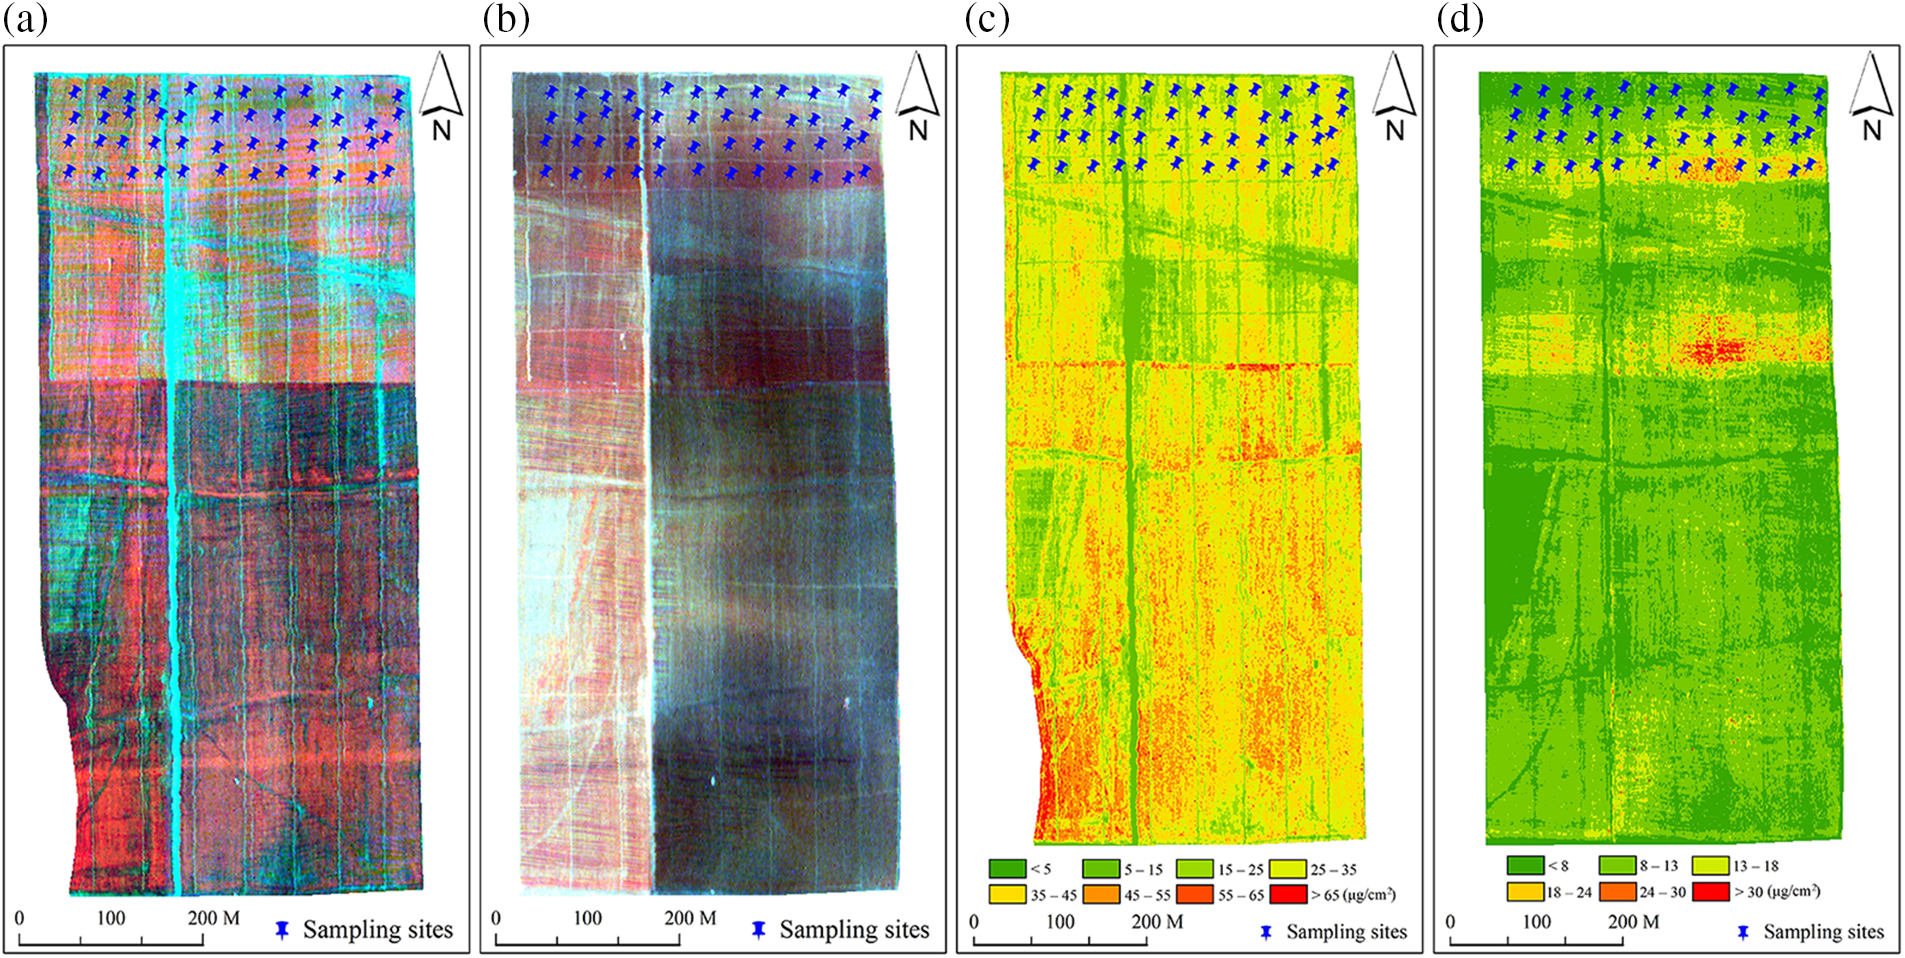
Figure 5: (a) and (b) are maps of the study area obtained on April 18 and May 31 of 2002, respectively. These images were synthetized in a false-color composite (R: 750 nm; G: 551 nm; B: 453 nm). (c) and (d) are corresponding maps of the CCx+cC derived using CI red edge spectral index based on 2002 datasets
In the present study, we tried to evaluate CCx+cC retrieval with hyperspectral reflectance ranged from visible to near-infrared region. A good relationship was found between CCx+cC and CCa+bC, and obvious strong correlations existed between CCx+cC and canopy reflectance ranging from visible to near-infrared wavebands, particularly in red-edge region. Many previous studies have proven that correlations existed between pigment content and canopy reflectance. For example, Blackburn [6] indicated that intercorrelation between concentration per unit area of carotenoids and chlorophylls in bracken accounted for that carotenoids are highly correlated with reflectance in red wavelengths (600–700 nm). Zou et al. [26] suggested that ratio between leaf carotenoid and chlorophyll content of LOPEX93 data is about 1:5 owing to correlation between them. Moreover, Netto et al. [14] demestrated that a direct linear relationship existed between total chlorophyll and carotenoids concentration in coffice leaves. These previous studies fuerther supported our results that excellent relationships existed between CCx+cC and CCa+bC regardless of crop types and growth stages, and thus could provide a basis for CCx+cC retrieval using hyperspectral reflectance ranged from visible to near-infrared region, particularly spectrum from red-edge wavebands that were sensitive to CCa+bC variations.
Result from this study has shown that chlorophyll indices composed by 705 and 750 nm reflectance performed with higher accuracy than all carotenoid indices in CCx+cC retrieval according to R2, RMSE, MAE and equations for regression lines. chlorophyll has a major absorption band in red region (670–680 nm) when pigment is dissolved in ether. However, within flesh leaves, absorption peaks shift toward longer wavelengths due to interactions between chlorophyll molecules and surrounding molecules such as protein, lipid and water. Degree of the shift is 10–50 nm as affected by physiological status and ratio between Chl a and Chl b. Consequently, absorption peak of leaf chlorophyll may not be fixed at around 670–680 nm [15]. This could explain that maximum correlation between CCa+bC (or CCx+cC) and wavelength ranged from 400 to 1000 nm was located around 700 nm, and that these chlorophyll indices (ND705, SR705 and CI red edge) could have better precision in assessing CCx+cC than all carotenoid indices. Moreover, we found that PLSR was effective for estimating CCx+cC, and its application in CCx+cC retrieval has further emphasized the importance of reflectance at wavebands that ranged from 700 to 750 nm for CCx+cC assessment, which accords with the research of Yi et al. [27]. Mapping of leaf Cx+c content with SRcars index by Hernández-Clemente et al. [13] suggested that carotenoid variations could be used to assess forests physiological condition. This accorded with our results that CCx+cC assessment could provide a basis for monitoring crop stress. For carotenoid indices, such as SRcars that uses reflectance from 517 and 570 nm might encounter an issue that SRcars could not be sensitive enough to Cx+c variations since these two wavebands are close, and differences in these two bands might be not obvious. By contrast, spectral indices that composed of red-edge spectrum could be more sensitive to Cx+c variations on condition that good relationships existed between CCx+cC and CCa+bC. Thus, the proposed method could be useful for CCx+cC retrieval at regional scale from aerial hyperspectral imagery.
However, there were still many shortcomings in this study, which need to be overcome or improved in future research. Firstly, linear relationships between CCx+cC and CCa+bC in winter wheat and maize provided basis for CCx+cC retrieval using canopy reflectance spectrum ranging from visible to near-infrared bands, particularly red edge wavebands. Nevertheless, more research should be conducted to generalize the approach for assessing CCx+cC in different crops, such as rice and barley. Moreover, canopy reflectance of winter wheat obtained with portable spectrometer during major growth stages is affected by multiple factors, effect of crop background, plant structure, and observation geometry on spectra response and CCx+cC retrieval should be considered and investigated. PROSAIL model, which coupling leaf radiative transfer model, PROSPECT [29] and canopy radiative transfer model, SAIL [30], has the advantage to simulate canopy reflectance for combination of biochemical parameters and observation conditions. This might help to quantify these mentioned effects in CCx+cC estimation for future researches.
This study aimed to assess the potentiality to estimate CCx+cC in winter wheat using field based- and aerial hyperspectral measurements in the visible and near-infrared spectrum. Four field survey datasets acquired during major growth stages of winter wheat were used to analyze the relationship between CCx+cC and canopy reflectance ranging from visible to near-infrared wavebands. Models for CCx+cC retrieval relying on spectral indices method and PLSR were evaluated using these data as well. PHI airborne hyperspectral imagery obtained independently was used for mapping CCx+cC at the regional scale. Results showed that a good correlation existed between CCx+cC and canopy reflectance ranged from 400 to 1000 nm, and maximum correlation occurred when waveband was around 700 nm, which supported the feasibility to assess CCx+cC with spectrum in the visible and near-infrared wavebands. For carotenoid indices, RARS and PSRI performed with satisfactory results in both calibration and validation models in CCx+cC retrieval. CCx+cC assessment based on chlorophyll indices (ND705, SR705, CI red edge and CI green) showed excellent results, among which CI red edge performed with the highest accuracy in CCx+cC retrieval. PLSR worked even better for CCx+cC retrieval when applied to canopy reflectance. Regression coefficients of PLSR highlighted the importance of reflectance at wavebands ranging from 700 to 750 nm in CCx+cC assessment, which supports the feasibility of making use of these wavebands in CCx+cC retrieval. Use of high-resolution imagery data obtained by PHI sensor onboard airborne platforms achieved satisfactory results in mapping CCx+cC on regional scale and spatial distribution of CCx+cC could provide some reference for monitoring plant physiological conditions.
Acknowledgement: The authors thank the reviewers for their helpful comments and suggestions. We also would like to thank those who helped with the field campaign at the National Experimental Station for Precision Agriculture.
Funding Statement: This study was supported by the Fundamental Research Funds for the Provincial Universities of Zhejiang (Project No. GK229909299001-302), the National Natural Science Foundation of China (Project No. 41901268), the Natural Science Foundation of Zhejiang Province (Project No. LQ19D010009), the Provincial Education Department General Scientific Research Items (Project No. Y202249845).
Conflicts of Interest: The authors declare that they have no conflicts of interest to report regarding the present study.
References
1. Nobel, P. S. (2009). Physicochemical and environmental plant physiology (Fourth Edition). New York: Elsevier Academic Press. [Google Scholar]
2. Lichtenthaler, H. K. (1998). The stress concept in plants: An introduction. Annals of the New York Academy of Sciences, 851(1), 187–198. [Google Scholar] [PubMed]
3. Sims, D. A., Gamon, J. A. (2002). Relationships between leaf pigment content and spectral reflectance across a wide range of species, leaf structures and developmental stages. Remote Sensing of Environment, 81(2), 337–354. [Google Scholar]
4. Frank, H. A., Cogdell, R. J. (1996). Carotenoids in photosynthesis. Photochemistry and Photobiology, 63(3), 257–264. [Google Scholar] [PubMed]
5. Strzałka, K., Kostecka-Gugała, A., Latowski, D. (2003). Carotenoids and environmental stress in plants: Significance of carotenoid-mediated modulation of membrane physical properties. Russian Journal of Plant Physiology, 50(2), 168–173. [Google Scholar]
6. Blackburn, G. A. (1998). Quantifying chlorophylls and carotenoids at leaf and canopy scales: An evaluation of some hyperspectral approaches. Remote Sensing of Environment, 66(3), 273–285. [Google Scholar]
7. Fassnacht, F. E., Stenzel, S., Gitelson, A. A. (2015). Non-destructive estimation of foliar carotenoid content of tree species using merged vegetation indices. Journal of Plant Physiology, 176, 210–217. [Google Scholar] [PubMed]
8. Blackburn, G. A. (2007). Hyperspectral remote sensing of plant pigments. Journal of Experimental Botany, 58(4), 855–867. [Google Scholar] [PubMed]
9. Féret, J., François, C., Gitelson, A., Asner, G. P., Barry, K. M. et al. (2011). Optimizing spectral indices and chemometric analysis of leaf chemical properties using radiative transfer modeling. Remote Sensing of Environment, 115(10), 2742–2750. [Google Scholar]
10. Zarco-Tejada, P. J., Guillén-Climent, M. L., Hernández-Clemente, R., Catalina, A., González, M. R. et al. (2013). Estimating leaf carotenoid content in vineyards using high resolution hyperspectral imagery acquired from an unmanned aerial vehicle (UAV). Agricultural and Forest Meteorology, 171, 281–294. [Google Scholar]
11. Chappelle, E. W., Kim, M. S., McMurtrey, J. E. (1992). Ratio analysis of reflectance spectra (RARSAn algorithm for the remote estimation of the concentrations of chlorophyll a, chlorophyll b, and carotenoids in soybean leaves. Remote Sensing of Environment, 39(3), 239–247. [Google Scholar]
12. Gitelson, A. A., Zur, Y., Chivkunova, O. B., Merzlyak, M. N. (2002). Assessing carotenoid content in plant leaves with reflectance spectroscopy. Photochemistry and Photobiology, 75(3), 272–281. [Google Scholar] [PubMed]
13. Hernández-Clemente, R., Navarro-Cerrillo, R. M., Zarco-Tejada, P. J. (2012). Carotenoid content estimation in a heterogeneous conifer forest using narrow-band indices and PROSPECT+DART simulations. Remote Sensing of Environment, 127, 298–315. [Google Scholar]
14. Netto, A. T., Campostrini, E., de Oliveira, J. G. A., Bressan-Smith, R. E. (2005). Photosynthetic pigments, nitrogen, chlorophyll a fluorescence and SPAD-502 readings in coffee leaves. Scientia Horticulturae, 104(2), 199–209. [Google Scholar]
15. Inoue, Y., Sakaiya, E., Zhu, Y., Takahashi, W. (2012). Diagnostic mapping of canopy nitrogen content in rice based on hyperspectral measurements. Remote Sensing of Environment, 126, 210–221. [Google Scholar]
16. Kira, O., Linker, R., Gitelson, A. (2015). Non-destructive estimation of foliar chlorophyll and carotenoid contents: Focus on informative spectral bands. International Journal of Applied Earth Observation and Geoinformation, 38, 251–260. [Google Scholar]
17. Yu, K., Lenz-Wiedemann, V., Chen, X., Bareth, G. (2014). Estimating leaf chlorophyll of barley at different growth stages using spectral indices to reduce soil background and canopy structure effects. ISPRS Journal of Photogrammetry and Remote Sensing, 97, 58–77. [Google Scholar]
18. Gao, J. (2006). Experimental guidance for plant physiology. Beijing, China: Higher Education Press. [Google Scholar]
19. Clevers, J. G., Gitelson, A. A. (2013). Remote estimation of crop and grass chlorophyll and nitrogen content using red-edge bands on Sentinel-2 and -3. International Journal of Applied Earth Observation and Geoinformation, 23, 344–351. [Google Scholar]
20. Clevers, J. G., Kooistra, L. (2012). Using hyperspectral remote sensing data for retrieving canopy chlorophyll and nitrogen content. IEEE Journal of Selected Topics in Applied Earth Observations and Remote Sensing, 5(2), 574–583. [Google Scholar]
21. Merzlyak, M. N., Gitelson, A. A., Chivkunova, O. B., Rakitin, V. Y. (1999). Non-destructive optical detection of pigment changes during leaf senescence and fruit ripening. Physiologia Plantarum, 106(1), 135–141. [Google Scholar]
22. Gitelson, A. A., Keydan, G. P., Merzlyak, M. N. (2006). Three-band model for noninvasive estimation of chlorophyll, carotenoids, and anthocyanin contents in higher plant leaves. Geophysical Research Letters, 33(11), 1–5. [Google Scholar]
23. Garrity, S. R., Eitel, J. U., Vierling, L. A. (2011). Disentangling the relationships between plant pigments and the photochemical reflectance index reveals a new approach for remote estimation of carotenoid content. Remote Sensing of Environment, 115(2), 628–635. [Google Scholar]
24. Gitelson, A. A., Merzlyak, M. N. (1994). Quantitative estimation of chlorophyll-a using reflectance spectra: Experiments with autumn chestnut and maple leaves. Journal of Photochemistry and Photobiology B Biology, 22(3), 247–252. [Google Scholar]
25. Wold, S., Sjostrom, M., Eriksson, L. (2001). PLS-regression: A basic tool of chemometrics. Chemometrics and Intelligent Laboratory Systems, 58(2), 109–130. [Google Scholar]
26. Zou, X., Hernández-Clemente, R., Tammeorg, P., Lizarazo Torres, C., Stoddard, F. L. et al. (2015). Retrieval of leaf chlorophyll content in field crops using narrow-band indices: Effects of leaf area index and leaf mean tilt angle. International Journal of Remote Sensing, 36(24), 6031–6055. [Google Scholar]
27. Yi, Q., Jiapaer, G., Chen, J., Bao, A., Wang, F. (2014). Different units of measurement of carotenoids estimation in cotton using hyperspectral indices and partial least square regression. ISPRS Journal of Photogrammetry and Remote Sensing, 91, 72–84. [Google Scholar]
28. Hansen, P., Schjoerring, J. (2003). Reflectance measurement of canopy biomass and nitrogen status in wheat crops using normalized difference vegetation indices and partial least squares regression. Remote Sensing of Environment, 86(4), 542–553. [Google Scholar]
29. Jacquemoud, S., Baret, F. (1990). PROSPECT: A model of leaf optical properties spectra. Remote Sensing of Environment, 34(2), 75–91. [Google Scholar]
30. Verhoef, W. (1984). Light scattering by leaf layers with application to canopy reflectance modeling: The SAIL model. Remote Sensing of Environment, 16(2), 125–141. [Google Scholar]
Cite This Article
 Copyright © 2023 The Author(s). Published by Tech Science Press.
This work is licensed under a Creative Commons Attribution 4.0 International License , which permits unrestricted use, distribution, and reproduction in any medium, provided the original work is properly cited.
 Downloads
 Citation Tools