 Open Access
ARTICLE
Genome-Wide Identification of ALDH Gene Family under Salt and Drought Stress in Phaseolus vulgaris
Department of Pharmacy Services, Kırıkhan Vocational School, Hatay Mustafa Kemal University, Hatay, 326, Türkiye
* Corresponding Author: Abdil Hakan Eren. Email:
(This article belongs to the Special Issue: Abiotic Stress Tolerance in Crop Plants: Physio-biochemical and Molecular Mechanisms)
Phyton-International Journal of Experimental Botany 2024, 93(11), 2883-2907. https://doi.org/10.32604/phyton.2024.058627
Received 17 September 2024; Accepted 16 October 2024; Issue published 30 November 2024
Abstract
Background: Aldehyde dehydrogenase (ALDH) genes constitute an important family of supergenes that play key roles in synthesizing various biomolecules and maintaining cellular homeostasis by catalyzing the oxidation of aldehyde products. With climate change increasing the exposure of plants to abiotic stresses such as salt and drought, ALDH genes have been identified as important contributors to stress tolerance. In particular, they help to reduce stress-induced lipid peroxidation. Objectives: This study aims to identify and characterize members of the ALDH supergene family in Phaseolus vulgaris through a genome-wide bioinformatic analysis and investigate their role in response to abiotic stressors such as drought and salt stress. Methods: Genome-wide identification of 26 ALDH genes in P. vulgaris was performed using bioinformatics tools. The identified ALDH proteins were analyzed for molecular weight, amino acid number, and exon number. Phylogenetic analysis was performed to classify P. vulgaris, Arabidopsis thaliana, and Glycine max ALDH proteins into different groups. Strong links between these genes and functions related to growth, development, stress responses, and hormone signaling were identified by cis-element analysis in promoter regions. In silico expression, analysis was performed to assess gene expression levels in different plant tissues. Results: RT-qPCR results showed that the expression of ALDH genes was significantly altered under drought and salt stress in beans. This study provides a comprehensive characterization of the ALDH supergene family in P. vulgaris, highlighting their potential role in abiotic stress tolerance. Conclusion: These findings provide a basis for future research on the functional roles of ALDH genes in enhancing plant resistance to environmental stressors.Keywords
Supplementary Material
Supplementary Material FileCommon bean (Phaseolus vulgaris L.) is an important food source in meeting the nutritional needs of humans in terms of protein, carbohydrate, mineral, and vitamin content [1]. It also has health-beneficial components and phenolic compounds with antioxidant activity [2]. Compared to other legumes, beans are very valuable in terms of nutritional value, with 20.9/100 g protein, 2.49/100 g lipid, 8.55/100 g crude fibre, and 54.3/100 g carbohydrate content [3]. When the legume production in 2021 was analyzed, beans were the most produced legume, with 27 million tons on 35 million hectares of the cultivated area [4].
With global climate change, environmental stress events to which plants are exposed have started to occur more frequently and for longer periods [5]. Stresses to which plants are exposed are divided into two parts: biotic and abiotic stresses. Factors such as heavy metals, drought, extreme heat, extreme cold, and salinity are classified as abiotic stresses. Stresses caused by pathogenic and parasitic organisms such as bacteria, insects, fungi, and viruses are classified as biotic stresses [6]. As a result of changing environmental conditions, soil salinity is accelerating in arid and semi-arid regions of the world [7]. As a result, there are negative effects on the growth, development, and yield of plants [5].
Drought stress reduces nutrient uptake and translocation of these nutrients from roots to shoots, causing all metabolic processes to be affected [8]. Drought stress, especially during flowering and pod-filling periods of beans, causes serious damage to the number of seeds and pods per plant, dry matter production, leaf area, seed size, and grain yield [9]. The accumulation of reactive oxygen species (ROS) in plant cells as a result of drought stress can disrupt membrane integrity and cause oxidative damage to DNA, lipids, and proteins [10].
Salinity stress is one of the most important factors affecting agricultural yield. The use of inadequate and salt-containing irrigation water in arid and semi-arid regions, salt accumulation in the upper part of the soil due to excessive irrigation, and the increase of salts in groundwater in the plant root zone due to excessive evaporation cause salinity stress [11]. As a result of this stress, negative effects such as osmotic stress, impaired hormone regulation, nutrient imbalance, and decreased carbon fixation are observed in plants [12].
The ALDH super gene family includes 13 different families in plants. These families are ALDH 2-3-5-6-7-10-11-1218-21-22-23 and 24 families, and ALDH 10-12-21-22-23 and 24 families are plant-specific gene families [13]. As a result of sequence comparison of ALDH genes in different organisms, marker amino acid motifs were identified. One of them is the glutamic acid (PS0687) active site, and the other is the cysteine (PS0070) active site [14,15]. The aldehyde dehydrogenase (ALDH) (E.C.: 1.2.1.3) superfamily includes NAD(P)+ dependent enzymes that catalyze the oxidation of endogenously and exogenously produced aromatic and aliphatic aldehydes. They play important roles in the synthesis of various biomolecules including amino acids, carbohydrates, lipids, and vitamins [16]. Aldehyde dehydrogenases are components involved in basic plant metabolism and stabilize aldehyde concentrations [17]. Under stress conditions, reactive oxygen species (ROS) are formed as a result of damage to plant cells. As a result, lipid hydrogen peroxides and their aldehyde products can cause damage to lipid membranes and increase cellular toxicity [18]. As a result of such disturbances in plant metabolism due to abiotic stress, aldehyde dehydrogenases provide homeostasis by reducing aldehydes [17]. ALDHs metabolize the toxic aldehyde intermediate betaine aldehyde to glycine betaine [16]. ALDHs have been found to be very important in tolerance to oxidative damage caused by abiotic stress. In Arabidopsis thaliana, overexpression of ALDH3I1 and ALDH7B4 genes was found to reduce lipid peroxidation caused by salt and drought stress [19]. Similarly, overexpression of the ALDH22A1 gene in Zea mays decreased MDA levels [20]. The increased expression level of the ALDH2B8 gene in Vitis vinifera plants showed a tolerance effect under high salt and drought stress [21]. ALDH7B1-5A gene in Triticum aestivum was found to increase drought tolerance [22].
The first studies related to ALDH genes in plants examined betaine accumulated in plant tissues and its catalyzer betaine aldehyde dehydrogenase (BADH). One study examined betaine accumulation and enzyme activity in Spinacia oleracea during water stress, another study characterized BADH in Spinacia oleracea, another study examined betaine accumulation and enzyme activity in Spinacia oleracea under salt and drought stress, and another study examined betaine accumulation and enzyme activity in Hordeum vulgare under salt stress [23–26]. The first identification of ALDH was the homology study of the rf2 gene, which is involved in pollen development in maize, with mammalian mitochondrial aldehyde dehydrogenase genes. As a result of this study, the rf2 gene was thought to encode an ALDH [27]. In the first study on the ALDH superfamily, 39 ALDH genes in 18 different plant species were named and listed [28]. In the first comprehensive study, 14 ALDH genes encoding 9 different protein family members were classified in Arabidopsis thalina [17], moreover, ALDH genes have been identified in Populus trichocarpa, Selaginella moellindorffii, Sorghum bicolor [13], Oryza sativa, Zea mays, and Vitis vinifera [29–31], G. max, Zea mays, and Malus domestica [32–34], Setaria italica, Gossypium raimondii, Populus trichocarpa, and Solanum lycopersicum [35–38]. Also, the ALDH gene family was studied in Gossypium arboreum, Gossypium barbadense and Gossypium hirsutum [39], Brassica rapa, Brassica rapa subsp. Pekinensis, Solanum tuberosum, and Cicer arietinum [40–43], Saccharum spontaneum, Allium sativum, Arachis hypogaea, and Phyllostachys edulis [44–47].
The study of genes that show different expression profiles in plants grown under stress conditions may lead to the identification of useful genes to increase the tolerance of varieties to salt and drought stress [48]. The cultivation and productivity of beans, an important legume, is also affected by abiotic stresses like other crops. Considering the threatening scenarios of climate change in the future, a research approach compatible with globally sustainable agricultural practices is needed [49]. There are no studies on the genome-wide analysis of the ALDH gene family in Phaseolus vulgaris. Therefore, this study aims to contribute to the literature with the information obtained from genome-wide analysis of PvALDH genes.
2.1 Identification of ALDH Super Gene Family Members in P. vulgaris Genome and Determination of Protein Properties
Pfam Accession Number (PF00171) obtained from the Pfam database [50] was used to access the protein sequences of ALDH supergene family members in the genomes of Phaseolus vulgaris (https://phytozome-next.jgi.doe.gov/info/Pvulgaris5_593_v1_1) (accessed on 15 October 2024), Glycine max [51] and Arabidopsis thaliana [52]. ALDH protein sequences in the Phytozome v13 database were searched using this accession number [53]. The coding and non-coding regions of PvALDH genes were identified and visualized in the Gene Structure Display (GSDS) v2.0 web tool using the genomic and CDS sequences included in the sequence information [54]. In addition, the positions of PvALDH genes on the chromosome were plotted with the help of the TBtools program [55]. The presence of ALDH domains in plant genomes was screened using the HMMER database [56]. Conserved glutamic acid (PS0687) and cysteine (PS0070) active sites in PvALDH proteins were searched using the PROSITE database [57]. The amino acid number, molecular weight, theoretical isoelectric point (pI), and stability status of PvALDH proteins were obtained with the help of the Protparam tool using the aliphatic index and protein sequences [58]. Localization information of ALDH genes using PvALDH protein sequences was obtained with the WoLF PSORT web tool [59].
2.2 Gene Duplication, Conserved Motif, and Phylogenetic Analysis of PvALDH Super Gene Family Members
With the help of PvALDH CDS and protein sequences, the non-synonymous ratio (Ka) and synonymous ratio (Ks) of duplicated genes divided by the evolutionary change (Ka/Ks) were calculated using the TBtools program [55]. Time (million years ago, Mya) of duplication and divergence of each ALDH gene were estimated based on T = Ks/2λ (λ = 6.56E-9) formula [60,61]. The Multiple EM for Motif Elimination (MEME) tool was used for the detection of conserved motifs in PvALDH amino acid sequences [62]. The settings used in the analysis were as described by Muslu et al. [63]. In addition, BioEdit Sequence Alignment Editor v7.7.1 (https://thalljiscience.github.io/) (accessed on 15 October 2024) was used to screen for conserved glutamic acid (PS0687) and cysteine (PS0070) active sites between ALDH genes. The phylogenetic analysis between P. vulgaris, G. max, and A. thaliana ALDH genes was plotted by the Maximum likelihood method, with 1000 replicated bootstrap values using Mega 7 software [64]. The phylogenetic tree was visualized using the iTOL web tool [65].
2.3 Synteny Analysis of PvALDH Super Gene Family Members
MCScanX tool was used to determine the orthologous relationship between P. vulgaris, G. max, and A. thaliana ALDH genes [66]. The synteny map was visualized using the gene information in the files obtained as a result of the analysis with the help of TBtools software [55].
2.4 Cis-Element Analysis of PvALDH Super Gene Family Members in the Upstream Region
The upstream 2 kb region of PvALDH genes was retrieved from the Phytozome database, and then, with the help of this sequence information, cis-elements in the upstream region of PvALDH genes were screened using the PlantCARE database [67].
2.5 Protein-Protein Interactions, Gene Ontology Analysis, and Homology Model of PvALDH
To examine the protein-protein interactions of PvALDHs, protein sequences were analyzed using the STRING database (https://string-db.org/) (accessed on 15 October 2024). The results were visualized using Cytoscape software [68]. The P. vulgaris annotation file was retrieved from the Phytozome v13 database. GO ID and description information of PvALDH genes in this file were taken out. In addition, the STRING database (https://string-db.org/) was searched using PvALDH protein sequence information. As a result of this search, GO ID and definition information were obtained and merged with the previous data. Protein homology models were obtained with the help of the Phyre2 database using PvALDH protein sequences [69]. As a result of the analysis, the 3D protein structures with the highest confidence value score were selected.
2.6 In-Silico Analysis of PvALDH Members
The expression data of PvALDH genes in leaves stems, roots and flowers of bean plants were obtained from the Phytozome v13 database. Expression values in FPKM were log2 transformed and visualized in TBtools software. In addition, RNA-seq data of P. vulgaris under salt and drought stress were obtained from the SRA library in the NCBI database. The accession numbers SRR957668 for salt stress SRR958469 for salt stress control [70] SRR8284481 for drought stress, and SRR8284480 for drought stress control [71] were searched. Expression values in RPKM were log2 transformed and visualized in TBtools [55].
2.7 Plant Material and Stress Treatments
This study utilized P. vulgaris cv. “Serra” and P. vulgaris cv. “Elkoca-05” is sourced from the Department of Molecular Biology and Genetics at Erzurum Technical University. These types were favored because Aygören et al. [72] established their resilience to salinity and drought stress. The seeds were immersed in a 1% (v/v) NaOCl solution for 5 min for surface sterilization. The seeds were subsequently sown in pots filled with wet perlite and Hoagland’s solution for germination. Seedlings were maintained in pots until they attained the three-leaf stage. Seedlings were maintained in a regulated environmental growth chamber at 25°C, 70% relative humidity, under illumination with a photosynthetic photon flux of 250 µmol m−2 s−1. They were additionally irrigated with Hoagland’s solution as required. Subsequently, seedlings of uniform size were relocated to a hydroponic medium comprising 0.2 L of modified 1/10 Hoagland solution. The Hoagland solution comprises both macronutrients and micronutrients. The nutrient concentrations are 2 mM Ca, 10−6 Mn, 4 mM NO3, 2.10−7 M Cu, 1 mM Mg, 10−8 M NH4, 2 mM K, 10−6 M Zn, 0.2 mM P, 10−4 M Fe and 10−6 M B ions [73]. Salt stress was administered under identical growth conditions using a Hoagland solution with 150 mM NaCl for 9 days [72]. For drought stress, samples cultivated under identical conditions were maintained in Hoagland solution with 0% (control) and 20% PEG6000 for 24 h [72]. Upon completion of the stress treatments, the leaf tissues extracted from the samples were immersed in liquid nitrogen and preserved at −80°C until the analysis was conducted. The samples included in the study were cultivated in three replicates, and qRT-PCR tests were conducted in three biological replicates.
2.8 Total RNA Isolation, cDNA Synthesis, and qRT-PCR Analysis
Total RNA extraction from the samples was conducted with Trizol® Reagent (Invitrogen Life Technologies, Carlsbad, CA, USA). Following isolation, RNA quality was assessed using a Multiskan Go spectrophotometer (Thermo Fisher Scientific, Vantaa, Finland) and subsequently visualized using 1% agarose gel electrophoresis. cDNA synthesis was conducted utilizing the SensiFAST™ cDNA Synthesis Kit (Cat. No. Bio-65053, UK) in accordance with the manufacturer’s instructions. Based on the RNAseq data, five PvALDH genes were chosen for qRT-PCR investigations (the primer list and additional information are included in the Table S1). Quantitative reverse transcription polymerase chain reaction (qRT-PCR) was conducted using the RotorGene® Q Real-Time PCR System (Corbett Research, Qiagen GmbH, Germany) with ABT SYBER Green (Cat. No. Q03-02-01, Ankara, Türkiye) mix. The qRT-PCR reaction mixture totaled 20 μL, comprising 200 ng of cDNA, 0.4 μL each of forward and reverse primers, and 10 μL of 2× ABT SYBER Green Mix, with double distilled water added to get a final volume of 20 μL. The procedure was conducted as follows: 95°C for 10 min, succeeded by 40 cycles of 94°C for 15 s, 60°C for 30 s, and 72°C for 30 s. The β-Actin gene of P. vulgaris was utilized as the housekeeping gene. For relative quantification, qRT-PCR data were standardized using the 2−∆∆CT technique [74]. The primers utilized in this work are detailed in the Table S1. Statistical analyses were conducted utilizing GraphPad Prism 9 software (http://www.graphpad.com/) (accessed on 15 October 2024) employing one-way ANOVA with Dunnett’s test at a significance level of 0.05.
3.1 Nomenclature and Protein Properties of PvALDH Super Gene Family Members
In the Phytozome v13 database, 26 genes belonging to 10 ALDH families (2, 3, 5, 6, 7, 10, 11, 12, 18, and 22) were found in the P. vulgaris genome using accession number PF00171. The nomenclature of PvALDH genes was performed according to the Brockers method [13]. The presence of the aldehyde dehydrogenase domain was confirmed as a result of the analysis of the found PvALDH genes in the HMMER database. The information about these 26 genes is listed in Table 1 and protein properties are listed in Table 2. To understand the evolution of ALDH genes in different organisms, G. max and A. thaliana ALDH gene sequences were obtained with the same accession number.


23 ALDH genes encoding 10 different protein family members in B. rapa [40], 22 ALDH genes encoding 10 different protein family members in S. tuberosum [42], 27 ALDH genes encoding 10 different protein family members in C. arietinum [43], 34 ALDH genes encoding 10 different protein family members in S. bicolor [75], 34 ALDH genes encoding 9 different protein family members in A. sativum [45], 71 ALDH genes encoding 10 different protein family members in A. hypogaea [46] and 60 ALDH genes encoding 10 different protein family members in P. edulis [47].
As a result of the analysis, between 9 and 20 exons and between 8 and 19 introns were found in PvALDH genes, as shown in Fig. 1. PvALDH18B1 and PvALDH18B2 had the highest number of exons and introns. There were 2 to 21 exons in P. edulis [47], 5 to 20 exons in S. bicolor [75], and 2 to 20 exons in S. spontaneum [44]. When these data were analyzed, it was found that the B subfamily genes of the ALDH 18 family were the genes with the highest number of introns and exons.
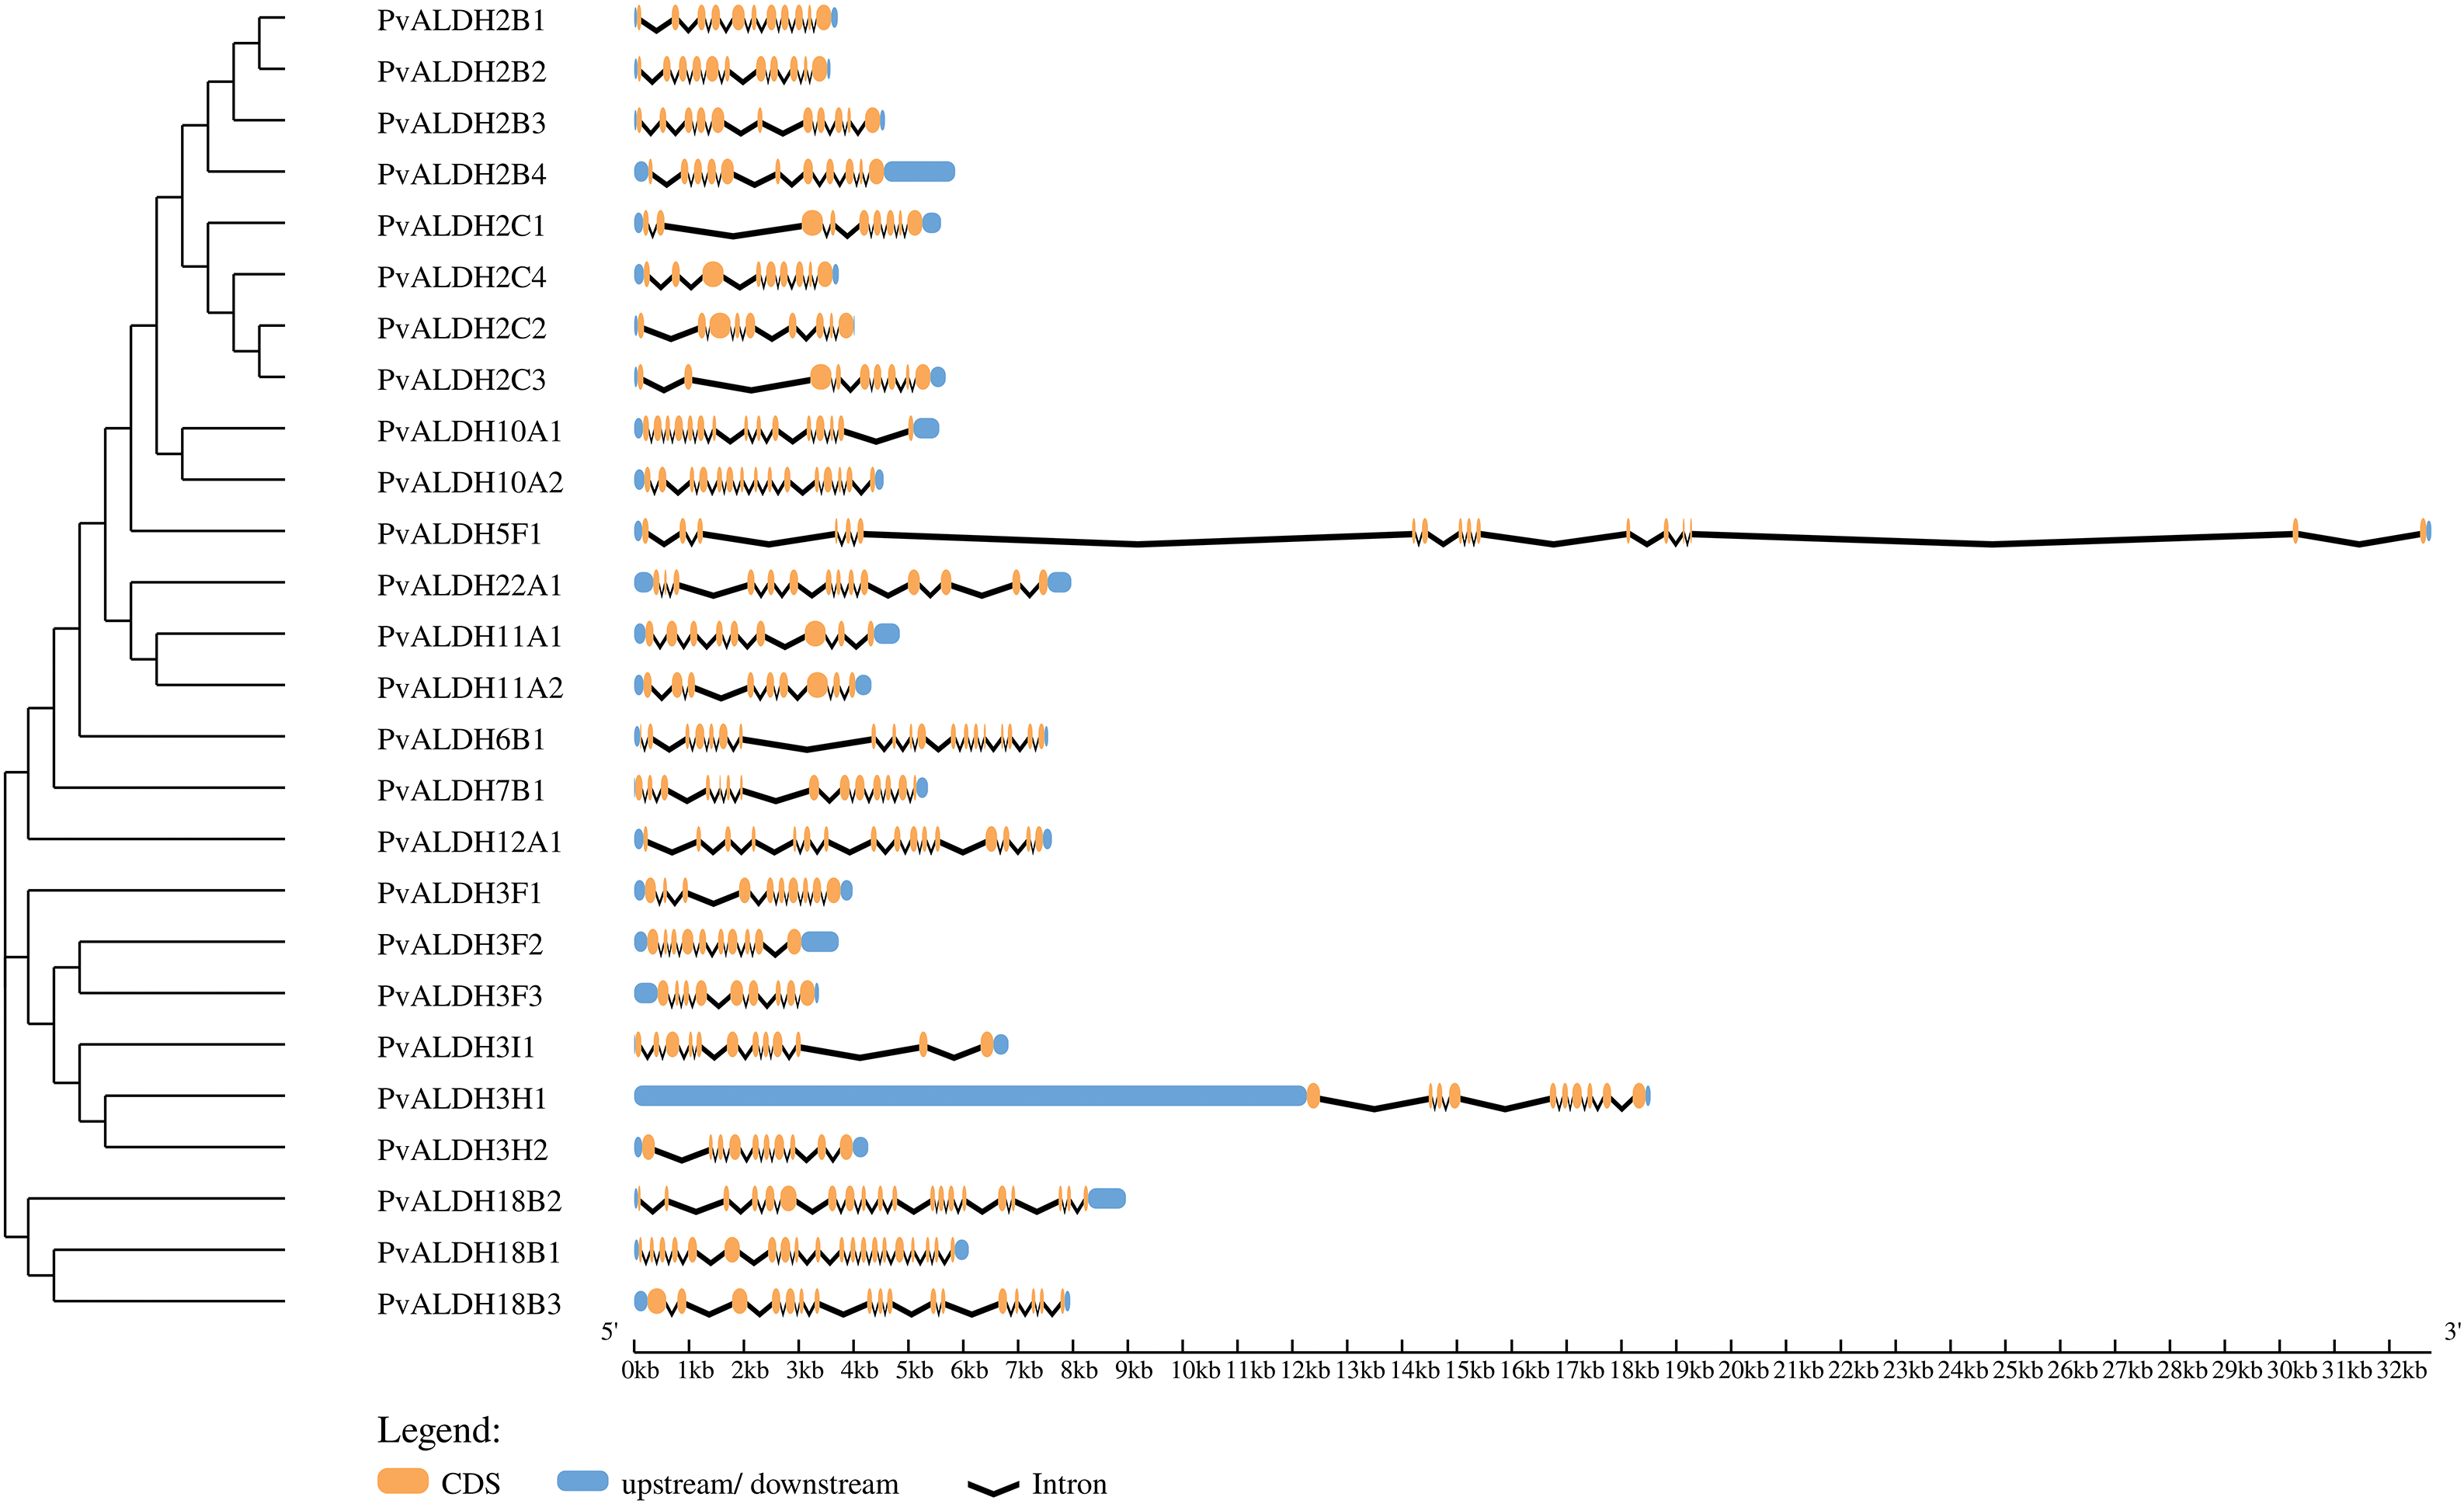
Figure 1: Structural representation of PvALDH genes. Orange color indicates exon and black lines indicate intron regions. Blue parts indicate 5′ and 3′ UTR regions
Fig. 2 presents PvALDH genes, which are distributed on 8 different bean chromosomes (PvChr1, PvChr2, PvChr3, PvChr4, PvChr5, PvChr8, PvChr9, PvChr11). The most genes are located on PvChr3. Only the PvALDH3F3 gene is located on Chromosome 11.
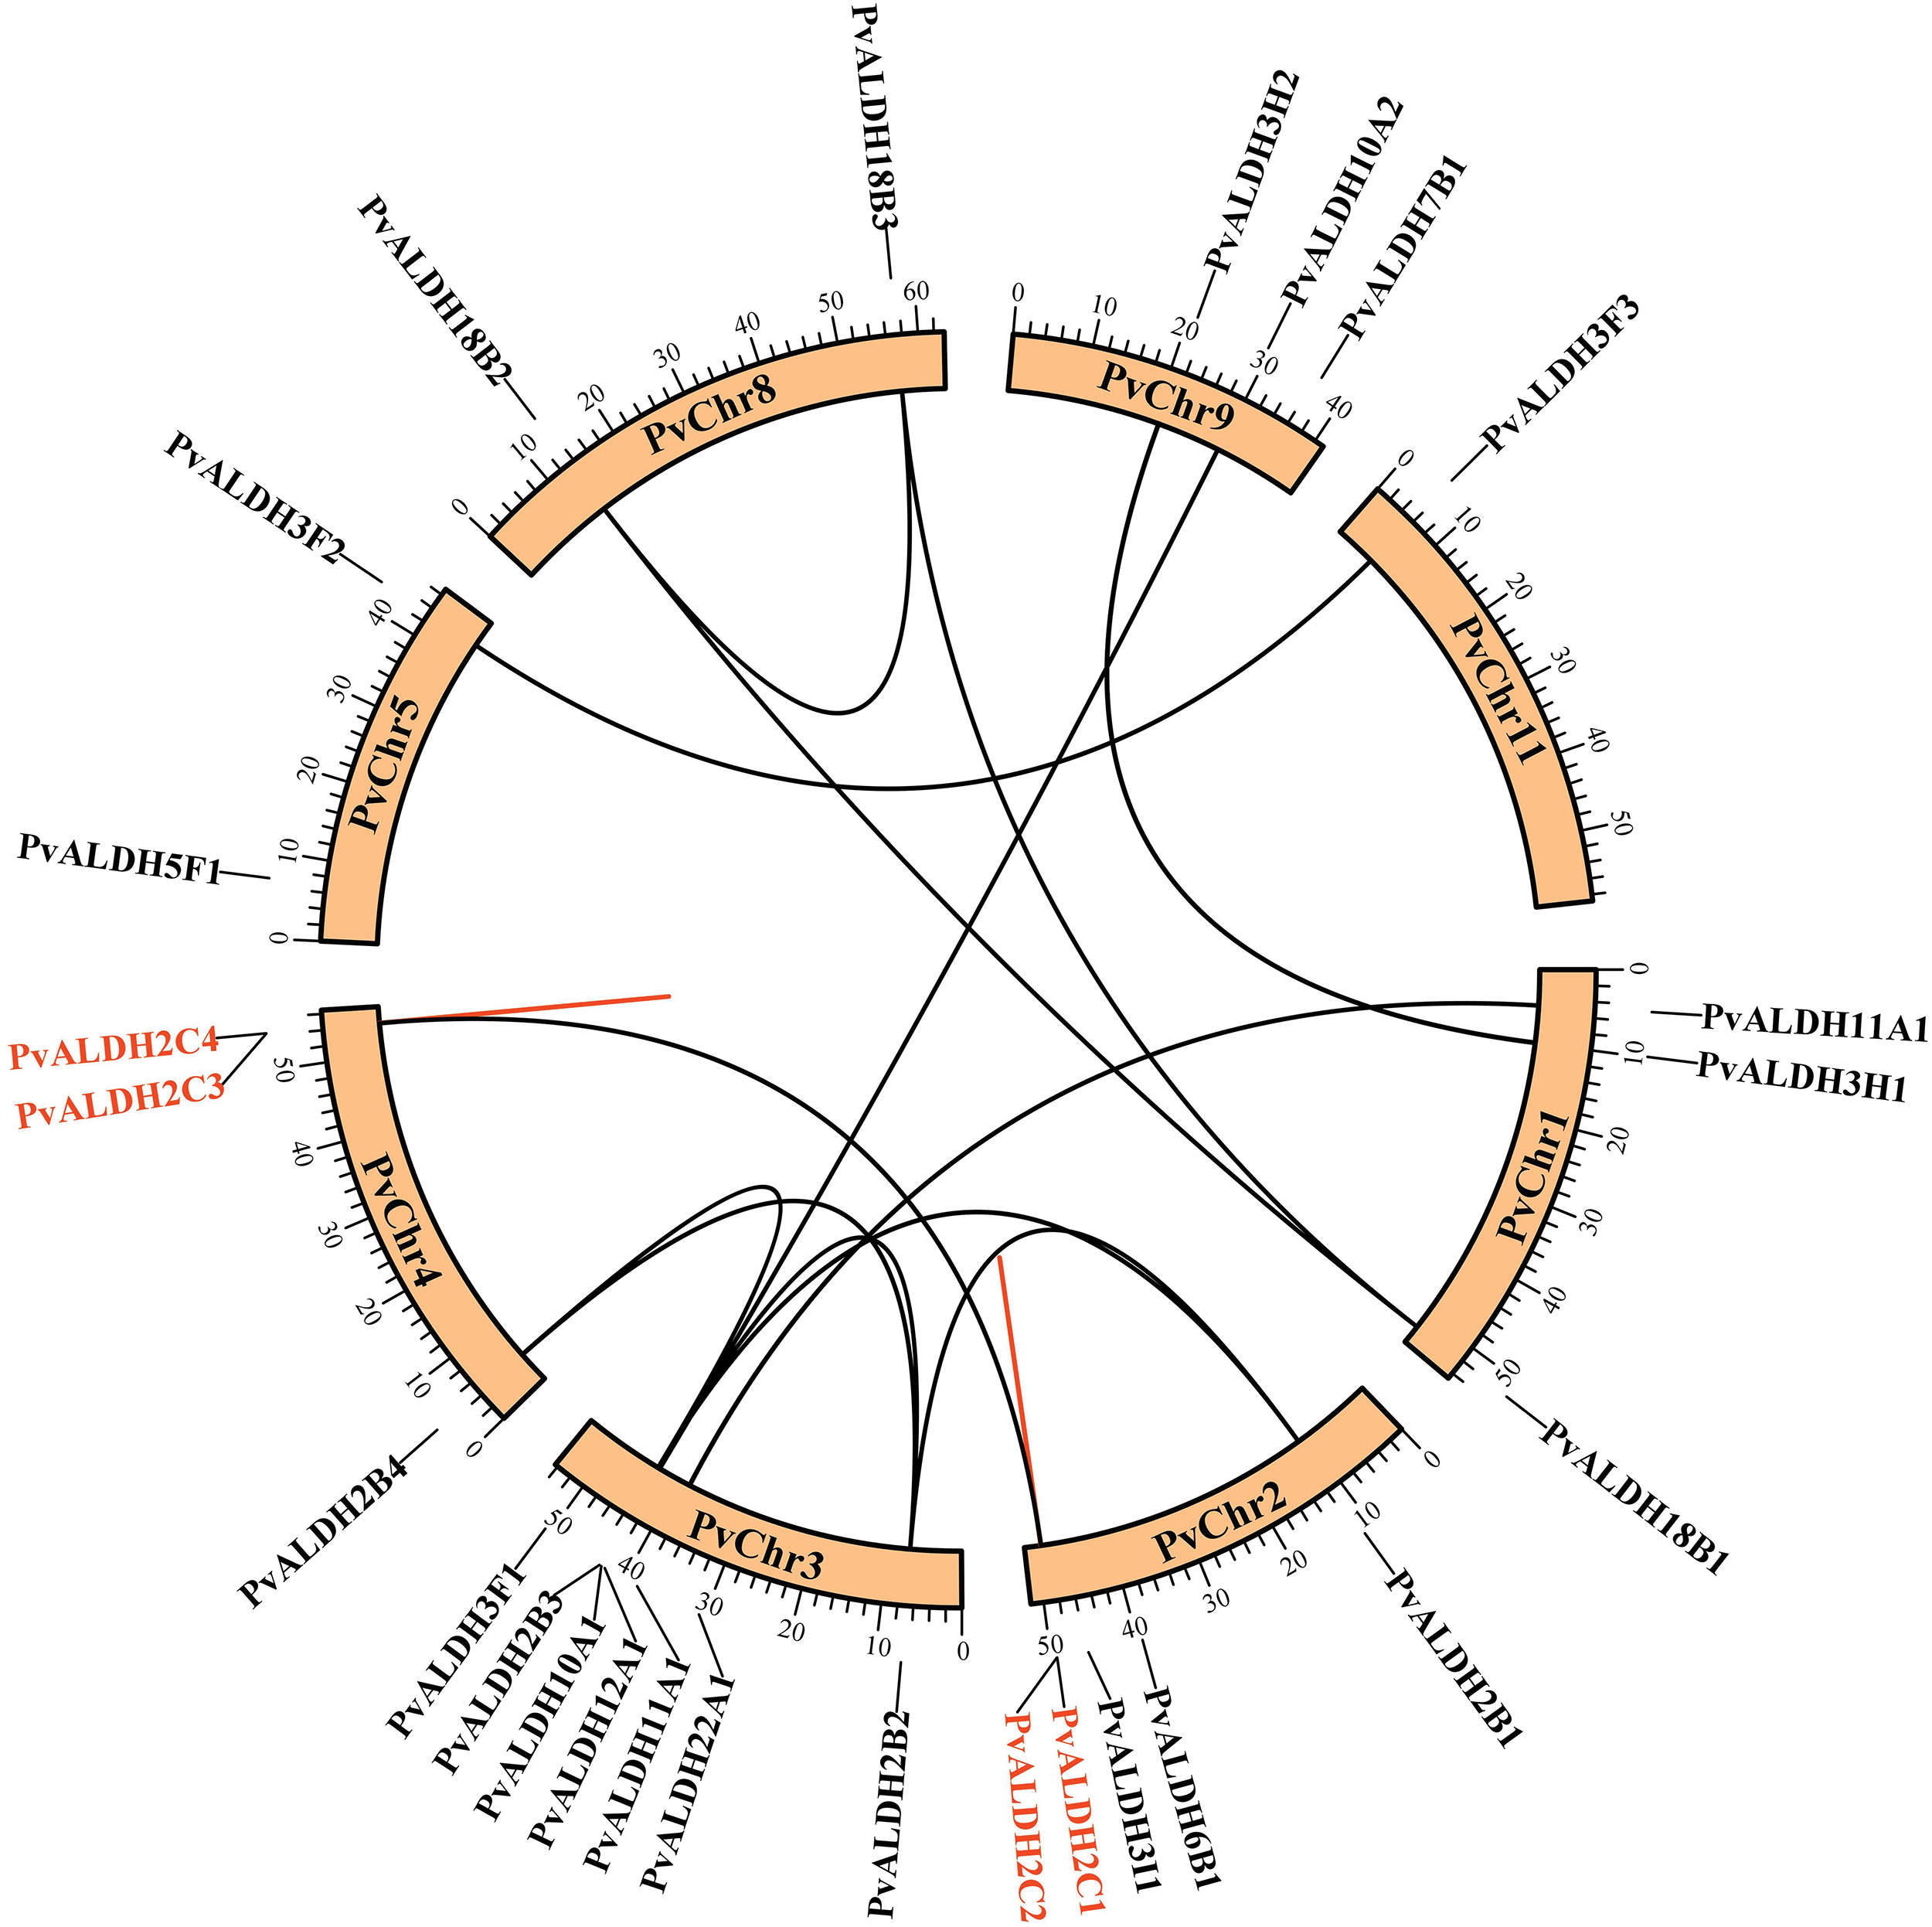
Figure 2: Location of PvALDH genes on P. vulgaris chromosomes. Genes with the same color represent tandem duplicated genes, and genes with corresponding lines represent segmentally duplicated genes
The amino acid number of PvALDH proteins varies between 489–720 amino acids. Molecular weights (mW) ranged between 53.05–78.23 kDa, and the theoretical isoelectric point was found. When GRAVY values were analyzed, 10 genes with negative values and 16 genes with positive values were found. Negative values indicate hydrophilicity and positive values indicate hydrophobicity [76].
A. sativum ALDH proteins were found to have a range of 103–626 amino acids, a molecular weight of 11.75–69.58 kDa, and an isoelectric point range of 5.1–9.36 [45]. In A. hypogaea, ALDH proteins were found to have an amino acid count range of 309–791, a molecular weight of 32.48–88.83 kDa, and an isoelectric point range of 4.91–9.61 [46]. In P. edulis, ALDH proteins were found to have an amino acid count range of 97–970, a molecular weight of 11.13105.2 kDa, and an isoelectric point range of 4.03–9.63 [47]. In S. bicolor, ALDH proteins were found to have a range of amino acids 391–729, a molecular weight of 41.5–78.36 kDa, and an isoelectric point range of 4.85–9.45 [75]. In C. arietinum, ALDH proteins were found to have an amino acid count range of 134–759, a molecular weight of 15.07 to 82.38 kDa, and an isoelectric point range of 4.34–9.49 [43]. ALDH proteins in the S. tuberosum plants were found to have a range of 120–717 amino acids, a molecular weight of 9.35–77.47 kDa, and an isoelectric point range of 5.10–10.0 [42].
When the subcellular localization of PvALDH proteins was examined, it was found that they were most often located in the cytoplasm. Chloroplast and mitochondria followed this. ALDH proteins in A. sativum were most commonly found in cytoplasm [45], while ALDH proteins in P. edulis were in chloroplast [47]. In S. bicolor, ALDH proteins are localized mostly in the mitochondria [75], and in S. tuberosum, ALDH proteins are mostly localized in the cytoplasm [42].
As a result of the analysis of the active sites of preserved glutamic acid (PS0687) and cysteine (PS0070) in PvALDH proteins, two regions were found in 13 proteins. Neither of the two preserved regions could be found in 7 proteins. These conserved regions were also screened in A. sativum, and two regions were not detected in PvALDH3F proteins (PvALDH3F1, PvALDH3F2, and PvALDH3F3), nor proteins in the F subfamily of the AsALDH3 family, as in the PvALDH3I1 protein [45]. Similar results have been observed in the ALDH3F proteins of C. arietinum [43].
3.2 Gene Duplication Events, Protected Motif, and Phylogenetic Analysis of PvALDH Super Gene Family Members
Of the 26 P. vulgaris ALDH genes, 13 were found to be segmentally duplicated gene pairs. PvALDH2B1-PvALDH2B2, PvALDH2B2-PvALDH2B3, PvALDH2B2-PvALDH2B4, PvALDH2B3-PvalDH2B1-PALDH2C1-PALDH2VALD, PvALDH18B1-PvALDH18B2 and PvALDH18B2-PvALDH18B3 gene pairs were segmentally duplicates. In addition, 2 tandemly duplicated gene pairs have been identified. PvALDH2C1-PvALDH2C2 and PvALDH2C3-PvALDH2C4 gene pairs were tandemly duplicated genes (Fig. 2). In A. sativum, 8 of 34 ALDH genes were segmentally, and 3 were tandemly duplicated [45], in S. bicolor, 4 of 34 ALDH genes were segmentally and one was tandemly duplicated [75] and in S. tuberosum, 3 of 22 ALDH genes were segmentally and 3 were tandemly duplicated [42].
Segmental gene pairs diverged before the time period, which ranged from 47 to 130 million years ago (MYA). The PvALDH2C1-PvALDH2C2 and PvALDH2C3-PvALDH2C4 tandem gene pairs diverged 53 and 72 MYA, respectively (Table 3). The fact that the Ka/Ks result obtained as a result of the analysis has a value less than 1 indicates that the gene pairs are subjected to purifying selection. If it is larger than 1, positive selection and equals 1, neutral selection occurs [77,78]. PvALDH segmental and tandem duplicated gene pairs have been found to undergo purifying selection because the Ka/Ks ratio is smaller than 1.

As a result of the motif scan, given in Fig. 3, performed in PvALDH proteins, 10 preserved motifs were found. The motifs found have amino acids ranging from 21 to 49. PvALDH2B1, PvALDH2B2, PvALDH2B3, PvALDH2B4, PvALDH2C1, PvALDH2C2, PvALDH2C3, PvALDH2C4, PvALDH5F1, PvALDH10A1, and PvALDH10A2 genes also contain 10 motifs.
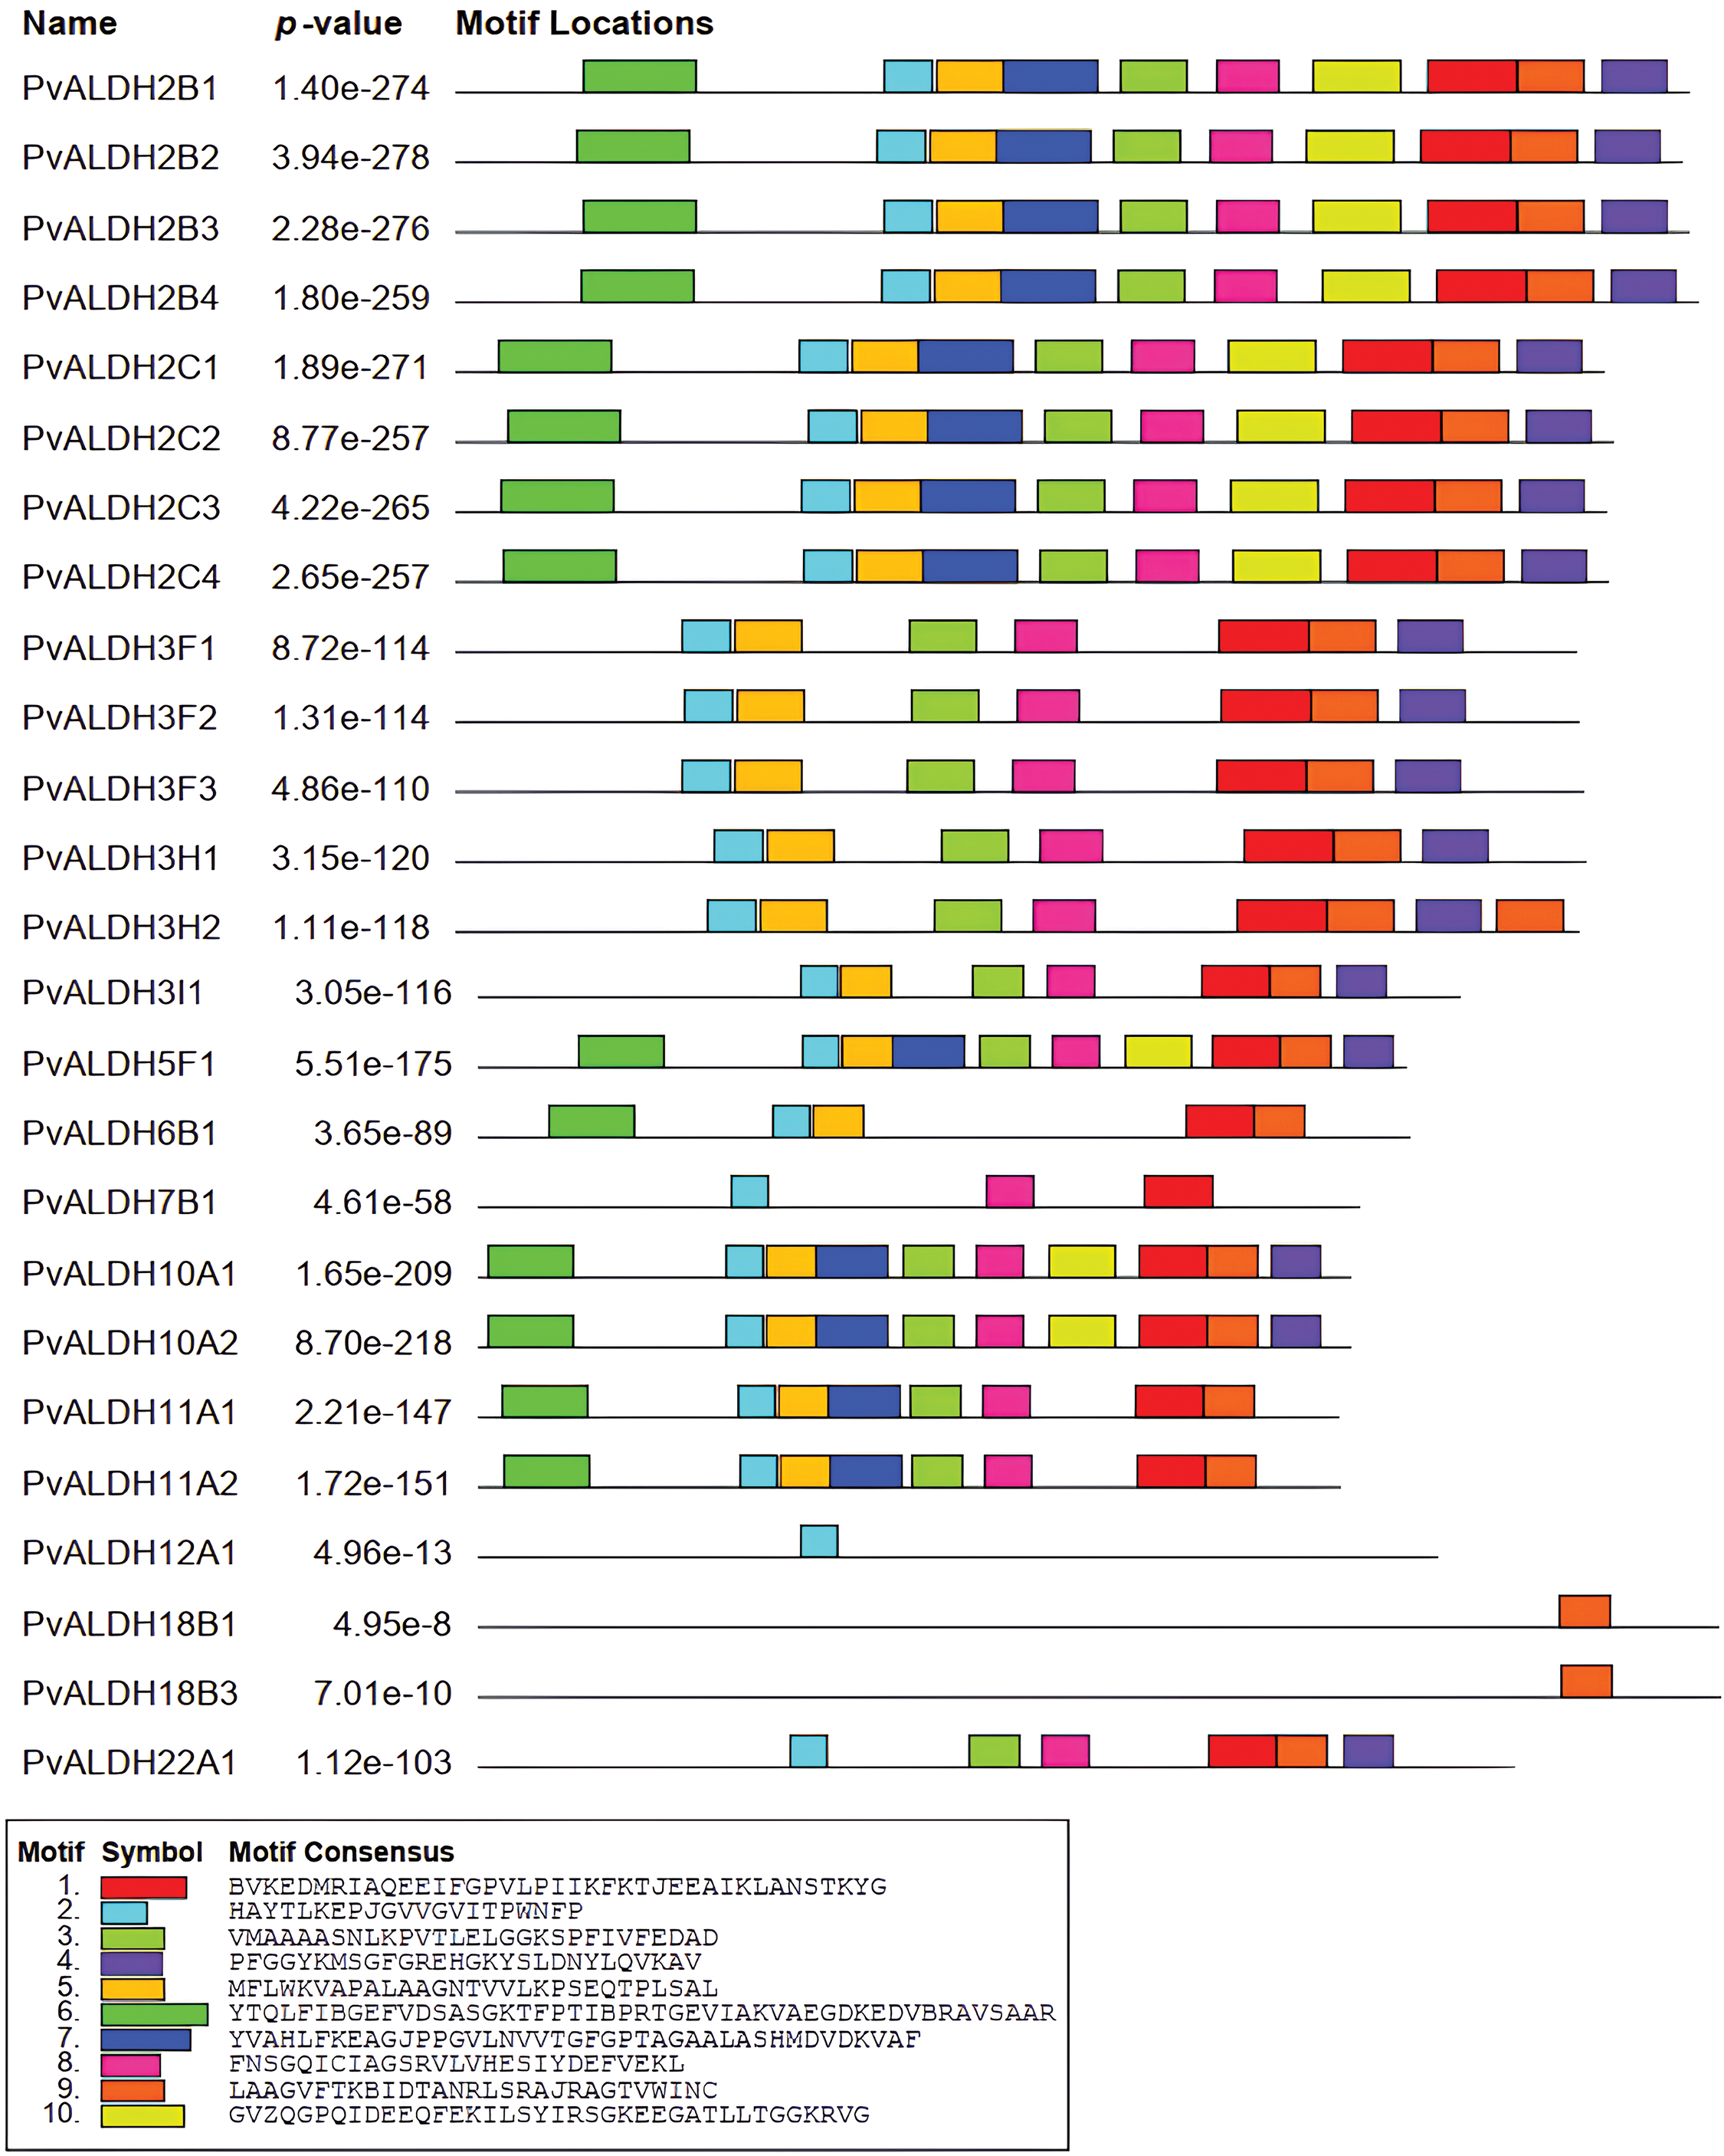
Figure 3: Preserved motif analysis in PvALDH proteins
The PvALDH18B1 and PvALDH18B3 genes contain only 1 motif (motif 9). This motif is common to all PvALDHs. In A. sativum, only 22 motifs in the AsALDH2A2 gene were observed. Genes have been found to have mostly 9 motifs.
In A. sativum, all 10 motifs were observed only in the AsALDH22A2 gene. In addition, motif similarity in PvALDH2, PvALDH3, and PvALDH10 family genes was also detected in A. sativum [45]. In B. rapa subsp. Pekinensis, 15 motifs were screened in ALDH genes, and between 3 and 11 motifs were found. As in PvALDH genes, the genes belonging to the BrALDH2 and BrALDH10 families contain the highest number of motifs. In addition, this plant also exhibits similar motifs [41].
Alignment analyses were conducted between the PvALDH gene sequences, and results were given in Fig. 4. Glutamic acid region has been detected in all genes except the PvALDH6B1, PvALDH18B1, PvALDH18B2, and PvALDH18B3. Except for PvALDH18B genes, other PvALDH genes were found to contain cysteine regions. However, in S. bicolor, the cysteine region was found in genes belonging to the SbALDH18 family [75]. The ALDH genes in S. tuberosum showed similar results as in S. bicolor [42].
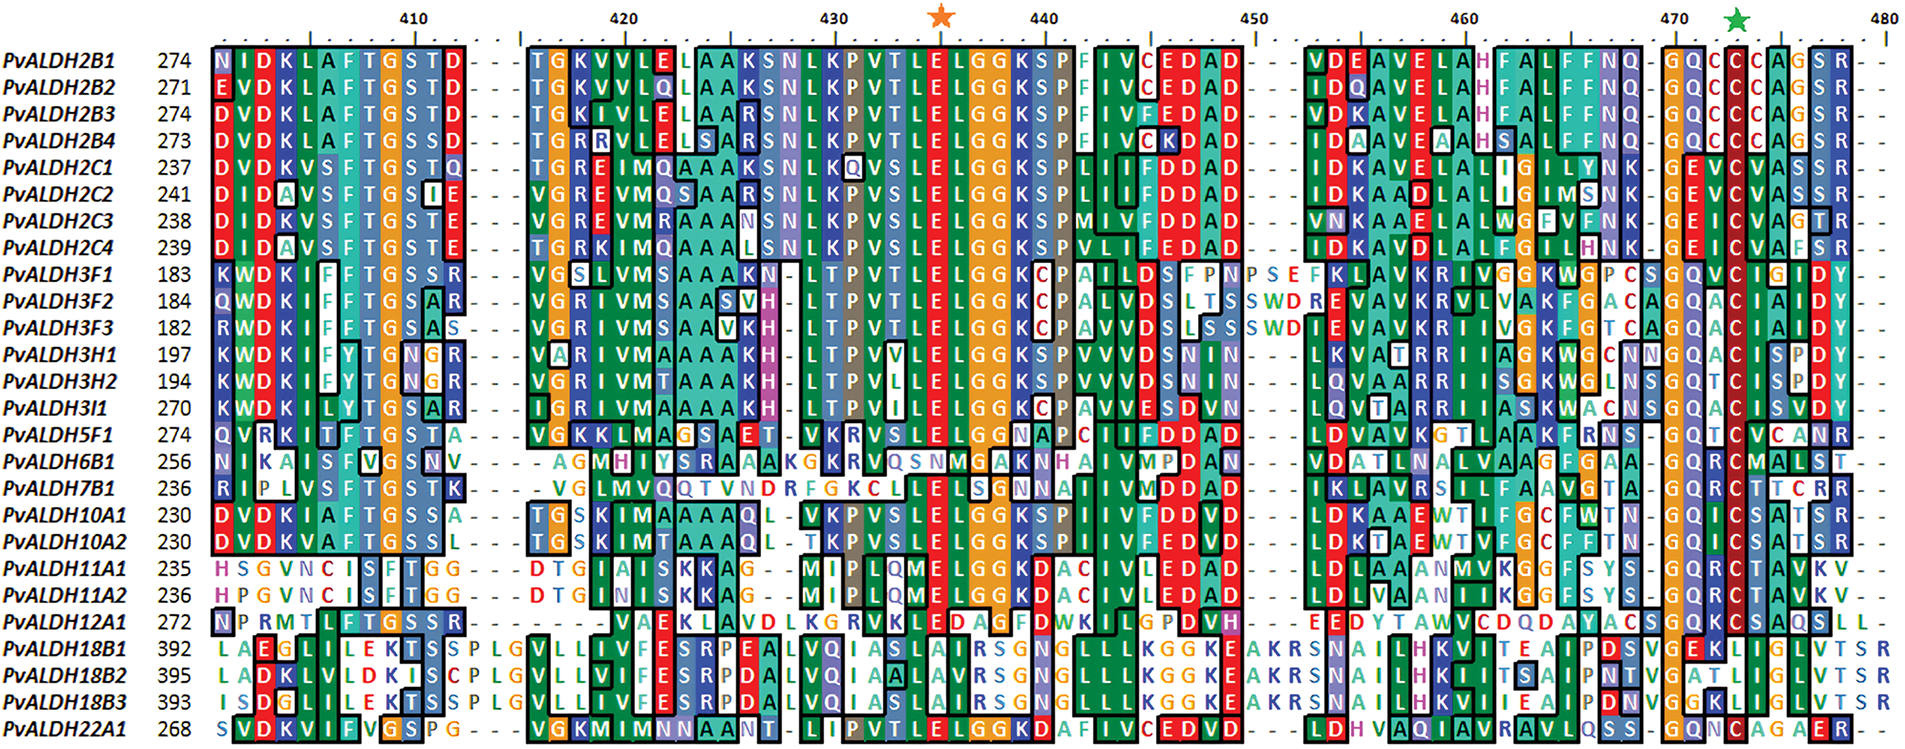
Figure 4: Screening of glutamic acid and cysteine sites in PvALDH genes. The orange star symbolizes glutamic acid and the green star cysteine region
A phylogenetic tree shown in Fig. 5 has been created with the help of the protein sequences of P. vulgaris, G. max, and A. thaliana ALDH. The maximum likelihood method was used when creating this tree. Out of a total of 105 ALDH proteins, 18 belong to ALDH2B, 15 to ALDH2C, 10 to ALDH3F, 7 to ALDH3H, 3 to ALDH3I, 4 to ALDH5F, 7 to ALDH6B, 4 to ALDH7B, 7 to ALDH10A, 7 to ALDH11A, 6 to ALDH12A, 11 to ALDH18B and 6 to ALDH22A. In the phylogenetic analysis of ALDHs in A. sativum with A. thaliana and O. sativa, the tree was divided into 10 different classes [45]. In A. hypogaea, ALDH proteins were divided into 12 different classes in the phylogenetic analysis carried out among A. thaliana, O. sativa, H. Sapiens, G. hirsutum, G. max, and V. vinifera [46].
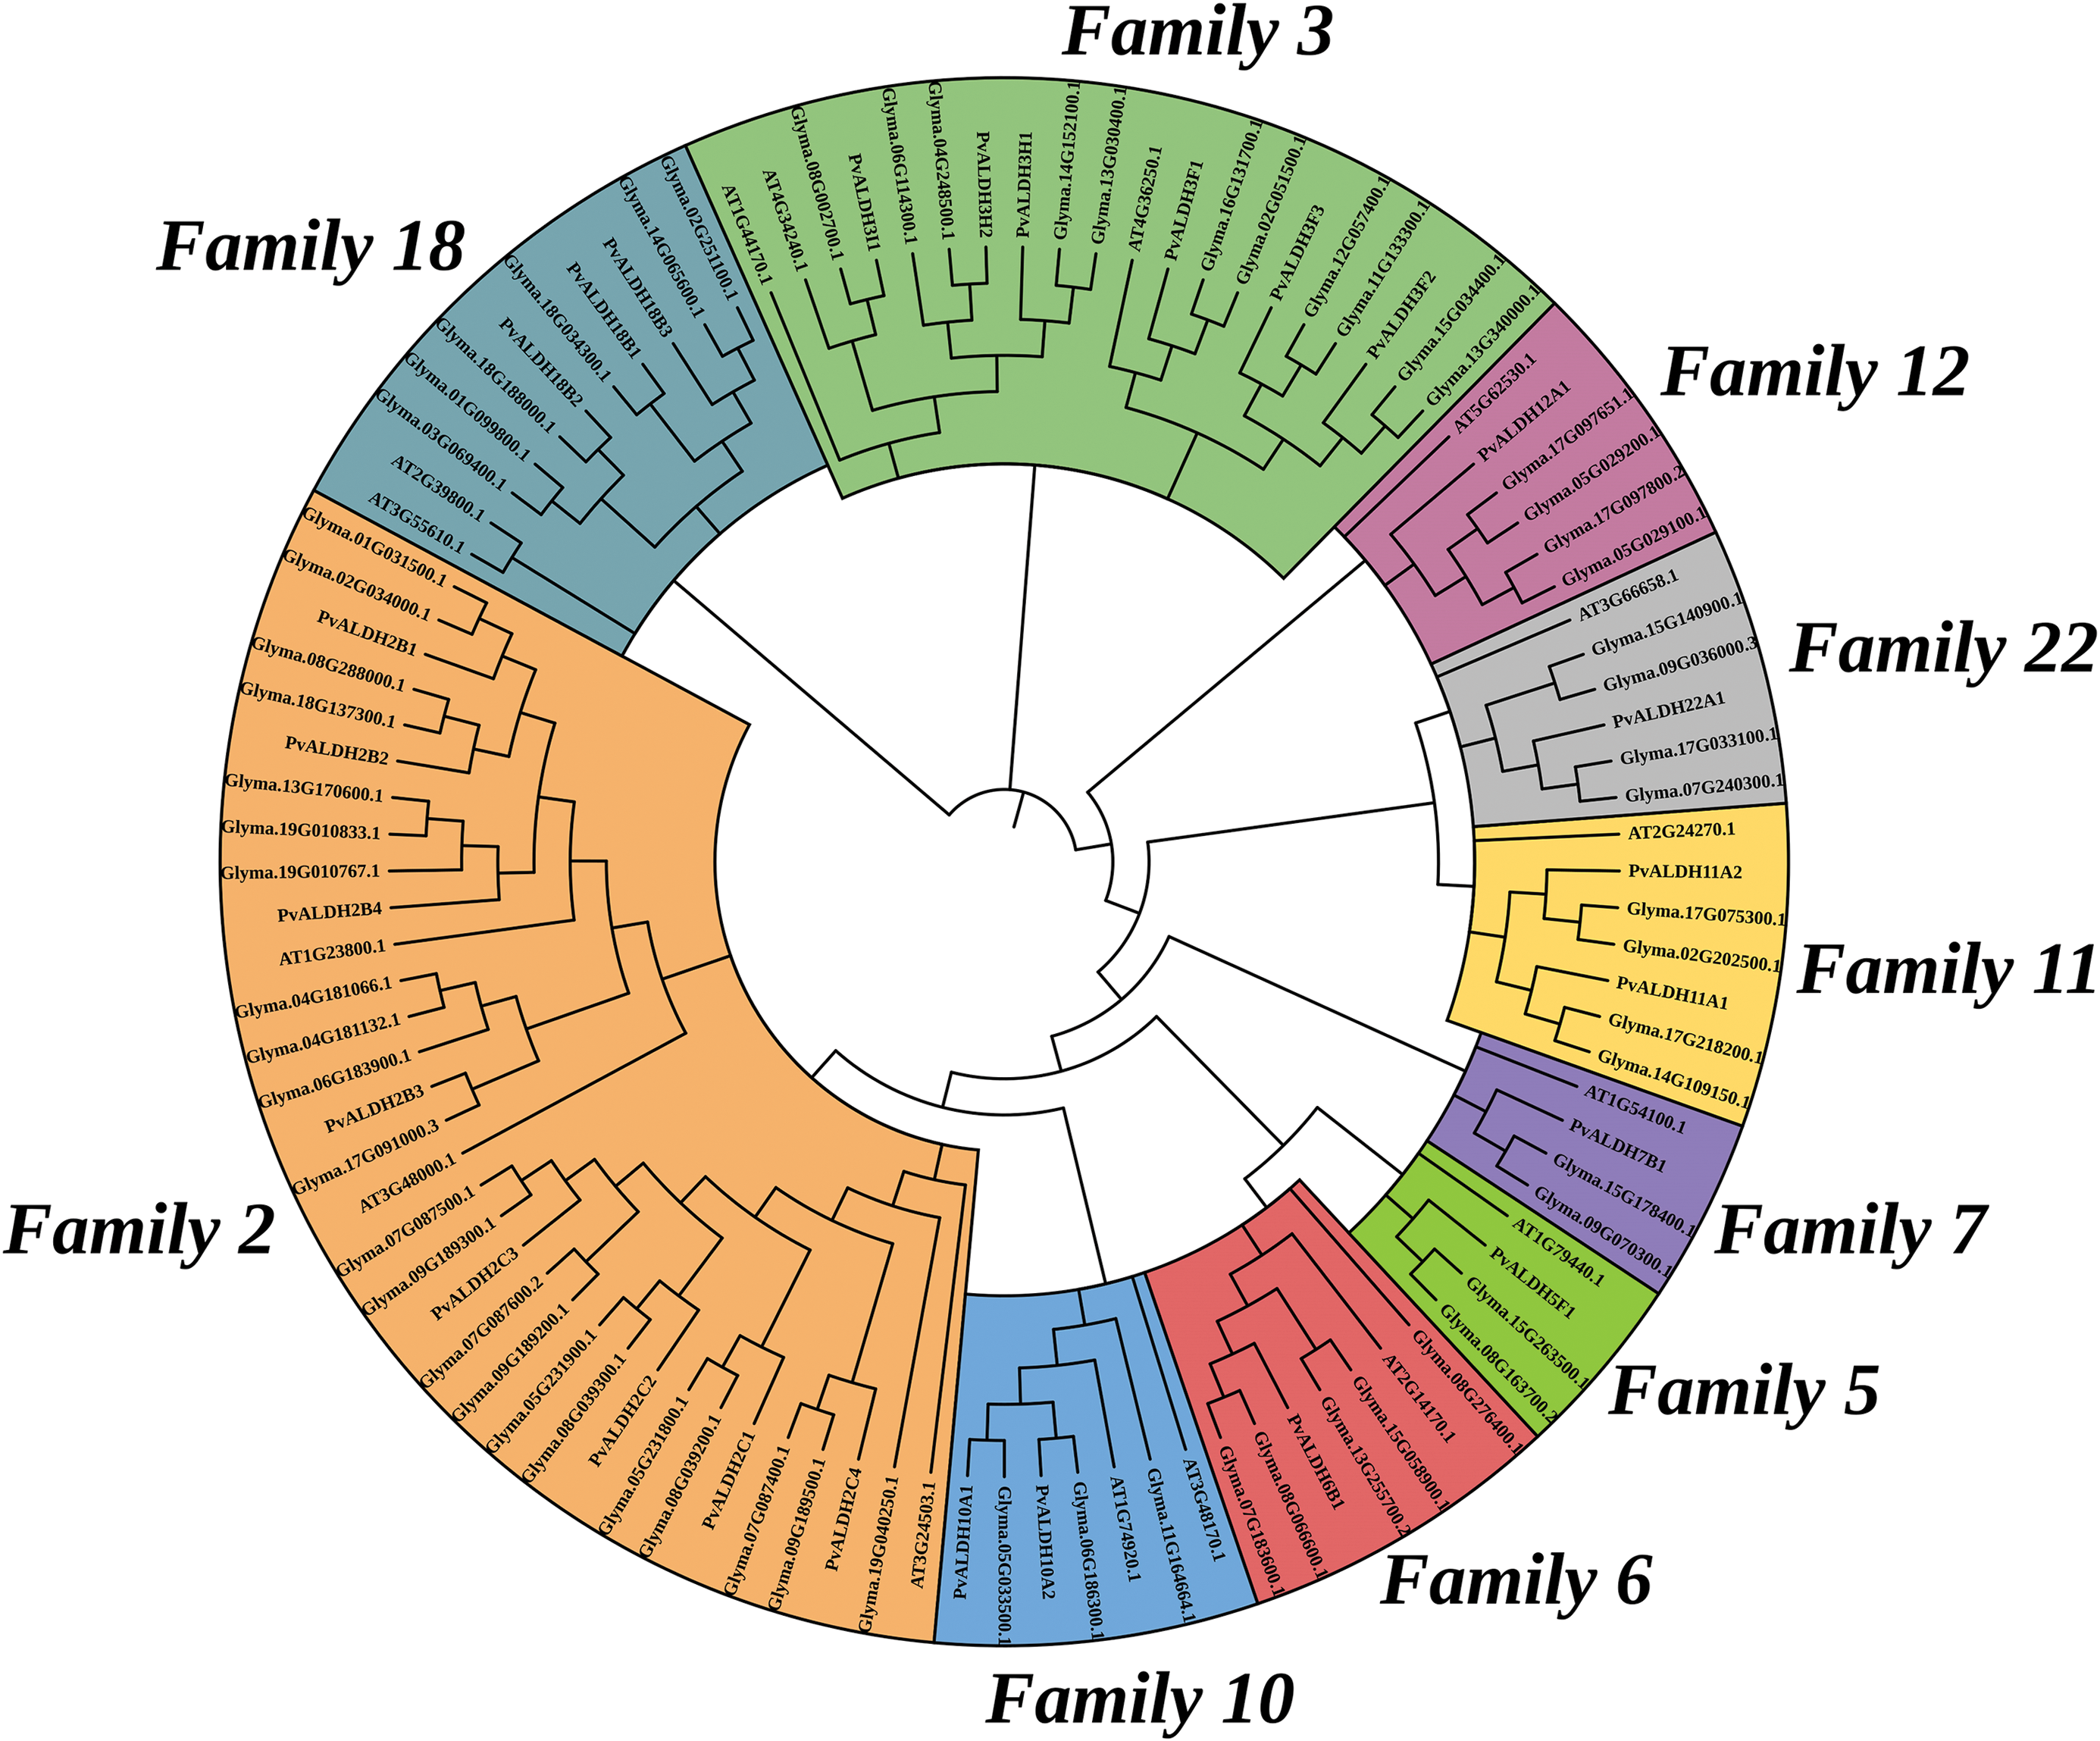
Figure 5: Phylogenetic analysis of ALDH in P. vulgaris, G. max and A. thaliana. The image was created with the Clustal Omega web tool. 105 ALDH proteins were divided into 13 different classes
3.3 Comparative Synteny Analysis with Other Species of PvALDH Super Gene Family Members
As a result of the analysis to determine the relationship between the P. vulgaris ALDH genes, a syntenic relationship was found between 13 gene pairs. This relationship occurred between the families PvALDH 2, 3, 10, 11 and 18 (Fig. 2). In the comparative analysis between the P. vulgaris and A. thaliana ALDH genes, a synteny relationship was observed between 19 gene pairs (Fig. 6a). As a result of the synteny analysis between P. vulgaris and G. max, 64 relationships were identified (Fig. 6b). The PvALDH 2 and 3 families are the families that show the most orthology with other species. Among them, the subfamily B of the PvALDH2 family is the most closely related genes. As a result of the comparative analysis of ALDH genes in A. hypogaea with A. thaliana, 24 gene pairs showed syntenic relationships [46], and in this analysis, the gene named AT5G62530.1 in AtChr5 showed no relations. However, the PvALDH12A1 gene is in orthology with the AT5G62530.1 gene.
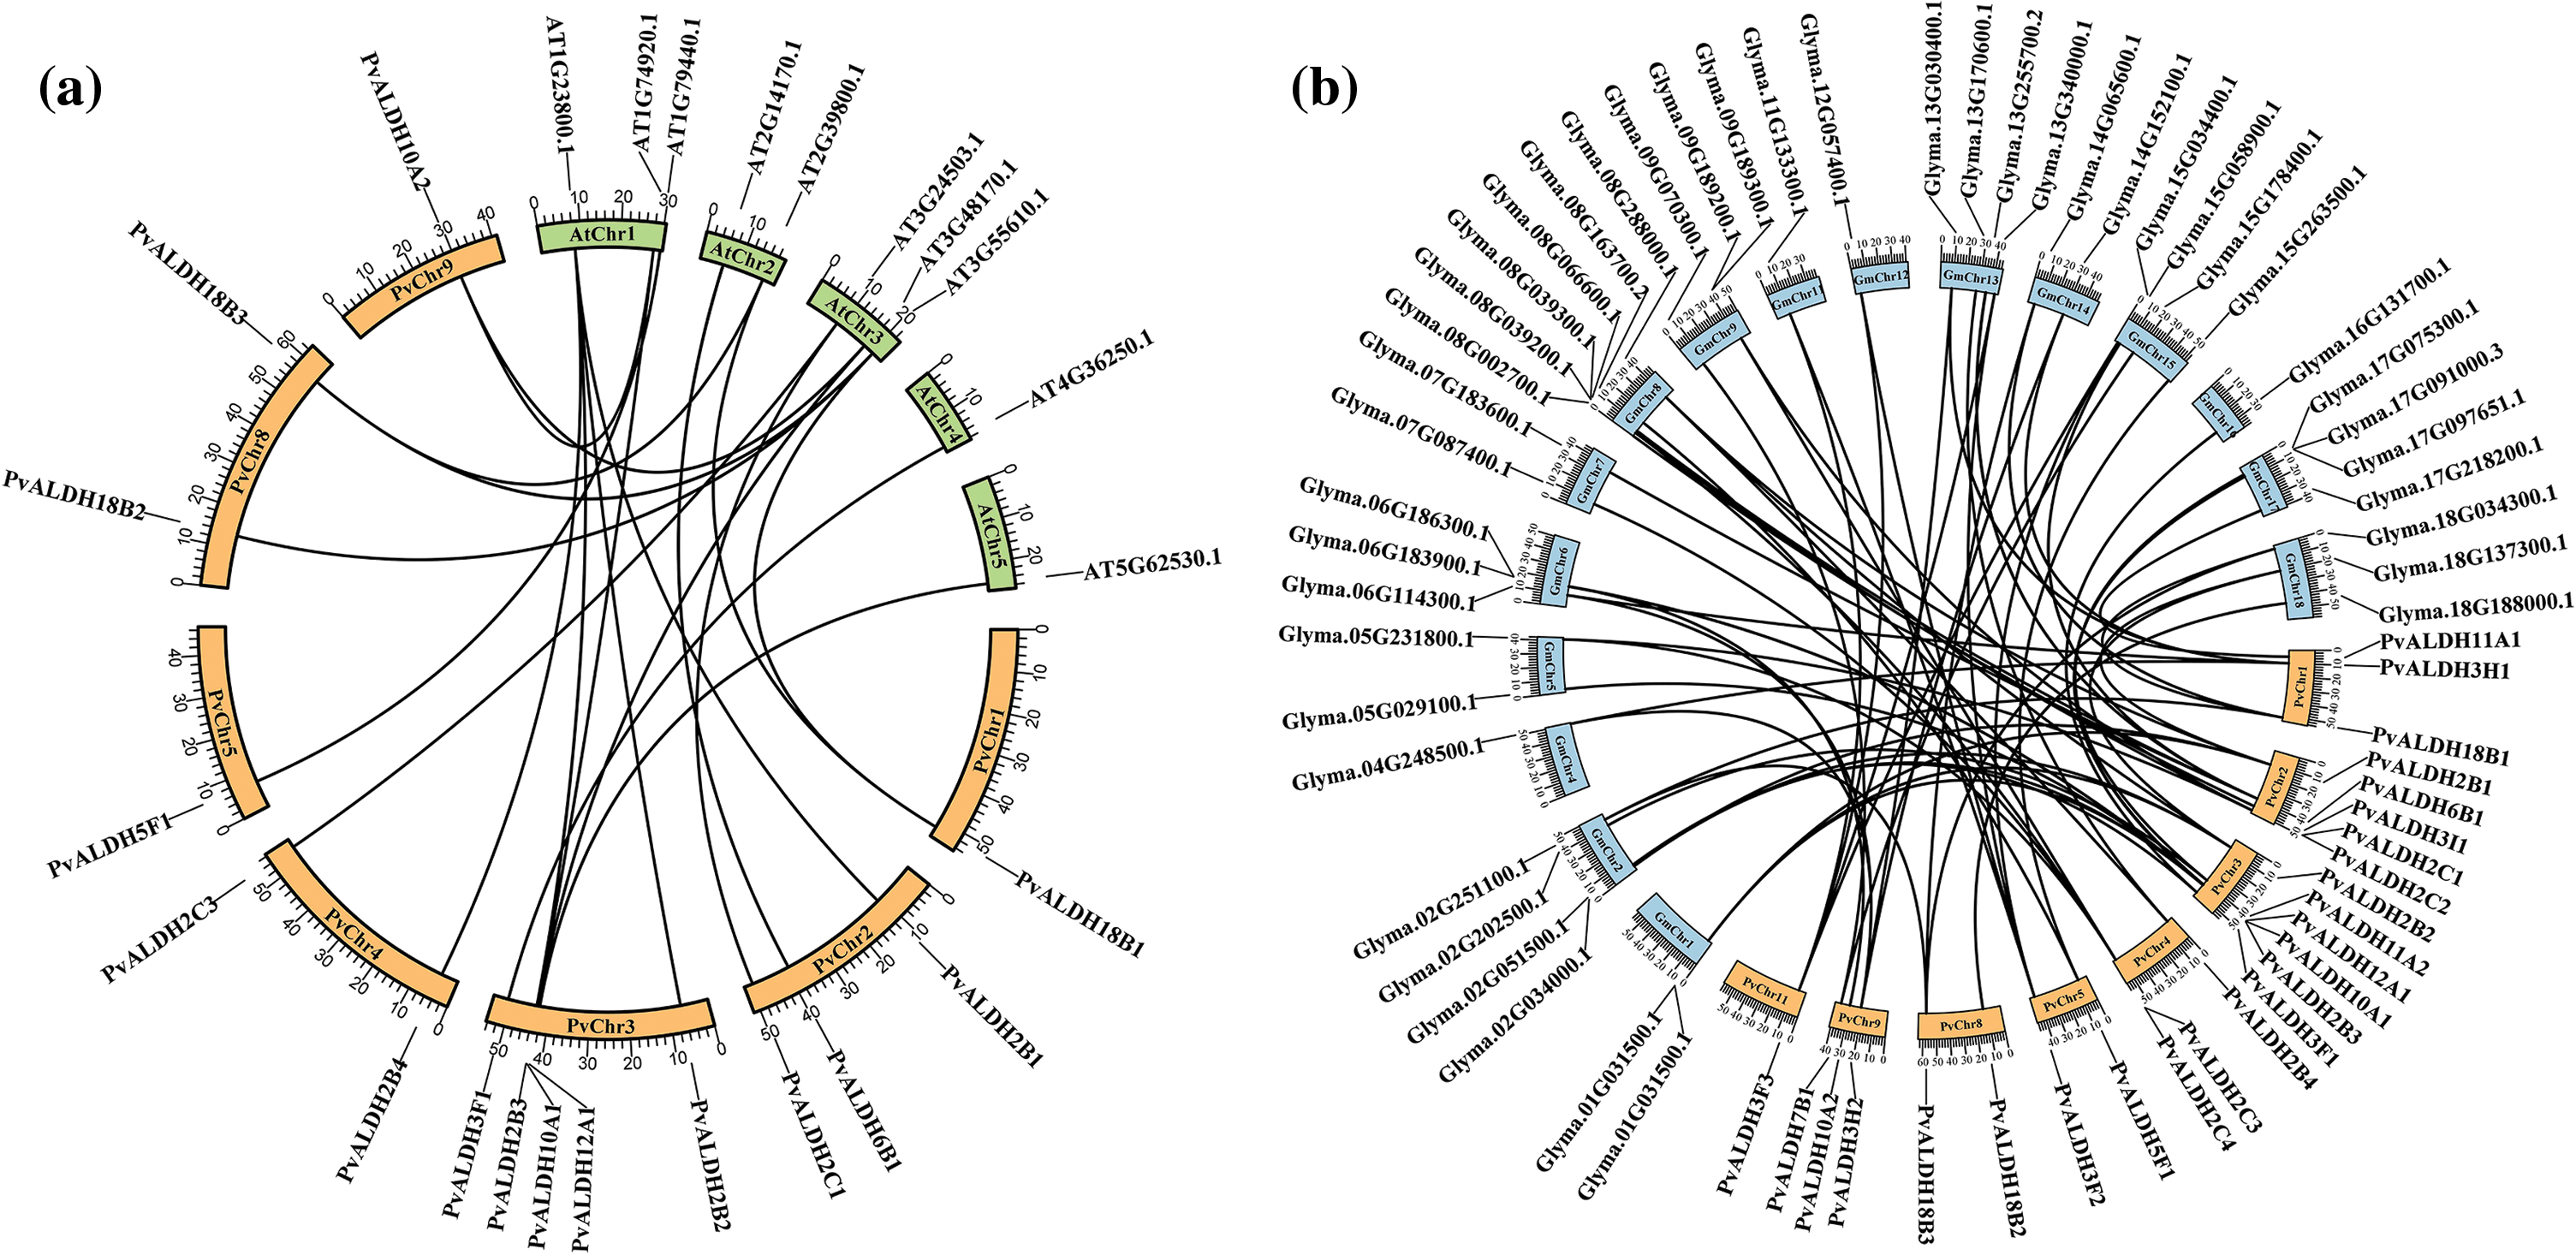
Figure 6: Synthenic analysis of the ortholog ALDH genes of P. vulgaris, G. max, and A. thaliana. (a) comparative synteny of P. vulgaris and A. thaliana, (b) comparative synteny of the P. vulgaris and G. max ALDH genes
3.4 Promotor Analysis of the PvALDH Super Gene Family
When the cis-elements in the upstream region of the PvALDH genes were examined, the TATA-box (%56), CAATBOX (%25), box-4 (%4), MYC (%2) and other elements were found and visualized in Fig. 7. Among these elements, there are also elements associated with abiotic stress [79,80]. The gene with the highest number of these elements (201) is PvALDH18B2. The following genes are PvALDH2C1 (192) and PvALDH2B4 (187). Abiotic stress elements such as ARE, LTR, MBS, MYB, MYC, STRE, TC-rich repeats, W box, etc., were examined. The genes containing the most stress elements were PvALDH11A2 and PvALDH3F2. Also, among these elements was the MYB (10) on the gene PvALDH3F2, the most abundant element on a gene. Similar stress elements have been found in S. bicolor. The gene with the highest number of these elements was SbALDH12A1 gene together with SbALDH3E2, which is a member of ALDH3 family, as in PvALDH genes [42]. However, in the A. thaliana MBS and MYB cis elements were found mostly in the AtALDH6B2, AtALDH7B4, and AtALDH18B2 genes [81]. While MBS was mostly found in the PvALDH18B1 gene, MYB was in the PvALDH3F2 gene.
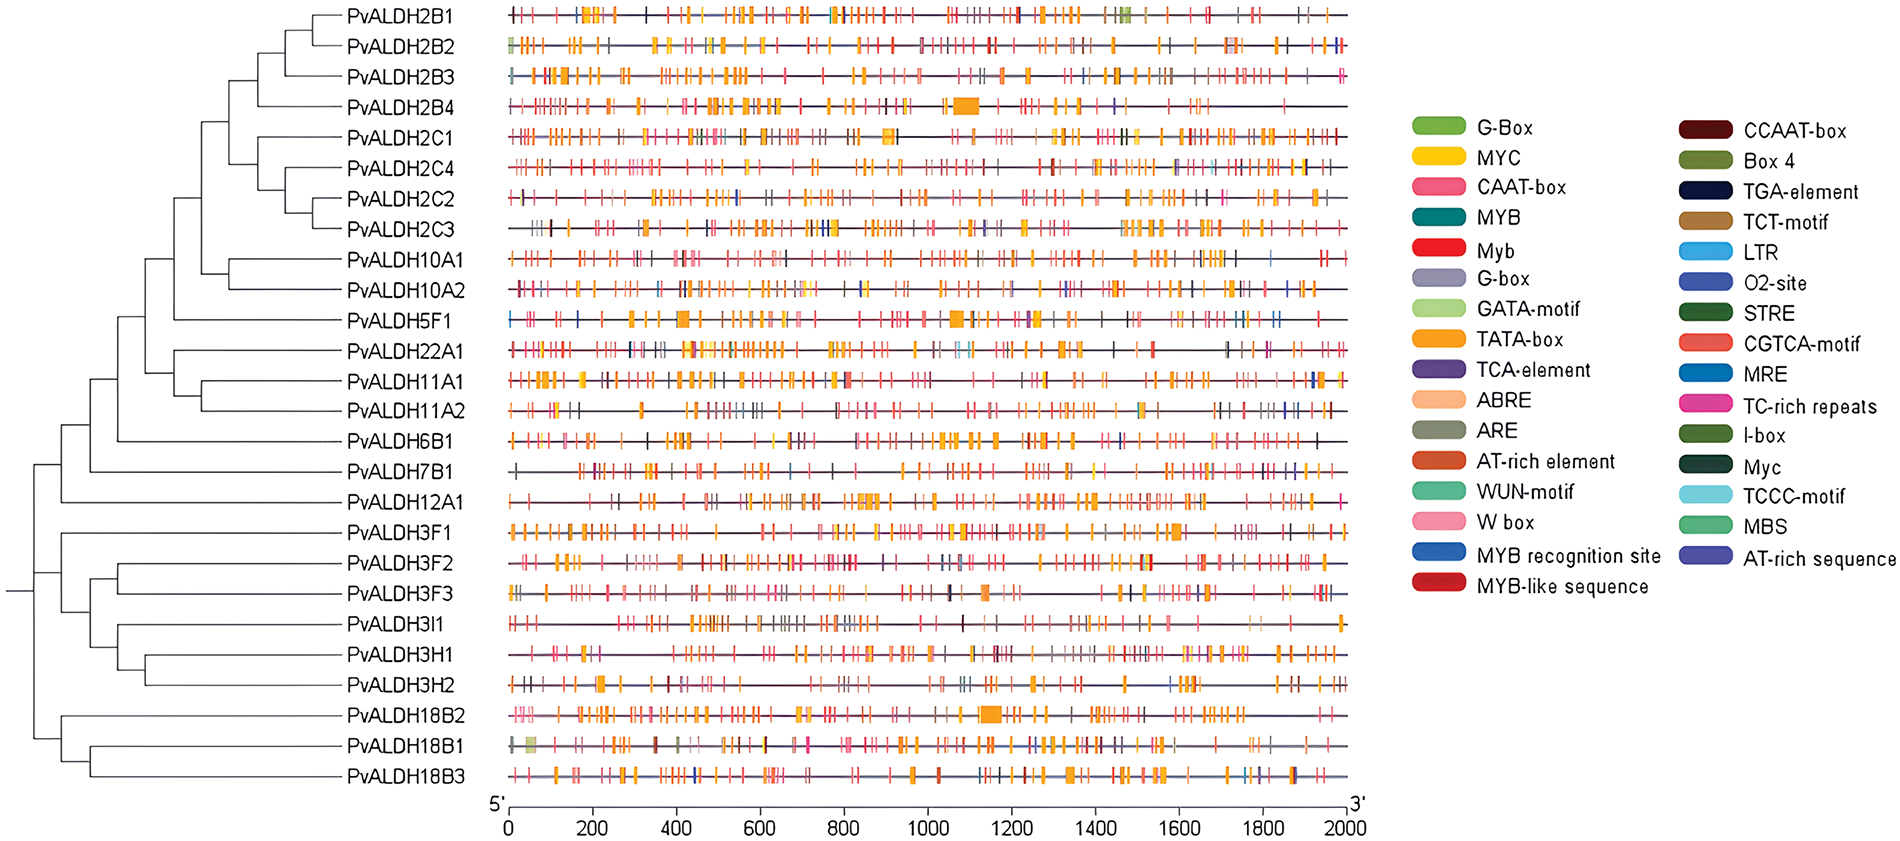
Figure 7: Cis-acting element analysis of PvALDH genes (cis-elements identified to be associated with stresses are included in the figure)
3.5 PvALDH Super Gene Family Gene Ontology Analysis, 3D Protein Homology and Protein-Protein Interactions
Biological processes of PvALDH genes were examined and presented in Fig. 8, and it was found that the most cellular metabolic and organic matter were involved in metabolic processes. When all the metabolic processes found as a result of the analysis were examined, it was observed that the genes PvALDH3H1, PvALDH3H2, PvalDH7B1 and PvALDH12A were the most involved in the process with 8 different processes. When the molecular functions of the genes were scanned, it was found that they showed the most oxidoreductase activity. They were followed by aldehyde dehydrogenase (NAD+) activity and glyceraldehyde-3-phosphateactivity. The genes with the most molecular functions were PvALDH3H1, PvALDH3H2, PvALDH3I1, PvALDH11A1 and PvalDH11A2, with 4 different molecular functions. ALDH proteins in P. edulis were found to be most involved in metabolic biological processes and had oxidoreductase activity [47]. Similar results were observed in G. max [82].
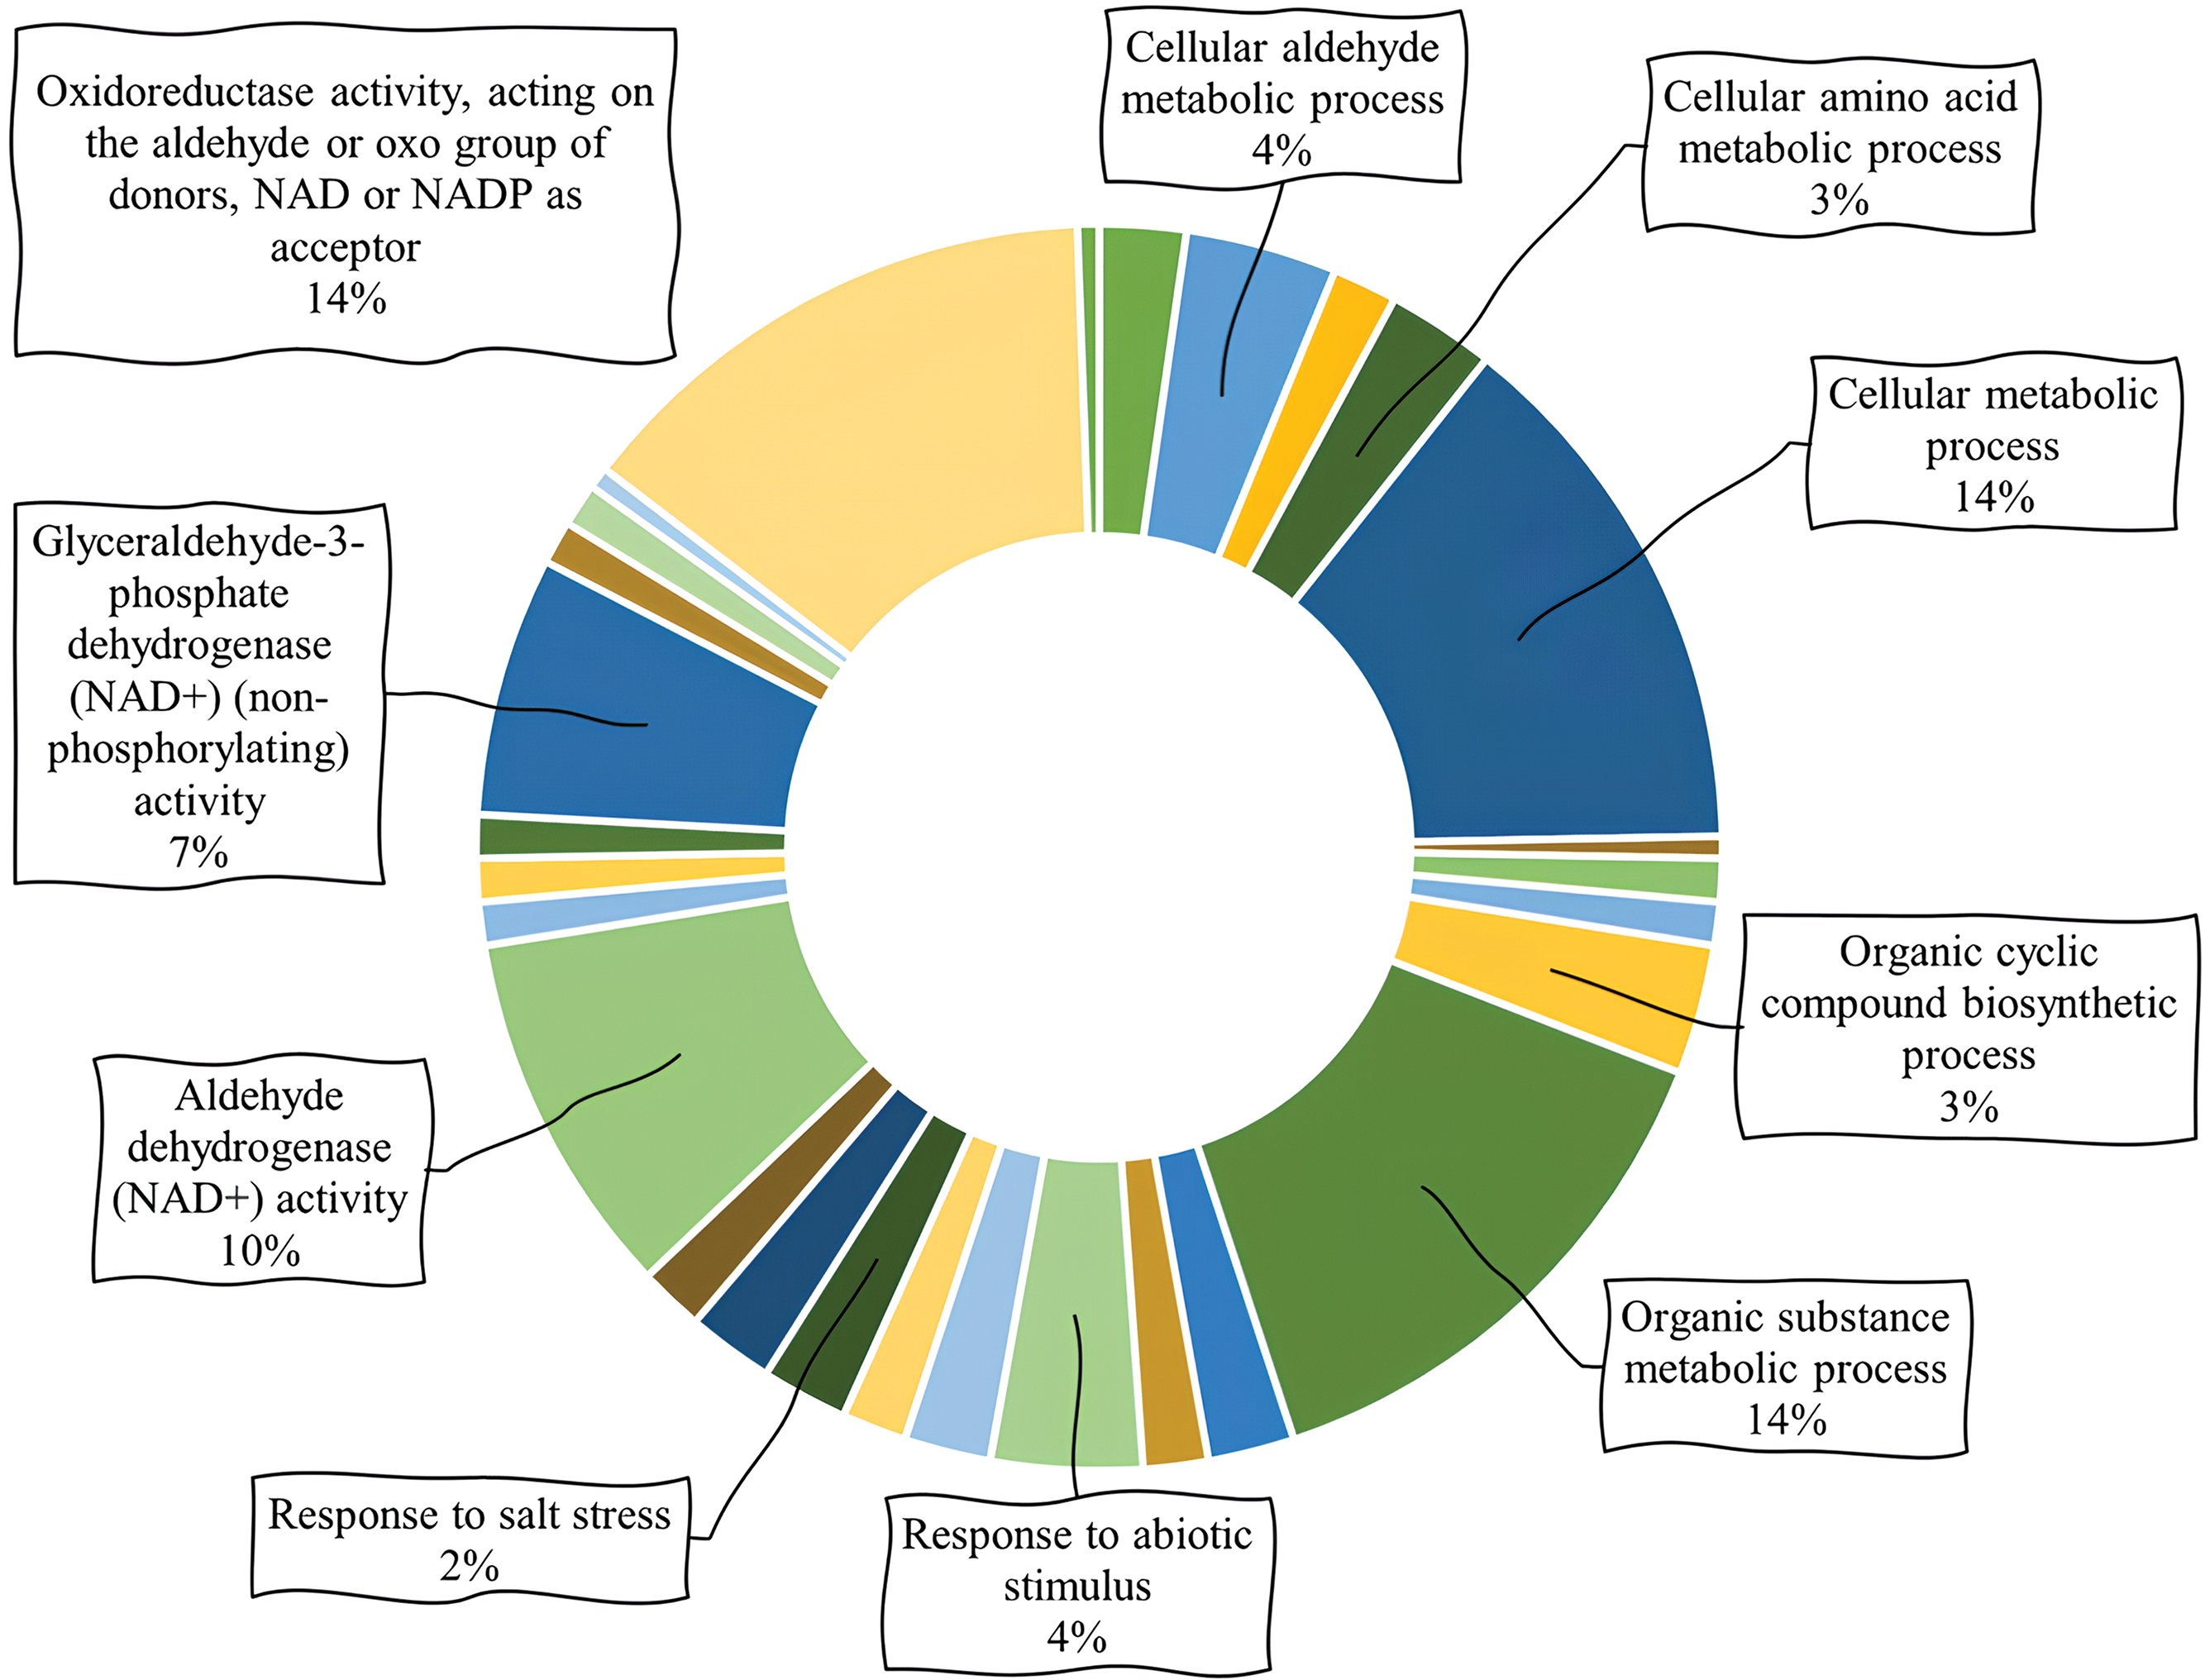
Figure 8: Analysis of gene ontology involving biological processes and molecular functions of PvALDHs
As a result of the structural analysis of the PvALDH protein, when the models obtained with a high confidence interval were examined, it was found to have an alpha-helical structure (Table 4). Models have alpha-helix structure between 31–42. PvALDH3F1, PvALDH3F2, and PvALDH3H1 are the proteins with the highest alpha-helix structure, with 42% of the protein. In addition, PvALDH proteins contain between 19%–22% beta-sheet layer. The protein containing the most beta-sheet layers is the PvALDH2C3 protein, with 22%. In S. tuberosum, ALDH proteins were found to consist of between 29% and 56% alpha-helix and between 4% and 11% beta-sheet [42].

The interactions of PvALDH proteins among themselves and with other proteins were analyzed. As a result of the interactions with each other, the most interacting proteins were PvALDH12A1, PvALDH18B1, PvALDH18B2 and PvALDH18B3 (Fig. 9a). When the protein interactions of the PvALDH2 family were analyzed, the B subfamily and the C subfamily were grouped among themselves. B subfamily members interact with methylmalonate-semialdehyde dehydrogenase protein (Pv5-593.02G208700) and polyamine oxidase protein (Pv5-593.05G023200). Subfamily C interacts with ferulate-5-hydroxylase proteins (Pv5-593.02G109600, Pv5-593.03G254300, Pv5-593.03G254400) (Fig. 9b). The PvALDH 3 family includes polyamine oxidase protein (Pv5-593.05G023200), methylmalonyl-CoA synthetase (Pv5-593.10G150900), pantothenate synthetase protein (Pv5-593. 07G207900), beta-ureidopropionase protein (Pv5-593.02G207200) and methylmalonate-semialdehyde dehydrogenase protein (Pv5-593.02G208700) (Fig. 9c). Proteins interacting with PvALDH families 5-6-7 and 10 are saccharopin dehydrogenase protein (Pv5-593.03G121800), chlorophyllide-a oxygenase protein (Pv5-593.08G156800), choline monooxygenase protein (Pv5593.03G135600), gamma-amino-N-butyrate transaminase protein (Pv5-593.11G024700) and Succinate semialdehyde dehydrogenase protein (Pv5-593.05G049100) (Fig. 9d). PvALDH 11-12-18 and 22 families were glutamate synthase protein (Pv5-593.01G077900), ornithine aminotransferase protein (Pv5-593.02G177300), glutamate-5-semialdehyde dehydrogenase protein (Pv5-593.10G021400), triosephosphate mutase protein (Pv5593.01G180000) and triose-phosphate isomerase protein (Pv5-593.05G146800) (Fig. 9e). In S. spontaneum, ALDH proteins have been found to interact with ornithine aminotransferase, succinic semialdehyde reductase and saccharopine dehydrogenase proteins [44].
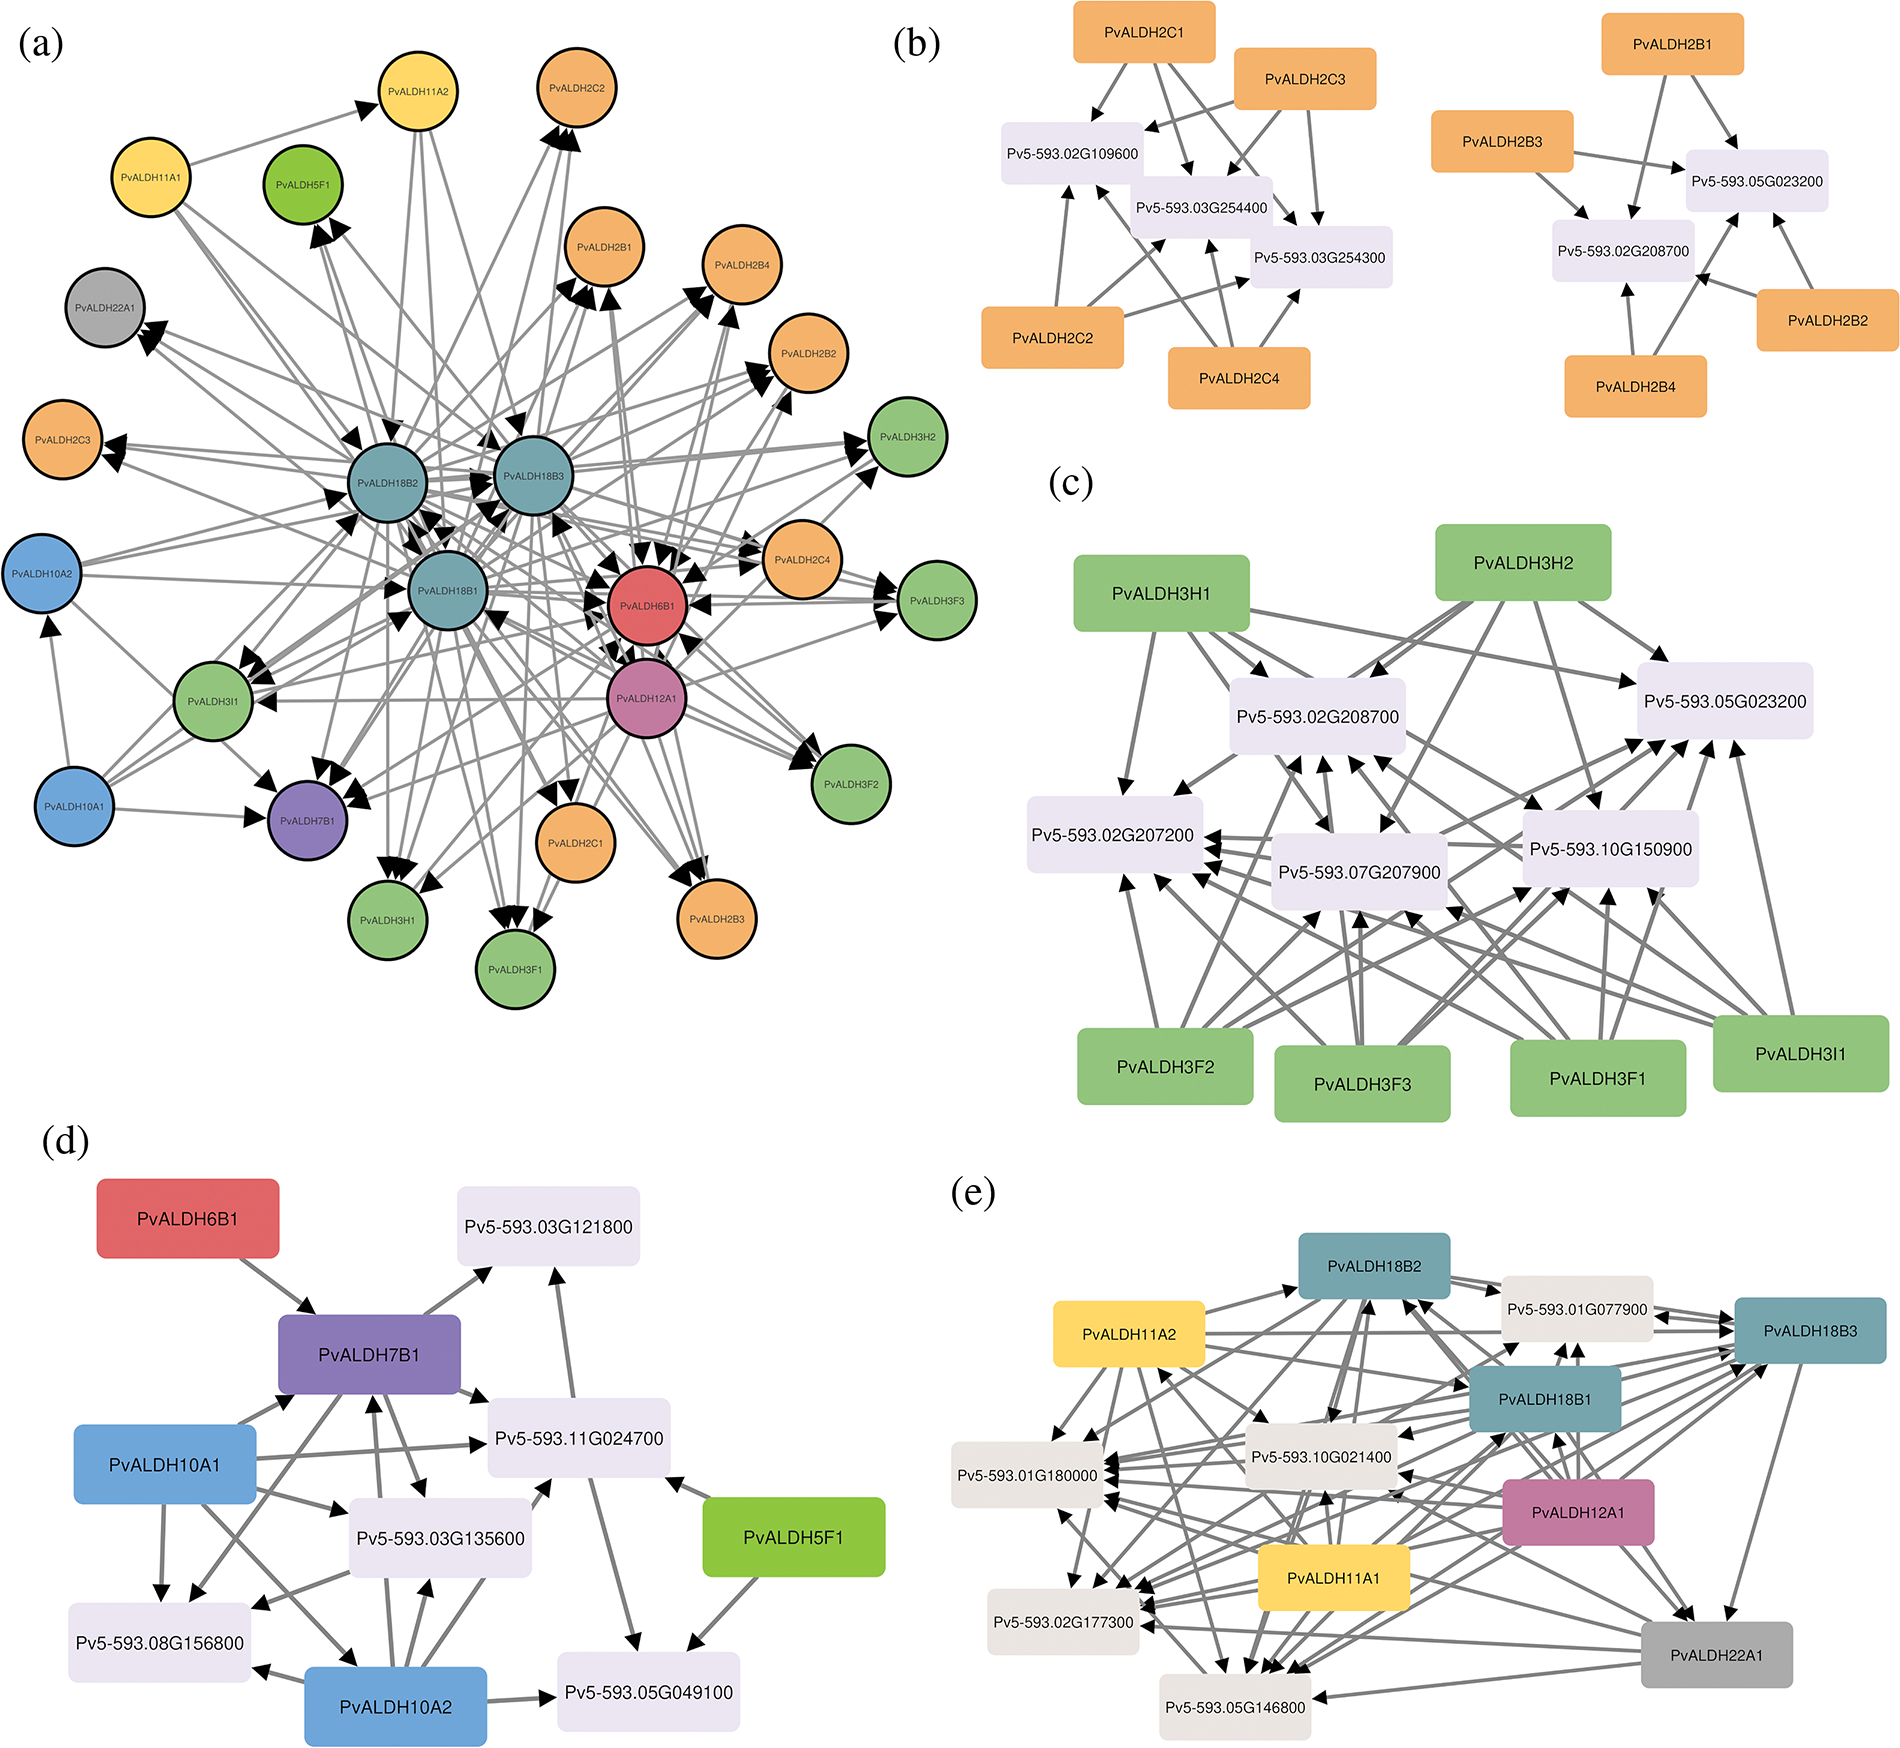
Figure 9: Interactions of PvALDH proteins between themselves and other proteins. (a) Interactions between PvALDH proteins, (b) Interactions of subfamilies B and C of the PvALDH 2 family, (c) Protein interactions of the PvALDH 3 family, (d) Protein interactions of families PvALDH 5-6-7 and 10, (e) Protein interactions of the PvALDH 11-12-18 and 22 families
3.6 In Silico Expression Analysis of PvALDH Super Gene Family in Different Plant Tissues
PvALDH genes showed high expression in the floral part of the plant according to the results of in silico analysis and the results are given in Fig. 10. Again, the place where the lowest expression is observed is the body part. While PvALDH11A1 is the gene with the least expression across examined tissues, the PvALDH2B2 gene is the gene with the most expression. When the body part has been examined, the PvALDH2C1 gene has been found to be the most expressed and the PvALDH3I1 gene has been the least expressed. In the root part, the PvALDH11A1 gene has shown the least, and the PvALDH2B2 gene has shown the most expression levels. The expression levelof PvALDH11A2 gene in the leaves has been observed to be the most and PvALDH2C2 gene has been observed to be the least expressed. In the floral parts, PvALDH11A1 has been identified as the gene with the least expression and the PvALDH3H1 gene with the most expression levels. In A. sativum, AsALDH2C4 has been found to be the most highly expressed gene in the root part [45]. In the A. hypogaea, AhALDH2C7 gene has also been found to be highly expressed in the root [46]. In S. bicolor, SbALDH2C3 showed a high expression in all tissues [42]. In tissues of S. tuberosum, the StALDH2B2 gene has been found to have high expression levels [42].
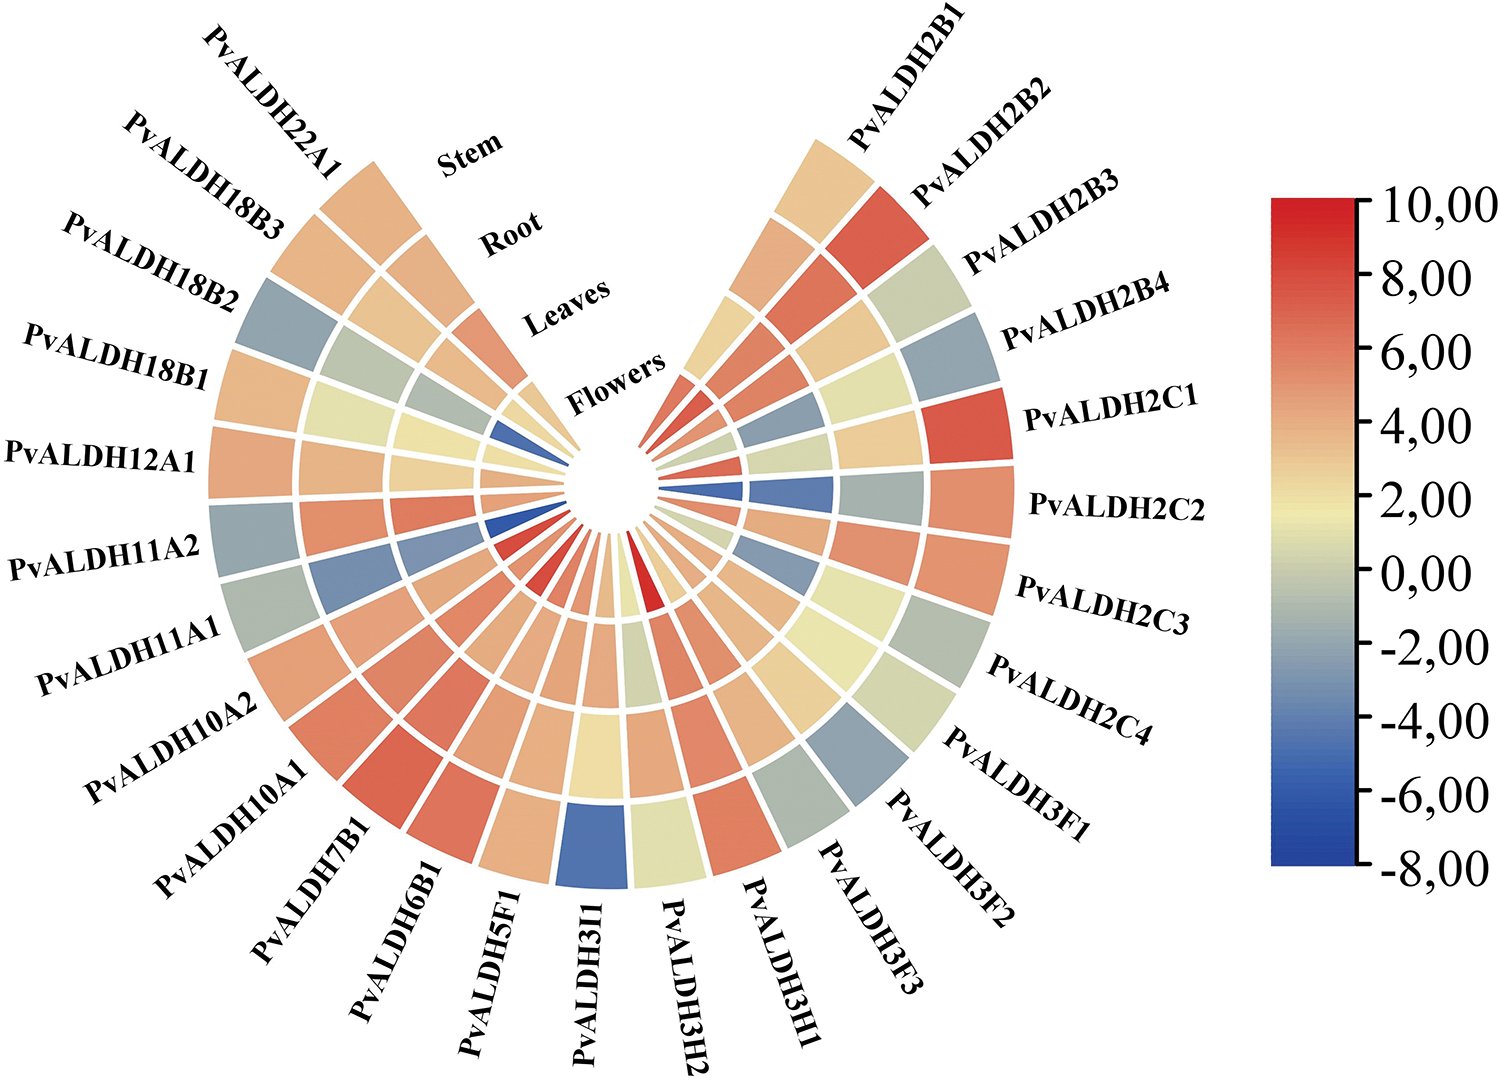
Figure 10: In silico analysis of expression data of PvALDH genes in different plant parts such as stem, stem, leaf and flower
Using tissue libraries derived from P. vulgaris leaves under salt and drought stress, expression levels of PvALDH genes were examined. As a result of the silico analysis, it was determined that the expression of PvALDH genes under salt and drought stress changed (Fig. 11). Under drought stress, the expression levels of PvALDH2B1, PvALDH2C2, PvALDH2C4, PvALDH3F1, PvALDH3F3, PvALDH7B1, PvALDH10A2, PvALDH11A2 and PvALDH12A1 genes decreased. The expression levels of PvALDH2B4, PvALDH2C1, PvALDH3F2, PvALDH3H2, PvALDH3I1, PvALDH18B1 and PvALDH18B2 genes increased.
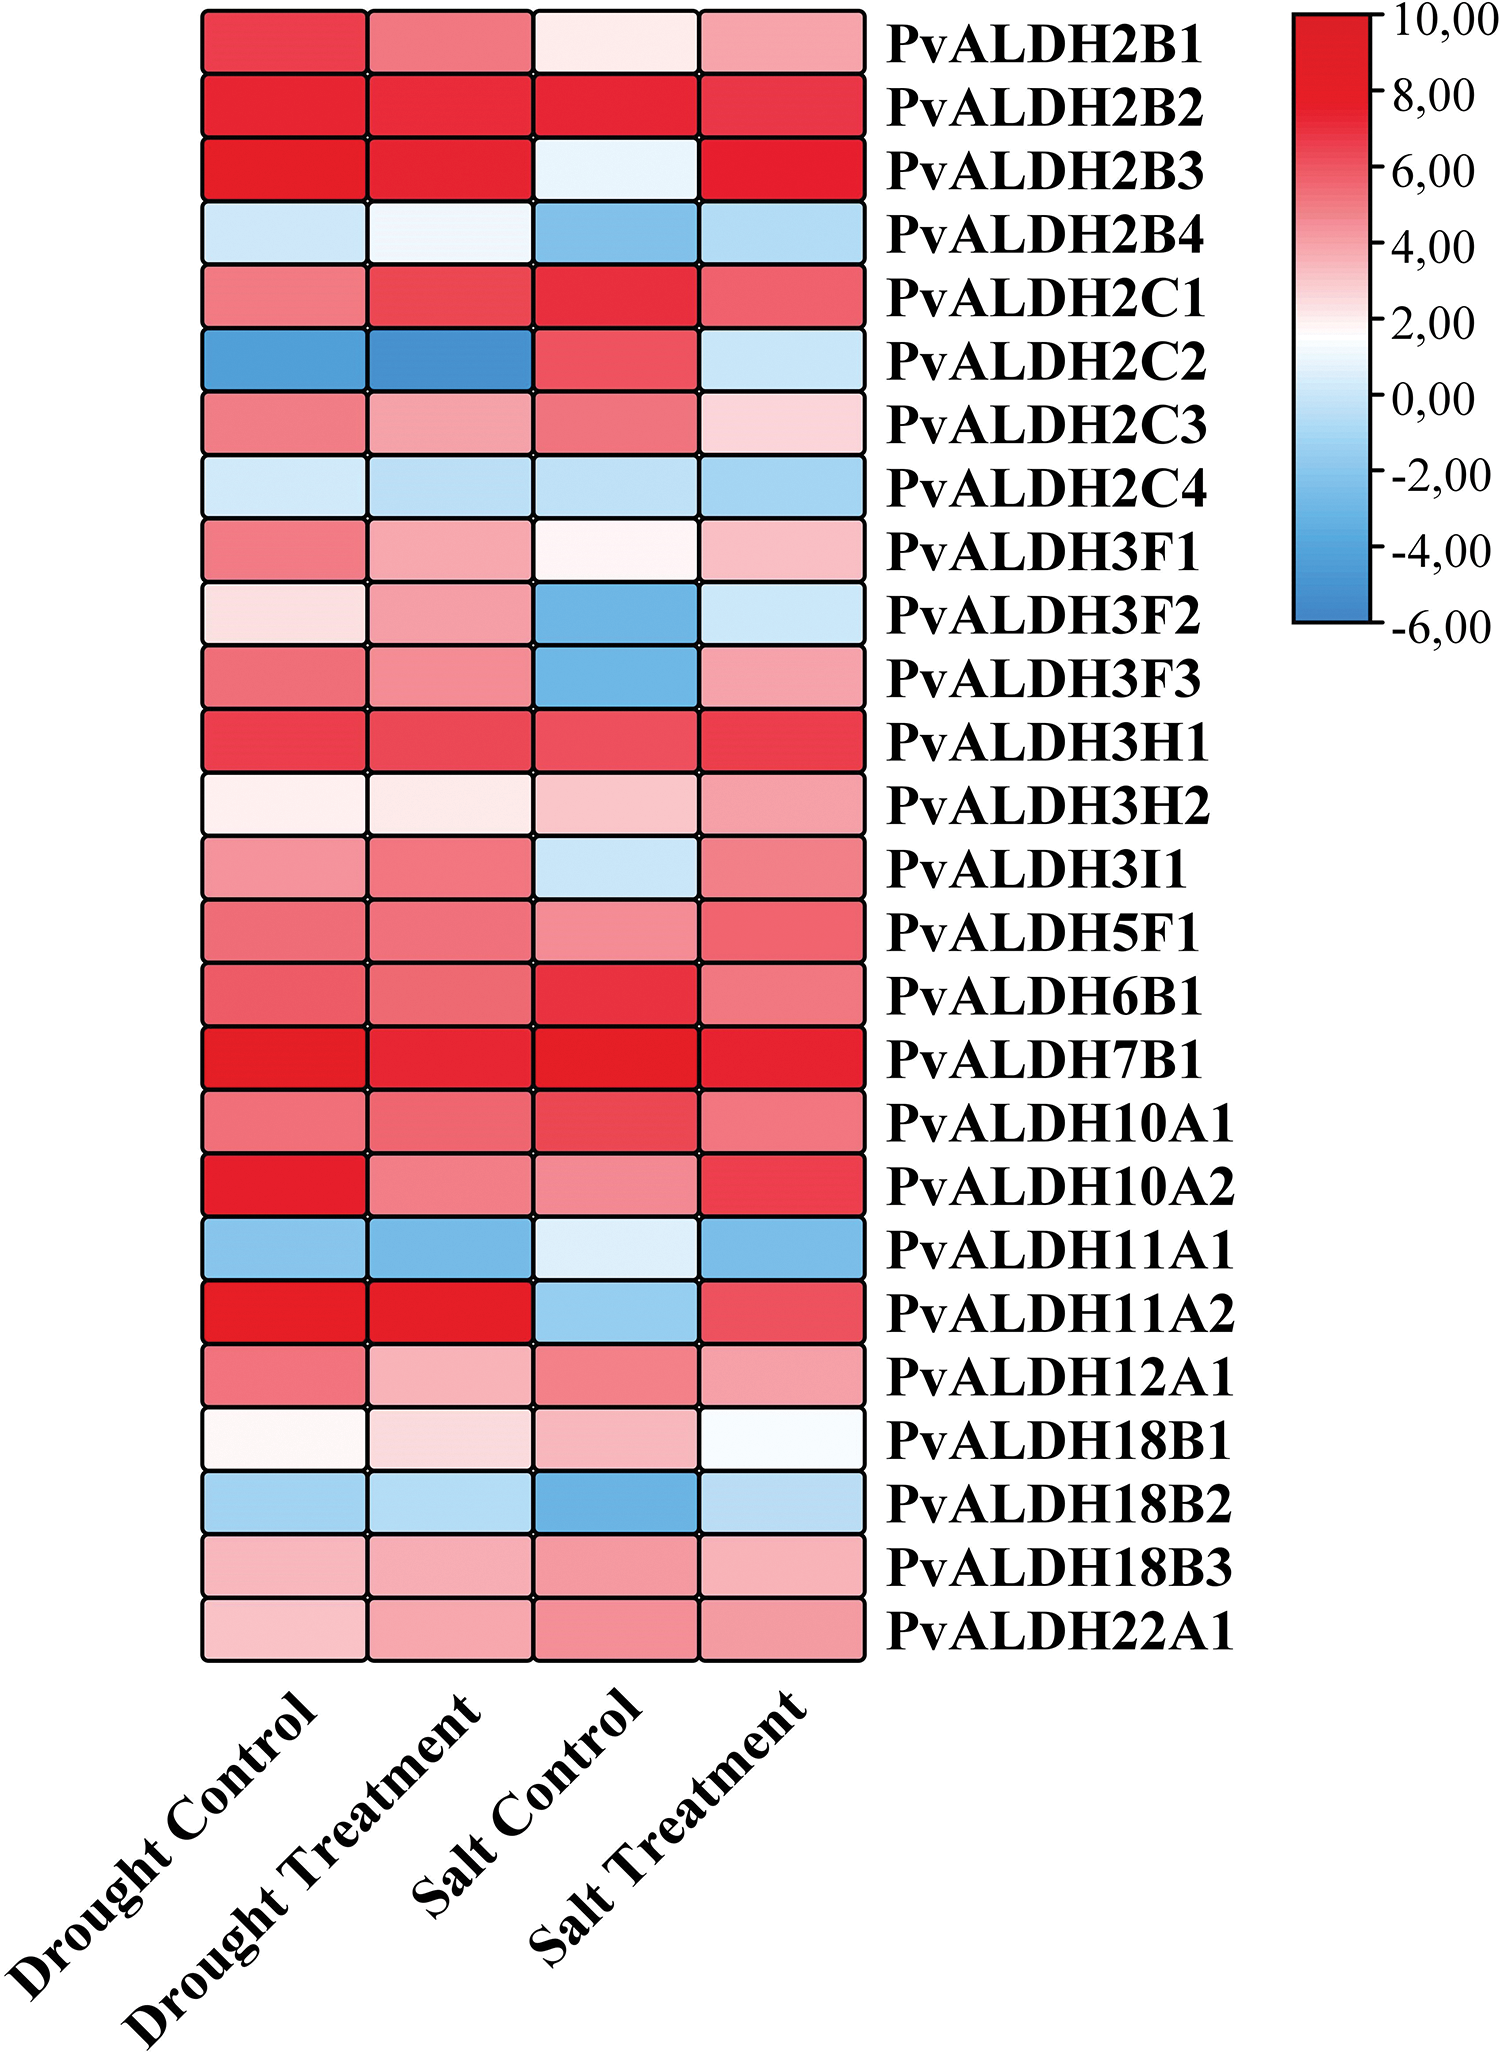
Figure 11: In silico analysis of expression states of PvALDH genes under salt and drought stress
Under salt stress, the expression of PvALDH2B2, PvALDH2C1, PvALDH2C2, PvALDH2C3, PvALDH2C4, PvALDH6B1, PvALDH10A1, PvALDH11A1, PvALDH18B1 and PvALDH18B3 genes decreased. The expression levels of PvALDH2B3, PvALDH2B4, PvALDH3F1, PvALDH3F2, PvALDH3F3, PvALDH3F3, PvALDH3H2, PvALDH3I1, PvALDH5F1, PvALDH10A2, PvALDH11A2 and PvALDH18B2 genes increased.
The PvALDH2C2 and PvALDH2C4 genes showed low expression profiles in both types of stress. The PvALDH2B4, PvALDH3F2, PvALDH3H2, PvALDH3I1 and PvALDH18B2 genes showed high levels of expression according to control under both drought and salt stress. Unlike the PvALDH7B1 gene under drought stress, in A. sativum, the expression of the ASALDH7B1 gene increased. Under salt stress, there was an increase in the level of the AsALDH5F1 gene as in the PvALDH5F1 gene [45]. As a result of the drought stress treatment of P. edulis, the expression of the PeALDH3H2 gene is increased, as did the PvALDH3H1 gene [47]. The expression level of the GmALDH3H2 gene, a member of the ALDH3H family, was found to increase further under drought stress [82]. Similar results were found in the StALDH3H1 gene, whose expression was also increased in three different types of stress in S. tuberosum [42].
3.7 Quantitative Real-Time PCR Analysis of the PvALDH Super Gene Family
The expression levels of the PvALDH supergene family in common bean leaf tissue under salt stress (Fig. 12) and drought stress (Fig. 13) were analyzed in two different genotypes: Elkoca-05 and Serra.
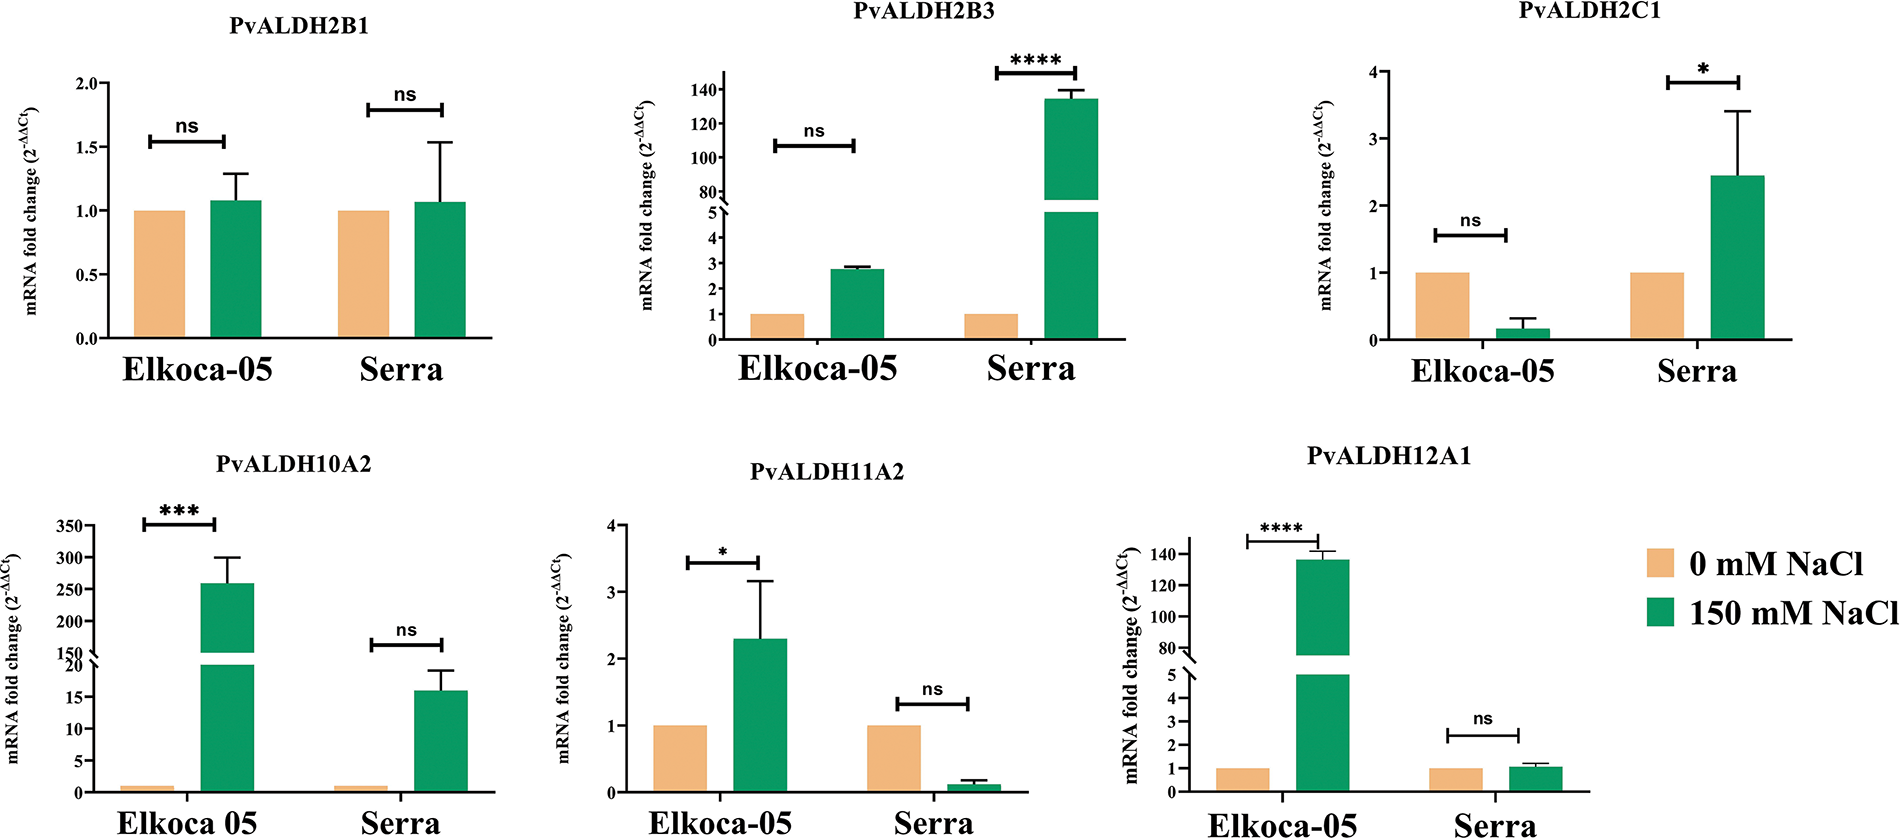
Figure 12: Tissue-specific expression profiles of six Pvul-ALDH genes determined through qRT-PCR analysis of leaf and root tissues from Elkoca-05 and Serra cultivars subjected to salt stress. The bars denote the mean ± standard error (n = 3). Substantial differences between the control and treatment groups were assessed using the Dunnett test (*p < 0.05, ***p < 0.001, ****p < 0.0001, ns: non-significant)
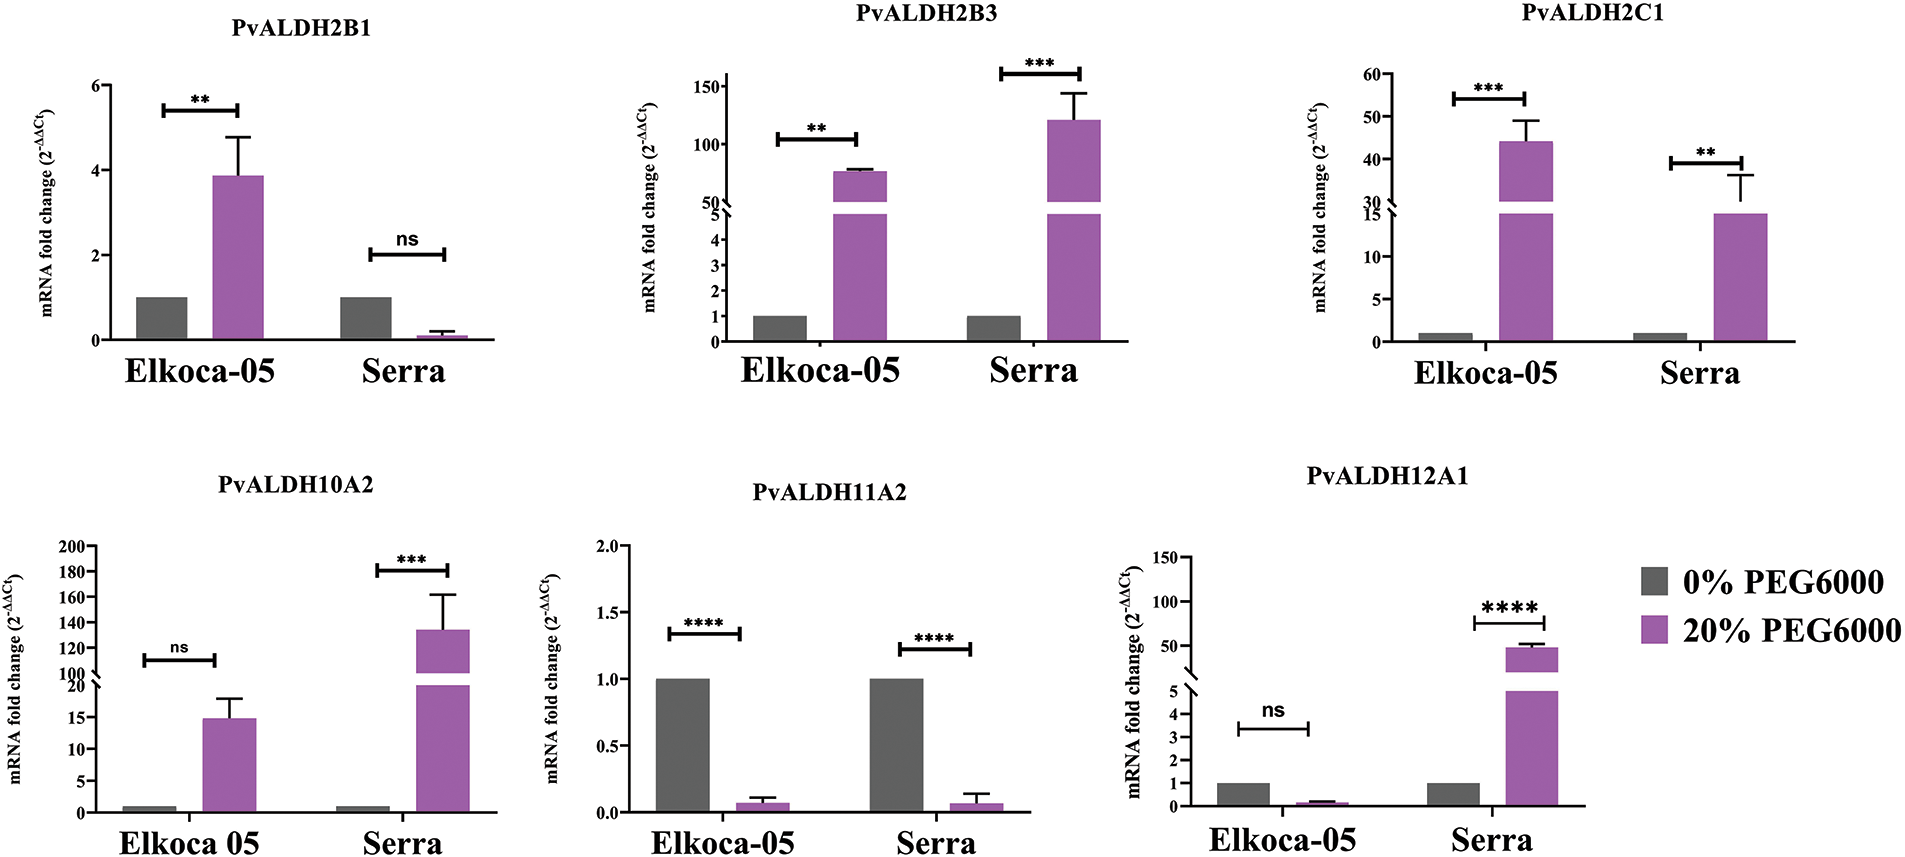
Figure 13: Tissue-specific expression profiles of six Pvul-ALDH genes determined through qRT-PCR analysis of leaf and root tissues from Elkoca-05 and Serra cultivars subjected to drought stress (The bars denote the mean ± standard error (n = 3). Substantial differences between the control and treatment groups were assessed using the Dunnett test (**p < 0.01, ***p < 0.001, ****p < 0.0001, ns: non-significant))
In the analysis conducted on the Elkoca-05 genotype under salt stress, it was observed that there was no significant change in the expression levels of the PvALDH2B1, PvALDH2B3, and PvALDH2C1 genes. However, the PvALDH10A2, PvALDH11A2, and PvALDH12A1 genes showed high expression levels. Among these genes, PvALDH10A2 showed the highest expression level under salt stress in the Elkoca-05 genotype (Fig. 12).
As a result of the analysis conducted on the Serra genotype under salt stress, it was observed that there was no significant change in the expression levels of the PvALDH2B1, PvALDH10A2, PvALDH11A2, and PvALDH12A1 genes. However, the PvALDH2B3 and PvALDH2C1 genes showed high expression levels. Among these genes, PvALDH2B3 showed the highest expression level under salt stress in the Serra genotype (Fig. 12).
Based on the analyses conducted, it was determined that the PvALDH genes did not cause a significant change in leaf tissues under severe salt stress in two different bean genotypes, except for the PvALDH2B3, PvALDH10A2, PvALDH11A2, and PvALDH12A1 genes.
In the analysis conducted on the Elkoca-05 genotype under drought stress, an increase in expression levels was observed for the PvALDH2B1, PvALDH2B3, and PvALDH2C1 genes. The highest expression level was detected in the PvALDH2C1 gene. No significant increase in expression levels was observed for the PvALDH10A2 and PvALDH12A1 genes. However, a decrease in expression levels was observed for the PvALDH11A2 gene under drought stress (Fig. 13).
In the analysis conducted on the Serra genotype drought stress, high expression levels were observed for the PvALDH2B3, PvALDH2C1, PvALDH10A2, and PvALDH12A1 genes. The highest expression level was detected in the PvALDH2B3 gene. While no change was observed in the expression level of PvALDH2B1 gene, a significant decrease in the expression level of PvALDH11A2 gene was detected (Fig. 13). Except for the PvALDH11A2 gene, the expression levels of the other PvALDH genes analyzed were upregulated in bean leaf tissues under drought stress in both genotypes.
Dong et al. [39] found that ALDH genes on cotton (G. hirsutum) were upregulated in leaf tissues under severe salt stress. In the study, despite the direct exposure of roots to environmental stresses, the reason for the increase in the expression level in leaf tissues more than in root tissues was related to the fact that these two tissues are different in terms of structure and function [39].
In another study with ALDH genes, Wang et al. [82] found that the expression levels of these genes were upregulated in young leaves of rice (O. sativa) under drought stress. On the other hand, they observed that none of the eight genes they identified caused a significant change in expression levels in rice panicles under drought stress. Based on their findings, they concluded that the function of ALDH genes is organ-specific in response to abiotic stresses in rice plants [83].
Plants are struggling with many abiotic stress factors due to their sessile structure. In this struggle, various toxic aldehyde products accumulate as a result of stress, and aldehyde dehydrogenases (ALDH) contribute to stress tolerance by providing oxidation of these aldehydes. There are 26 ALDH gene families in P. vulgaris. These are divided into 10 different families. As a result of the analysis, cis-elements associated with abiotic stress have been found on these genes. PvALDH genes have been found to act as the most oxidoreductase. When all genes are examined, in silico gene expressions are most often seen in the floral part of the plant. Interestingly, the PvALDH genes show both a very high and very low expression profile in the plant’s stem. PvALDH genes show varying expression profiles under both salt and drought stress. Similar to results in other species, the PvALDH3H1 gene shows increased expression levels. Other studies, which are also discussed in this article, have reported altered expression levels of ALDH genes under different abiotic stress conditions (increased expression levels of some genes and decreased expression levels of others). This study provides a basis for further studies of ALDH genes in P. vulgaris.
Acknowledgement: None.
Funding Statement: The author declares that no funds, grants or other supports were received.
Availability of Data and Materials: All data included in this work are available upon request by contact with the corresponding author.
Ethics Approval: Not applicable.
Conflicts of Interest: The author declares no conflicts of interest to report regarding the present study.
Supplementary Materials: The supplementary material is available online at https://doi.org/10.32604/phyton.2024.058627.
References
1. Broughton WJ, Hernández G, Blair M, Beebe S, Gepts P, Vanderleyden J. Beans (Phaseolus spp.)–model food legumes. Plant Soil. 2003;252(1):55–128. doi:10.1023/A:1024146710611. [Google Scholar] [CrossRef]
2. Hayat I, Ahmad A, Masud T, Ahmed A, Bashir S. Nutritional and health perspectives of beans (Phaseolus vulgaris L.an overview. Crit Rev Food Sci Nutr. 2014;54(5):580–92. doi:10.1080/10408398.2011.596639. [Google Scholar] [PubMed] [CrossRef]
3. de Almeida Costa GE, da Silva Queiroz-Monici K, Reis SMPM, de Oliveira AC. Chemical composition, dietary fibre and resistant starch contents of raw and cooked pea, common bean, chickpea and lentil legumes. Food Chem. 2006;94(3):327–30. doi:10.1016/j.foodchem.2004.11.020. [Google Scholar] [CrossRef]
4. FAOSTAT. Food and agriculture data. Rome: FAOSTAT. Available from: https://www.fao.org/faostat/en/. [Accessed 2024]. [Google Scholar]
5. Gong Z, Xiong L, Shi H, Yang S, Herrera-Estrella LR, Xu G, et al. Plant abiotic stress response and nutrient use efficiency. Sci China Life Sci. 2020;63(5):635–74 (In Chinese). doi:10.1007/s11427-020-1683-x. [Google Scholar] [PubMed] [CrossRef]
6. Anzano A, Bonanomi G, Mazzoleni S, Lanzotti V. Plant metabolomics in biotic and abiotic stress: a critical overview. Phytochem Rev. 2022;21(2):503–24. doi:10.1007/s11101-021-09786-w. [Google Scholar] [CrossRef]
7. Mukhopadhyay R, Sarkar B, Jat HS, Sharma PC, Bolan NS. Soil salinity under climate change: challenges for sustainable agriculture and food security. J Environ Manage. 2021;280(6):111736. doi:10.1016/j.jenvman.2020.111736. [Google Scholar] [PubMed] [CrossRef]
8. da Silva EC, Nogueira R, da Silva MA, de Albuquerque MB. Drought stress and plant nutrition. Plant Stress. 2011;5(1):32–41. [Google Scholar]
9. Mathobo R, Marais D, Steyn JM. The effect of drought stress on yield, leaf gaseous exchange and chlorophyll fluorescence of dry beans (Phaseolus vulgaris L.). Agric Water Manag. 2017;180(2):118–25. doi:10.1016/j.agwat.2016.11.005. [Google Scholar] [CrossRef]
10. Khatun M, Sarkar S, Era FM, Islam AKMM, Anwar MP, Fahad S, et al. Drought stress in grain legumes: effects, tolerance mechanisms and management. Agronomy. 2021;11(12):2374. doi:10.3390/agronomy11122374. [Google Scholar] [CrossRef]
11. Gama PBS, Inanaga S, Tanaka K, Nakazawa R. Physiological response of common bean (Phaseolus vulgaris L.) seedlings to salinity stress. Afr J Biotechnol. 2007;6(2). doi:10.4314/ajb.v6i2.56104. [Google Scholar] [CrossRef]
12. Farooq M, Gogoi N, Hussain M, Barthakur S, Paul S, Bharadwaj N, et al. Effects, tolerance mechanisms and management of salt stress in grain legumes. Plant Physiol Biochem. 2017;118(5):199–217. doi:10.1016/j.plaphy.2017.06.020. [Google Scholar] [PubMed] [CrossRef]
13. Brocker C, Vasiliou M, Carpenter S, Carpenter C, Zhang Y, Wang X, et al. Aldehyde dehydrogenase (ALDH) superfamily in plants: gene nomenclature and comparative genomics. Planta. 2013;237(1):189–210. doi:10.1007/s00425-012-1749-0. [Google Scholar] [PubMed] [CrossRef]
14. Hempel J, Nicholas H, Lindahl R. Aldehyde dehydrogenases: widespread structural and functional diversity within a shared framework. Protein Sci. 1993;2(11):1890–900. doi:10.1002/pro.5560021111. [Google Scholar] [PubMed] [CrossRef]
15. Steinmetz CG, Xie P, Weiner H, Hurley TD. Structure of mitochondrial aldehyde dehydrogenase: the genetic component of ethanol aversion. Structure. 1997;5(5):701–11. doi:10.1016/S0969-2126(97)00224-4. [Google Scholar] [PubMed] [CrossRef]
16. Singh S, Brocker C, Koppaka V, Chen Y, Jackson BC, Matsumoto A, et al. Aldehyde dehydrogenases in cellular responses to oxidative/electrophilic stress. Free Radic Biol Med. 2013;56(Suppl. 3):89–101. doi:10.1016/j.freeradbiomed.2012.11.010. [Google Scholar] [PubMed] [CrossRef]
17. Kirch HH, Bartels D, Wei Y, Schnable PS, Wood AJ. The ALDH gene superfamily of Arabidopsis. Trends Plant Sci. 2004;9(8):371–7. doi:10.1016/j.tplants.2004.06.004. [Google Scholar] [PubMed] [CrossRef]
18. Oberschall A, Deák M, Török K, Sass L, Vass I, Kovács I, et al. A novel aldose/aldehyde reductase protects transgenic plants against lipid peroxidation under chemical and drought stresses. Plant J. 2000;24(4):437–46. doi:10.1111/j.1365-313X.2000.00885.x. [Google Scholar] [CrossRef]
19. Kotchoni SO, Kuhns C, Ditzer A, Kirch HH, Bartels D. Over-expression of different aldehyde dehydrogenase genes in Arabidopsis thaliana confers tolerance to abiotic stress and protects plants against lipid peroxidation and oxidative stress. Plant Cell Environ. 2006;29(6):1033–48. doi:10.1111/j.1365-3040.2005.01458.x. [Google Scholar] [PubMed] [CrossRef]
20. Huang W, Ma X, Wang Q, Gao Y, Xue Y, Niu X, et al. Significant improvement of stress tolerance in tobacco plants by overexpressing a stress-responsive aldehyde dehydrogenase gene from maize (Zea mays). Plant Mol Biol. 2008;68(4):451–63. doi:10.1007/s11103-008-9382-9. [Google Scholar] [PubMed] [CrossRef]
21. Xu X, Guo R, Cheng C, Zhang H, Zhang Y, Wang X. Overexpression of ALDH2B8, an aldehyde dehydrogenase gene from grapevine, sustains Arabidopsis growth upon salt stress and protects plants against oxidative stress. Plant Cell Tissue Organ Cult. 2013;114(2):187–96. doi:10.1007/s11240-013-0314-2. [Google Scholar] [CrossRef]
22. Chen J, Wei B, Li G, Fan R, Zhong Y, Wang X, et al. TraeALDH7B1-5A, encoding aldehyde dehydrogenase 7 in wheat, confers improved drought tolerance in Arabidopsis. Planta. 2015;242(1):137–51. doi:10.1007/s00425-015-2290-8. [Google Scholar] [PubMed] [CrossRef]
23. Arakawa K, Katayama M, Takabe T. Levels of betaine and betaine aldehyde dehydrogenase activity in the green leaves, and etiolated leaves and roots of barley. Plant Cell Physiol. 1990;31(6):797–803. doi:10.1093/oxfordjournals.pcp.a077981. [Google Scholar] [CrossRef]
24. Pan SM, Moreau RA, Yu C, Huang AHC. Betaine accumulation and betaine-aldehyde dehydrogenase in spinach leaves. Plant Physiol. 1981;67(6):1105–8. doi:10.1104/pp.67.6.1105. [Google Scholar] [PubMed] [CrossRef]
25. Weretilnyk EA, Hanson AD. Betaine aldehyde dehydrogenase polymorphism in spinach: genetic and biochemical characterization. Biochem Genet. 1988;26(1):143–51. doi:10.1007/BF00555495. [Google Scholar] [PubMed] [CrossRef]
26. Weretilnyk EA, Hanson AD. Molecular cloning of a plant betaine-aldehyde dehydrogenase, an enzyme implicated in adaptation to salinity and drought. Proc Natl Acad Sci U S A. 1990;87(7):2745–9. doi:10.1073/pnas.87.7.2745. [Google Scholar] [PubMed] [CrossRef]
27. Cui X, Wise RP, Schnable PS. The rf2 nuclear restorer gene of male-sterile T-cytoplasm maize. Science. 1996;272(5266):1334–6. doi:10.1126/science.272.5266.1334. [Google Scholar] [PubMed] [CrossRef]
28. Sophos NA, Pappa A, Ziegler TL, Vasiliou V. Aldehyde dehydrogenase gene superfamily: the 2000 update. Chem Biol Interact. 2001;130–132(1–3):323–37. doi:10.1016/S0009-2797(00)00275-1. [Google Scholar] [PubMed] [CrossRef]
29. Kotchoni SO, Jimenez-Lopez JC, Gao D, Edwards V, Gachomo EW, Margam VM, et al. Modeling-dependent protein characterization of the rice aldehyde dehydrogenase (ALDH) superfamily reveals distinct functional and structural features. PLoS One. 2010;5(7):e11516. doi:10.1371/journal.pone.0011516. [Google Scholar] [PubMed] [CrossRef]
30. Jimenez-Lopez JC, Gachomo EW, Seufferheld MJ, Kotchoni SO. The maize ALDH protein superfamily: linking structural features to functional specificities. BMC Struct Biol. 2010;10(1):43. doi:10.1186/1472-6807-10-43. [Google Scholar] [PubMed] [CrossRef]
31. Zhang Y, Mao L, Wang H, Brocker C, Yin X, Vasiliou V, et al. Genome-wide identification and analysis of grape aldehyde dehydrogenase (ALDH) gene superfamily. PLoS One. 2012;7(2):e32153. doi:10.1371/journal.pone.0032153. [Google Scholar] [PubMed] [CrossRef]
32. Kotchoni SO, Jimenez-Lopez JC, Kayodé AP, Gachomo EW, Baba-Moussa L. The soybean aldehyde dehydrogenase (ALDH) protein superfamily. Gene. 2012;495(2):128–33. doi:10.1016/j.gene.2011.12.035. [Google Scholar] [PubMed] [CrossRef]
33. Zhou ML, Zhang Q, Zhou M, Qi LP, Yang XB, Zhang KX, et al. Aldehyde dehydrogenase protein superfamily in maize. Funct Integr Genomics. 2012;12(4):683–91. doi:10.1007/s10142-012-0290-3. [Google Scholar] [PubMed] [CrossRef]
34. Li X, Guo R, Li J, Singer SD, Zhang Y, Yin X, et al. Genome-wide identification and analysis of the aldehyde dehydrogenase (ALDH) gene superfamily in apple (Malus × domestica Borkh.). Plant Physiol Biochem. 2013;71:268–82. doi:10.1016/j.plaphy.2013.07.017. [Google Scholar] [PubMed] [CrossRef]
35. Chen Z, Chen M, Xu ZS, Li LC, Chen XP, MA YZ. Characteristics and expression patterns of the aldehyde dehydrogenase (ALDH) gene superfamily of foxtail millet (Setaria italica L.). PLoS One. 2014;9(7):e101136. doi:10.1371/journal.pone.0101136. [Google Scholar] [PubMed] [CrossRef]
36. He D, Lei Z, Xing H, Tang B. Genome-wide identification and analysis of the aldehyde dehydrogenase (ALDH) gene superfamily of Gossypium raimondii. Gene. 2014;549(1):123–33. doi:10.1016/j.gene.2014.07.054. [Google Scholar] [PubMed] [CrossRef]
37. Tian FX, Zang JL, Wang T, Xie YL, Zhang J, Hu JJ. Aldehyde dehydrogenase gene superfamily in Populus: organization and expression divergence between paralogous gene pairs. PLoS One. 2015;10(4):e0124669. doi:10.1371/journal.pone.0124669. [Google Scholar] [PubMed] [CrossRef]
38. Jimenez-Lopez JC, Lopez-Valverde FJ, Robles-Bolivar P, Lima-Cabello E, Gachomo EW, Kotchoni SO. Genome-wide identification and functional classification of tomato (Solanum lycopersicum) aldehyde dehydrogenase (ALDH) gene superfamily. PLoS One. 2016;11(10):e0164798. doi:10.1371/journal.pone.0164798. [Google Scholar] [PubMed] [CrossRef]
39. Dong Y, Liu H, Zhang Y, Hu J, Feng J, Li C, et al. Comparative genomic study of ALDH gene superfamily in Gossypium: a focus on Gossypium hirsutum under salt stress. PLoS One. 2017;12(5):e0176733. doi:10.1371/journal.pone.0176733. [Google Scholar] [PubMed] [CrossRef]
40. Gautam R, Ahmed I, Shukla P, Meena RK, Kirti PB. Genome-wide characterization of ALDH superfamily in Brassica rapa and enhancement of stress tolerance in heterologous hosts by BrALDH7B2 expression. Sci Rep. 2019;9(1):549. doi:10.1038/s41598-019-43332-1. [Google Scholar] [PubMed] [CrossRef]
41. Jiang X, Ren J, Ye X, Liu M, Li Q, Wang L, et al. Genome-wide identification and analysis of the aldehyde dehydrogenase gene superfamily in Chinese cabbage (Brassica rapa subsp. pekinensis). Can J Plant Sci. 2019;99(4):420–36. doi:10.1139/cjps-2018-0205. [Google Scholar] [CrossRef]
42. Islam MS, Hasan MS, Hasan MN, Prodhan SH, Islam T, Ghosh A. Genome-wide identification, evolution, and transcript profiling of aldehyde dehydrogenase superfamily in potato during development stages and stress conditions. Sci Rep. 2021;11(1):2028. doi:10.1038/s41598-021-97691-9. [Google Scholar] [PubMed] [CrossRef]
43. Carmona-Molero R, Jimenez-Lopez JC, Caballo C, Gil J, Millán T, Die JV. Aldehyde dehydrogenase 3 is an expanded gene family with potential adaptive roles in chickpea. Plants. 2021;10(11):2429. doi:10.3390/plants10112429. [Google Scholar] [PubMed] [CrossRef]
44. Su W, Zhang C, Wang D, Ren Y, Zhang J, Zang S, et al. A comprehensive survey of the aldehyde dehydrogenase gene superfamily in Saccharum and the role of ScALDH2B-1 in the stress response. Environ Exp Bot. 2022;194:104725. doi:10.1016/j.envexpbot.2021.104725. [Google Scholar] [CrossRef]
45. Munim Twaij B, Jameel Ibraheem L, Al-Shammari RHH, Hasan M, Akter Khoko R, Sunzid Ahomed M, et al. Identification and characterization of aldehyde dehydrogenase (ALDH) gene superfamily in garlic and expression profiling in response to drought, salinity, and ABA. Gene. 2023;860(7):147215. doi:10.1016/j.gene.2023.147215. [Google Scholar] [PubMed] [CrossRef]
46. Zhang X, Zhong J, Cao L, Ren C, Yu G, Gu Y, et al. Genome-wide characterization of aldehyde dehydrogenase gene family members in groundnut (Arachis hypogaea) and the analysis under saline-alkali stress. Front Plant Sci. 2023;14:W202. doi:10.3389/fpls.2023.1097001. [Google Scholar] [PubMed] [CrossRef]
47. Xu J, Liu L, Huang H, Shang C, Pan H, Fan H, et al. Genome-wide characterization and gene expression analyses of ALDH gene family in response to drought stress in moso bamboo (Phyllostachys edulis). Plant Physiol Biochem. 2023;202(1):107954. doi:10.1016/j.plaphy.2023.107954. [Google Scholar] [PubMed] [CrossRef]
48. Jamil A, Riaz S, Ashraf M, Foolad MR. Gene expression profiling of plants under salt stress. Crit Rev Plant Sci. 2011;30(5):435–58. doi:10.1080/07352689.2011.605739. [Google Scholar] [CrossRef]
49. Araújo SS, Beebe S, Crespi M, Delbreil B, González EM, Gruber V, et al. Abiotic stress responses in legumes: strategies used to cope with environmental challenges. Crit Rev Plant Sci. 2015;34(1–3):237–80. doi:10.1080/07352689.2014.898450. [Google Scholar] [CrossRef]
50. Mistry J, Chuguransky S, Williams L, Qureshi M, Salazar GA, Sonnhammer ELL, et al. Pfam: the protein families database in 2021. Nucleic Acids Res. 2021;49(D1):D412–19. doi:10.1093/nar/gkaa913. [Google Scholar] [PubMed] [CrossRef]
51. Valliyodan B, Cannon SB, Bayer PE, Shu S, Brown AV, Ren L, et al. Construction and comparison of three reference-quality genome assemblies for soybean. Plant J. 2019;100(5):1066–82. doi:10.1111/tpj.14500. [Google Scholar] [PubMed] [CrossRef]
52. Lamesch P, Berardini TZ, Li D, Swarbreck D, Wilks C, Sasidharan R, et al. The Arabidopsis Information Resource (TAIRimproved gene annotation and new tools. Nucleic Acids Res. 2012;40(D1):D1202–10. doi:10.1093/nar/gkr1090. [Google Scholar] [PubMed] [CrossRef]
53. Goodstein DM, Shu S, Howson R, Neupane R, Hayes RD, Fazo J, et al. Phytozome: a comparative platform for green plant genomics. Nucleic Acids Res. 2012;40(D1):D1178–86. doi:10.1093/nar/gkr944. [Google Scholar] [PubMed] [CrossRef]
54. Hu B, Jin J, Guo AY, Zhang H, Luo J, Gao G. GSDS 2.0: an upgraded gene feature visualization server. Bioinformatics. 2015;31(8):1296–97. doi:10.1093/bioinformatics/btu817. [Google Scholar] [PubMed] [CrossRef]
55. Chen C, Wu Y, Li J, Wang X, Zeng Z, Xu J, et al. TBtools-II: a “one for all, all for one” bioinformatics platform for biological big-data mining. Mol Plant. 2023;16(11):1733–42. doi:10.1016/j.molp.2023.09.010. [Google Scholar] [PubMed] [CrossRef]
56. Eddy SR. Accelerated profile HMM searches. PLoS Comput Biol. 2011;7(10):e1002195. doi:10.1371/journal.pcbi.1002195. [Google Scholar] [PubMed] [CrossRef]
57. Sigrist CJA, Cerutti L, de Castro E, Langendijk-Genevaux PS, Bulliard V, Bairoch A, et al. PROSITE, a protein domain database for functional characterization and annotation. Nucleic Acids Res. 2010;38(suppl_1):D161–6. doi:10.1093/nar/gkp885. [Google Scholar] [PubMed] [CrossRef]
58. Gasteiger E, Hoogland C, Gattiker A, Duvaud S, Wilkins MR, Appel RD, et al. Protein identification and analysis tools on the ExPASy server. In: John MW, editor. The proteomics protocols handbook. Totowa, NJ: Humana Press; 2005. p. 571–607. doi:10.1385/159259-890-0:571. [Google Scholar] [CrossRef]
59. Horton P, Park KJ, Obayashi T, Fujita N, Harada H, Adams-Collier CJ, et al. WoLF PSORT: protein localization predictor. Nucleic Acids Res. 2007;35(suppl_2):W585–7. doi:10.1093/nar/gkm259. [Google Scholar] [PubMed] [CrossRef]
60. Yang Z, Nielsen R. Estimating synonymous and nonsynonymous substitution rates under realistic evolutionary models. Mol Biol Evol. 2000;17(1):32–43. doi:10.1093/oxfordjournals.molbev.a026236. [Google Scholar] [PubMed] [CrossRef]
61. Lynch M, Conery JS. The evolutionary demography of duplicate genes. In: Meyer A, Van de Peer Y, editors. Genome evolution. Dordrecht: Springer; 2003. p. 35–44. doi:10.1007/978-94-010-0263-9_4. [Google Scholar] [CrossRef]
62. Bailey TL, Williams N, Misleh C, Li WW. MEME: discovering and analyzing DNA and protein sequence motifs. Nucleic Acids Res. 2006;34(suppl_2):W369–73. doi:10.1093/nar/gkl198. [Google Scholar] [PubMed] [CrossRef]
63. Muslu S, Kasapoğlu AG, Güneş E, Aygören AS, Yiğider E, İlhan E, et al. Genome-wide analysis of glutathione S-transferase gene family in P. vulgaris under drought and salinity stress. Plant Mol Biol Rep. 2023;42(1):57–76. doi:10.1007/s11105-023-01400-x. [Google Scholar] [CrossRef]
64. Kumar S, Stecher G, Tamura K. MEGA7: molecular evolutionary genetics analysis version 7.0 for bigger datasets. Mol Biol Evol. 2016;33(7):1870–4. doi:10.1093/molbev/msw054. [Google Scholar] [PubMed] [CrossRef]
65. Letunic I, Bork P. Interactive Tree Of Life (iTOL) v5: an online tool for phylogenetic tree display and annotation. Nucleic Acids Res. 2021;49(W1):W293–6. doi:10.1093/nar/gkab301. [Google Scholar] [PubMed] [CrossRef]
66. Wang Y, Tang H, DeBarry JD, Tan X, Li J, Wang X, et al. MCScanX: a toolkit for detection and evolutionary analysis of gene synteny and collinearity. Nucleic Acids Res. 2012;40(7). doi:10.1093/nar/gkr1293. [Google Scholar] [PubMed] [CrossRef]
67. Lescot M, Déhais P, Thijs G, Marchal K, Moreau Y, Van de Peer Y, et al. PlantCARE, a database of plant cis-acting regulatory elements and a portal to tools for in silico analysis of promoter sequences. Nucleic Acids Res. 2002;30(1):325–7. doi:10.1093/nar/30.1.325. [Google Scholar] [PubMed] [CrossRef]
68. Shannon P, Markiel A, Ozier O, Baliga NS, Wang JT, Ramage D, et al. Cytoscape: a software environment for integrated models of biomolecular interaction networks. Genome Res. 2003;13(11):2498–504. doi:10.1101/gr.1239303. [Google Scholar] [PubMed] [CrossRef]
69. Kelley LA, Mezulis S, Yates CM, Wass MN, Sternberg MJ. The Phyre2 web portal for protein modeling, prediction and analysis. Nat Protoc. 2015;10(6):845–58. doi:10.1038/nprot.2015.053. [Google Scholar] [PubMed] [CrossRef]
70. Hiz MC, Canher B, Niron H, Turet M. Transcriptome analysis of salt-tolerant common bean (Phaseolus vulgaris L.) under saline conditions. PLoS One. 2014;9(3):e92598. doi:10.1371/journal.pone.0092598. [Google Scholar] [PubMed] [CrossRef]
71. Gregorio Jorge J, Villalobos-López MA, Chavarría-Alvarado KL, Ríos-Meléndez S, López-Meyer M, Arroyo-Becerra A. Genome-wide transcriptional changes triggered by water deficit on a drought-tolerant common bean cultivar. BMC Plant Biol. 2020;20(1):525. doi:10.1186/s12870-020-02664-1. [Google Scholar] [PubMed] [CrossRef]
72. Aygören AS, Güneş E, Muslu S, Kasapoğlu AG, Yiğider E, Aydın M, et al. Genome-wide analysis and characterization of SABATH gene family in Phaseolus vulgaris genotypes subject to melatonin under drought and salinity stresses. Plant Mol Biol Rep. 2023;41(2):242–59. doi:10.1007/s11105-022-01363-5. [Google Scholar] [CrossRef]
73. Hoagland DR, Arnon DI. The water-culture method for growing plants without soil. California agricultural experiment station. 1950. Available from: https://www.cabdirect.org/cabdirect/abstract/19500302257. [Accessed 2024]. [Google Scholar]
74. Livak KJ, Schmittgen TD. Analysis of relative gene expression data using real-time quantitative PCR and the 2−ΔΔCT method. Methods. 2001;25(4):402–8. doi:10.1006/meth.2001.1262. [Google Scholar] [PubMed] [CrossRef]
75. Islam MS, Mohtasim M, Islam T, Ghosh A. Aldehyde dehydrogenase superfamily in sorghum: genome-wide identification, evolution, and transcript profiling during development stages and stress conditions. BMC Plant Biol. 2022;22(1):316. doi:10.1186/s12870-022-03708-4. [Google Scholar] [PubMed] [CrossRef]
76. Kyte J, Doolittle RF. A simple method for displaying the hydropathic character of a protein. J Mol Biol. 1982;157(1):105–32. doi:10.1016/0022-2836(82)90515-0. [Google Scholar] [PubMed] [CrossRef]
77. Juretic N, Hoen DR, Huynh ML, Harrison PM, Bureau TE. The evolutionary fate of MULE-mediated duplications of host gene fragments in rice. Genome Res. 2005;15(9):1292–7. doi:10.1101/gr.4064205. [Google Scholar] [PubMed] [CrossRef]
78. Kasapoğlu AG, Ilhan E, Kizilkaya D, Hossein-Pour A, Haliloğlu K. Genome-wide analysis of BES1 transcription factor family in sorghum (Sorghum bicolor (L.) Moench) genome. Turk J Agric Res. 2020;7(1):85–95. [Google Scholar]
79. Aygören AS, Aydinyurt R, Uçar S, Kasapoğlu AG, Yaprak E, Öner BM, et al. Genome-wide analysis and characterization of the PIF gene family under salt and drought stress in common beans (Phaseolus vulgaris L.). Turk J Agric Res. 2022;9(3):274–85. doi:10.19159/tutad.1109558. [Google Scholar] [CrossRef]
80. İlhan E, Kasapoğlu AG, Muslu S, Aygören AS, Aydin M. Genome-wide analysis and characterization of Eucalyptus grandis TCP transcription factors. J Agric Sci. 2023;29(2):2. doi:10.15832/ankutbd.1104949. [Google Scholar] [CrossRef]
81. Guan Y, Tanwar UK, Sobieszczuk-Nowicka E, Floryszak-Wieczorek J, Arasimowicz-Jelonek M. Comparative genomic analysis of the aldehyde dehydrogenase gene superfamily in Arabidopsis thaliana—searching for the functional key to hypoxia tolerance. Front Plant Sci. 2022;13:1000024. doi:10.3389/fpls.2022.1000024. [Google Scholar] [PubMed] [CrossRef]
82. Wang W, Jiang W, Liu J, Li Y, Gai J, Li Y. Genome-wide characterization of the aldehyde dehydrogenase gene superfamily in soybean and its potential role in drought stress response. BMC Genomics. 2017;18(1):518. doi:10.1186/s12864-017-3908-y. [Google Scholar] [PubMed] [CrossRef]
83. Gao C, Han B. Evolutionary and expression study of the aldehyde dehydrogenase (ALDH) gene superfamily in rice (Oryza sativa). Gene. 2009;431(1–2):86–94. doi:10.1016/j.gene.2008.11.010. [Google Scholar] [PubMed] [CrossRef]
Cite This Article
 Copyright © 2024 The Author(s). Published by Tech Science Press.
This work is licensed under a Creative Commons Attribution 4.0 International License , which permits unrestricted use, distribution, and reproduction in any medium, provided the original work is properly cited.


 Submit a Paper
 Propose a Special lssue
 View Full Text
 Download PDF
 Downloads
 Citation Tools