
 Submit a Paper
 Propose a Special lssue
 Open Access
ARTICLE

Correlation and Pathway Analysis of the Carbon, Nitrogen, and Phosphorus in Soil-Microorganism-Plant with Main Quality Components of Tea (Camellia sinensis)
1 College of Agriculture, Guizhou University, Guiyang, China
2 School of Geography and Resources, Guizhou Education University, Guiyang, China
* Corresponding Author: Ji He. Email:
Phyton-International Journal of Experimental Botany 2024, 93(3), 487-502. https://doi.org/10.32604/phyton.2024.048246
Received 01 December 2023; Accepted 29 January 2024; Issue published 28 March 2024
 View Full Text
 Download PDF
Abstract
The contents of carbon (C), nitrogen (N), and phosphorus (P) in soil-microorganisms-plant significantly affect tea quality by altering the main quality components of tea, such as tea polyphenols, amino acids, and caffeine. However, few studies have quantified the effects of these factors on the main quality components of tea. The study aimed to explore the interactions of C, N, and P in soil-microorganisms-plants and the effects of these factors on the main quality components of tea by using the path analysis method. The results indicated that (1) The contents of C, N, and P in soil, microorganisms, and tea plants were highly correlated and collinear, and showed significant correlations with the main quality components of tea. (2) Optimal regression equations were established to estimate tea polyphenol, amino acid, catechin, caffeine, and water extract content based on C, N, and P contents in soil, microorganisms, and tea plants (R2 = 0.923, 0.726, 0.954, 0.848, and 0.883, respectively). (3) Pathway analysis showed that microbial biomass phosphorus (MBP), root phosphorus, branch nitrogen, and microbial biomass carbon (MBC) were the largest direct impact factors on tea polyphenol, catechin, water extracts, amino acid, and caffeine content, respectively. Leaf carbon, root phosphorus, and leaf nitrogen were the largest indirect impact factors on tea polyphenol, catechin, and water extract content, respectively. Leaf carbon indirectly affected tea polyphenol content mainly by altering MBP content. Root phosphorus indirectly affected catechin content mainly by altering soil organic carbon content. Leaf nitrogen indirectly affected water extract content mainly by altering branch nitrogen content. The research results provide the scientific basis for reasonable fertilization in tea gardens and tea quality improvement.Keywords
Camellia sinensis (L.) O. Kuntze is a perennial evergreen woody crop of the theaceae, planted extensively worldwide as a cash crop [1]. Polyphenols, amino acids, caffeine, and other biochemical components are important metabolic substances of tea trees and vital tea-quality components. The content of these metabolites is strongly correlated to the sensory quality of tea [2,3]. The main quality components of tea are overwhelmingly influenced by the nutrients absorbed and utilized by the tea plant [4,5]. As constituents of tea quality components, tea plants’ C, N, and P contents impact the formation of tea quality and show significant correlations with soil nutrient content [6]. As a vital link between soil and plant nutrients, soil microorganisms have a significant role in the nutrient cycle of soil. Plants absorb nutrient elements from the soil through root systems such as C, N, and P and then return those nutrients to the soil as leaf litter [7]. This shows that the soil-microorganism-plant system involves complex nutrient cycles. The development of high-yield, high-quality, and high-efficiency tea cultivation technology is the main objective of tea garden management at present. Therefore, it is essential to study how C, N, and P in soil-microorganism-plant systems affect the main quality components of tea, which can offer the basis for guiding fertilizer application in tea gardens and improve tea quality.
It was discovered that soil organic C (SOC) was significantly and negatively associated with tea polyphenol levels [8]. N and P were the major elements for the synthesis of tea-quality components. Soil’s N and P levels and those in the tea plants revealed a substantial correlation, as well as a certain connection between the N and P levels of different tea plant organs [9]. Increasing the N and P content in tea plants was beneficial to raising the content of amino acids, caffeine, and other nitrogenous substances in the tea plant, thus advancing tea quality [10]. The above studies demonstrated the synergistic relationship between above- and below-ground nutrients in the tea garden ecosystem and indicated that C, N, and P are important research objects for regulating tea quality.
However, there was a strong correlation and collinear relationship between the amounts of C, N, and P in the soil, microorganisms, and the roots, branches, and leaves of tea plants [3,6]. Correlation analysis reflects only the correlativity among two variables. It is difficult to connect soil, microorganisms, and plants to accurately reflect the correlativity among the main quality components of tea and various factors. To further investigate the interactions of different influence elements and how they affect the main quality components of tea, path analysis was conducted on the main quality components of tea and the C, N, and P contents in soil, microorganisms, and plants, to estimate the influence of each factor on the main quality components of tea, and then determine the contribution of each factor to the main quality components of tea. As a multivariate statistical analytic technique, path analysis can investigate each variable’s relative importance, the link between variables, and the way independent factors affect dependent variables. It breaks down the correlation coefficient into direct and indirect pathway coefficients based on correlation analysis. Direct and indirect pathway coefficients, respectively, show the independent variable’s direct and indirect influences on the dependent variable [11]. At the same time, the path coefficient’s absolute value reflects the magnitude of the effect and clarifies how and to what extent each independent variable affects the dependent variable accordingly [12]. In recent years, some scholars have applied path analysis to explore the impact of multiple variables on dependent variables and have successfully determined the connection between different elements and the influencing elements of the research object [6,13,14]. For example, Jimenez et al. [13] used pathway analysis to assess the relationship between P pools following P fertilizer application to soils with different organic matter contents. The result demonstrated that the only source of unstable P was applied P in soils with large levels of organic matter. To investigate the effects of hydrological conditions, soil characteristics, and plant roots on the ability of karst hillslopes to separate soil, Zi et al. [14] employed the pathway analysis method. The findings indicated that the direct factors influencing soil detachment were water-stable aggregates and root length density. He et al. [6] conducted pathway analysis to explore the influences of soil physicochemical properties on the nutrient content of tea tree new shoots and found that available potassium (K) and pH had a more significant direct influence on new shoot N level, while the remaining factors had an indirect effect on new shoot N content mainly through available K and pH. Thus, path analysis can be used to investigate the connection between the main quality components of tea and the C, N, and P contents in soil, microorganisms, and plants.
Previous studies have mainly used correlation analysis, principal component analysis, multiple regression, and other analytical methods to explore the correlation between soil and tea plant nutrients and their influences on tea quality [8–10]. However, the direct and indirect influences of various nutrients on tea quality components are still unclear. It is difficult to clarify the real and specific impacts of various nutrients on the main quality components of tea. In addition, no studies have been reported that taking the soil-microorganism-plant as a whole system to analyze the connection between nutrient elements and the main quality components of tea. Therefore, correlation analysis, regression analysis, and pathway analysis were used to study the relationship between soil, microorganisms, plant C, N, and P content, and the main quality components of tea. The purposes of this study were (1) to identify the dominant factors affecting the main quality components of tea; (2) to establish the optimal regression equations of soil-microorganism-plant C, N, and P with the main quality components of tea; (3) to explore the interactions between soil, microorganisms, and plant C, N, and P content and how soil, microorganisms and plant C, N and P content affect the main quality components of tea, including direct and indirect effects.
2.1 Overview of the Research Field
The study region was situated in Jiangxipo Town, Pu’an County, Guizhou Province, China (104°51′10″-105°09′24″E, 25°18′31″-26°10′35″N). The average altitude is 1400 m. The climate type belongs to subtropical monsoon humid climate. The average annual temperature is 14°C. The frost-free period is around 290 d. The average annual sunshine is 1563 h. The average annual rainfall is 1360 mm, and the rainfall is concentrated from June to August. The exposed strata are mainly Triassic carbonate rocks. The tea varieties are ‘Baiye 1’, ‘Huangjinya’, ‘Longjing 43’, and ‘Wuniuzao’, which were planted in 2015. Yellow soil is the type of soil. The soil pH is 5.05, the available N content is 136.75 mg·kg−1, the available P content is 9.45 mg·kg−1, and the available K content is 190.28 mg·kg−1.
Based on field investigation, different types of tea gardens (‘Baiye 1’, ‘Huangjinya’, ‘Longjing 43’, and ‘Wuniuzao’) with the same geographical location and consistent tea growth were selected as research plots. In each tea garden type, 9 quadrats measuring 1 m × 1 m were set up. In total, there were 36 quadrats. The area of each plot was about 50 m2. The planting method of tea plants was double plants and single row planting, which were 1 m between rows and 0.3 m between plants. The management of tea gardens in the study area was the same. The branches were pruned once a year in October which were returned to the soil. Organic fertilizer (mainly fermented chicken manure or pig manure) was applied in December each year by spreading at a rate of about 1.5 t·ha−1.
2.3 Sample Collection and Processing
In September 2022, samples of the soil and plants were gathered. Five tea plants were randomly selected and tagged within each experimental plot.
Soil sample collection: Five sampling points were selected from each plot using the S-shaped distribution approach, and a 10 cm diameter soil drill was used to collect surface soil (0−20 cm) within the canopy of the marked tea plants. Five points were mixed into one soil sample. Removed plant roots and small stones, and used the quartering method to take approximately 1.5 kg. The soil sample was then split into two parts. One sample was placed in a pre-sterilized self-sealing bag, which was set in an insulated box with ice packs and returned to the laboratory. After passing through a 2 mm sieve, it was stored in a refrigerator at 4°C to determine the soil microbial biomass. The other sample was air-dried indoors and put through 2 and 0.149 mm sieves for the determination of soil physicochemical properties.
Plant sample collection: Approximately 50 g of new shoots (one bud and two leaves), branches, and lateral roots of tea plants were collected from the four directions (east, south, west, and north) of the marked tea plants. These samples were then brought to the lab in plastic bags. After washing with distilled water, the samples were dried at 75°C–85°C. Then, the samples were sieved through a 1 mm sieve and used for C, N, and P determination.
2.4 Measurement Items and Methods
A combination pH electrode (soil: Water, 1:2.5 w/v) and alkaline hydrolysable technique were used to measure the pH and the amount of accessible nitrogen in the soil, respectively [15]. The content of P in soil was measured by Molybdenumly anticolorimetry [16]. Available P and available K were measured by hydrochloric acid and flame photometry, respectively [17]. The N content in plants and soil was determined by Kjeldahl distillation; SOC and plant C were measured by K2Cr2O7 oxidation, and plant P was measured by H2SO4-HClO4 digestion methods [18]. Microbial biomass C, N, and P were measured by chloroform fumigation extraction method [19,20]. Free amino acid, caffeine, and water extracts concentration was determined following the national standard GB/T 8314-2013, GB/T 8312-2013, and GB/T 8305-2013, respectively. The content of tea polyphenol and catechin was measured following the national standard GB/T 8313-2018.
The correlation coefficient consists of the direct path coefficients of each influencing factor and the indirect path coefficients through other influencing factors. The direct path coefficient is the standardized partial regression coefficient of the independent variable. The correlation coefficients of two independent variables and the direct path coefficient of the other independent variable with the dependent variable are multiplied to get the indirect path coefficient. The indirect path coefficient was calculated by Eq. (2). In this study, tea polyphenol, water extracts, amino acid, caffeine, and catechin of four tea plant varieties were used together as dependent variables, and soil organic carbon (x1), total soil nitrogen (x2), total soil phosphorus (x3), MBC (x4), MBN (x5), MBP (x6), root carbon (x7), root nitrogen (x8), root phosphorus (x9), branch carbon (x10), branch nitrogen (x11), branch phosphorus (x12), leaf carbon (x13), leaf nitrogen (x14), and leaf phosphorus (x15) of four tea garden soil were used together as independent variables to conduct path analysis. First, correlation analysis was used to determine the correlation coefficients between each influencing element and the main quality components of tea, as well as the correlation coefficients between each influencing factor. Pathway analysis was conducted based on the fact that there is a true linear relationship between all independent variables and dependent variables. Therefore, it is necessary to test whether there is a linear relationship between all independent variables and dependent variables before conducting path analysis. A stepwise regression analysis was then performed. In the pathway system, the influencing factors that did not have a significant effect on the main quality components of tea were eliminated, and the influencing factors that had a significant effect were retained from the analysis by the F-test. Then, by normalizing the regression coefficients of the dominant factors, the direct path coefficients were derived. The F-test was used to test the significance of the direct path coefficient. Lastly, by computing the indirect path coefficients, the relative effects of each factor on the main quality components of tea were determined. The results of the pathway analysis were tested by the decision coefficient (R2) and the residual factor (pey). The decision coefficient is also the decision coefficient of the regression equation. According to the relevant studies when the decision coefficient is greater than or equal to 0.85, the main independent variables affecting the target variables can be identified [21]. Meanwhile, the smaller the residual factor, the smaller the error; the larger the residual factor, the larger the error. The residual factor was calculated by Eq. (3).
Regression equation: If a linear equation has the correlation variables
The method of Huo et al. [21] was used to calculate the indirect path coefficient:
where
2.6 Data Processing and Analysis
Microsoft Excel 2021 was used for data collection. SPSS 27.0 was used for correlation, regression, and path analysis. Origin 2021 was used for drawing.
3.1 Correlation Analysis of Soil-Microorganism-Plant C, N, and P Contents with Main Quality Components of Tea
To thoroughly evaluate the impacts of various influences on the main quality components of tea, the correlation between the influence indexes and the main quality components of tea was analyzed by Pearson correlation analysis. Before performing the correlation analysis, a K-S test was performed on each group of data. The K-S test is a method of assessing whether the probability density distribution of each set of data is normal. The findings demonstrated that each group’s data followed a normal distribution and met the requirements for correlation analysis. As shown in Fig. 1, tea polyphenol content was significantly and positively associated with Soil C content (p < 0.05), highly significantly and positively correlated to Root N and Root P content (p < 0.01), significantly and negatively related to Soil P, Branch C, Branch P, and Leaf C content, highly significantly and negatively correlated to microbial biomass nitrogen (MBN) and MBP content. Amino acid content was highly significantly and positively correlated to Soil P, MBP, and Branch C content, significantly and positively associated with MBN, Branch N, and Leaf C content, and highly significantly and negatively correlated to Soil C and MBC content. Catechin content was highly significantly and positively correlated to Soil C, MBC, and Leaf P content, highly significantly and negatively correlated to Soil P, MBN, MBP, Branch C, and Leaf C content, and significantly and negatively correlated to Branch N and Branch P content. Caffeine content was highly significantly and positively associated with Soil P, MBP, Branch C, and Leaf C content, highly significantly and negatively associated with Soil C and MBC, and significantly and negatively correlated to Root P. Tea water extracts content was significantly and positively associated to Soil C, MBP and Branch P content, highly significantly and positively correlated to Soil N, MBN, Root C, Root P, Branch C, Branch N and Leaf C content, and highly significantly and negatively associated to Leaf N and Leaf P content.
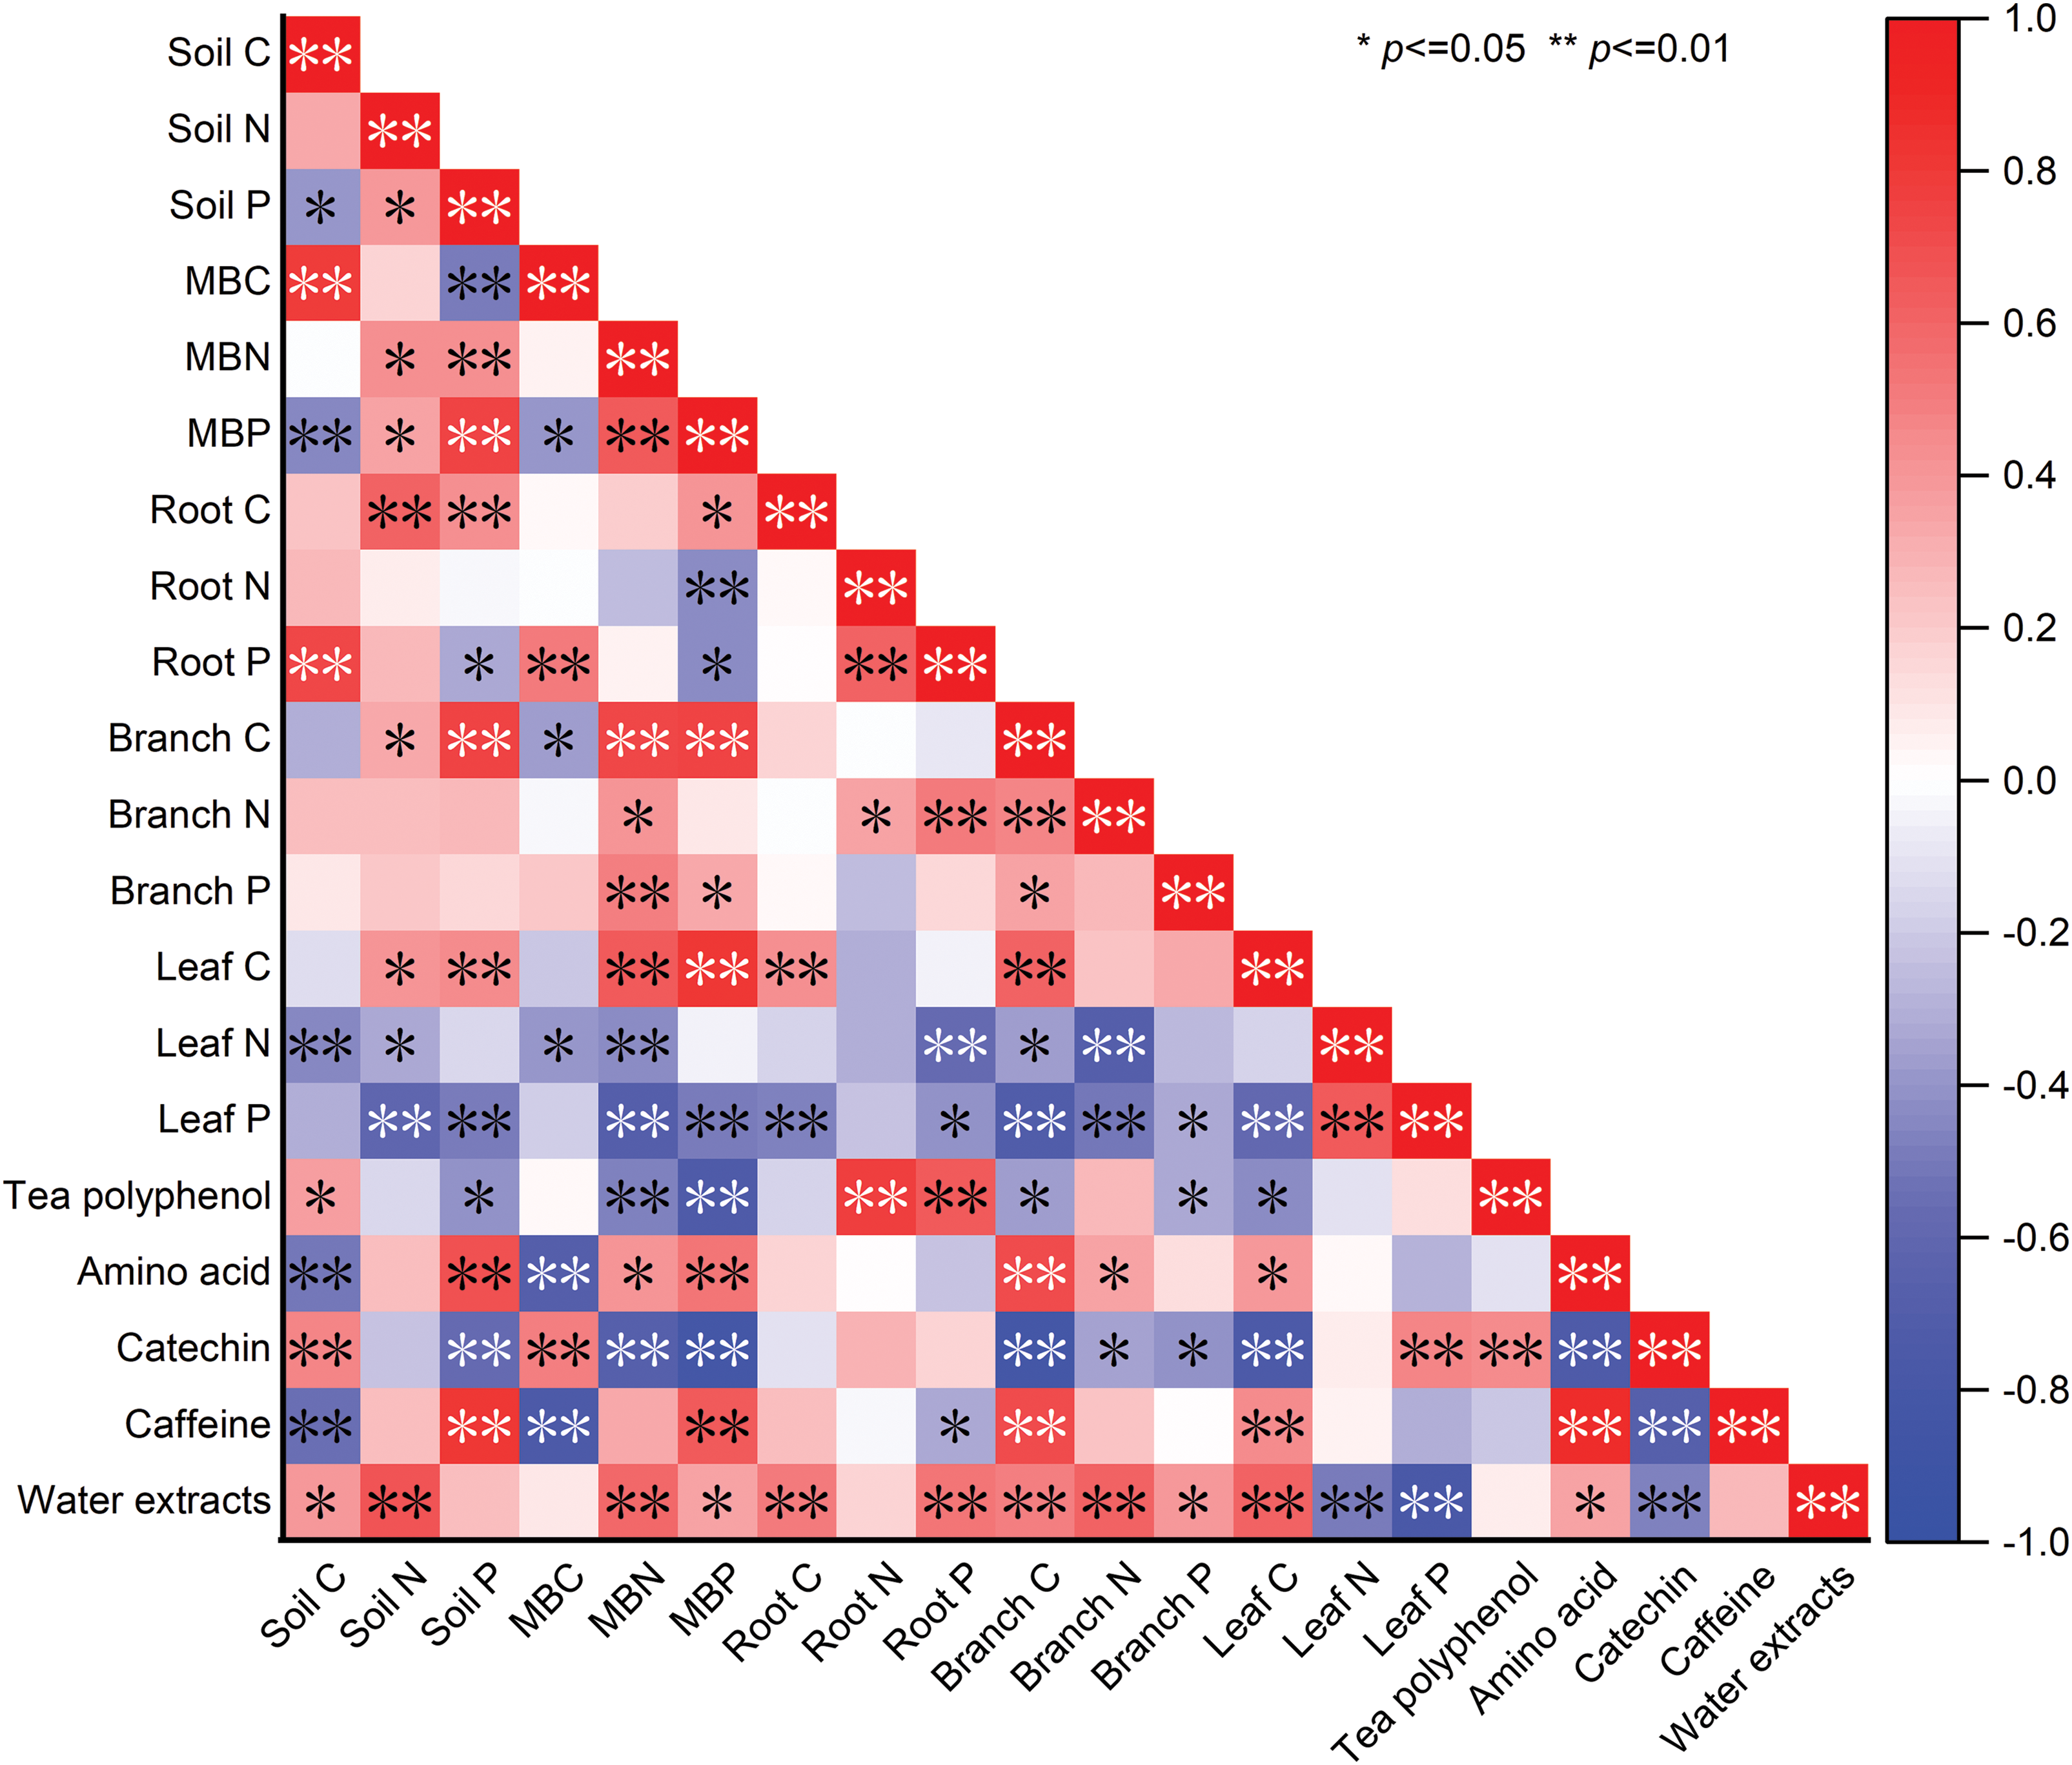
Figure 1: Correlation analysis of soil-microorganism-plant C, N, and P content with main quality components of tea. Soil C, soil organic carbon; Soil N, total soil nitrogen; Soil P, total soil phosphorus; MBC, microbial biomass carbon; MBN, microbial biomass nitrogen; MBP, microbial biomass phosphorus; Root C, root carbon; Root N, root nitrogen; Root P, root phosphorus; Branch C, branch carbon; Branch N, branch nitrogen; Branch P, branch phosphorus; Leaf C, leaf carbon; Leaf N, leaf nitrogen; Leaf P, leaf phosphorus. The red and blue colors represent positive and negative correlations, respectively. Shades of color represent the magnitude of the correlation
3.2 Establishment of Optimal Multiple Regression Equations
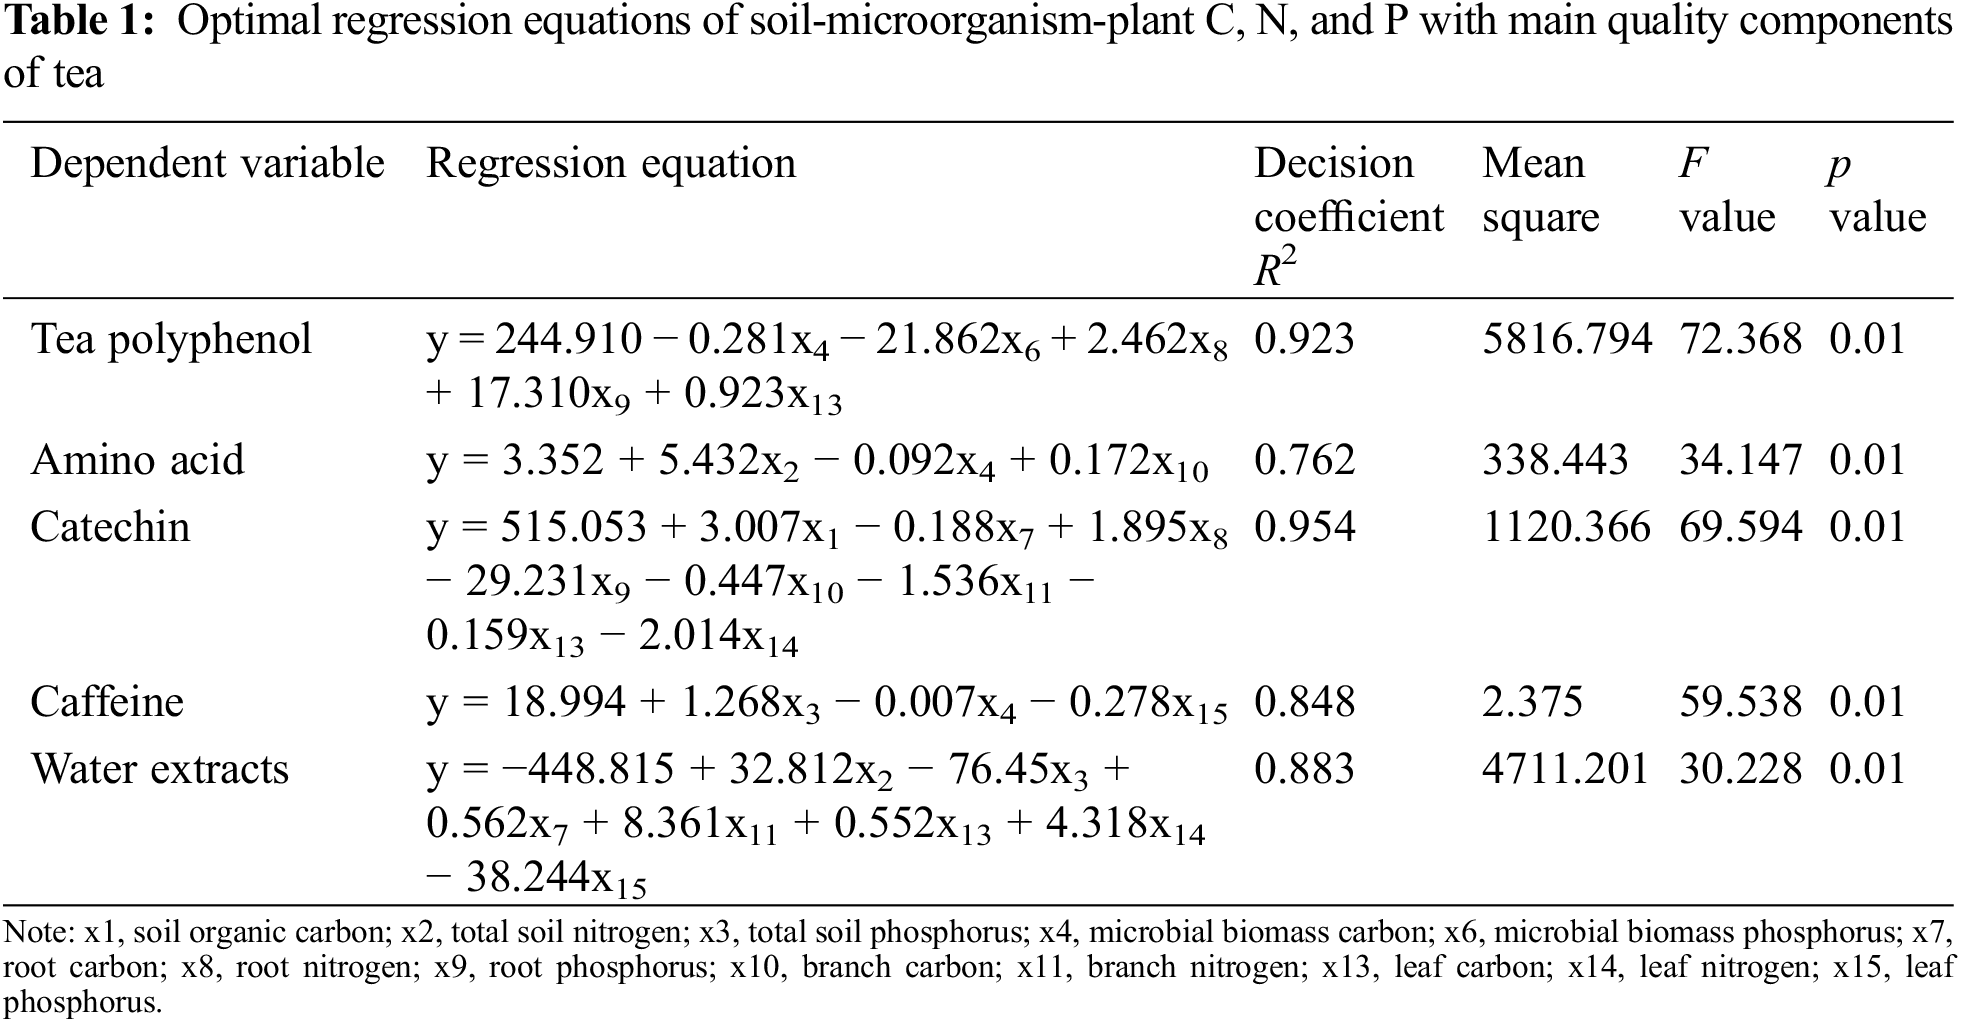
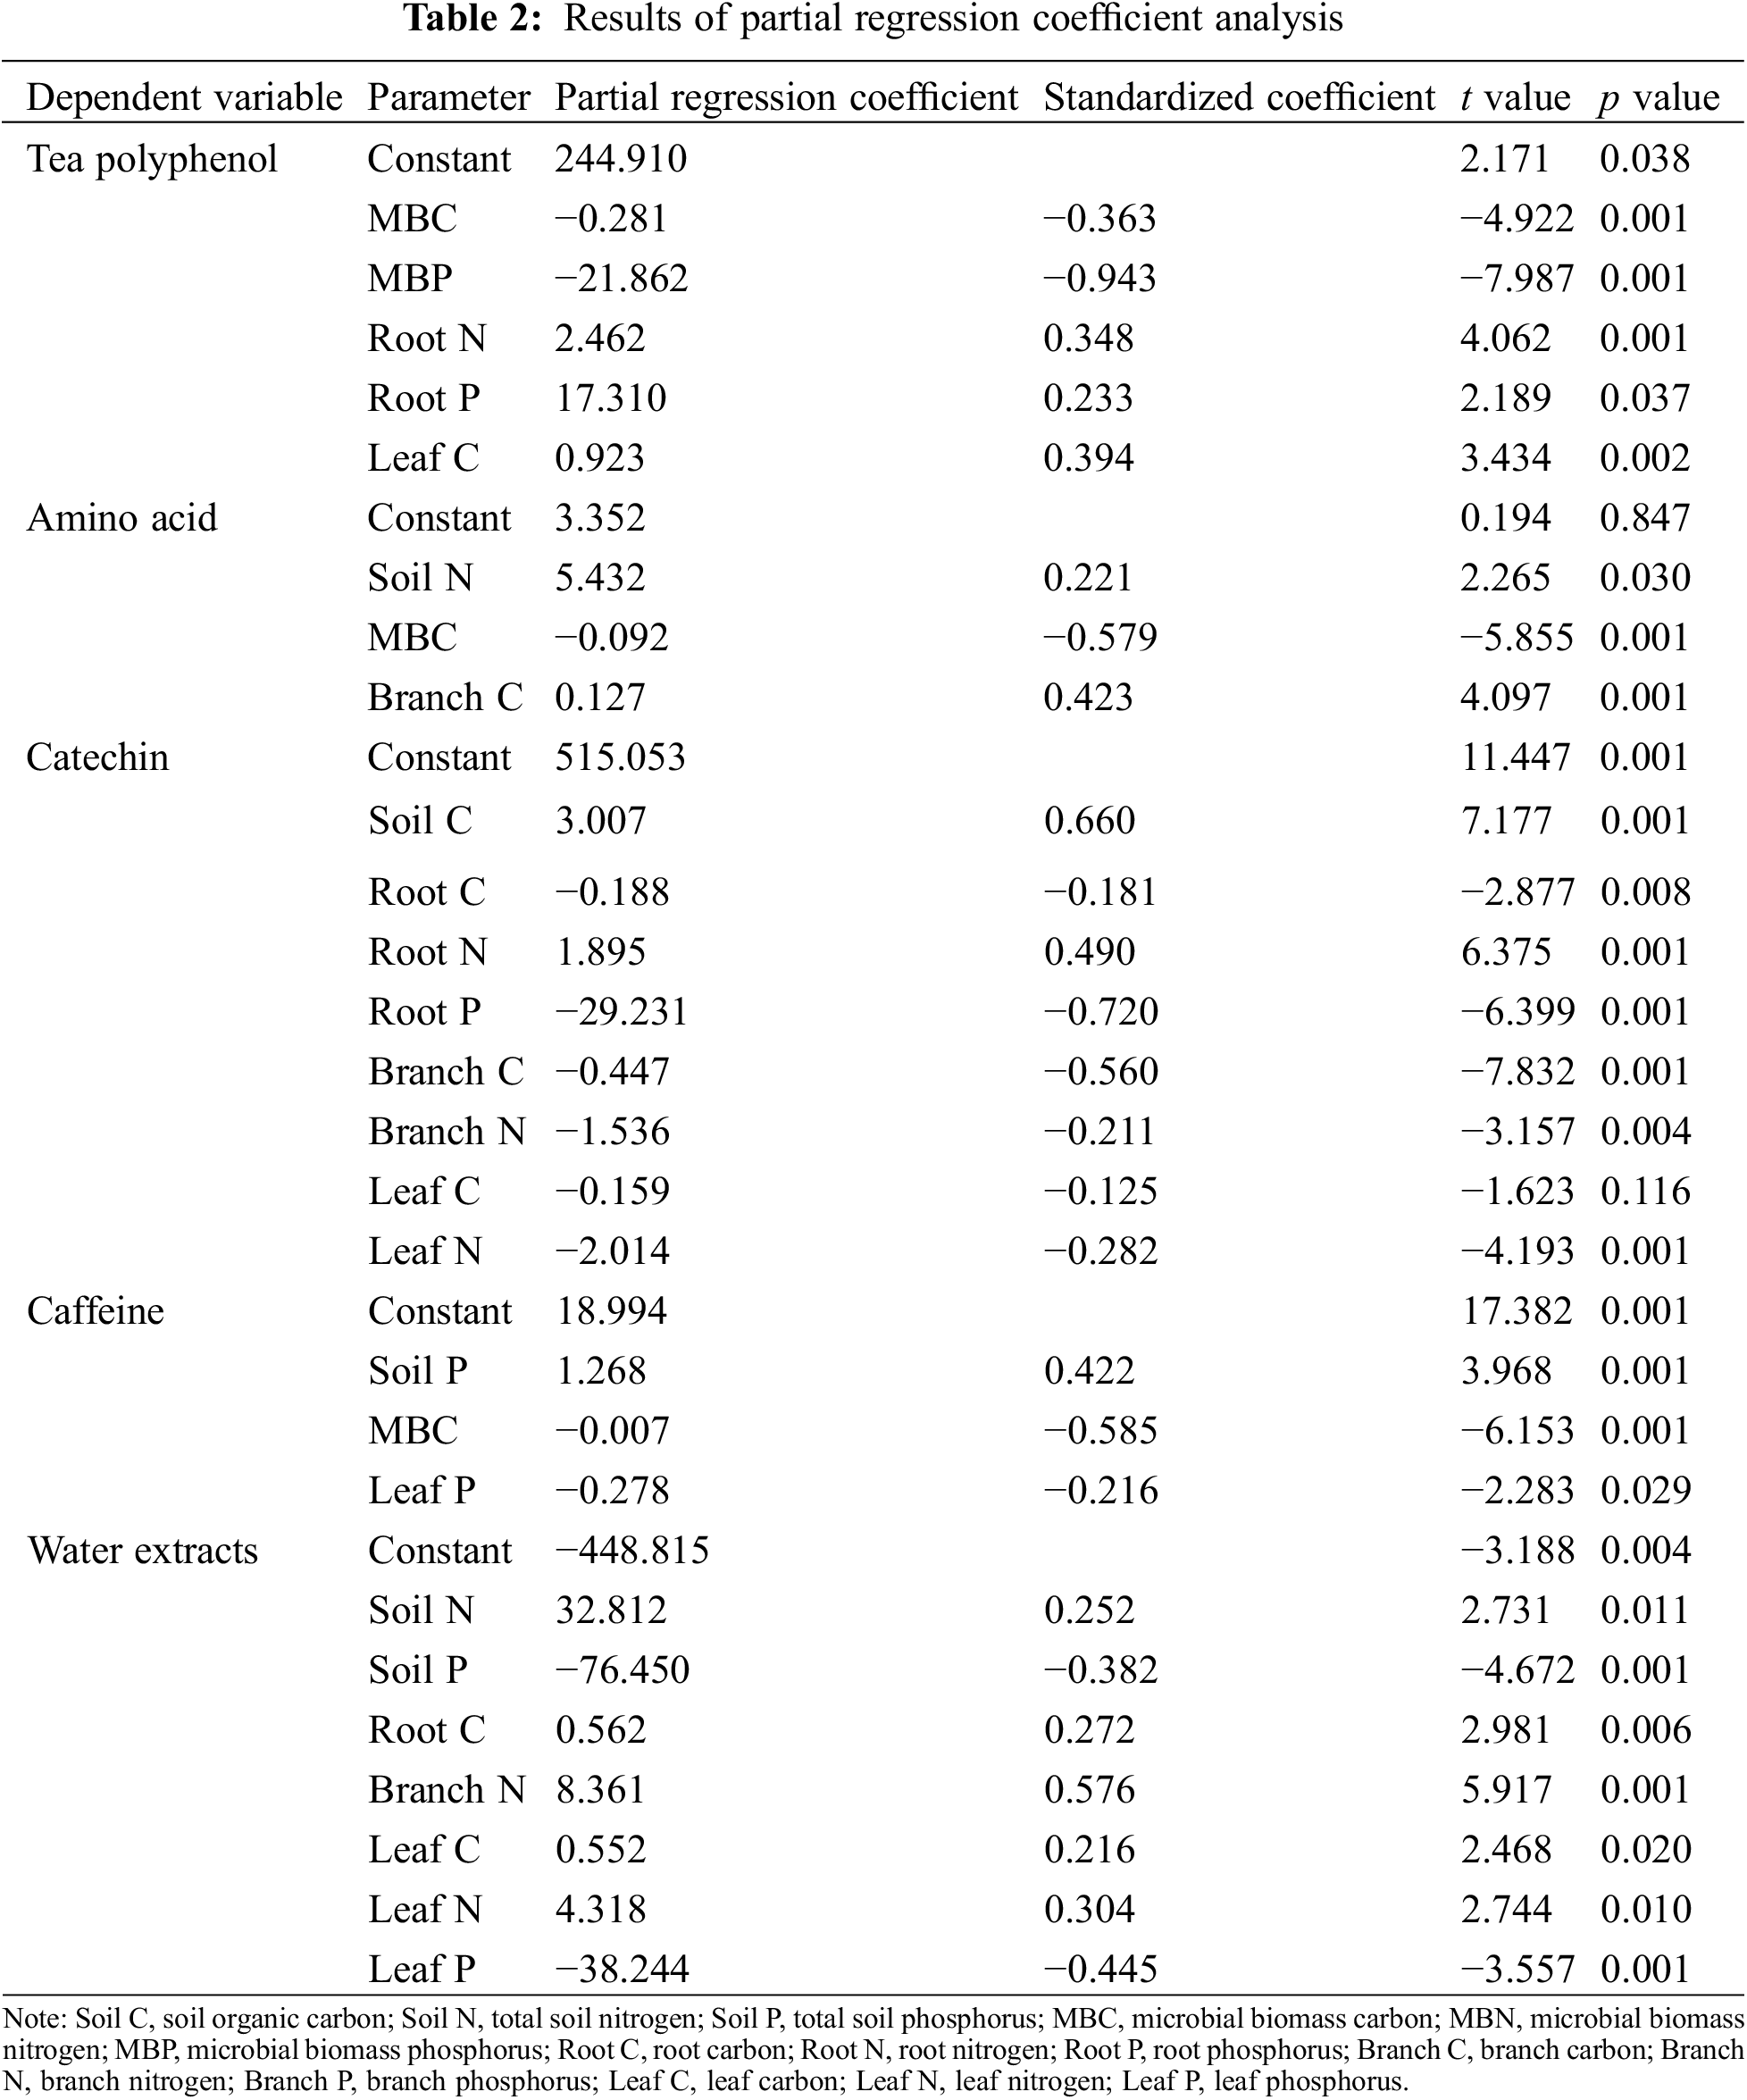
Tea polyphenol, catechin, free amino acid, water extracts, and caffeine of all four tea plant varieties were used together as dependent variables, Soil C (x1), Soil N (x2), Soil P (x3), MBC (x4), MBN (x5), MBP (x6), Root C (x7), Root N (x8), Root P (x9), Branch C (x10), Branch N (x11), Branch P (x12), Leaf C (x13), Leaf N (x14), Leaf P (x15) were used as independent variables for stepwise regression analyses to establish the optimal multiple regression equations of soil-microorganism-plant C, N, and P with the main quality components of tea. According to Table 1, the decision coefficient of the optimal regression equations for tea polyphenols, amino acids, catechins, caffeine, and water extracts were 0.923, 0.762, 0.954, 0.848, and 0.883, respectively. The R2 and the p value (P) of the equations indicated that these equations can effectively estimate the relationship between various factors and the main quality components of tea. According to Table 2, the partial regression analysis showed that the optimal regression coefficients of the independent variables that entered the regression equation reached the level of significance. This indicated that the regression equations fitted by these factors with the main quality components of tea were statistically significant and could be used to guide actual production. The F values and p values of the linear relationship between the factors and the main quality components of tea reached highly significant levels (Table 1), indicating that these factors had highly significant linear relationships with the main quality components of tea and were suitable for path analysis.
3.3 Pathway Analysis of Soil-Microorganism-Plant C, N, and P Content with Main Quality Components of Tea
To further determine the direct and indirect impacts of different influencing factors on tea polyphenol, amino acid, catechin, caffeine, and water extracts, pathway analysis was conducted based on regression analysis. The pathway analyses explained the effects of the effectors on the target variables more accurately.
As shown in Fig. 2, the direct effects on tea polyphenol were MBP (−0.943) > Leaf C (0.394) > MBC (−0.363) > Root N (0.348) > Root P (0.233). The indirect effects were Leaf C (−0.818) > Root N (0.428) > Root P (0.408) > MBC (0.399). MBC, Root N, Root P, and Leaf C played indirect roles in tea polyphenol content mainly through MBP.
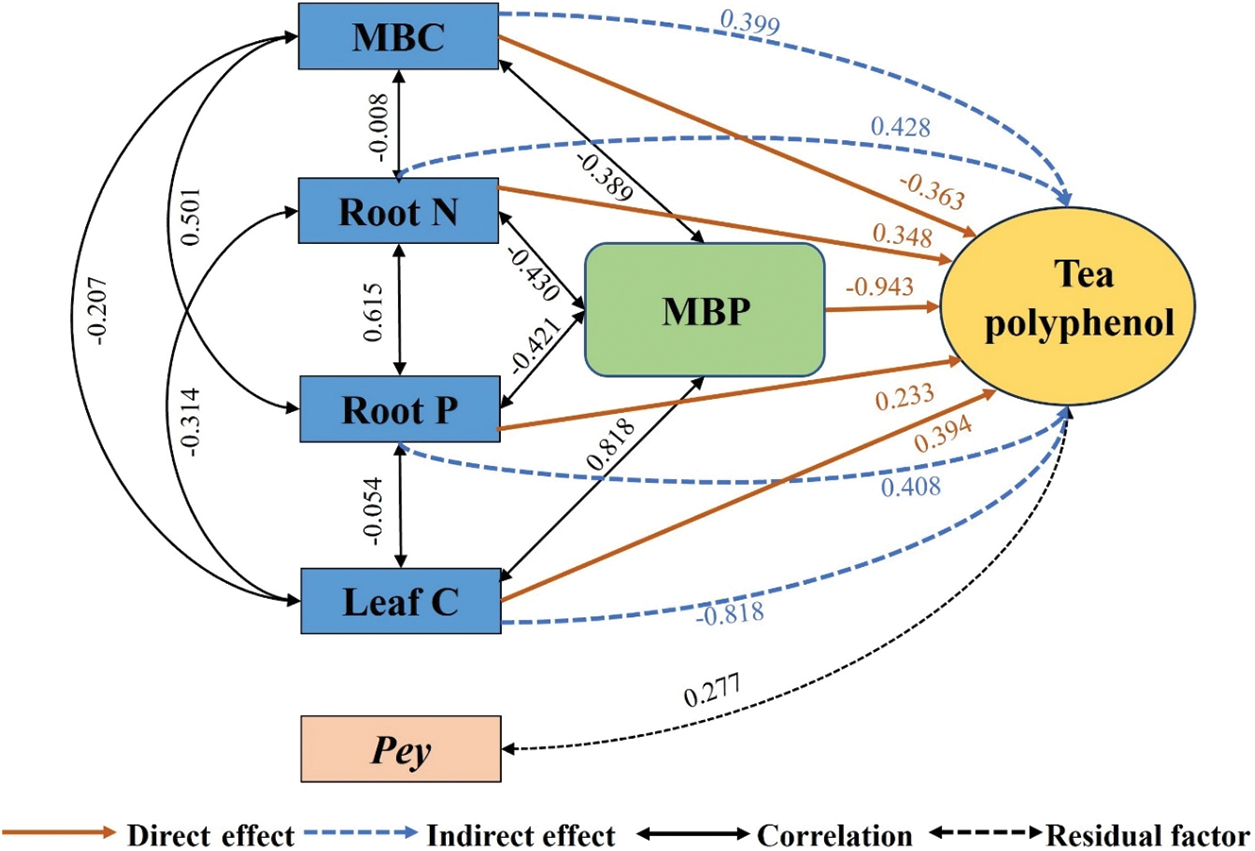
Figure 2: Pathway analysis of soil-microorganism-plant C, N, and P content with tea polyphenol content. MBC, microbial biomass carbon; MBP, microbial biomass phosphorus; Root N, root nitrogen; Root P, root phosphorus; Leaf C, leaf carbon; Pey, residual factors
As shown in Fig. 3, the direct effects on amino acids were MBC (−0.579) > Branch C (0.423) > Soil N (0.221). The direct effects of MBC, Branch C, and Soil N on amino acids were all greater than the indirect effects.
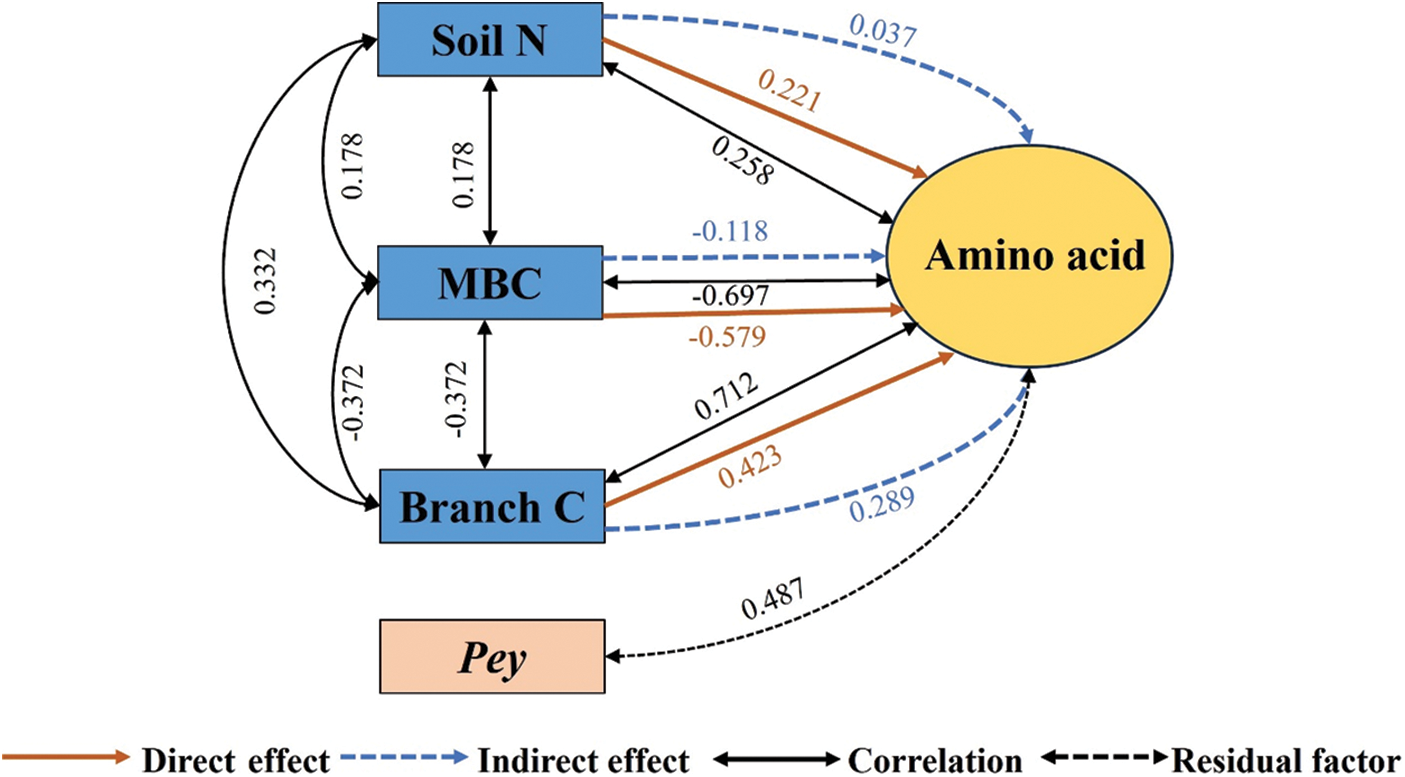
Figure 3: Pathway analysis of soil-microorganism-plant C, N, and P content with amino acid content. Soil N, total soil nitrogen; MBC, microbial biomass carbon; Branch C, branch carbon; Pey, residual factors
As shown in Fig. 4, the direct effects on catechins were Root P (−0.720) > Soil C (0.660) > Branch C (−0.560) > Root N (0.490). The indirect effects were Root P (0.891) > Leaf C (−0.615) > Leaf N (0.356). Root P played an indirect role in catechin content mainly through Soil C. Leaf C played an indirect role in catechin content mainly through Branch C. Leaf N played an indirect role in catechin content mainly through Root P.
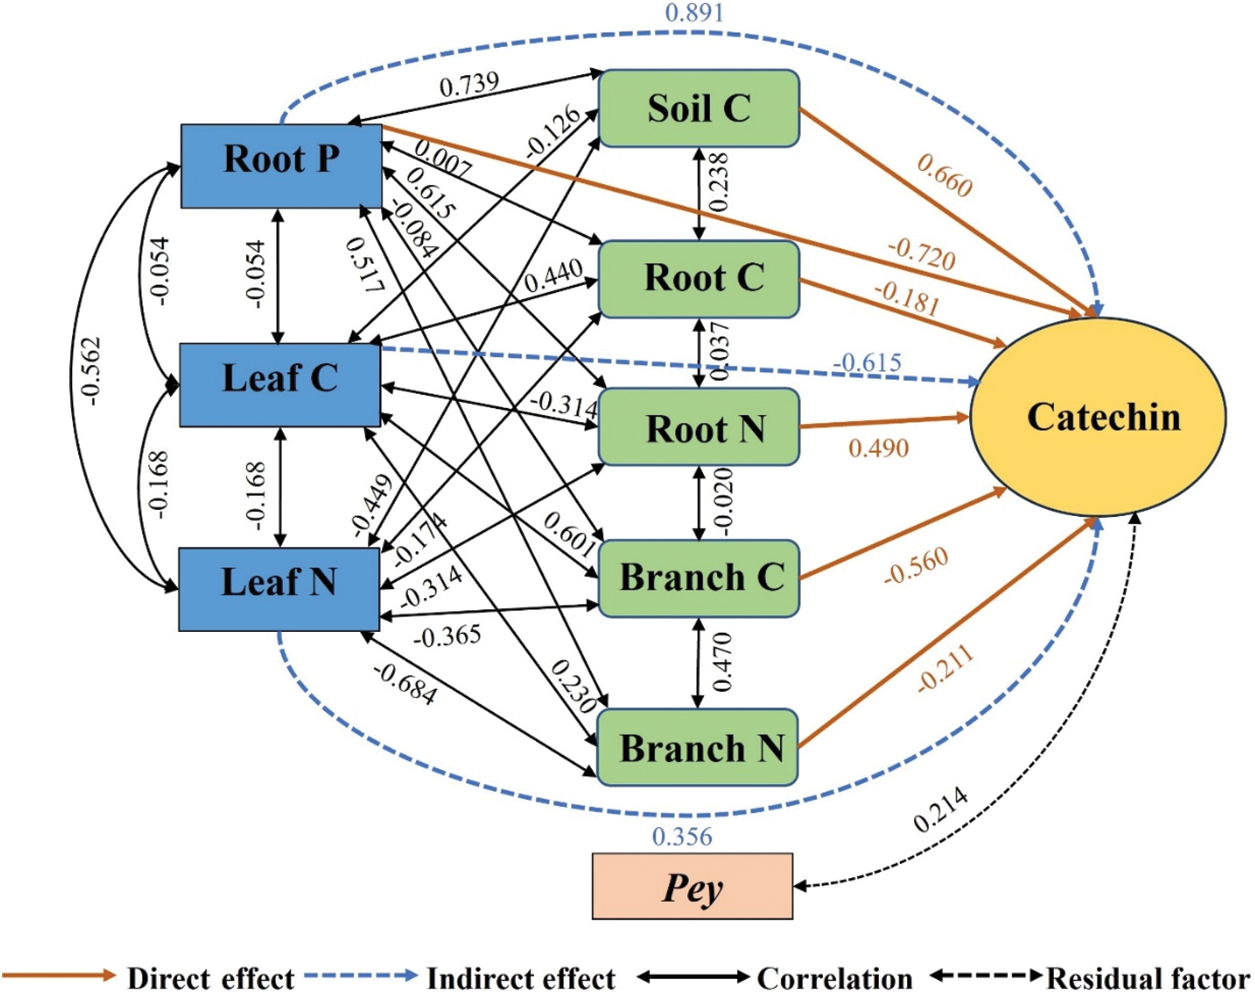
Figure 4: Pathway analysis of soil-microorganism-plant C, N, and P content with catechin content. Soil C, soil organic carbon; Root C, root carbon; Root N, root nitrogen; Root P, root phosphorus; Branch C, branch carbon; Branch N, branch nitrogen; Leaf C, leaf carbon; Leaf N, leaf nitrogen; Pey, residual factors
As shown in Fig. 5, the direct effects on caffeine were MBC (−0.585) > Soil P (0.422) > Leaf P (−0.216). The direct effects of MBC, Soil P, and Leaf P on caffeine were all greater than the indirect effects.
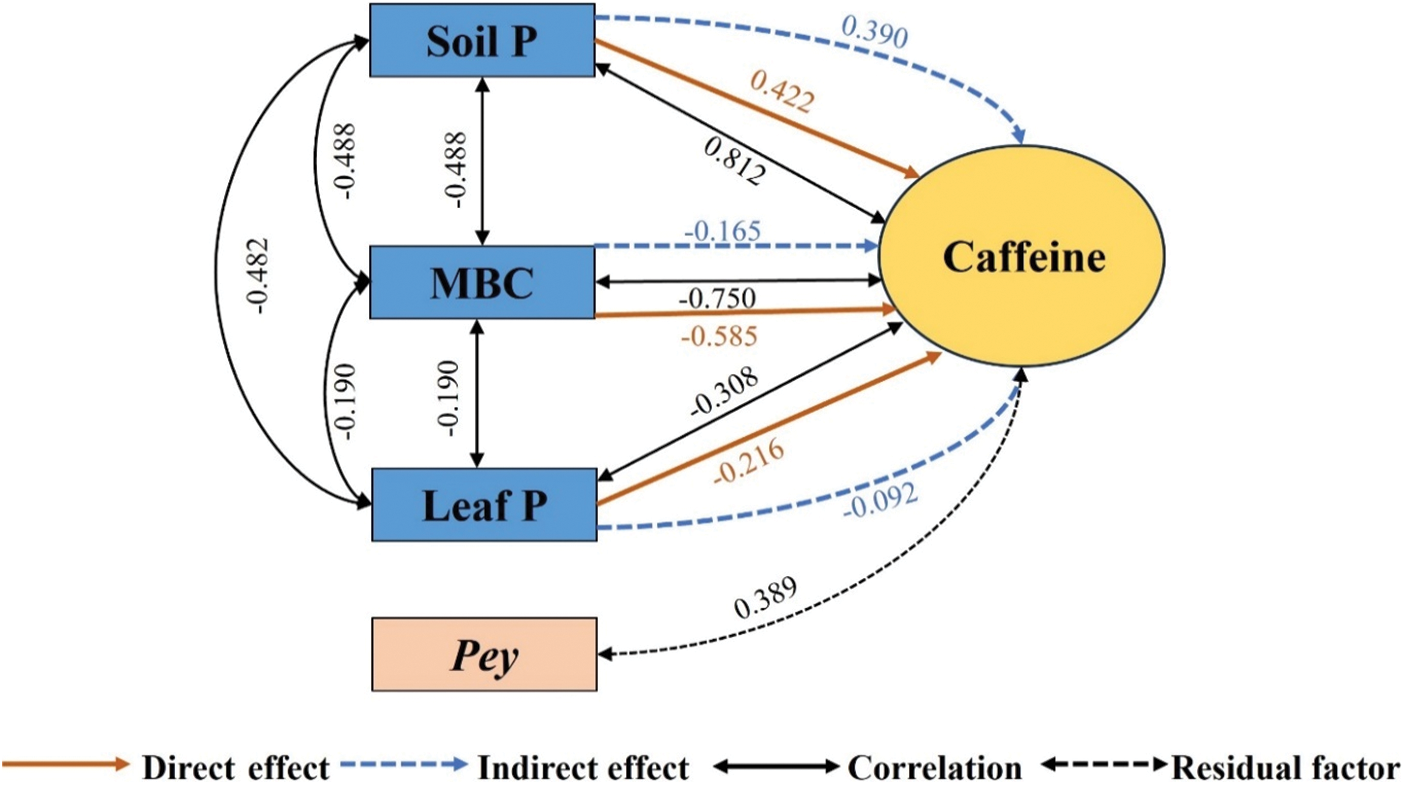
Figure 5: Pathway analysis of soil-microorganism-plant C, N, and P content with caffeine content. Soil P, total soil phosphorus; MBC, microbial biomass carbon; Leaf P, leaf phosphorus; Pey, residual factors
As shown in Fig. 6, the direct effects on water extracts were Branch N (0.576) > Leaf P (−0.445) > Root C (0.272). The indirect effects were Leaf N (−0.794) > Soil P (0.641) > Soil N (0.419) > Leaf C (0.391). Soil N, Soil P, and Leaf C played indirect roles in water extract content mainly through Leaf P. Leaf N played an indirect role in water extract content mainly through Branch N.
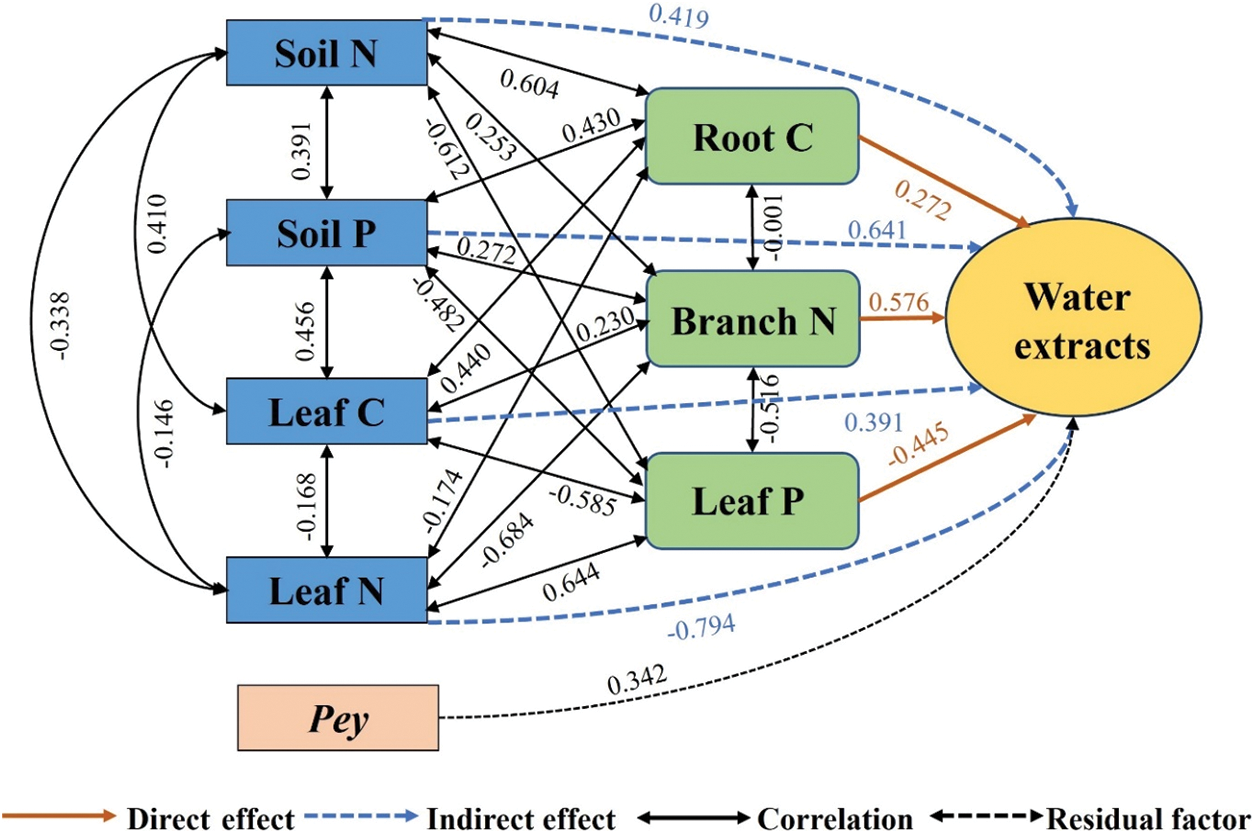
Figure 6: Pathway analysis of soil-microorganism-plant C, N, and P content with water extracts content. Soil N, total soil nitrogen; Soil P, total soil phosphorus; Root C, root carbon; Branch N, branch nitrogen; Leaf C, leaf carbon; Leaf N, leaf nitrogen; Leaf P, leaf phosphorus; Pey, residual factors
4.1 Relationship between Soil-Microorganism-Plant C, N, and P Content with Main Quality Components of Tea
Amino acids, polyphenols, catechins, water extracts, and caffeine are not only the prime biochemical components of tea but also essential indicators of evaluating tea quality [22]. The soil provides the tea plants with their material foundation for survival. The supply of nutrients in the soil, especially C, N, and P, directly affects the uptake and utilization of nutrients by the tea plants, which in turn affects the formation of the main quality components of tea [3,23,24]. Microorganisms are important and active components of the soil ecosystem, closely linked to soil nutrient cycling and directly affecting the output and quality of tea [25,26]. Roots and leaves are the primary organs of the tea plant for nutrient uptake, and their C, N, and P levels are likewise closely associated with the tea quality [3]. Therefore, the use of correlation analysis to clarify the associations between soil, microorganisms, and plant C, N, and P contents and the main quality components of tea is important for understanding the relationship between nutrient cycling in tea plants and the development of tea quality. The study results indicated that the contents of amino acids, tea polyphenols, catechins, water extracts, and caffeine were closely correlated to the C, N, and P contents in soil, microorganisms, and tea plants. Tea polyphenols are the core components that affect the tea quality. High amino acid content and moderate polyphenol levels are characteristics of premium green tea [27]. In this study, the Soil P, MBN, MBP, Branch C, Branch P, Leaf C, and tea polyphenol content were significantly and negatively linked, suggesting that increasing the contents of these factors can reduce tea polyphenol content. Amino acids are involved in creating the fresh flavor of tea. The quality of the tea improves with increasing amino acid concentration. The study found a substantial and positive correlation between Branch N and amino acid concentration, suggesting that increasing the N content of tea trees is conducive to improving tea quality. As the major polyphenolic compounds, catechins showed significant negative correlations with Soil P, MBN, MBP, Branch C, N, P, and Leaf C, suggesting that increasing soil microbial biomass and plant C, N and P content could reduce catechin content. Caffeine imparts a bitter taste to tea infusion. The lower the caffeine content, the better the quality of the finished tea. In this study, caffeine content was significantly negatively rated with Soil C and MBC, suggesting that increasing SOC and MBC content is beneficial to improving the tea quality. Water extract content is directly proportional to the tea quality [28]. Water extract content in this study was significantly and positively associated with Soil C, Soil N, MBN, MBP, Root C, Root P, Branch C, N, P, and Leaf C, suggesting that increasing the content of these factors can improve tea quality. This shows the amount of C, N, and P in the soil affects not only the nutrients available to the tea plant but also the production of polyphenols, amino acids, caffeine, and many other components that affect the yield and quality of tea. Therefore, one of the most crucial assurances for high quality and high output of tea is ensuring the balance and coordination of C, N, and P concentrations in the soil-microorganism-plant system.
Stepwise regression analyses were performed based on correlation analyses to further determine the relationship between soil, microorganisms, and plant C, N, and P content and the main quality components of tea. Optimal regression equations between soil, microorganisms, and plant C, N, and P and the main quality components of tea were established. These optimal regression equations quantified the combined association of the different influencing factors with the main quality components of tea. The decision coefficients of the optimal regression equations for tea polyphenols, catechins, and water extracts were 0.923, 0.954, and 0.883, respectively. The residual factor (Pey) of tea polyphenols, catechins, and water extracts were 0.277, 0.214, and 0.342, respectively. The residual factors were small. This indicated that these equations identified the main factors affecting the tea polyphenols, catechins, and water extract contents. The decision coefficients of the optimal regression equations for amino acids and caffeine were 0.762 and 0.848, respectively. The residual factor of amino acids and caffeine was 0.487 and 0.389. The residual factors were large. This suggested that amino acids and caffeine are less correlated with soil, microbial, and plant carbon, nitrogen, and phosphorus content. Other factors have a greater influence on amino acids and caffeine that have not been taken into account. Ma et al. [29] also found that caffeine content was less correlated with soil variables. Huan et al. [30] pointed out that the effect of nitrogen fertilizer application on amino acids and tea polyphenols in tea was more pronounced. The content of the main quality components of tea plants is also closely related to the effectiveness of soil nutrients. Ye et al. [31] found that the morphological distribution of phosphorus in soil significantly affected the content of the main quality components of tea. In addition, soil moisture, soil pH, microclimate of tea gardens, and soil heavy metals were also crucial factors affecting the main quality components of tea leaves [5,24,32]. The relationships between these factors and the main quality components of tea need to be further investigated.
4.2 Effects of Soil-Microorganism-Plant C, N, and P Content on Main Quality Components of Tea
To quantify the direct and indirect effects of soil, microorganisms, and plant C, N, and P content on the main quality components of tea, path analysis based on regression analysis was carried out. Pathway analysis is generally used to analyze the linear relationship between multiple effectors and the target variable. The magnitude of the absolute values of the direct and indirect pathway coefficients is usually used to determine the specific impact of the independent variable on the dependent variable [11].
Tea polyphenol is the main contributor to the tea’s astringency. In this study, MBP had the greatest direct effect on tea polyphenols, and Leaf C had the greatest indirect effect on tea polyphenols through MBP. Increasing the contents of MBP and Leaf C could reduce the tea polyphenol content in tea to reduce the bitterness and astringency and improve tea quality. C in tea leaves is predominantly derived from the soil. Therefore, improving the organic C content and microbial biomass in soil can enhance the uptake and utilization of nutrients by the plant. With this method, the tea quality can be improved.
Soil N, MBC, and Branch C were the main factors influencing amino acid content, and the effects on amino acids were mainly direct effects. Amino acids are N metabolism products of the tea plant. Increasing N in the soil is conducive to enhancing photosynthesis, producing more carbon-containing compounds to synthesize proteins, and promoting amino acid accumulation in tea plants [33]. The impact of MBC on amino acids was mainly negative, while the impact of Branch C on amino acids was positive. The reason may be related to the balance of C and N metabolism in tea plants. C and N metabolism in tea plants are coordinated and constrained. When N metabolism increases, C metabolism decreases [34]. At the same time, N metabolism requires C metabolism to provide energy and C sources [10]. It can be seen that C and N coordinate with each other to influence the synthesis of amino acids.
Both the direct and indirect effects of Root P on catechins were greatest. The direct effect showed a negative effect and the indirect effect showed a positive effect. However, the overall effect was positive, indicating that increased Root P content was favorable to increased catechin content. P is an essential element for photosynthesis and respiration in the tea plants. P also has an impact on the tea plants’ metabolites and mineral catabolism [35]. Increased P content in soil can influence catechin synthesis by promoting the metabolism of malic acid in the tricarboxylic acid cycle and inducing a bias of photosynthates and carbohydrates towards the catechin metabolic pathway [36]. The direct effect of soil C on catechins was also greater and showed a positive effect. Catechin is the unique secondary metabolite of tea plants. Catechin biosynthesis is part of C metabolism in tea plants [37]. Increased soil carbon can enhance carbon metabolism in tea plants, resulting in increased accumulation of catechins [38].
Caffeine is the main contributor to the bitter taste of tea infusion [39]. Soil P, MBC, and Leaf P were the main factors influencing caffeine content, and the effects on caffeine were mainly direct effects. The effect of Soil P on caffeine was positive, indicating that the increase of Soil P content is conducive to the increase of caffeine content. Yu et al. [40] and Yang et al. [41] also found that the accumulation of caffeine in new shoots increased significantly with increased P content in soil. Caffeine is mainly derived from the photosynthesis of tea plants. Tea photosynthesis is highly dependent on P. P promotes the synthesis of caffeine by affecting the metabolism of pyruvic acid [36]. The direct effect of MBC on caffeine was largest and negative, indicating that the increase of MBC content could inhibit caffeine synthesis. MBC is a source of essential plant nutrients that can be directly absorbed and used by plants. It is an active C component of the soil [42]. The application of organic fertilizer is a practical way to boost soil microbial biomass. As a result, it is possible to minimize the amount of caffeine in tea and enhance the tea quality by enhancing the application of organic fertilizer.
The direct effect of Branch N on water extracts was the largest. Leaf N indirectly affected water extract content mainly by altering Branch N content. As a leafy cash crop, the tea plant has the highest demand for the mineral element nitrogen. Nitrogen is indispensable for the growth, development, and physiological metabolism of tea plants [43]. Water extracts primarily consist of soluble carbohydrates, caffeine, soluble proteins, amino acids, tea polyphenols, and other water-soluble ingredients. It was discovered that the water extract content and the tea polyphenol concentration had a strong negative correlation, while the total phenolic content decreased significantly with the increase of N utilization [44,45]. Thus, Leaf N may indirectly affect water extract content by influencing polyphenol synthesis. In summary, the C, N, and P content of soil, microorganisms, and plants can directly or indirectly affect the amount of main quality components of tea. Therefore, maintaining appropriate Soil C, N, and P content to meet the nutrient requirements of tea plants is important for the formation of tea quality.
The direct effect of MBP on tea polyphenols was the greatest, and the indirect impact of Leaf C on tea polyphenols via MBP was the greatest. The direct effect of Root P on catechins was the greatest, and the indirect effect of Root P on catechins via Soil C was the greatest. The direct effect of Branch N on water extracts was the greatest, and the indirect impact of Leaf N on water extracts via Branch N was the greatest. The direct effects of MBC on caffeine and amino acids were the greatest.
Increasing the content of Soil N, MBC, MBP, Branch C, and Branch N can reduce the content of polyphenols and caffeine and increase amino acids and water extracts content. This could reduce the bitterness and astringency and increase the freshness and crispness of the tea infusion. Therefore, in the process of tea cultivation, it is recommended to increase the application of organic fertilizer and N fertilizer, control the amount of P fertilizer, and coordinate the proportion of fertilizer applied to various nutrients to improve the tea quality and achieve high-quality and high-efficient production of tea.
Acknowledgement: We gratefully acknowledge the staff of the Ecological Tea Garden in Jiangxi Po Town, Pu’an County, Guizhou Province for their support and assistance in sampling.
Funding Statement: This work was supported by Guizhou Provincial Basic Research Program (Natural Science), Grant Number Qiankehejichu-ZK [2021] YB133; Guizhou Provincial Scientific and Technological Program, Grant Number Qiankehehoubuzhu [2020] 3001; and National Natural Science Foundation of China-Guizhou Provincial People’s Government Karst Science Research Centre (U1612442).
Author Contributions: The authors confirm contribution to the paper as follows: study conception and design: Chun Mao, Ji He; data collection: Jihong Feng, Yangzhou Xiang; analysis and interpretation of results: Chun Mao, Ji He, Xuefeng Wen, Yangzhou Xiang; draft manuscript preparation: Chun Mao, Jihong Feng, Yingge Shu. All authors reviewed the results and approved the final version of the manuscript.
Availability of Data and Materials: The datasets generated during and/or analyzed during the current study are available from the corresponding author upon reasonable request.
Ethics Approval: None.
Conflicts of Interest: The authors declare that they have no conflicts of interest to report regarding the present study.
References
1. Xia EH, Tong W, Wu Q, Wei S, Zhao J, Zhang ZZ, et al. Tea plant genomics: achievements, challenges and perspectives. Hortic Res. 2020;7:7. [Google Scholar] [PubMed]
2. Li CF, Zhu Y, Yu Y, Zhao QY, Wang SJ, Wang XC, et al. Global transcriptome and gene regulation network for secondary metabolite biosynthesis of tea plant (Camellia sinensis). BMC Genom. 2015;16(1):560. [Google Scholar]
3. Tang S, Pan WK, Tang R, Ma QX, Zhou JJ, Zheng N, et al. Effects of balanced and unbalanced fertilisation on tea quality, yield, and soil bacterial community. Appl Soil Ecol. 2022;175:104442. [Google Scholar]
4. Sun, L. L., Liu, Y., Wu, L. Q., Liao, H. Comprehensive analysis revealed the close relationship between N/P/K status and secondary metabolites in tea leaves. ACS Omega. 2019;4(1):176–84. [Google Scholar]
5. Wen B, Zhang XL, Ren S, Duan Y, Zhang YY, Zhu XJ, et al. Characteristics of soil nutrients, heavy metals and tea quality in different intercropping patterns. Agrofor Syst. 2020;94(3):963–74. [Google Scholar]
6. He J, Lu Q, Wu CM, Liu HY. Response of soil and plant nutrients to planting years in precious ancient Camellia tetracocca plantations. Agron. 2023;13(3):914. [Google Scholar]
7. See CR, Yanai RD, Fisk MC, Vadeboncoeur MA, Quintero BA, Fahey TJ. Soil nitrogen affects phosphorus recycling: Foliar resorption and plant-soil feedbacks in a northern hardwood forest. Ecol. 2015;96(9):2488–98. [Google Scholar]
8. Chen LD, Zhou W, Zhang SR, Deng LJ, Deng OP, Luo L, et al. Improvement of tea yield and quality by chicken manure and wine lees (CMWL) substitution for chemical fertilizers in the hilly region of western sichuan. China J Soil Plant Nut. 2022;22(4):4415–26. [Google Scholar]
9. Ma LF, Zhu Y, Geng SP, Ruan JY. Response of nutritional status and tea quality to the rate and substitution of chemical fertilizers with organic manure. Horticult. 2022;8(12):1198. [Google Scholar]
10. Wang Y, Wang YM, Lu YT, Qiu QL, Fan DM, Wang XC, et al. Influence of different nitrogen sources on carbon and nitrogen metabolism and gene expression in tea plants (Camellia sinensis L.). Plant Physiol Biochem. 2021;167:561–6. [Google Scholar] [PubMed]
11. Qamaruz-Zaman N, Abdul-Sukor NS, Ab-Rahman SA, Yaacof N. The influence of moisture content on the production of odor from food waste using path analysis. Environ Sci Pollut Res Int. 2019;26(13):13658–63. [Google Scholar] [PubMed]
12. Hui L, Xing ZZ, Yao LU, Zhong MH, De PZ, Xi WY. Effects of shell morphological traits on the weight traits of orange strain of Manila clam Ruditapes philippinarum. J Dalian Ocean Univ. 2015;30(5):514–8 (In Chinese). [Google Scholar]
13. Jimenez JLG, Healy MG, Daly K. Effects of fertiliser on phosphorus pools in soils with contrasting organic matter content: a fractionation and path analysis study. Geoderma. 2019;338(1–3):128–35. [Google Scholar]
14. Zi RY, Zhao LS, Fang Q, Qian XH, Fang FY, Fan CH. Path analysis of the effects of hydraulic conditions, soil properties and plant roots on the soil detachment capacity of karst hillslopes. Catena. 2023;228(1):107177. [Google Scholar]
15. Drescher GL, Silva LSD, Sarfaraz Q, Molin GD, Marzari LB, Lopes AF, et al. Alkaline hydrolyzable nitrogen and properties that dictate its distribution in paddy soil profiles. Pedosphere. 2020;30(3):326–35. [Google Scholar]
16. Hasegawa Y, Suzuki Y, Kawakubo S. On-site determination of trace arsenic by reflection-absorption colorimetry of molybdenum blue collected on a membrane filter. Anal Sci. 2017;33(7):859–62. [Google Scholar] [PubMed]
17. Pansu M, Gautheyrou J. Handbook of soil analysis. Berlin: Springer-Verlag; 2006. [Google Scholar]
18. Bao SD. Soil and agricultural chemistry analysis. China: China Agriculture Press; 2000. p. 30–79 (In Chinese). [Google Scholar]
19. Brookes PC, Powlson DS, Jenkinson DS. Phosphorus in the soil microbial biomass. Soil Biol Biochem. 1984;16(2):169–75. [Google Scholar]
20. Vance ED, Brookes PC, Jenkinson DS. An extraction method for measuring soil microbial biomass C. Soil Biol Biochem. 1987;19(6):703–7. [Google Scholar]
21. Huo ZM, Yan XW, Zhao LQ, Zhang YH, Yang F, Zhang GF. Effects of shell morphological traits on the weight traits of Manila clam (Ruditapes philippinarum). Acta Ecol Sin. 2010;30:251–6. [Google Scholar]
22. Cai HL, Zhong ZH, Li ZM, Zhang XJ, Fu HW, Yang BX, et al. Metabolomics in quality formation and characterisation of tea products: a review. Int J Food Sci Tech. 2022;57(7):4001–14. [Google Scholar]
23. Liu WB, Cui SY, Wu LY, Qi WL, Chen JL, Ye ZQ, et al. Effects of bio-organic fertilizer on soil fertility, yield, and quality of tea. J Soil Sci Plant Nutr. 2023;23(4):5109–21. [Google Scholar]
24. Ma LF, Yang XD, Shi YZ, Yi XY, Ji LF, Cheng Y, et al. Response of tea yield, quality and soil bacterial characteristics to long-term nitrogen fertilization in an eleven-year field experiment. Appl Soil Ecol. 2021;166:103976. [Google Scholar]
25. Wall LG, Gabbarini LA, Ferrari AE, Frene JP, Covelli J, Reyna D, et al. Changes of paradigms in agriculture soil microbiology and new challenges in microbial ecology. Acta Oecol. 2019;95(1):68–73. [Google Scholar]
26. Yang WH, Li CJ, Wang SS, Zhou BQ, Mao YL, Rensing C, et al. Influence of biochar and biochar-based fertilizer on yield, quality of tea and microbial community in an acid tea orchard soil. Appl Soil Ecol. 2021;166:104005. [Google Scholar]
27. Horanni R, Engelhardt UH. Determination of amino acids in white, green, black, oolong, pu-erh teas and tea products. J Food Compos Amal. 2013;31(1):94–100. [Google Scholar]
28. Shevchuk, A., Megías-Pérez, R., Zemedie, Y., Kuhnert, N. Evaluation of carbohydrates and quality parameters in six types of commercial teas by targeted statistical analysis. Food Res Int. 2020;133:109122. [Google Scholar] [PubMed]
29. Ma, Y. H., Fu, S. L., Zhang, X. P., Zhao, K., Chen, H. Y. H. Intercropping improves soil nutrient availability, soil enzyme activity and tea quantity and quality. Appl Soil Ecol. 2017;119:171–8. [Google Scholar]
30. Huang, Z. J., Wang, F. X., Li, B., Pang, Y. L., Du, Z. Y. Appropriate nitrogen form and application rate can improve yield and quality of autumn tea with drip irrigation. Agron. 2023;13(5):1303. [Google Scholar]
31. Ye HM, Li GP, Yuan XY, He H, Yang H, Tang L, et al. The distribution of phosphorus forms in Wuyi rock region and its effect on tea quality-related constituents in tea garden soil. Pol J Environ Stud. 2021;30(5):4331–41. [Google Scholar]
32. Sano T, Horie H, Matsunaga A, Hirono Y. Effect of shading intensity on morphological and color traits and on chemical components of new tea (Camellia sinensis L.) shoots under direct covering cultivation. J Sci Food Agric. 2018;98(15):5666–76. [Google Scholar] [PubMed]
33. Ruan J, Haerdter R, Gerendás J. Impact of nitrogen supply on carbon/nitrogen allocation: a case study on amino acids and catechins in green tea [Camellia sinensis (L.) O. Kuntze] plants. Plant Biol. 2010;12(5):724–34. [Google Scholar] [PubMed]
34. Kusano M, Fukushima A, Redestig H, Saito K. Metabolomic approaches toward understanding nitrogen metabolism in plants. J Exp Bot. 2011;62(4):1439–53. [Google Scholar] [PubMed]
35. Ding Z, Jia S, Wang Y, Xiao J, Zhang Y. Phosphate stresses affect ionome and metabolome in tea plants. Plant Physiol Biochem. 2017;120:30–9. [Google Scholar] [PubMed]
36. Wei KL, Liu MY, Shi YF, Zhang H, Ruan JY, Zhang QF, et al. Metabolomics reveal that the high application of phosphorus and potassium in tea plantation inhibited amino-acid accumulation but promoted metabolism of flavonoid. Agron. 2022;12(5):1086. [Google Scholar]
37. Wang YS, Gao LP, Shan Y, Liu YJ, Tian YW, Xia T, et al. Influence of shade on flavonoid biosynthesis in tea (Camellia sinensis (L.) O. Kuntze). Sci Hortic-Amsterdam. 2012;141:7–16. [Google Scholar]
38. Li Y, Jeyaraj A, Yu H, Wang Y, Ma Q, Chen X, et al. Metabolic regulation profiling of carbon and nitrogen in tea plants (Camellia sinensis (L.) O. Kuntze) in response to shading. J Agric Food Chem. 2020;68(4):961–74. [Google Scholar] [PubMed]
39. Xia EH, Zhang HB, Sheng J, Li K, Zhang QJ, Kim C, et al. The tea tree genome provides insights into tea flavor and independent evolution of caffeine biosynthesis. Mol Plant. 2017;10(6):866–77. [Google Scholar] [PubMed]
40. Yu, P., Yeo, AS, Low, MY, Zhou, W. Identifying key non-volatile compounds in ready-to-drink green tea and their impact on taste profile. Food Chem. 2014;155:9–16. [Google Scholar] [PubMed]
41. Yang X, Cheng YF, Deng C, Ma Y, Wang ZW, Chen XH, et al. Comparative transcriptome analysis of eggplant (Solanum melongena L.) and turkey berry (Solanum torvum Sw.Phylogenomics and disease resistance analysis. BMC Genom. 2014;15(1):412. [Google Scholar]
42. Spedding TA, Hamel C, Mehuys GR, Madramootoo CA. Soil microbial dynamics in maize-growing soil under different tillage and residue management systems. Soil Biol Biochem. 2004;36:499–512. [Google Scholar]
43. Chandran AK, Priatama RA, Kumar V, Xuan Y, Je BI, Kim CM, et al. Genome-wide transcriptome analysis of expression in rice seedling roots in response to supplemental nitrogen. J Plant Physiol. 2016;200(1):62–75. [Google Scholar] [PubMed]
44. Fei T, Fei J, Huang F, Xie T, Xu J, Zhou Y, et al. The anti-aging and anti-oxidation effects of tea water extract in Caenorhabditis elegans. Exp Gerontol. 2017;97(3):89–96. [Google Scholar] [PubMed]
45. Yang YY, Ma LF, Li XH, Ratcliffe RG, Kruger NJ, Ruan J. Metabonomic analysis on the effects of different nitrogen application rates and light/dark change on metabolism in tea leaves. J Tea Sci. 2013;33(6):491–9 (In Chinese). [Google Scholar]
Cite This Article
 Copyright © 2024 The Author(s). Published by Tech Science Press.
This work is licensed under a Creative Commons Attribution 4.0 International License , which permits unrestricted use, distribution, and reproduction in any medium, provided the original work is properly cited.
 Downloads
 Citation Tools