
 Submit a Paper
 Propose a Special lssue
 Open Access
ARTICLE

Genome-Wide Identification and Characterization of FAR1 in Phaseolus vulgaris under Salt and Drought Stress Conditions
Department of Pharmacy Services, Kırıkhan Vocational School, Hatay Mustafa Kemal University, Antakya, 31440, Türkiye
* Corresponding Author: Abdil Hakan Eren. Email:
(This article belongs to the Special Issue: Abiotic Stress Tolerance in Crop Plants: Physio-biochemical and Molecular Mechanisms)
Phyton-International Journal of Experimental Botany 2025, 94(10), 3085-3107. https://doi.org/10.32604/phyton.2025.069506
Received 25 June 2025; Accepted 03 September 2025; Issue published 29 October 2025
 View Full Text
 Download PDF
Abstract
The FAR1-related sequence (FAR1) gene family consists of transcription factors that originated from transposases and is crucial for light signaling and stress adaptation in plants. Despite the recognized importance of FAR1 genes in model organisms, their genomic architecture, structural variability, and expression patterns in Phaseolus vulgaris have yet to be investigated. This study offers the inaugural comprehensive genome-wide identification and characterization of the FAR1 gene family in P. vulgaris. A total of 27 PvulFAR1 genes were identified, and their chromosomal distribution, gene structures, conserved domains, and phylogenetic relationships were analyzed systematically. The promoter regions of these genes were discovered to encompass a diverse range of cis-regulatory elements that respond to light, phytohormones, and abiotic stressors, highlighting their regulatory complexity. In silico expression analysis and quantitative real-time PCR (qRT-PCR) experiments demonstrated differential expression patterns of specific PvulFAR1 genes under salt and drought stress in two commercial bean cultivars. PvulFAR1-10 demonstrated consistent upregulation under both stress conditions, especially in the stress-tolerant cultivar Elkoca-05, indicating its potential role in broad-spectrum stress responsiveness. Gene ontology and protein–protein interaction network analyses revealed that PvulFAR1 proteins are predominantly nuclear-localized transcription factors, enriched in zinc ion binding activity, and associated with transcriptional regulation and nucleobase metabolic processes. The results offer novel perspectives on the evolution, structural complexity, and stress-responsive regulatory functions of the FAR1 gene family in common bean. This fundamental knowledge provides significant candidate genes for additional validation and for developing of genetically improved cultivars with enhanced tolerance to abiotic stresses. Future research should focus on clarifying the downstream targets of essential FAR1 members and their integrative function in plant developmental and stress response networks.Keywords
Supplementary Material
Supplementary Material FilePlants have developed various biological mechanisms to adapt to their environments. Light significantly influences various plant functions, including flowering, photomorphogenesis, stomatal regulation, circadian rhythms, and overall growth [1–5]. Light functions as a crucial environmental signal, providing the energy necessary for photosynthesis and facilitating the evolution of various photoreceptors in plants. These photoreceptors allow plants to perceive the quality, intensity, and direction of light, comprising phytochromes that respond to far-red and red light, along with phototropins and cryptochromes that are responsive to blue light [6,7].
The FAR1-related Sequence (FRS) and FRS-related Factor (FRF) genes, which originated from transposases, play key roles as transcription factors in detecting and transmitting light signals. Recently, studies have brought more clarity to how these transcription factors function in light signaling responses [8]. FAR1, recognized as the founding member of the FRS family, includes an N-terminal C2H2 zinc finger domain for DNA binding, a central MULE transposase domain, and a C-terminal SWIM zinc finger domain [9,10]. In contrast, the FRF group contains only the FAR1 DNA-binding domain, lacking both the transposase and SWIM domains. It is suggested that FRF proteins might either compete with FRS proteins by binding to the same DNA sites or influence the transcription levels of target genes through interactions with other transcription factors [11,12].
Plants have evolved adaptive mechanisms to respond to environmental changes, with light serving as a critical factor in this process [10]. By adjusting their growth patterns and metabolic processes, plants can enhance their survival and reproductive success in varying light conditions. Light is recognized as an essential resource for the development of all autotrophic organisms, enabling critical processes such as biomass production and energy metabolism. In plants, light functions as a critical signaling molecule in processes such as circadian rhythms, aging, metabolism, vegetative reproductive development and adaptation to environmental changes [8,13,14]. Plants must contend with light and various biotic and abiotic stressors, including drought, temperature fluctuations, salinity, waterlogging, fungi, viruses, and bacteria. Plants have developed intricate defense mechanisms to withstand substantial environmental stressors through the regulation of specific gene expressions [15–17].
A thorough examination of the functions of FRS and FRF proteins, essential to light signaling pathways and responses to abiotic stress, could greatly enhance our comprehension of plant responses to light stimuli and the development of molecular adaptation strategies under environmental stress. Therefore, it is imperative for researchers to investigate the potential roles of FAR1 and FRF proteins in light signaling and plant responses to abiotic stress [8,10] to elucidate these intricate regulatory networks. In silico analyses of many plant species have identified FAR1 genes. These comprise Arabidopsis thaliana [6], potato (Solanum tuberosum) [10], walnut (Juglans sigillata L.) [18], cucumber (Cucumis sativus L.) [19], and peanut (Arachis hypogaea) [7]. Nonetheless, we have not yet comprehensively characterized Phaseolus vulgaris, despite their economic importance and nutritional value. The goal of this study was to find and describe the FAR1 gene family in beans and see how they react to drought and salt stress. Using the qRT-PCR method, the response of FAR1 genes to drought and salt stress in leaf tissue samples of bean plants will be investigated. This initiative will be the first study to examine the FAR1 gene family in beans.
2.1 Identification of FAR1 Family Members
The Pfam database accession number (PF03101) was utilized to get protein sequences of the FAR1 gene family from the genomes of A. thaliana [20], P. vulgaris [21], and Glycine max [22]. FAR1 protein sequences were acquired by keyword searches utilizing this accession number in the Phytozome v13 database (Table S1). BLASTP and hidden Markov model (HMM)-based searches (http://www.ebi.ac.uk) were conducted on the Phytozome v13 database to discover all probable FAR1 proteins in the genomes of the three plants. The existence of pertinent FAR1 sequences in the bean genome was validated utilizing the HMMER database (http://hmmer.org/). Data such as amino acid length (AA) and molecular weight (mW) of FAR1 proteins identified in beans were evaluated using the Expasy website (https://web.expasy.org/protparam/ (accessed on 01 September 2025)). The subcellular localization of bean FAR1 protein sequences was assessed via WoLF PSORT [23].
2.2 Chromosomal Localization of FAR1 Genes and Gene Duplications in P. vulgaris
The coding and non-coding portions of PvulFAR1 genes were delineated utilizing the gff file sourced from the Phytozome v13 database and viewed with TBTools [24]. The chromosomal positions and dimensions of PvulFAR1 genes were ascertained with Phytozome v13. The locations of PvulFAR1 genes have been identified and visualized on all bean chromosomes. The Ks (synonymous), Ka (non-synonymous) values, and Ka/Ks (evolutionary pressure) between PvulFAR1 gene pairs have been calculated, and gene duplication events have been identified using gene linkage information obtained from TBTools [24].
2.3 Structure of PvulFAR1 Genes and Identification of Conserved Motifs
A gff3 (annotation-gene-transcript) file containing information about the start and end points obtained from the Phytozome v13 database was used to analyze the intron/exon distribution of FAR1 genes and to understand the effects of gene structure and organization on protein functionality and evolutionary differences between species.
‘MEME’ program was utilized to uncover conserved motifs within the amino acid sequences of PvulFAR1, as detailed by Bailey et al. [25]. The width of the motif was constrained to a minimum of 2 and a maximum of 50, while the total number of motifs was capped at 10. The motif width was limited to a minimum of 2 and a maximum of 50, with the total number of motifs restricted to 10. The dimensions of motif areas ranged from 6 to 300, and the distributions of these regions were adjusted to accommodate varying quantities of repeats. The identified motifs were analyzed and functionally evaluated using the InterPro database, adhering to the default parameters set by Quevillon et al. [26]. The data regarding conserved motifs for the PvulFAR1 genes was obtained from the “NCBI Conserved Domain Search” database. The collected data were visualized utilizing TBtools software [24].
2.4 Phylogenetic Analysis of PvulFAR1 Members
The phylogenetic analyses were conducted using the Neighbor-Joining (NJ) method, which was further supported by bootstrap analyses involving 1000 replicates. The protein sequences of FAR1 from A. thaliana, P. vulgaris, and G. max were aligned, and a phylogenetic tree was created utilizing the MEGA v11 program [27]. The phylogenetic tree generated using Mega v11 was visualized and edited using the Interactive Tree of Life (iTOL) browser [28].
2.5 Analysis of Synteny among Different Species and P. vulgaris
A comparative analysis was performed employing the One Step MCScanX tool, which utilized the genome and transcript sequences of P. vulgaris in comparison to those of A. thaliana and G. max. The FAR1 genes from the three plants were examined in the collected files, and a multiple synteny map was created using the TBtools database tool [24].
2.6 Investigation of the Regulatory Elements Associated with the PvulFAR1 Gene Family
The PlantCARE database [29,30] was utilized to examine the cis-acting elements located in the 5′ upstream regions of approximately 2 kb of the bean FAR1 gene family members (Table S2). The phenogram was created using the TBtools software [24].
2.7 Homology Modeling of FAR1 Proteins and Protein-Protein Interactions in P. vulgaris
Protein homology modeling was performed using the PvulFAR1 sequences, and corresponding three-dimensional (3D) structures were generated via the Phyre2 database [31]. The reliability of these structures was assessed, and the most appropriate models were selected (Table S2). These models were subsequently visualized using Chimera software to facilitate a detailed structural analysis [32].
Protein–protein interactions (PPI) are involved in various biological processes, such as photosynthesis, transpiration, metabolic development, and intercellular communication [33]. The STRING database has been utilized to identify the physical and functional interactions among proteins (Table S3). The collected data were divided and integrated with the scores for all PPIs on the STRING website. Functional genomics is a crucial component of research methods in plant biotechnology, enabling the functional characterization of novel sequence data. GO (Gene Ontology) data were sourced from the identical database (Table S3).
2.8 Analysis of Gene Expression Using In Silico Methods
In order to explore the expression profiles of bean FAR1 genes, we retrieved Illumina RNA-seq data from the Sequence Read Archive (SRA) database maintained by NCBI. The accession numbers for the RNA-seq data related to salt stress [34] and drought stress [35] were identified. The data utilized in this study include SRR957668, which corresponds to salt stress, SRR958469 representing the control condition, SRR8284481 for drought stress, and SRR8284480 as the control sample (Table S2). The normalization of gene expression levels was conducted using the reads per kilobase of transcript, per million mapped reads (RPKM) method, as described by Mortazavi et al. [36]. The RPKM values were transformed into log2 format, and subsequently, a heatmap was generated utilizing TBtools software [24].
The commercial bean varieties Serra and Elkoca-05 were obtained from Erzurum Technical University, Faculty of Science, Department of Molecular Biology and Genetics. Seeds were kept in a solution containing 1% NaOCl for 5 min for surface sterilization. Then, the seeds were sown in pots containing perlite for germination. Germinated seedlings were grown under hydroponic conditions in pots containing 200 mL of modified 1/10 Hoagland’s solution. This solution contains macro- and micronutrients necessary for plant growth [37]. Seedlings were cultivated under controlled conditions—70% humidity, a temperature of 25°C, a light intensity of 250 mmol, and a photoperiod of 16 h light and 8 h dark—until they reached the first trifoliate stage [38]. During this period, the seedlings were subjected to both salt and drought stress treatments. For salt stress, a Hoagland solution was prepared with either 0 mM NaCl (control) or 150 mM NaCl, and leaf tissues were harvested on day 7. In the case of drought stress, seedlings were treated with a Hoagland solution containing either 0% (control) or 20% PEG6000 (polyethylene glycol) for 24 h [39]. Following treatment, leaf tissues were flash-frozen in liquid nitrogen and stored at −80°C [40]. Each treatment was performed in triplicate.
2.10 Isolation of Total RNA and Expression Analysis
RNA isolation from drought- and salt-stressed bean leaves was conducted utilizing TRIzol® reagent (Invitrogen Life Technologies, Carlsbad, CA, USA). Total RNA concentrations were quantified using a Nanodrop device based to the A260/280 ratio, and the integrity of the RNAs was verified through 1.5% agarose gel electrophoresis. Following the equalization of the RNA concentrations, cDNA synthesis was conducted in according to the guidelines of SensiFAST™ cDNA Synthesis Kit (Cat No: Bio-65053, UK). qRT-PCR was perfomed utilizing the RotorGene® Q Real-Time PCR System with the EnTurbo™ SYBR Green PCR Super Mix (Catalog No: EQ001, Denver, USA). The reaction mixture had a total volume of 20 µL, which included 200 ng of cDNA, 0.4 µL each of the forward and reverse primers, and 10 µL of a 2× SYBR Green Master Mix, with double-distilled water added to reach the final volume. The thermal cycling conditions comprised an initial denaturation at 95°C for 30 s, followed by 40 cycles of denaturation at 95°C for 5 s, annealing between 50 and 60°C for 30 s, and extension at 72°C for 30 s. PvulFAR1 genes to be used in qRT-PCR analysis were selected by considering bean transcriptome data (Table S4). The β-Actin gene of P. vulgaris was used as a control gene. qRT-PCR was performed with three technical replicates for each sample.
The expression profiles of the indicated genes in drought-stressed plants were compared with the expression level of the PvActin gene. The data collected were subjected to statistical analysis through the 2−ΔΔCT method as outlined by Livak and Schmittgen [41], along with a two-way ANOVA, which included a multiple comparison test with Bonferroni correction. Normalization was conducted using Ct values, with the expression data of the PvActin gene serving as the housekeeping reference. The statistical analyses were conducted utilizing GraphPad Prism 9 software.
3.1 Identification and Characterization of FAR1 Genes in Phaseolus vulgaris
A total of 27 FAR1 genes were identified within the faba bean genome-wide data, exhibiting amino acid lengths that range from 199 to 875 amino acids. PvulFAR1-22 exhibits the shortest amino acid length and molecular weight, whereas PvulFAR1-26 possesses the longest amino acid sequence. The isoelectric point (pI) values varied from 5,67 for PvulFAR1-10 to 8,81 for both PvulFAR1-8 and PvulFAR1-17, as presented in Table 1. The instability indices varied from 42.05 for PvulFAR1-2 to 60.73 for PvulFAR1-7. In contrast, the indices for PvulFAR1-10 and PvulFAR1-17 were below 40, indicating that these proteins are regarded as stable. The conclusion drawn was that the remaining proteins exhibited instability.
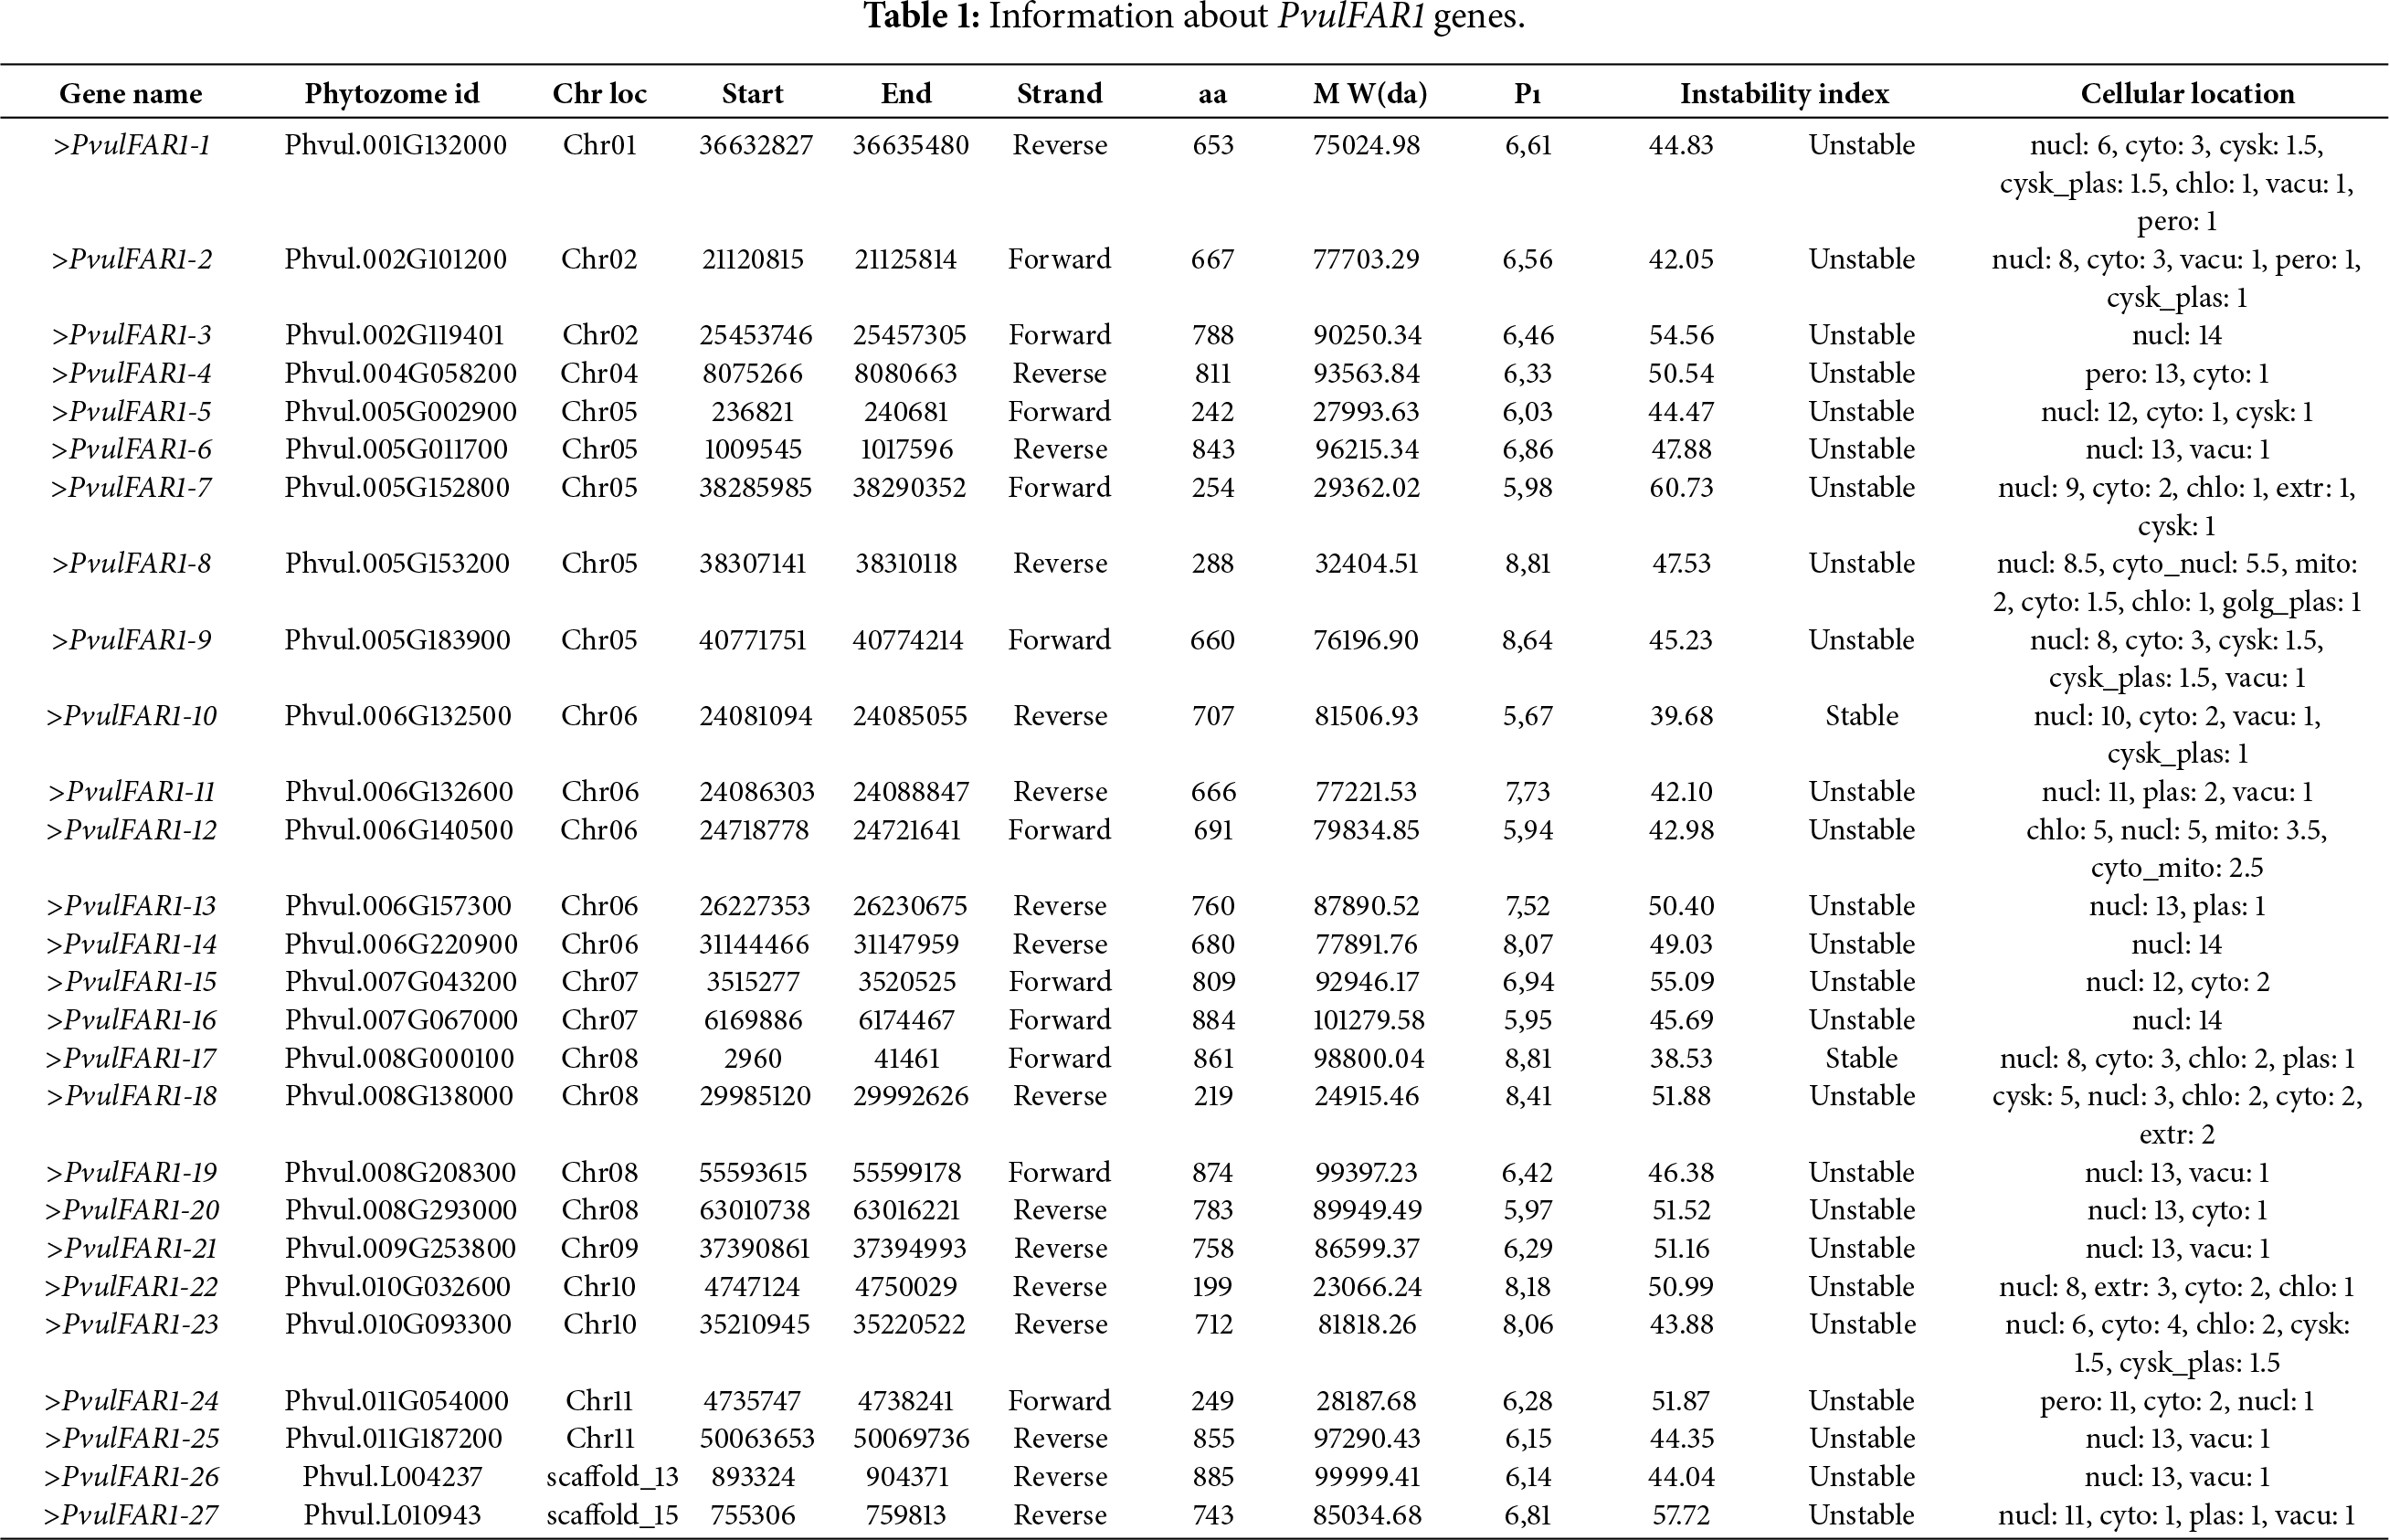
Cellular localization analysis indicated that PvulFAR1 proteins were predominantly found in the nucleus. Additionally, PvulFAR1-12 was found to be localized within the chloroplast, whereas PvulFAR1-4 and PvulFAR1-24 were identified as being localized in the peroxisome. The localization of PvulFAR1 family proteins was observed in different cellular regions (Table 1).
3.2 Chromosomal Position of FAR1 Genes and Instances of Gene Duplication
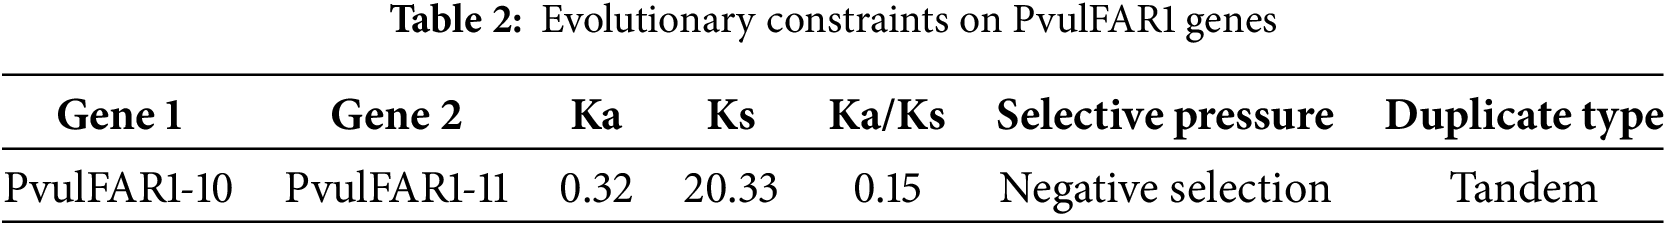
The distribution of PvulFAR1 genes across the ten chromosomes in the bean genome is not uniform, as each chromosome varies in size. The PvulFAR1 genes are designated as PvulChr01, PvulChr02, PvulChr04, PvulChr05, PvulChr06, PvulChr07, PvulChr08, PvulChr09, PvulChr10, and PvulChr11, reflecting their respective positions on the chromosome (Fig. 1). PvulFAR1-10 and PvulFAR1-11 genes are tandem duplicated genes (Table 2). PvulFAR1 genes have been subjected to negative selection throughout evolution.
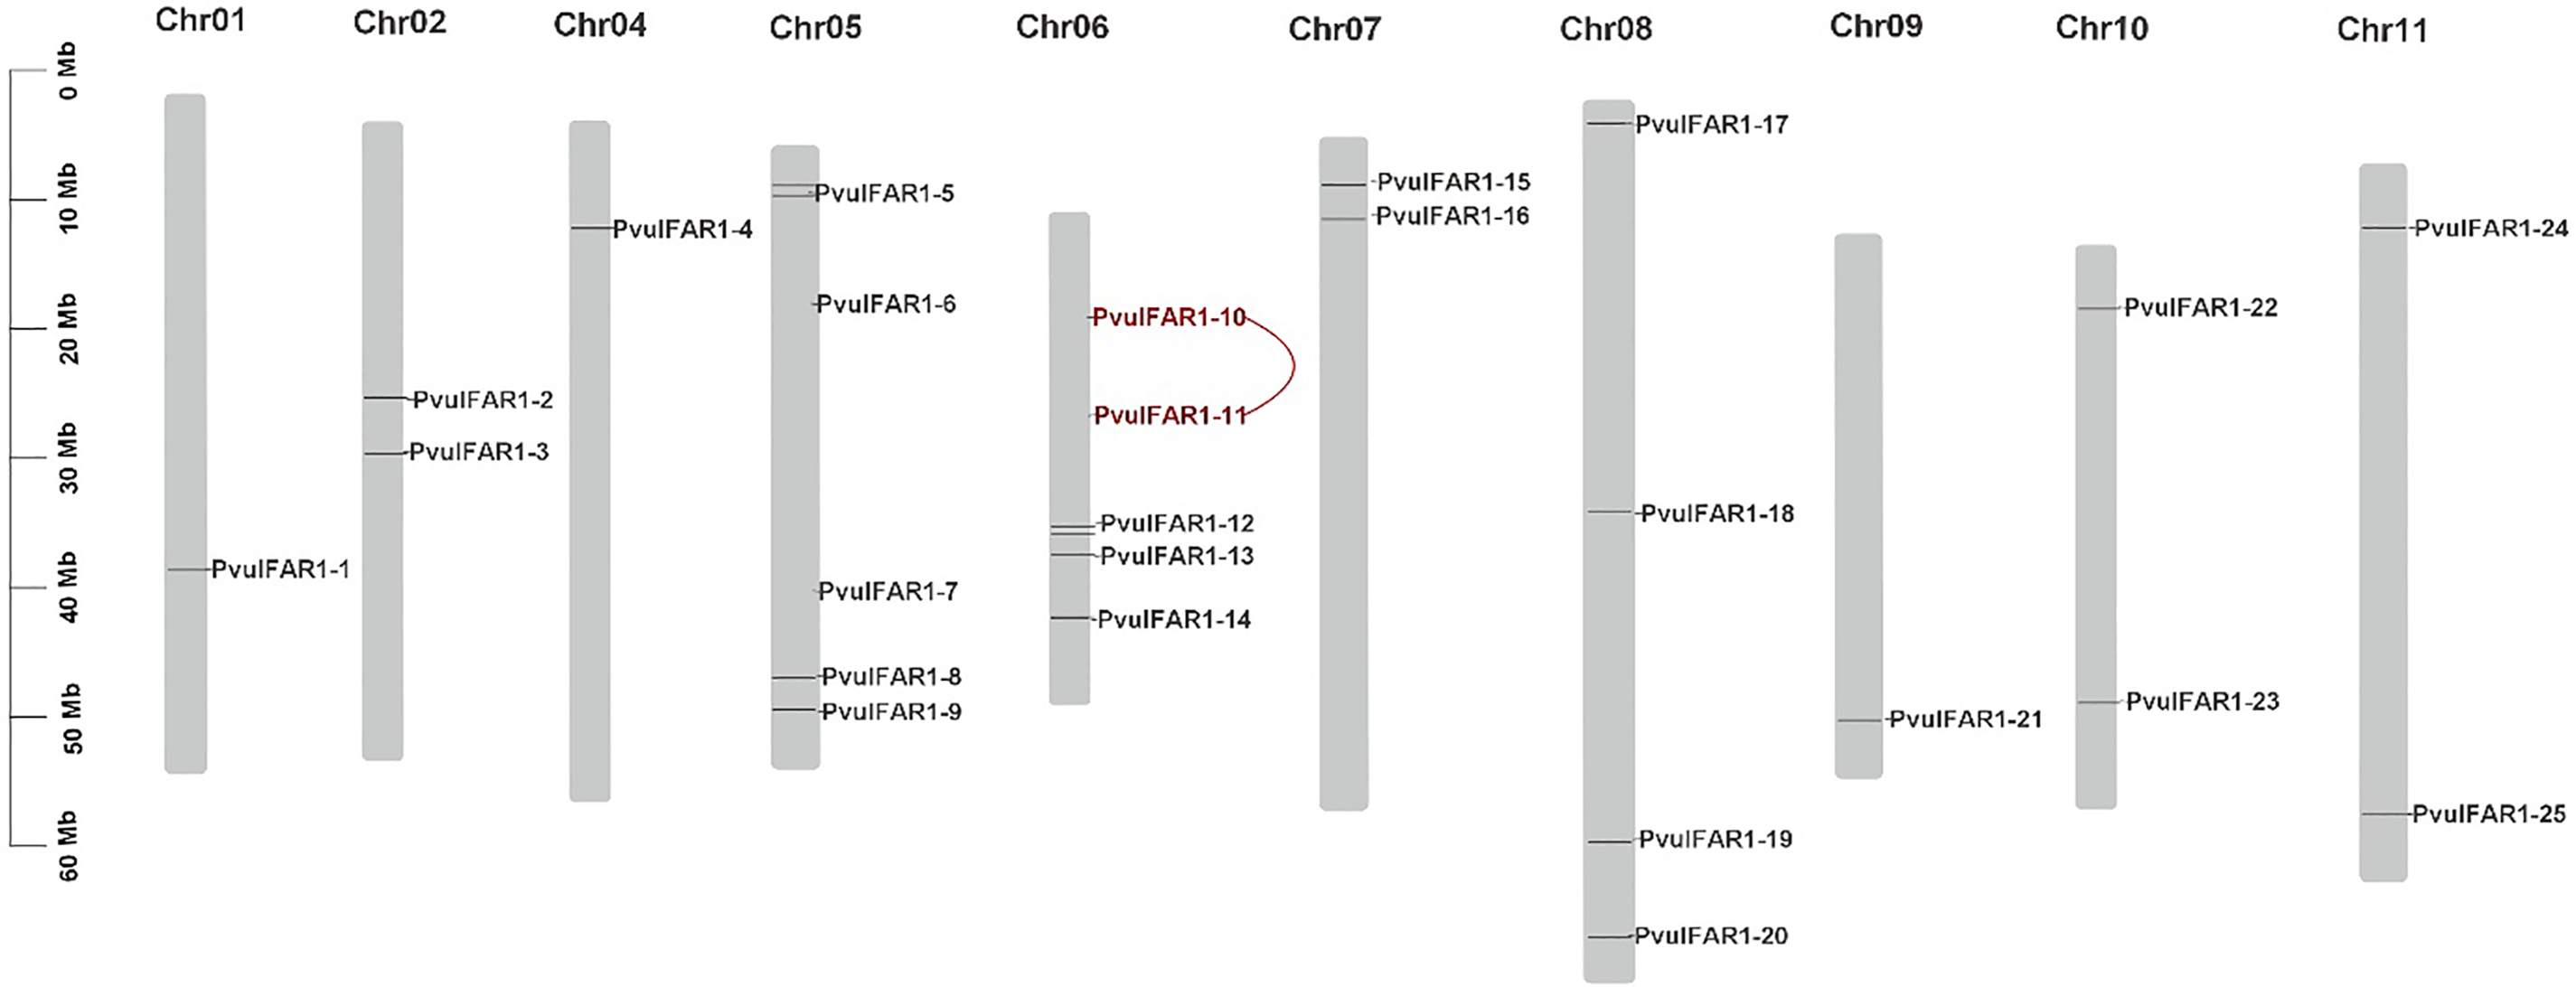
Figure 1: Chromosomal location of PvulFAR1 genes. Note: Genes seen in red are tandem duplications
3.3 Analysis of Gene Structure, Conserved Regions, and Motifs
The analysis of the exon and intron regions of the genes within the PvulFAR1 gene family revealed that the number of exons and introns in these genes ranges from 1 to 6 (Fig. 2). The genes PvulFAR1-6 and PvulFAR1-15 exhibited the greatest number of exons, whereas the exon and intron counts of the other PvulFAR1 genes were largely comparable. All PvulFAR1 genes were identified to possess regions characteristic of the FAR1 and FAR1 superfamily. Furthermore, numerous PvulFAR1 genes were found to encompass the MULE superfamily region. In contrast to the other genes, the PvulFAR1-7 gene was identified as possessing the HMMR_N superfamily region. Meanwhile, the PvulFAR1-6, PvulFAR1-16, and PvulFAR1-17 genes were characterized by the presence of the transposa_mut superfamily region.
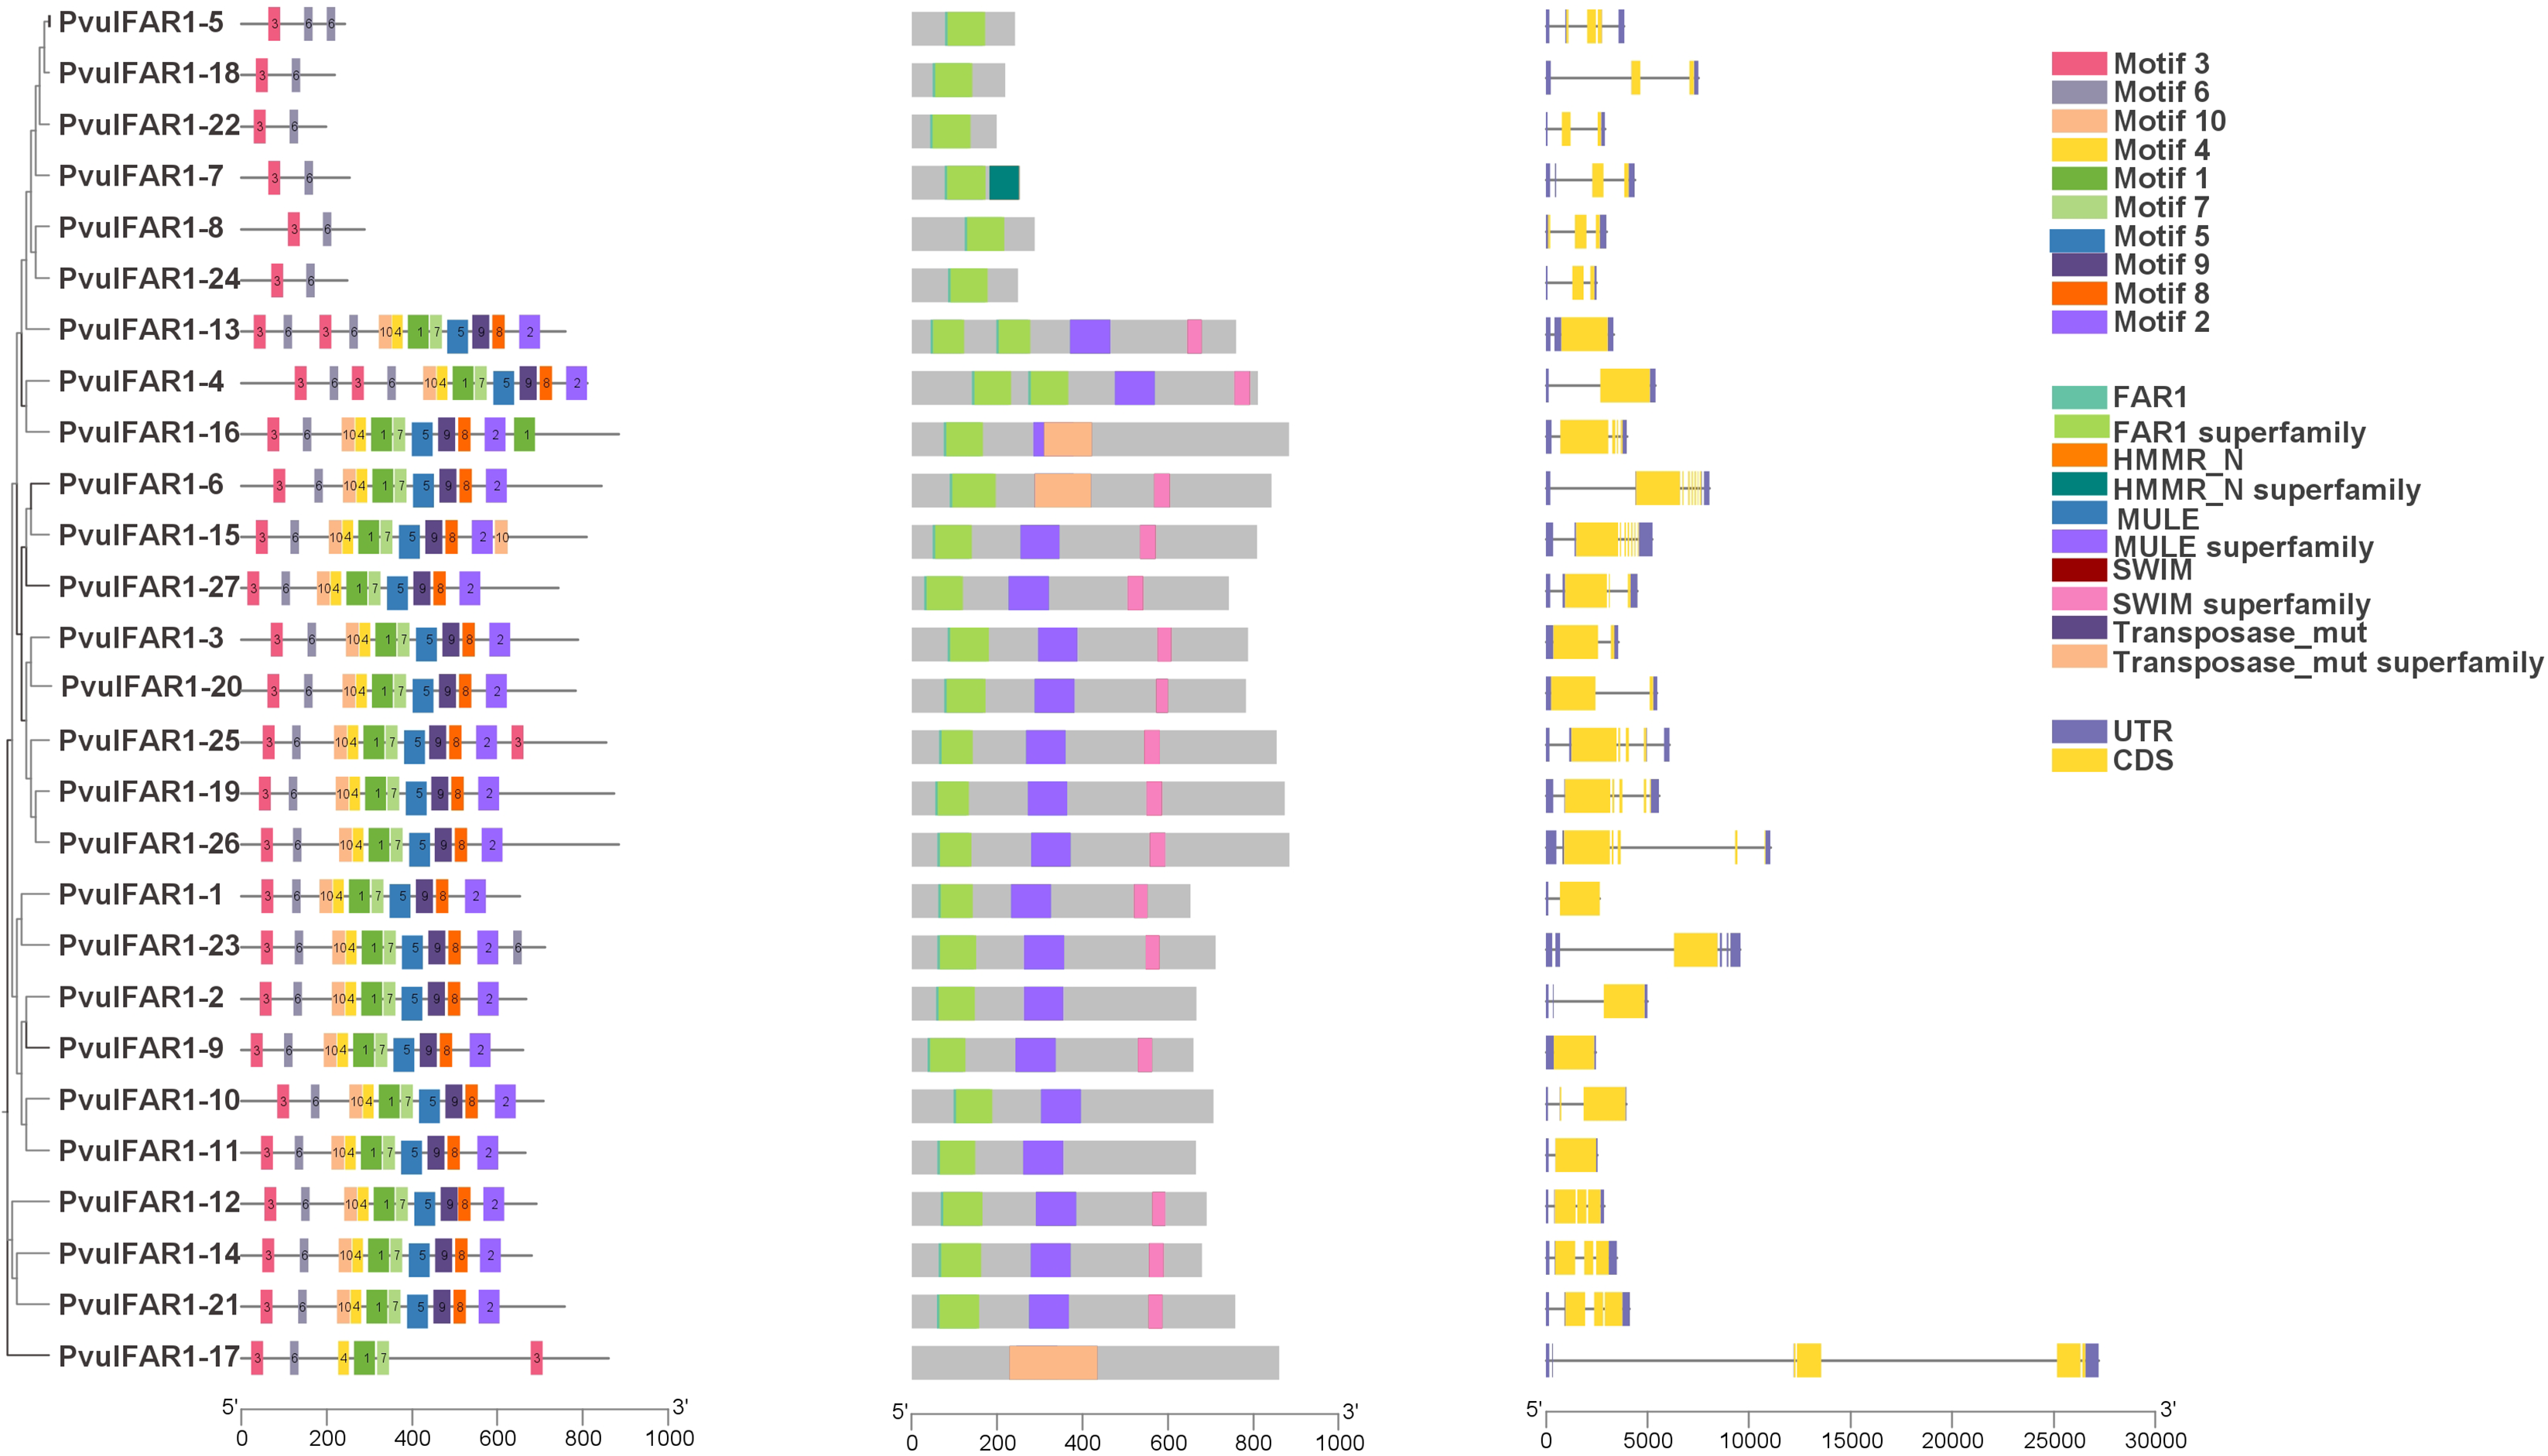
Figure 2: Conserved motif diagram of PvulFAR1 proteins, domain and gene structure of PvulFAR1 proteins
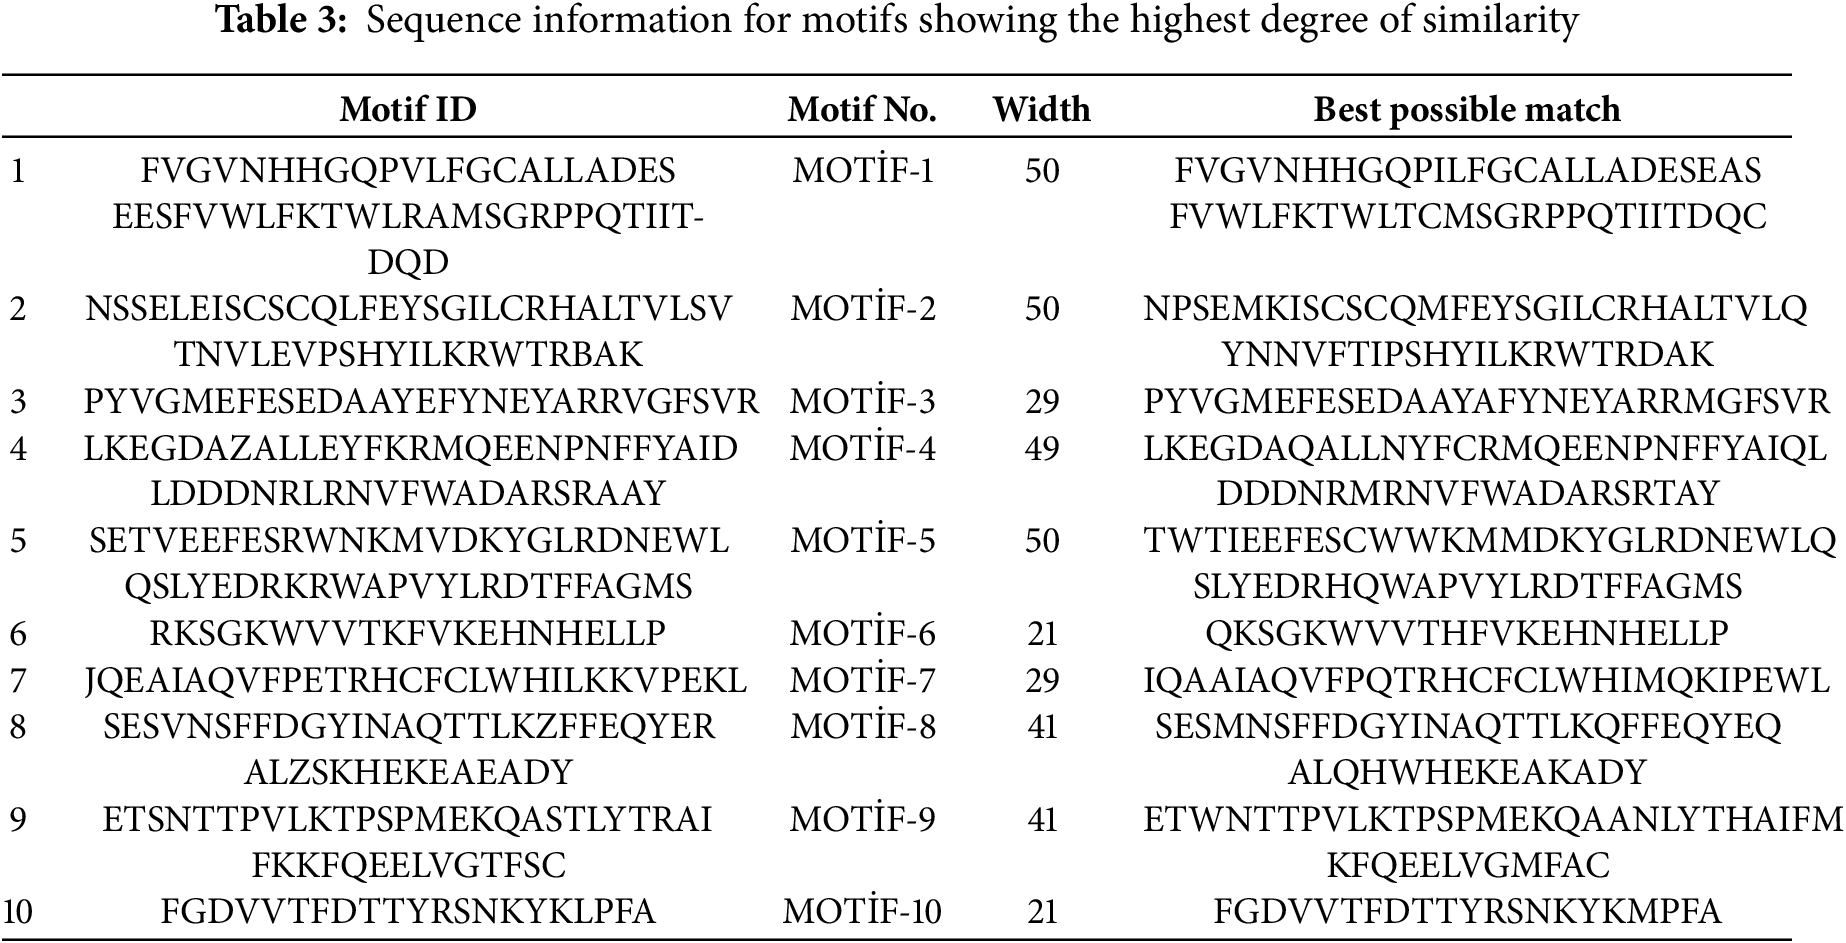
Fig. 2 presents the results of the analysis concerning the domain and conserved motif structures of PvulFAR1 proteins. Analysis of conserved motifs identified a total of ten motifs, with amino acid lengths varying from 21 to 50. The genes PvulFAR1-5, PvulFAR1-7, PvulFAR1-8, PvulFAR1-18, PvulFAR1-22, and PvulFAR1-24 exhibited the lowest motif count, with only two motifs identified, whereas the remaining genes displayed relatively comparable motif quantities. Additionally, the sequences that exhibit the highest degree of correspondence are thoroughly outlined in Table 3. The findings offer significant insights into the genetic structure and protein characteristics of PvulFAR1 genes.
3.4 Analysis of the Phylogenetic Tree and Synteny of FAR1 Genes
After comparing the sequences of 96 FAR1 proteins, phylogenetic analysis was performed. This showed that the proteins could be divided into three separate groups (Fig. 3). Twelve FAR1 proteins from the species P. vulgaris and G. max are in Group A. Thirteen FAR1 proteins from the species bean, G. max, and A. thaliana are in Group B. Group C, characterized by the highest concentration of FAR1 proteins, comprises a total of 71 FAR1 proteins. Group A classifies the proteins PvulFAR1-4 and PvulFAR1-16. In contrast, Group C is different because it has the most FAR1 proteins and the highest level of homology. Furthermore, we identified the tandem duplication of the PvulFAR1-10 and PvulFAR1-11 genes within Group C (Fig. 3).
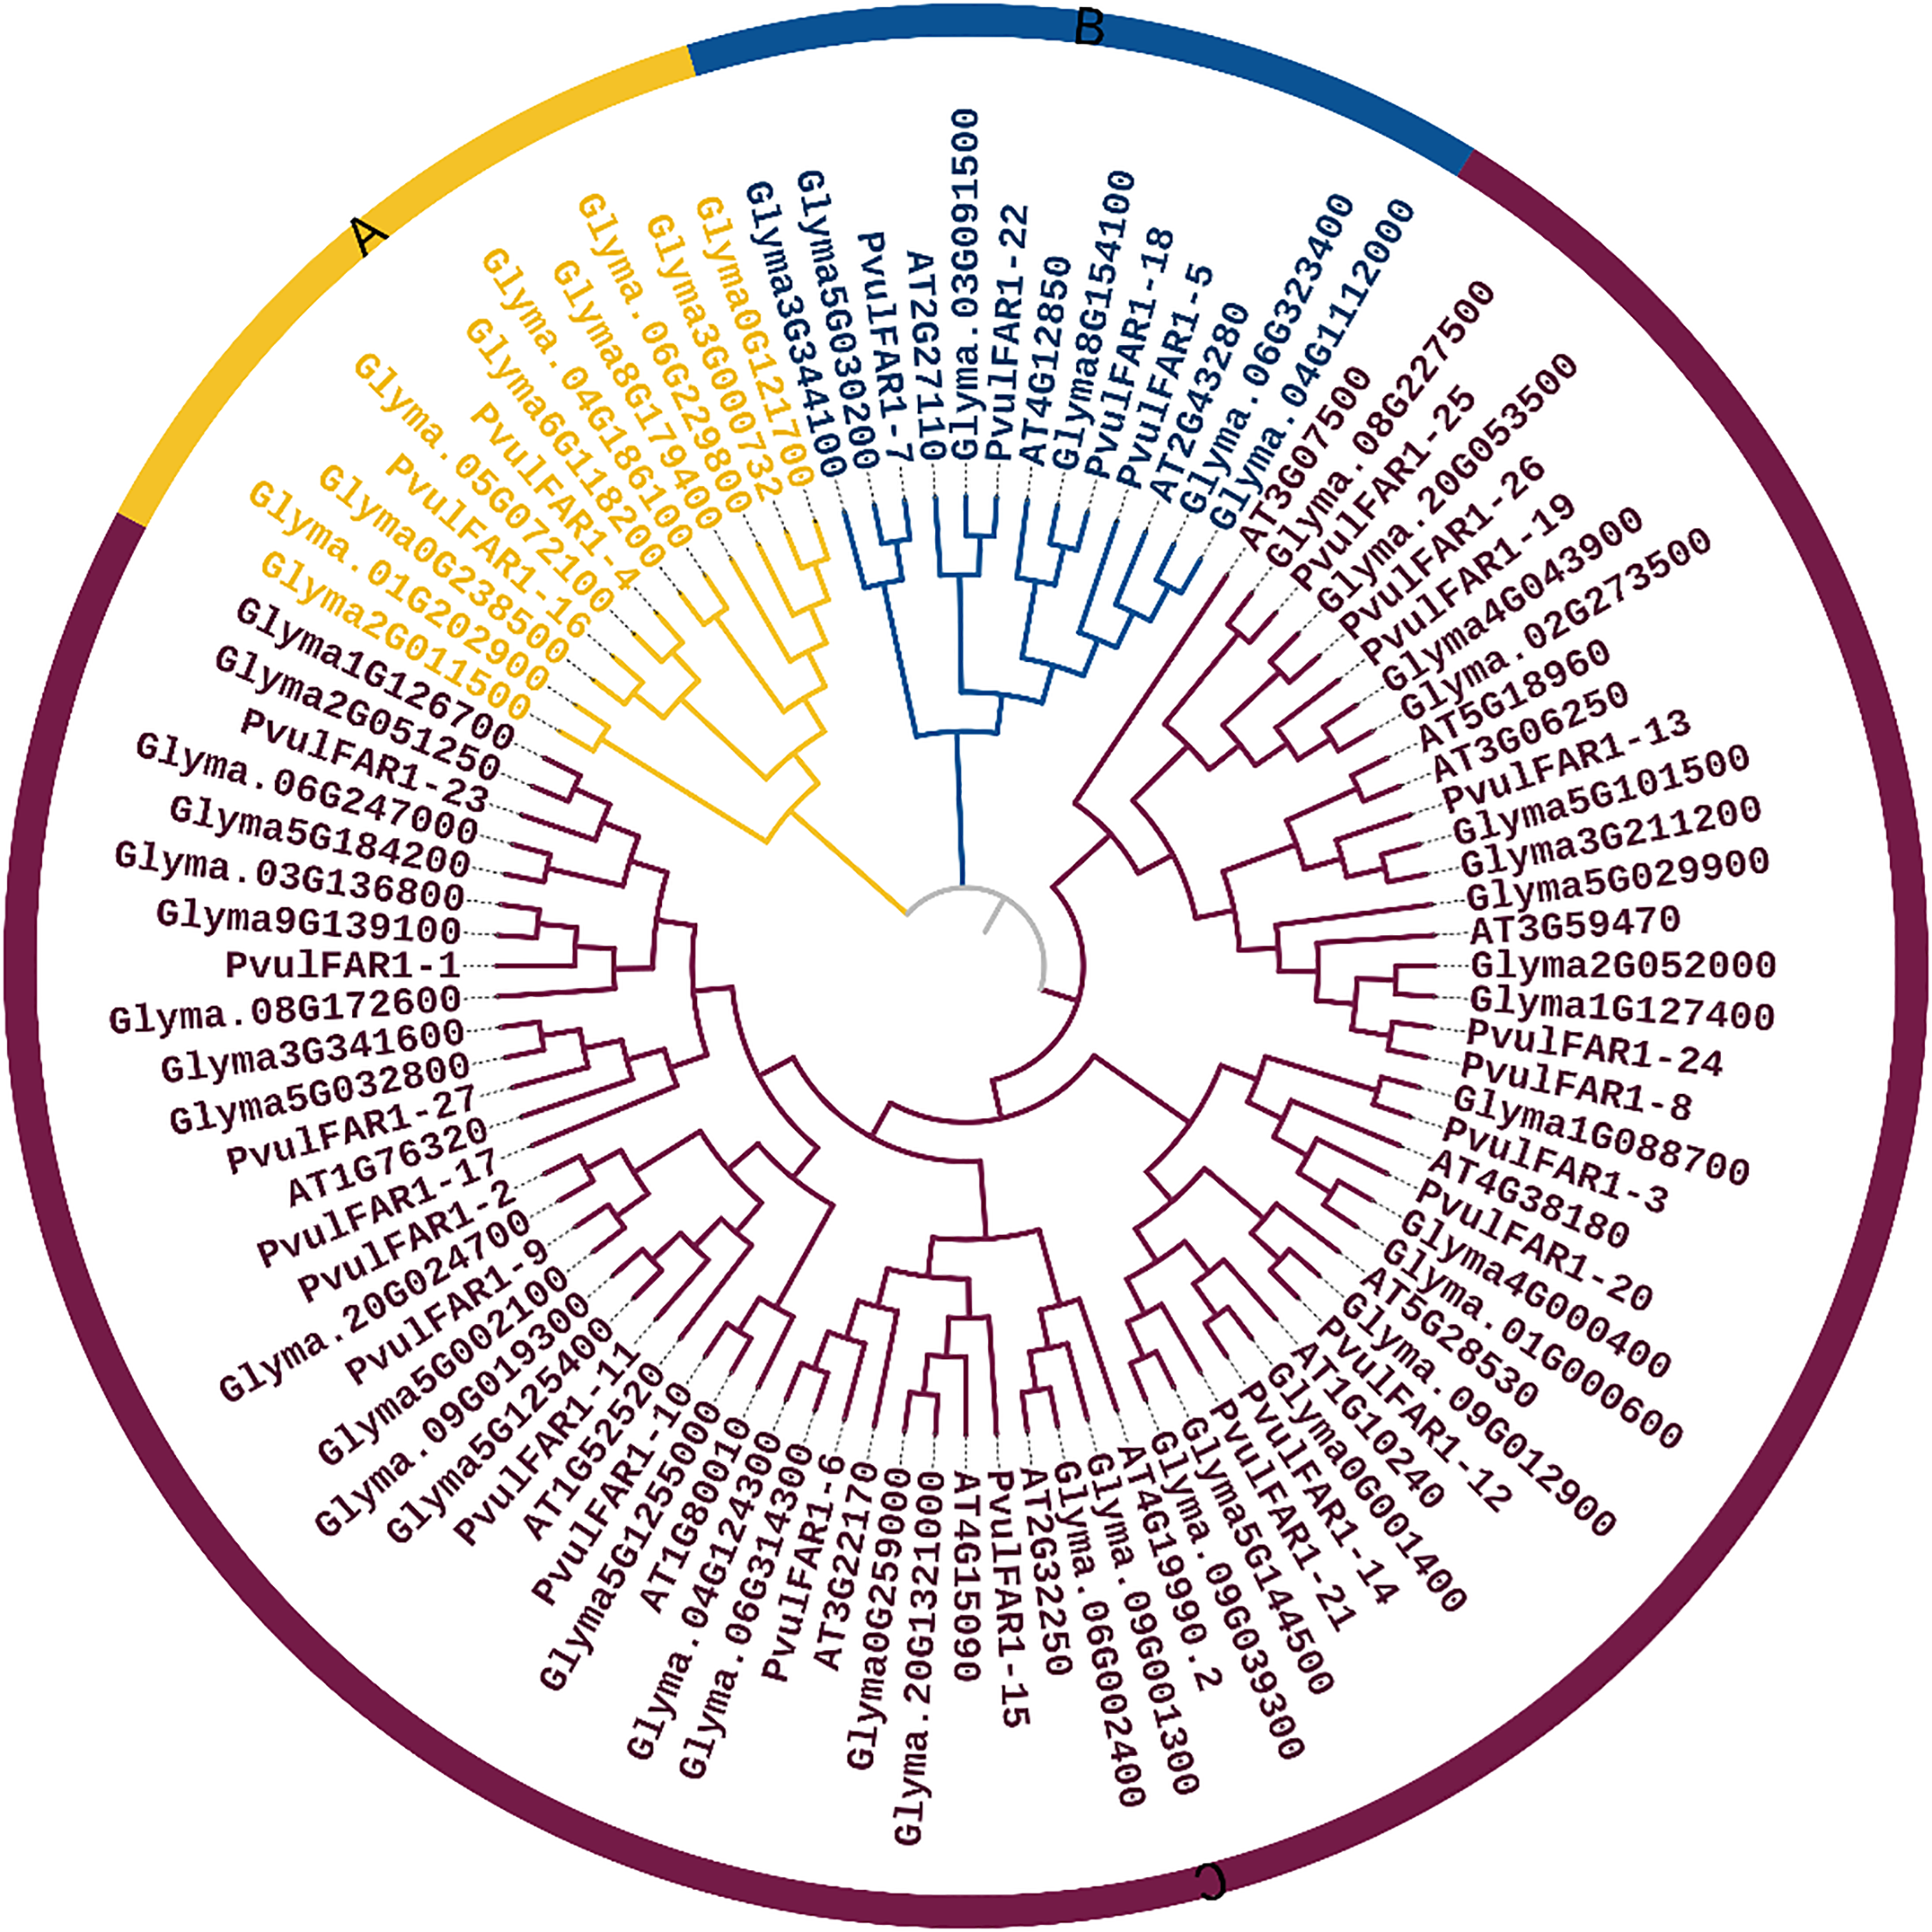
Figure 3: Phylogenetic tree representation of FAR1 proteins
Synteny analysis identified five syntenic connections between the species P. vulgaris and A. thaliana. A total of 34 syntenic links (Fig. 4) indicate a greater genetic relationship between the species P. vulgaris and G. max. The findings indicate that the species P. vulgaris and G. max may share a more recent common ancestor in the evolutionary timeline, and their genetic material appears to be more conserved.
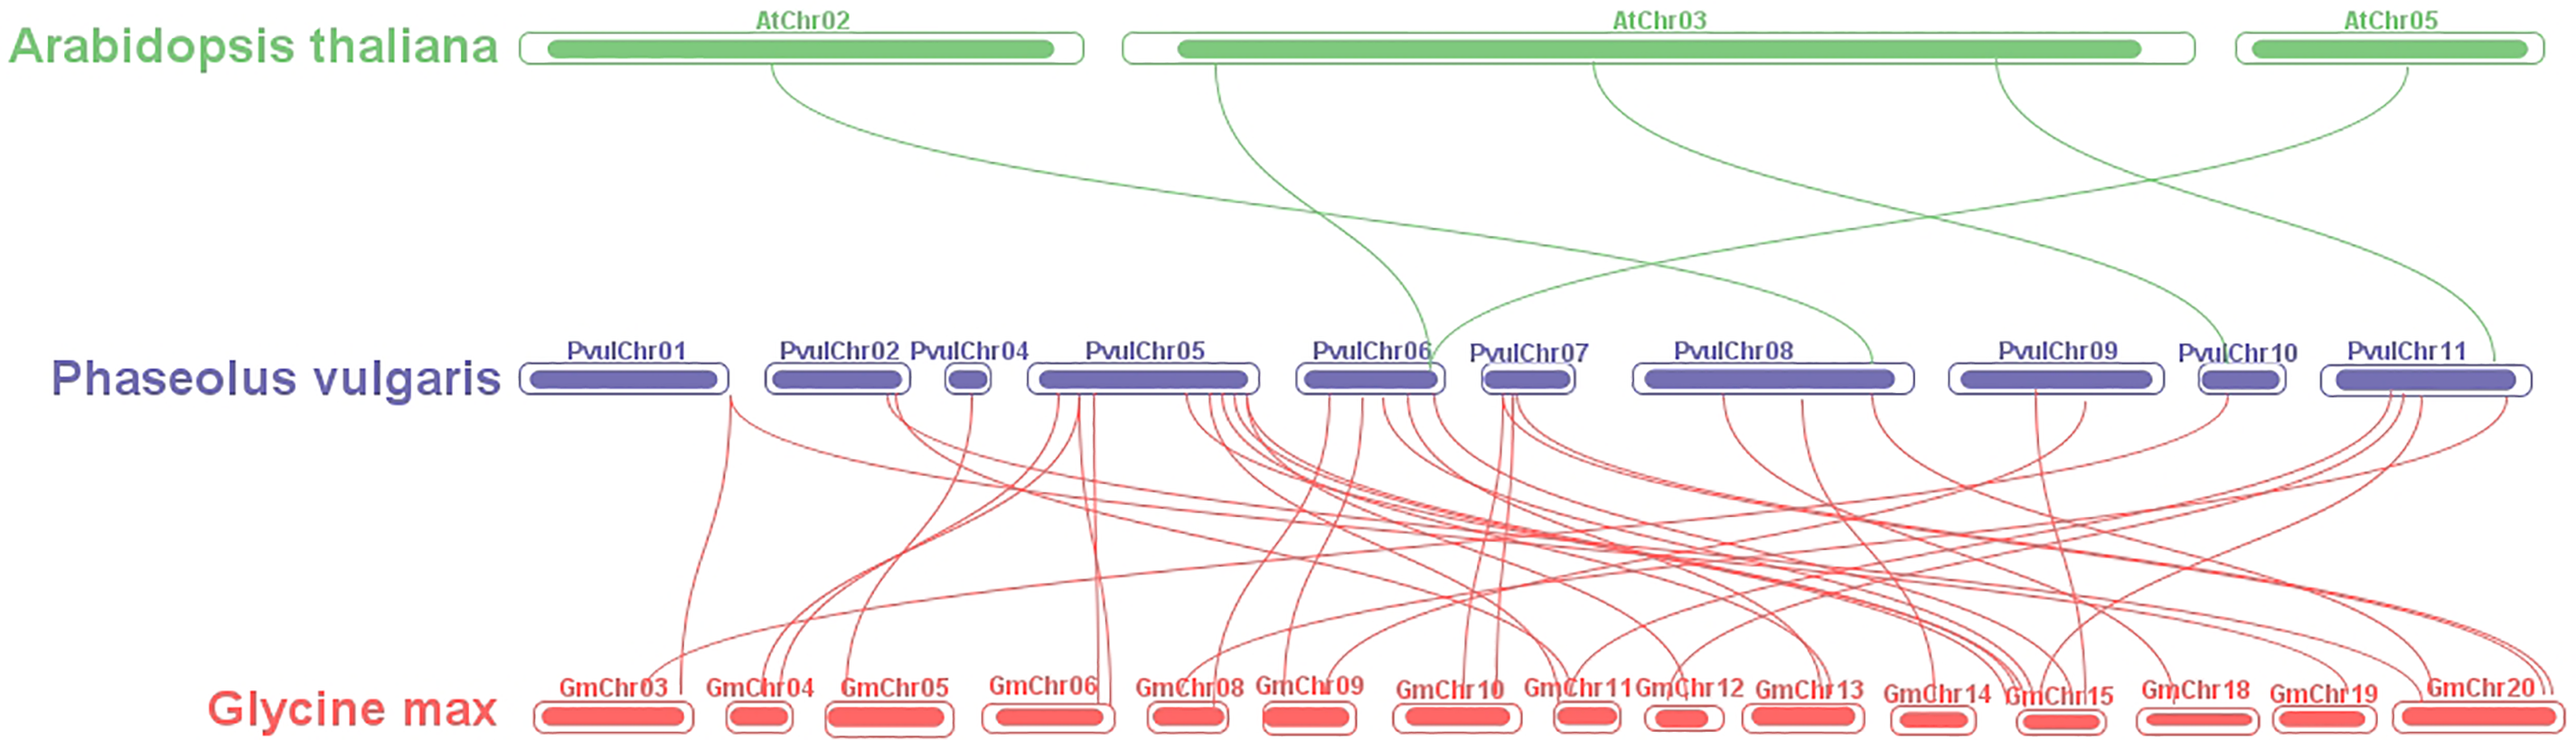
Figure 4: Synteny analysis of FAR1 genes
3.5 Three-Dimensional Structural (3D) Modeling of PvulFAR1 Proteins
The analysis of FAR1 proteins was conducted through the Phytozome v13 database, and 3D homology modeling was carried out using the Phyre2 platform to anticipate their structural and functional characteristics. The models underwent analysis using the visualization software Chimera, and the findings are illustrated in Fig. 5.
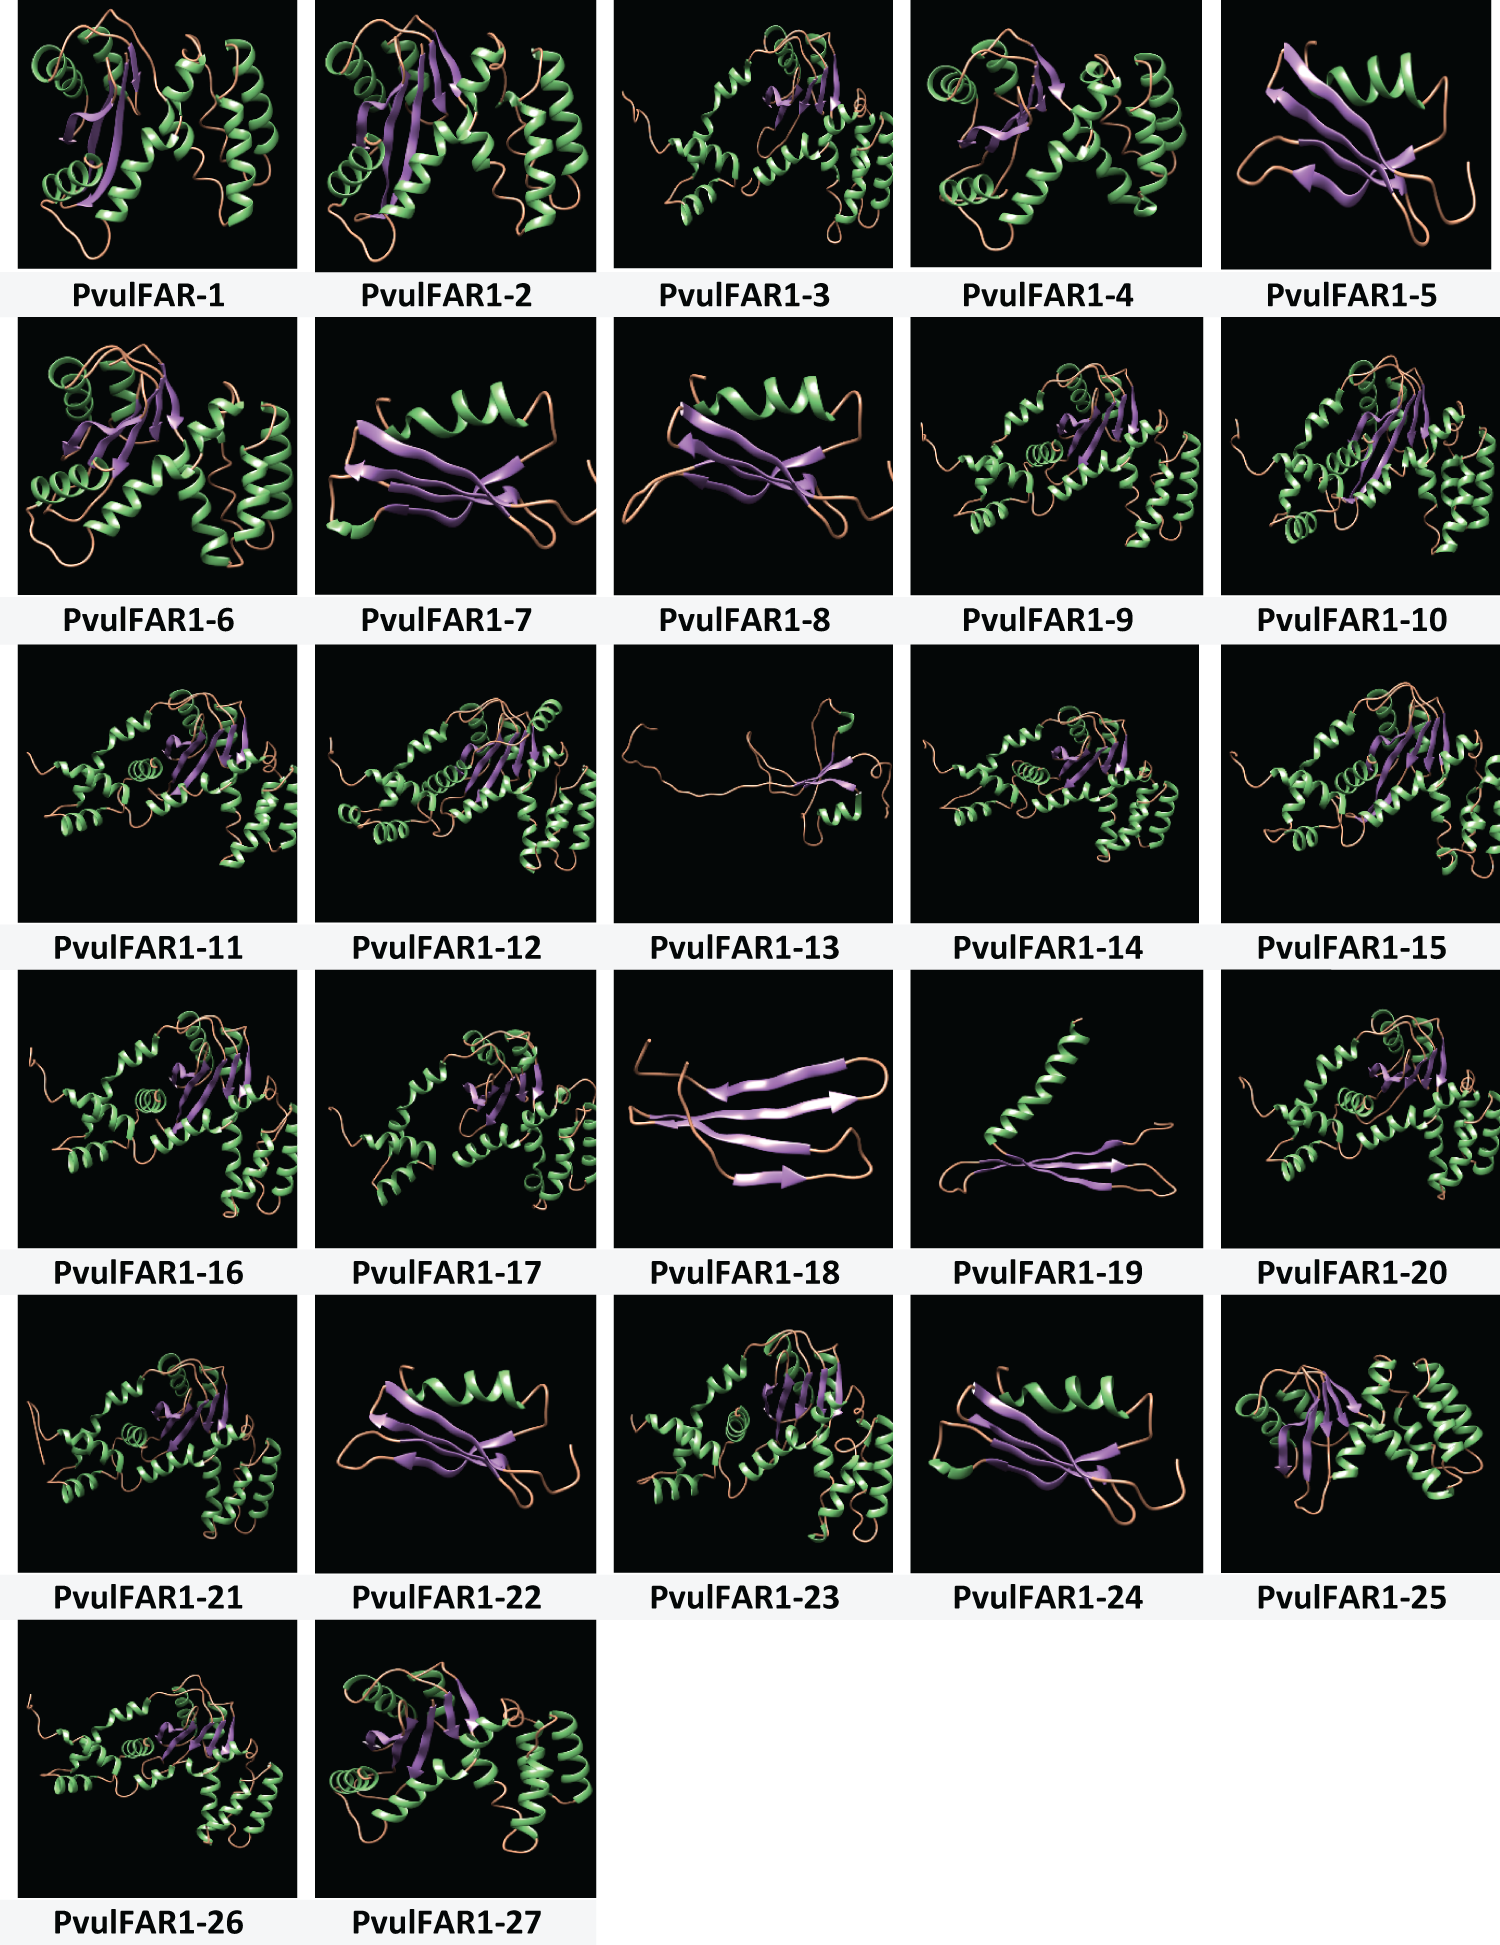
Figure 5: 3D homology modeling of PvulFAR1 proteins
The assessment of the three-dimensional configurations of PvulFAR1 proteins indicated that these proteins are primarily made up of alpha-helices while exhibiting a lesser amount of beta-sheet structures. The three-dimensional structures of most PvulFAR1 proteins were found to be very similar. However, the PvulFAR1-18 protein was very different from these overall structures. The structural analysis of PvulFAR1 proteins also revealed notable differences. When compared to other PvulFAR1 proteins, the interaction regions of the PvulFAR1-13, PvulFAR1-18, and PvulFAR1-19 proteins are different.
3.6 Analysis of Cis-Elements in PvulFAR1 Promoters Using In Silico Methods
The upstream promoter regions of FAR1 genes, which are 2000 base pairs long, were taken out and analyzed using the PlantCARE database to learn more about how these genes are controlled during transcription. The data were visualized utilizing TbTools software. The study found that the promoter regions of FAR1 genes had 28 different stress-related cis-regulatory elements (Fig. 6). The study found that the MYB binding site drought-inducibility (MBS) element, which is connected to drought and salt stress, and the ABRE element, which controls the ABA response, were found in almost all of the genes that were looked at. The most abundant cis elements in the promoters of stress-responsive PvulFAR1 genes are MYB and ABRE elements. Also, it was found that the promoter regions of FAR1 genes have a lot of cis-regulatory elements connected to different phytohormones and light-responsive elements like box-4, GT1-motif, and G-box. The results indicate that FAR1 genes exhibit transcriptional regulations that respond to environmental stresses and hormonal signals.
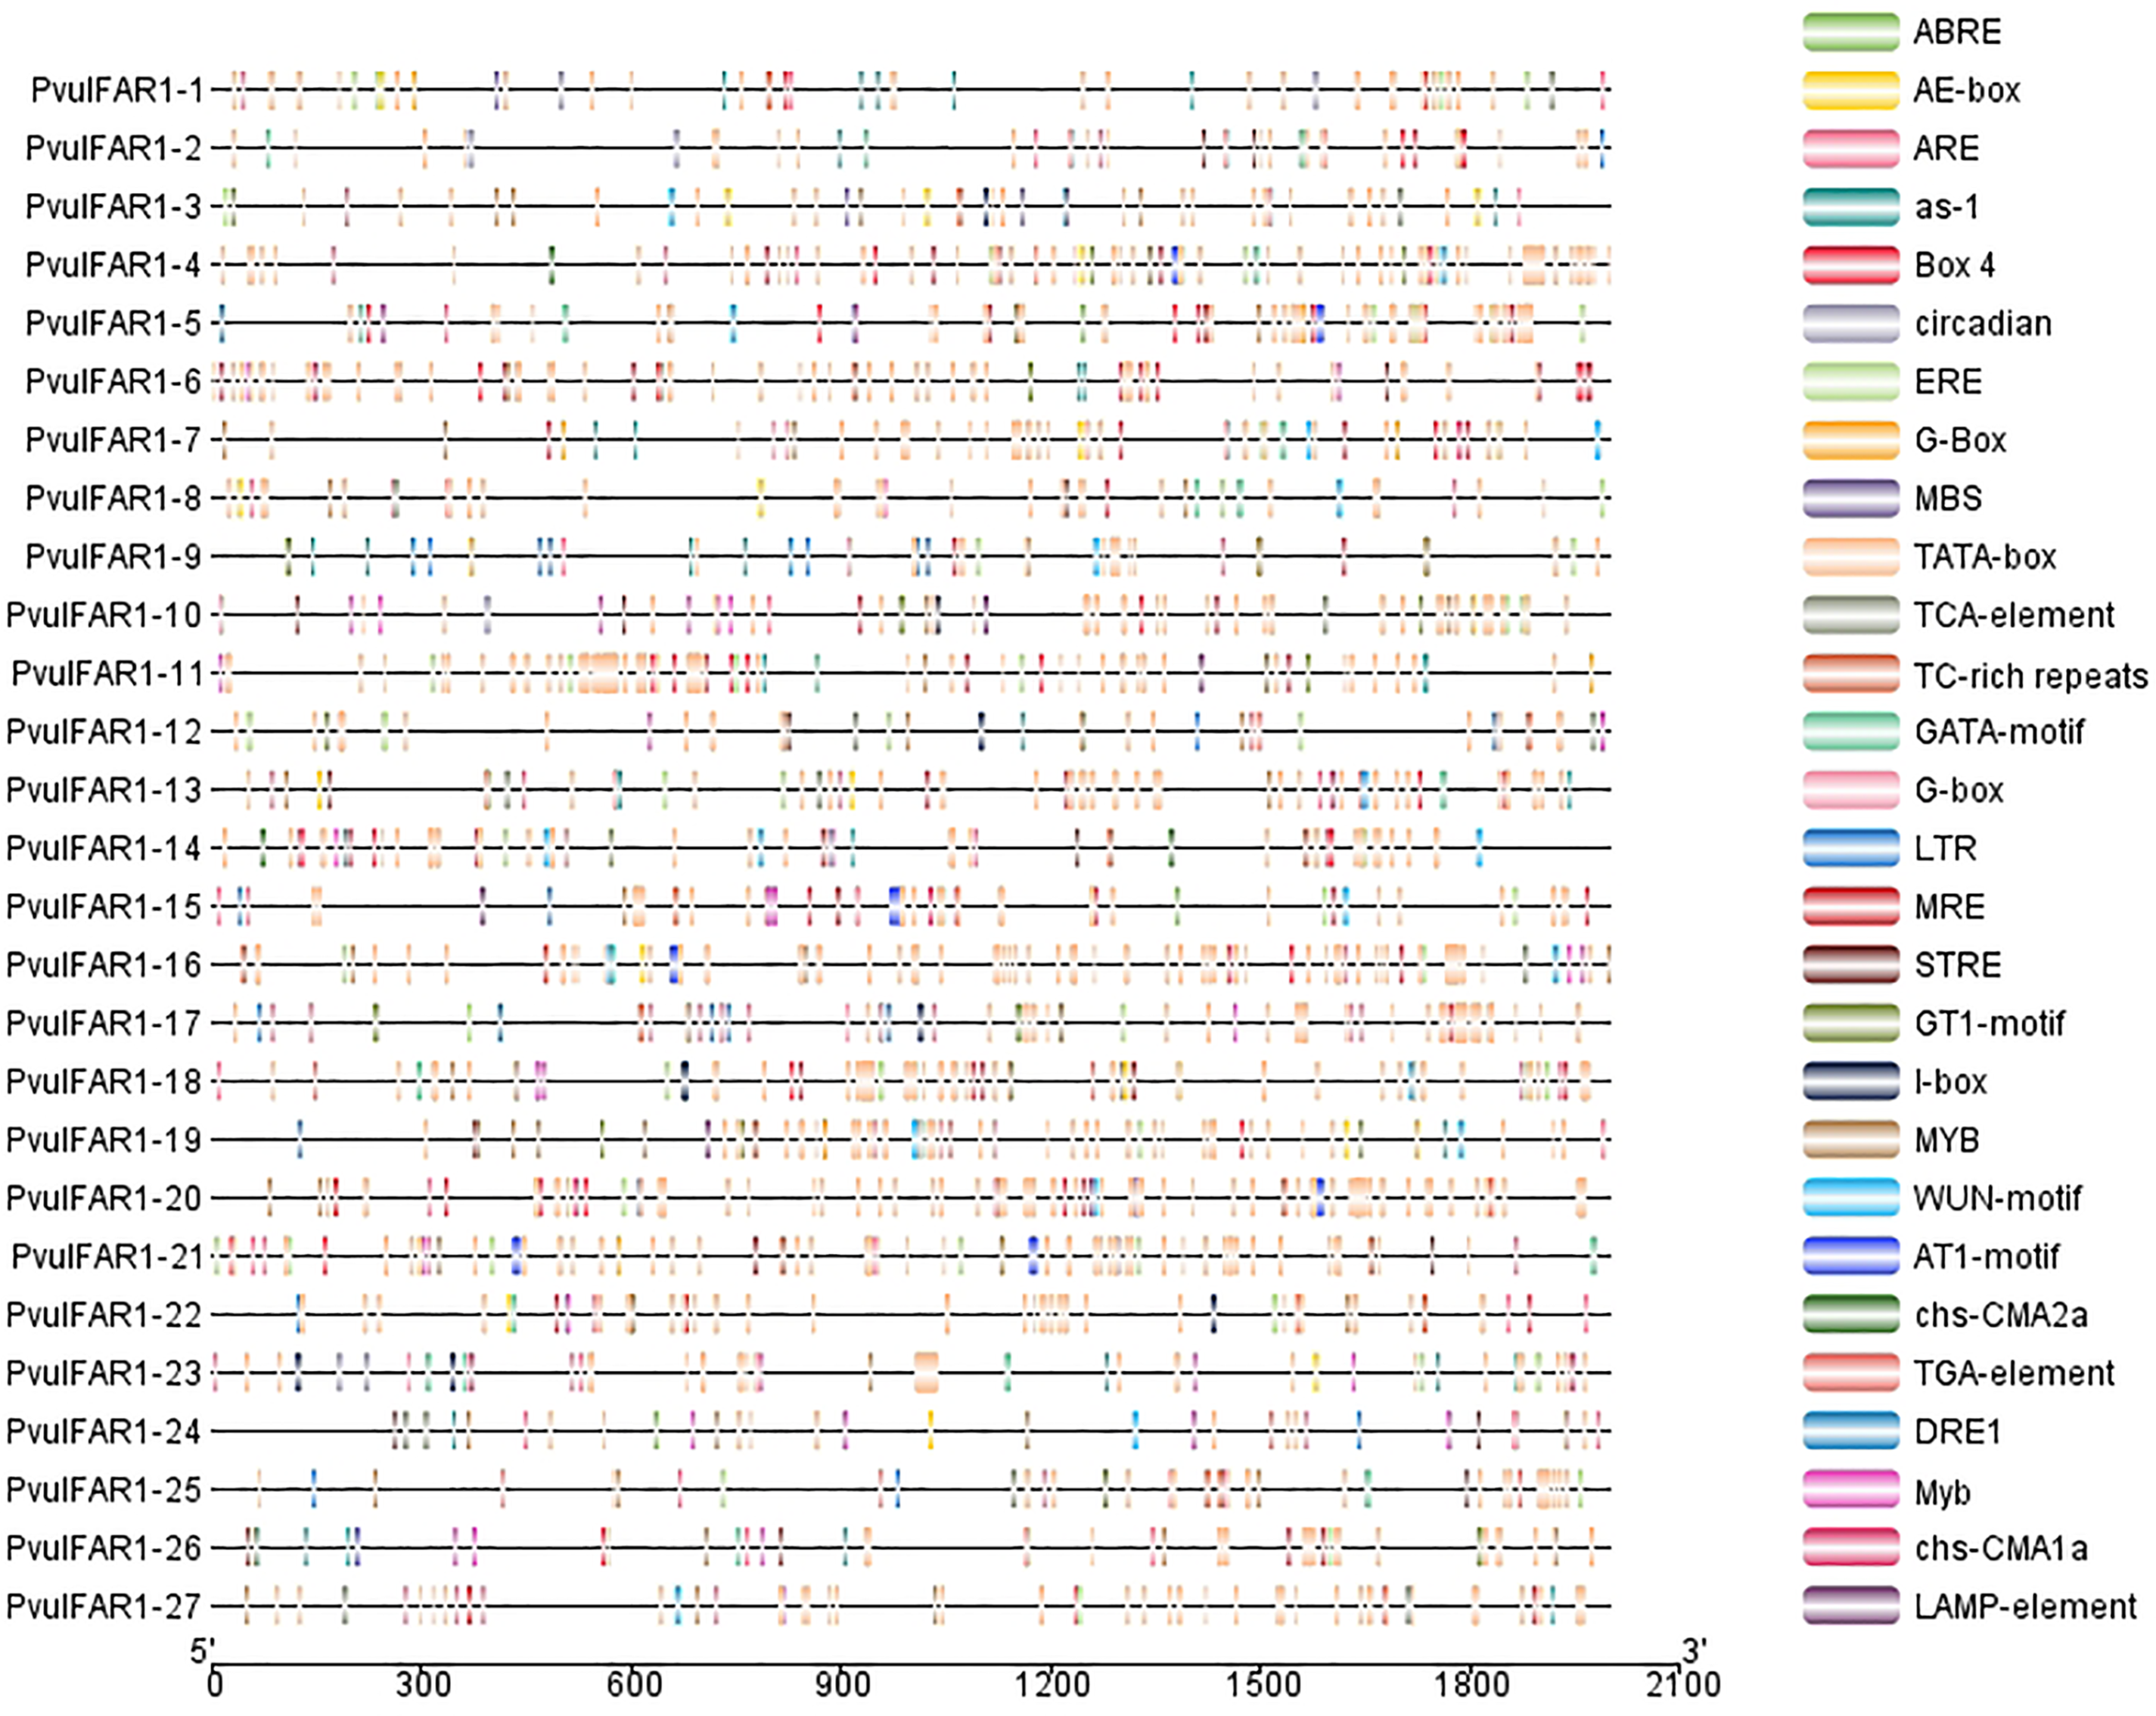
Figure 6: PvulFAR1 cis-acting element analysis
3.7 In Silico Analysis of Gene Expression for FAR1 Genes in Response to Various Stress Conditions in P. vulgaris
We generated a heat map using RNAseq data to analyze drought and salt stress (Fig. 7). The expression profiles of PvulFAR1 genes showed that the levels of expression of PvulFAR1-16 and PvulFAR1-17 genes went up in response to both drought and salt stress. On the other hand, we found that both stress conditions reduced the expression levels of the PvulFAR1-4 and PvulFAR1-5 genes. Drought stress significantly elevated the expression level of the PvulFAR1-1 gene, while salt stress significantly reduced it. The different expression profiles show that FAR1 genes react in different ways to different types of environmental stress.
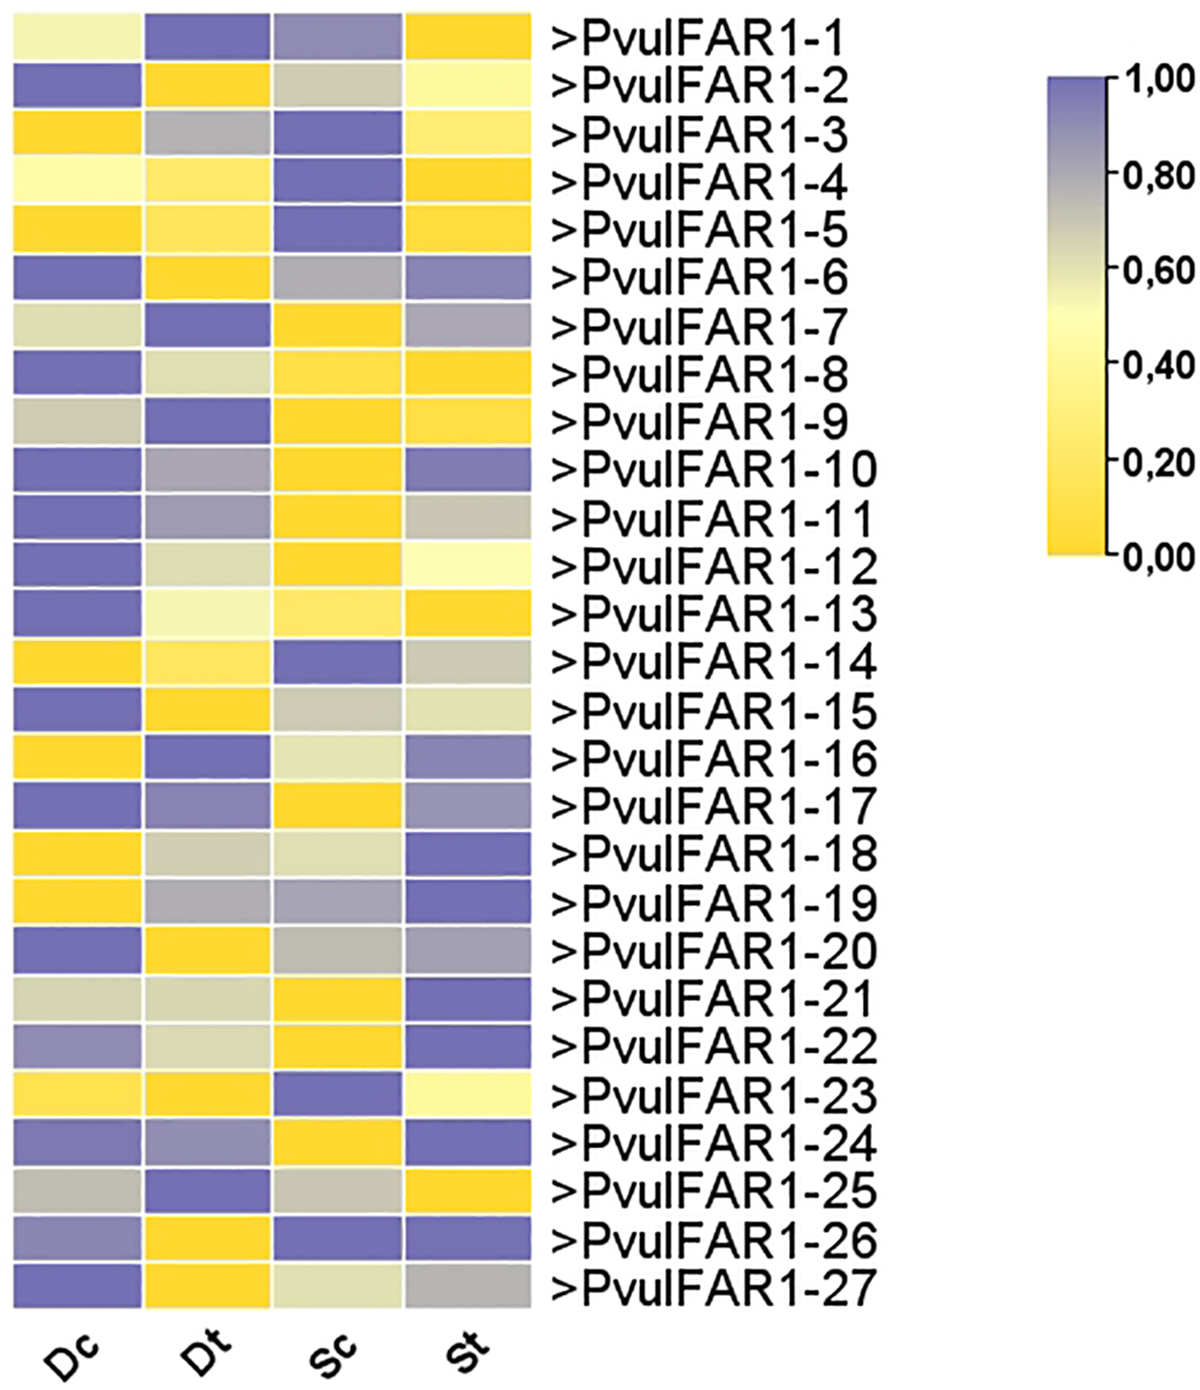
Figure 7: Expression analysis of FAR1 gene family members in bean
3.8 Gene Ontology Analysis and Protein-Protein Interactions of PvulFAR1 Proteins
Gen Ontology (GO) analyses of FAR1 genes in beans were performed using protein sequences obtained from the Phytozome v13 database and the STRING online browser with default parameters. The participation rates of these genes in cellular components, biological processes, and molecular functions were determined.
The result of molecular function enrichment analysis of the chosen gene set revealed several significant functional domains, particularly focusing on metal ion interactions (Fig. 8A). The term with the highest enrichment was GO:0008270 (Zinc ion binding), comprising 18 of 661 genes, with the highest enrichment score of 3.17, a gene ratio of 1.39, and a remarkably low FDR value of 2.11 × 10⁻¹⁸. This significant enrichment highlights a clear functional relationship between the selected genes and zinc-dependent molecular mechanisms. Furthermore, GO:0046872 (Metal ion binding) exhibited significant enrichment (22 out of 4213 genes), with a moderate gene ratio of 0.67 and an enrichment score of 0.83 (FDR = 2.89 × 10⁻⁹). This term, while encompassing a wider range, reinforces the prevailing trend of ion-binding activity within the gene set, indicating a general affinity for metal ions that may play structural or catalytic roles in cellular processes. At last, the broader category GO:0005488 (Binding) included 27 out of 14,897 reference genes. Nevertheless its reduced gene ratio (0.21) and enrichment score (0.24), the term retained marginal significance (FDR = 0.0248), presumably owing to its elevated background frequency and functional generality. Its presence further substantiates the hypothesis that a significant proportion of the genes participate in diverse binding interactions.
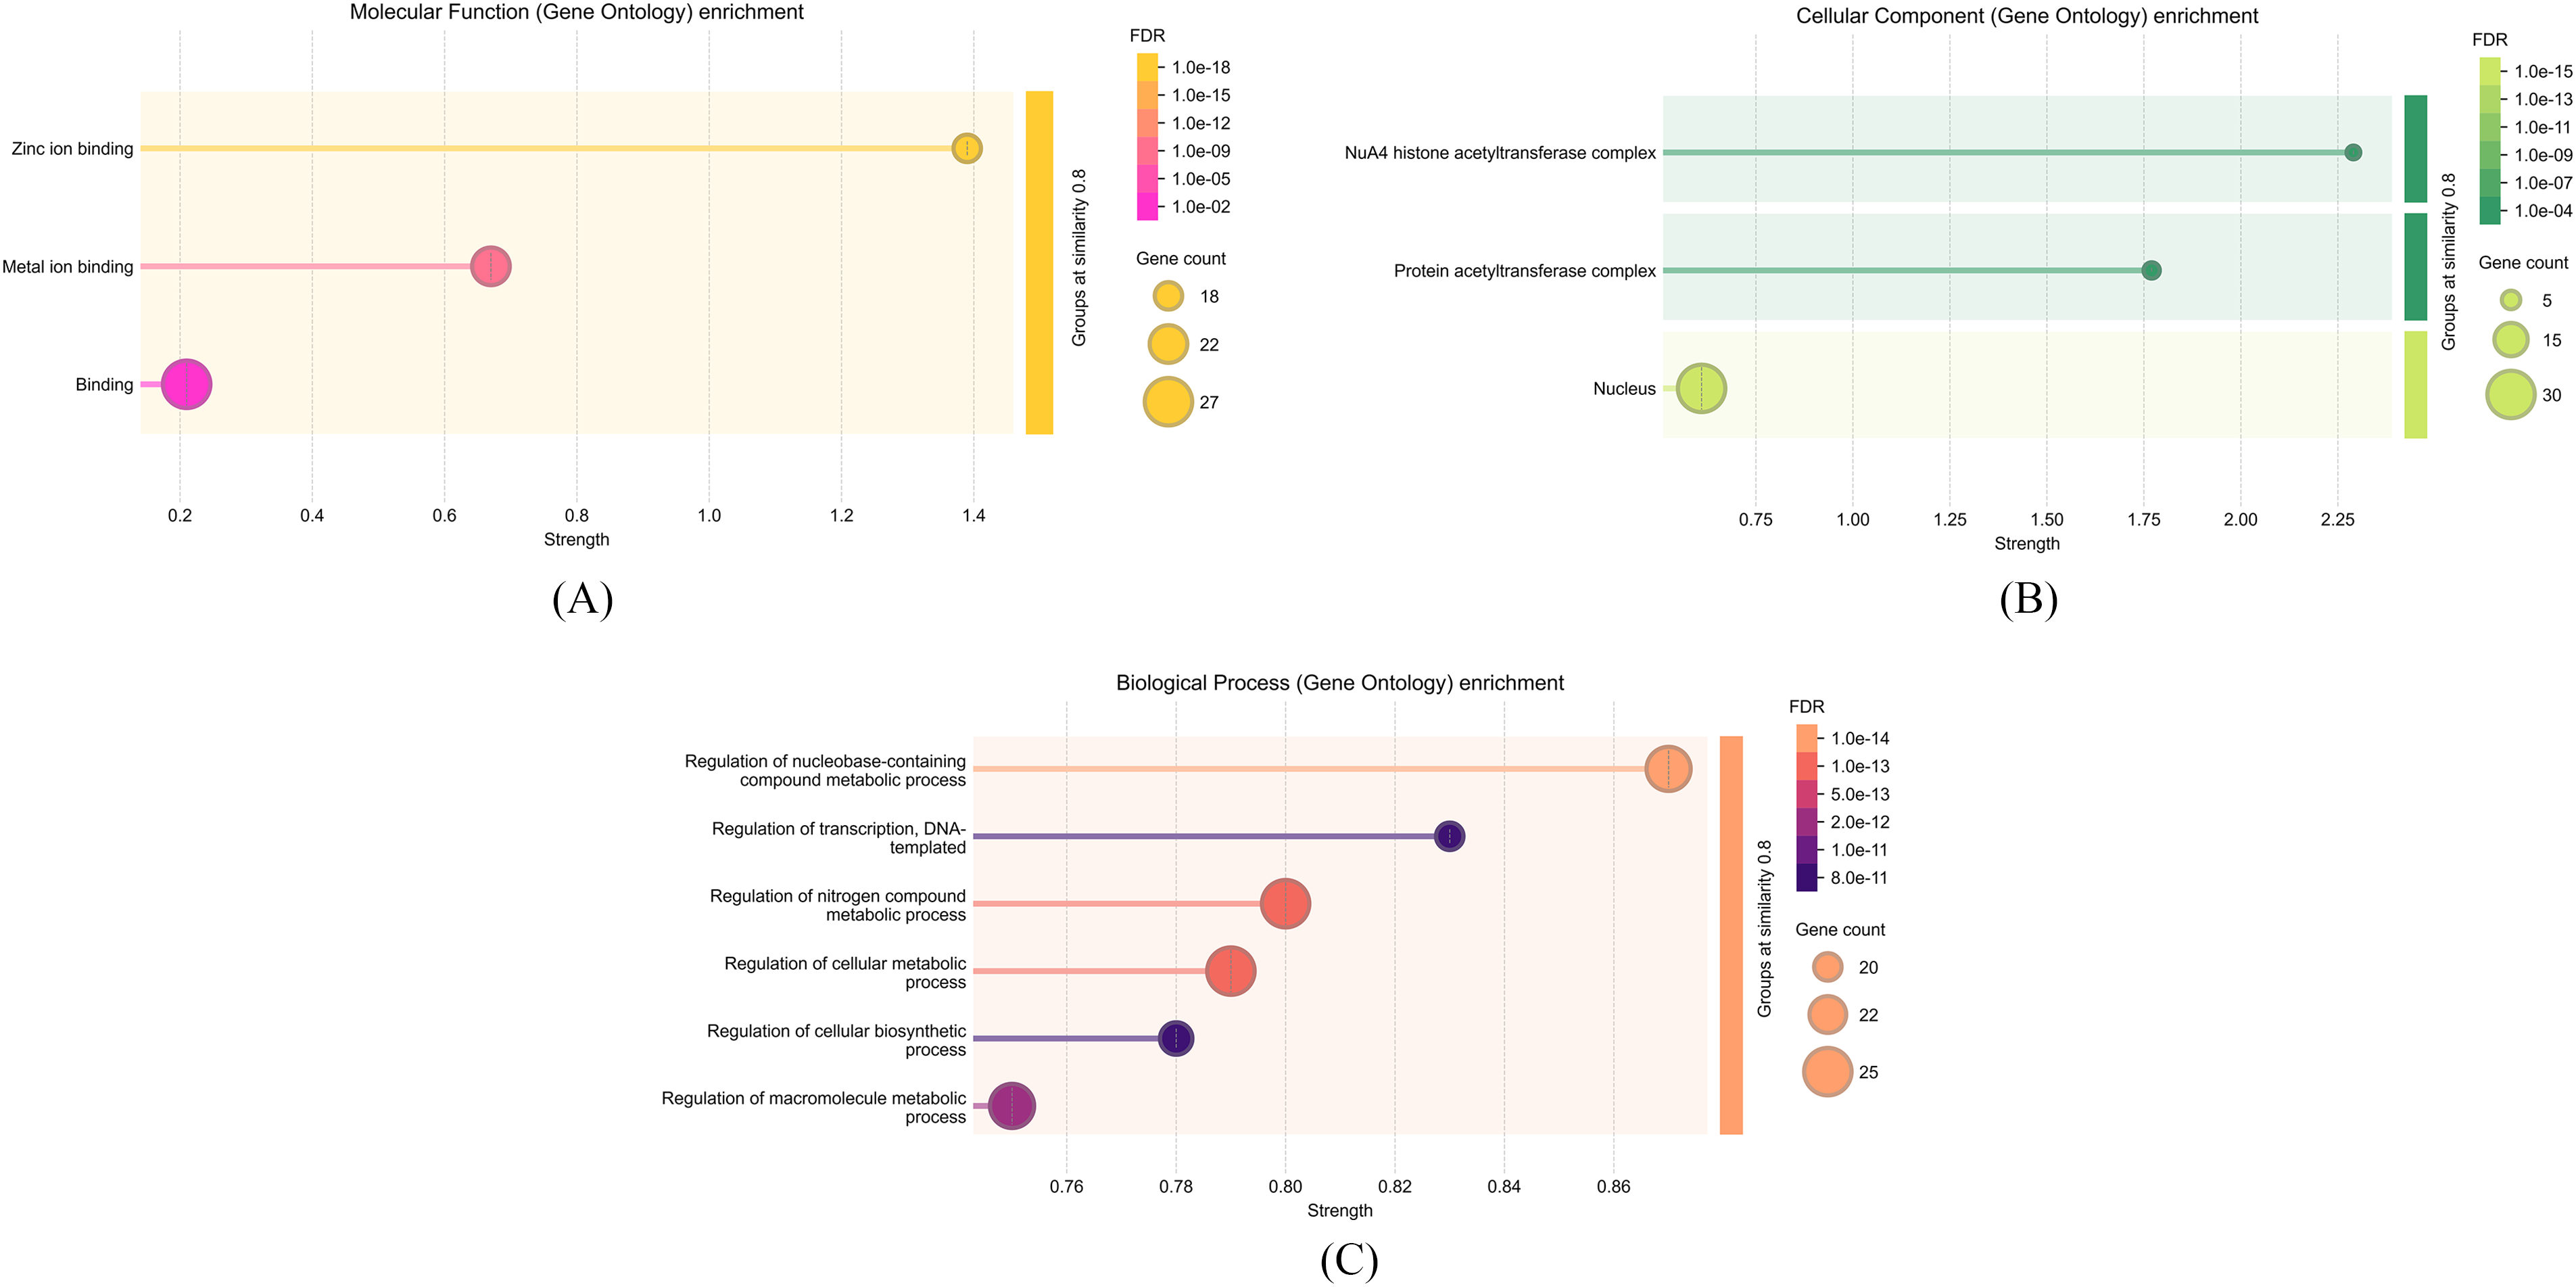
Figure 8: The figure illustrates the molecular functions, cellular components, and biological processes associated with the PvFAR1 gene
The enrichment analysis of cellular component terms demonstrated that the selected genes are significantly associated with nuclear and chromatin-related complexes, indicating a robust subcellular localization pattern connected to transcriptional regulation and epigenetic control (Fig. 8B). Among the most enriched GO terms, GO:0035267 (NuA4 histone acetyltransferase complex) exhibited the highest enrichment score of 1.56, despite being derived from a relatively limited gene count (3 out of 14 in the background set). The gene ratio of 2.29 and the minimal FDR value (0.00011) highlight the statistical validity of this discovery. This complex is believed to be involved in histone acetylation, chromatin remodeling, and the regulation of gene expression. Likewise, GO:0031248 (Protein acetyltransferase complex) was identified as significantly enriched (4 of 61 genes), exhibiting a gene ratio of 1.77, an enrichment score of 1.44, and an identical FDR (0.00011). The intersection of these two complexes indicates a common functional structure, highlighting the role of acetyltransferase activity in the cellular functions of the chosen genes. Conversely, the more encompassing GO term GO:0005634 (Nucleus) encompassed a greater subset of genes (30 of 6596), and despite its lower gene ratio (0.61), it exhibited a remarkably high level of statistical significance (FDR = 3.02 × 10⁻¹⁵), underscoring the pivotal role of nuclear localization throughout the dataset. This indicates that most of the examined genes operate within the nuclear compartment, thereby supporting their presumed roles in gene regulation, chromatin dynamics, and possibly DNA repair mechanisms.
The functional enrichment analysis identified biological processes associated with the selected 25 genes, resulting in the definition of six significant GO terms (Fig. 8C). The acquired data indicate that most genes participate in regulating fundamental cellular metabolic processes, including nucleotides, nitrogen, macromolecules, and transcription.
The greatest enrichment was noted in the GO:0019219 term, “Regulation of nucleobase-containing compound metabolic process”. A total of 24 genes from this category were identified from 2942 reference genes. This term exhibits a statistically significant value with a ratio of 0.87, an enrichment score of 1.3, and a false discovery rate (FDR) of 1.91 × 10⁻¹⁴. The terms GO:0051171 and GO:0031323, each comprising 25 genes, exhibit comparable ratios (0.8 and 0.79) and enrichment scores (1.14 and 1.13), suggesting that the regulation of nitrogen compounds and cellular metabolism is significant within the examined gene set. The term GO:0006355 (Regulation of transcription, DNA-templated), indicative of transcriptional regulation, demonstrates considerable significance with an FDR of 7.94 × 10⁻¹¹, despite being associated with only 20 genes. This signifies that the gene set is especially engaged in regulating DNA-dependent transcriptional mechanisms. Additional processes, including GO:0031326 and GO:0060255, also indicate macromolecular and biosynthetic metabolic processes, which are significantly represented within the gene set (Fig. 8C).
The protein–protein interaction (PPI) network analysis of the PvulFAR1 family identified a highly interconnected network comprising 32 proteins, which includes both PvulFAR1 isoforms and central interaction hub proteins (Fig. 9). The network, depicted through STRING with functional GO annotations, indicates that FAR1 proteins in P. vulgaris are probably components of a coordinated regulatory module engaged in transcriptional regulation and signal transduction. The functional annotation through color-coding indicated that most PvulFAR1 proteins are concurrently linked to three principal characteristics: (1) Zinc ion binding (GO: 0008270, blue)—signifying that these proteins possess zinc-finger motifs, characteristic of DNA-binding transcription factors, (2) Localization to the nuclear lumen (GO: 0031981, green)—reinforcing their involvement in nuclear signaling or transcriptional regulation, and (3) Participation in the regulation of nucleobase-containing compound metabolic processes (GO: 0019219, red)—emphasizing their regulatory role in nucleotide metabolism and gene expression.
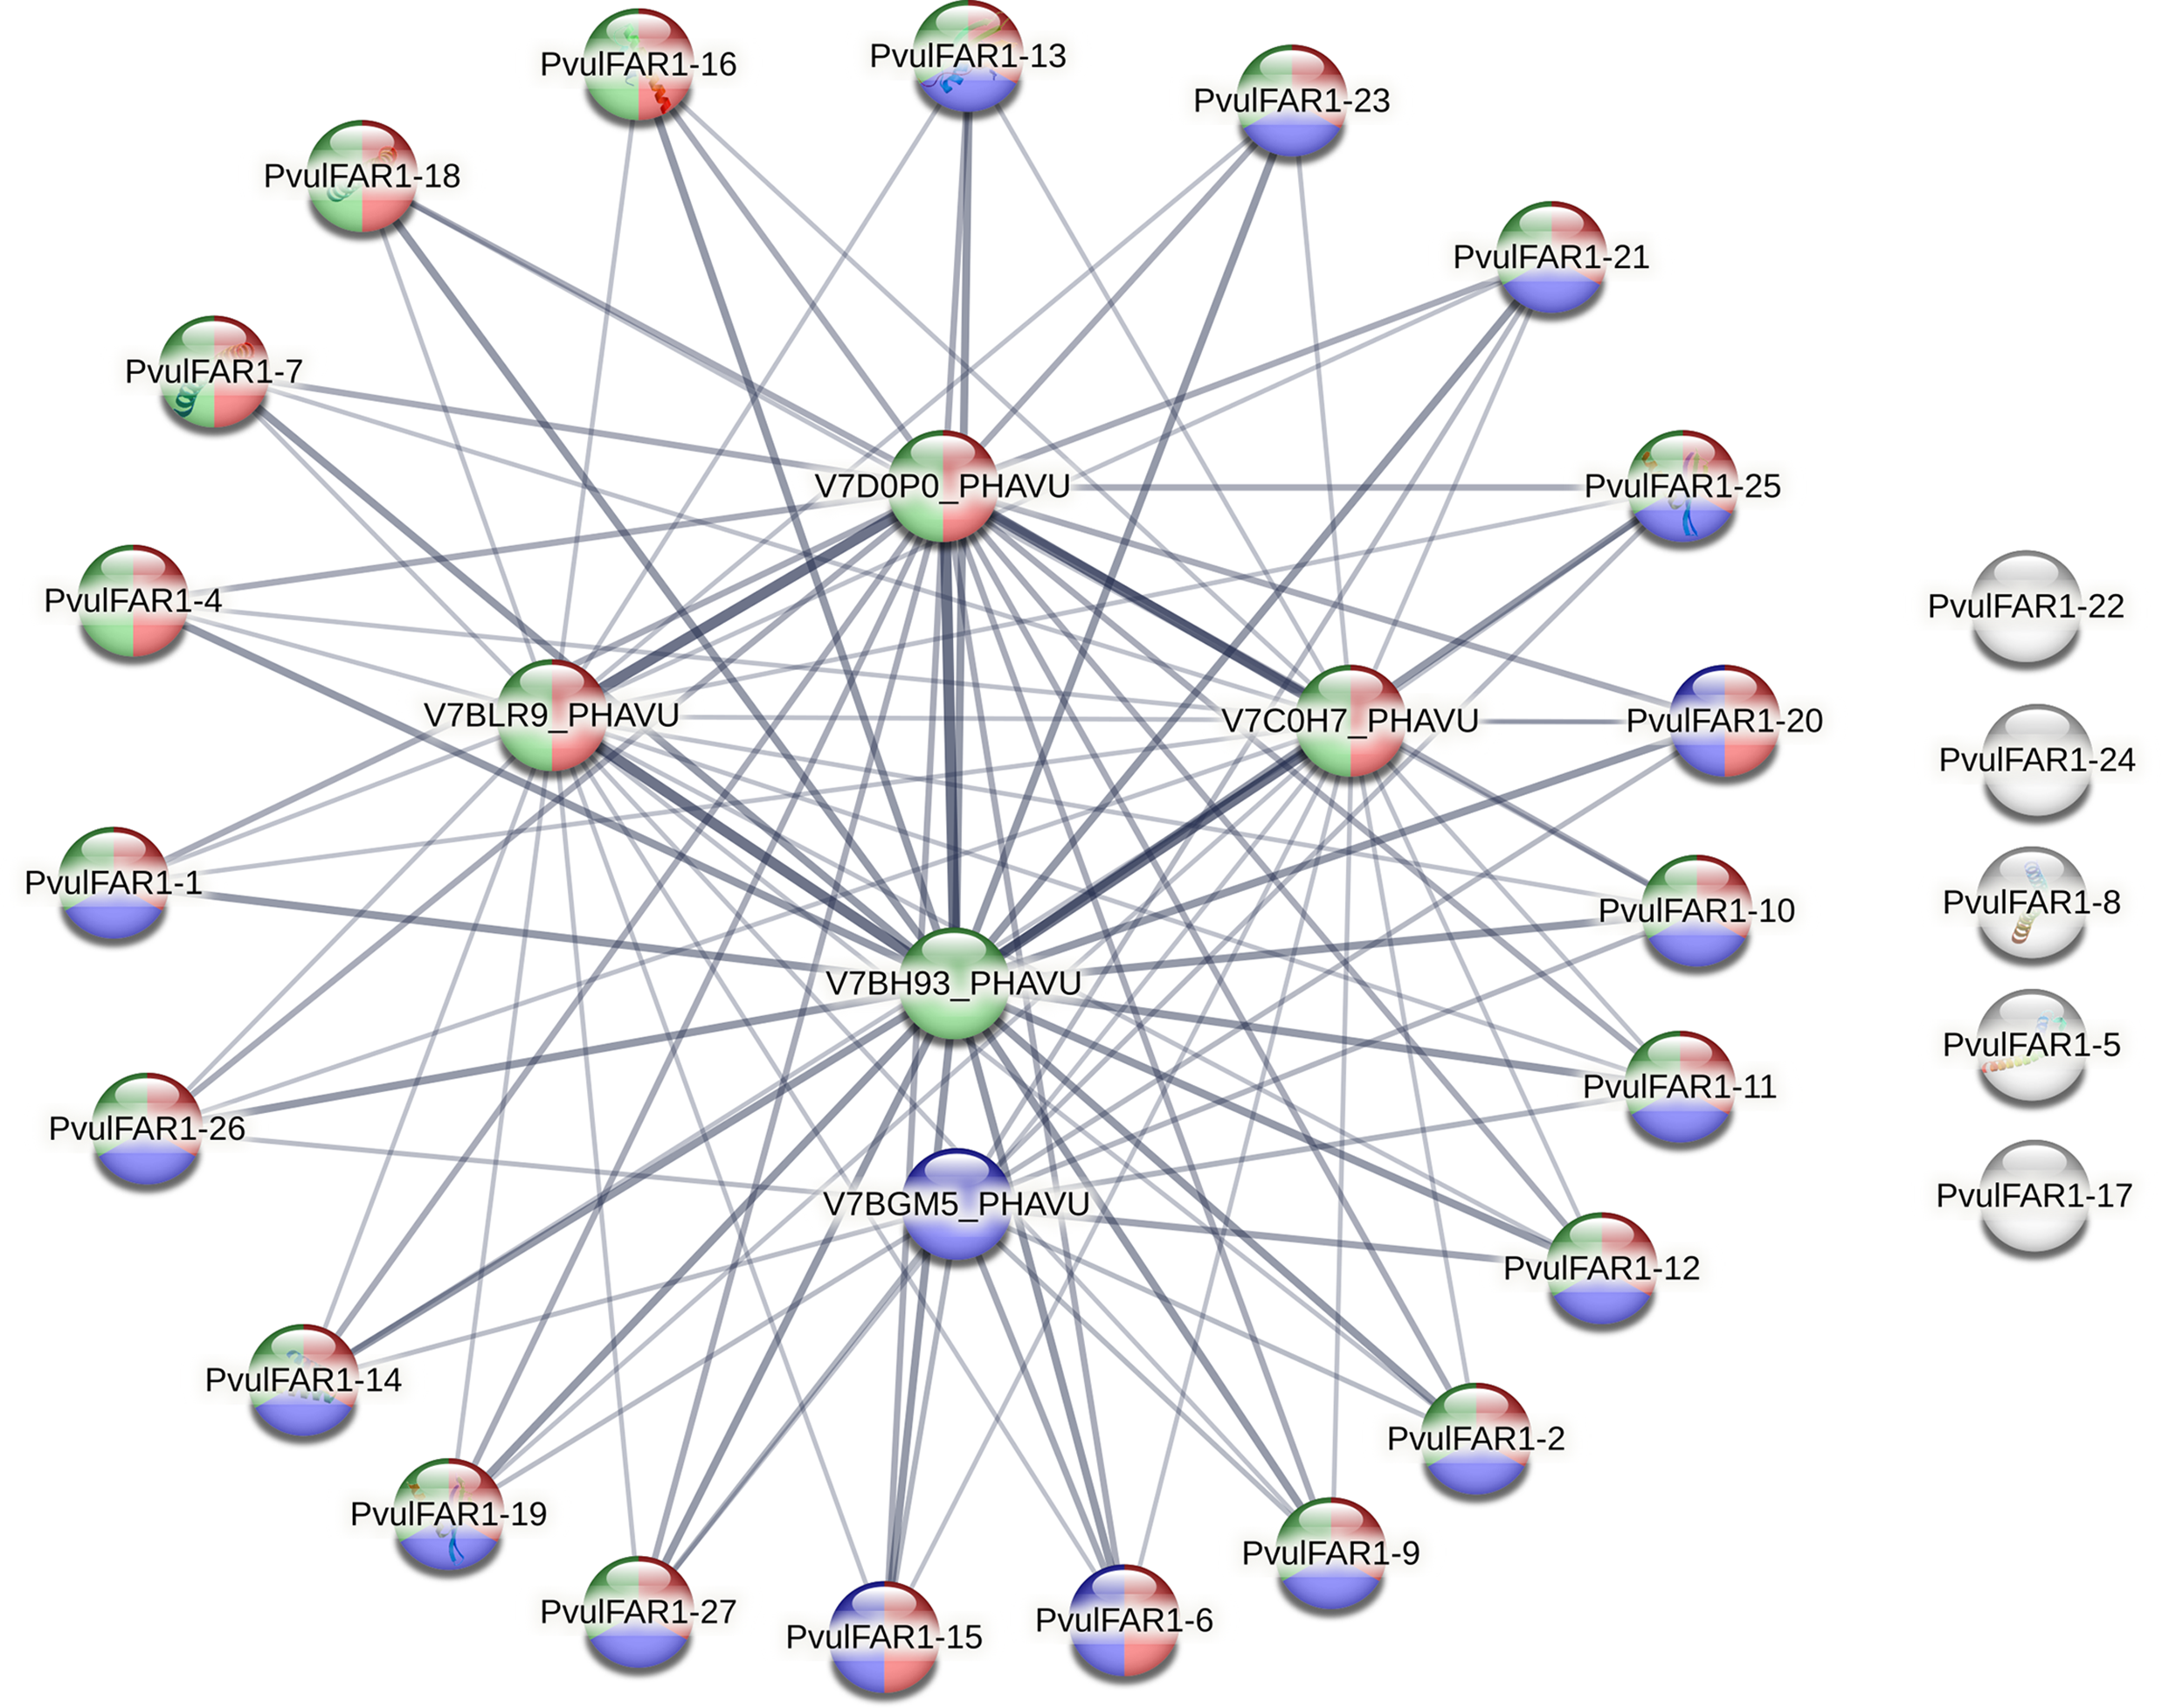
Figure 9: Protein-protein interactions of PvulFAR1 proteins
Proteins including PvulFAR1-1, -2, -4, -6, -7, -10, -11, -12, -14, -15, -19, -20, -21, -23, -25, and -27 exhibited overlapping functional colors, indicating multifunctionality. These proteins are pivotal to the network and demonstrate robust interactions with core hub nodes such as V7D0P0_PHAVU, V7BLR9_PHAVU, V7C0H7_PHAVU, V7BH93_PHAVU, and V7BGM5_PHAVU (Table S3), which presumably function as integrative scaffold proteins or upstream regulators (Fig. 9).
A specific subset of PvulFAR1 proteins—comprising PvulFAR1-5, -8, -17, -22, and -24—was identified on the periphery or isolated from the primary interaction cluster. These proteins predominantly lack annotated GO terms or exhibit only a singular function (usually weak or absent nuclear localization), suggesting either a specialized, non-redundant role or inadequate data resulting from limited experimental annotation.
3.9 Quantitative Real-Time (qRT-PCR) Analyses of FAR1 Genes
Specific primers were designed for the PvulFAR1-1, PvulFAR1-4, PvulFAR1-10, PvulFAR1-16, PvulFAR1-19, PvulFAR1-22, and PvulFAR1-24 genes, and qRT–PCR analyses were subsequently performed. These analyses were conducted on two bean cultivars, Elkoca-05 and Serra, which were subjected to treatments with 150 mM salt and 20% PEG6000 to assess changes in PvulFAR1 gene expression. Previous research [39] reported that the Elkoca-05 cultivar exhibits greater resistance compared to the Serra cultivar.
This study employed two different approaches to treatment to explore whether the cultivars respond differently to stress conditions. The expression levels of the seven PvulFAR1 genes were examined under both control conditions (0 mM salt) and salt stress conditions (150 mM salt) (Fig. 10). In the Elkoca-05 cultivar, salt stress induced a significant increase in the expression of the PvulFAR1-10, PvulFAR1-16, PvulFAR1-19, PvulFAR1-22, and PvulFAR1-24 genes relative to the control, while the remaining genes showed no substantial changes. In contrast, salt stress did not result in a significant upregulation of PvulFAR1 gene expression in the Serra cultivar (Fig. 10).
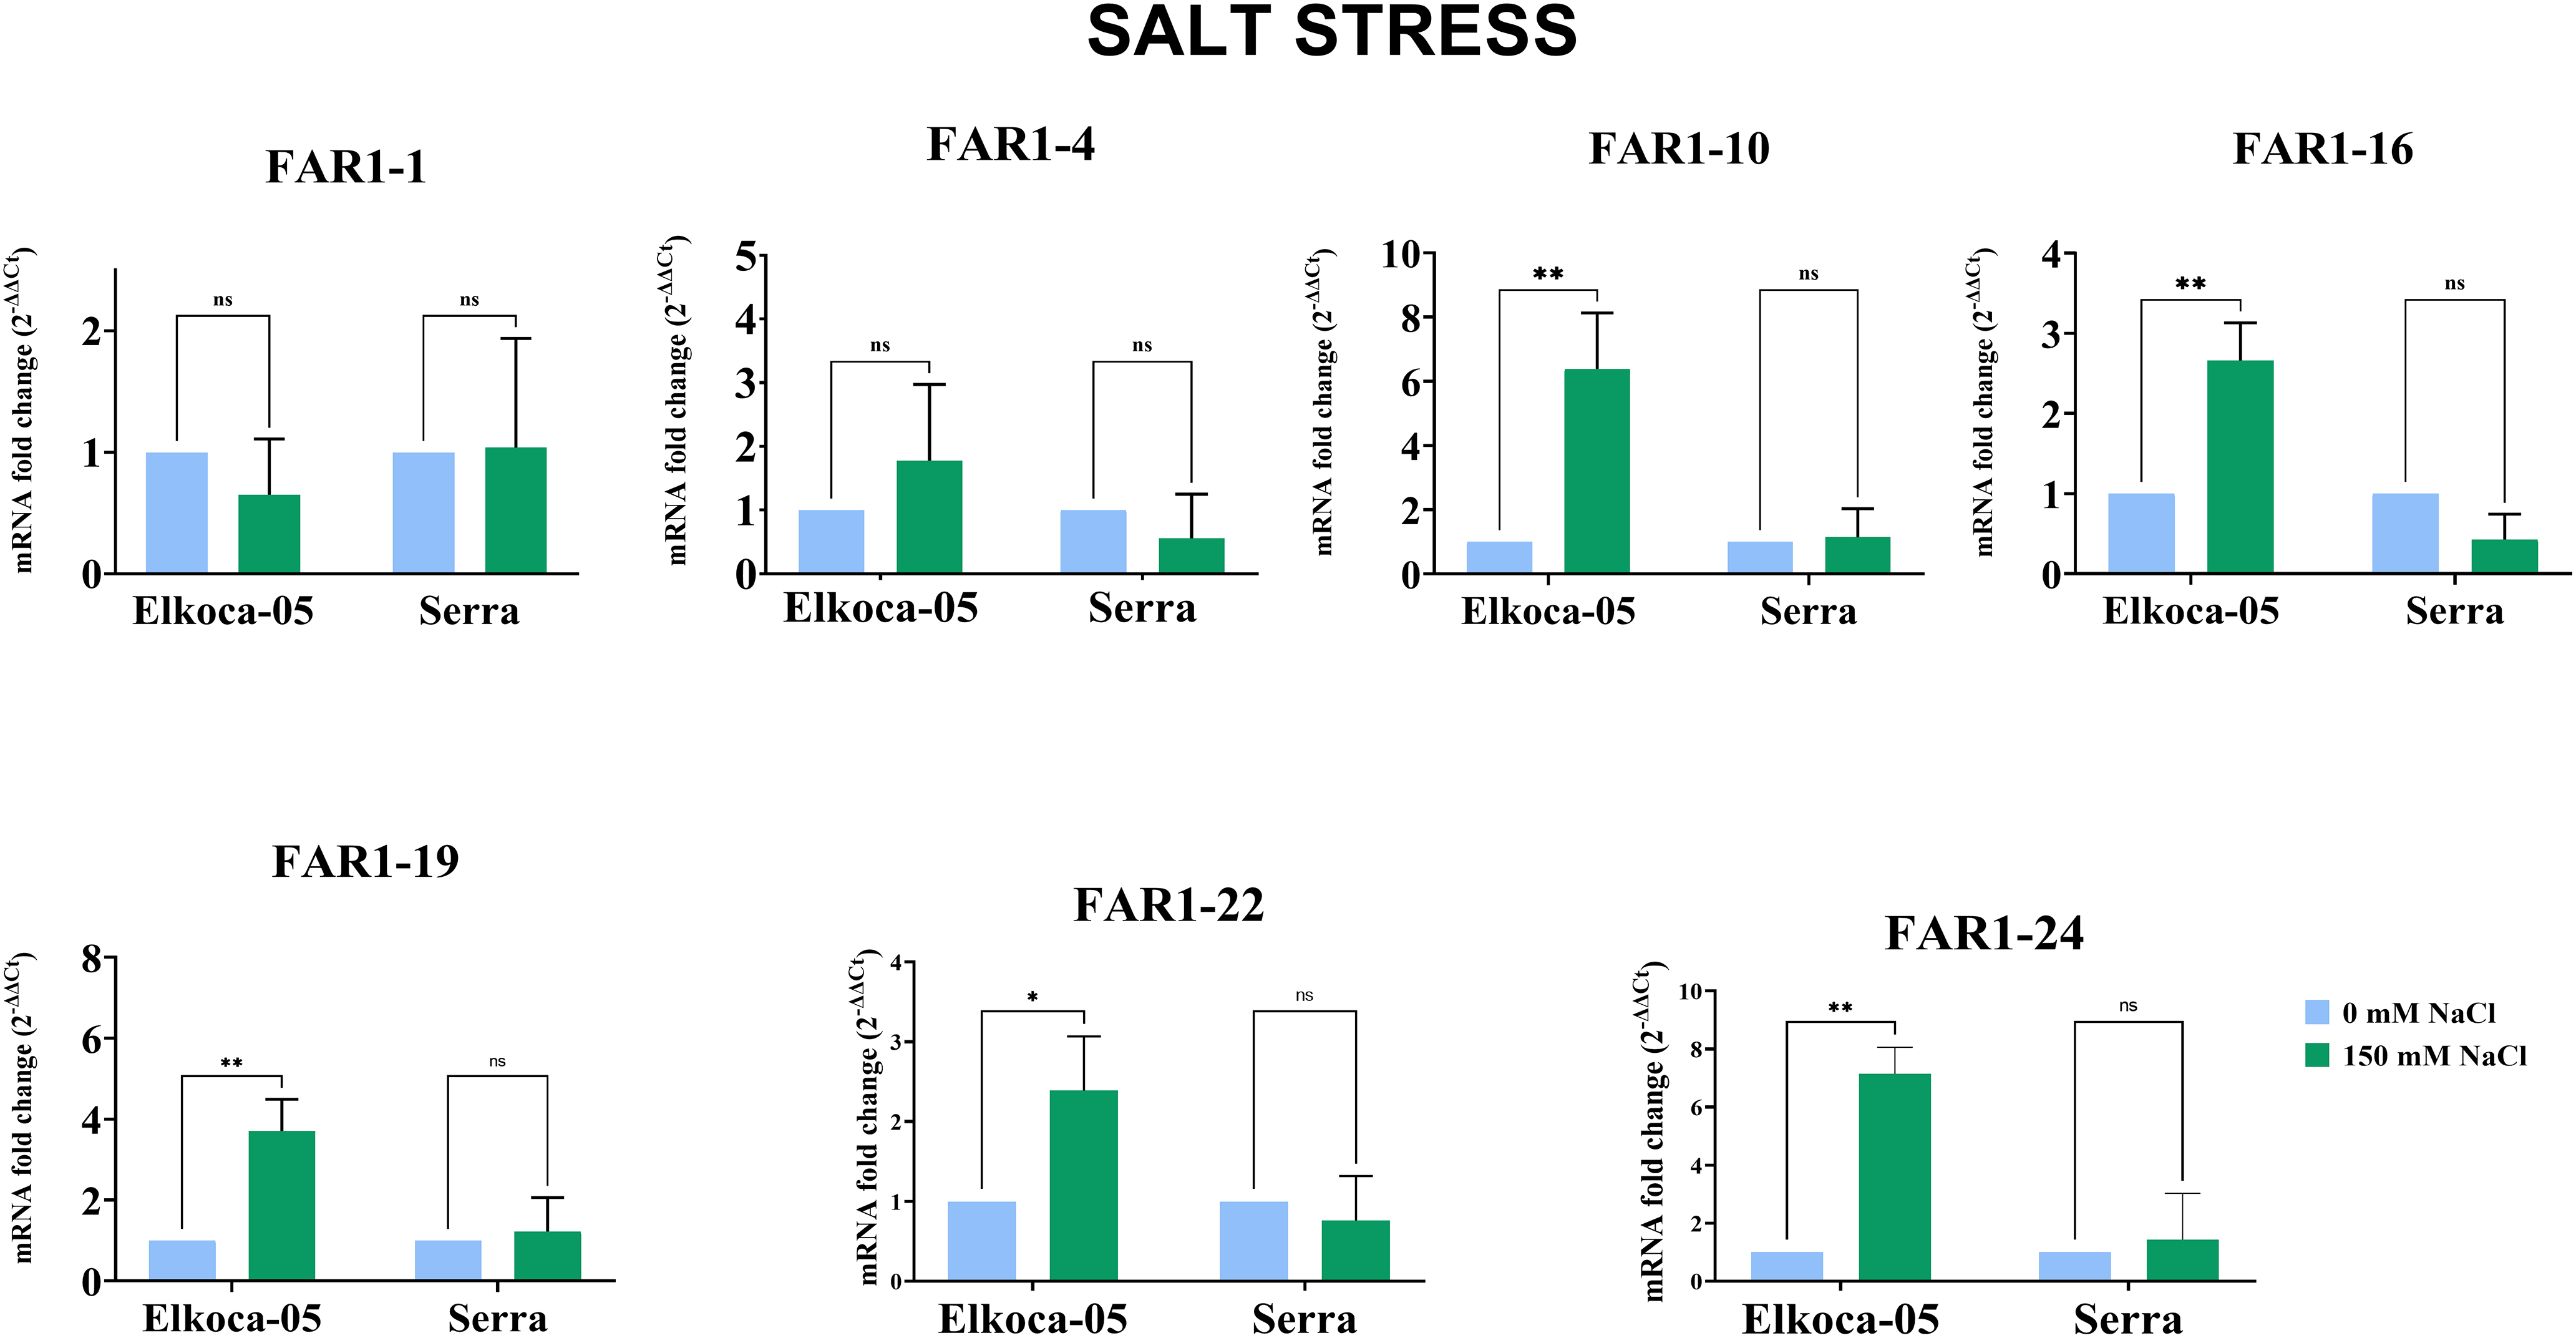
Figure 10: Plots illustrating the expression levels of PvulFAR1 genes in two cultivars, Elkoca-05 and Serra, under conditions of salt stress (The bars denote the mean ± standard error (n = 3). Substantial differences between the control and treatment groups were assessed using the Dunnett test (*p < 0.05, **p < 0.01, ns: non-significant))
Thus, the qRT–PCR results indicate that, under salt stress, the PvulFAR1-10, PvulFAR1-16, PvulFAR1-19, PvulFAR1-22, and PvulFAR1-24 genes respond consistently in the Elkoca-05 cultivar, whereas their response in the Serra cultivar varies. The results demonstrated that the gene expression levels and patterns observed in the RNA-Seq profile were consistent with those obtained through qRT-PCR analysis.
Under drought stress conditions, both cultivars were treated with 0% PEG (control) and 20% PEG (Fig. 11). For the Serra cultivar, no significant differences in PvulFAR1 gene expression were detected when compared to the control. In contrast, the Elkoca-05 cultivar exhibited a pronounced increase in the expression levels of the PvulFAR1-4 and PvulFAR1-10 genes following the 20% PEG treatment, while the expression of the other FAR1 genes remained largely unchanged (Fig. 11). Additionally, qRT-PCR analysis confirmed that the expression of the PvulFAR1-10 gene was significantly upregulated in response to both salt and drought stress.
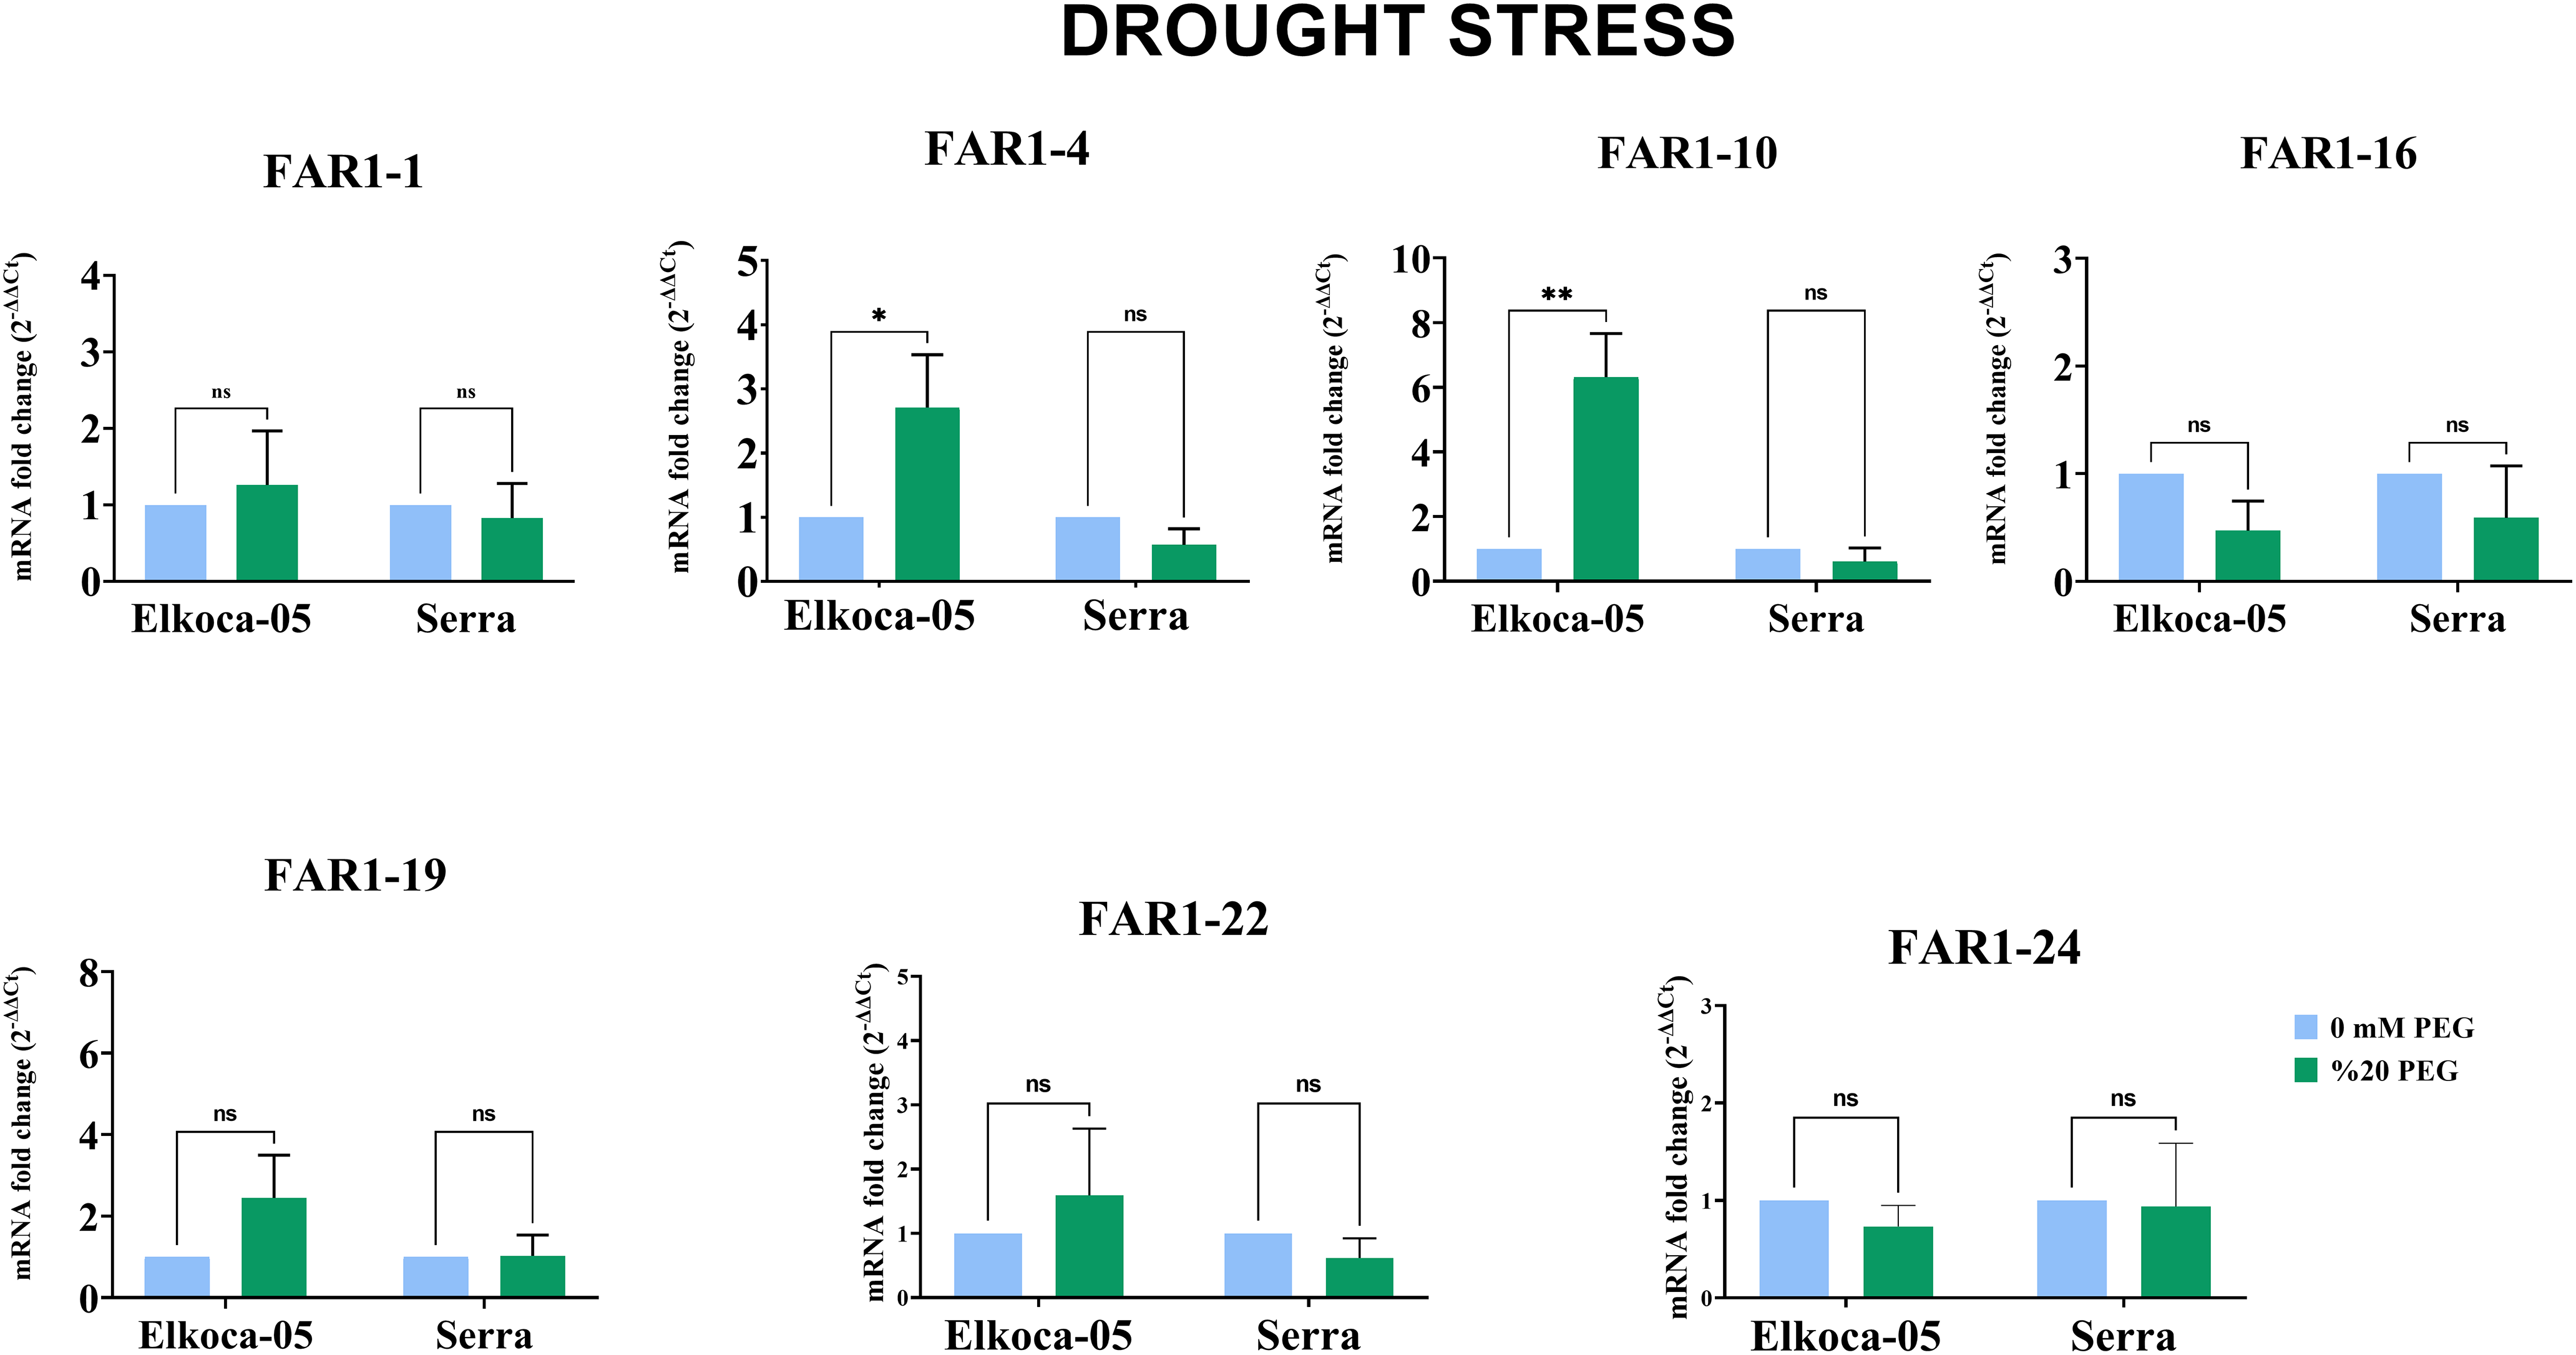
Figure 11: Plots illustrating the expression levels of PvulFAR1 genes in two cultivars, Elkoca-05 and Serra, under conditions of drought stress (The bars denote the mean ± standard error (n = 3). Substantial differences between the control and treatment groups were assessed using the Dunnett test (*p < 0.05, **p < 0.01, ns: non-significant))
FAR1 is widely recognized as a founding member of the FRS family and serves as a critical transcription factor that modulates various cellular processes by activating or repressing specific target genes. While numerous target genes under FAR1’s transcriptional regulation have been identified, only a select few have been comprehensively characterized [42–45]. This observation suggests that FAR1 may have a broader and more essential role in biological systems than previously understood. Consequently, a thorough investigation of the FRS family proteins is essential to fully elucidate the significance of these transcription factors in plant processes [46].
The FAR1 gene was first found in A. thaliana as an important part of the phyA-mediated far-red light signaling pathway. Its full set of functions were then elucidated [47]. Researchers have explored the scope of FAR1 family genes in various other plant species. For instance, a total of 25 members have been identified in tea (Camellia sinensis), 20 in potato (Solanum tuberosum), 61 in walnut (Juglans sigillata L.), 20 in cucumber (Cucumis sativus), 246 in peanut (Arachis hypogaea), and 20 in pepper (Capsicum annuum) [7,10,18,19,48]. Within this study, 27 members of the FAR1 family were found in P. vulgaris, and the traits and roles of these genes were carefully examined.
Ten chromosomes contain the FAR1 genes, with chromosomes 5 and 6 having the highest concentration. Additionally, a region of tandem duplication was identified within the genome (Fig. 1). Additionally, a tandem duplication of one gene pair (PvulFAR1-10 and PvulFAR1-11) from the FAR1 genes has occurred, and these genes may have undergone functional diversification to adapt to different environmental conditions. Accordingly, it is thought that one gene may remain involved in light signaling, while the other may be specialized for stress response. Another possibility is that these genes may continue to serve the same function in different regions [49,50]. Tandem and segmental duplications are recognized for their significant contribution to the functional diversification of gene families and the adaptive mechanisms in plants [51]. Three tandem duplications have been identified in potato, suggesting that these genes may share similar functions across various biological processes [10]. Comparable alterations were observed between conserved motifs and gene structures (Fig. 2). The results indicate that FAR1 proteins are present not only in monocotyledonous plants but also across a diverse range of plant species. This observation suggests that the FAR1 protein family has remained evolutionarily conserved throughout the plant kingdom [52], implying that these proteins likely play critical and specialized roles in plant growth and development. Furthermore, a detailed examination of conserved regions within the bean gene family revealed that these genes harbor domains associated with both FAR1 and the broader FAR1 superfamily, exhibiting similar gene structures.
Phylogenetic analyses showed that FAR1 genes were split into three groups: A, B, and C. These groups were found in bean, A. thaliana, and G. max species (Fig. 3). PvulFAR1 genes showed high similarity to FAR1 genes within the Fabaceae family, especially in closely related species such as Glycine max. This suggests that PvulFAR1 genes are derived from a common ancestor and follow a conservative evolutionary path at the family level. Previous studies show that the FAR1 genes are more different between Arachis and G. max than they are between different species of Arachis [7]. The potato StFRS subfamily exhibits similarities to those found in Arabidopsis and tomato, indicating a degree of evolutionary conservation and the possibility of analogous functions [10]. The phylogenetic evolutionary tree shows that many FAR1 members have orthologous pairs, which means that these genes may have similar biological functions.
Response mechanisms to light and abiotic stresses are not independent of each other. FAR1 genes interact with pathways that regulate reactive oxygen species (ROS) balance in the cell via photoreceptors activated by light signals. This may play a role in preventing oxidative damage that may occur during stresses such as drought and salinity [46]. Furthermore, FAR1 members may cross-talk with ABA signaling, which increases during abiotic stress, to regulate responses such as stomatal closure and root development according to light conditions [10,53]. Analysis of cis-acting elements revealed that the FAR1 gene family encompasses multiple regulatory elements linked to light, hormones, and stress responses, including the G-box, ABRE, TGA-element, and CGTCA-motif (Fig. 6). The findings suggest possible roles of FAR1 genes in photoreceptive responses and various biological functions. The fact that the promoters of the FAR1/FHY3 gene family are rich in stress-related cis-elements such as ABRE, DRE, MYB, Box-4, and low-temperature responsiveness (LTR) suggests that these genes may be important functional indicators in the regulation of genes responding to environmental stresses such as salt and drought [54–56]. This, coupled with the downregulation observed in root tissue under drought conditions, particularly in maize, as in the case of ZmFAR genes, suggests that this gene family has roles in regulating stress responses [55]. This suggests that the ZmFAR promoter regions are enriched in drought-responsive cis-elements, suggesting that these genes may be involved in drought response mechanisms in maize [55]. Promoter analysis of the FAR1/FHY3 genes in Eucalyptus grandis revealed that light-related cis-elements such as the G-box and Box-4 play a role in the photoreceptive response. A potential relationship between the photoreaction and salt and heat stress responses has also been noted [57]. Han et al. [58] specifically identified motifs such as the G-box, ABRE, and ARE, suggesting that members of BnFAR1/FHY3 play regulatory roles by sensing environmental and physiological stimuli. Research has demonstrated that light plays a significant role in abiotic stress, and gene expression exhibits variations that are specific to different tissues. Lin and Wang [47] found that Arabidopsis expresses the AtFAR1 genes in its leaves, stems, and flowers. In contrast, in cotton, these genes exhibit high expression levels in leaves, while their expression in stems and thorax is comparatively low [59]. This study investigated the alterations in gene expression levels within bean leaf tissue subjected to drought and salt stress conditions (Fig. 7). The investigation showed that drought stress elevated the expression levels of numerous genes, while salt stress reduced them. On the other hand, when there was drought, the expression levels of genes that were upregulated when there was salt stress went down.
Molecular function analysis underscored the pivotal role of zinc-associated molecular functions in the biological activity of the gene set. The strong enrichment of zinc ion binding implies potential involvement in enzymatic catalysis, redox homeostasis, and transcriptional regulation processes requiring zinc as a cofactor. The remarkably low FDR values enhance the reliability and biological relevance of these associations. Zinc plays an essential role in plants, affecting various physiological and biochemical processes. It is essential for the metabolism of proteins and nucleic acids, the regulation of enzyme activity, the stabilization of protein structures, and the functioning of RNA and DNA polymerases [60,61]. Zinc plays a crucial role in the regulation of hormones, the protection against photodamage, and the maintenance of carbon dioxide levels within mesophyll cells [62,63]. Cellular component analysis revealed that the identified genes are predominantly localized within the nucleus, with significant enrichment observed in chromatin-modifying complexes. These results collectively highlight the involvement of these genes in epigenetic regulation and transcriptional control within the nuclear environment, supported by high enrichment scores and strong statistical significance. Biological process enrichment analysis indicated that the selected genes are mainly involved in the regulation of diverse metabolic activities. These data suggest that the gene set functions cooperatively to maintain metabolic homeostasis and modulate gene expression at multiple regulatory levels. Gene ratios ranged between 0.75 and 0.87, with enrichment scores between 1.02 and 1.3. These metrics indicate a functional interconnection among the genes and a higher-than-expected representation in the identified processes. The extremely low FDR values confirm the statistical robustness of the results, suggesting non-random enrichment. Collectively, these findings reinforce the role of the gene set in the regulation of essential cellular metabolic functions, supporting their integral involvement in maintaining cellular homeostasis.
The nuclear localization and zinc-binding capacity of FAR1 family transcription factor-like proteins in Phaseolus vulgaris are consistent with their proposed role in far-red light-mediated developmental regulation. The co-occurrence of GO:0008270 (zinc ion binding) and GO:0031981 (nuclear lumen) across several FAR1 proteins suggests direct regulatory activity within the nucleus via DNA interaction. These findings underscore the role of PvulFAR1 proteins as a unified set of nuclear regulators with zinc-dependent DNA-binding capabilities, presumably coordinating transcriptional responses to environmental stimuli and internal signals. Far-red light plays a significant role in expediting the flowering process in plants, modulating nutritional aspects, and influencing morphological characteristics [64–67]. As the intensity of far-red light within the canopy escalates, plants respond by enhancing their capacity to intercept solar energy. This is achieved through an increase in leaf area and the modification of leaf angle, which involves altering the orientation of the leaves in relation to the incoming light. Additionally, plants adjust the positioning of chloroplasts and the arrangement of leaves within the canopy. Upon the capture of sunlight, far-red light enhances the ratio of light energy utilized in the light reaction, diminishes heat dissipation, and augments photochemical efficiency [68]. These results highlight the significance of PvulFAR1 proteins as a closely interconnected set of nuclear regulators with zinc-dependent DNA-binding capabilities, likely coordinating transcriptional responses to environmental and endogenous stimuli. Yao et al. [69] discovered that the interaction among VvFRS12, VvFRS6, and VvFRS7 may influence the regulation of grape flowering under photoperiodic conditions. Liu et al. [48] elucidated in their research that the interaction network constituted by members of the CsFHY3/FAR1 family in conjunction with HY5, PHYE, PHYC, or PHYA significantly influences the hormonal response, development, light response, and growth of tea plants.
This study investigated the response of FAR1 family genes to abiotic stresses in bean leaf tissues (see Figs. 8 and 9). In the Elkoca-05 bean variety, subgroups PvulFAR1-10, PvulFAR1-16, PvulFAR1-19, PvulFAR1-22, and PvulFAR1-24 were significantly upregulated following salt stress, with subgroups -10 and -24 exhibiting particularly high expression levels. Conversely, under drought stress conditions, both the PvulFAR1-4 and PvulFAR1-10 genes demonstrated increased expression. Notably, the consistent upregulation of PvulFAR1-10 across both stress conditions suggests it may serve a common regulatory function in mediating bean responses to these environmental challenges. Yao et al. [69] reported that several VvFRS genes in Vitis vinifera were markedly upregulated in response to abiotic stress. Similarly, Li et al. [19] monitored the expression of CsFAR genes in Cucumis sativus L. and found that these genes exhibited significant upregulation under both salt and drought stress. In another investigation, Liu et al. [48] evaluated the expression of CsFYH3/FAR1 genes in Camellia sinensis under various abiotic stress conditions and observed results consistent with those of prior studies. Moreover, Chen et al. [10] illustrated that the StFRS genes in Solanum tuberosum exhibit unique expression profiles contingent upon the particular stress factors faced. Furthermore, several studies have demonstrated that the FAR1 gene family plays a pivotal role in mediating responses to both biotic and abiotic stresses, including extreme temperature fluctuations, drought, and salt exposure [48,70].
This study presents a thorough genome-wide analysis of the FAR1 gene family in Phaseolus vulgaris. Twenty-seven PvulFAR1 genes were identified and systematically analyzed regarding their chromosomal distribution, gene structures, conserved motifs, phylogenetic relationships, and regulatory elements. The existence of stress- and hormone-responsive cis-elements in promoter regions indicates that FAR1 genes have integrative functions in environmental signal perception and gene regulation.
Expression profiling via in silico analysis and qRT-PCR demonstrated that multiple PvulFAR1 genes exhibit dynamic responses to salt and drought stress, especially in the stress-tolerant cultivar Elkoca-05. PvulFAR1-10 consistently demonstrated upregulation under both stress conditions, suggesting its potential as a crucial regulator of abiotic stress tolerance. Moreover, gene ontology and protein–protein interaction analyses corroborated the role of PvulFAR1 proteins in transcriptional regulation, metal ion binding, and nuclear functions, highlighting their functional versatility.
The findings highlight the essential functions of FAR1 transcription factors in regulating light signaling and responses to abiotic stress in common bean. The identified candidate genes, particularly PvulFAR1-10, present promising targets for subsequent functional validation and biotechnological applications. Future research should concentrate on the in vivo functional analysis of pivotal FAR1 members and their regulatory networks to enhance breeding initiatives aimed at increasing environmental resilience in legume crops.
Acknowledgement: None.
Funding Statement: The author received no specific funding for this study.
Availability of Data and Materials: All data included in this work are available upon request by contact with the corresponding author.
Ethics Approval: Not applicable.
Conflicts of Interest: The author declares no conflicts of interest to report regarding the present study.
Supplementary Materials: The supplementary material is available online at https://www.techscience.com/doi/10.32604/phyton.2025.069506/s1. Table S1: FAR1 gene family protein sequences retrieved using Pfam accession PF03101 from the genomes of Arabidopsis thaliana, Phaseolus vulgaris, and Glycine max in the Phytozome v13 database. Table S2: Cis-acting elements identified in the 2 kb upstream regions of Phaseolus vulgaris FAR1 genes using PlantCARE, with visualization generated in Tbtools. Table S3: Protein–protein interactions and associated Gene Ontology (GO) annotations of FAR1 proteins, identified using the STRING database. Table S4: Phaseolus vulgaris FAR1 genes selected for qRT-PCR analysis based on transcriptome data, with β-Actin as the reference gene.
References
1. Quail PH. Phytochrome photosensory signalling networks. Nat Rev Mol Cell Biol. 2002;3(2):85–93. doi:10.1038/nrm728. [Google Scholar] [PubMed] [CrossRef]
2. Wang H, Deng XW. Arabidopsis FHY3 defines a key phytochrome a signaling component directly interacting with its homologous partner FAR1. EMBO J. 2002;21(6):1339–49. doi:10.1093/emboj/21.6.1339. [Google Scholar] [CrossRef]
3. Huang X, Ouyang X, Yang P, Lau OS, Li G, Li J, et al. Arabidopsis FHY3 and HY5 positively mediate induction of COP1 transcription in response to photomorphogenic UV-B light. Plant Cell. 2012;24(11):4590–606. doi:10.1105/tpc.112.103994. [Google Scholar] [PubMed] [CrossRef]
4. Huai J, Zhang X, Li J, Ma T, Zha P, Jing Y, et al. SEUSS and PIF4 coordinately regulate light and temperature signaling pathways to control plant growth. Mol Plant. 2018;11(7):928–42. doi:10.1016/j.molp.2020.11.014. [Google Scholar] [PubMed] [CrossRef]
5. Krzeszowiec W, Novokreshchenova M, Gabryś H. Chloroplasts in C3 grasses move in response to blue-light. Plant Cell Rep. 2020;39(9):1331–43. doi:10.1007/s00299-020-02567-3. [Google Scholar] [PubMed] [CrossRef]
6. Casal JJ. Phytochromes, cryptochromes, phototropin: photoreceptor interactions in plants. Photochem Photobiol. 2000;71(1):1–11. [Google Scholar] [PubMed]
7. Lu Q, Liu H, Hong Y, Liang X, Li S, Liu H, et al. Genome-wide identification and expression of FAR1 gene family provide insight into pod development in peanut (Arachis hypogaea). Front Plant Sci. 2022;13:893278. doi:10.3389/fpls.2022.893278. [Google Scholar] [PubMed] [CrossRef]
8. Wang H, Wang H. Multifaceted roles of FHY3 and FAR1 in light signaling and beyond. Trends Plant Sci. 2015;20(7):453–61. doi:10.1016/j.tplants.2015.04.003. [Google Scholar] [PubMed] [CrossRef]
9. Hudson ME, Lisch DR, Quail PH. The FHY3 and FAR1 genes encode transposase-related proteins involved in regulation of gene expression by the phytochrome a-signaling pathway. Plant J. 2003;34(4):453–71. doi:10.1046/j.1365-313x.2003.01741.x. [Google Scholar] [PubMed] [CrossRef]
10. Chen Q, Song Y, Liu K, Su C, Yu R, Li Y, et al. Genome-wide identification and functional characterization of FAR1-RELATED SEQUENCE (FRS) family members in potato (Solanum tuberosum). Plants. 2023;12(13):2575. doi:10.3390/plants12132575. [Google Scholar] [PubMed] [CrossRef]
11. Aguilar-Martínez JA, Uchida N, Townsley B, West DA, Yanez A, Lynn N, et al. Transcriptional, posttranscriptional, and posttranslational regulation of SHOOT MERISTEMLESS gene expression in Arabidopsis determines gene function in the shoot apex. Plant Physiol. 2015;167(2):424–42. doi:10.1104/pp.114.248625. [Google Scholar] [PubMed] [CrossRef]
12. He X, He Y, Dong Y, Gao Y, Sun X, Chen W, et al. Genome-wide analysis of FRF gene family and functional identification of HvFRF9 under drought stress in barley. Front Plant Sci. 2024;15:1347842. doi:10.3389/fpls.2024.1347842. [Google Scholar] [PubMed] [CrossRef]
13. Harmer SL. The circadian system in higher plants. Annu Rev Plant Biol. 2009;60(1):357–77. doi:10.1146/annurev.arplant.043008.092054. [Google Scholar] [PubMed] [CrossRef]
14. Kami C, Lorrain S, Hornitschek P, Fankhauser C. Light-regulated plant growth and development. Curr Top Dev Biol. 2010;91:29–66. [Google Scholar] [PubMed]
15. Wessler SR. Homing into the origin of the AP2 DNA binding domain. Trends Plant Sci. 2005;10(2):54–6. doi:10.1016/j.tplants.2004.12.007. [Google Scholar] [PubMed] [CrossRef]
16. Riaz MW, Lu J, Shah L, Yang L, Chen C, Mei XD, et al. Expansion and molecular characterization of AP2/ERF gene family in wheat (Triticum aestivum L.). Front Genet. 2021;12:632155. doi:10.3389/fgene.2021.632155. [Google Scholar] [PubMed] [CrossRef]
17. Liu R, Lu J, Xing J, Xue L, Wu Y, Zhang L. Characterization and functional analyses of wheat TaPR1 genes in response to stripe rust fungal infection. Sci Rep. 2023;13(1):3362. doi:10.1038/s41598-023-30456-8. [Google Scholar] [PubMed] [CrossRef]
18. Chen S, Chen Y, Liang M, Qu S, Shen L, Zeng Y, et al. Genome-wide identification and molecular expression profile analysis of FHY3/FAR1 gene family in walnut (Juglans sigillata L.) development. BMC Genomics. 2023;24(1):673. doi:10.1186/s12864-023-09629-2. [Google Scholar] [PubMed] [CrossRef]
19. Li X, Li Y, Qiao Y, Lu S, Yao K, Wang C, et al. Genome-wide identification and expression analysis of FAR1/FHY3 gene family in cucumber (Cucumis sativus L.). Agronomy. 2024;14(1):50. doi:10.3390/agronomy14010050. [Google Scholar] [CrossRef]
20. Lamesch P, Berardini TZ, Li D, Swarbreck D, Wilks C, Sasidharan R, et al. The Arabidopsis Information Resource (TAIRimproved gene annotation and new tools. Nucleic Acids Res. 2012;40(D1):D1202–10. doi:10.1093/nar/gkm965. [Google Scholar] [PubMed] [CrossRef]
21. Schmutz J, McClean PE, Mamidi S, Wu GA, Cannon SB, Grimwood J, et al. A reference genome for common bean and genome-wide analysis of dual domestications. Nat Genet. 2014;46(7):707–13. doi:10.1038/ng.3008. [Google Scholar] [PubMed] [CrossRef]
22. Valliyodan B, Cannon SB, Bayer PE, Shu S, Brown AV, Ren L, et al. Construction and comparison of three reference-quality genome assemblies for soybean. Plant J. 2019;100(5):1066–82. [Google Scholar] [PubMed]
23. Horton P, Park KJ, Obayashi T, Fujita N, Harada H, Adams-Collier CJ, et al. WoLF PSORT: protein localization predictor. Nucleic Acids Res. 2007;35(Web Server issue):W585–7. doi:10.1093/nar/gkm259. [Google Scholar] [PubMed] [CrossRef]
24. Chen C, Wu Y, Li J, Wang X, Zeng Z, Xu J, et al. TBtools-II: a “one for all, all for one” bioinformatics platform for biological big-data mining. Mol Plant. 2023;16(11):1733–42. doi:10.1016/j.molp.2023.09.010. [Google Scholar] [PubMed] [CrossRef]
25. Bailey TL, Williams N, Misleh C, Li WW. MEME: discovering and analyzing DNA and protein sequence motifs. Nucleic Acids Res. 2006;34(Web Server issue):W369–73. doi:10.1093/nar/gkl198. [Google Scholar] [PubMed] [CrossRef]
26. Quevillon E, Silventoinen V, Pillai S, Harte N, Mulder N, Apweiler R, et al. InterProScan: protein domains identifier. Nucleic Acids Res. 2005;33(Web Server issue):W116–20. doi:10.1093/nar/gki442. [Google Scholar] [PubMed] [CrossRef]
27. Kumar S, Stecher G, Tamura K. MEGA7: molecular evolutionary genetics analysis version 7.0 for bigger datasets. Mol Biol Evol. 2016;33(7):1870–4. doi:10.1093/molbev/msw054. [Google Scholar] [PubMed] [CrossRef]
28. Letunic I, Bork P. Interactive tree of life v2: online annotation and display of phylogenetic trees made easy. Nucleic Acids Res. 2011;39(Web Server issue):W475–8. doi:10.1093/nar/gkr201. [Google Scholar] [PubMed] [CrossRef]
29. Lescot M, Déhais P, Thijs G, Marchal K, Moreau Y, Van de Peer Y, et al. PlantCARE, a database of plant cis-acting regulatory elements and a portal to tools for in silico analysis of promoter sequences. Nucleic Acids Res. 2002;30(1):325–7. doi:10.1093/nar/30.1.325. [Google Scholar] [PubMed] [CrossRef]
30. Lee TH, Tang H, Wang X, Paterson AH. PGDD: a database of gene and genome duplication in plants. Nucleic Acids Res. 2013;41(D1):D1152–8. doi:10.1093/nar/gks1104. [Google Scholar] [PubMed] [CrossRef]
31. Kelley LA, Mezulis S, Yates CM, Wass MN, Sternberg MJ. The Phyre2 web portal for protein modeling, prediction and analysis. Nat Protoc. 2015;10(6):845–58. doi:10.1038/nprot.2015.053. [Google Scholar] [PubMed] [CrossRef]
32. Pettersen EF, Goddard TD, Huang CC, Couch GS, Greenblatt DM, Meng EC, et al. UCSF Chimera—a visualization system for exploratory research and analysis. J Comput Chem. 2004;25(13):1605–12. doi:10.1002/jcc.20084. [Google Scholar] [PubMed] [CrossRef]
33. Braun P, Gingras AC. History of protein–protein interactions: from egg-white to complex networks. Proteomics. 2012;12(10):1478–98. doi:10.1002/pmic.201100563. [Google Scholar] [PubMed] [CrossRef]
34. Hiz MC, Canher B, Niron H, Turet M. Transcriptome analysis of salt tolerant common bean (Phaseolus vulgaris L.) under saline conditions. PLoS One. 2014;9(3):e92598. doi:10.1371/journal.pone.0092598. [Google Scholar] [PubMed] [CrossRef]
35. Jorge GJ, Villalobos-López MA, Chavarría-Alvarado KL, Ríos-Meléndez S, López-Meyer M, Arroyo-Becerra A. Genome-wide transcriptional changes triggered by water deficit on a drought-tolerant common bean cultivar. BMC Plant Biol. 2020;20(1):1–20. doi:10.1186/s12870-020-02664-1. [Google Scholar] [PubMed] [CrossRef]
36. Mortazavi A, Williams BA, McCue K, Schaeffer L, Wold B. Mapping and quantifying mammalian transcriptomes by RNA-Seq. Nat Methods. 2008;5(7):621–8. doi:10.1038/nmeth.1226. [Google Scholar] [PubMed] [CrossRef]
37. Hoagland DR, Arnon DI. The water-culture method for growing plants without soil. Calif Agric Exp Stn Circ. 1938;347:1–39. [Google Scholar]
38. Muslu S, Kasapoğlu AG, Güneş E, Aygören AS, Yiğider E, İlhan E, et al. Genome-wide analysis of glutathione S-transferase gene family in P. vulgaris under drought and salinity stress. Plant Mol Biol Rep. 2024;42(1):57–76. doi:10.1007/s11105-023-01400-x. [Google Scholar] [CrossRef]
39. Aygören AS, Güneş E, Muslu S, Kasapoğlu AG, Yiğider E, Aydın M, et al. Genome-wide analysis and characterization of SABATH gene family in Phaseolus vulgaris genotypes subject to melatonin under drought and salinity stresses. Plant Mol Biol Rep. 2023;41(2):242–59. doi:10.1007/s11105-022-01363-5. [Google Scholar] [CrossRef]
40. Buttanri A, Kasapoğlu AG, Öner BM, Aygören AS, Muslu S, İlhan E, et al. Predicting the role of β-GAL genes in bean under abiotic stress and genome-wide characterization of β-GAL gene family members. Protoplasma. 2024;262(2):1–19. doi:10.1007/s00709-024-01998-z. [Google Scholar] [PubMed] [CrossRef]
41. Livak KJ, Schmittgen TD. Analysis of relative gene expression data using real-time quantitative PCR and the 2−ΔΔCT method. Methods. 2001;25(4):402–8. doi:10.1006/meth.2001.1262. [Google Scholar] [PubMed] [CrossRef]
42. Ouyang X, Li J, Li G, Li B, Chen B, Shen H, et al. Genome-wide binding site analysis of FAR-RED ELONGATED HYPOCOTYL3 reveals its novel function in Arabidopsis development. Plant Cell. 2011;23(7):2514–35. doi:10.1105/tpc.111.085126. [Google Scholar] [PubMed] [CrossRef]
43. O’Malley RC, Huang SSC, Song L, Lewsey MG, Bartlett A, Nery JR, et al. Cistrome and epicistrome features shape the regulatory DNA landscape. Cell. 2016;165(5):1280–92. doi:10.1016/j.cell.2016.04.038. [Google Scholar] [PubMed] [CrossRef]
44. Li D, Fu X, Guo L, Huang Z, Li Y, Liu Y, et al. FAR-RED ELONGATED HYPOCOTYL3 activates SEPALLATA2 but inhibits CLAVATA3 to regulate meristem determinacy and maintenance inArabidopsis. Proc Natl Acad Sci U S A. 2016;113(33):9375–80. doi:10.1073/pnas.1602960113. [Google Scholar] [CrossRef]
45. Ritter A, Iñigo S, Fernández-Calvo P, Heyndrickx KS, Dhondt S, Shi H, et al. The transcriptional repressor complex FRS7-FRS12 regulates flowering time and growth in Arabidopsis. Nat Commun. 2017;8(1):15235. doi:10.1038/ncomms15235. [Google Scholar] [PubMed] [CrossRef]
46. Ma L, Li G. FAR1-related sequence (FRS) and FRS-related factor (FRF) family proteins in Arabidopsis growth and development. Front Plant Sci. 2018;9:692. doi:10.3389/fpls.2018.00692. [Google Scholar] [PubMed] [CrossRef]
47. Lin R, Wang H. Arabidopsis FHY3/FAR1 gene family and distinct roles of its members in light control of Arabidopsis development. Plant Physiol. 2004;136(4):4010–22. doi:10.1104/pp.104.052191. [Google Scholar] [CrossRef]
48. Liu Z, An C, Zhao Y, Xiao Y, Bao L, Gong C, et al. Genome-wide identification and characterization of the CsFHY3/FAR1 gene family and expression analysis under biotic and abiotic stresses in tea plants (Camellia sinensis). Plants. 2021;10(3):570. doi:10.3390/plants10030570. [Google Scholar] [PubMed] [CrossRef]
49. Zhang J. Evolution by gene duplication: an update. Trends Ecol Evol. 2003;18(6):292–8. [Google Scholar]
50. He X, Zheng R, Chen Y, Tan C. Genome-wide analysis of KNOX genes: identification, evolution, comparative genomics, expression dynamics, and sub-cellular localization in Brassica napus. Plants. 2025;14(14):2167. doi:10.3390/plants14142167. [Google Scholar] [CrossRef]
51. Yu J, Wang L, Guo H, Liao B, King G, Zhang X. Genome evolutionary dynamics followed by diversifying selection explains the complexity of the Sesamum indicum genome. BMC Genomics. 2017;18(1):1–14. doi:10.1186/s12864-017-3599-4. [Google Scholar] [PubMed] [CrossRef]
52. Siddiqui H, Khan S, Rhodes BM, Devlin PF. FHY3 and FAR1 act downstream of light stable phytochromes. Front Plant Sci. 2016;7:175. [Google Scholar] [PubMed]
53. Tang W, Ji Q, Huang Y, Jiang Z, Bao M, Wang H, et al. FAR-RED ELONGATED HYPOCOTYL3 and FAR-RED IMPAIRED RESPONSE1 transcription factors integrate light and abscisic acid signaling in Arabidopsis. Plant Physiol. 2013;163(2):857–66. [Google Scholar] [PubMed]
54. Wang X, Guo C, Peng J, Li C, Wan F, Zhang S, et al. ABRE-binding factors play a role in the feedback regulation of ABA signaling by mediating rapid ABA induction of ABA co-receptor genes. New Phytol. 2019;221(1):341–55. doi:10.1111/nph.15345. [Google Scholar] [PubMed] [CrossRef]
55. Zhao D, Guan P, Wei L, Gao J, Guo L, Tian D, et al. Comprehensive identification and expression analysis of FAR1/FHY3 genes under drought stress in maize (Zea mays L.). PeerJ. 2024;12(9):e17684. doi:10.7717/peerj.17684. [Google Scholar] [PubMed] [CrossRef]
56. Abid U, Iqbal A, Mazher M, Bibi S, Ashraf S, Kamel M, et al. Genome-wide identification and characterization of light-responsive FAR1 gene family in finger millet (Eleusine coracana) under abiotic stress. Genet Resour Crop Evol. 2024;72(5):1–17. doi:10.1007/s10722-024-02317-4. [Google Scholar] [CrossRef]
57. Dai J, Sun J, Peng W, Liao W, Zhou Y, Zhou XR, et al. FAR1/FHY3 transcription factors positively regulate the salt and temperature stress responses in Eucalyptus grandis. Front Plant Sci. 2022;13:883654. doi:10.3389/fpls.2022.883654. [Google Scholar] [PubMed] [CrossRef]
58. Han Y, Cheng H, Jiang Y, Wang X, Liu X, Zhang D, et al. Identification and characterization of the BnFAR1/FHY3 gene family and expression analysis under shading and low-temperature responses in Brassica napus L. Agronomy. 2024;14(1):202. doi:10.3390/agronomy14010202. [Google Scholar] [CrossRef]
59. Yuan N, Wang T, Liu T, Yang Y, Guo Y, Liu J, et al. Genome-wide analysis of the FAR1/FHY3 gene family in cotton. Cotton Sci. 2018;30(1):1–11. doi:10.11963/1002-7807.yndjc.20171214. [Google Scholar] [CrossRef]
60. Sadeghzadeh B. A review of zinc nutrition and plant breeding. J Soil Sci Plant Nutr. 2013;13(4):905–27. [Google Scholar]
61. Stanton C, Sanders D, Krämer U, Podar D. Zinc in plants: integrating homeostasis and biofortification. Mol Plant. 2022;15(1):65–85. doi:10.1016/j.molp.2021.12.008. [Google Scholar] [PubMed] [CrossRef]
62. Sharma A, Kumar V, Shahzad B, Ramakrishnan M, Singh Sidhu GP, Bali AS, et al. Photosynthetic response of plants under different abiotic stresses: a review. J Plant Growth Regul. 2020;39(2):509–31. doi:10.1007/s00344-019-10018-x. [Google Scholar] [CrossRef]
63. Kumar M, Narwal E, Rakshit S, Bishi SK, Bhadana VP, Kumar M, et al. Zinc homeostasis and biofortification in crop plants: towards efficient zinc utilization. J Plant Growth Regul. 2025;31(12):1–20. doi:10.1007/s00344-025-11805-5. [Google Scholar] [CrossRef]
64. Demotes-Mainard S, Péron T, Corot A, Bertheloot J, Le Gourrierec J, Pelleschi-Travier S, et al. Plant responses to red and far-red lights, applications in horticulture. Environ Exp Bot. 2016;121:4–21. doi:10.1016/j.envexpbot.2015.05.010. [Google Scholar] [CrossRef]
65. Zhen S, Haidekker M, van Iersel MW. Far-red light enhances photochemical efficiency in a wavelength-dependent manner. Physiol Plant. 2019;167(1):21–33. doi:10.1111/ppl.12834. [Google Scholar] [PubMed] [CrossRef]
66. Legendre R, van Iersel MW. Supplemental far-red light stimulates lettuce growth: disentangling morphological and physiological effects. Plants. 2021;10(1):166. doi:10.3390/plants10010166. [Google Scholar] [PubMed] [CrossRef]
67. Takemura Y, Kishimoto M, Tamura F. Selection of cut flower species affected promotion of flowering and stem elongation by far-red lighting or heating treatments on end of day under limited sunshine from autumn to winter. Hortic Sci. 2020;47(3):169–77. doi:10.17221/174/2018-hortsci. [Google Scholar] [CrossRef]
68. Tan T, Li S, Fan Y, Wang Z, Raza MA, Shafiq I, et al. Far-red light: a regulator of plant morphology and photosynthetic capacity. Crop J. 2022;10(2):300–9. doi:10.1016/j.cj.2021.06.007. [Google Scholar] [CrossRef]
69. Yao H, Zheng Y, Sun Y, Liu Y. Genome-wide identification and expression analysis of the FAR1-RELATED SEQUENCE (FRS) gene family in grape (Vitis vinifera L.). Int J Mol Sci. 2025;26(10):4675. doi:10.3390/ijms26104675. [Google Scholar] [PubMed] [CrossRef]
70. Liu Y, Wei H, Ma M, Li Q, Kong D, Sun J, et al. Arabidopsis FHY3 and FAR1 regulate the balance between growth and defense responses under shade conditions. Plant Cell. 2019;31(9):2089–106. doi:10.1105/tpc.18.00991. [Google Scholar] [PubMed] [CrossRef]
Cite This Article
 Copyright © 2025 The Author(s). Published by Tech Science Press.
This work is licensed under a Creative Commons Attribution 4.0 International License , which permits unrestricted use, distribution, and reproduction in any medium, provided the original work is properly cited.
 Downloads
 Citation Tools