
 Submit a Paper
 Propose a Special lssue
 Open Access
ARTICLE

Phytochemical Composition and Pharmacological Effects of Extracts from Gilia capitata Sims
1 Institute of Pharmacy, Faculty of Medicine, University of Tartu, Tartu, 50411, Estonia
2 School of Natural Sciences and Health, Tallinn University, Tallinn, 10120, Estonia
3 Institute of Pharmaceutical Technologies, Lithuanian University of Health Sciences, Kaunas, LT-44307, Lithuania
4 Department of Pharmacognosy, Lithuanian University of Health Sciences, Kaunas, LT-44307, Lithuania
5 Department of Pharmaceutical Management, Drug Technology and Pharmacognosy, Ivano-Frankivsk National Medical University, Ivano-Frankivsk, 76018, Ukraine
6 Institute of Ecology and Earth Sciences, Faculty of Science and Technology, University of Tartu, Tartu, 50409, Estonia
* Corresponding Author: Ain Raal. Email:
Phyton-International Journal of Experimental Botany 2025, 94(12), 3991-4019. https://doi.org/10.32604/phyton.2025.074153
Received 03 October 2025; Accepted 28 November 2025; Issue published 29 December 2025
 View Full Text
 Download PDF
Abstract
Gilia capitata Sims (Polemoniaceae) is an annual herbaceous plant widely distributed in western North America and cultivated as an ornamental flower. The detailed chemical composition and pharmacological properties of this plant have not been previously reported. This study aimed to investigate the chemical composition and pharmacological activity of aqueous-ethanolic extracts derived from different plant parts (herb, flowers, stems, roots, and fruits). HPLC analysis identified 12 phenolic compounds and 16 amino acids in the aqueous-ethanolic extracts obtained from these plant parts. The biological effects of the extracts were evaluated in vitro, including cytotoxicity, anti-inflammatory response, and wound-healing potential. The anti-inflammatory activity was evaluated by measuring their effect on NO production in LPS-stimulated RAW264.7 murine macrophages and HaCaT keratinocytes. Phagocytic activity was assessed using the neutral red uptake assay. HaCaT cell proliferation and migration were assessed to evaluate the wound-healing potential. Morphological changes in both cell lines were examined microscopically. Moreover, neurobehavioral effects were studied in vivo. The herb extracts significantly enhanced locomotor activity while preserving exploratory behaviour, suggesting a stimulating effect. G. capitata flower extracts caused a decrease in both locomotor and exploratory behaviour, demonstrating a moderate sedative effect. Fruit extracts significantly suppressed locomotor and exploratory activity, indicating a strong sedative effect. These findings indicated that G. capitata contains bioactive compounds with diverse pharmaceutical effects depending on the specific plant part and may have potential applications in medicine and pharmacology pending further research.Keywords
Supplementary Material
Supplementary Material FileGilia capitata Sims (Polemoniaceae), also known as bluehead gilia or globe gilia, is an annual herbaceous plant native to western North America [1,2] and cultivated as an ornamental flower in Alaska, northern Mexico, and parts of Europe [3]. In the wild, it grows in rocky hillslopes and open fields with well-drained soil at elevations up to 2000 m [4,5]. This species is highly valued as a pollinator magnet [6], attracting wild bees, bumblebees, flies, and butterflies, making it a common addition to wildflower seed mixes designed to support pollinator populations [7,8]. In Estonia, G. capitata is also primarily cultivated as an ornamental plant, but it has recently gained recognition as a bee-friendly intercrop species [9]. Farmers can receive agri-environmental support for growing it near beehives, promoting pollinator-friendly agriculture. Beyond its ecological benefits, bluehead gilia has potential as a production crop for valuable agricultural products, including essential oils and saponins [10]. G. capitata is grown from seeds, requiring no stratification or scarification, though a two-week cold stratification may enhance germination. Seeds can be directly sown in spring, yet our observations indicate successful self-seeding in autumn, with overwintering in Estonia followed by vigorous germination in early spring. The soil should be moist at planting. In its natural habitat, wildfires benefit bluehead gilia by clearing mature vegetation and allowing more light penetration to the ground. Germination likely responds to signals from fire residues [11]. Once established, G. capitata demands minimal care, aside from weeding. Flowering can be prolonged and continuous, contingent upon soil moisture and temperature. Removing deadhead flowers promotes reblooming. The plant thrives in sunny open areas, either individually or alongside other low-competition annuals [12]. Optimal growth occurs in well-drained medium to coarse soil with a sub-neutral pH (6.0–7.0). Mature plants exhibit high drought tolerance. The strong attraction of pollinators to bluehead gilia is attributed to its compact capitate inflorescence, which hosts up to 80 flowers, offering a convenient landing pad for insects [7]. Additionally, its essential oils may play a role in attracting pollinators through scent [13,14] or as a foraging target. Given this, earlier researchers explored the essential oil content and composition across different plant sections [15]. The presence of these oils suggests possible applications in medicinal use, food processing, and perfumery. Moreover, past studies indicate that saponins may represent the plant’s primary economic value [16,17].
The chemical composition of G. capitata has been very poorly studied, to the best of our knowledge. The composition of essential oils and saponins in different parts of G. capitata has previously been investigated by our group [10]. The essential oil yield varied between 0.42 and 1.97 mL/kg, with seeds producing the highest amounts, followed by flowers, fruits, and leaves, while stems, roots, and shells contained significantly lower concentrations. GC-MS analysis identified 116 compounds, with hexahydrofarnesyl acetone being the predominant compound in most plant sections: flowers: hexahydrofarnesyl acetone (19.1%); fruits: hexahydrofarnesyl acetone (18.2%); seeds: hexahydrofarnesyl acetone (15.2%); fruits: (+)-epi-bicyclosesquiphellandrene (15.4%); leaves: phytol (23.3%); stems: isomanool (8.3%); and roots: (−)-myrtenol (25.7%). Additionally, triterpenoid saponins were detected, with 21 compounds quantified using HPLC analysis. Saponin concentrations were highest in aerial parts (excluding stems), whereas roots contained the lowest levels [10]. The comprehensive characterisation of other biologically active substances and their pharmacological activities not been reported earlier. This research focuses on profiling phenolic compounds and amino acids in various parts of the plant, alongside evaluating their extracts for cytotoxic, anti-inflammatory, wound-healing, and neurotropic activities.
Most of the chemicals used in this study were of analytical grade and purchased from Fisher Scientific (Waltham, MA, USA) or Sigma-Aldrich (St. Louis, MO, USA). The following chemicals and reagents were used: Dulbecco’s Modified Eagle’s Medium (DMEM/F12; nutrient mixture, Ref. D8437), Heat-inactivated fetal bovine serum (Ref. F9665), Penicillin-streptomycin (Ref. P4333), Trypsin-EDTA solution, Thiazolyl blue tetrazolium bromide (Ref. M5655), Dimethyl sulfoxide (DMSO, Ref. 472301), Mitomycin C ready-made solution (Ref. M5353, 10 mg/mL), Lipopolysaccharides (LPS, Ref. L2880, Escherichia coli O55:B5), Crystal violet (Ref. C0775), Nitrite assay kit (Griess Reagent, Ref. MAK367). Additionally, the following reagents were obtained from Thermo Scientific, Bremen, Germany, and used according to the manufacturer’s instructions: AlamarBlue™ Cell Viability Reagent, Neutral red, SuperScript™ IV CellsDirect™ cDNA Synthesis Kit (Ref. 11750150), and PowerTrack™ SYBR™ Green Master Mix for qPCR (Ref. A46109, Thermo Scientific, Bonn, Germany).
Seeds of G. capitata were sourced from various commercial flower suppliers across Europe. To ensure broader estimates of the species’ chemical profile and prevent genetic bottleneck effects caused by reliance on a single supplier, the seeds were mixed. Sowing took place in mid-May 2023 (15–22 May). The taxonomic identity of the species was re-verified at the flowering stage using digital identification keys available online. During growth, plants received nutritional support through commercial complex fertilisers formulated for flowering plants. The plant materials were gathered during the summer, with distinct parts—flowers, stems with leaves (herb), and roots—harvested separately. The collected specimens underwent a 14-day drying process at room temperature in a well-ventilated space. Once dried, larger stems were separated, and the material was categorised into two groups: stems and threshed herb, primarily composed of leaves. To ensure a representative analysis, materials from different locations were mixed in equal proportions before testing. Storage was maintained at room temperature in paper bags. Voucher specimens (No Polemon/Gil1-7) are catalogued at the Institute of Pharmacy, University of Tartu, Estonia. This study focused on a single growing season as part of an initial assessment of the pharmaceutical potential of this plant, which had not previously undergone a comprehensive phytochemical analysis.
The plant raw materials were ground to a particle size of 0.5–2.0 mm and extracted once using the maceration method at a plant-to-solvent ratio of 1:10 with 70% and 40% aqueous ethanol for 24 h. The aqueous extract from the plant roots was obtained using the classical decoction method at a 1:10 ratio. The resulting aqueous extracts were concentrated using a Buchi B-300 rotary vacuum evaporator (Buchi AG, Flawil, Switzerland) to obtain soft extracts. These were then freeze-dried (lyophilised) using a SCANVAC COOLSAFE 55-4 Pro freeze dryer (LaboGene ApS, Lillerød, Denmark). The following dry extracts were obtained: G1 (herb extract, obtained with 70% aqueous ethanol), G2 (flower extract, obtained with 70% aqueous ethanol), G3 (stem extract, obtained with 70% aqueous ethanol), G4 (fruits extract, obtained with 70% aqueous ethanol), G5 (root extract, obtained with purified water) and G6 (herb extract, obtained with 40% aqueous ethanol).
2.4.1 Analysis of Phenolics by UPLC-MS/MS
The qualitative and quantitative analysis of phenolic compounds in G. capitata extracts was conducted using ultra-performance liquid chromatography-tandem mass spectrometry (UPLC-MS/MS). The study utilized an Acquity H-Class UPLC chromatograph (Waters, Milford, MA, USA) equipped with a YMC Triart C18 column (100 mm × 2.0 mm, 1.9 μm), maintained at a constant temperature of 40°C. The mobile phase flow rate was 0.5 mL/min, consisting of solvent A (0.1% aqueous formic acid solution) and solvent B (pure acetonitrile). A gradient elution method was applied: 0–1 min: 5% solvent B, 1–5 min: increased to 30%, 5–7 min: further increased to 50%, 7.5–8 min: column washing with solvent B, 8.1–10 min: re-equilibration to initial conditions (5% solvent B). For structural characterisation, the study employed a Xevo triple quadrupole tandem mass spectrometer (Waters, Milford, MA, USA), utilising negative electrospray ionisation (ESI) mode to generate ions for MS/MS analysis. Operating conditions included: Capillary voltage: −2 kV, Desolvation nitrogen gas temperature: 400°C, flow rate: 700 L/h, Ion source temperature: 150°C, Gas flow rate: 20 L/h. Phenolic compounds were identified by comparing MS/MS spectral data of reference standards with their retention times. Quantification was performed using linear regression models and the standard dilution method [18,19]. The method validation was done previously [20].
2.4.2 Assay of Amino Acids by UPLC-MS/MS
The analysis of amino acids in G. capitata extracts was conducted using an Acquity H-Class UPLC system (Waters, Milford, MA, USA) coupled with an Xevo TQD mass spectrometer (Waters, Milford, MA, USA). The separation was performed on a BEH Amide column (150 mm × 2.1 mm, 1.7 μm, Waters, Milford, MA, USA) maintained at 25°C. A 1 μL sample was injected for analysis. The mobile phase consisted of eluent A (10 mmol ammonium formate with 0.125% formic acid in water) and eluent B (acetonitrile), with a flow rate of 0.6 mL/min. The gradient elution profile was as follows: 0–1 min: 95% eluent B, 1–3.9 min: reduced to 70%, 3.9–5.1 min: further decreased to 30%, 5.1–6.4 min: column flushing with 70% eluent A, 6.5 min: re-equilibration to initial conditions (95% eluent B) for a total run time of 10 min. The mass spectrometer settings in positive electrospray ionisation (ESI) mode were: Capillary voltage: +3.5 kV, Cone voltage: 30 V, Desolvation gas flow: 800 L/h, Desolvation temperature: 400°C, Ion source temperature: 120°C. Amino acid identification and peak assignment in G. capitata extracts were performed by comparing MS/MS spectral data with those of analytical-grade standards and their corresponding retention times. Quantification was achieved using linear regression models and the standard dilution method [20,21].
2.4.3 Assay of Main Phenolics by Spectrophotometry
The quantification of key phenolic compounds—including hydroxycinnamic acids, flavonoids, and total phenolic substances—in the dry extracts of G. capitata was carried out using a Shimadzu UV-1800 spectrophotometer (Shimadzu Corporation, Kyoto, Japan) in accordance with European Pharmacopoeia protocols [22]. The hydroxycinnamic acid content was determined through a reaction with sodium molybdate and sodium nitrite, using chlorogenic acid as the standard of equivalence [22,23]. The flavonoid concentration was assessed via a reaction with aluminium chloride, with rutin serving as the reference compound, and absorbance was measured at 417 nm [18,22,24]. The total phenolic content was analysed using gallic acid as the standard, with absorbance recorded at 270 nm [25,26]. To ensure statistical reliability, all experiments were conducted in triplicate.
2.5 In Vitro Assays on Immune and Skin Cells
HaCaT human epidermal keratinocytes (obtained from ATCC) and RAW264.7 murine macrophage cells (ECACC 91062702) were grown in Dulbecco’s Modified Eagle’s Medium (DMEM/F12; nutrient mixture, Sigma-Aldrich, St. Louis, MI, USA) enriched with 10% (v/v) heat-inactivated fetal bovine serum (FBS, Sigma-Aldrich) and a combination of 100 U/mL penicillin and 100 μg/mL streptomycin (Thermo Fisher, Altrincham, UK) [27]. The cells were incubated at 37°C in a humidified environment with 5% CO2 (using an MCO-170AICUV-PE incubator, PHCbi). Initially, the cells were cultured in 25 cm2 flasks (Corning) and later transferred to 75 cm2 flasks (Corning) when they reached approximately 80–90% confluency, with a starting seeding density of 2 × 10⁴ cells/mL. The culture medium was refreshed every two to three days.
HaCaT (skin cells) and RAW264.7 (immune cells) were plated in 96-well plates (Corning Glassworks, Corning, NY, USA) at a density of 2 × 10⁴ cells/mL and allowed to adhere overnight at 37°C in a 5% CO2 atmosphere. After incubation, the extracted compounds (G1-G6; initially at 50 μg/μL in DMSO) were diluted to create 10 concentrations ranging from 0.5 to 0.001 μg/μL in DMSO. These solutions were added to the wells at a 100:1 ratio (test solution in DMEM cell culture media). Four replicates (n = 4) were prepared for each concentration, and a no-treatment (NT) control group (containing only 1% DMSO) was included for comparison. Negative and positive controls were prepared using Milli-Q water and 70% ethanol, respectively. After 24 h of treatment, the contents of the wells were aspirated, washed with PBS, and treated with 10 μL of alamarBlue reagent mixed with 90 μL of culture media [28]. Fluorescence was measured using a FLUOstar OPTIMA microplate reader (BMG LABTECH, San Diego, CA, USA) at excitation/emission wavelengths of 540 nm/590 nm following a 2-h incubation period.
2.5.3 Cell Proliferation Assay
Cell proliferation was assessed using HaCaT and RAW264.7 cells via the alamarBlue assay, as outlined in a previously established protocol [27]. HaCaT cells were plated at a density of 2 × 10⁴ cells/mL in 96-well plates (Corning Glassworks, Corning, NY, USA) using DMEM supplemented with 10% FBS and incubated for 24 h at 37°C in a 5% CO2 environment. After incubation, the extracted compounds (stock concentration: 50 μg/μL in DMSO) were diluted to final concentrations of 0.001 μg/μL (G1, G3, G4, G6) and 0.01 μg/μL (G2, G5), maintaining a total DMSO concentration of 1% in cell culture media. The cells were incubated for 24, 48, and 72 h. At each time point, the culture medium was aspirated, and 10 μL of alamarBlue reagent was mixed with 90 μL of culture medium and added to each well. Fluorescence was measured using a FLUOstar OPTIMA microplate reader at excitation/emission wavelengths of 540 nm/590 nm after 4 h of incubation. Results were compared to negative controls (mitomycin-C-treated cells, 0.004 μg/μL), positive controls (lipopolysaccharide, 100 μg/mL LPS, Escherichia coli O55:B5; Millipore Sigma, Burlington, MA, USA), and non-treated cell growth rates.
2.5.4 Scratch Wound Healing Assay
The migration of HaCaT cells was assessed to evaluate the wound-healing potential of the extracted polysaccharides, as outlined by Premarathna et al. [29]. A 48-well tissue culture plate (Corning Glassworks, Corning, NY, USA) was seeded with 1 × 10⁵ cells/mL and incubated at 37°C with 5% CO2 until the cells reached 90% confluency. A 200 μL sterile pipette tip was used to create scratches in the cell monolayers, and the wells were washed with PBS to remove debris and detached cells. DMEM medium (495 μL) was added to each well, along with 5 μL of test solutions (G1, G3, G4, G6: 0.001 μg/μL, G2 & G5: 0.01 μg/μL), resulting in a final DMSO concentration of 1% for each well. After 24 and 48 h of incubation, cells were washed twice with 1X PBS, fixed with 3.7% paraformaldehyde for 2 min, and then treated with methanol for 15 min. The fixed cells were stained with 1% crystal violet (Ref. C0775, Sigma-Aldrich) in 2% ethanol for 10 min. Phase-contrast images of cell migration were taken at 10X magnification using an inverted microscope (ZEISS Axiovert 5) with motorised stages. Wound dimensions at 0, 24, and 48 h were quantified in square millimetres using software provided by Carl Zeiss Microscopy GmbH. For further image analysis—including measurements of area, perimeter, Feret diameter, and circularity—the ImageJ software Zen lite (developed by the National Institutes of Health, Bethesda, MD, USA; http://rsbweb.nih.gov/ij/ (accessed on 24 November 2025)) was employed. The percentage of wound closure was calculated using the following formula: Percentage of distance wound closure = [(wound area at T0 − wound area at Tt)/wound area at T0] × 100(1) where T0 is the initial wound area and Tt is the wound area at 24 or 48 h.
2.5.5 Microscopy and Image Analysis for Toxicity
Microscopic analysis was employed to examine the effects of G. capitata extracts on the morphology of HaCaT and RAW264.7 cells. HaCaT cells were seeded in 96-well microplates at a density of 1 × 10⁵ cells per well and incubated at 37°C with 5% CO2 for 24 h. Cells were treated with G. capitata extracts (5 μL; G1, G3, G4 & G6: 0.001 μg/μL, G2 & G5: 0.01 μg/μL) in a DMEM medium (495 μL), resulting in a final DMSO concentration of 1%. The cells were then incubated for an additional 24 h. Phase-contrast images of cell morphology were captured at 20× magnification using an inverted microscope (ZEISS Axiovert 5, Oberkochen, Germany) with motorised stages.
Propidium Iodide (PI) Staining
Fluorescence images were captured using propidium iodide (PI) staining, a cell-impermeable nucleic acid intercalating dye, following the manufacturer’s protocol. Live cells were stained for 15 min at room temperature to assess the effects of the test solutions on HaCaT cells. Fluorescence microscopy (ZEISS Axiovert 5, 20× objective) was used to acquire the images. Positive controls (70% ethanol) and negative controls (mitomycin-C, 0.04 μg/μL) were included, with Milli-Q water serving as the no-treatment (NT) control.
2.5.6 Anti-Inflammatory Activity
The anti-inflammatory activity of the extracted polysaccharides was evaluated by measuring their effect on NO production in LPS-stimulated RAW264.7 murine macrophages and HaCaT cells [28]. Cells were seeded at a density of 1 × 10⁵ cells/mL in 96-well plates (Corning Glassworks, Corning, NY) and incubated overnight at 37°C with 5% CO2. The culture medium was replaced with fresh medium (99 μL), and the cells were treated with 1 μL of the test solution. The final concentrations used were as follows: for HaCaT cells, G1, G3, G4 & G6: 0.0002 μg/μL, G2 & G5: 0.0008 μg/μL; for RAW264.7 cells, G1, G3, G4 & G6: 0.001 μg/μL, G2 & G5: 0.008 μg/μL. Lipopolysaccharide (LPS) at a concentration of 50 ng/mL was added to stimulate the cells. After 24 h of incubation, the DMEM medium and test solution were removed. PBS was applied to cleanse the cells, and NO levels were determined using a nitrite assay kit (Griess Reagent Kit, Catalogue Numbers G7921, Invitrogen, Carlsbad, CA, USA), following the manufacturer’s instructions. Absorbance at 540 nm was measured using a FLUOstar OPTIMA microplate reader. Nitrite concentration was calculated using the following formula: Nitrite concentration (nmol/μL or mM) = (B/V) × D(2) where: B = the Nitrite amount in the sample from the standard curve (nmol), V = the volume of sample added to the reaction well (μL), D = sample dilution factor
Determination of Phagocytosis Activity
Phagocytic activity was assessed using the neutral red uptake assay, as described by Premarathna et al. [30], with modifications. RAW264.7 cells (1 × 10⁵ cells/mL) were seeded in 96-well plates (Corning Glassworks, Corning, NY) and incubated overnight at 37°C with 5% CO2. Cells were treated with 1 μL of test solution in fresh culture medium (99 μL) (Final concentration in DMEM: G1, G3, G4, and G6 at 0.001 μg/μL; G2 and G5 at 0.008 μg/μL). Lipopolysaccharide (LPS, 100 μg/mL) was used as a positive control, and mitomycin-C (MMC, 0.04 μg/mL) was used as a negative control. After 24 h of incubation, the medium was discarded, and the cells were washed with PBS. Neutral red (50 μL, 0.075% in PBS) and 50 μL of DMEM were added to each well and incubated for 2 h at 37°C. Excess neutral red was removed, and cells were washed three times with PBS. The dye was then extracted using 100 μL of neutral red lysis solution (1% acetic acid in 50% ethanol) and incubated overnight at 25°C. Absorbance at 540 nm was measured using a FLUOstar OPTIMA microplate reader. The phagocytosis rate was calculated as follows: Phagocytosis rate (%) = (ODTreatment − ODBlank/ODNo-treatment − ODBlank) × 100(3) where ODBlank represents the absorbance of the blank (i.e., cell culture media), while ODTreatment represents the absorbance of the polysaccharide-treated cells. ODNo-treatment represents Milli-Q water used as the control (NT—no treatment).
HaCaT cells were seeded at a density of 1 × 10⁵ cells/mL in 24-well plates (Corning Glassworks, Corning, NY, USA) and maintained in DMEM supplemented with 10% FBS for 24 h at 37°C with 5% CO2. The cells were then treated with various test solutions (5 μL; G1 at 0.001 μg/μL, G5 at 0.01 μg/μL in DMSO), along with 495 μL of DMEM medium. Positive (lipopolysaccharide, 50 ng/mL) and negative (mitomycin-C, 0.004 μg/μL) controls were included. After 24, 48, and 72 h, cDNA was synthesised using the SuperScript™ IV CellsDirect™ cDNA Synthesis Kit (Ref. 11750150, Thermo Scientific, Germany) and quantified using a NanoDrop Spectrophotometer (2000, Thermo Scientific, Waltham, MA, USA). Quantitative PCR (qPCR) was performed in a 20 μL reaction volume containing PowerTrack™ SYBR™ Green Master Mix (10 μL), cDNA template (5 μL), 1.5 μM forward and reverse primers, and UltraPure™ DNase/RNase-Free Distilled Water (3 μL). Amplification was carried out using specific primers for Tumour Necrosis Factor-α (TNF-α), Transforming Growth Factor-β (TGF-β), and β-actin (control). PCR conditions included an initial denaturation at 95°C for 5 min, followed by 40 cycles of denaturation (95°C for 15 s), annealing (56.8°C for 45 s), and extension (72°C for 30 s). Melting curve analysis was performed at 55–95°C. Relative gene expression was calculated using the comparative CT method (2−ΔΔCT) as described by Zhang et al. [31], with β-actin as the reference gene.
2.7 Neurotropic Activity of the Gilia capitata Extracts
For the evaluation of neurotropic (anxiolytic) effects of G. capitata extracts, the following behavioural tests were used: Open Field Test, Elevated Plus Maze, and Black-and-White Box Test, which belong to the behavioural methods for studying the pharmacological activity of psychotropic agents. The antidepressant activity was assessed using the Tail Suspension Test, which simulates animal behaviour based on despair. Each test was conducted on a separate day.
This study was conducted in accordance with the methodological guidelines of the State Expert Centre of the Ministry of Health of Ukraine [32] at the clinical-biological experimental base of Ivano-Frankivsk National Medical University (IFNMU).
All animal experiments were carried out in strict compliance with the National General Ethical Principles of Animal Research (Ukraine, 2001), which align with the European Convention for the Protection of Vertebrate Animals Used for Experimental and Other Scientific Purposes (Strasbourg, 1986) [33,34,35]. Additionally, the study adhered to ethical, moral, and legal standards to ensure the humane treatment of experimental animals in scientific and educational contexts, as outlined in Protocol No. 151/25 of the Ethics Committee of IFNMU, approved on 10 April 2025.
This research was conducted on white outbred sexually mature mice of both sexes, weighing 20–24 g, bred in the vivarium of IFNMU. The animals were standardised based on physiological and biochemical parameters, housed according to sanitary and hygienic norms, and provided a balanced diet while ensuring humane treatment. The mice were kept under controlled sanitary conditions, maintaining a temperature range of 20–24°C, humidity levels of 50–55%, and a natural light cycle (“day-night”). They were housed in plastic cages and received a balanced diet in compliance with current regulations.
The animals were divided into six groups, with six subjects in each: Group I: intact animals (IC); Group II: animals administered Sedaphyton (manufacturer: Fitofarm, Sumy city, Ukraine) as the comparison group (CG); Group III: animals administered the extract G1; Group IV: animals administered the extract G2; Group V: animals administered the extract G4; group VI: animals administered the extract G6. The G. capitata extracts were administered orally, dissolved in water, at a dose of 50 mg/kg (0.1 mL per 10 g of body weight). The selection of the extracts G1, G2, G4 and G6 was determined by the logical quantity and availability of plant biomass of raw materials during cultivation, as well as the results of preliminary phytochemical analysis of the extracts obtained from different parts of G. capitata. The control group received Sedaphyton at the same dose of 50 mg/kg, while intact animals received an equivalent volume of drinking water. For 3–4 h before administration, animals were deprived of food but had free access to water. One hour after administration, behavioural experiments began.
Experimental results were processed using variational standard statistical methods (GraphPad Prism 10.0.1 for MacOS (GraphPad Software, San Diego, CA, USA etc.), including calculations of the arithmetic mean, standard deviation, Student’s t-test, and probability coefficient using Microsoft Excel 2007 (Microsoft Corporation, Redmond, WA, USA), following the guidelines of the State Pharmacopoeia of Ukraine [36,37].
3.1 Extraction and Physical Characteristics
The G. capitata extracts were yellow-brown-greenish (herb, extractant 70% ethanol—extract G1, herb, extractant 40%-ethanol—extract G6), grey-purple (flowers, extractant 70% ethanol—extract G2), yellow-brown (stems, extractant 70% ethanol—extract G3, fruits, extractant 70% ethanol—extract G4) and yellow-white powders (roots, extractant water—extract G5). The extract G1 turned dark brown during storage and formed a solid crystallised mass.
3.2 Phenolic and Amino Acid Profile of Gilia capitata
The content of phenolic substances has been determined by HPLC (Fig. S1) and spectrophotometry (Table 1). The results of HPLC analysis of amino acids are also presented in Table 1 (Fig. S2).
Table 1: Content of phenolic compounds and amino acids in the Gilia capitata extracts.
| Compound | Content, mg/100 g (Dry Extract) | |||||
|---|---|---|---|---|---|---|
| G1 | G2 | G3 | G4 | G5 | G6 | |
| Phenolic compounds, mg/100 g | ||||||
| Kaempferol-3-O-rutinoside | 54.4 ± 4.4 | 149.8 ± 9.2 | 30.5 ± 1.1 | 38.5 ± 2.3 | 3.1 ± 0.2 | 57.6 ± 2.5 |
| Isoquercitrin | 212.4 ± 9.2 | 109.3 ± 6.2 | 170.5 ± 6.3 | 34.3 ± 1.0 | 9.1 ± 1.0 | 225.2 ± 11.5 |
| Luteolin 7 rutinoside | 61.4 ± 1.4 | 158.1 ± 6.1 | 30.0 ± 1.2 | 37.5 ± 2.9 | 3.2 ± 0.6 | 63.3 ± 0.6 |
| Quercetin | 10.6 ± 0.4 | 2.5 ± 0.2 | 0.4 ± 0.0 | 6.2 ± 0.5 | nd | 4.4 ± 0.5 |
| p-Coumaric acid | 3.5 ± 0.5 | 3.8 ± 1.1 | 1.6 ± 0.4 | 14.2 ± 1.1 | nd | 2.5 ± 0.7 |
| Ferulic acid | 27.2 ± 2.4 | 6.5 ± 0.7 | 0.2 ± 0.0 | 26.5 ± 2.6 | 2.1 ± 0.1 | 7.3 ± 1.1 |
| Kaempherol | 5.9 ± 0.3 | 7.6 ± 0.1 | nd | 256.1 ± 6.3 | 7.6 ± 1.2 | 15.1 ± 0.8 |
| 3,4-Dihydroxyphenylacetic acid | 3.7 ± 0.4 | 1.3 ± 0.3 | 6.6 ± 0.5 | 13.1 ± 0.9 | 3.3 ± 0.2 | 3.5 ± 0.4 |
| Isorhamnetin | 3.7 ± 0.2 | 1.6 ± 0.1 | 0.3 ± 0.0 | 3.3 ± 0.2 | 0.2 ± 0.0 | 2.3 ± 0.1 |
| Apigenin | 2.2 ± 0.1 | 5.4 ± 0.6 | 0.1 ± 0.0 | 1.3 ± 0.0 | 0.1 ± 0.0 | 0.7 ± 0.1 |
| Kaempherol-3-O-glucoside | 25.5 ± 1.0 | 92.3 ± 5.1 | 5.6 ± 0.7 | 39.0 ± 3.6 | 1.6 ± 0.2 | 18.8 ± 0.5 |
| Rutin | 262.2 ± 14.9 | 141.2 ± 8.1 | 289.5 ± 10.2 | 36.4 ± 1.6 | 23.1 ± 2.1 | 275.1 ± 22.1 |
| Total | 672.6 | 679.4 | 535.4 | 506.6 | 53.4 | 661.7 |
| Amino acids, mg/100 g | ||||||
| Alanine | 468.5 ± 11.6 | 341.9 ± 40.6 | 344.9 ± 16.6 | 268.1 ± 15.2 | nd | 417.3 ± 17.8 |
| Arginine | 108.2 ± 7.4 | 138.1 ± 7.1 | 61.4 ± 3.5 | 106.3 ± 6.6 | nd | 93.6 ± 3.0 |
| Aspartic acid | 85.0 ± 2.2 | 55.7 ± 6.6 | 50.1 ± 2.9 | 102.6 ± 9.0 | nd | 78.3 ± 5.7 |
| Glutamic acid | 69.3 ± 1.9 | 64.3 ± 2.2 | 37.9 ± 1.3 | 170.1 ± 8.9 | nd | 62.1 ± 2.2 |
| Glycine | 3.6 ± 1.6 | 32.2 ± 0.4 | 6.5 ± 0.2 | 19.6 ± 4.2 | nd | 10.3 ± 0.8 |
| Histidine | 82.8 ± 4.9 | 77.4 ± 3.3 | 33.0 ± 0.2 | 37.3 ± 1.3 | 5.7 ± 0.1 | 93.6 ± 2.7 |
| Isoleucine | 234.6 ± 24.3 | 224.9 ± 13.6 | 212.4 ± 4.8 | 78.2 ± 3.4 | 2.8 ± 0.2 | 233.8 ± 12.0 |
| Leucine | 353.9 ± 17.2 | 379.7 ± 17.9 | 249.4 ± 23.0 | 141.4 ± 13.1 | 0.6 ± 0.0 | 380.2 ± 36.1 |
| Lysine | 64.0 ± 5.9 | 77.0± 2.0 | 19.2 ± 3.4 | 63.6 ± 1.2 | nd | 31.3 ± 2.7 |
| Methionine | 13.8 ± 1.2 | 27.3 ± 0.5 | 0.6 ± 0.1 | 25.4 ± 1.5 | nd | 5.8 ± 0.6 |
| Phenylalanine | 230.5 ± 7.5 | 144.3 ± 11.8 | 78.0 ± 7.0 | 80.1 ± 2.0 | 6.0 ± 0.3 | 254.1 ± 12.0 |
| Proline | 105.9 ± 4.8 | 186.5 ± 10.9 | 52.3 ± 2.3 | 16.2 ± 2.1 | nd | 81.3 ± 4.6 |
| Serine | 144.6 ± 17.2 | 189.6 ± 13.7 | 103.0 ± 10.8 | 66.3 ± 8.7 | nd | 129.0 ± 7.2 |
| Threonine | 257.5 ± 28.0 | 308.6 ± 24.5 | 209.5 ± 15.6 | 132.6 ± 13.9 | 9.9 ± 0.6 | 241.5 ± 22.9 |
| Tyrosine | 18.6 ± 2.9 | 40.2 ± 3.7 | 12.2 ± 1.1 | 11.3 ± 2.1 | nd | 16.2 ± 0.6 |
| Valine | 165.9 ± 9.9 | 178.9 ± 12.3 | 119.4 ± 3.9 | 44.6 ± 3.6 | nd | 131.8 ± 9.4 |
| Total | 2406.7 | 2466.9 | 1589.7 | 1363.9 | 24.9 | 2260.2 |
| Spectrophotometry, % | ||||||
| Hydroxycinnamic acids (chlorogenic acid equivalents, spectrophotometry) | 6.33 ± 0.33 | 6.52 ± 0.71 | 5.01 ± 0.68 | 4.67 ± 0.47 | 0.46 ± 0.05 | 6.24 ± 0.67 |
| Flavonoids (rutin equivalents, spectrophotometry) | 12.35 ± 0.79 | 12.60 ± 0.89 | 9.88 ± 0.63 | 9.21 ± 0.56 | 0.87 ± 0.08 | 11.74 ± 0.78 |
| Total phenolic compounds (gallic acid equivalents, spectrophotometry) | 28.53 ± 0.67 | 29.53 ± 0.53 | 22.28 ± 0.78 | 20.53 ± 1.03 | 1.93 ± 0.07 | 27.53 ± 1.18 |
The cytotoxic effects of various G. capitata extracts on HaCaT were evaluated using a cell viability assay across a range of concentrations (0.002 to 0.5 μg/μL, Fig. 1). At the highest tested concentration (0.5 μg/μL), extract G1 significantly reduced cell viability to 34.0 ± 0.9% (p < 0.0001), indicating strong cytotoxicity, particularly at 0.5 and 0.25 μg/μL. Similarly, G2 showed a reduction in cell viability to 37.9 ± 0.7% (p < 0.0001), and these toxic effects were evident across a wide range of concentrations, from 0.5 to 0.06 μg/μL. G3, in contrast, exhibited relatively mild toxicity, with a cell viability of 73.8 ± 10.6% (p < 0.01) observed at the highest concentration tested, suggesting that cytotoxic effects were limited to the highest dose. G4 demonstrates considerable toxicity, reducing viability to 30.8 ± 0.3% (p < 0.0001), with all tested concentrations showing suppressed cell growth. G5, display no observable cytotoxicity, maintaining 96.5 ± 2.7% cell viability even at the highest concentration. Interestingly, lower concentrations of G5 (0.06 to 0.002 μg/μL) appear to promote cell proliferation, suggesting a possible stimulatory effect on keratinocyte growth. G6 showed a similar toxicity profile to G1 and G2, with a viability of 31.3 ± 0.7% at 0.5 μg/μL and toxic effects noted at concentrations down to 0.13 μg/μL.
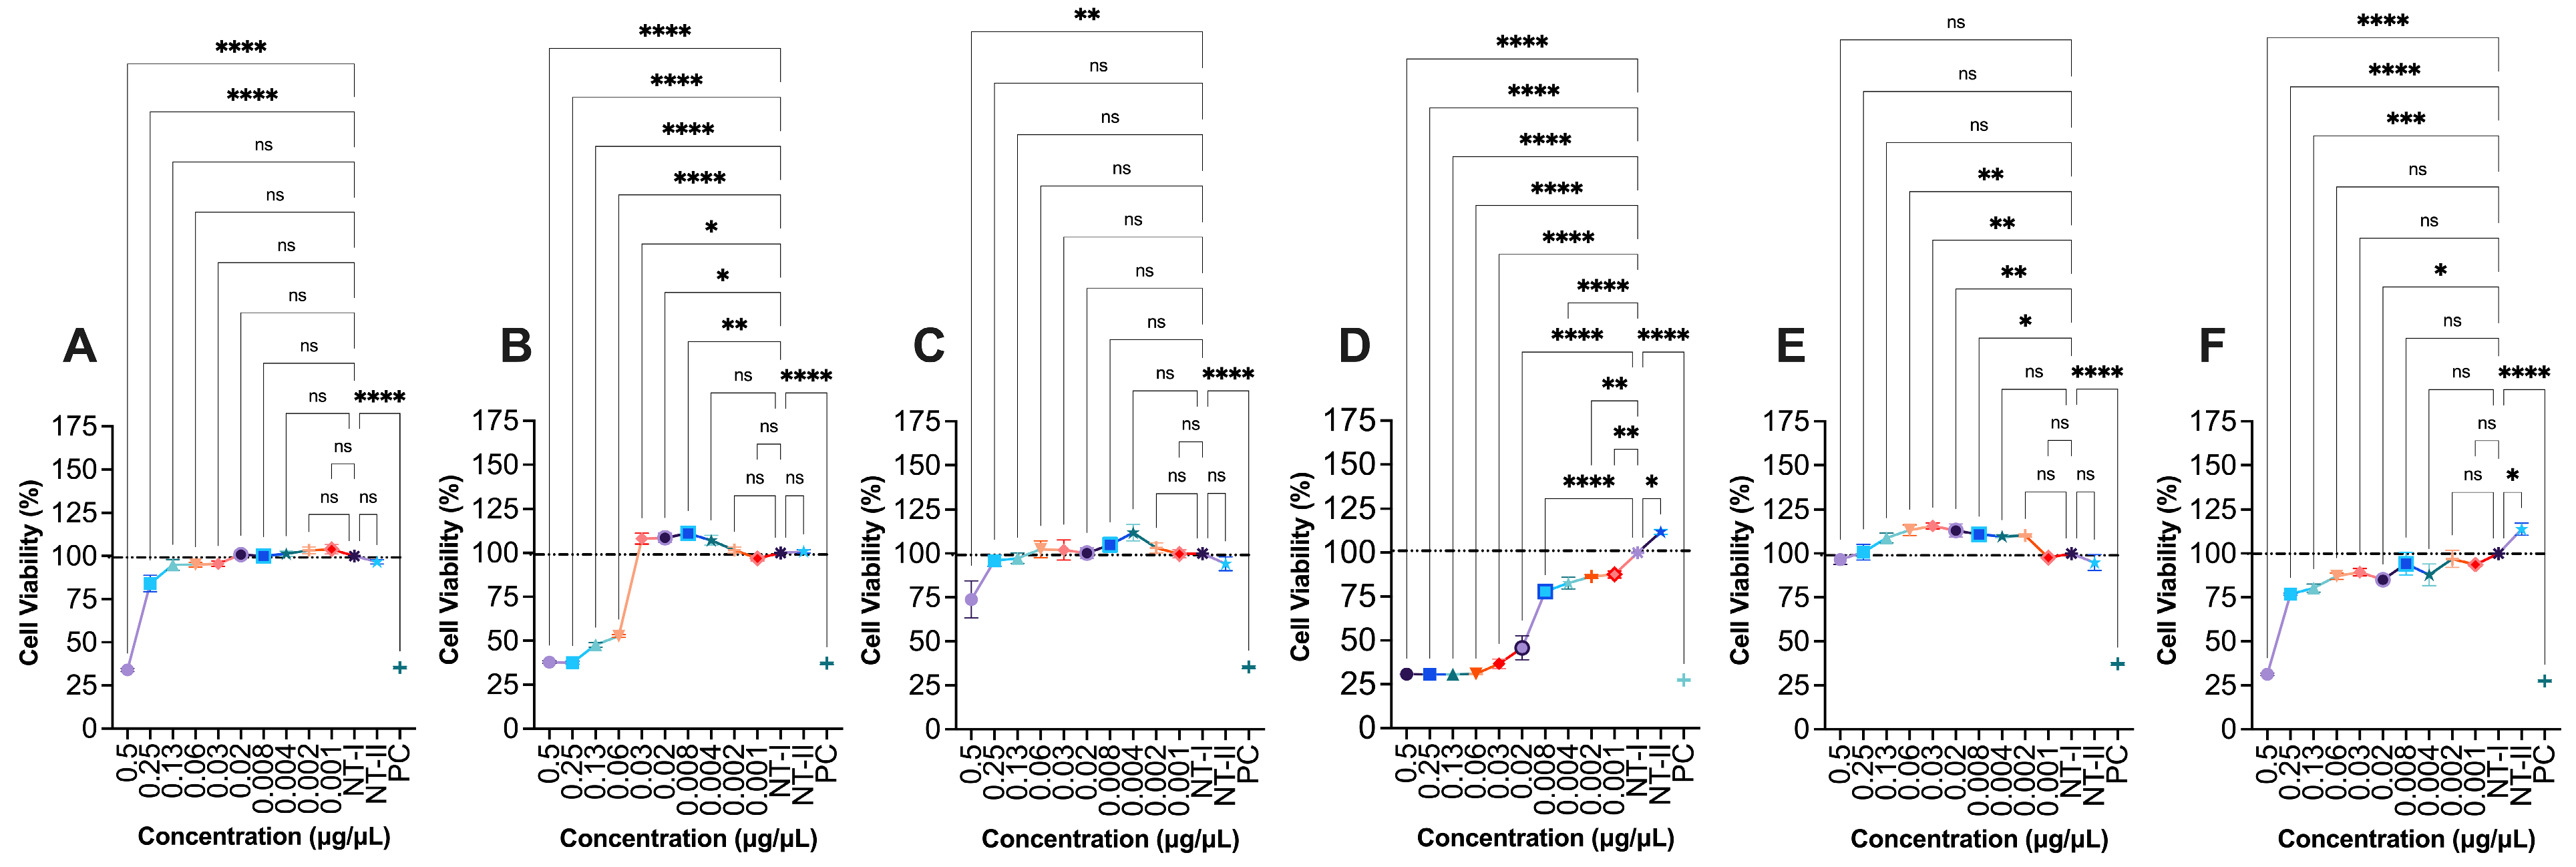
Figure 1: Effect of G1-G6 (0.1–0.0004 μg/μL) extracts on HaCaT (Human keratinocytes) cells viability. (A) G1, (B) G2, (C) G3, (D) G4, (E) G5, (F) G6. NT-I–no treatment; 1% DMSO in cell culture media. NT-II–no treatment; Milli-Q water (1 μL) in cell culture media. Mito–Mitomycin-C (0.004 μg/μL) is used as a negative control (NC). 70% ethanol was used as a positive control (PC). Values are expressed as mean ± SE. ****p < 0.0001, ***p < 0.001, **p < 0.01, and *p < 0.05 were considered statistically significant compared to the control group. (*) indicates a statistically significant difference, and (ns) indicates no significant difference from the respective group using ANOVA, followed by Dunnett’s multiple comparison test.
3.3.2 HaCaT Cell Proliferation
At a low concentration of 0.0008 μg/μL, only G2 and G5 exhibited a significant proliferative effect on HaCaT keratinocyte cells after 24 h of exposure (Fig. 2). Specifically, G2 increased cell viability to 111.1 ± 3.9% (p < 0.01), while G5 enhanced viability to 110.8 ± 1.7% (p < 0.01). None of the other extracts demonstrated a proliferative effect at this or any other tested concentration. Interestingly, although G2 initially promoted proliferation at 24 h, prolonged exposure revealed a delayed cytotoxic effect. Viability dropped markedly to 36.0 ± 4.4% at 48 h and further to 25.0 ± 6.1% at 72 h (p < 0.0001 for both), indicating a strong time-dependent cytotoxic or proliferation-inhibitory activity of this extract on HaCaT cells.
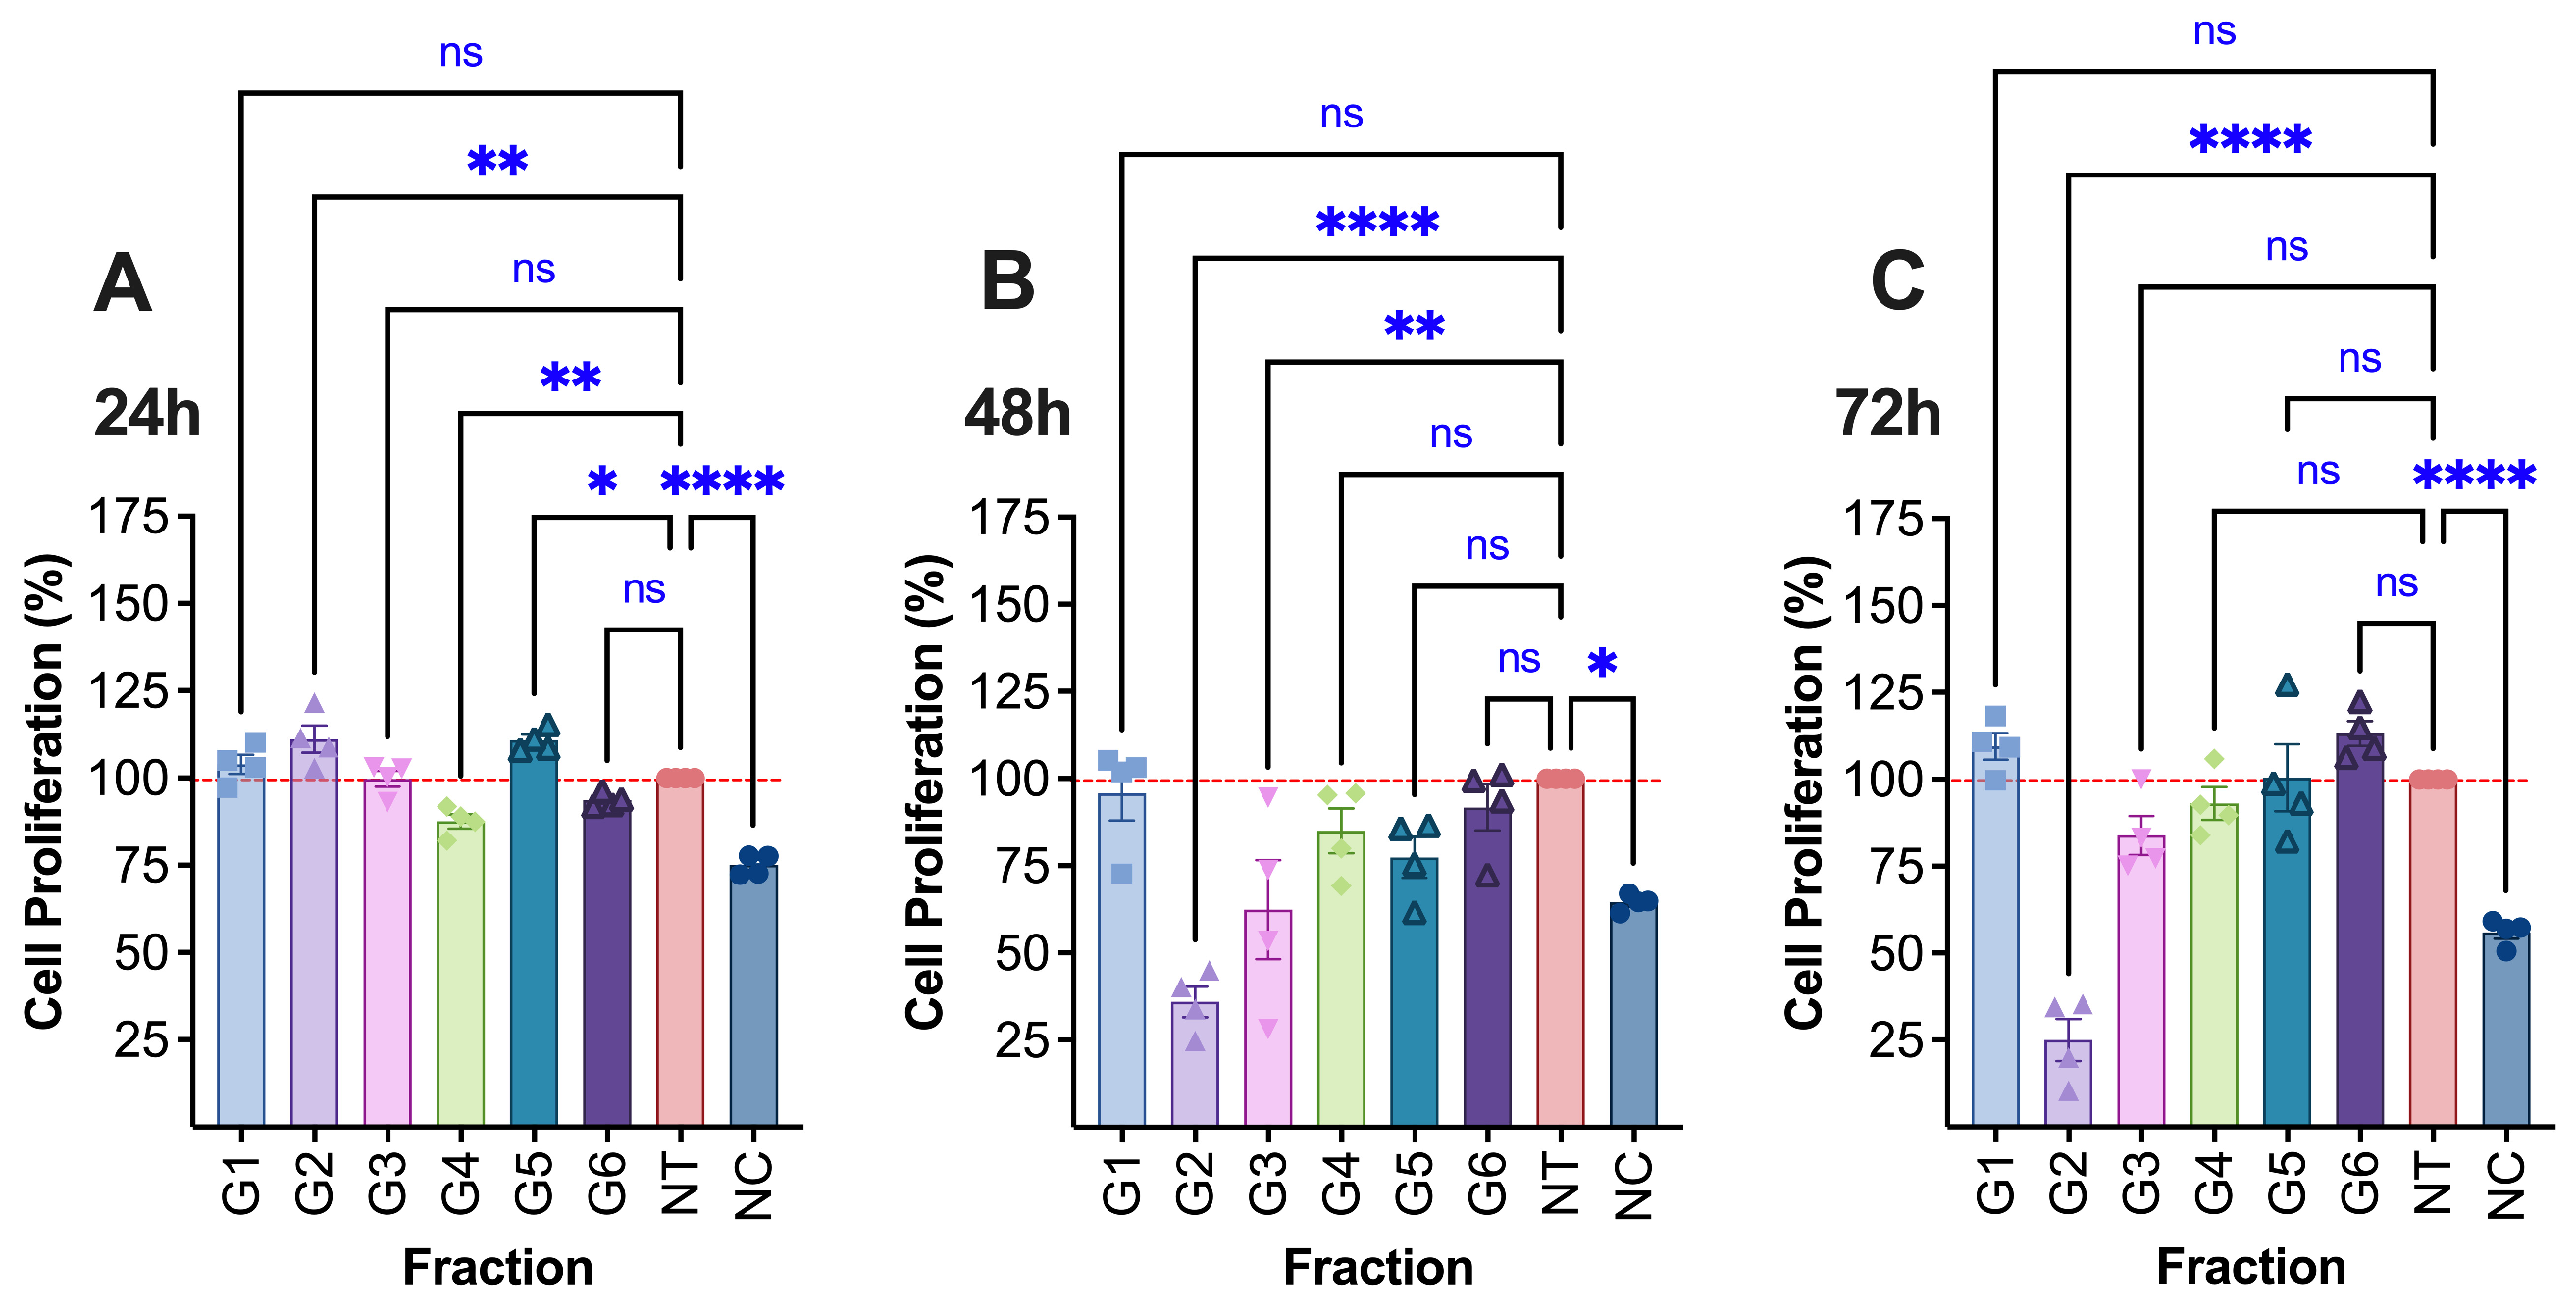
Figure 2: The proliferation (detected by alamarBlue assay, test solution concentration: G1: 0.001 μg/μL, G2: 0.008 μg/μL, G3: 0.001 μg/μL, G4: 0.001 μg/μL, G5: 0.008 μg/μL, G6: 0.001 μg/μL) of treated HaCaT (Human keratinocytes) cells at (A) 24 h, (B) 48 h and (C) 72 h. NT–no treatment; 1% DMSO in cell culture media. Mito–Mitomycin-C (0.004 μg/μL) is used as a negative control (NC). Values are expressed as mean ± SE. ****p < 0.0001, ***p < 0.001 (if it had occurred in this figure), **p < 0.01, and *p < 0.05 were considered statistically significant compared to the control group. (*) indicates a statistically significant difference, and (ns) indicates no significant difference from the respective group using one-way-ANOVA, followed by Dunnett's multiple comparison test.
In the in vitro starch-wound healing assay, extracts G1–G3 demonstrated a notably reduced migratory capacity compared to the control, suggesting a potential inhibitory effect on keratinocyte wound closure or regenerative behaviour (Fig. 3).
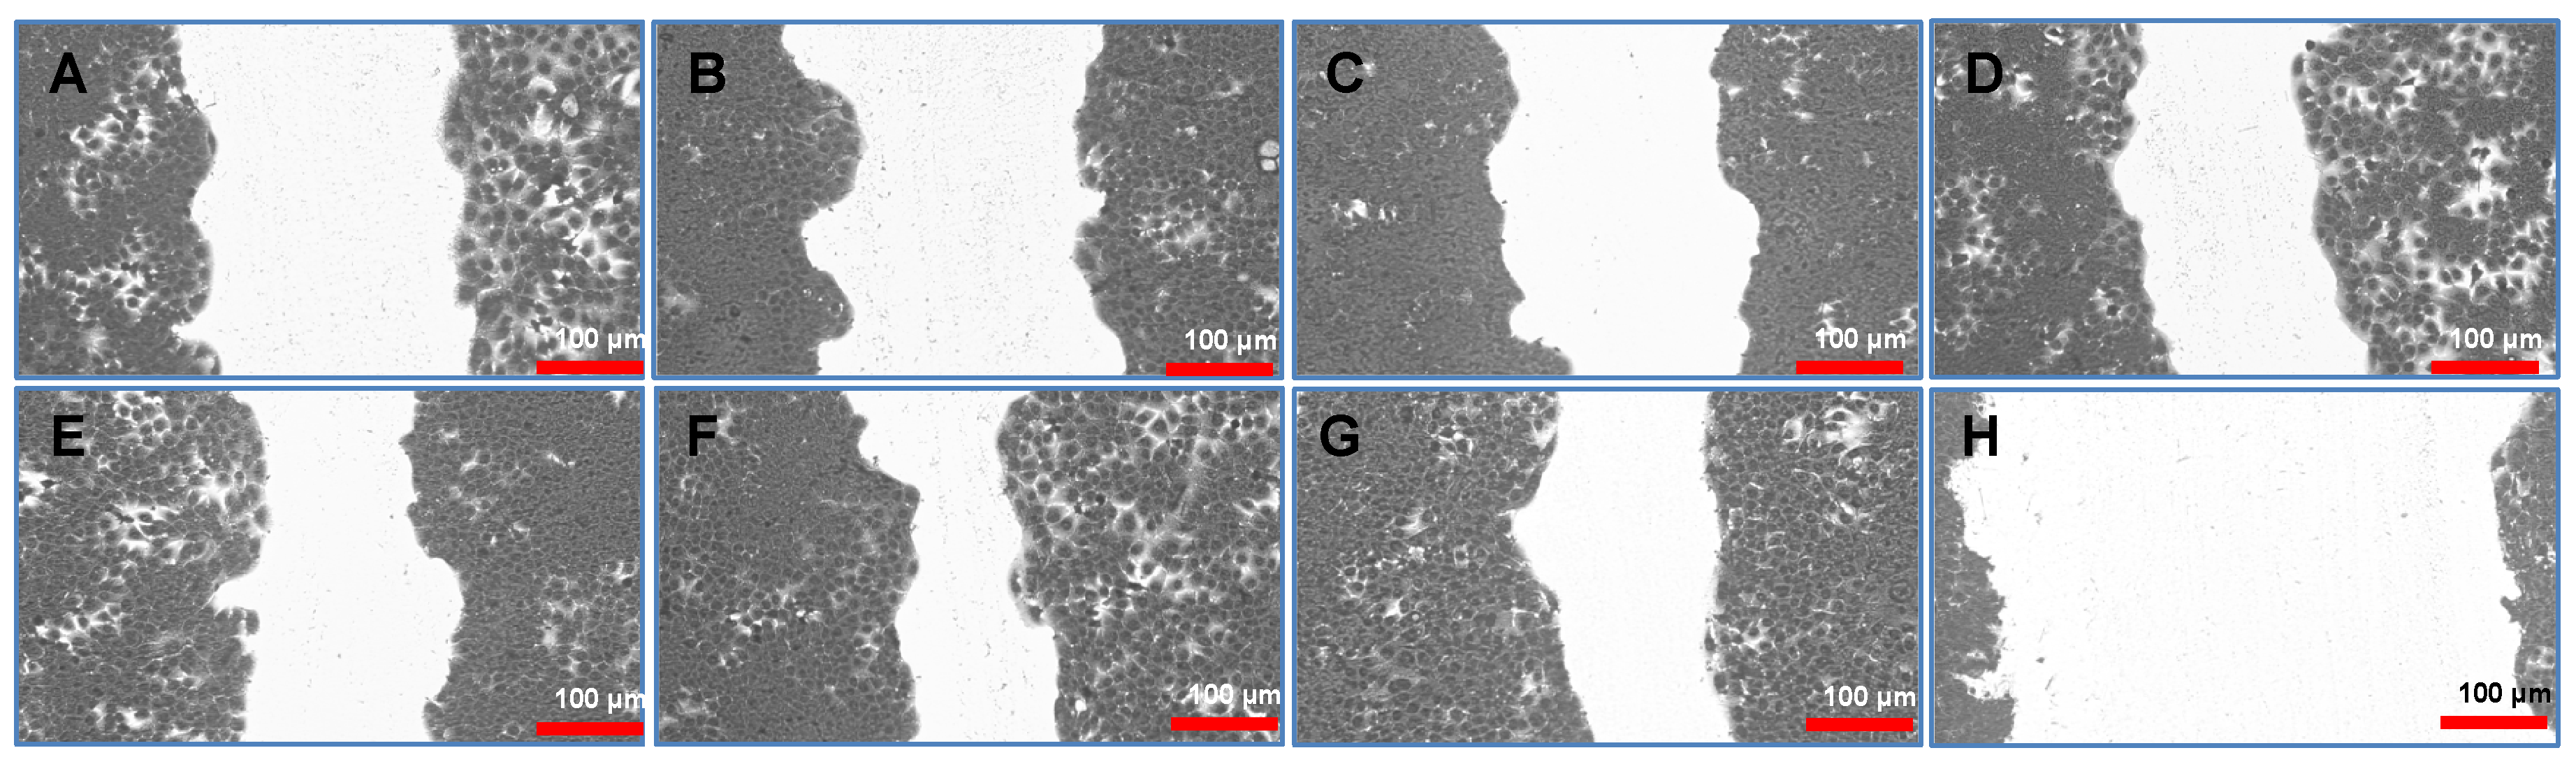
Figure 3: HaCaT cell migration by in vitro starch-wound healing assay at 24 h. (A) G1: 0.001 μg/μL, (B) G2: 0.008 μg/μL, (C) G3: 0.001 μg/μL, (D) G4: 0.001 μg/μL, (E) G5: 0.008 μg/μL, (F) G6: 0.001 μg/μL, (G) NT—No treatment. (H) PC—Positive control (Mito–Mitomycin-C (0.04 μg/μL to inhibit cell migration).
3.3.4 Propidium Iodide (PI) Staining
All treated samples (G1–G6) and the control group (I—1% DMSO) exhibited low or negligible PI staining, comparable to baseline levels observed in the negative and/or positive control. Cells treated with G4 appeared morphologically similar to untreated controls (Fig. 4), with very few PI-positive cells, even fewer than those observed in the DMSO-treated group.
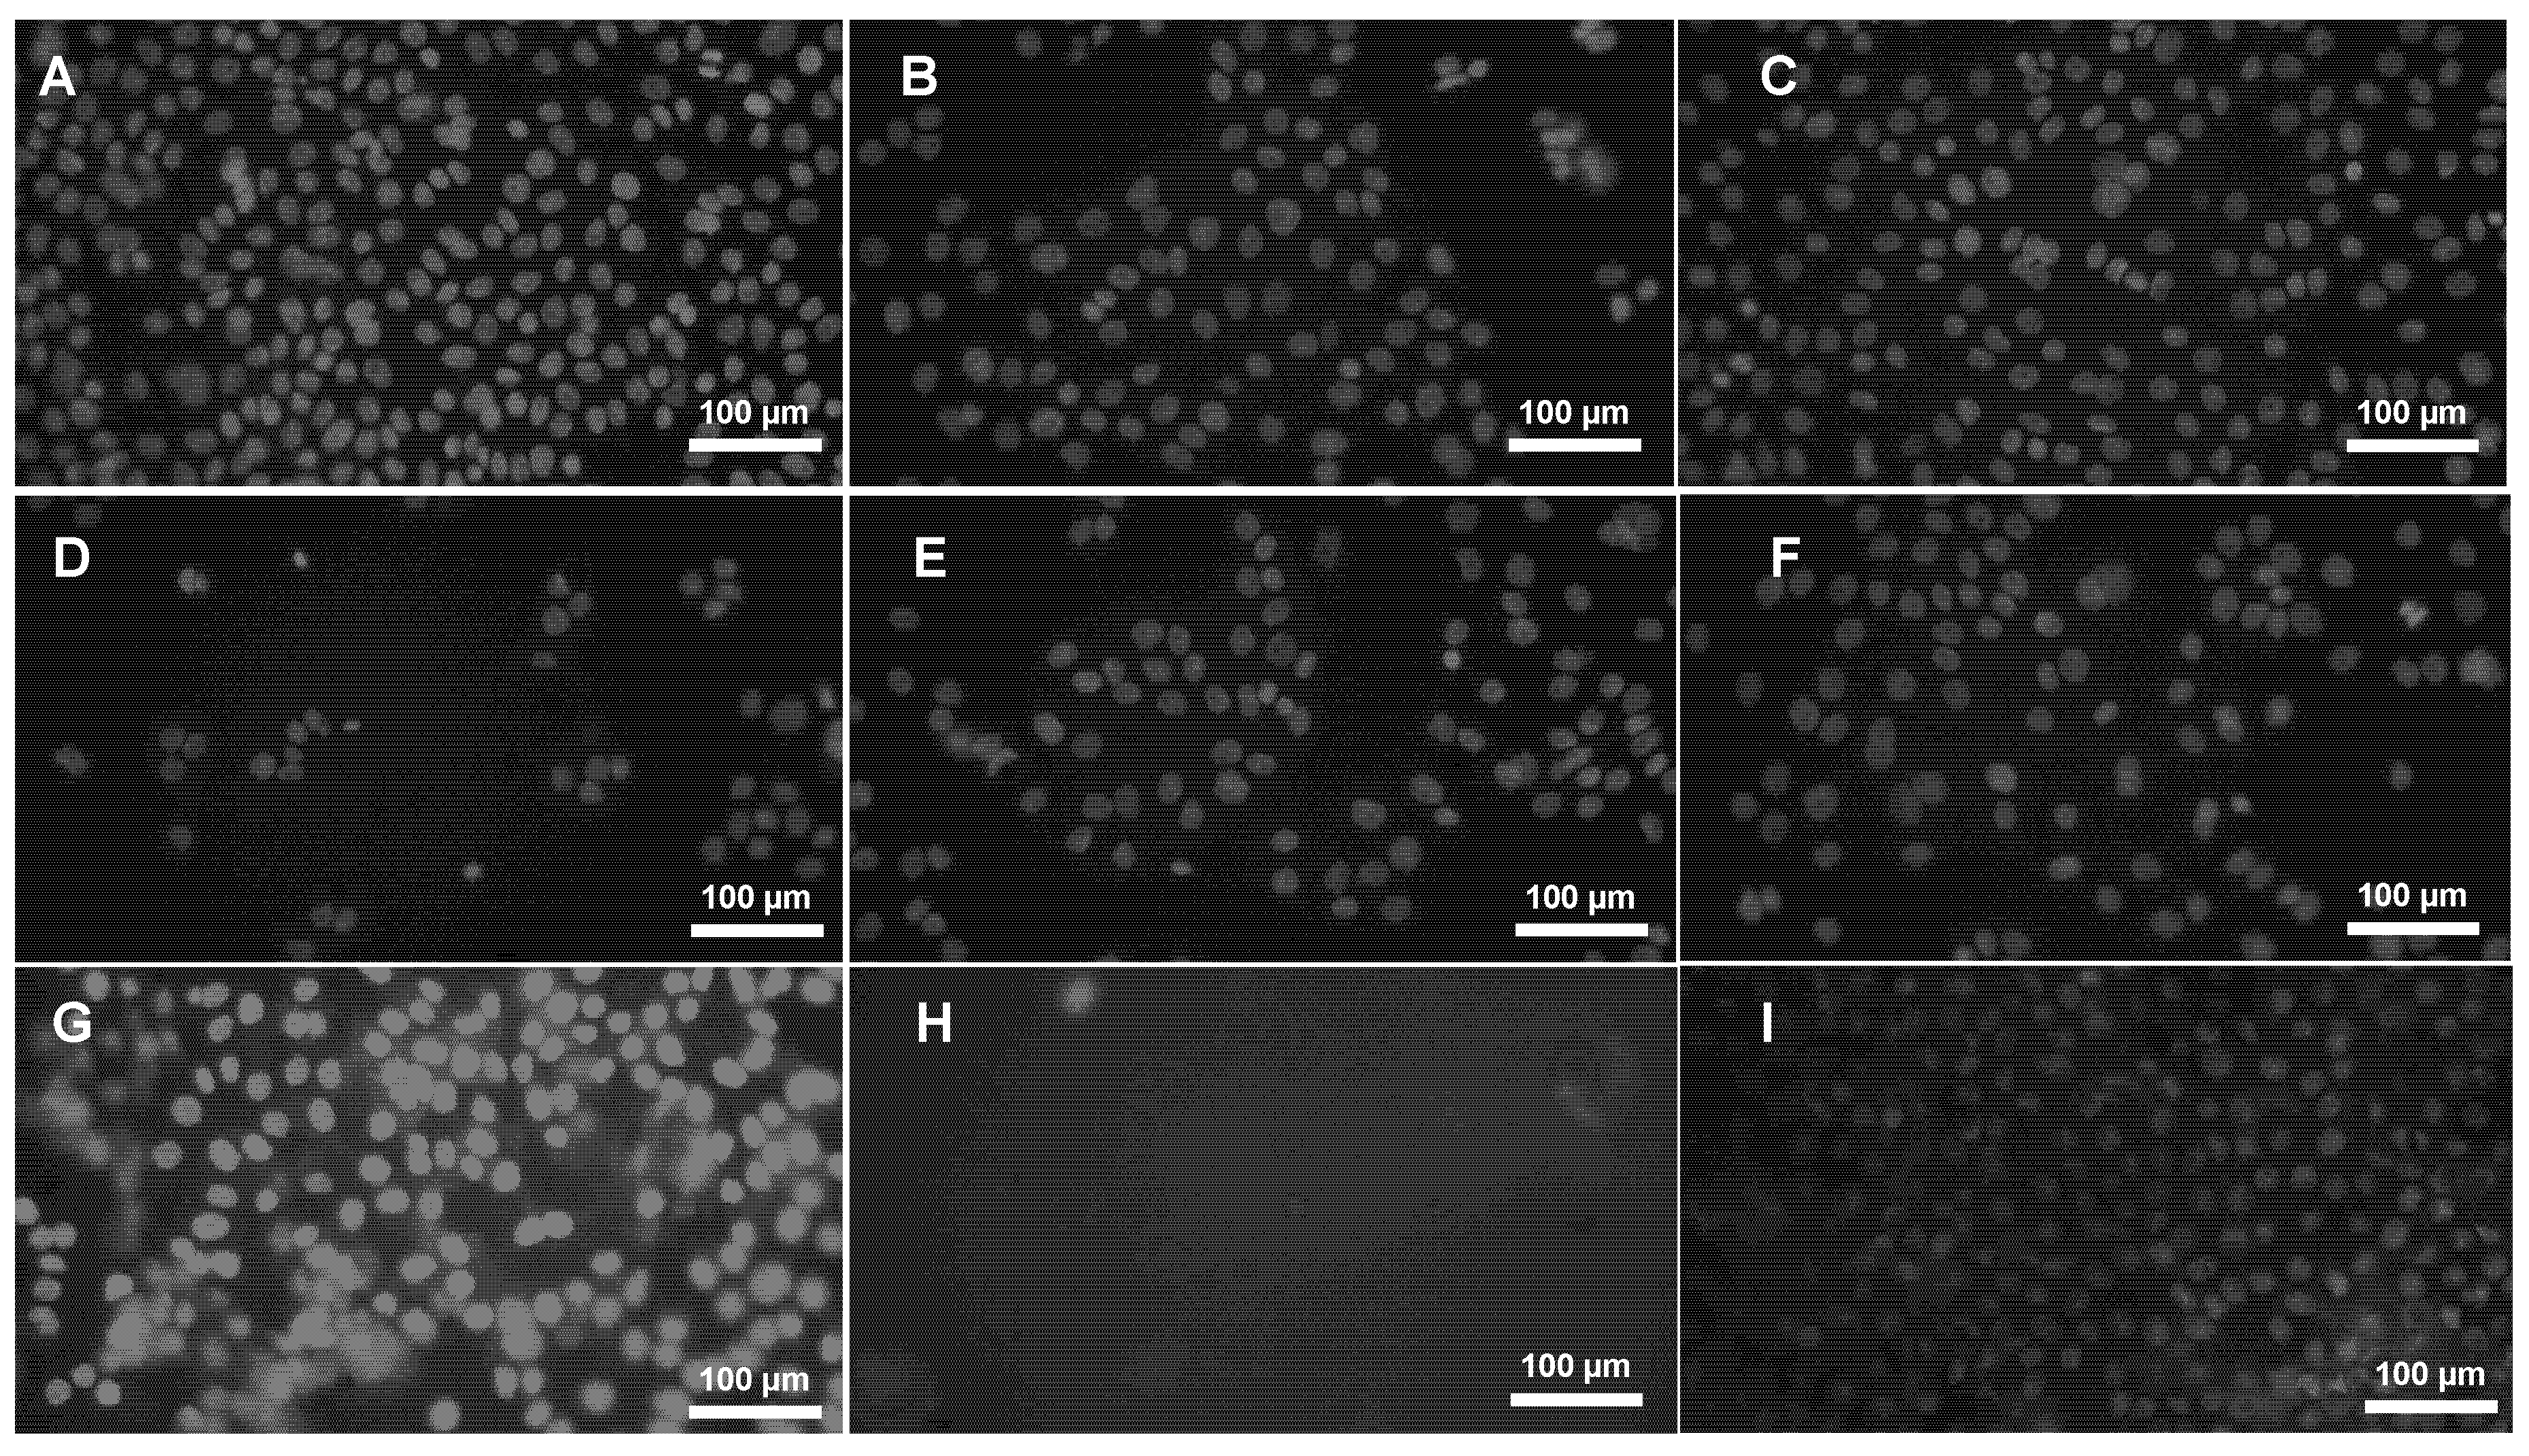
Figure 4: Propidium Iodide (PI) staining. Test solutions were treated with HaCaT cells for 72 h to check the prolonged exposure toxicity effect. (A) G1: 0.001 μg/μL, (B) G2: 0.008 μg/μL, (C) G3: 0.001 μg/μL, (D) G4: 0.001 μg/μL, (E) G5: 0.008 μg/μL, (F) G6: 0.001 μg/μL, (G) PC—Positive control (70% ethanol to kill cells), (H) NT—No treatment (only cell culture media), I: NT–no treatment; 1% DMSO in cell culture media.
3.3.5 Nitric Oxide (NO) Production in HaCaT Cells
Herb extract in 70% ethanol (G1) significantly increased inflammatory NO production to 39.34 ± 1.67 μM (p < 0.01) at a concentration of 0.001 μg/μL, indicating a pro-inflammatory effect. Similarly, G6 exhibited an elevated inflammatory response, with levels reaching 37.54 ± 3.14 μM (p < 0.05) at the same concentration. In contrast, only G5 demonstrated a significant anti-inflammatory effect (Fig. 5). At a concentration of 0.008 μg/μL, G5 markedly reduced NO levels to 8.81 ± 1.14 μM (p < 0.0001), highlighting its potential as an effective anti-inflammatory agent in keratinocyte-based models.
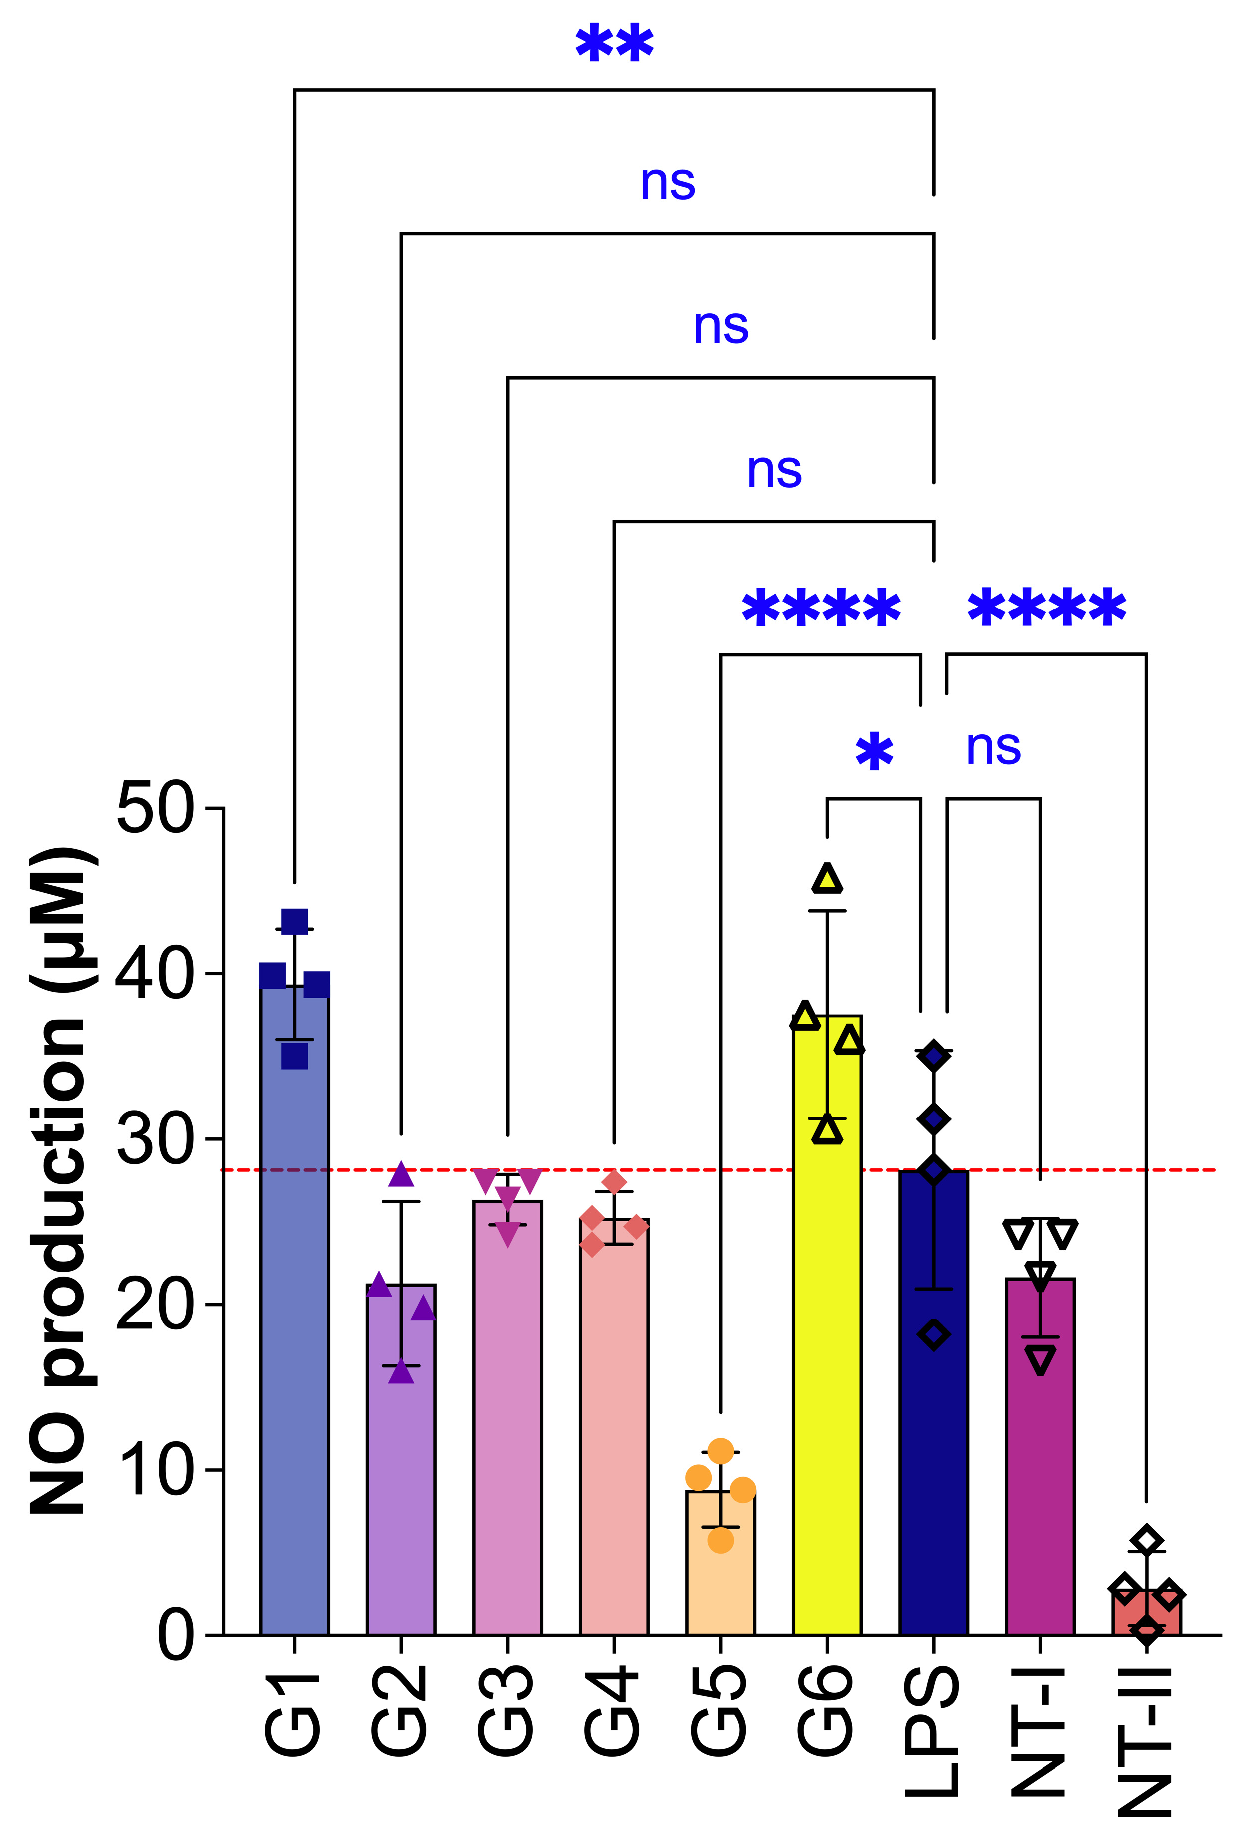
Figure 5: Anti-inflammatory effect of treated HaCaT (Human keratinocytes) cells; G1: 0.001 μg/μL, G2: 0.008 μg/μL, G3: 0.001 μg/μL, G4: 0.001 μg/μL, G5: 0.008 μg/μL, G6: 0.001 μg/μL), NT-I–no treatment; 1% DMSO in cell culture media. NT-II–no treatment; Milli-Q water (1 μL) in cell culture media. Mito–Mitomycin-C (0.004 μg/μL) is used as a negative control (NC). Lipopolysaccharide (LPS—50 ng/mL) was used to stimulate the cells, and Milli-Q water served as the control (NT—no treatment). Values are expressed as mean ± SE. Statistical significance was determined by ANOVA followed by Dunnett’s multiple comparison test, with ****p < 0.0001, ***p < 0.001 (if it had occurred in this figure), **p < 0.01, and *p < 0.05 vs. control. (*) indicates a statistically significant difference; (ns) indicates no significant difference from the respective group.
3.3.6 Expression of TNF-α and TGF-β Cytokines in HaCaT Cells
To evaluate the inflammatory and regenerative effects of G. capitata extracts on HaCaT cells, the expression levels of TNF-α and TGF-β were measured following treatment with G1, G5, and LPS as a positive control (Fig. 6). For TNF-α, the LPS-treated group showed elevated expression (3.19 ± 0.85%), confirming its role as an inflammatory stimulus mediator. G1-treated cells showed a moderately lower TNF-α level (2.29 ± 0.44%), while G5-treated cells exhibited minimal expression (0.38 ± 0.35%). These results suggested that neither G1 nor G5 significantly induced TNF-α in HaCaT cells under the tested conditions. In the TGF-β assay, the LPS group demonstrated a mean expression of 5.06 ± 0.61%. G1-treated cells showed low TGF-β expression (0.38 ± 0.47%), whereas G5 treatment resulted in slightly elevated levels (0.58 ± 0.45%), though still considerably lower than the LPS response.
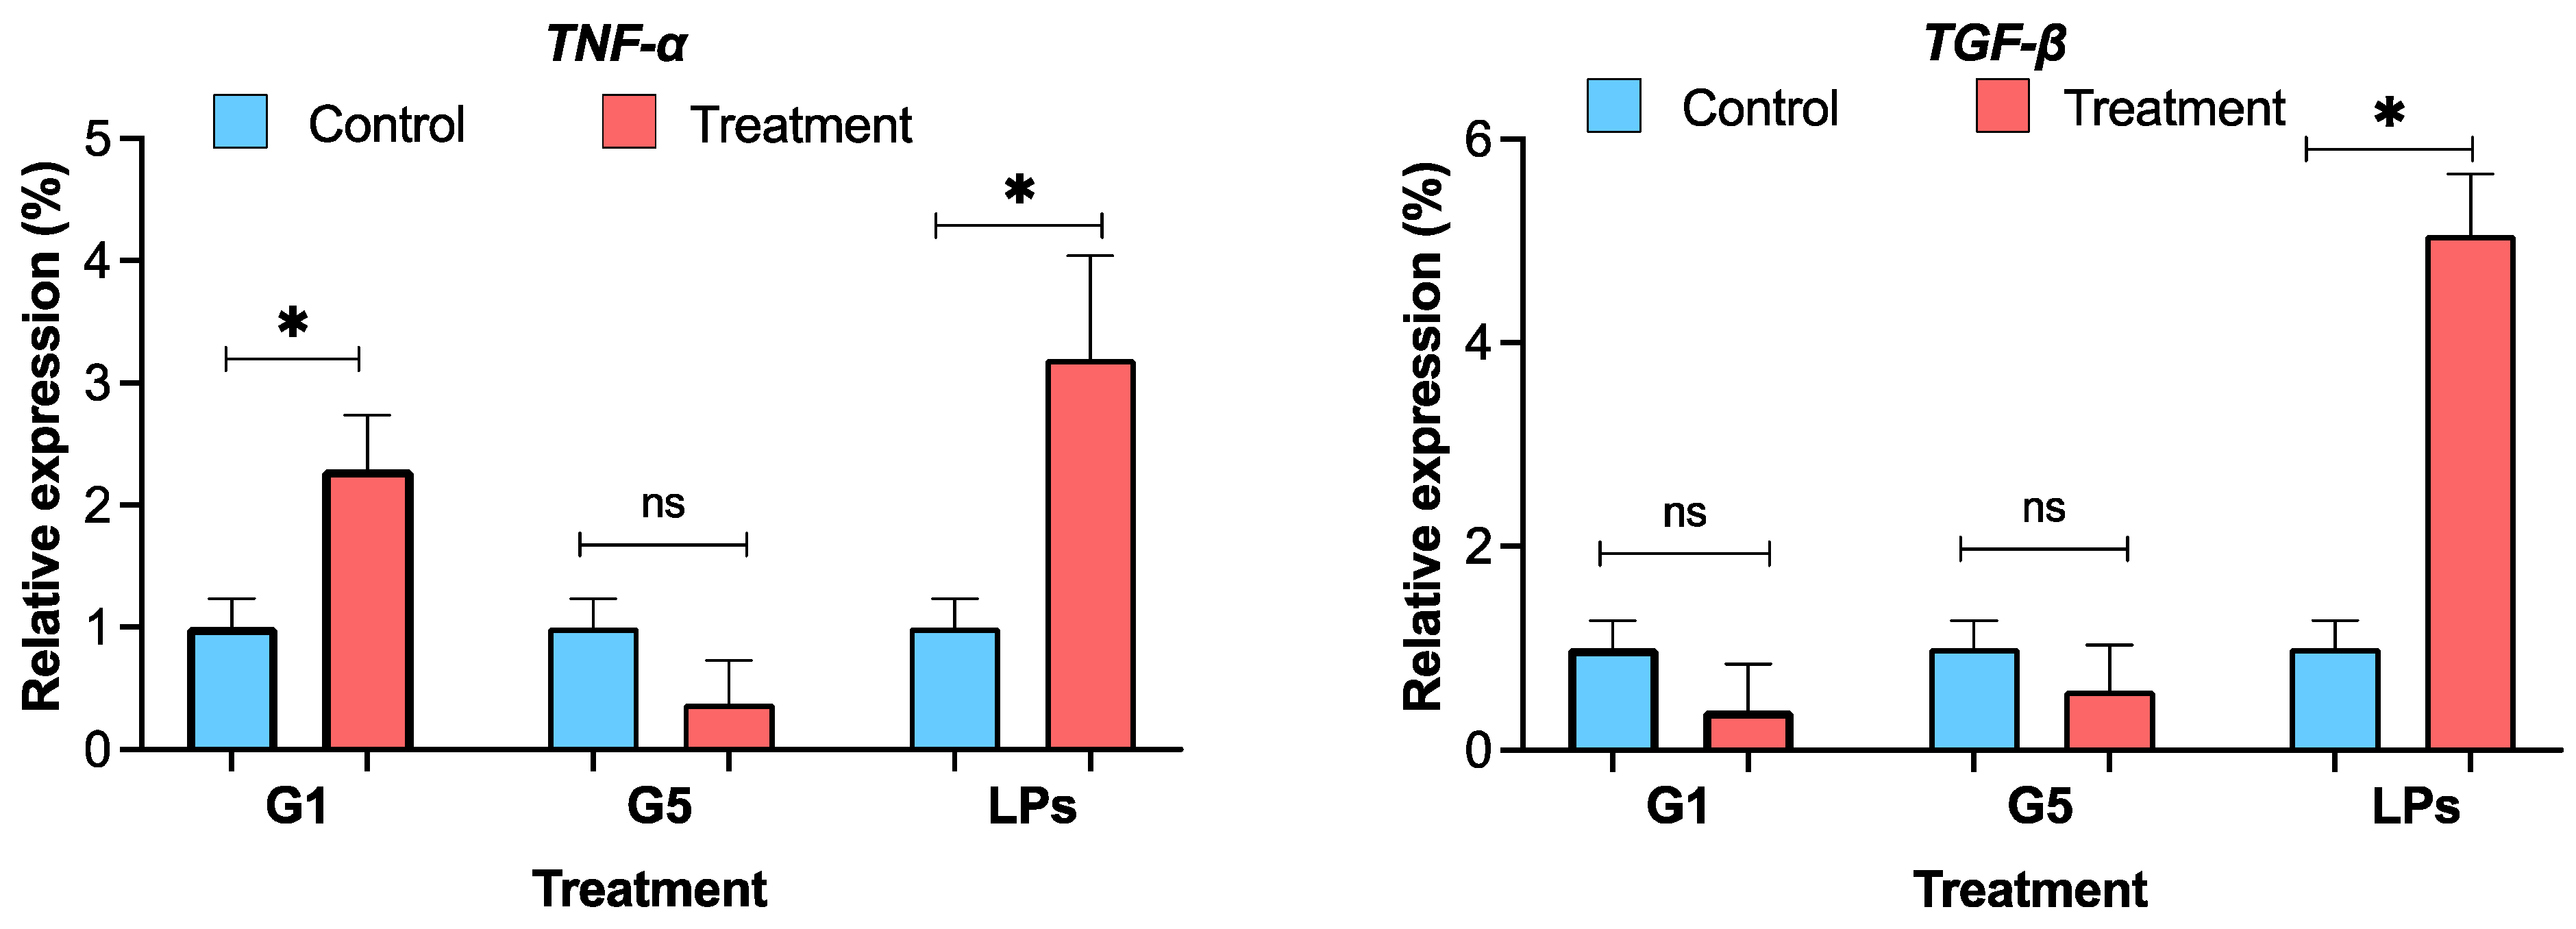
Figure 6: Cytokine expression of TNF-α and TGF-β profile in HaCaT (Human keratinocytes) cells treated with: G1: 0.001 μg/μL, G5: 0.008 μg/μL, NT-I–no treatment; 1% DMSO in cell culture media. NT-II–no treatment; Milli-Q water (1 μL) in cell culture media. Mito–Mitomycin-C (0.004 μg/μL) is used as a negative control (NC). Lipopolysaccharide (LPS—50 ng/mL) was used to stimulate the cells, and Milli-Q water served as the control (NT—no treatment). Values are expressed as mean ± SE. *p < 0.05 was considered statistically significant compared to the control group. (*) indicates a statistically significant difference, and (ns) indicates no significant difference from the respective group using ANOVA, followed by Dunnett’s multiple comparison test.
3.4 RAW264.7 Cells Bioactivities
3.4.1 Effects of G. capitata Extracts on RAW264.7 Cell Viability
To assess the cytotoxic potential of G. capitata extracts on immune cells, the viability of RAW264.7 murine macrophages was evaluated following treatment with six different plant extracts (G1–G6) across a concentration range of 0.0004 to 0.1 μg/μL (Fig. 7). G1 exhibited moderate cytotoxicity at higher concentrations, with cell viability reduced to 50.1 ± 3.9% (p < 0.0001) at 0.1 μg/μL. Toxic effects were evident at both 0.1 and 0.002 μg/μL, suggesting a relatively narrow therapeutic window. G2 displayed stronger cytotoxicity, reducing viability to 37.9 ± 0.7% (p < 0.0001) at the highest concentration, with toxicity observed at concentrations ranging from 0.1 to 0.001 μg/μL. G3 maintained better tolerability, with 73.8 ± 10.6% (p < 0.05) viability at 0.1 μg/μL, though cytotoxic effects became apparent between 0.05 and 0.006 μg/μL. G4 was among the most cytotoxic, decreasing cell viability to 30.8 ± 0.3% (p < 0.0001) at the highest concentration, with a broad range of tested concentrations (0.1 to 0.002 μg/μL) causing a substantial reduction in cell viability. In contrast, G5 was well tolerated by RAW264.7 cells, with a viability of 96.5 ± 2.7% at the highest concentration. Notably, this extract appeared to stimulate macrophage proliferation at lower concentrations (0.05 to 0.0002 μg/μL), indicating potential immunostimulatory effects. G6 demonstrated toxicity at intermediate concentrations (0.05 to 0.006 μg/μL), with a viability of 31.3 ± 0.7% (p < 0.0001) at 0.1 μg/μL.
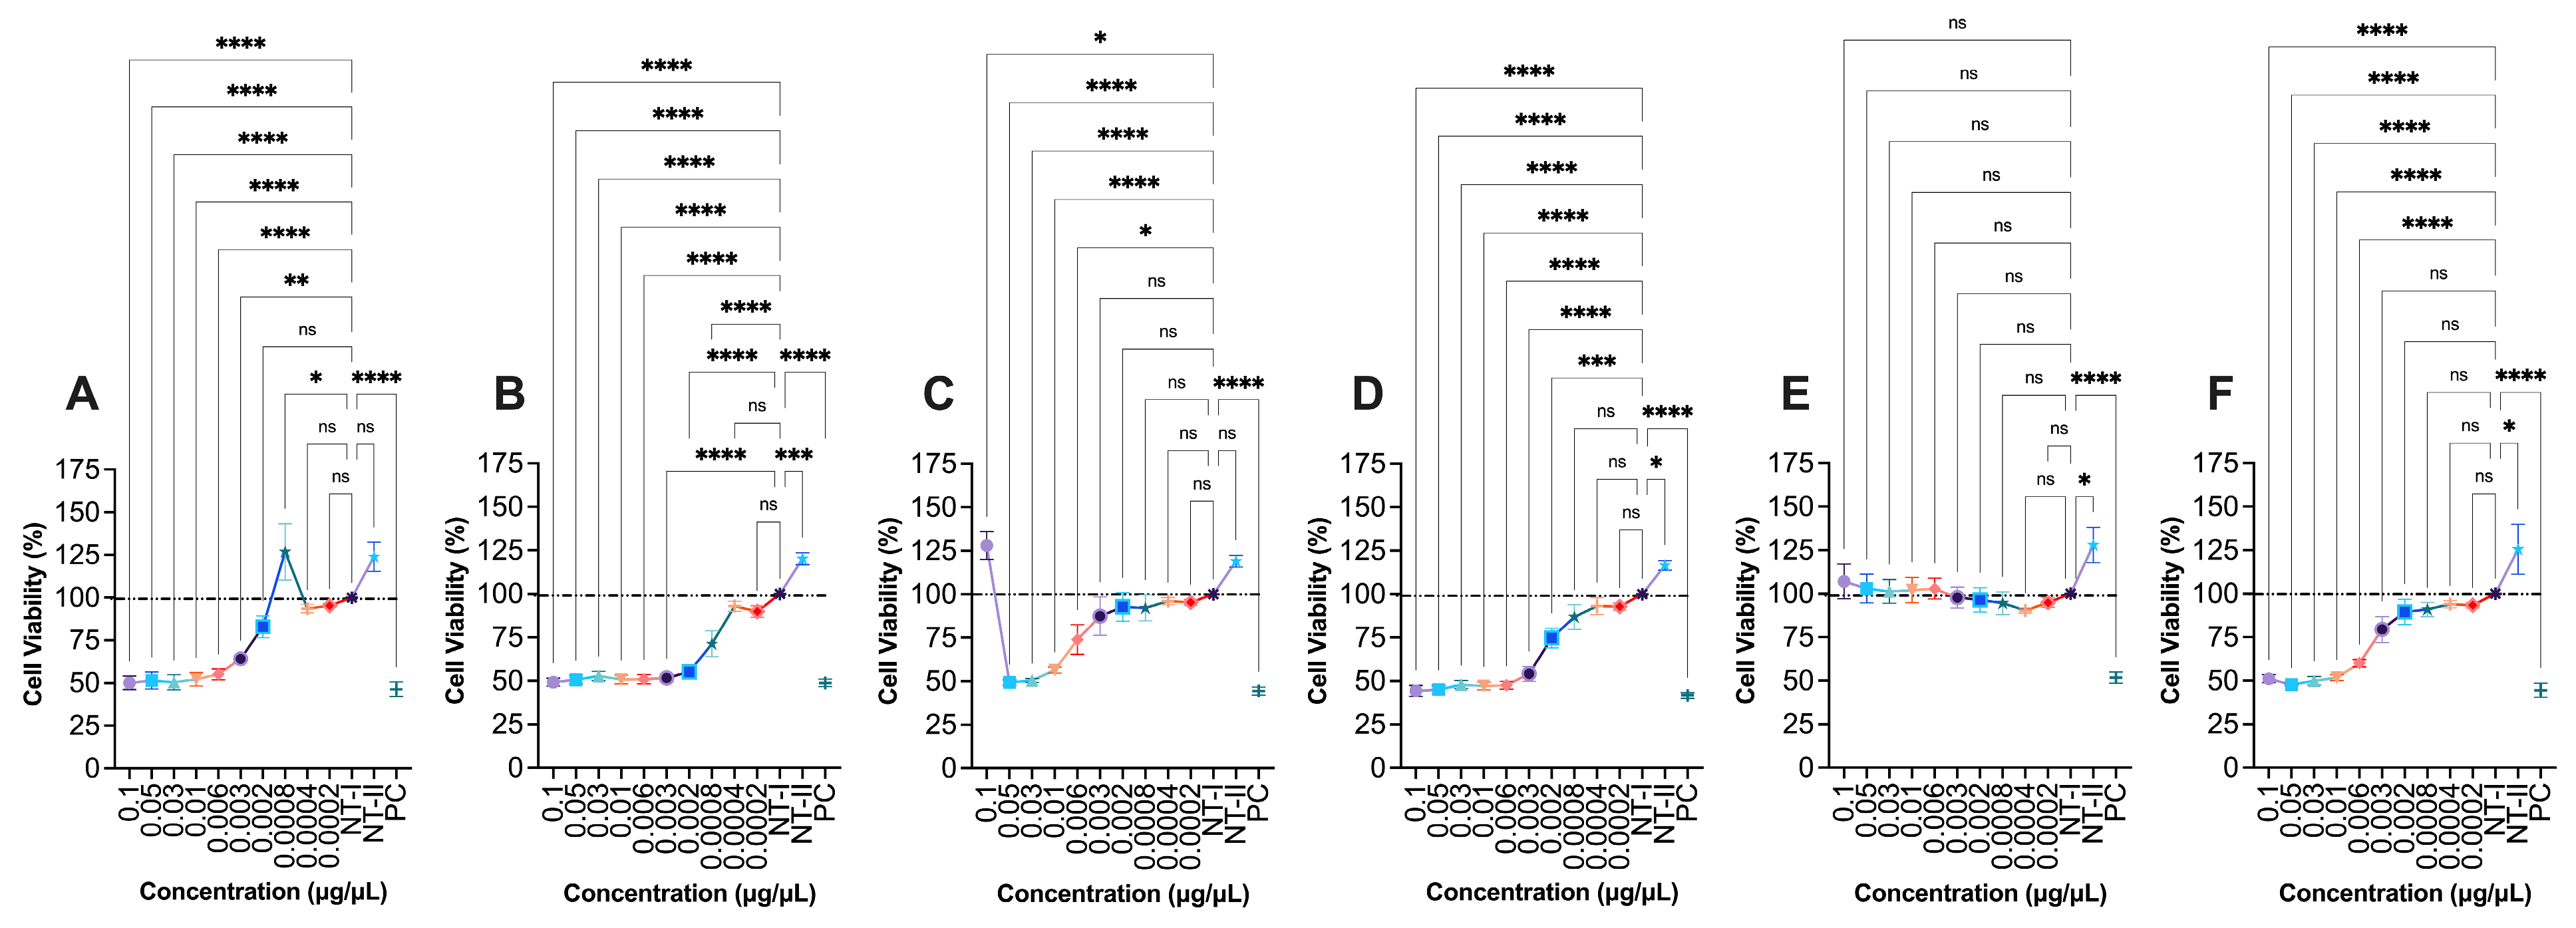
Figure 7: Effect of G1-G6 (0.1–0.0004 μg/μL) extracts on RAW264.7 murine macrophage cells viability. (A) G1, (B) G2, (C) G3, (D) G4, (E) G5, (F) G6. NT-I–no treatment; 1% DMSO in cell culture media. NT-II–no treatment; Milli-Q water (1 μL) in cell culture media. Mito–Mitomycin-C (0.004 μg/μL) is used as a negative control (NC). 70% ethanol was used as a positive control (PC). Values are expressed as mean ± SE. ****p < 0.0001, ***p < 0.001, **p < 0.01, and *p < 0.05 were considered statistically significant compared to the control group. (*) indicates a statistically significant difference, and (ns) indicates no significant difference from the respective group using ANOVA, followed by Dunnett’s multiple comparison test.
3.4.2 Phagocytosis Assay in RAW264.7 Cells
Among the tested samples, only G5 maintained relatively phagocytic activity, showing a mean value of 87.02 ± 0.14% (Fig. 8). This result suggested a preserved or slightly enhanced phagocytic response, similar to the untreated control (NT). In contrast, all other extracts showed reduced activity: G1 (53.1 ± 4.2%, p < 0.0001), G2 (69.1 ± 5.1%, p < 0.001), G3 (67.3 ± 10.11%, p < 0.001), G4 (62.1 ± 5.7%, p < 0.0001), and G6 (47.7 ± 3.6%, p < 0.0001). The observed decrease indicates a potential immunosuppressive effect or interference with macrophage function.

Figure 8: The phagocytosis activity of RAW264.7 cells. G1: 0.0002 μg/μL, G2: 0.0008 μg/μL, G3: 0.0002 μg/μL, G4: 0.0002 μg/μL, G5: 0.0008 μg/μL, G6: 0.0002 μg/μL, NT-I–no treatment; 1% DMSO in cell culture media. NT-II–no treatment; Milli-Q water (1 μL) in cell culture media. Mito–Mitomycin-C (0.004 μg/μL) is used as a negative control (NC). Values are expressed as mean ± SE. Statistical significance was determined by ANOVA followed by Dunnett’s multiple comparison test, with ****p < 0.0001, ***p < 0.001, (ns) indicates no significant.
3.4.3 Microscopic Evaluation of RAW264.7 Cells
The results of microscopic evaluations of RAW264.7 cells are presented (Fig. 9).
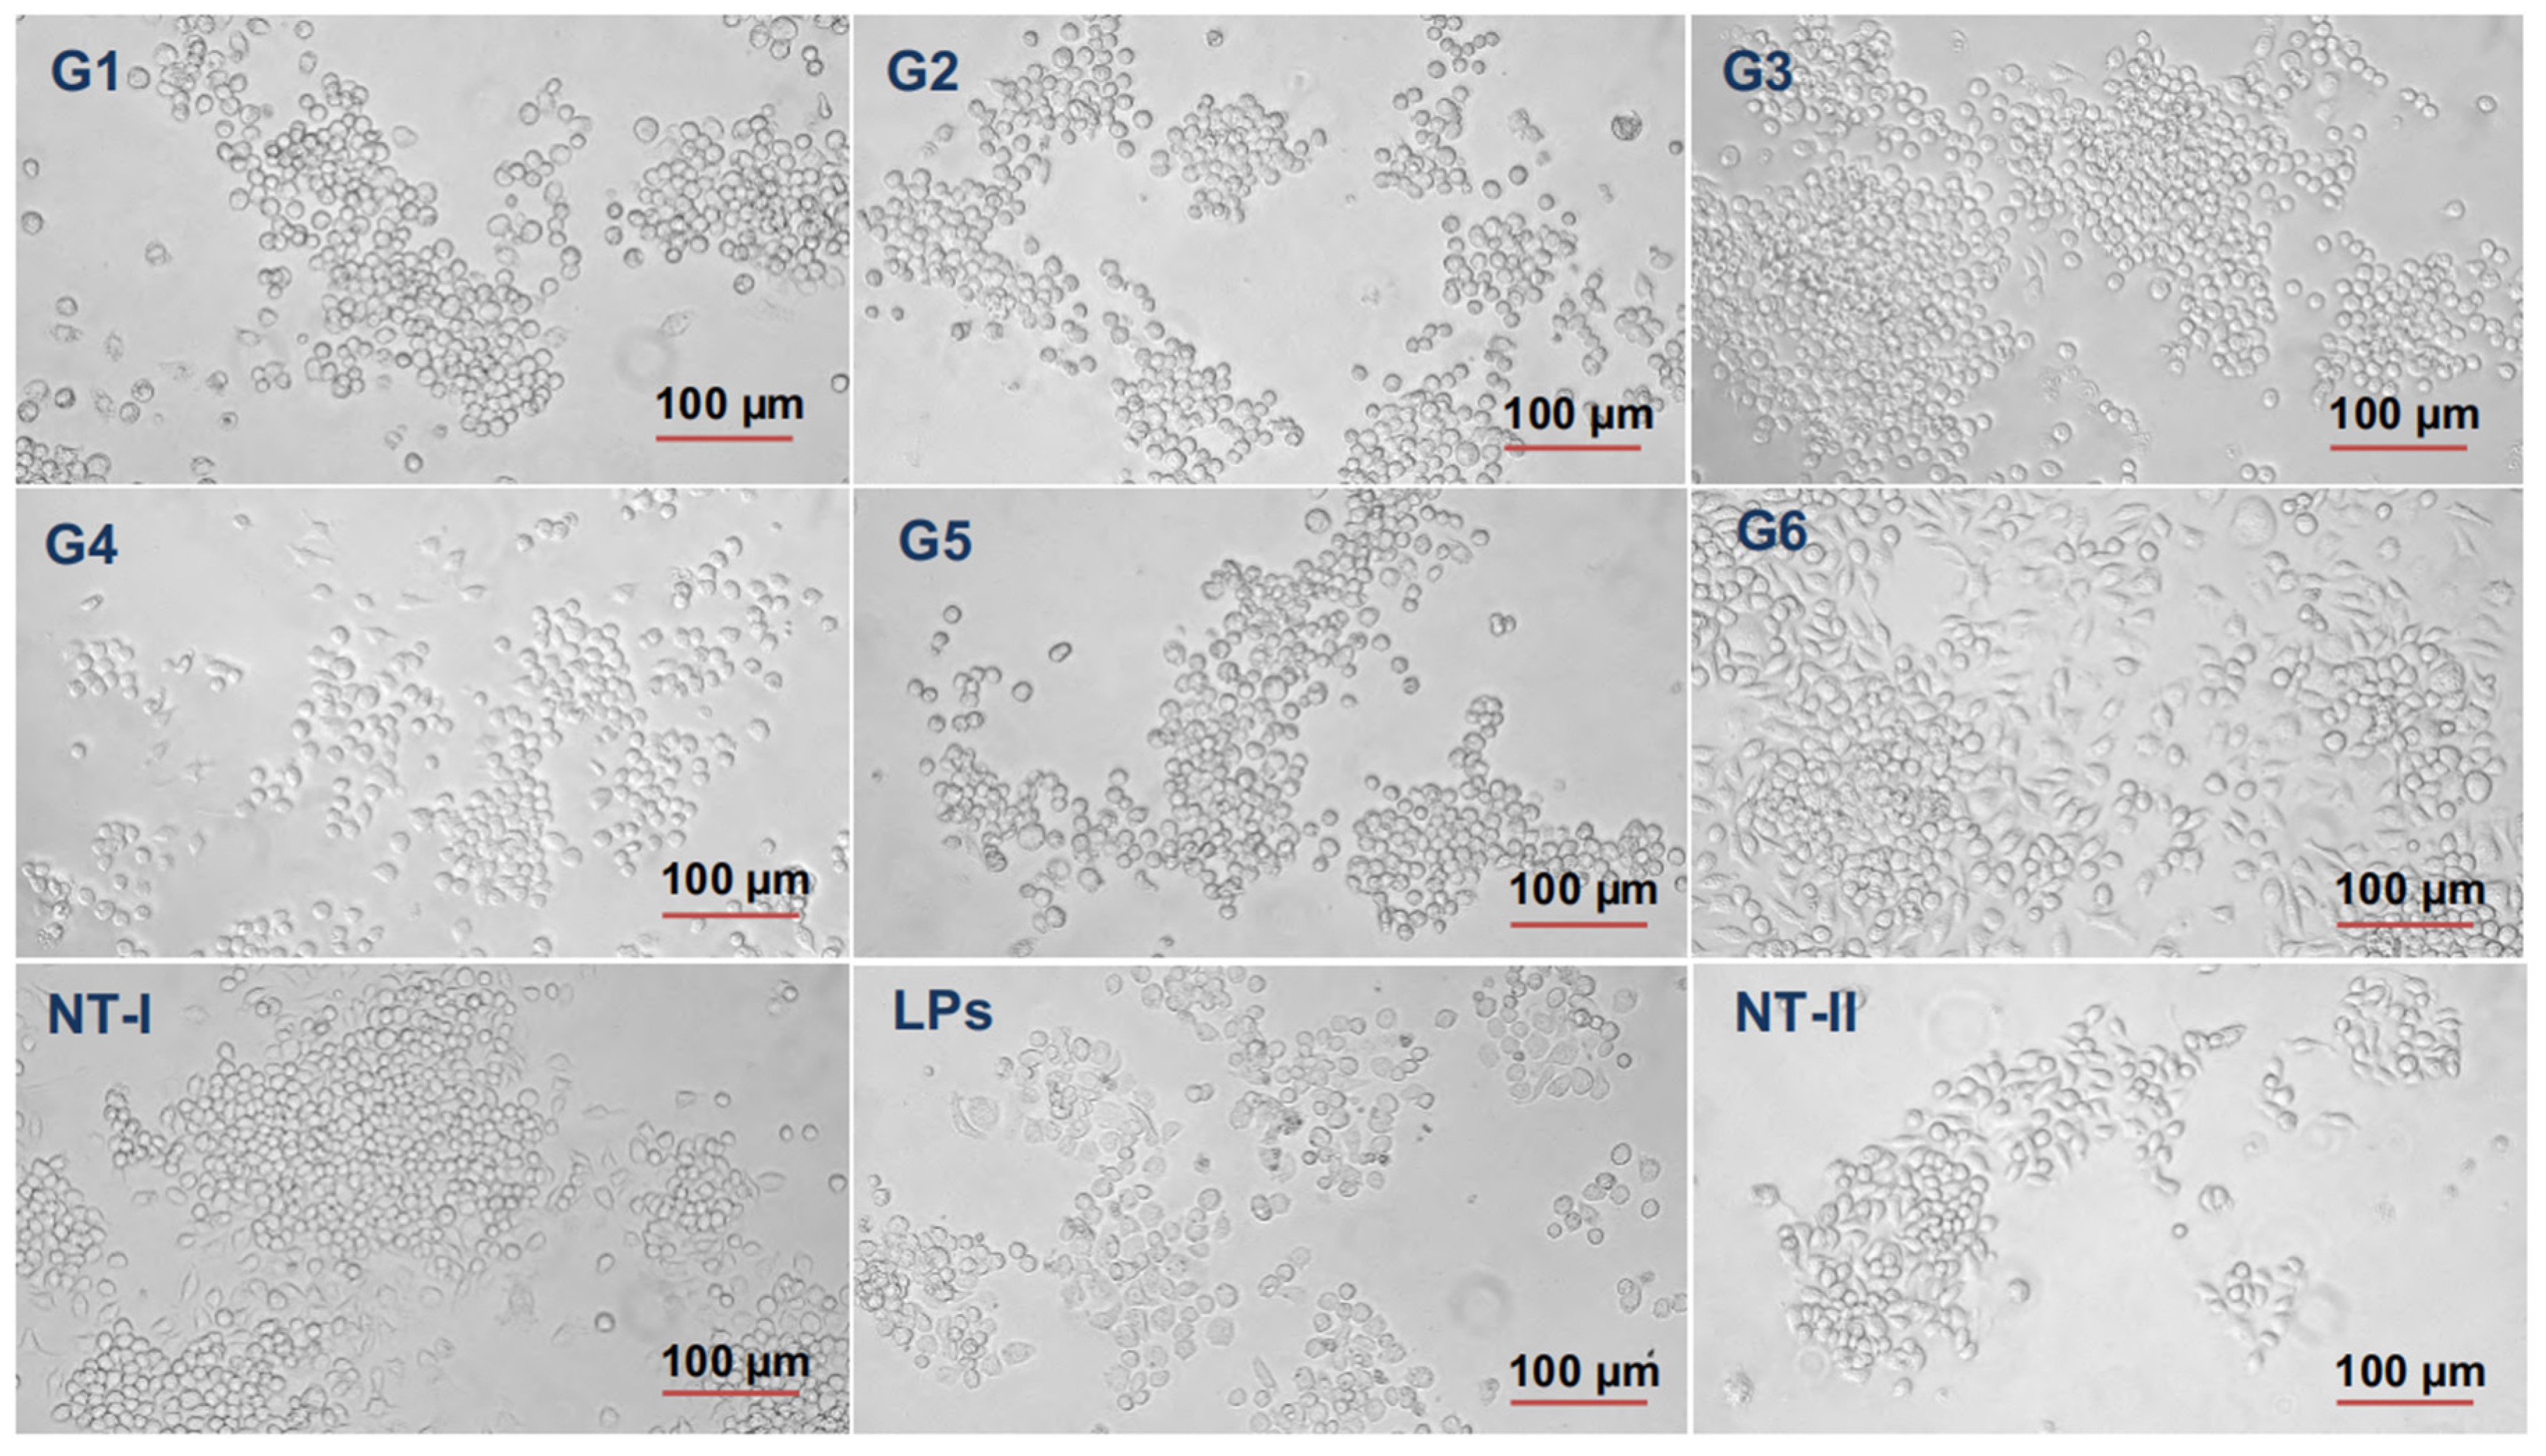
Figure 9: Microscopic inspection (20X objective) of the proliferation of RAW264.7 cells at 24 h. (A) G1: 0.0002 μg/μL, (B) G2: 0.0008 μg/μL, (C) G3: 0.0002 μg/μL, (D) G4: 0.0002 μg/μL, (E) G5: 0.0008 μg/μL, (F) G6: 0.0002 μg/μL, (G) NT-I–no treatment; 1% DMSO in cell culture media, (H) Lipopolysaccharide (Lipo–50 ng/mL) is used as a positive control. (I) NT-II–no treatment; Milli-Q water (1 μL) in cell culture media.
3.4.4 Nitric Oxide (NO) Production in RAW264.7 Cells
The LPS-treated group showed a mean response of 20.0 ± 0.6 (Fig. 10). Among the tested extracts, G1 induced a markedly elevated response (114.9 ± 8.2, p < 0.0001). This result indicates a strong pro-inflammatory effect, suggesting that G1 contained components that significantly activate macrophage-mediated inflammation. In contrast, only G3 and G5 showed anti-inflammatory activity. G3 reduced the inflammatory mediator production to 3.6 ± 0.2 (p < 0.001), while G5 showed an even more pronounced suppression with a value of 0.04 ± 1.7 (p < 0.01). These findings suggest that G3 and G5 are capable of inhibiting macrophage activation and may possess compounds with potential therapeutic anti-inflammatory effects. The other extracts tested, including G2, G4, and G6, did not show any significant difference compared to the LPS control.
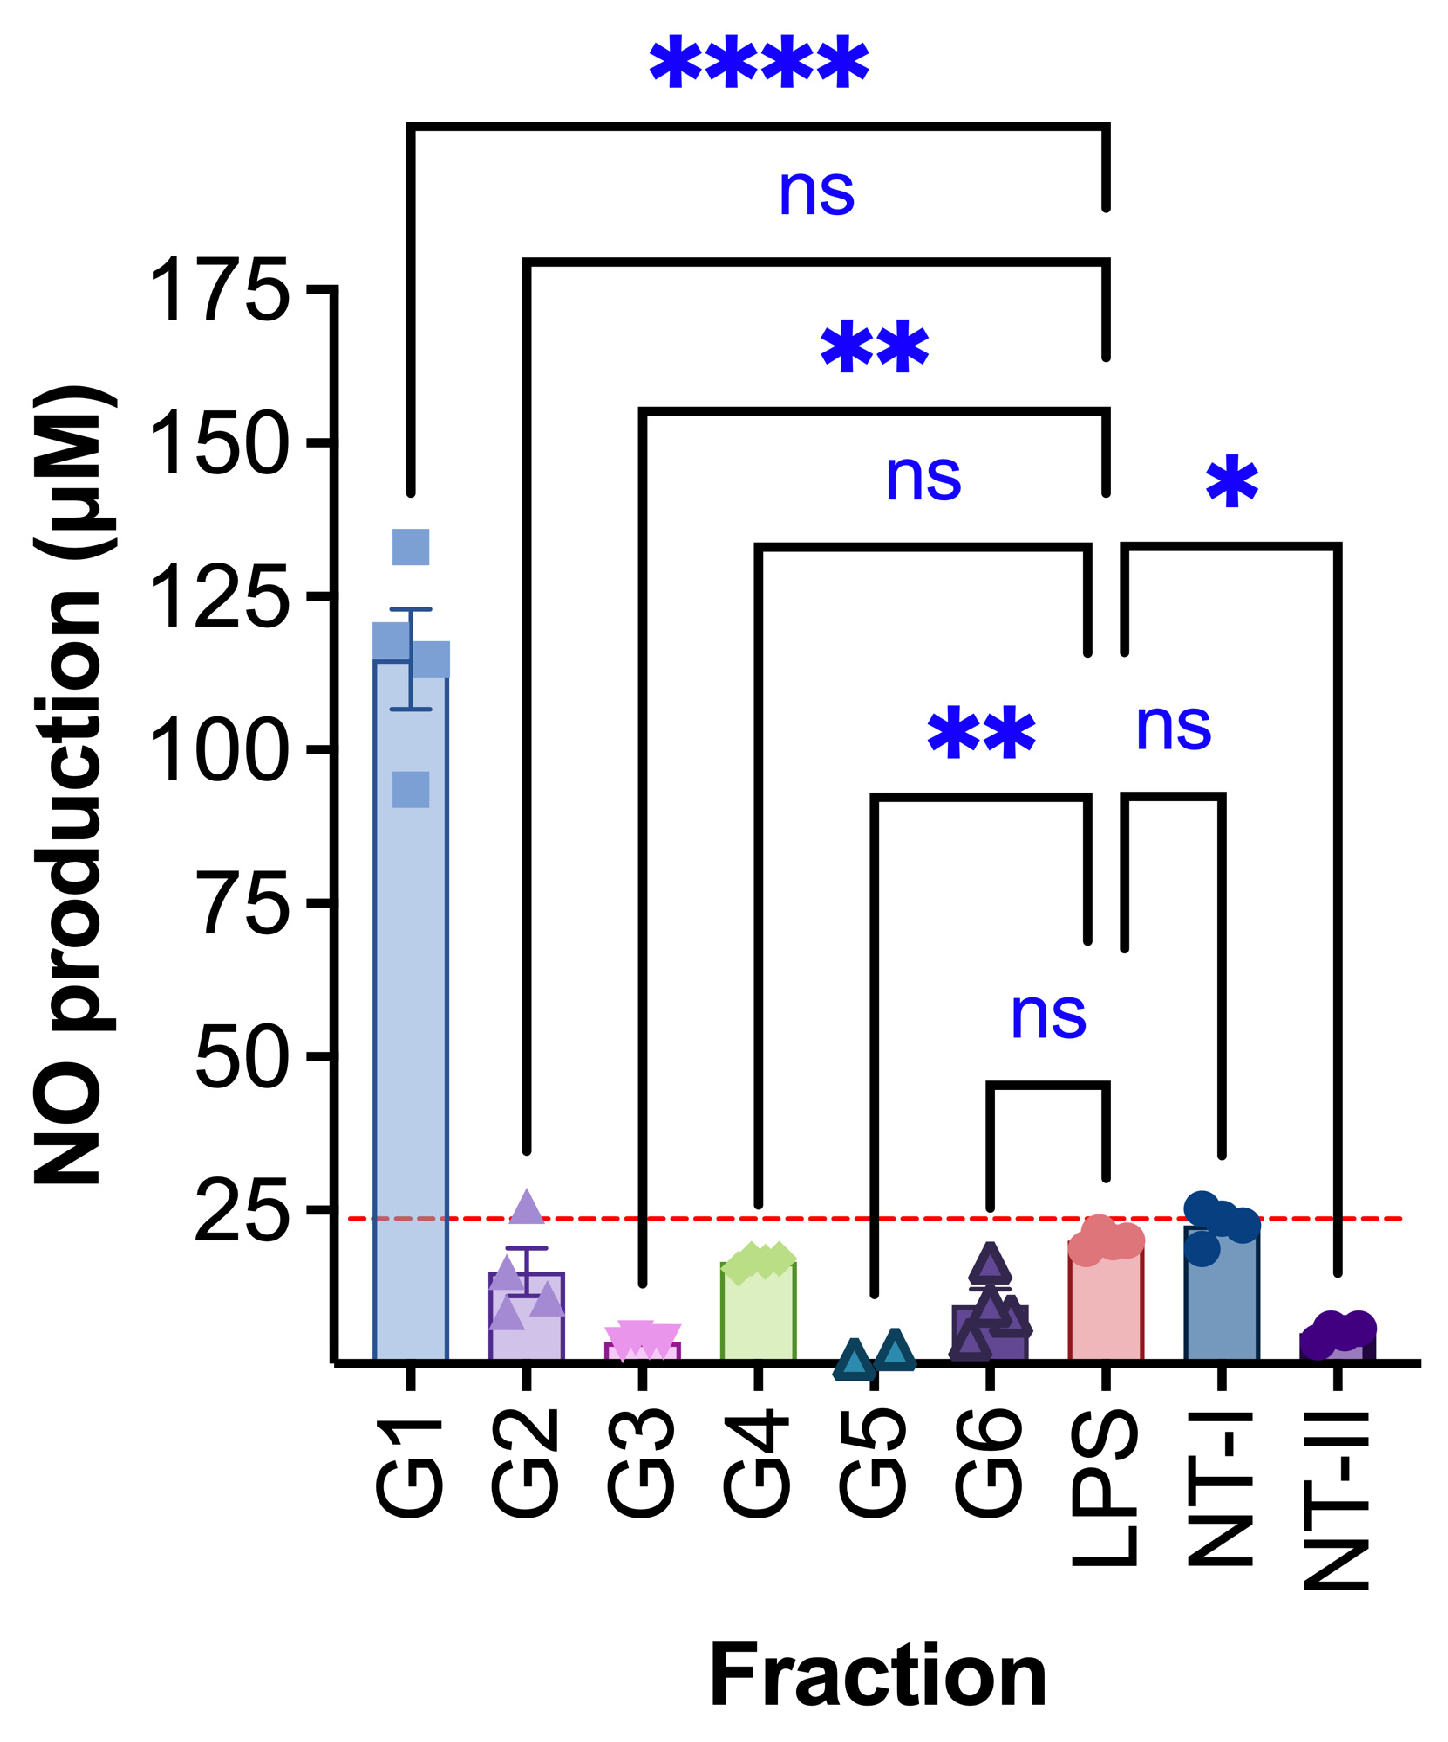
Figure 10: Anti-inflammatory effect of treated RAW264.7 cells; G1: 0.0002 μg/μL, G2: 0.0008 μg/μL, G3: 0.0002 μg/μL, G4: 0.0002 μg/μL, G5: 0.0008 μg/μL, G6: 0.0002 μg/μL, NT-I–no treatment; 1% DMSO in cell culture media. NT-II–no treatment; Milli-Q water (1 μL) in cell culture media. Mito–Mitomycin-C (0.004 μg/μL) is used as a negative control (NC). Lipopolysaccharide (LPS—50 ng/mL) was used to stimulate the cells, and Milli-Q water served as the control (NT—no treatment). Values are expressed as mean ± SE. ****p < 0.0001, ***p < 0.001 (if it had occurred in this figure), **p < 0.01, and *p < 0.05 were considered statistically significant compared to the control group. (*) indicates a statistically significant difference, and (ns) indicates no significant difference from the respective group using ANOVA, followed by Dunnett’s multiple comparison test.
3.4.5 Expression of TNF-α and TGF-β Cytokines in RAW264.7 Cells
The effects of G. capitata extracts on inflammatory cytokine expression were assessed in RAW264.7 macrophage cells by measuring TNF-α and TGF-β levels (Fig. 11). The LPS-treated positive control group exhibited elevated relative TNF-α expression (1.98 ± 0.06%), consistent with its known pro-inflammatory activity. G1 (herb extract in 70% ethanol) induced a moderate increase in TNF-α levels (1.23 ± 0.35%), indicating a mild pro-inflammatory effect. In contrast, G5 (root extract in water) did not induce any significant TNF-α expression, suggesting the absence of a pro-inflammatory response. Regarding TGF-β expression, G1-treated cells exhibited elevated levels (43.9 ± 0.1%), which were higher than those of the LPS group (2.6 ± 0.2%). G5 treatment resulted in a dramatic increase in TGF-β expression (232.1 ± 0.2%), representing the highest level among all tested groups.
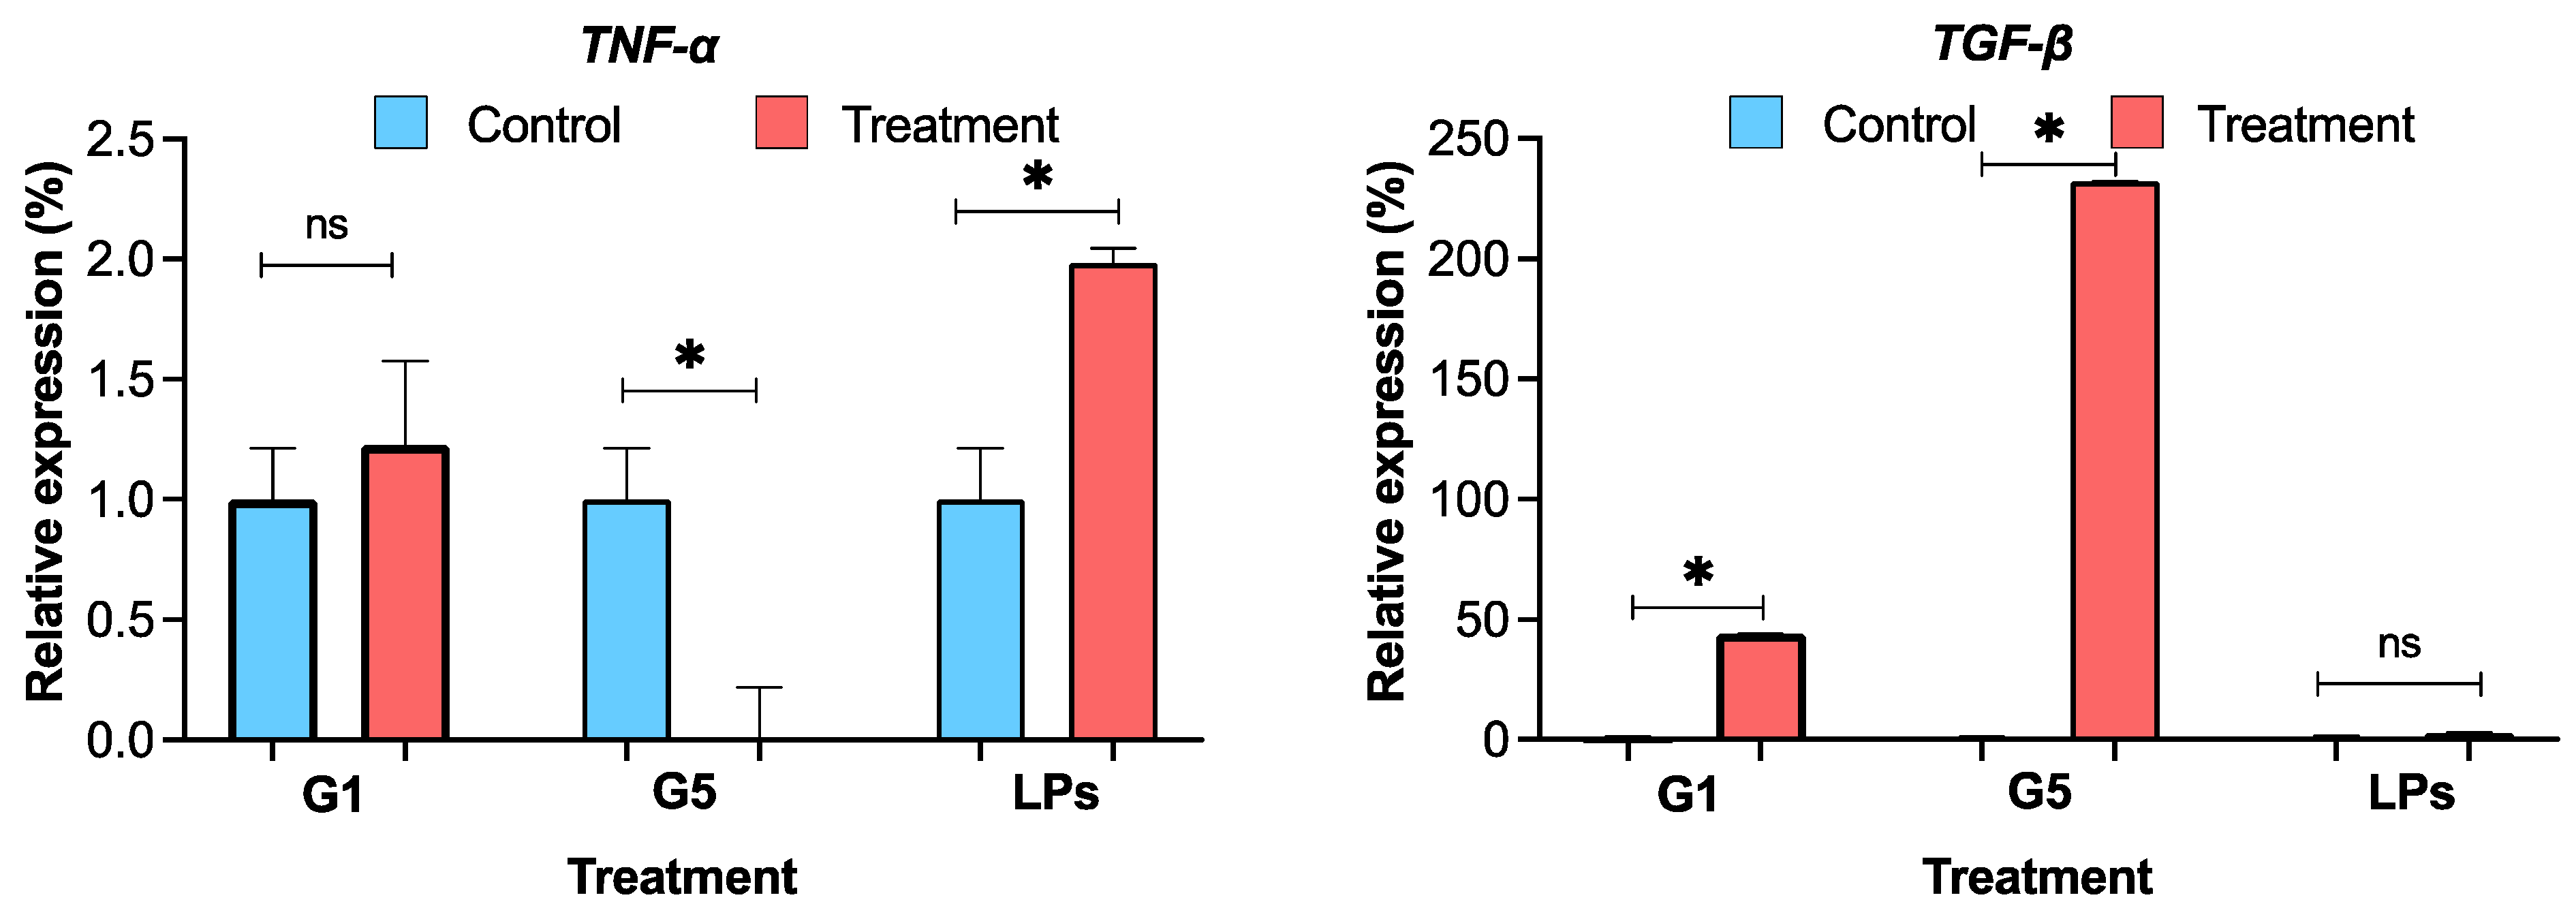
Figure 11: Cytokine expression of TNF-α and TGF-β profile in RAW264.7 cells treated with: G1: 0.0002 μg/μL, G5: 0.0008 μg/μL, NT-I–no treatment; 1% DMSO in cell culture media (Fig. 11). NT-II–no treatment; Milli-Q water (1 μL) in cell culture media. Mito–Mitomycin-C (0.004 μg/μL) is used as a negative control (NC). Lipopolysaccharide (LPS—50 ng/mL) was used to stimulate the cells, and Milli-Q water served as the control (NT—no treatment). Values are expressed as mean ± SE. *p < 0.05 was considered statistically significant compared to the control group. (*) indicates a statistically significant difference, and (ns) indicates no significant difference from the respective group using ANOVA, followed by Dunnett’s multiple comparison test.
3.5 Neurotropic Activity of the Gilia Extracts
The Open Field Test is based on assessing the natural defensive and exploratory behavioural responses of rodents in a new open space. This method enables the evaluation of animal anxiety levels through mobility indicators [32,38,39]. The results of this test on the G. capitata extracts are presented in Table 2. They showed that administration of the extract G1 increased locomotor activity of animals (number of squares crossed). Compared to the intact animal group, activity increased 1.38 times (p < 0.05), and compared to the comparison group, activity increased 1.42 times (p < 0.05). After administration of the extract G2, G4, and G6, a significant decrease in locomotor activity was observed compared to intact animals (1.84 times, p < 0.05; 4.97 times, p < 0.05; and 1.59 times, p < 0.05, respectively) and the comparison group (1.78 times, p < 0.05; 4.82 times, p < 0.05; and 1.54 times, p < 0.05, respectively). Thus, the obtained results suggest a possible stimulating effect of G1, a moderate sedative effect of G2 and G6, and a strong sedative effect of G4.
Table 2: Study of the neurotropic activity of Gilia capitata extracts in the Open Field Test.
| Indicator | Intact Animals (IC) | Comparison Group (Sedaphyton) (CG) | The Dry G. capitata Extract | |||
|---|---|---|---|---|---|---|
| G1 | G2 | G4 | G6 | |||
| Number of squares crossed | 75.33 ± 14.60 | 73.17 ± 15.04 | 104.17 ± 15.08*/** | 41.00 ± 11.52*/** | 15.17 ± 3.95*/** | 47.50 ± 16.96*/** |
| Number of vertical racks | 10.50 ± 2.72 | 7.83 ± 1.54 | 4.33 ± 1.58*/** | 3.83 ± 1.23*/** | 1.50 ± 0.57*/** | 4.00 ± 1.33*/** |
| Number of peeps into the holes | 14.17 ± 2.77 | 2.83 ± 0.79* | 10.67 ± 2.71*/** | 10.00 ± 2.48*/** | 7.00 ± 1.76*/** | 11.83 ± 3.84** |
| Conventional units of exploratory research activities | 3 | 1.91 | 2.55 | 1.62 | 0.84 | 1.85 |
| Boluses | 1.33 ± 0.33 | 1.50 ± 0.81 | 0.50 ± 0.22 | 0.17 ± 0.17* | 0 | 0.50 ± 0.22 |
| Grooming | 0.67 ± 0.21 | 0.33 ± 0.33 | 0.67 ± 0.49 | 0.17 ± 0.17 | 0.17 ± 0.17 | 0.33 ± 0.21 |
| Conventional units of indicators of emotional reactions | 2 | 1.62 | 1.38 | 0.38 | 0.25 | 0.88 |
| Conventional units of all activities | 5 | 3.54 | 3.92 | 1.99 | 1.09 | 2.72 |
The indicator of exploratory activity (number of vertical rears) was lowest in the group administered G4. After G4 administration, values were seven times lower than those of intact animals (p < 0.05) and 5.22 times lower than the comparison group (p < 0.05). Administration of G1, G2, and G6 also resulted in a decrease in vertical rears, though to a lesser extent than G4. Compared to intact animals, vertical activity decreased 2.42 times (p < 0.05), 2.74 times (p < 0.05), and 2.63 times, respectively, while compared to the comparison group, activity decreased 1.81 times (p < 0.05), 2.04 times, and 1.96 times (p < 0.05), respectively. These results indicate that G1, G2, and G6 induced significant reductions in vertical activity, demonstrating sedative effects, while G4 almost completely suppressed vertical activity, showing strong sedative effects.
Exploratory activity (hole poking behaviour) was best preserved in animals that received G1, G2, and G6, though it remained lower than in intact animals, by 1.33 times (p < 0.05), 1.42 times (p < 0.05), and 1.20 times, respectively. G4 reduced this indicator 2.02 times (p < 0.05) compared to intact animals. Compared to the comparison group, all tested extracts exhibited higher exploratory activity: G1—3.77 times (p < 0.05), G2—3.53 times (p < 0.05), G4—2.47 times (p < 0.05), and G6—4.18 times (p < 0.05).
The Elevated Plus Maze Test is another model used to assess situational anxiety, allowing for the evaluation of anxiolytic (anti-anxiety) or anxiogenic (anxiety-inducing) properties of pharmacological agents. This test is designed to study rodent behaviour in conditions of variable stress exposure, where they can freely choose comfortable environments. It helps determine anxiety levels by analysing exploration of dark compartments, natural fear of open areas, and aversion to heights. The anxiolytic effect of a substance is measured by the time spent in the dark and illuminated arms of the maze. An increase in time spent in the illuminated arms, along with a higher frequency of head-dipping and exploratory movements, is classified as an anxiolytic effect, while a decrease in these indicators suggests an anxiogenic effect [32,38]. The test duration was five minutes, during which behavioural characteristics of mice were visually recorded (Table 3).
Table 3: Behaviour of animals in the Elevated Plus Maze Test after administration of Gilia capitata extracts.
| Group of Animals | Time Spent in the Open Arm of the Maze, s | Time Spent in the Closed Arm of the Maze, s | Number of Looks from a Closed Sleeve | Number of Crossings through the Central Platform | Number of Looks down from the Ends of Open Sleeves |
|---|---|---|---|---|---|
| IC | 24.17 ± 5.33 | 273.17 ± 13.88 | 10.50 ± 2.46 | 3.33 ± 0.54 | 4.67 ± 1.58 |
| CG | 18.50 ± 3.97 | 279.00 ± 21.95 | 3.33 ± 0.54* | 1.00 ± 0.66* | 3.00 ± 0.94* |
| G1 | 25.50 ± 7.20 | 274.33 ± 15.90 | 6.17 ± 1.54*/** | 6.33 ± 2.27*/** | 3.50 ± 1.10 |
| G2 | 36.00 ± 9.10*/** | 263.50 ± 16.76 | 8.67 ± 1.08** | 8.00 ± 2.65*/** | 5.67 ± 1.95** |
| G4 | 12.17 ± 3.21*/** | 286.17 ± 10.77 | 4.33 ± 0.86*/** | 4.17 ± 1.03** | 1.17 ± 0.43*/** |
| G6 | 34.00 ± 7.57*/** | 265.00 ± 10.47 | 7.67 ± 1.71*/** | 10.17 ± 1.68*/** | 5.17 ± 2.04** |
The administration of the extracts G2 and G6 led to significant changes in the emotional and behavioural responses of the test animals in the Elevated Plus Maze compared to intact animals and those administered the reference drug Sedaphyton (Table 3). In the study of exploratory activity, the time spent in the open arm of the maze increased by 1.49 times (p < 0.05) and 1.41 times (p < 0.05) after administration of G2 and G6, respectively, compared to intact animals, and by 1.95 times (p < 0.05) and 1.84 times (p < 0.05) compared to the reference group. G2 and G6 also increased the number of head dips (“risk assessment” indicator) by 1.21 times and 1.11 times, respectively, compared to intact animals, and by 1.89 times (p < 0.05) and 1.72 times (p < 0.05) compared to the reference group. Additionally, animals in the G2 and G6 groups showed an increase in crossings over the central platform by 2.40 times (p < 0.05) and 3.05 times (p < 0.05), respectively, compared to intact animals, though their head peeking from dark arms remained similar to the intact animal group.
After administration of the extract G1, the time spent in the open arms was similar to that of intact animals. At the same time, head dips from open arm edges and head peeking from dark arms were slightly lower than those of the intact animal group, by 1.33 times and 1.70 times (p < 0.05), respectively. However, the number of crossings over the central platform was higher, increasing by 1.90 times (p < 0.05) compared to intact animals. Across all evaluated parameters, G1 surpassed the reference group, with increases of 1.38 times (time spent in the open arm), 1.85 times (p < 0.05) (head peeks from dark arm), 6.33 times (p < 0.05) (crossings over central platform), and 1.17 times (head dips from open arm edges).
In contrast, the extract G4 exhibited an anxiogenic (anxiety-inducing) effect. The time spent in the open arm decreased by 1.99 times (p < 0.05) compared to intact animals and 1.52 times (p < 0.05) compared to the reference group. A significant reduction in the number of head dips was observed, by 3.99 times (p < 0.05) compared to intact animals and 2.56 times (p < 0.05) compared to Sedaphyton-administered animals. Additionally, head peeking from the dark arm was reduced by 2.42 times (p < 0.05) compared to intact animals.
The anxiolytic effect of the G. capitata extracts on the exploratory responses of mice under stress was studied using the “Black and White Chamber” test [32,39,40]. The animals were placed in the dark compartment for 2 min to acclimate, with the passage to the light compartment closed. The door was then opened and a 3-min trial commenced, during which we recorded time spent in the dark compartment, time spent in the light compartment, number of entries into the light compartment, and number of exploratory peeks toward the light compartment (Table 4). It is known that anxiolytics increase the number of exits and the time spent in the light compartment of the chamber, while control animals prefer to be in the dark compartment [32,38].
Table 4: Anxiolytic activity of Gilia capitata extracts after oral administration in the Black-and-White Box Test.
| Group of Animals | Staying in the Dark Compartment, s | Number of Looks from the Dark Compartment | Staying in the Light Compartment, s | Number of Exits to the Light Compartment | Average Time of Single Stay in the Light Compartment, s |
|---|---|---|---|---|---|
| IC | 101.00 ± 12.66 | 5.83 ± 1.17 | 78.33 ± 12.57 | 4.83 ± 0.79 | 16.73 ± 4.81 |
| CG | 119.00 ± 13.27* | 2.17 ± 0.70* | 59.67 ± 13.87* | 3.33 ± 0.54* | 18.24 ± 4.72 |
| G1 | 68.50 ± 11.24*/** | 1.50 ± 0.43* | 110.83 ± 11.25*/** | 3.50 ± 0.88* | 32.65 ± 5.86*/** |
| G2 | 146.67 ± 34.82* | 3.33 ± 0.88 | 32.33 ± 11.43*/** | 2.33 ± 0.86*/** | 14.50 ± 3.65 |
| G4 | 71.67 ± 14.61*/** | 2.33 ± 0.67* | 106.50 ± 16.97*/** | 2.00 ± 0.66*/** | 59.31 ± 28.04*/** |
| G6 | 96.83 ± 15.47** | 2.17 ± 0.60* | 82.33 ± 17.72** | 4.00 ± 0.66 | 20.79 ± 4.35 |
The results of the Black-and-White Box Test (Table 4) indicate that the tested G. capitata extracts exert different effects on animal behaviour. Among the tested extracts, G1 showed the most significant anxiolytic properties, which increased the time spent in the light compartment by 1.41 times (p < 0.05) compared to intact animals and 1.86 times (p < 0.05) compared to animals that received Sedaphyton. This may suggest reduced anxiety and enhanced activity. Animals receiving the extract G4 also spent significant time in the light compartment (106.50 ± 16.97 s), but they displayed low mobility, often remaining motionless, indicating reduced activity due to anxiety. After administration of the extract G6, light compartment duration was comparable to that of intact animals, suggesting a moderate anxiety level and activity. Animals receiving the extract G2 spent the least amount of time in the light compartment (32.33 ± 11.43 s), which likely indicates high fear and anxiety levels. Anxiolytic activity in this group decreased by 2.42 times (p < 0.05) compared to intact animals and 1.85 times (p < 0.05) compared to the Sedaphyton group. In all groups receiving G. capitata extracts, the number of head peeks from the dark compartment was lower than in intact animals, indicating reduced alertness and anxiety. The fewest head peeks were observed in G1 (1.50 ± 0.43), while the highest occurred in G2 (3.33 ± 0.88). Animals in the G1 and G6 groups made fewer exits from the dark compartment (3.50 ± 0.88 and 4.00 ± 0.66, respectively) compared to intact animals (4.83 ± 0.79), but more than in the comparison group (3.33 ± 0.54), suggesting a moderate activity level. After administration of G2 and G4, the number of exits from the dark compartment decreased (2.33 ± 0.86 and 2.00 ± 0.66, respectively), indicating high anxiety and distress.
Using data on time spent in the light compartment and the number of exits from the dark section, the average duration of a single stay in the light compartment was calculated (Table 4). The highest value occurred after G4 administration (59.31 ± 28.04 s), but considering the low number of exits, this duration is likely due to reduced mobility rather than active exploration. After G1 administration, single stay time increased by 1.95 times (p < 0.05) compared to intact animals and 1.79 times (p < 0.05) compared to the Sedaphyton group. The lowest single stay time was observed after G2 administration (14.50 ± 3.65 s), suggesting high alertness and anxiety.
For the preliminary assessment of antidepressant activity of the G. capitata extracts, the Tail Suspension Test was used, which simulates animal behaviour based on despair [38,41,42]. The Tail Suspension Test provides a fast and reliable method for evaluating depressive behaviour in mice. Observations were conducted over six minutes, recording the duration of immobility (motionless hanging) (Table 5).
Table 5: Antidepressant activity of Gilia capitata extracts in the Tail Suspension Test.
| Group of Animals | Total Immobility Time, s |
|---|---|
| IC | 103.67 ± 12.86 |
| CG | 190.67 ± 31.97* |
| G1 | 108.33 ± 19.34** |
| G2 | 112.17 ± 24.59** |
| G4 | 208.50 ± 49.31* |
| G6 | 136.17 ± 34.50*/** |
The total immobility time (Table 5) in animals receiving the extract G1 was the lowest, measuring 108.33 ± 19.34 s, which was comparable to intact animals and 1.76 times lower (p < 0.05) than the Sedaphyton group. After administration of the extracts G2 and G6, the total immobility time significantly decreased by 1.70 times (p < 0.05) and 1.40 times (p < 0.05), respectively, compared to the Sedaphyton group. The values for G2 did not significantly differ from intact animals, while G6 showed a slight increase (1.31 times, p < 0.05). Following the G4 administration, total immobility time increased by 2.01 times (p < 0.05) compared to intact animals, aligning with the comparison group values.
In aqueous-ethanolic extracts from the herb, flowers, roots and fruits of G. capitata, a total of 12 phenolics and 16 amino acids have been identified by HPLC (Table 1). The highest content of phenolic compounds was inherent in the herb and flower extracts. Among phenolics, flavonoids predominated, and the main ones were rutin, isoquercitrin, luteolin 7 rutinoside and kaempferol-3-O-rutinoside. Phenolic compounds have garnered substantial attention due to their potential neuroprotective, anxiolytic, antidepressant, and cognitive-enhancing effects. Many flavonoids and hydroxycinnamic acids influence oxidative stress, neuroinflammation, and neurotransmitter pathways, contributing to their role in neuropharmacology [43,44].
Rutin has been shown to improve synaptic plasticity and memory formation, offering cognitive benefits. Additionally, it modulates monoaminergic neurotransmission, including dopaminergic and serotonergic systems, contributing to antidepressant-like effects. This makes rutin a promising candidate for mood regulation and neuroprotection [31,45,46]. Kaempferol and its derivatives, such as kaempferol-3-O-rutinoside, kaempferol-3-O-glucoside, etc., are potent antioxidants and anti-inflammatory agents that exhibit neuroprotective effects via modulation of NF-kB, p38MAPK, AKT, and β-catenin pathways. Studies suggest that kaempferol enhances brain-derived neurotrophic factor (BDNF), supporting neuronal plasticity and cognitive function. Moreover, it inhibits MMP2, MMP3, and MMP9, reducing neurodegeneration associated with Alzheimer’s disease and Parkinson’s disease [47]. Isoquercitrin and its aglycone, quercetin, are known for their antioxidant and neuroprotective properties. These compounds mitigate hydrogen peroxide-induced neuronal damage, regulate apoptotic pathways (including caspase-3, Bcl-2, and Bax), and reduce neuroinflammation. Furthermore, they have been investigated for their potential role in delaying neurodegeneration, particularly in Alzheimer’s disease [48,49]. Both luteolin-7-O-rutinoside and apigenin exert anxiolytic and antidepressant effects by modulating GABAergic and serotonergic pathways. Apigenin, in particular, enhances GABA receptor activity, reducing anxiety-like behaviour. These flavonoids also suppress the release of pro-inflammatory cytokines, thereby protecting neurons from excessive inflammation [50,51,52].
p-Coumaric and ferulic acids as neuroprotective agents, primarily through free radical scavenging and anti-inflammatory mechanisms. Ferulic acid has been reported to enhance memory and learning, potentially improving cognitive function by modulating neurotransmitter activity. Both compounds may have implications in reducing oxidative stress-related neurodegeneration [53,54]. 3,4-Dihydroxyphenylacetic acid and isorhamnetin are known to influence dopaminergic pathways, making them potential therapeutic agents for the treatment of Parkinson’s disease. Their neuroprotective effects are linked to anti-inflammatory activity and reduction of neuronal apoptosis. Research indicates that isorhamnetin may also enhance neuronal survival under oxidative stress conditions [55,56,57]. Phenolic compounds, found in G. capitata extracts, exhibit diverse neuroactive properties, ranging from neuroprotection and cognitive enhancement to anxiolytic and antidepressant effects. Their influence on oxidative stress, neurotransmitter modulation, and anti-inflammatory pathways positions them as potential therapeutic agents for various neurodegenerative and psychiatric disorders.
Among 16 identified amino acids, the essential ones are histidine, isoleucine, leucine, lysine, methionine, phenylalanine, threonine and valine. Alanine, leucine, threonine, isoleucine, phenylalanine and valine predominate in the G. capitata extracts. Some of the identified amino acids have significant effects on the nervous system. Glutamic acid, in its ionized form known as glutamate, is the brain’s primary excitatory neurotransmitter. It plays a critical role in synaptic plasticity, learning, and memory. [58,59]. Glycine is a major inhibitory neurotransmitter, regulating neuronal hyperactivity and maintaining balance in neural signalling [60]. Tyrosine is a precursor to dopamine, norepinephrine, and adrenaline, affecting mood, motivation, and cognitive function [61]. Histidine converts into histamine, playing a role in neural excitability and cognitive functions [62,63]. Arginine stimulates the production of nitric oxide (NO), enhancing neuronal communication and cerebral blood flow [64,65]. Thus, it makes sense to study neurotropic activity of the G. capitata extracts.
The cytotoxicity of G. capitata extracts in HaCaT was significantly influenced by three key factors: the specific plant part used, the extraction solvent, and the concentration tested. Ethanol-based extracts, particularly those derived from the herb (G1, G6), flowers (G2), and fruits (G4), demonstrated notable cytotoxic effects at higher concentrations. In contrast, the aqueous root extract (G5) exhibited minimal toxicity and even showed transient proliferative effects at low concentrations (0.0008 μg/μL). This concentration-dependent response aligns with the well-documented concept of hormesis in phytochemical studies, where low doses of plant compounds can stimulate cellular activity, while higher doses become inhibitory or toxic [66]. Extracts G1 and G2, both rich in rutin (~262 and 141 mg/100 g, respectively) and isoquercitrin/luteolin-rutinoside, exhibited strong cytotoxicity (cell viability ~34–38%) and significantly impaired cell migration. These flavonoids are known to induce oxidative stress or apoptosis at high concentrations [67], which likely explains the observed toxicity in HaCaT cells. G4 was also cytotoxic, though to a slightly lesser degree than G1 and G2, consistent with lower total flavonoid content (~506 mg/100 g total phenolics; ~9.2% flavonoids based on spectrophotometric values), suggesting reduced potency. Extracts from G3, which contained moderate levels of total phenolics (~22 mg GAE) but lower flavonoid concentrations, demonstrated milder cytotoxicity (~73% viability at high doses). Extracts from G6 had the highest total phenolic content (~661 mg/100 g) but fewer strongly oxidative flavonoids, and its cytotoxicity profile was similar to G1/G2 at high doses, though overall less severe.
For subsequent functional assays, we selected concentrations that showed no cytotoxicity: 0.001 μg/μL for G1, G3, G4, and G6, and 0.008 μg/μL for G2 and G5. The root extract (G5) displayed particularly interesting time-dependent effects, with early proliferative activity at 24 h that diminished by 48 h. G5 showed very low total phenolics (53 mg/100 g) and flavonoids (~0.9%), with minimal flavonols like kaempferol (~3 mg) and no detectable quercetin, correlating with no cytotoxicity and even stimulation at low doses and short exposure. This suggested that milder phytochemical profiles may promote HaCaT proliferation by avoiding oxidative stress. Despite very low amino acid content, G5 was non-toxic and regenerative. This suggested that the absence of cytotoxic flavonoids plays a larger role than the presence of amino acids. Minor components (trace methionine, histidine, etc.) may synergize with non-phenolic water-soluble compounds such as sugars or polysaccharides for protective effects. The transient stimulation observed may result from activation of cellular defence or growth pathways at subtoxic concentrations, a phenomenon observed with certain plant-derived polysaccharides and saponins [68].
In inflammation-related assays, the aqueous root extract (G5) demonstrated the most promising anti-inflammatory profile, significantly suppressing nitric oxide production. This effect is likely due to inhibition of key pro-inflammatory pathways such as NF-κB and iNOS, mechanisms previously reported in aqueous plant extracts containing immunomodulatory compounds [69,70]. Conversely, the ethanol-based extracts (G1 and G6) induced mild pro-inflammatory responses, potentially due to ethanol-soluble flavonoid components like rutin and isoquercitrin, which are known to transiently activate inflammatory and modulate inducible nitric oxide synthase (iNOS) activity [71,72]. Cytokine analysis provided further insights into the extracts’ biological activities. Neither G1 nor G5 significantly increased TNF-α levels in HaCaT cells, indicating their non-inflammatory nature and suggesting potential safety for topical applications [73]. However, G5 consistently upregulates of TGF-β levels, albeit modestly. TGF-β is a cytokine involved in tissue repair and extracellular matrix remodelling [74]. This finding is particularly relevant for potential wound healing applications, as TGF-β is a key mediator in keratinocyte migration and wound closure processes.
The macrophage experiments revealed cell-type-specific responses to the plant extracts [30,75]. Ethanol-based flower (G2) and fruit (G4) extracts showed higher cytotoxicity in RAW264.7 macrophages, while the aqueous root extract (G5) again showed excellent biocompatibility. Extracts G1 and G6, which contain very high levels of total phenolics (approximately 672 and 661 mg/100 g, respectively) and flavonoids (about 12.3% and 11.7%), showed strong cytotoxicity. Consequently, a low, non-toxic concentration of 0.0002 μg/μL was selected for subsequent assays, including cell proliferation and anti-inflammatory studies. G3 and G4, with moderate phenolic content (around 535 and 506 mg/100 g), also displayed some cytotoxic effects, and the same low concentration was used. Although G2 also had a high phenolic content, it was better tolerated, allowing for a slightly higher non-toxic dose of 0.0008 μg/μL. In contrast, G5 had extremely low phenolic levels (approximately 53 mg/100 g) and showed no toxicity, which permitted the use of the higher concentration (0.0008 μg/μL) in functional assays.
G5 extracts consistently exhibited anti-inflammatory effects in macrophages, suppressing both nitric oxide production and TNF-α release while enhancing TGF-β expression. This balanced immunomodulatory profile suggests G5 could be particularly valuable for conditions involving both inflammation and impaired tissue repair. None of the extracts increased phagocytosis; most actually reduced it compared to the control. Ethanol-based extracts such as G1 and G6 likely contain flavonoids like rutin (262–275 mg/100 g) and isoquercitrin, which are known to interfere with immune cell function. In contrast, the non-inhibitory effect of G5 corresponds with its low content of phenolic metabolites.
Notably, G1 and G6 increased NO levels and induced mild TNF-α expression, suggesting a pro-inflammatory activity likely associated with their high flavonoid content. On the other hand, G5 suppressed NO and increased TGF-β, indicating strong anti-inflammatory and immunoregulatory potential. This activity likely arises from non-phenolic, water-soluble compounds, possibly including small bioactive peptides or minor amino acids. G3 also showed moderate inhibition of NO and cytokine modulation, which is consistent with its intermediate phenolic and amino acid content. The combination of low phenolic content and stable amino acid levels in G5 (not high overall but present) supports its non-toxicity, anti-inflammatory, and immunoregulatory profile, particularly through increased TGF-β expression. G3 demonstrated an intermediate response, reflecting its moderate phytochemical composition and suggesting balanced bioactivity.
The findings highlight the importance of both the extraction method (alcohol vs. water) and plant parts (root vs. herb or flower) in determining biological outcomes. Overall, the study demonstrates substantial variability in biological activity among different G. capitata extracts, with the aqueous root extract (G5) emerging as the most promising candidate due to its low toxicity, anti-inflammatory effects, and potential to support tissue repair. These results showed the critical role of carefully selecting plant parts and extraction techniques in the development of effective phytotherapeutic formulations. Future research should focus on isolating and characterize the specific active compounds in G5 and further evaluating their efficacy in more complex models of skin inflammation and repair.
G. capitata extracts did not influence emotional response indicators in the Open Field Test (Table 2): G4 suppressed emotional responses, completely eliminating boluses and showing minimal grooming, while other extracts also reduced emotional manifestations, but to a lesser extent. Considering all types of activity in the Open Field Test, G1 had the highest indicators (3.92) among the tested extracts, close to intact animals (5.0) and higher than the comparison group (3.54). This activity profile was analogous to that of known adaptogenic and stimulating plant extracts, such as Panax ginseng and Rhodiola rosea, which have been extensively documented to enhance central nervous system (CNS) performance and physical endurance in animal models [76,77]. Thus, the conducted study suggests that: the extract G1 of G. capitata herb (70% ethanol) maintains locomotor and exploratory activity, demonstrating a stimulating effect; extract G2 of G. capitata flowers (70% ethanol) and G6 of G. capitata herb (40% ethanol) suppress activity while preserving exploratory behaviour, indicating a moderate sedative effect. These effects mirror those observed with Passiflora incarnata and Valeriana officinalis extracts, recognised for their anxiolytic and mild sedative properties via modulation of GABAergic neurotransmission [78,79]. The extract G4 of G. capitata fruits (70% ethanol) exhibits the strongest sedative effect, almost completely suppressing all types of activity.
The obtained results in the Elevated Plus Maze test (Table 3) indicate the presence of anxiolytic effects after administration of G2 and G6, as evidenced by increased exploratory and locomotor activity in test animals. G1 maintained activity levels comparable to intact animals, while G4 resulted in less active behaviour. It can be suggested that G2 and G6 exert CNS-activating effects, reducing fear responses and enhancing adaptation speed to new environments. G1 exhibited a mild anxiolytic effect, whereas G4 did not contribute to reducing anxiety levels in the animals. Similar results have been reported in studies evaluating plant-derived compounds with anxiolytic potential. For instance, Lactuca sativa extract significantly increased exploratory behaviour in mice, indicating reduced anxiety [80]. Likewise, molsidomine, a nitric oxide donor, demonstrated anxiolytic-like properties and enhanced locomotor activity in rats [81]. Additionally, Passiflora incarnata and Valeriana officinalis have been shown to exert anxiolytic effects through modulation of GABA receptors, maintaining exploratory activity without sedation [78,79]. These behavioural patterns are comparable to those observed with G2 and G6, suggesting similar underlying neuropharmacological mechanisms.
Considering all Black-and-White Box Test (Table 4) parameters, G1 exhibited a calming effect, reducing anxiety levels in the animals. G2 administration resulted in increased time spent in the dark compartment and fewer exits, indicating heightened alertness and anxiety. Similar patterns were observed in studies of Thunbergia erecta, which increased light zone activity and transitions, reflecting anxiolytic action [82], and Coriandrum sativum, which, at low doses, heightened anxiety-like behaviour similar to G2 [83]. Matricaria chamomilla also produced calming effects, supporting the anxiolytic interpretation of G1 [84].
The Tail Suspension Test results (Table 5) indicate that G1, G2, and G6 exhibit moderate calming effects, reducing anxiety and enhancing mobility. G4, however, demonstrates a stronger sedative effect, surpassing Sedaphyton in its impact. Comparable effects have been reported in studies of herbal extracts with anxiolytic or antidepressant-like activity. For instance, Bacopa monnieri significantly reduced immobility time in the Tail Suspension Test, indicating antidepressant potential through serotonergic and dopaminergic modulation [85]. Similarly, Pimpinella anisum extract shortened immobility time in both TST and FST models, supporting its calming and mood-enhancing properties [86]. In contrast, Melissa officinalis and Valeriana officinalis extracts have been shown to prolong immobility at higher doses, consistent with the sedative profile observed for G4 [79,87].
Thus, the results of the present study indicate that the extracts exhibit diverse pharmacological effects, depending on the selected plant raw material and extraction solvent. The extract from G. capitata herb (70% ethanol) (G1) significantly enhanced locomotor activity while preserving exploratory behaviour, suggesting a stimulating effect. The extract from G. capitata herb (40% ethanol) (G6) led to reduced locomotor activity while maintaining exploratory behaviour, indicating a mild calming effect without complete CNS suppression. The extract from G. capitata flowers (70% ethanol) (G2) caused a decrease in both locomotor and exploratory behaviour, demonstrating a moderate sedative effect. The extract from G. capitata fruits (70% ethanol) (G4) resulted in strong locomotor suppression, a significant reduction in exploratory activity, and passivity, suggesting a pronounced sedative action.
Limitations of the study. Our study provides a preliminary overview of G. capitata an unstudied ornamental plant from a pharmaceutical perspective, but it also has its shortcomings. First, the aqueous extract of G. capitata root, which has low cytotoxicity and potent anti-inflammatory effects in vitro, has not been studied in in vivo behavioural experiments. This is due to the fact that the root of the plant is rich in saponins [10], which gives this plant part the potential to be used as a potential anti-inflammatory and expectorant, but would be an obstacle to the manifestation of the effect in the central nervous system due to the irritation reactions caused by saponins. Second, the reference preparation Sedaphyton used in the pharmacological studies comes from the Ukrainian market and is not widely available internationally. However, it is well accepted by consumers in Ukraine, and to the best of our knowledge, there are no medicines or dietary supplements directly based on G. capitata extract on the world market. Third, it is currently unclear which specific phenolic compounds in G. capitata are responsible for the effects on the behaviour of experimental animals, but this was not the aim of the study.
The strengths of the study. To the best of our knowledge, the study is the first to analyze the phenolic composition of G. capitata and the first approach to determine the biological activity of this plant, which has not been previously studied pharmacognostically and pharmacologically, except for our own article [10]. These studies help to understand the pharmaceutical perspective of G. capitata, previously known as an ornamental and honey plant, as a potential medicinal plant. We have demonstrated in animal studies the low toxicity of G. capitata extracts and several effects that may occur in the central nervous system.
The cytotoxicity and biological activity of G. capitata extracts were profoundly influenced by the plant part used, the extraction method, and the concentration. Ethanol-based extracts from plant parts (G1, G2, G4, G6) demonstrated concentration-dependent cytotoxicity, correlating with their high phenolic and flavonoid content, particularly rutin and isoquercitrin. In contrast, the aqueous root extract (G5) exhibited minimal toxicity and even showed proliferative effects at low concentrations, likely due to a distinct phytochemical profile characterised by low phenolic content and the presence of water-soluble compounds. HPLC analysis identified 12 phenolic compounds and 16 amino acids across the extracts, revealing substantial phytochemical diversity. The root extract (G5) displayed particularly promising anti-inflammatory activity through suppression of TNF-α related release with enhanced TGF-β expression, suggesting therapeutic potential for inflammatory skin conditions and wound healing. Behavioural studies revealed neurotropic effects, with the herb extract significantly enhancing locomotor activity, while flower and fruit extracts showed progressively stronger sedative properties. These findings collectively demonstrated that G. capitata extracts may possess significant potential for pharmaceutical development, with the aqueous root extract (G5) emerging as the most promising candidate due to its favourable combination of biocompatibility, anti-inflammatory activity, and tissue regenerative potential. G. capitata extracts show their prospects to be implemented in medical and pharmaceutical practice after further research.
Acknowledgement:
Funding Statement: This research was supported by the Estonian Research Council (ETAG) [grants number PRG1808 and PRG1223].
Author Contributions: The authors confirm contribution to the paper as follows: Conceptualization, Oleh Koshovyi, Rando Tuvikene, Valdas Jakštas, Andriy Grytsyk, Jaan Liira and Ain Raal; methodology, Oleh Koshovyi, Rando Tuvikene, Amal D. Premarathna, Valdas Jakštas, Vaidotas Žvikas, Lyubov Grytsyk, Andriy Grytsyk, Jaan Liira and Ain Raal; software, Vaidotas Žvikas, Yurii Hrytsyk, Lyubov Grytsyk, Amal D. Premarathna, and Oleh Koshovyi; validation, Rando Tuvikene, Valdas Jakštas, Vaidotas Žvikas and Ain Raal; formal analysis, Oleh Koshovyi, Amal D. Premarathna, Vaidotas Žvikas, Yurii Hrytsyk, and Lyubov Grytsyk; investigation, Oleh Koshovyi, Rando Tuvikene, Amal D. Premarathna, Vaidotas Žvikas, Yurii Hrytsyk, and Lyubov Grytsyk; resources, Rando Tuvikene, Valdas Jakštas, Andriy Grytsyk, Jaan Liira, and Ain Raal; data curation, Oleh Koshovyi, Rando Tuvikene, Amal D. Premarathna, Vaidotas Žvikas, Yurii Hrytsyk, and Lyubov Grytsyk; writing—original draft preparation, Oleh Koshovyi, Rando Tuvikene, Amal D. Premarathna, Valdas Jakštas, Vaidotas Žvikas, Lyubov Grytsyk, Jaan Liira, and Ain Raal; writing—review and editing, Oleh Koshovyi, Rando Tuvikene, Amal D. Premarathna, Valdas Jakštas, Andriy Grytsyk, Jaan Liira and Ain Raal; visualization, Rando Tuvikene, Amal D. Premarathna, Vaidotas Žvikas, Yurii Hrytsyk, and Oleh Koshovyi; supervision, Oleh Koshovyi, Rando Tuvikene, Valdas Jakštas, Andriy Grytsyk, Jaan Liira and Ain Raal; project administration, Rando Tuvikene, Andriy Grytsyk, and Ain Raal; funding acquisition, Rando Tuvikene and Ain Raal. All authors reviewed the results and approved the final version of the manuscript.
Availability of Data and Materials: The data supporting the results of this study can be obtained from the corresponding author (Ain Raal) upon reasonable request.
Ethics Approval: All animal experiments were carried out in strict compliance with the National General Ethical Principles of Animal Research (Ukraine, 2001), which align with the European Convention for the Protection of Vertebrate Animals Used for Experimental and Other Scientific Purposes (Strasbourg, 1986) [33,34,35]. Additionally, the study adhered to ethical, moral, and legal standards to ensure the humane treatment of experimental animals in scientific and educational contexts, as outlined in Protocol No. 151/25 of the Ethics Committee of IFNMU, approved on 10 April 2025.
Conflicts of Interest: The authors declare no conflicts of interest to report regarding the present study.
Supplementary Materials: The supplementary material is available online at https://www.techscience.com/doi/10.32604/phyton.2025.074153/s1.
References
1. Jaramillo Z , Leigh J . Revision of the genus Gilia of Utah. J Undergrad Res. 2019; 2019: 105. [Google Scholar]
2. Native Plant Network: Propagation Protocol Database. Protocol Information: Gilia (capitata) [cited 2025 Sep 16]. Available from: https://courses.washington.edu/esrm412/protocols/2011/GICA5.pdf [Google Scholar]
3. Royal Botanic Gardens, Kew . Gilia capitata Sims [Internet]. 2024 [cited 2025 Nov 19]. Available from: https://powo.science.kew.org/taxon/urn:lsid:ipni.org:names:110013-2. [Google Scholar]
4. Grant V . Genetic and taxonomic studies in Gilia: I. Gilia Capitata. Aliso A J Syst Florist Bot. 1950; 2( 3): 239– 316. doi:10.5642/aliso.19500203.05. [Google Scholar] [CrossRef]
5. Porter JM . Gilia capitata subsp. capitata [Internet]. 2023 [cited 2025 Nov 19]. Available from: https://ucjeps.berkeley.edu/eflora/eflora_display.php?tid=26878. [Google Scholar]
6. Hayes JE . Top 10 Oregon Native Plants for Pollinators: Week 8. [cited 2025 Nov 19]. Available from: https://blogs.oregonstate.edu/gardenecologylab/tag/gilia-capitata/. [Google Scholar]
7. Grant V , Grant KA . Flower pollination in the phlox family. New York, NY, USA: Columbia University Press; 1965. 180 p. [Google Scholar]
8. Nagy ES . Selection for native characters in hybrids between two locally adapted plant subspecies. Evolution. 1997; 51( 5): 1469– 80. doi:10.1111/j.1558-5646.1997.tb01470.x. [Google Scholar] [CrossRef]
9. Runge T , Latacz-Lohmann U , Schaller L , Todorova K , Daugbjerg C , Termansen M , et al. Implementation of eco-schemes in fifteen European union member states. EuroChoices. 2022; 21( 2): 19– 27. doi:10.1111/1746-692X.12352. [Google Scholar] [CrossRef]
10. Raal A , Liira J , Lepiku M , Ilina T , Kovalyova A , Strukov P , et al. The composition of essential oils and the content of saponins in different parts of Gilia capitata Sims. Crops. 2025; 5( 3): 33. doi:10.3390/crops5030033. [Google Scholar] [CrossRef]
11. Grant V . Seed germination in Gilia capitata and its relatives. Madroño. 1949; 10( 3): 87– 93. [Google Scholar]
12. Keeley JE , Keeley SC . Role of fire in the germination of chaparral herbs and suffrutescents. Madroño. 1987; 34( 3): 240– 9. [Google Scholar]
13. Cseke LJ , Kaufman PB , Kirakosyan A . The biology of essential oils in the pollination of flowers. Nat Prod Commun. 2007; 2( 12): 1934578X0700201225. doi:10.1177/1934578x0700201225. [Google Scholar] [CrossRef]
14. Knudsen JT , Eriksson R , Gershenzon J , Ståhl B . Diversity and distribution of floral scent. Bot Rev. 2006; 72( 1): 1. doi:10.1663/0006-8101(2006)72[1:DADOFS]2.0.CO;2. [Google Scholar] [CrossRef]
15. Dötterl S , Schäffler I . Flower scent of floral oil-producing Lysimachia punctata as attractant for the oil-bee Macropis fulvipes. J Chem Ecol. 2007; 33( 2): 441– 5. doi:10.1007/s10886-006-9237-2. [Google Scholar] [CrossRef]
16. Smith DM , Glennie CW , Harborne JB , Williams CA . Flavonoid diversification in the polemoniaceae. Biochem Syst Ecol. 1977; 5( 2): 107– 15. doi:10.1016/0305-1978(77)90038-2. [Google Scholar] [CrossRef]
17. Nagy ES , Rice KJ . Local adaptation in two subspecies of an annual plant: implications for migration and gene flow. Evolution. 1997; 51( 4): 1079– 89. doi:10.1111/j.1558-5646.1997.tb03955.x. [Google Scholar] [CrossRef]
18. Sepp J , Koshovyi O , Jakstas V , Žvikas V , Botsula I , Kireyev I , et al. Phytochemical, technological, and pharmacological study on the Galenic dry extracts prepared from German chamomile (Matricaria chamomilla L.) flowers. Plants. 2024; 13( 3): 350. doi:10.3390/plants13030350. [Google Scholar] [CrossRef]
19. Hrytsyk Y , Koshovyi O , Lepiku M , Jakštas V , Žvikas V , Matus T , et al. Phytochemical and pharmacological research in galenic remedies of Solidago canadensis L. herb. Phyton Int J Exp Bot. 2024; 93( 9): 2303– 15. doi:10.32604/phyton.2024.055117. [Google Scholar] [CrossRef]
20. Koshovyi O , Sepp J , Jakštas V , Žvikas V , Kireyev I , Karpun Y , et al. German chamomile (Matricaria chamomilla L.) flower extract, its amino acid preparations and 3D-printed dosage forms: phytochemical, pharmacological, technological, and molecular docking study. Int J Mol Sci. 2024; 25( 15): 8292. doi:10.3390/ijms25158292. [Google Scholar] [CrossRef]
21. Shanaida M , Korablova O , Rakhmetov D , Serafyn O , Lashch N , Shanaida V . Comparative chromatographic analysis of amino acids in the seeds of three Nigella L. representatives. Biomed Chromatogr. 2025; 39( 3): e70009. doi:10.1002/bmc.70009. [Google Scholar] [CrossRef]
22. Council of Europe . European Pharmacopoeia. 2022 [cited 2023 Jan 1]. Available from: https://www.edqm.eu/en/european-pharmacopoeia-ph.-eur.-11th-edition. [Google Scholar]
23. Sepp J , Koshovyi O , Jakštas V , Žvikas V , Botsula I , Kireyev I , et al. Phytochemical, pharmacological, and molecular docking study of dry extracts of Matricaria discoidea DC. with analgesic and soporific activities. Biomolecules. 2024; 14( 3): 361. doi:10.3390/biom14030361. [Google Scholar] [CrossRef]
24. Kukhtenko H , Bevz N , Konechnyi Y , Kukhtenko O , Jasicka-Misiak I . Spectrophotometric and chromatographic assessment of total polyphenol and flavonoid content in Rhododendron tomentosum extracts and their antioxidant and antimicrobial activity. Molecules. 2024; 29( 5): 1095. doi:10.3390/molecules29051095. [Google Scholar] [CrossRef]
25. Kovaleva AM , Georgievskyi GV , Kovalev VM , Komissarenko AM , Timchenko MM . Development of the method of standardization of the new medicinal product piflamin. Pharmacom. 2002; 2: 92– 7. [Google Scholar]
26. Krivoruchko E , Markin A , Samoilova V , Ilina T , Koshovyi O . Research in the chemical composition of the bark of Sorbus aucuparia. Ceska Slov Farm. 2018; 67( 3): 113– 5. doi:10.36290/csf.2018.016. [Google Scholar] [CrossRef]
27. Premarathna AD , Tuvikene R , Somasiri M , De Silva M , Adhikari R , Ranahewa TH , et al. A novel therapeutic effect of mannitol-rich extract from the brown seaweed Sargassum ilicifolium using in vitro and in vivo models. BMC Complement Med Ther. 2023; 23( 1): 26. doi:10.1186/s12906-023-03840-0. [Google Scholar] [CrossRef]
28. Premarathna AD , Ahmed TAE , Rjabovs V , Hammami R , Critchley AT , Tuvikene R , et al. Immunomodulation by xylan and carrageenan-type polysaccharides from red seaweeds: anti-inflammatory, wound healing, cytoprotective, and anticoagulant activities. Int J Biol Macromol. 2024; 260( 1): 129433. doi:10.1016/j.ijbiomac.2024.129433. [Google Scholar] [CrossRef]
29. Premarathna AD , Ranahewa TH , Wijesekera SK , Wijesundara RRMKK , Jayasooriya AP , Wijewardana V , et al. Wound healing properties of aqueous extracts of Sargassum illicifolium: an in vitro assay. Wound Med. 2019; 24( 1): 1– 7. doi:10.1016/j.wndm.2018.11.001. [Google Scholar] [CrossRef]
30. Premarathna AD , Sooäär A , Ahmed TAE , Rjabovs V , Hincke MT , Tuvikene R . Isolation, structural characterization and biological activities of polysaccharides from Chondrus crispus. Food Hydrocoll. 2024; 154: 110131. doi:10.1016/j.foodhyd.2024.110131. [Google Scholar] [CrossRef]
31. Zhang L , Zhao Q , Chen CH , Qin QZ , Zhou Z , Yu ZP . Synaptophysin and the dopaminergic system in hippocampus are involved in the protective effect of rutin against trimethyltin-induced learning and memory impairment. Nutr Neurosci. 2014; 17( 5): 222– 9. doi:10.1179/1476830513Y.0000000085. [Google Scholar] [CrossRef]
32. Stefanov OV . Preclinical studies of drugs. Kyiv, Ukraine: Avicenna; 2001. 288 p. [Google Scholar]
33. Verkhovna Rada of Ukraine . Law of Ukraine No. 3447-IV: On the Protection of Animals from Cruelty (as amended and supplemented) [Internet]. 2006 [cited 2025 Nov 19]. Available from: https://zakon.rada.gov.ua/laws/show/3447-15#Text. [Google Scholar]
34. Verkhovna Rada of Ukraine . On Approval of the Procedure for Preclinical Study of Medicinal Products and Examination of Materials of Preclinical Study of Medicinal Products [Internet]. 2009 [cited 2025 Nov 19]. Available from: https://zakon.rada.gov.ua/laws/show/z0972-01#Text. [Google Scholar]
35. Council of Europe . European Convention for the Protection of Vertebrate Animals Used for Experimental and Other Scientific Purposes [Internet]. 1999 [cited 2005 Dec 2]. Available from: https://eur-lex.europa.eu/legal-content/EN/TXT/?uri=CELEX%3A21999A0824%2801%29. [Google Scholar]
36. State Pharmacopoeia of Ukraine. 2nd ed. Kharkiv, Ukraine: Ukrainian Scientific Pharmacopoeial Center of Drugs Quality; 2015. 720 p. [Google Scholar]
37. Lapach SN , Chubenko AV , Babich PN . Statistical methods in biomedical research using excel. Kyiv, Ukraine: MORION; 2000. 320 p. [Google Scholar]
38. Tovchiga OV , Shtrygol’ SJ , Balia AA . The influence of goutweed (Aegopodium podagraria L.) extract and tincture on the behavioural reactions of mice against the background of caffeine-sodium benzoate. Klìn Farm. 2018; 22( 3): 29– 37. doi:10.24959/cphj.18.1459. [Google Scholar] [CrossRef]
39. Prokopchuk OG , Aleksandrova OI , Kravchenko IA . Study of the dynamics of anticonvulsant and anxiolytic action after oral administration of tin (II) chloride. Rep Vinnytsia Nation Med Univ. 2019; 23( 2): 204– 8. doi:10.31393/reports-vnmedical-2019-23(2)-03. [Google Scholar] [CrossRef]
40. Singh B , Jalwal P , Dahiya J , Khokhara S . Research methods for animal studies of the anxiolytic drugs. Pharma Innov J. 2016; 5( 1): 19– 22. [Google Scholar]
41. Cryan JF , Mombereau C , Vassout A . The tail suspension test as a model for assessing antidepressant activity: review of pharmacological and genetic studies in mice. Neurosci Biobehav Rev. 2005; 29( 4–5): 571– 625. doi:10.1016/j.neubiorev.2005.03.009. [Google Scholar] [CrossRef]
42. Steru L , Chermat R , Thierry B , Simon P . The tail suspension test: a new method for screening antidepressants in mice. Psychopharmacology. 1985; 85( 3): 367– 70. doi:10.1007/BF00428203. [Google Scholar] [CrossRef]
43. Hamsalakshmi , Alex AM , Arehally Marappa M , Joghee S , Chidambaram SB . Therapeutic benefits of flavonoids against neuroinflammation: a systematic review. Inflammopharmacology. 2022; 30( 1): 111– 36. doi:10.1007/s10787-021-00895-8. [Google Scholar] [CrossRef]
44. Rudrapal M , Khairnar SJ , Khan J , Dukhyil AB , Ansari MA , Alomary MN , et al. Dietary polyphenols and their role in oxidative stress-induced human diseases: insights into protective effects, antioxidant potentials and mechanism(s) of action. Front Pharmacol. 2022; 13: 806470. doi:10.3389/fphar.2022.806470. [Google Scholar] [CrossRef]
45. Pyrzanowska J , Piechal A , Blecharz-Klin K , Joniec-Maciejak I , Zobel A , Widy-Tyszkiewicz E . Influence of long-term administration of rutin on spatial memory as well as the concentration of brain neurotransmitters in aged rats. Pharmacol Rep. 2012; 64( 4): 808– 16. doi:10.1016/s1734-1140(12)70876-9. [Google Scholar] [CrossRef]
46. Zhang C , Wang S . Molecular mechanisms of neuroprotective effect of rutin. Front Pharmacol. 2025; 16: 1599167. doi:10.3389/fphar.2025.1599167. [Google Scholar] [CrossRef]
47. Silva Dos Santos J , Gonçalves Cirino JP , de Oliveira Carvalho P , Ortega MM . The pharmacological action of kaempferol in central nervous system diseases: a review. Front Pharmacol. 2021; 11: 565700. doi:10.3389/fphar.2020.565700. [Google Scholar] [CrossRef]
48. Suematsu N , Hosoda M , Fujimori K . Protective effects of quercetin against hydrogen peroxide-induced apoptosis in human neuronal SH-SY5Y cells. Neurosci Lett. 2011; 504( 3): 223– 7. doi:10.1016/j.neulet.2011.09.028. [Google Scholar] [CrossRef]
49. Kim JH , Choi JS , Cho EJ . Protective effects of kaempferol, quercetin, and its glycosides against hydrogen peroxide-induced oxidative stress in SH-SY5Y neuronal cells. J Agric Life Environ Sci. 2024; 36( 3): 278– 88. [Google Scholar]
50. Jantas D , Malarz J , Le TN , Stojakowska A . Neuroprotective properties of kempferol derivatives from Maesa membranacea against oxidative stress-induced cell damage: an association with cathepsin D inhibition and PI3K/Akt activation. Int J Mol Sci. 2021; 22( 19): 10363. doi:10.3390/ijms221910363. [Google Scholar] [CrossRef]
51. Taban K , İlhan M , Süntar I . Luteolin: advances on resources, biosynthesis pathway, bioavailability, bioactivity, and pharmacology. In: Xiao J , editor. Handbook of dietary flavonoids. Cham, Switzerland: Springer International Publishing; 2023. p. 1– 37. doi:10.1007/978-3-030-94753-8_5-1. [Google Scholar] [CrossRef]
52. De Stefano A , Caporali S , Di Daniele N , Rovella V , Cardillo C , Schinzari F , et al. Anti-inflammatory and proliferative properties of luteolin-7-O-glucoside. Int J Mol Sci. 2021; 22( 3): 1321. doi:10.3390/ijms22031321. [Google Scholar] [CrossRef]
53. Daroi PA , Dhage SN , Juvekar AR . P-Coumaric acid mitigates lipopolysaccharide induced brain damage via alleviating oxidative stress, inflammation and apoptosis. J Pharm Pharmacol. 2022; 74( 4): 556– 64. doi:10.1093/jpp/rgab077. [Google Scholar] [CrossRef]
54. Di Giacomo S , Percaccio E , Gullì M , Romano A , Vitalone A , Mazzanti G , et al. Recent advances in the neuroprotective properties of ferulic acid in Alzheimer’s disease: a narrative review. Nutrients. 2022; 14( 18): 3709. doi:10.3390/nu14183709. [Google Scholar] [CrossRef]
55. Ito S , Tanaka H , Ojika M , Wakamatsu K , Sugumaran M . Oxidative transformations of 3,4-dihydroxyphenylacetaldehyde generate potential reactive intermediates as causative agents for its neurotoxicity. Int J Mol Sci. 2021; 22( 21): 11751. doi:10.3390/ijms222111751. [Google Scholar] [CrossRef]
56. Corti O , Blomgren K , Poletti A , Beart PM . Autophagy in neurodegeneration: new insights underpinning therapy for neurological diseases. J Neurochem. 2020; 154( 4): 354– 71. doi:10.1111/jnc.15002. [Google Scholar] [CrossRef]
57. Mulati A , Zhang X , Zhao T , Ren B , Wang L , Liu X , et al. Isorhamnetin attenuates high-fat and high-fructose diet induced cognitive impairments and neuroinflammation by mediating MAPK and NFκB signaling pathways. Food Funct. 2021; 12( 19): 9261– 72. doi:10.1039/d0fo03165h. [Google Scholar] [CrossRef]
58. de León-López CAM , Carretero-Rey M , Khan ZU . AMPA receptors in synaptic plasticity, memory function, and brain diseases. Cell Mol Neurobiol. 2025; 45( 1): 14. doi:10.1007/s10571-024-01529-7. [Google Scholar] [CrossRef]
59. Nicosia N , Giovenzana M , Misztak P , Mingardi J , Musazzi L . Glutamate-mediated excitotoxicity in the pathogenesis and treatment of neurodevelopmental and adult mental disorders. Int J Mol Sci. 2024; 25( 12): 6521. doi:10.3390/ijms25126521. [Google Scholar] [CrossRef]
60. Raiteri L . Interactions involving Glycine and other amino acid neurotransmitters: focus on transporter-mediated regulation of release and Glycine-glutamate crosstalk. Biomedicines. 2024; 12( 7): 1518. doi:10.3390/biomedicines12071518. [Google Scholar] [CrossRef]
61. Waløen K , Kleppe R , Martinez A , Haavik J . Tyrosine and tryptophan hydroxylases as therapeutic targets in human disease. Expert Opin Ther Targets. 2017; 21( 2): 167– 80. doi:10.1080/14728222.2017.1272581. [Google Scholar] [CrossRef]
62. Carthy E , Ellender T . Histamine, neuroinflammation and neurodevelopment: a review. Front Neurosci. 2021; 15: 680214. doi:10.3389/fnins.2021.680214. [Google Scholar] [CrossRef]
63. Nomura H , Shimizume R , Ikegaya Y . Histamine: a key neuromodulator of memory consolidation and retrieval. In: Yanai K , Passani MB , editors. The functional roles of histamine receptors. Current topics in behavioral neurosciences, vol. 59. Cham, Switzerland: Springer International Publishing; 2021. p. 329– 53. doi:10.1007/7854_2021_253. [Google Scholar] [CrossRef]
64. Scarpellino G , Brunetti V , Berra-Romani R , De Sarro G , Guerra G , Soda T , et al. The unexpected role of the endothelial nitric oxide synthase at the neurovascular unit: beyond the regulation of cerebral blood flow. Int J Mol Sci. 2024; 25( 16): 9071. doi:10.3390/ijms25169071. [Google Scholar] [CrossRef]
65. Lourenço CF , Laranjinha J . Nitric oxide pathways in neurovascular coupling under normal and stress conditions in the brain: strategies to rescue aberrant coupling and improve cerebral blood flow. Front Physiol. 2021; 12: 729201. doi:10.3389/fphys.2021.729201. [Google Scholar] [CrossRef]
66. Yeger H , Mokhtari RB . Perspective on dietary isothiocyanates in the prevention, development and treatment of cancer. J Cancer Metastasis Treat. 2020; 6: 26. doi:10.20517/2394-4722.2020.61. [Google Scholar] [CrossRef]
67. Jomova K , Alomar SY , Valko R , Liska J , Nepovimova E , Kuca K , et al. Flavonoids and their role in oxidative stress, inflammation, and human diseases. Chem Biol Interact. 2025; 413: 111489. doi:10.1016/j.cbi.2025.111489. [Google Scholar] [CrossRef]
68. Shen L , Luo H , Fan L , Tian X , Tang A , Wu X , et al. Potential immunoregulatory mechanism of plant saponins: a review. Molecules. 2023; 29( 1): 113. doi:10.3390/molecules29010113. [Google Scholar] [CrossRef]
69. Saleh HA , Yousef MH , Abdelnaser A . The anti-inflammatory properties of phytochemicals and their effects on epigenetic mechanisms involved in TLR4/NF-κB-mediated inflammation. Front Immunol. 2021; 12: 606069. doi:10.3389/fimmu.2021.606069. [Google Scholar] [CrossRef]
70. Chojnacka K , Lewandowska U . Inhibition of pro-inflammatory cytokine secretion by polyphenol-rich extracts in macrophages via NF-κB pathway. Food Rev Int. 2023; 39( 8): 5459– 78. doi:10.1080/87559129.2022.2071936. [Google Scholar] [CrossRef]
71. Duarte J , Francisco V , Perez-Vizcaino F . Modulation of nitric oxide by flavonoids. Food Funct. 2014; 5( 8): 1653– 68. doi:10.1039/c4fo00144c. [Google Scholar] [CrossRef]
72. Terao J . Factors modulating bioavailability of quercetin-related flavonoids and the consequences of their vascular function. Biochem Pharmacol. 2017; 139: 15– 23. doi:10.1016/j.bcp.2017.03.021. [Google Scholar] [CrossRef]
73. Pal RR , Rajpal V , Singh N , Singh S , Mishra N , Singh P , et al. Downregulation of pro-inflammatory markers IL-6 and TNF-α in rheumatoid arthritis using nano-lipidic carriers of a quinone-based phenolic: an in vitro and in vivo study. Drug Deliv Transl Res. 2023; 13( 2): 627– 41. doi:10.1007/s13346-022-01221-7. [Google Scholar] [CrossRef]
74. Roberts AB , McCune BK , Sporn MB . TGF-β: regulation of extracellular matrix. Kidney Int. 1992; 41( 3): 557– 9. doi:10.1038/ki.1992.81. [Google Scholar] [CrossRef]
75. Günther J , Koy M , Berthold A , Schuberth HJ , Seyfert HM . Comparison of the pathogen species-specific immune response in udder derived cell types and their models. Vet Res. 2016; 47: 22. doi:10.1186/s13567-016-0307-3. [Google Scholar] [CrossRef]
76. Kennedy DO , Scholey AB . Ginseng: potential for the enhancement of cognitive performance and mood. Pharmacol Biochem Behav. 2003; 75( 3): 687– 700. doi:10.1016/S0091-3057(03)00126-6. [Google Scholar] [CrossRef]
77. Panossian A , Wikman G . Effects of adaptogens on the central nervous system and the molecular mechanisms associated with their stress-protective activity. Pharmaceuticals. 2010; 3( 1): 188– 224. doi:10.3390/ph3010188. [Google Scholar] [CrossRef]
78. Dhawan K , Dhawan S , Sharma A . Passiflora: a review update. J Ethnopharmacol. 2004; 94( 1): 1– 23. doi:10.1016/j.jep.2004.02.023. [Google Scholar] [CrossRef]
79. Hattesohl M , Feistel B , Sievers H , Lehnfeld R , Hegger M , Winterhoff H . Extracts of Valeriana officinalis L. s.l. show anxiolytic and antidepressant effects but neither sedative nor myorelaxant properties. Phytomedicine. 2008; 15( 1–2): 2– 15. doi:10.1016/j.phymed.2007.11.027. [Google Scholar] [CrossRef]
80. Harsha SN , Anilakumar KR . Anxiolytic property of Lactuca sativa, effect on anxiety behaviour induced by novel food and height. Asian Pac J Trop Med. 2013; 6( 7): 532– 6. doi:10.1016/S1995-7645(13)60091-7. [Google Scholar] [CrossRef]
81. Mititelu-Tartau L , Bogdan M , Pavel LL , Rezus C , Foia CI , Dima N , et al. Anxiolytic-like activity, antioxidant properties, and facilitatory effects on the short-term memory retention of molsidomine in rats. Life.. 2024; 14( 3): 306. doi:10.3390/life14030306. [Google Scholar] [CrossRef]
82. Begum A , Hossen A , Moly AA , Bhuiyan MMR , Shahed-Al-Mahmud MS . In vivo sedative and anxiolytic activities of Thunbergia erecta (Acanthaceae) leaves activate gamma-aminobutyric acid (GABA) mediated hyperpolarizationin Swiss albino mice. Pharmacol Pharm. 2019; 10( 4): 177– 93. doi:10.4236/pp.2019.104016. [Google Scholar] [CrossRef]
83. Mahendra P , Bisht S . Anti-anxiety activity of Coriandrum sativum assessed using different experimental anxiety models. Indian J Pharmacol. 2011; 43( 5): 574– 7. doi:10.4103/0253-7613.84975. [Google Scholar] [CrossRef]
84. Ioniță R . Anxiolytic and antidepressant effects of Matricaria chamomilla hydroalcoholic extract in a rat model of scopolamine. Farmacia. 2019; 67( 1): 68– 72. doi:10.31925/farmacia.2019.1.9. [Google Scholar] [CrossRef]
85. Wasnik U , Singh V , Ali M . Evaluation of the antidepressant effects of Bacopa monieri in mice. Int J Pharm Sci Res. 2015; 6( 2): 890– 4. [Google Scholar]
86. Es-Safi I , Mechchate H , Amaghnouje A , Elbouzidi A , Bouhrim M , Bencheikh N , et al. Assessment of antidepressant-like, anxiolytic effects and impact on memory of Pimpinella anisum L. total extract on Swiss albino mice. Plants. 2021; 10( 8): 1573. doi:10.3390/plants10081573. [Google Scholar] [CrossRef]
87. Namjou A , Yazdani N , Abbasi E , Rafieian-Kopaei M . The antidepressant activity of Matricaria chamomilla and Melissa officinalis ethanolic extracts in non-reserpinized and reserpinized Balb/C mice. Jundishapur J Nat Pharm Prod. 2018; 13( 4): e65549. doi:10.5812/jjnpp.65549. [Google Scholar] [CrossRef]
Cite This Article
 Copyright © 2025 The Author(s). Published by Tech Science Press.
This work is licensed under a Creative Commons Attribution 4.0 International License , which permits unrestricted use, distribution, and reproduction in any medium, provided the original work is properly cited.
 Downloads
 Citation Tools