
 Submit a Paper
 Propose a Special lssue
 Open Access
ARTICLE

Forecasting Modeling Tool of Crop Diseases across Multiple Scenarios: System Design, Implementation, and Applications
1 College of Artificial Intelligence, Hangzhou Dianzi University, Hangzhou, 310018, China
2 Agricultural Technology Extension Station of Ningbo, Ningbo, 315012, China
* Corresponding Author: Jingcheng Zhang. Email:
# These authors contributed equally to this work
(This article belongs to the Special Issue: Application of Digital Agriculture and Machine Learning Technologies in Crop Production)
Phyton-International Journal of Experimental Botany 2025, 94(12), 4059-4078. https://doi.org/10.32604/phyton.2025.074422
Received 10 October 2025; Accepted 22 December 2025; Issue published 29 December 2025
 View Full Text
 Download PDF
Abstract
The frequent outbreaks of crop diseases pose a serious threat to global agricultural production and food security. Data-driven forecasting models have emerged as an effective approach to support early warning and management, yet the lack of user-friendly tools for model development remains a major bottleneck. This study presents the Multi-Scenario Crop Disease Forecasting Modeling System (MSDFS), an open-source platform that enables end-to-end model construction-from multi-source data ingestion and feature engineering to training, evaluation, and deployment-across four representative scenarios: static point-based, static grid-based, dynamic point-based, and dynamic grid-based. Unlike conventional frameworks, MSDFS emphasizes modeling flexibility, allowing users to build, compare, and interpret diverse forecasting approaches within a unified workflow. A notable feature of the system is the integration of a weather scenario generator, which facilitates comprehensive testing of model performance and adaptability under extreme climatic conditions. Case studies corresponding to the four scenarios were used to validate the system, with overall accuracy (OA) ranging from 73% to 93%. By lowering technical barriers, the system is designed to serve plant protection managers and agricultural producers without advanced programming expertise, providing a practical modeling tool that supports the construction of smart plant protection systems.Keywords
The frequent occurrence of crop diseases represents a pressing challenge to global agricultural production and food security, with risks further exacerbated by international trade and climate change [1]. It is estimated that such outbreaks cause more than 30% yield loss worldwide each year, amounting to economic losses of hundreds of billions of dollars [2]. In light of this challenge, plant health management strategies must transition from traditional post-disaster responses to proactive, risk-based prevention frameworks. Early forecasting and timely interventions are critical for minimizing corresponding damages. At present, crop disease forecasting largely relies on expert knowledge or empirical models [3]. While such approaches can provide broad insights into epidemic trends, they often fail to quantitatively characterize the intricate interactions among pathogens, hosts, and the environment, making precise prediction difficult.
Recent advances in data-driven modeling have opened new avenues for large-scale crop disease prediction. By integrating heterogeneous datasets, including meteorological, environmental, remote sensing, and crop disease survey records, with machine learning algorithms and epidemiological models, these approaches can capture nonlinear relationships and intricate patterns underlying outbreaks [4,5]. Such models offer objective, evidence-based predictions, and the incorporation of spatio-temporal environmental information (such as daily temperature and vegetation indices) enables more refined early-warning capabilities, thereby strengthening support for precision crop disease management [6].
Crop disease forecasting models are generally classified into two categories: static and dynamic. Static models focus on estimating disease severity or outbreak peaks during specific periods (e.g., annual cycles or critical phenological stages). They typically employ machine learning or statistical methods such as Random Forests or k-nearest neighbors, trained on environmental and agronomic data [7]. These models are efficient for short-term assessments. In contrast, dynamic models simulate and forecast the temporal progression of epidemics based on epidemiological mechanisms, often incorporating differential equation models or deep learning approaches to describe host-pathogen-environment interactions [8,9,10,11,12].
Both static and dynamic models may be driven by either point-based data (e.g., weather stations, IoT sensors) or grid distributed data (e.g., remote sensing, gridded meteorological datasets) [13,14]. For instance, De Oliveira Aparecido et al. [15] developed a coffee leaf rust model by integrating temperature and rainfall statistics (e.g., maximum temperature, number of rainy days, and number of high-humidity days) with field survey data on disease occurrence, while Chaiyana et al. [16] predicted cassava mosaic disease using Sentinel-2 based NDVI time series data with cumulative precipitation and daily maximum temperature variables. Similarly, Li et al. [17] combined Sentinel-2 indices (e.g., FVC and the remote sensing factor REHBI, which combines the red and red-edge bands) with precipitation data (e.g., average precipitation and the number of days with precipitation) to forecast wheat Fusarium head blight.
Although data-driven approaches (i.e., methods that learn predictive patterns directly from observational data) demonstrate promising performance across multiple scenarios, their adoption is constrained by the substantial expertise needed in data processing and modeling. For many plant protection personnel, these technical barriers limit practical application [18,19]. This gap highlights the urgent need for integrated tools that lower entry thresholds while supporting diverse forecasting tasks. Recent studies have made preliminary attempts in this direction. For example, Madasamy et al. [20] developed a cotton forecasting system based on ARIMA models and microclimate data. This system automatically collects microclimate data and enables early warning, which achieved a prediction accuracy of 92.3%. Considering the needs of agricultural managers and researchers in East Africa, Brown et al. [21] designed a warning system framework targeting invasive crop diseases such as the fall armyworm. The system predicts the spatiotemporal dynamics of the crop disease, with the prediction accuracy reached AUC of 0.76.
Although these systems provide valuable exploratory attempts, they remain limited in scope, as most support only a narrow range of modeling options, are designed for specific crops or diseases, rely on external tools for preprocessing or feature extraction, and are generally confined to point-based data. Moreover, their reliance on simplistic, fixed models not only undermines generalization across crops and regions but also restricts functionality to mere result visualization, preventing users from constructing or training custom models. To enable plant protection managers and large-scale growers to conveniently construct, test, and implement forecasting models, a highly automated system with strong modeling capacity and broad scenario compatibility is urgently needed.
In response to these limitations, this study introduces the Multi-Scenario Crop Disease Forecasting Modeling System (hereafter called “MSDFS” for simplicity)-an open-source system designed to integrate multi-source data, support diverse modeling approaches, and streamline the entire workflow from data preprocessing to model deployment. Specifically, MSDFS aims to: (1) enable compatibility with multi-source data and modeling scenarios; (2) support a wide range of crop disease forecasting methods; (3) provide comprehensive model tests under both real-world and simulated weather conditions; and (4) allow flexible customization and deployment of models. Ultimately, the system is intended to empower plant protection managers and agricultural professionals with accessible yet powerful tools, supporting variable control of crop diseases over large area.
This study developed a crop disease forecasting modeling systems that is applicable to multiple scenarios. The system addresses two major categories of prediction settings: static and dynamic. Within each category, the models are further classified into point-based models, which are driven by point data such as meteorological records, crop disease survey records, and grid-based models, which rely on spatial data including remote sensing imagery, topographic maps, and gridded meteorological data. The design and development of the system follow a modular workflow architecture encompassing data upload, preprocessing, feature extraction and selection, model construction, evaluation, and application. To support diverse analytical requirements, the system incorporates a customizable toolkit that includes 4 preprocessing methods, 8 feature extraction techniques, 3 feature selection strategies, and 8 modeling algorithm modules. Furthermore, to improve model interpretability and usability, visualization components are embedded at every stage of the workflow, enabling interactive exploration, efficient comparison of analytical strategies, and fine-tuning of model parameters. Together, these features provide a comprehensive solution that ensures scientific robustness while remaining accessible for practical application.
To enable crop disease forecasting across four distinct modeling scenarios-static point-based, static grid-based, dynamic point-based, and dynamic grid-based-the system was designed to address four key challenges: (1) How can multi-source, heterogeneous datasets be efficiently ingested, transformed, and integrated? (2) How can diverse modeling methods be embedded within a unified system architecture? (3) How can the adaptability of models be tested under extreme climatic conditions? (4) How can a streamlined workflow be developed that automates data ingestion and facilitates efficient model deployment for forecasting tasks?
Based on these requirements, the system architecture was organized into four functional modules: the Data Management Module, the Core Function Module, the Visualization and Interaction Module, and the Cloud Service Module (see Fig. 1). The Data Management Module integrates multi-source datasets, including crop disease survey data, remote sensing, and meteorological data, and provides standardized input for modeling. The Core Function Module represents the computational core of the system, offering capabilities such as data preprocessing, feature selection, model training, and prediction across multiple scenarios. The Visualization and Interaction Module serves as the graphical user interface (GUI), integrating multiple third-party open-source libraries to ensure coherent coordination and efficient management of functionalities. The Cloud Service Module provides the runtime environment. The application is publicly accessible through the Streamlit Community Cloud (https://pestfcst.streamlit.app, accessed on 11 December 2025), which allocates approximately two CPU cores and 2 GB of shared RAM, allowing users, including those without programming experience, to directly interact with all system functions through a web-based interface. The full source code of MSDFS is publicly available at our GitHub repository: https://github.com/Marvelss/DiseaseForecast (accessed on 11 December 2025).
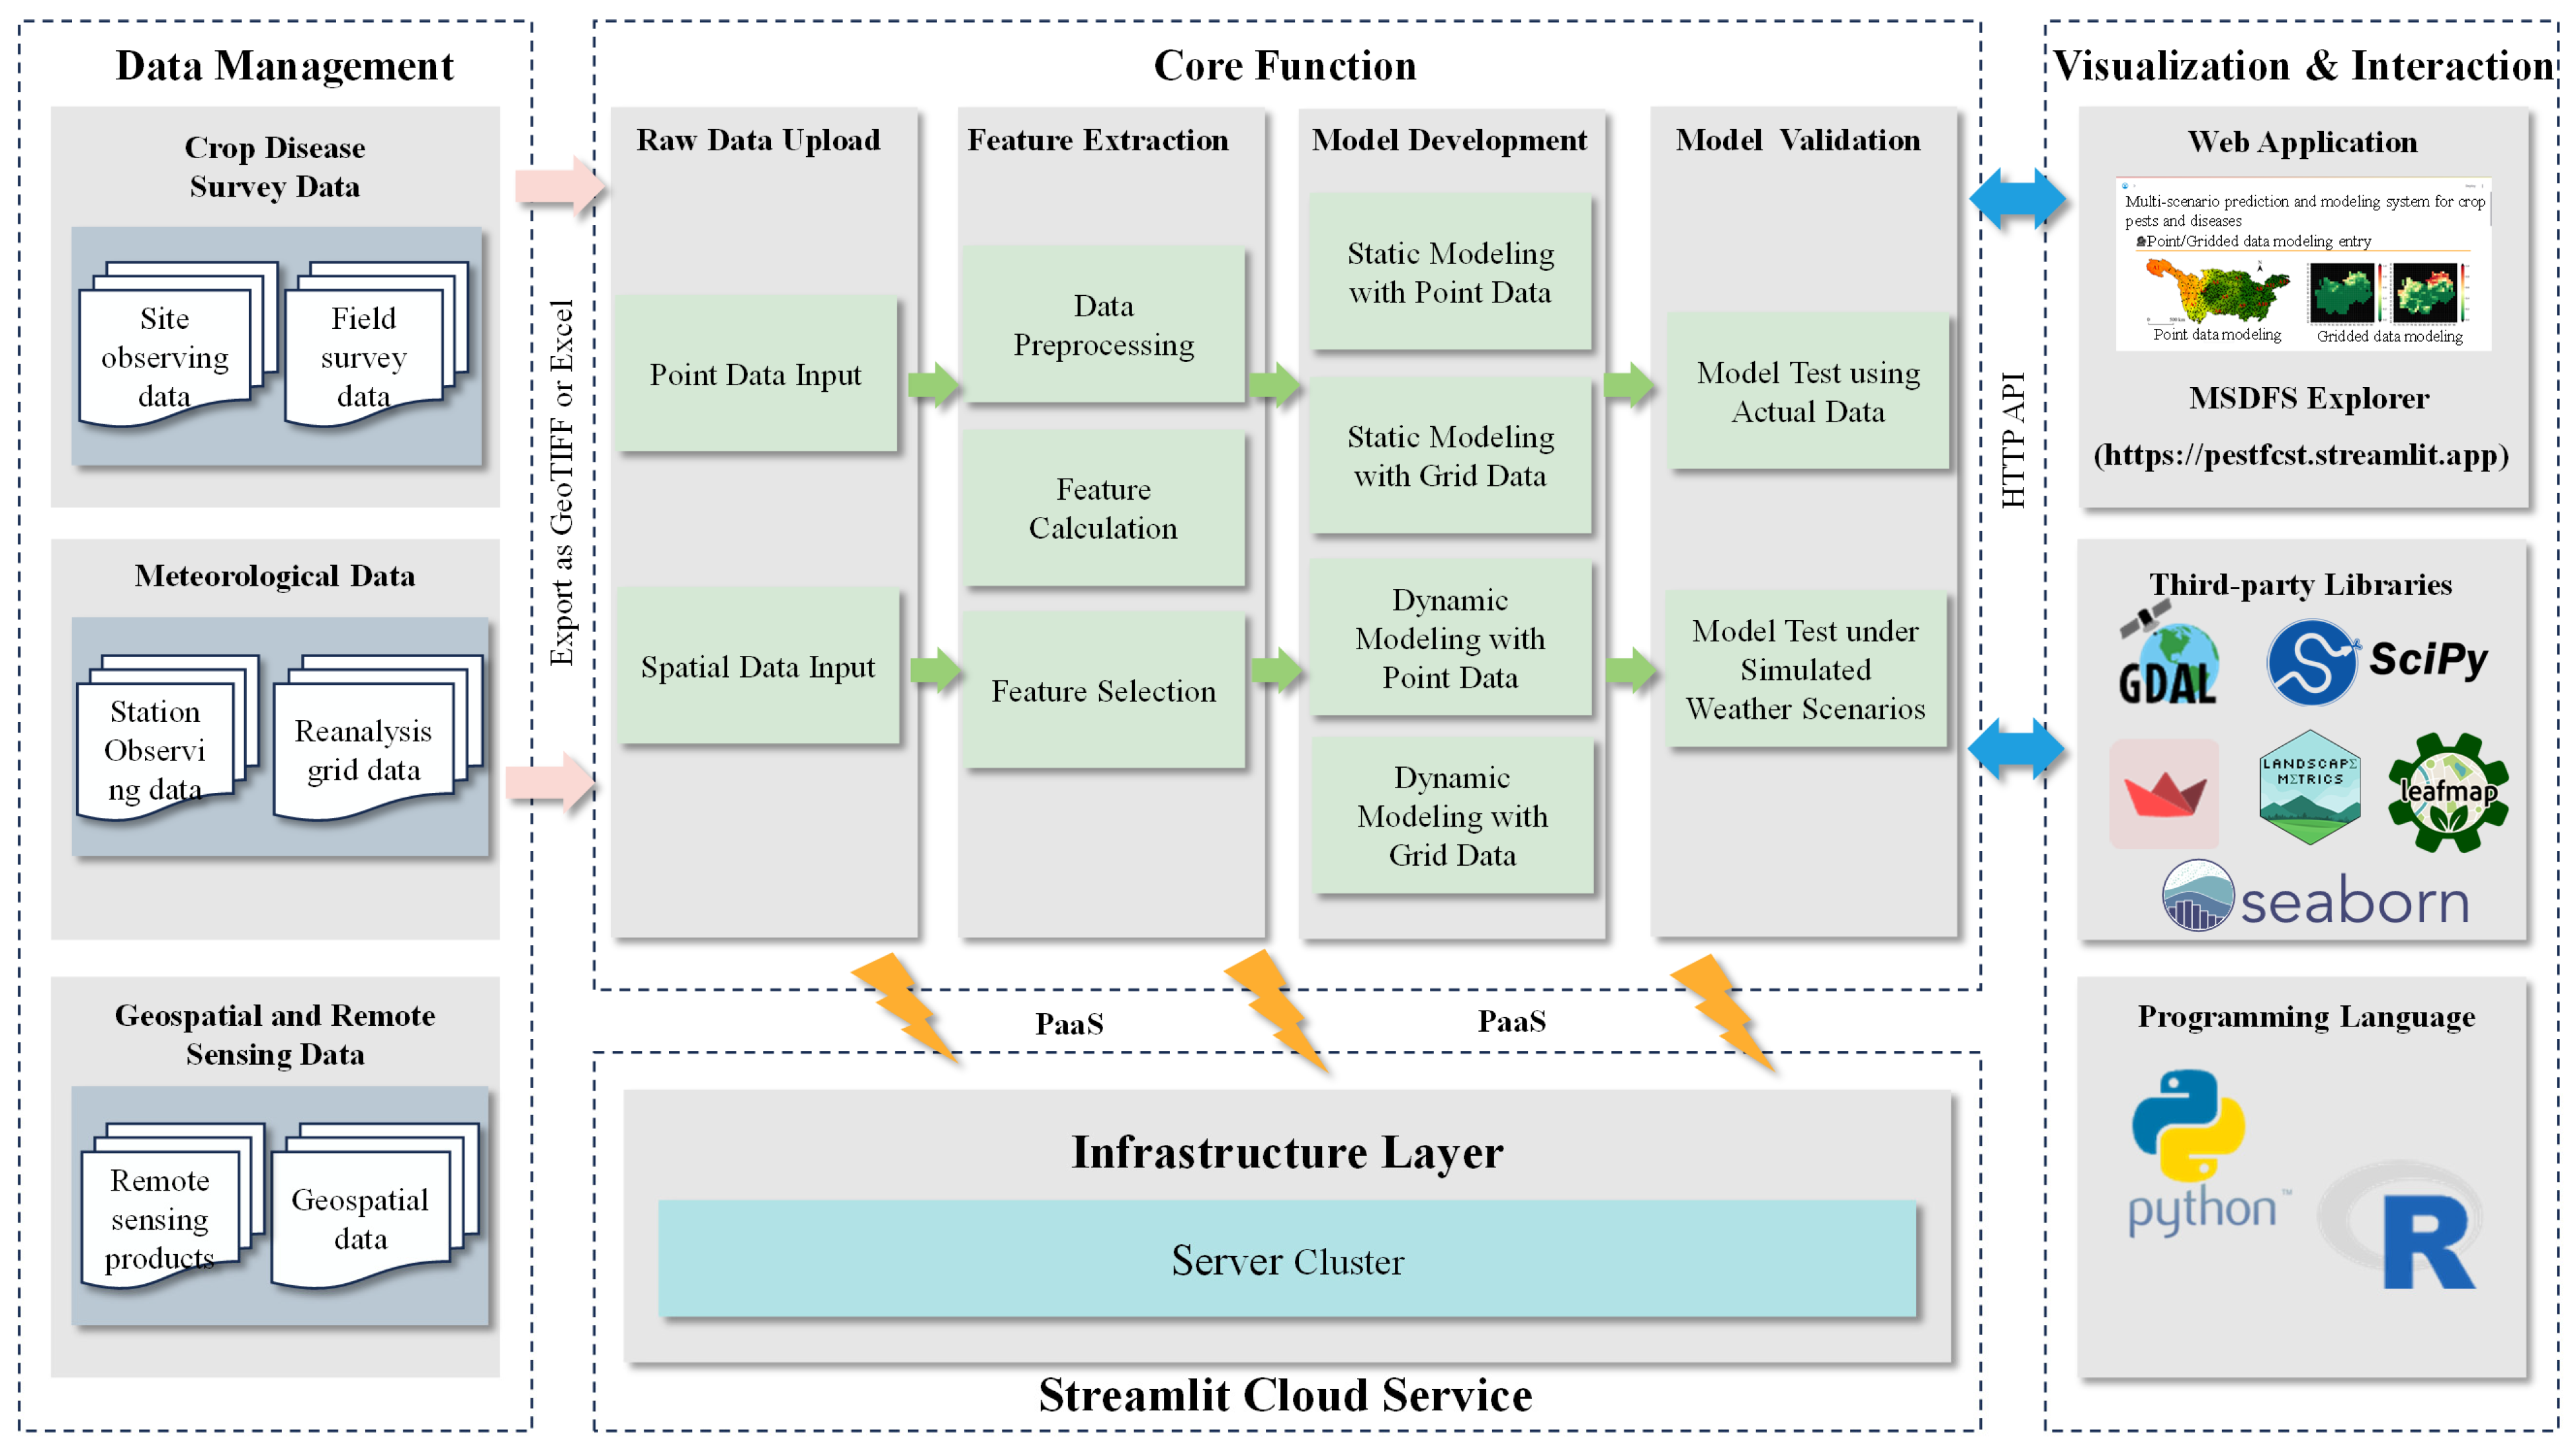
Figure 1: Overall system architecture of MSDFS (Multi-Scenario Crop Disease Forecasting Modeling System).
The MSDFS is designed to accommodate three primary types of datasets as model inputs: agronomic data, meteorological data, and remote sensing and geographic data. In them, agronomic data include crop disease incidence rates, severity levels, and crop physiological or growth status. These data are typically derived from official survey records, automated monitoring devices, or crowdsourced observations. Meteorological data (e.g., temperature, precipitation, humidity) are usually stored in tabular formats such as CSV or Excel, or in NetCDF formats. Data sources include institutions such as the China Meteorological Administration Meteorological Data Center (CMDC), the European Centre for Medium-Range Weather Forecasts (ECMWF), the National Oceanic and Atmospheric Administration (NOAA), and local automated weather stations. Remote sensing and geographic data capture environmental and ecological information such as land use, terrain, and vegetation indices reflecting crop condition and surrounding environment. These datasets are generally provided in GeoTIFF raster or vector formats (e.g., ASCII, Shapefile). Common sources include satellite products (e.g., MODIS, Sentinel series) and geospatial datasets (e.g., GlobeLand30, Shuttle Radar Topography Mission [SRTM]). Table 1 summarizes the basic information of the input data for different forecasting scenarios.
Table 1: Basic information of the input data for four typical crop disease forecasting modeling scenarios.
| Data Category | Data Sources | Data Formats |
|---|---|---|
| Agronomic Data | Official survey records, automated monitoring devices, or crowdsourced observations | CSV, Excel |
| Meteorological Data | CMDC, ECMWF and NOAA. | Excel, NetCDF |
| Remote Sensing and Geographic Data | MODIS products, Sentinel 1/2, GlobeLand30, SRTM | GeoTIFF, ASCII, Shapefile |
2.4 System Function Implementation (Backend Development)
The crop disease forecasting framework was designed with principles of modularity and scalability, enabling seamless integration of diverse data ingestion methods, preprocessing routines, feature engineering approaches, and modeling techniques. This design allows users to efficiently conduct the entire analytical workflow-from raw data ingestion to model deployment. The overall functional workflow is illustrated in Fig. 2. The system’s core functionality is organized into three main components: (1) Modeling based on point data (Fig. 2a), (2) Modeling based on gridded data (Fig. 2b), and (Fig. 2c) Model Application, which integrates a weather scenario generator for model performance evaluation (Fig. 2c). From a technical perspective, the backend is primarily implemented in Python (v3.9, Python Software Foundation, Wilmington, NC, USA), with supplementary routines developed in R (v4.4.0, R Core Team, Vienna, Austria). A range of open-source libraries has been integrated to provide computational support, including NumPy (v1.26.2, NumPy Developers, open-source) and Pandas (v2.1.3, Pandas Development Team, open-source) for numerical computation and tabular data processing; GDAL (v3.8.2, Open Source Geospatial Foundation, open-source) and Rasterio (v1.3.10, Mapbox/Open Source Contributors, open-source) for geospatial data operations; landscapemetrics (v2.1.2, Hesselbarth et al., R package, open-source) for land-scape pattern analysis [22]; and Scikit-learn (v1.3.2, Scikit-learn Developers, INRIA, Paris, France, open-source) for machine learning-based modeling.
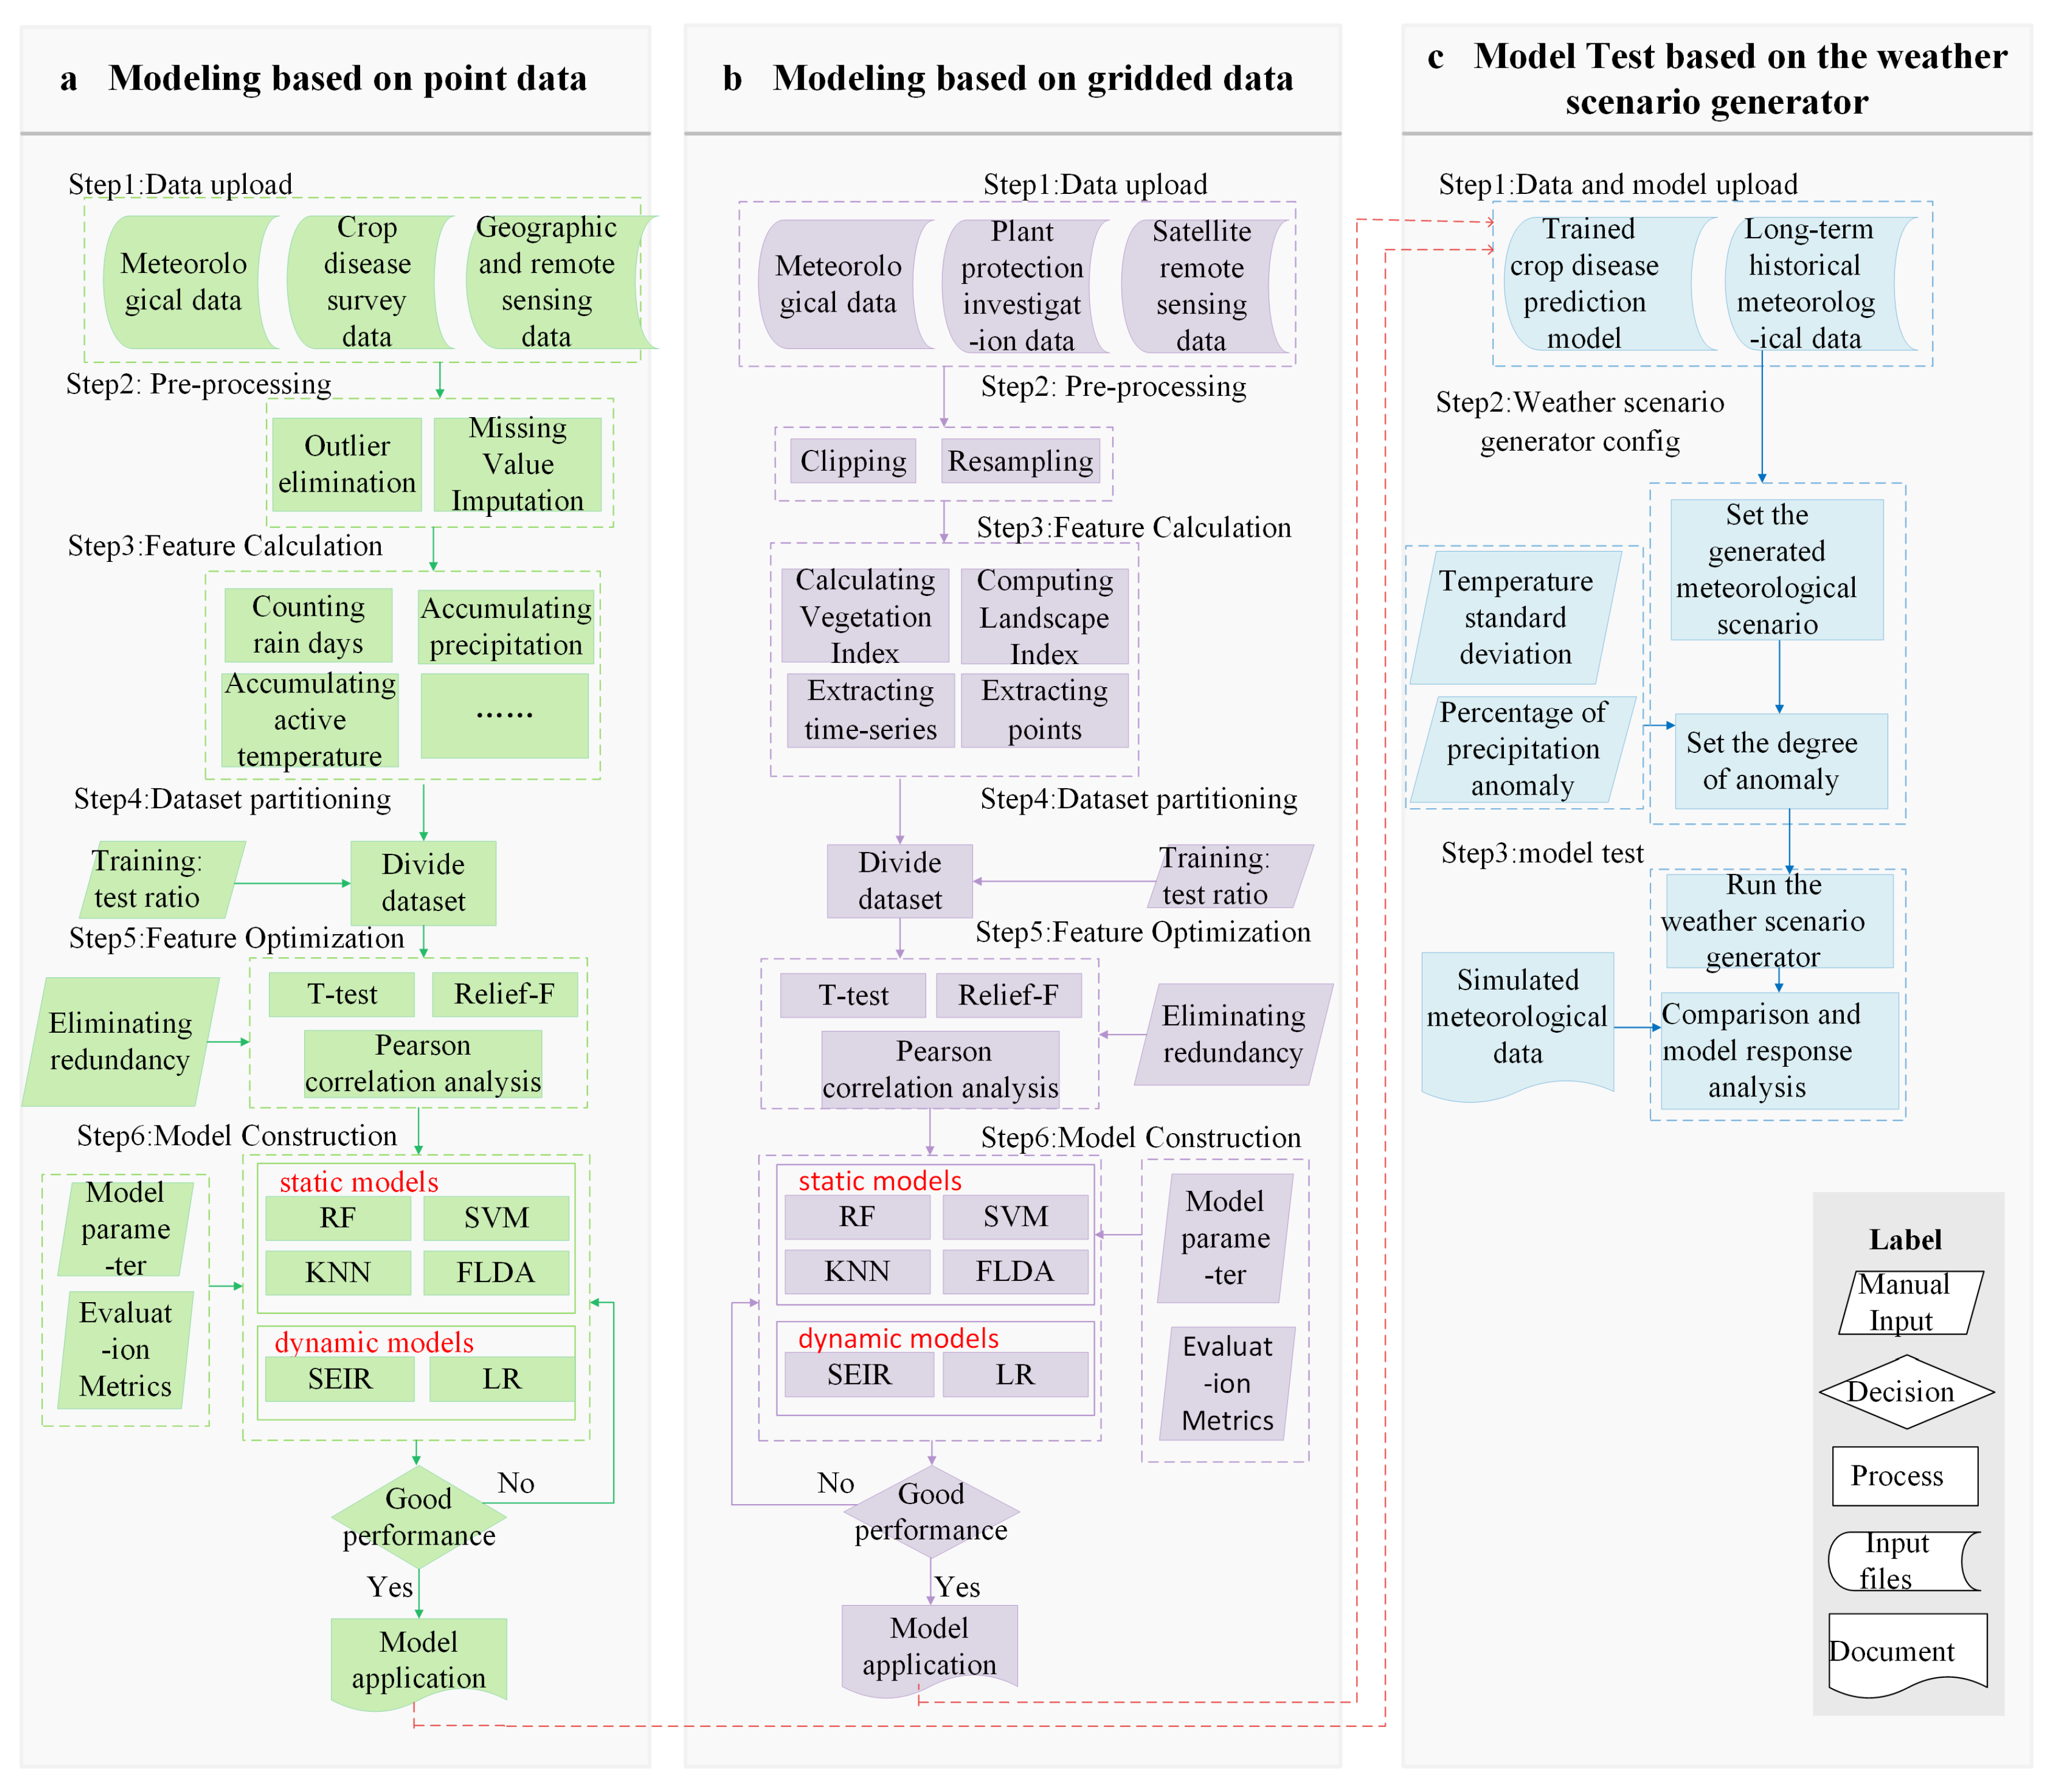
Figure 2: Workflow diagram of the Multi-Scenario Crop Disease Forecasting Modeling System (MSDFS). The RF stands for Random Forest, The SVM stands for Support Vector Machine, The KNN RF stands for K-Nearest Neighbor Algorithm, The FLDA stands for Linear Discriminant Analysis, The PLSR stands for Partial Least Squares Regression, The LR stands for Linear Regression, and The SVR stands for Support Vector Regression. (a) Modeling based on point data; (b) Modeling based on gridded data; (c) Modeling based on the weather scenario generator.
2.4.1 Data Input and Preprocessing
To handle multi-source and heterogeneous data, the system implements a standardized workflow for data ingestion, transformation, and validation. It automatically recognizes common file formats, including tabular files (e.g., *.csv, *.xlsx) and geospatial raster/vector files (e.g., *.tif, *.shp). For point-based data, users can extract and preprocess key variables, such as meteorological factors, crop disease indicators, and phenological stages, using either predefined templates or customized rules. The system performs automated data quality checks, including verification of essential spatial (latitude, longitude) and temporal (year, day of year) attributes, outlier detection, and missing-value imputation. For gridded data, files are organized as temporal series, and preprocessing options include resampling, clipping to regions of interest, and spatiotemporal consistency checks. These utilities ensure the integration of heterogeneous datasets from diverse sources into a clean, standardized format suitable for subsequent modeling and analysis.
2.4.2 Feature Extraction and Selection
The system provides an automated feature engineering toolkit that integrates 8 feature extraction methods, 3 feature selection algorithms, while also offering support for user-defined feature calculations. For meteorological data processing, derivative indicators such as cumulative precipitation and effective accumulated temperature can be automatically computed, given their significant influence on crop disease development in many cases [23,24]. For remote sensing data processing, the system incorporates automated calculation of widely used vegetation indices, such as the Normalized Difference Vegetation Index (NDVI) and the Enhanced Vegetation Index (EVI), to indicate crop vitality and habitat suitability [25]. Additionally, the system computes landscape metrics, including aggregation and connectivity indices, which are key drivers of disease and pathogen dispersal dynamics [26].
Based on these extracted features, the system provides an automated data integration and matching function. This function leverages spatiotemporal attributes (e.g., coordinates and timestamps) to align and integrate meteorological and remote sensing data with crop disease survey records, facilitating the construction of comprehensive feature sets for modeling. The system also incorporates a specialized spatiotemporal feature extraction method that first calculates active temperature accumulation to dynamically determine the sensitive phenological windows for diseases. It then extracts other multi-source environmental features within this temporal window to achieve more precise spatiotemporal feature alignment. To enhance model performance and mitigate overfitting, the system integrates several feature selection strategies, including student t-tests for identifying sensitive predictors, pairwise Pearson correlation analysis for removing redundant variables, as well as a Relief-F-based algorithm for multi-feature optimization. These tools allow users to select appropriate features for constructing the forecasting models of specific disease.
2.4.3 Construction, Validation, and Implementation of Models
In terms of crop disease forecasting modeling methods, the system integrates eight modeling approaches, including machine learning (e.g., SVM, FLDA, KNN, RF), statistical methods (e.g., PLSR, SVR, LR), and mechanistic modeling (SEIR with genetic algorithm optimization). These models are accessed through a unified interface that supports both default and customized parameter configurations, with machine learning models implemented via Scikit-learn. Model evaluation can be performed using custom train/test splits or k-fold cross-validation. To accommodate both classification- and regression-based forecasting tasks, the system provides multiple evaluation metrics. For classification models, Overall Accuracy (OA) (Eq. (1)) and the Kappa (Eq. (2)) coefficient are used. OA reflects the proportion of correctly predicted samples, whereas Kappa accounts for agreement occurring by chance, providing a more robust assessment of model reliability in predicting disease occurrence or severity levels. Their standard formulations are:
For regression models, the system reports Root Mean Square Error (RMSE) (Eq. (3)) and the coefficient of determination (R2) (Eq. (4)). RMSE quantifies the deviation between predicted and observed disease incidence and thus reflects the accuracy of numerical predictions, while measures the goodness of fit and the proportion of variance explained by the model. the metric formulas are as follows:
observedt is the actual survey value of the t-th phase, predictedt is the predicted value of the t-th phase, n is the total number of predicted phases.
To improve workflow continuity, the system integrates data input, model construction, and evaluation into a unified workflow engine. Each module operates independently but can be flexibly combined to support different modeling scenarios.
2.4.4 Weather Scenario Generator
Given the growing impact of climate change and frequent extreme weather events, a Weather Scenario Generator (WSG) module was designed to test the model adaptability under diverse climatic conditions. The WSG generates 9 categories of weather scenarios, including high/low temperature and high/low precipitation extremes, based on long-term historical meteorological records (see Table 2). Parameterization is guided by standards such as the China Temperature Evaluation Grade Standard (GB/T 35562-2017) and the Meteorological Drought Grade Standard (GB/T 20481-2017), while also allowing users to specify custom thresholds. The WSG employs a first-order autoregressive model for temperature simulation and a first-order Markov chain coupled with a probabilistic distribution model for precipitation simulation, both parameterized using long-term historical meteorological records [27]. By feeding the generated meteorological data into a trained model, users can assess its responsiveness, stability, and overall performance under diverse climatic conditions, providing guidance on whether model adjustments are necessary.
Table 2: Default settings for Weather Scenario Generator parameters.
| Simulated Weather Scenario | Maximum Precipitation Deviation | Minimum Precipitation Deviation | Maximum Temperature Deviation (°C) | Minimum Temperature Deviation (°C) |
|---|---|---|---|---|
| Hot and wet | 95% | 90% | 3.0 | 2.5 |
| Hot with normal precipitation | 0% | 0% | 3.0 | 2.5 |
| Hot and dry | −90% | −95% | 3.0 | 2.5 |
| Normal temperature and wet | 95% | 90% | 0 | 0 |
| Normal temperature with normal precipitation | 0% | 0% | 0 | 0 |
| Normal temperature and dry | −90% | −95% | 0 | 0 |
| Cold and wet | 95% | 90% | −2.5 | −3.0 |
| Cold with normal precipitation | 0% | 0% | −2.5 | −3.0 |
| Cold and dry | −90% | −95% | −2.5 | −3.0 |
2.5 System Interface and Interaction (Front-End Development)
To facilitate efficient interaction with the multi-scenario crop disease forecasting framework, a web-based graphical user interface (GUI) was developed using the Streamlit (v1.39.0, Streamlit Inc., San Francisco, CA, USA). With the integration of Leafmap (v0.42.4, Leafmap Developers, open-source), the interface provides raster data visualization, online map rendering, and interactive spatial analysis.
The interface design accounts for the distinct requirements of point-based and grid-based modeling tasks. Two layout schemes were implemented: the “Point-Insight Layout” (Fig. 3a), optimized for site-level analysis, and the “Geo-Spatial Canvas Layout” (Fig. 3b), designed for regional forecasting. The Point-Insight Layout adopts a multi-panel structure that separates data overview, modeling control, and result visualization panels, thereby enabling efficient handling of tabular datasets and flexible parameter adjustments. In contrast, the Geo-Spatial Canvas Layout is map-centered, with data layer management and spatial analysis functions embedded alongside, allowing intuitive visualization of spatial distribution patterns of diseases. Both layouts include a progress bar at the top of the interface to assist users in managing the modeling process.
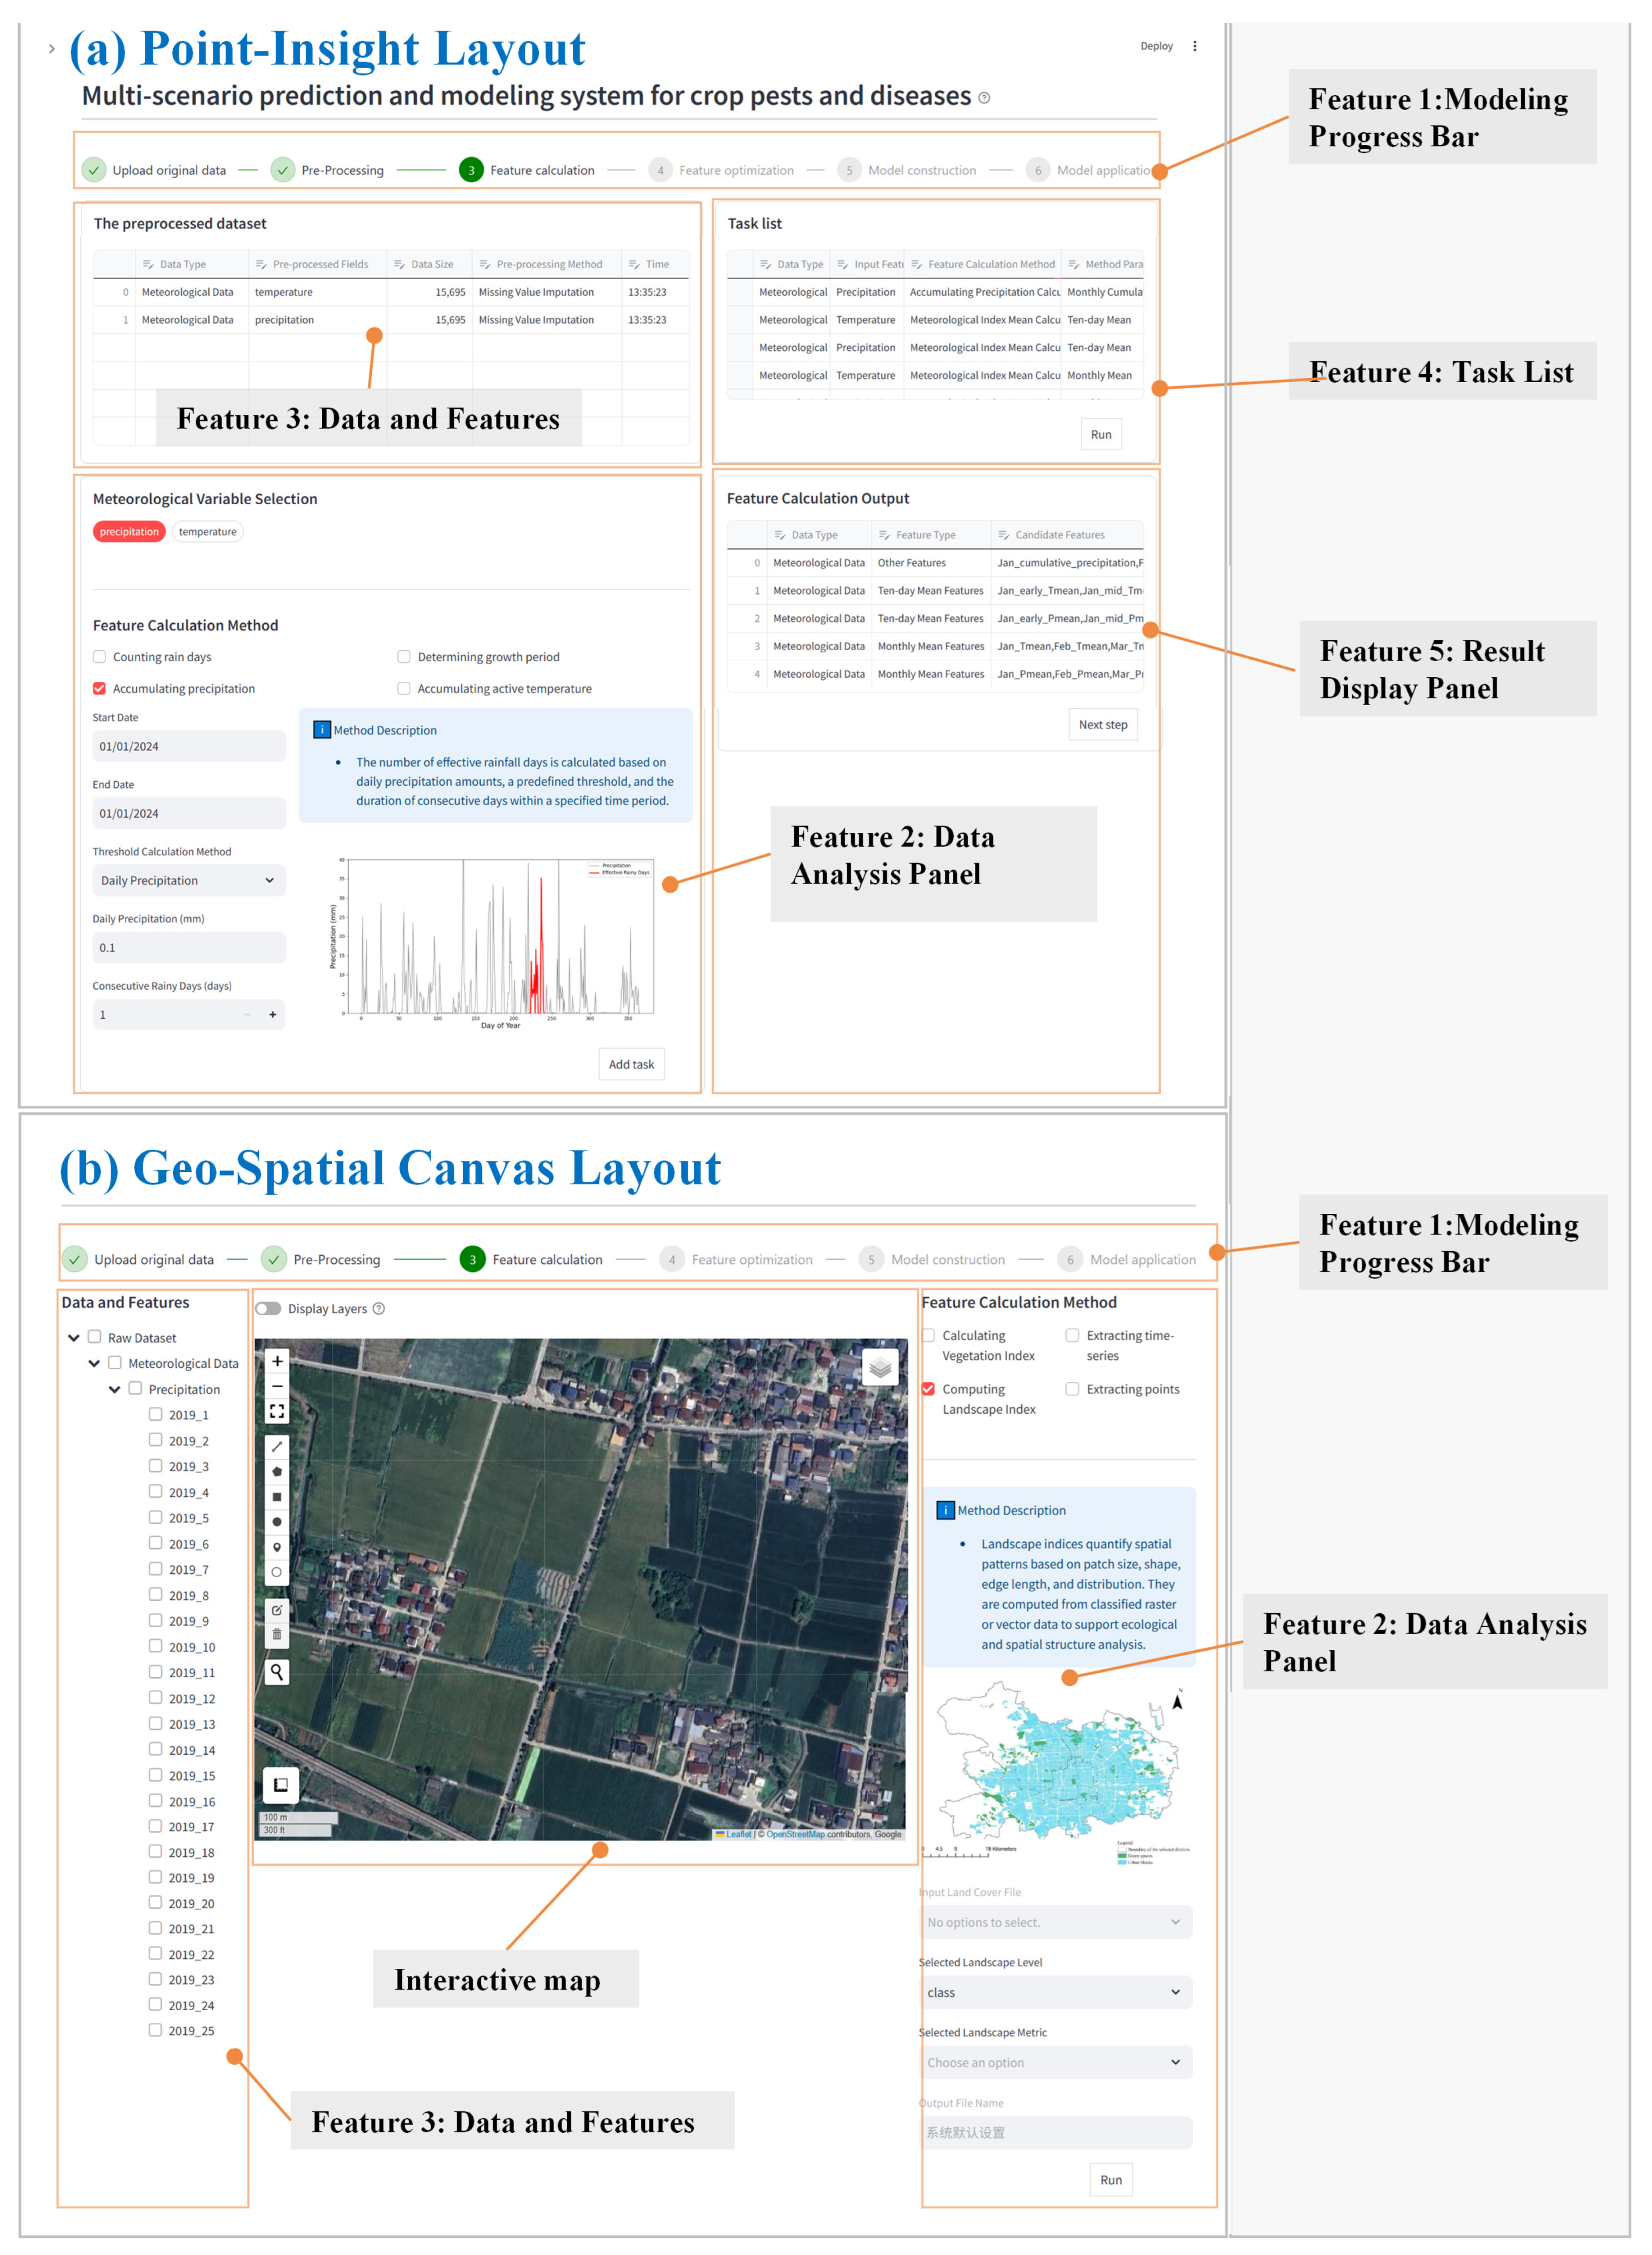
Figure 3: The core system interface for Point-Insight layout (a), and Geo-Spatial Canvas layout (b).
To further enhance user experience, the system incorporates an automatic report generation module, which compiles key parameters, performance metrics, and visualizations into structured reports. The function is based on a predefined markdown template and integrates graphical outputs generated by the Seaborn library. In addition, the system supports the serialization of trained models for persistence using the joblib (v1.3.2, Joblib Development Team, open-source), and the storage of intermediate processes through the built-in functionalities of Streamlit, thereby enabling users to retrieve and examine datasets, feature sets, model parameters, and prediction outputs at any stage of the workflow. By embedding backend functionalities into a transparent and interactive front-end environment, the system provides an accessible visualization toolset that allows non-specialists, such as plant protection managers or practitioners without programming backgrounds, to perform crop disease forecasting effectively. This design bridges the gap between complex computational modeling and real-world agricultural decision-making.
To validate the proposed system, four representative datasets were selected to correspond to the four core modeling scenarios targeted by MSDFS-that is, static vs. dynamic forecasting tasks and point-based vs. grid-based data structures (Table 3). These datasets were not chosen for their uniqueness, but rather because they match the data characteristics required for each scenario, thereby demonstrating the system’s multi-scenario compatibility in practical applications. For Scenario 1 (static, point-based), apple Marssonina blotch disease was predicted using meteorological data at key growth stages and corresponding disease incidence records for orchards in Linyi County (Shanxi Province) and Qixia City (Shandong Province) between 2018 and 2020. Meteorological inputs were derived from the High-Resolution Land Data Assimilation System (HRLDAS) of the China Meteorological Administration. For Scenario 2 (static, grid-based), tea anthracnose disease forecasting was conducted using gridded meteorological data (2016–2020, National Meteorological Science Data Center, Beijing, China), terrain maps of elevation and slope derived from digital elevation models (DEM; NASA and Chinese Academy of Sciences, Beijing, China), vegetation indices products including EVI and FPAR (MODIS MOD13Q1 and MOD15A2, NASA, Washington, DC, USA), and regional survey records of disease severity (field surveys, local agricultural agencies, China). For Scenario 3 (dynamic, point-based), rice sheath blight disease forecasting was performed using multi-year time-series disease monitoring records from counties and cities in Hunan Province, together with phenological information, crop data from the ChinaCropPhen1km dataset [28], and meteorological data from China Meteorological Administration (CMA). Finally, Scenario 4 (dynamic, grid-based) integrated large-scale epidemic records of rice sheath blight disease from six provinces (Hubei, Hunan, Jiangxi, Jiangsu, Anhui, and Zhejiang) with gridded meteorological datasets for grid prediction of the disease dynamics.
Table 3: Summary of datasets for the four case studies corresponding to different modeling scenarios.
| Scenario Category | Disease Type | Time and Location | Data Category | Raw Input Variables | Target Variable |
|---|---|---|---|---|---|
| Static Point-Based Modeling | Apple Marssonina blotch | 2018–2020 Linyi County (Shanxi Province), Qixia City (Shandong Province), China | Meteorological Data | Temperature | Crop Disease Occurrence |
| Humidity | |||||
| Static Grid-Based Modeling | Tea anthracnose | 2016–2020 Tea-growing regions, ZheJiang Province, China | Meteorological Data | Temperature | Crop Disease Severity Level |
| Precipitation | |||||
| Geographic Data | Elevation | ||||
| Slope aspect | |||||
| Remote Sensing Data | Enhanced Vegetation Index | ||||
| Fraction of Photosynthetically Active Radiation | |||||
| Dynamic Point-Based Modeling | Rice Sheath Blight | 2010–2016 Counties and cities, Hunan Province, China | Meteorological Data | Temperature | Disease Incidence Rate |
| Precipitation | |||||
| Remote Sensing Data | Growth stage | ||||
| Dynamic Grid-Based Modeling | Rice Sheath Blight | 2010–2016 Hubei, Hunan, Jiangxi, Jiangsu, Anhui, Zhejiang Provinces, China | Meteorological Data | Temperature | Disease Incidence Rate |
| Precipitation | |||||
| Remote Sensing Data | Growth stage |
3.2 Functional Evaluation of Static Forecasting Modeling
The static crop disease prediction model developed using this system achieved accurate results with both point-based and grid-based data. In Scenario 1, feature optimization yielded 11 non-redundant meteorological variables significantly associated with apple Marssonina blotch occurrence (Fig. 4a), involving temperature during early March to late June and humidity during early March, mid-May, and late June, etc. The RF model achieved an overall accuracy (OA) of 0.93, a Kappa of 0.82, an F1-score of 0.95, a Precision of 0.96, and a Recall of 0.95 on the independent test set, substantially surpassing SVM, LDA, and KNN (Table 4). Grid predictions indicated that orchards in Qixia City were largely disease-free, whereas Linyi County was identified as a high-risk area, closely matching actual outbreak records. In Scenario 2, the system integrated multi-source spatial datasets, including meteorological and geospatial remote sensing data, and extracted 25 spatiotemporal features corresponding to the sensitive period of tea anthracnose. These features encompassed topographic variables (elevation and slope aspect), temperature and precipitation at specific time points, and key vegetation indices derived from satellite images, including the Enhanced Vegetation Index (EVI) and the Fraction of Photosynthetically Active Radiation (FPAR). Among the models evaluated, the Random Forest (RF) consistently outperformed other approaches, achieving an overall accuracy (OA) of 0.71, a Kappa of 0.55, an F1-score of 0.70, a Precision of 0.73, and a Recall of 0.71 (Table 4). The resulting spatial risk distribution indicated that tea anthracnose hotspots were concentrated in the central-western regions of Zhejiang Province, with a trend of eastward expansion, whereas low-risk areas dominated the southeastern hilly regions and coastal tea gardens. These findings were consistent with epidemic survey records. Among the machine learning algorithms tested, Random Forest (RF) exhibited the best performance across both cases. Notably, the system fully automated the modeling workflow from data ingestion to output reporting: training required 10 s for Scenario 1 and 12 s for Scenario 2, with automatic documentation of key results (Fig. 4b).
Table 4: Model performance for static modeling in two case scenarios.
| Performance Metrics | Static Point-Based (Scenario 1) | Static Grid-Based (Scenario 2) |
|---|---|---|
| OA | 0.93 | 0.71 |
| Kappa | 0.82 | 0.55 |
| F1-score | 0.95 | 0.70 |
| Precision | 0.96 | 0.73 |
| Recall | 0.95 | 0.71 |
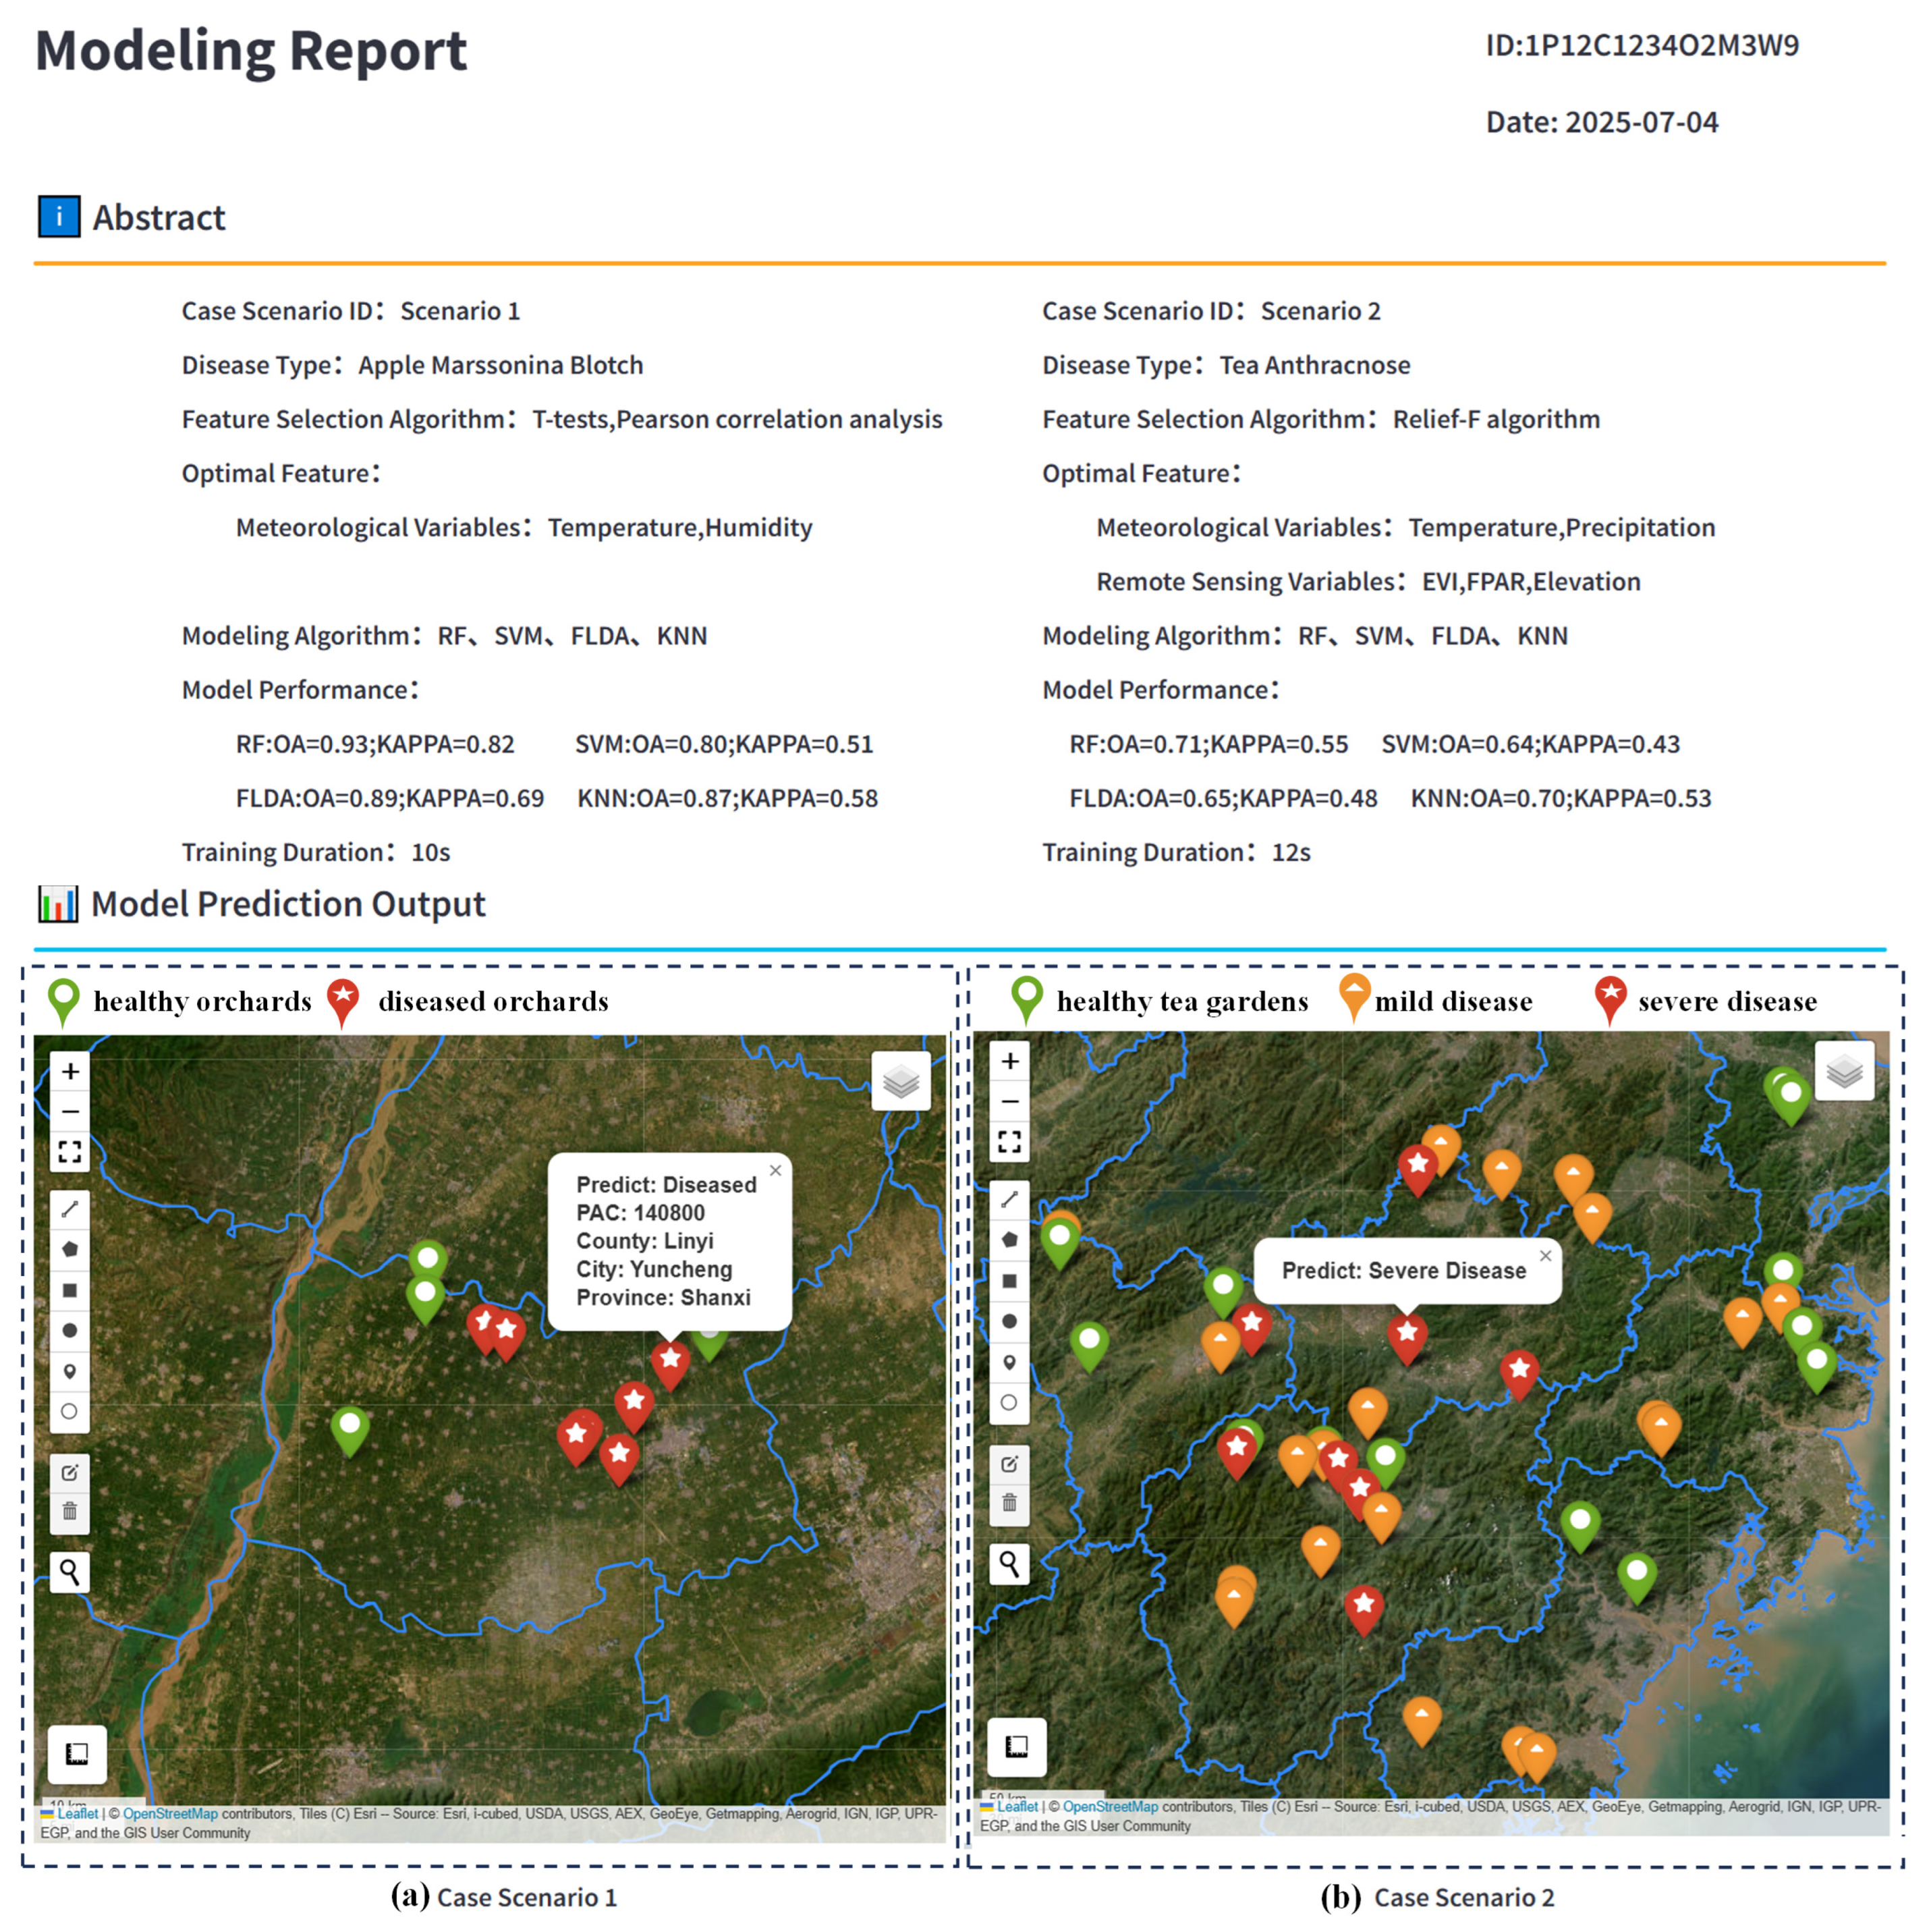
Figure 4: Modeling report results for two static forecasting model case scenarios. The summary section systematically records the key parameters of model construction, while the model application results section includes: (a) the prediction results for case scenario 1, where green represents healthy orchards and red represents diseased orchards, and (b) the prediction results for case scenario 2, where green represents healthy tea gardens, yellow represents mild disease, and red represents severe disease.
3.3 Functional Evaluation of Dynamic Forecasting Modeling
In the dynamic modeling case studies, both point-based and grid-based models constructed within the system effectively captured the temporal evolution of crop disease epidemics. In Scenario 3, the SEIR model for rice sheath blight achieved satisfactory accuracy, with a coefficient of determination (
Table 5: Optimal parameters and model performance for dynamic modeling in two case scenarios.
| Parameter Category | Parameter Name | Parameter Definition | Dynamic Point-Based (Scenario 3) | Dynamic Grid-Based (Scenario 4) |
|---|---|---|---|---|
| Model Parameters | Average latent period | 1/3 | 1/3 | |
| Average infectious period | 1/69.90 | 1/87.61 | ||
| Potential infection rate | 0.46 | 0.46 | ||
| Temperature submodule T: variance | 43.90 | 58.21 | ||
| OptimumTEM | Temperature submodule T: optimal temperature | 28 | 28 | |
| OptimumPRE | Precipitation submodule P: optimal precipitation | 14.05 | 23.45 | |
| Precipitation submodule P: adjustment parameter | 17.94 | 18.19 | ||
| ka | Buffer coefficient for ka | 1.41 | 2.23 | |
| kb | Buffer coefficient for kb | 0.29 | 0.19 | |
| Performance Metrics | Coefficient of determination | 0.69 | 0.62 | |
| RMSE | Root mean square error | 7.59 | 10.82 |
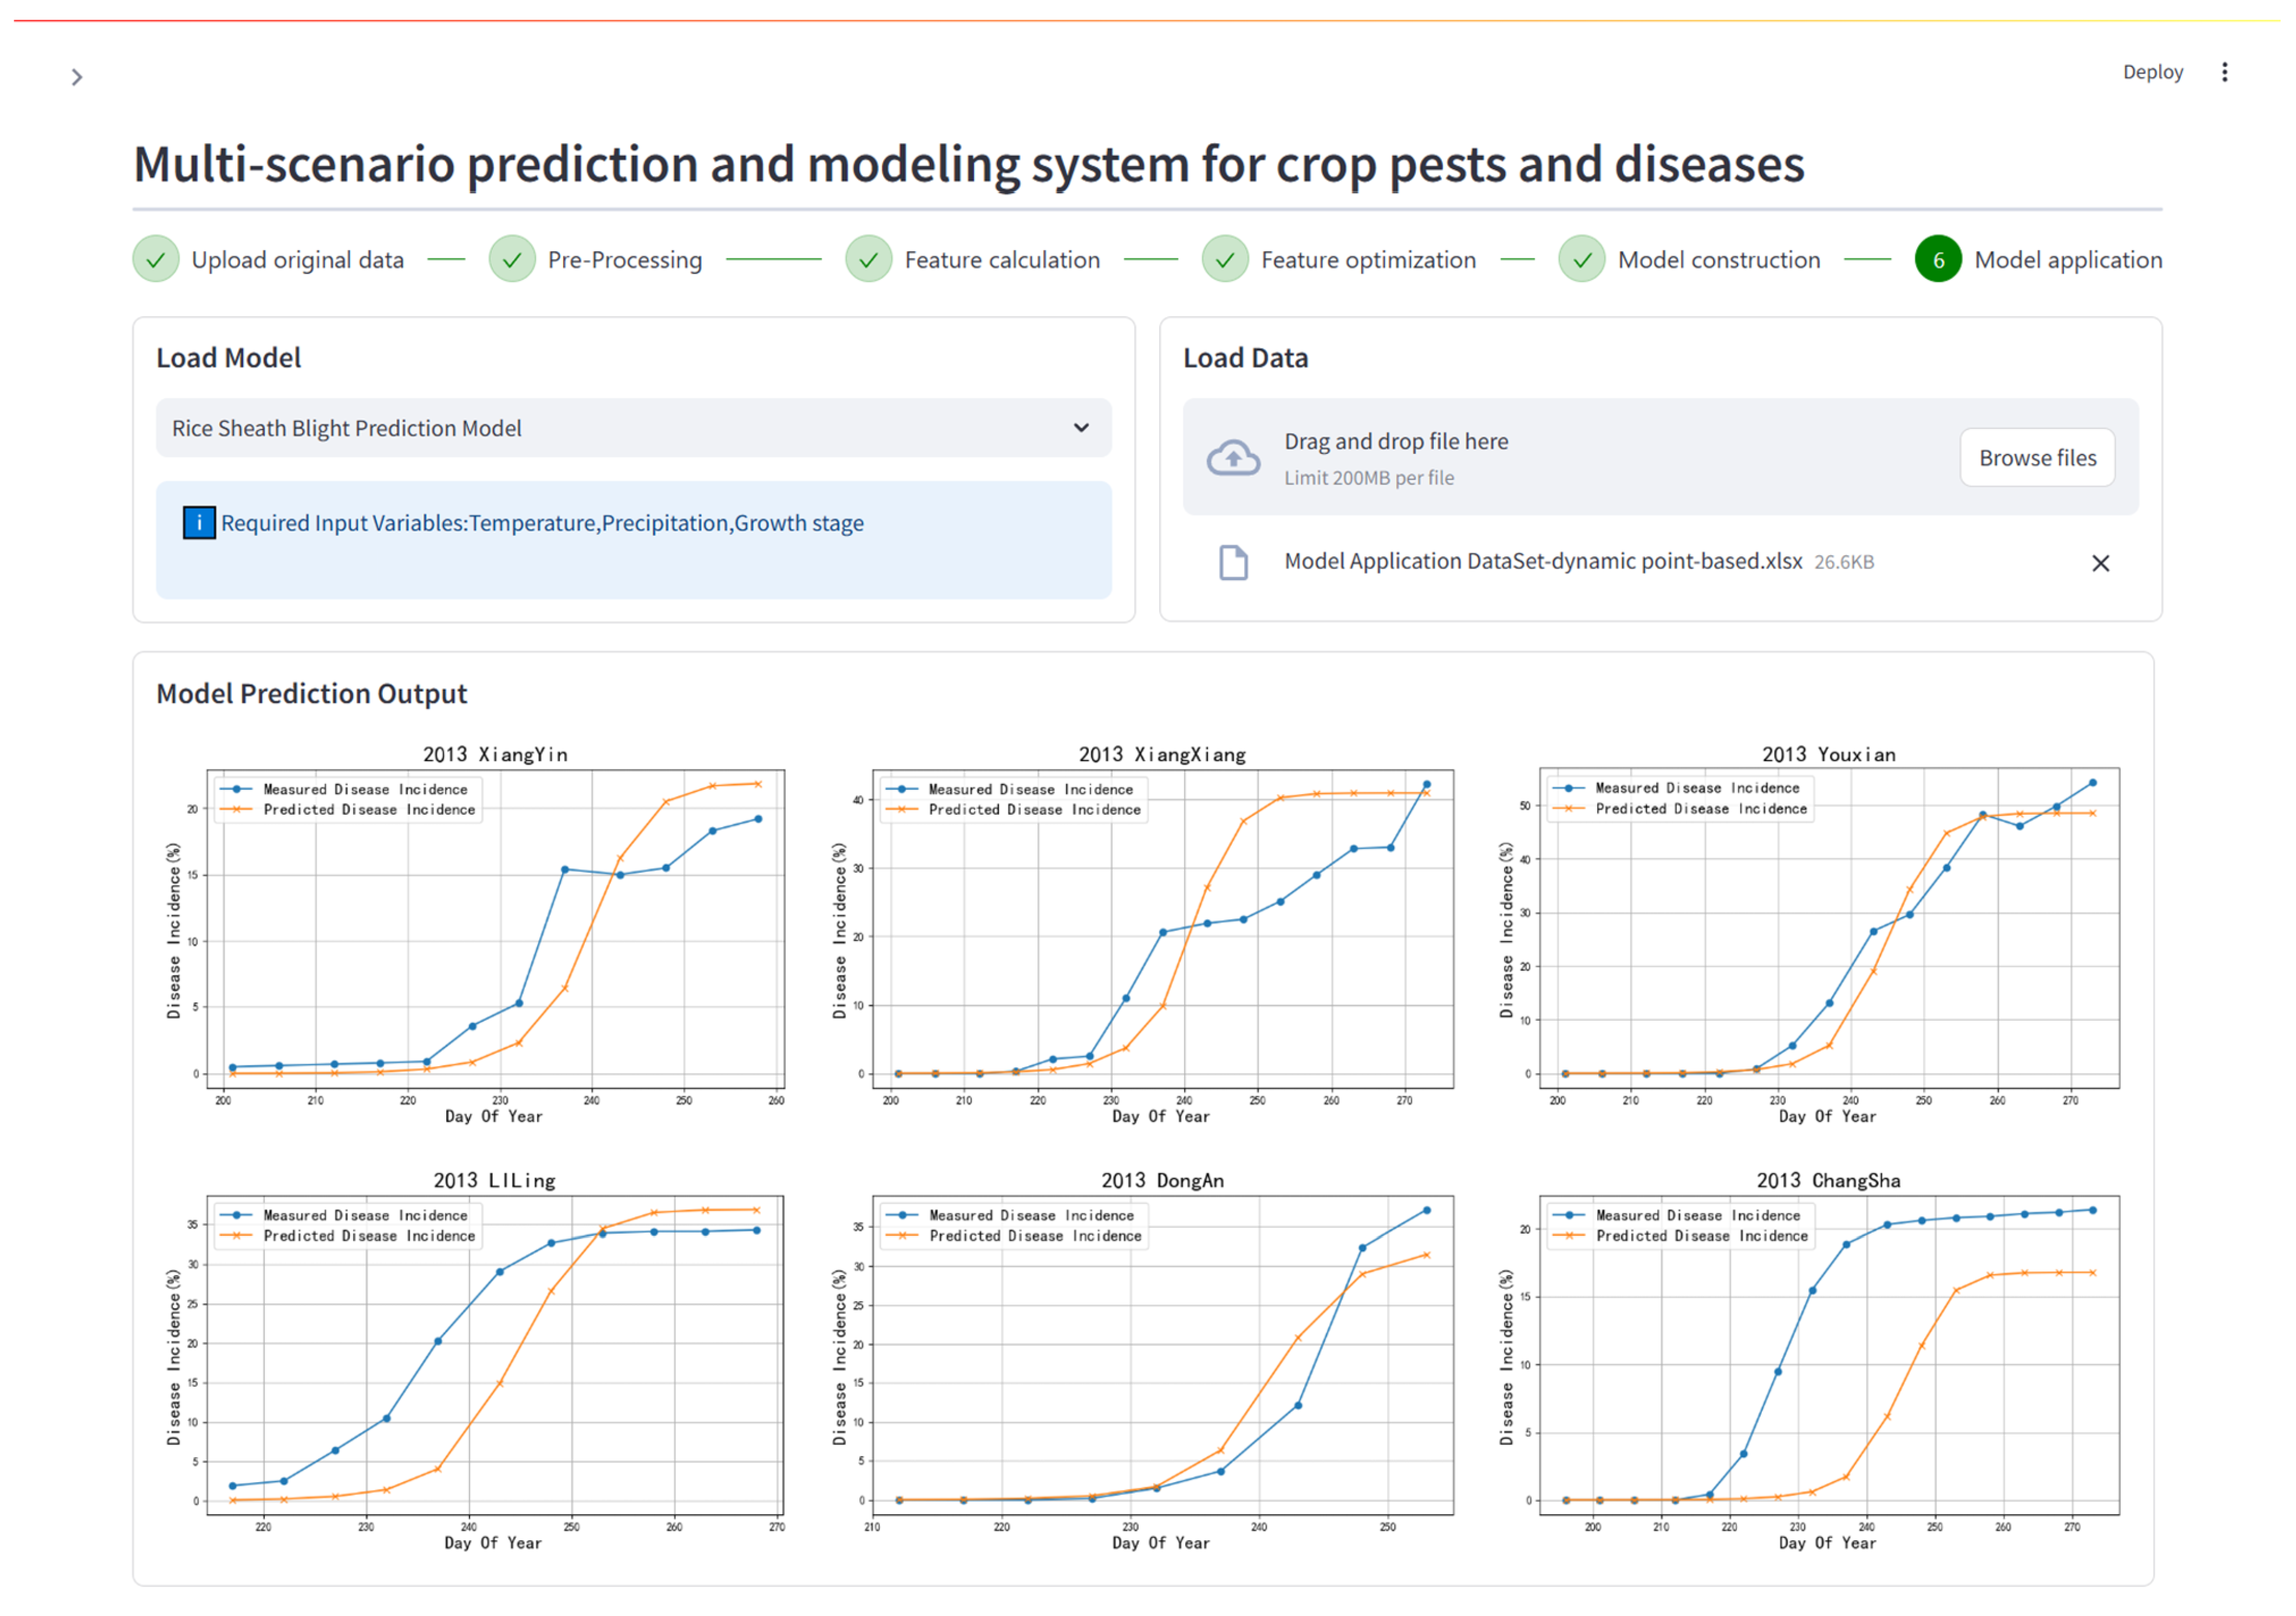
Figure 5: Prediction results for the dynamic point-based model case scenario. The upper half of the interface shows the interactive components used in the system to upload model application data and trained model structures. The lower half shows the model application results and displays the predicted disease incidence rate variation curves at six county-level stations in Hunan Province.
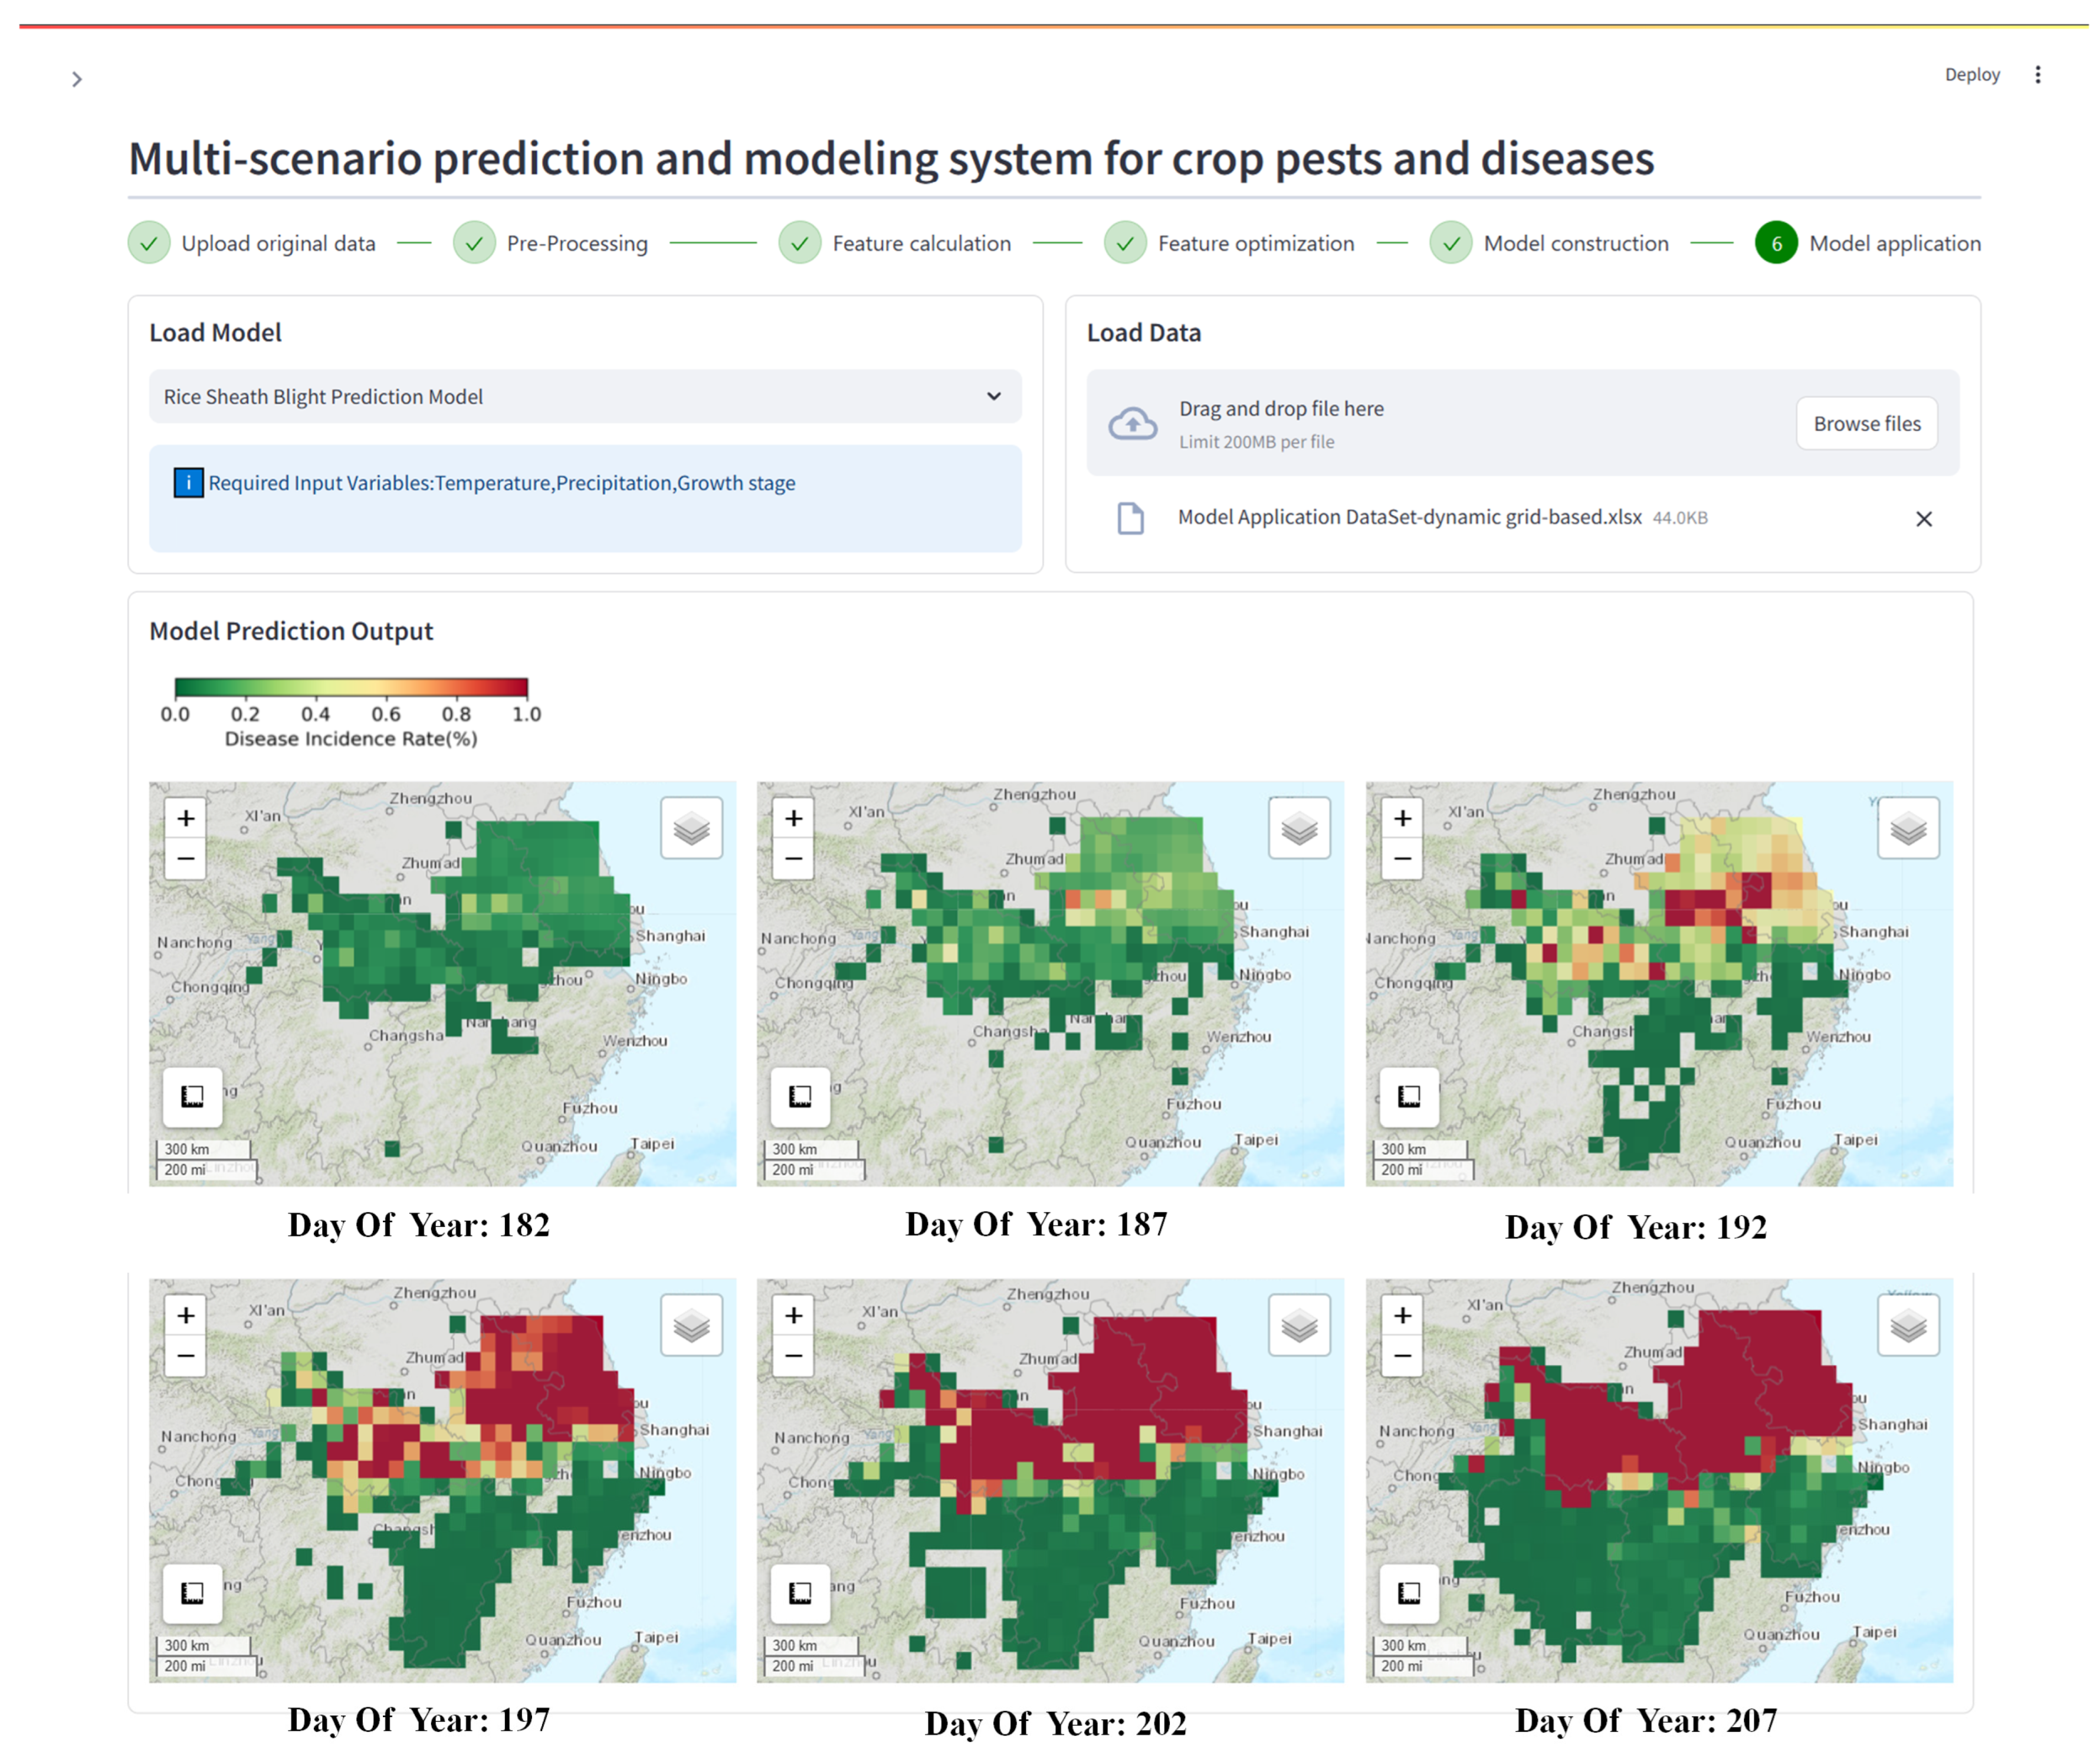
Figure 6: Prediction results of the dynamic grid-based model case scenario. The lower half of the interface shows the predicted spatiotemporal disease distribution results in six provinces from days 182 to 207 of 2013. The basemap used the Esri World Topographic Map (© Esri, USGS, NOAA).
3.4 Model Testing under Simulated Meteorological Scenarios
To test the stability of crop disease prediction models under climatic extremes, the WSG was applied to the rice sheath blight dynamic prediction model (Scenario 3). Historical meteorological data were used to configure 9 synthetic weather scenarios, and the system automatically generated one-year daily meteorological series for each (Fig. 7). These datasets were then applied as inputs to the trained model.
Comparisons between baseline forecasts and scenario-based simulations (Table 6; Fig. 8) revealed that scenario-specific differences were evident: under high-temperature and high-humidity conditions, area under the disease progress curve (AUDPC) values were 5.1% higher than those under low-temperature and low-humidity conditions, indicating a clear acceleration of epidemic buildup. The peak of the epidemic’s rapid growth phase, defined as the day of maximum daily increase in diseased crops, occurred earlier under high-temperature and high-humidity scenarios (DOY 233) than under low-temperature and low-humidity scenarios (DOY 239), high-lighting the advancing effect of warm and wet conditions on disease development. In terms of computational efficiency, generating and analyzing a single weather scenario required 14 s, and the subsequent model application test took 32 s.
Table 6: AUDPC values and rapid epidemic growth phase of the rice sheath blight model under simulated meteorological scenarios.
| Simulated Weather Scenario | AUDPC | Rapid Epidemic Growth Phase |
|---|---|---|
| Hot and wet | 408.81 | 233 |
| Hot with normal precipitation | 529.54 | 234 |
| Hot and dry | 606.67 | 235 |
| Normal temperature and wet | 606.67 | 235 |
| Normal temperature with normal precipitation | 537.43 | 236 |
| Normal temperature and dry | 407.16 | 237 |
| Cold and wet | 569.32 | 237 |
| Cold with normal precipitation | 571.24 | 238 |
| Cold and dry | 388.88 | 239 |
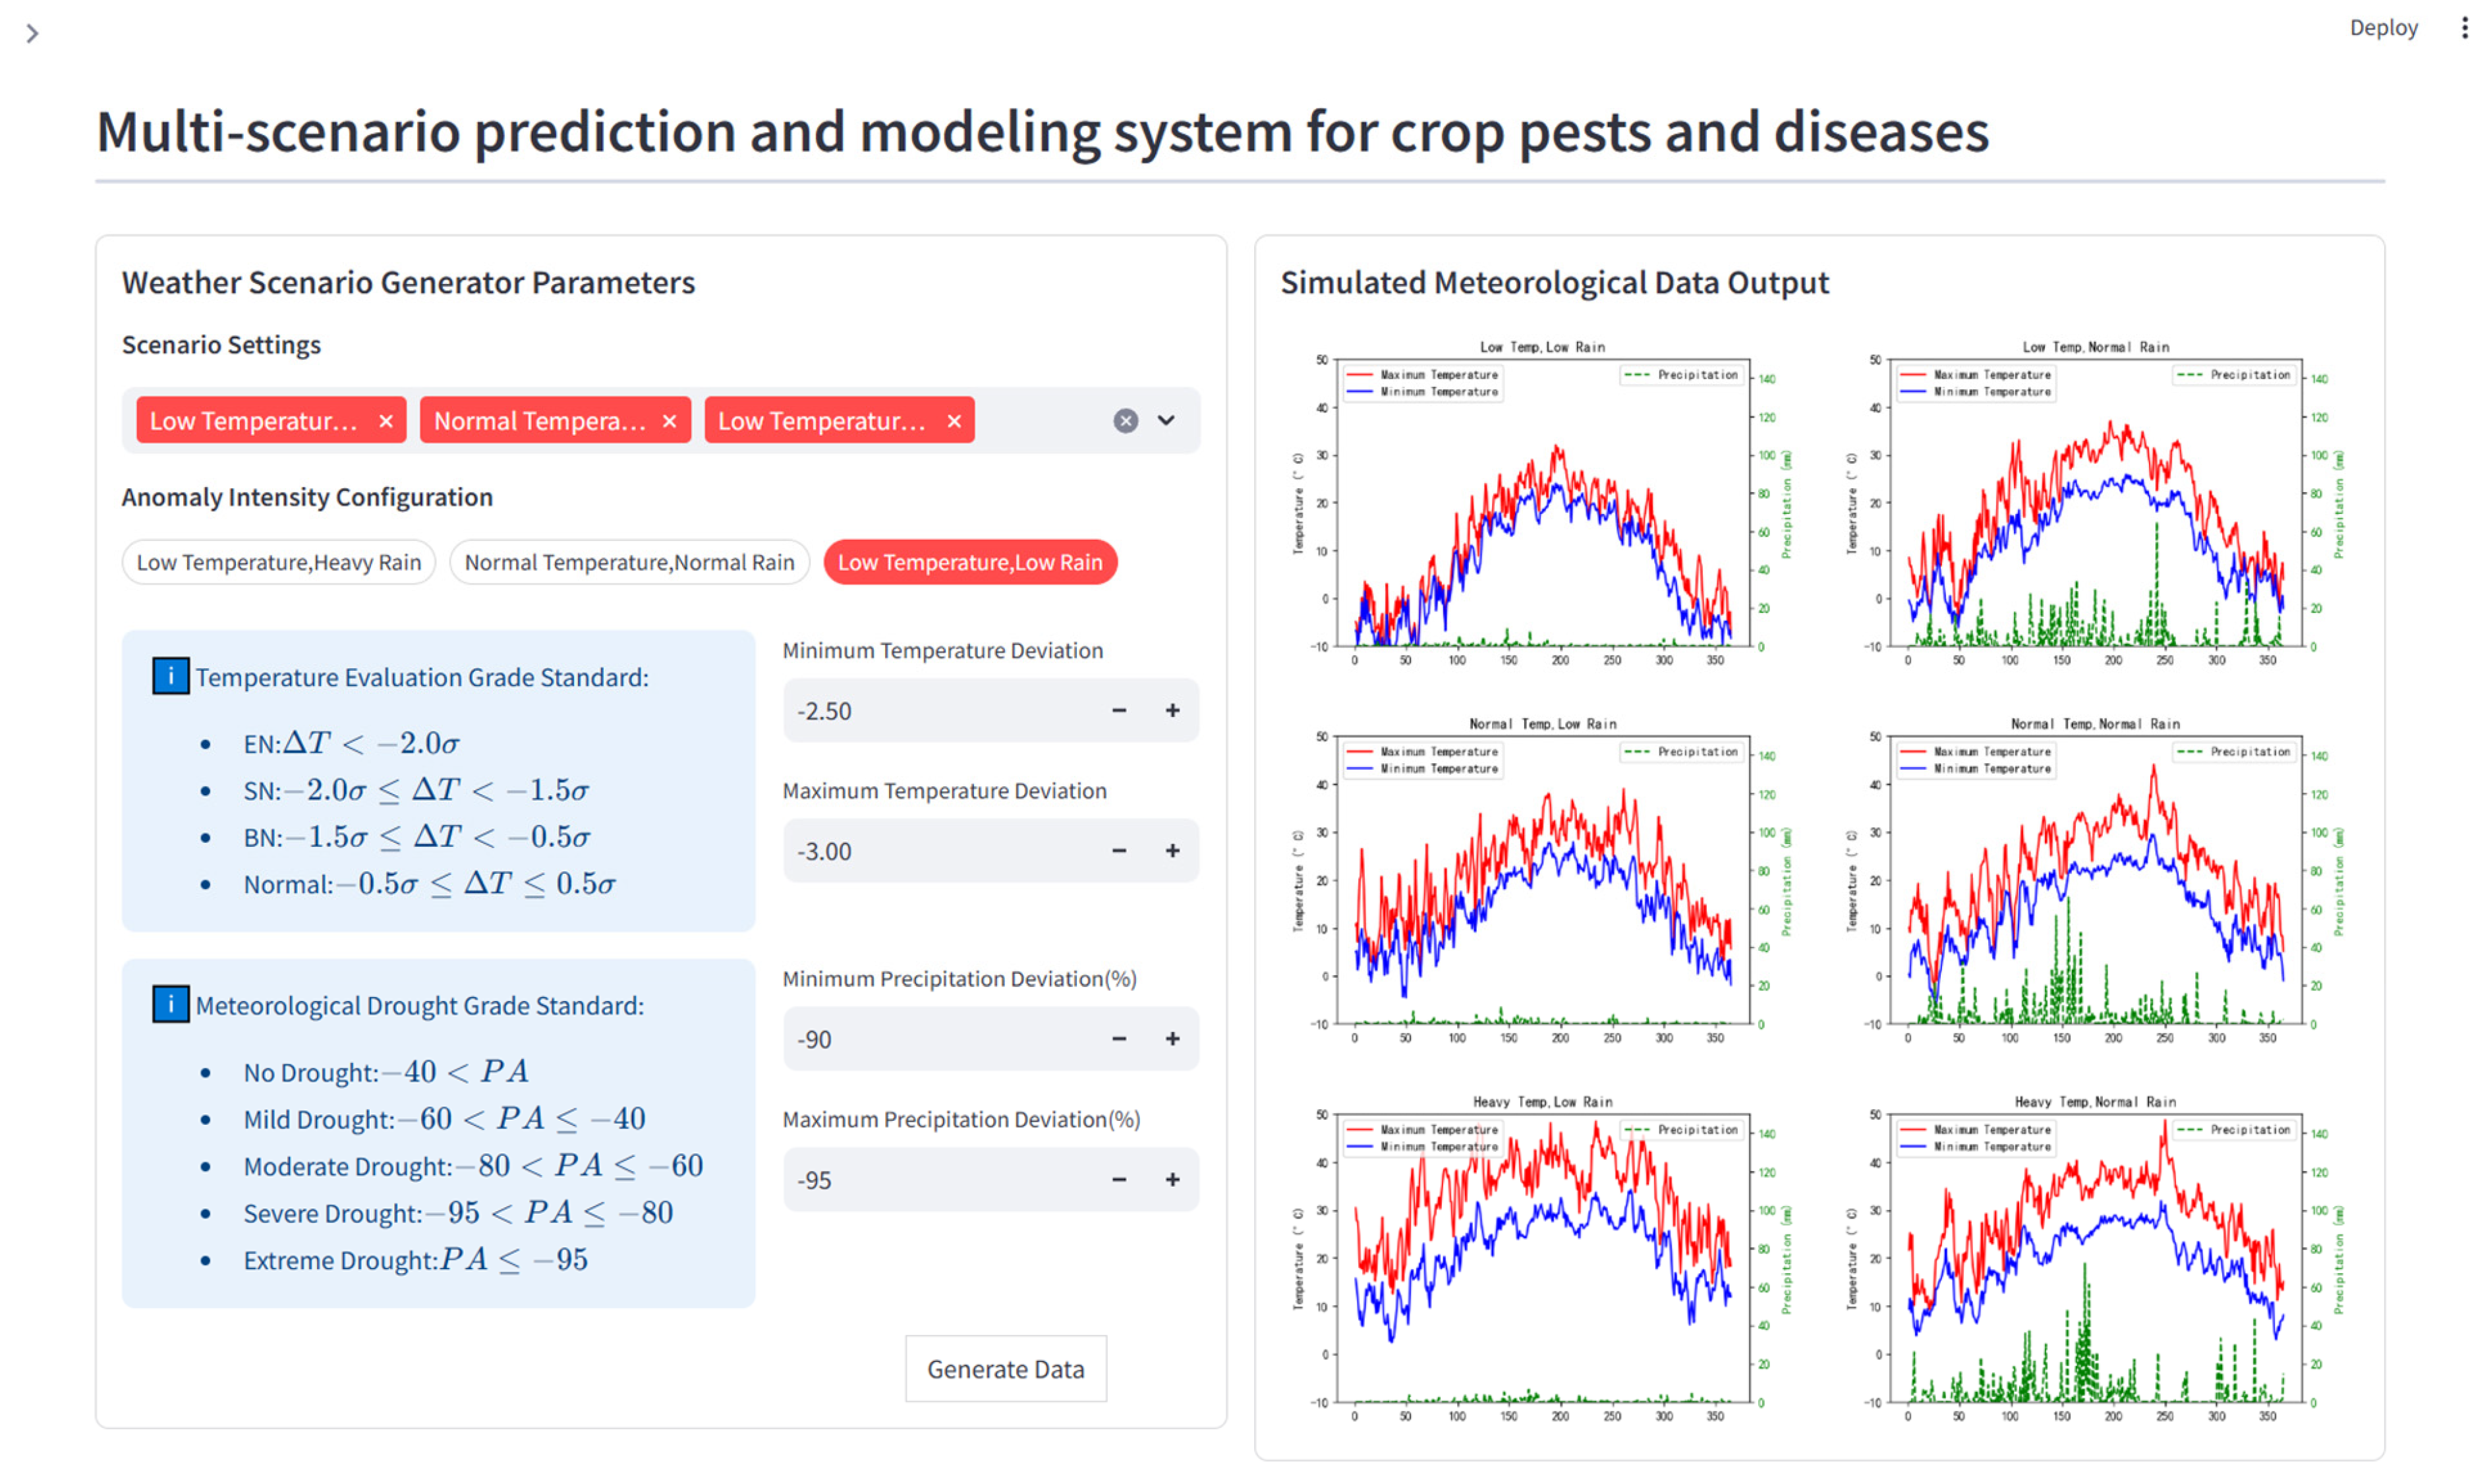
Figure 7: Simulated meteorological data generated by the weather scenario generator. The left half of the interface shows the parameter settings for the generator, and the right half displays time series data for the daily maximum and minimum temperatures and precipitation under different simulated climate scenarios. These data are used to test model stability.
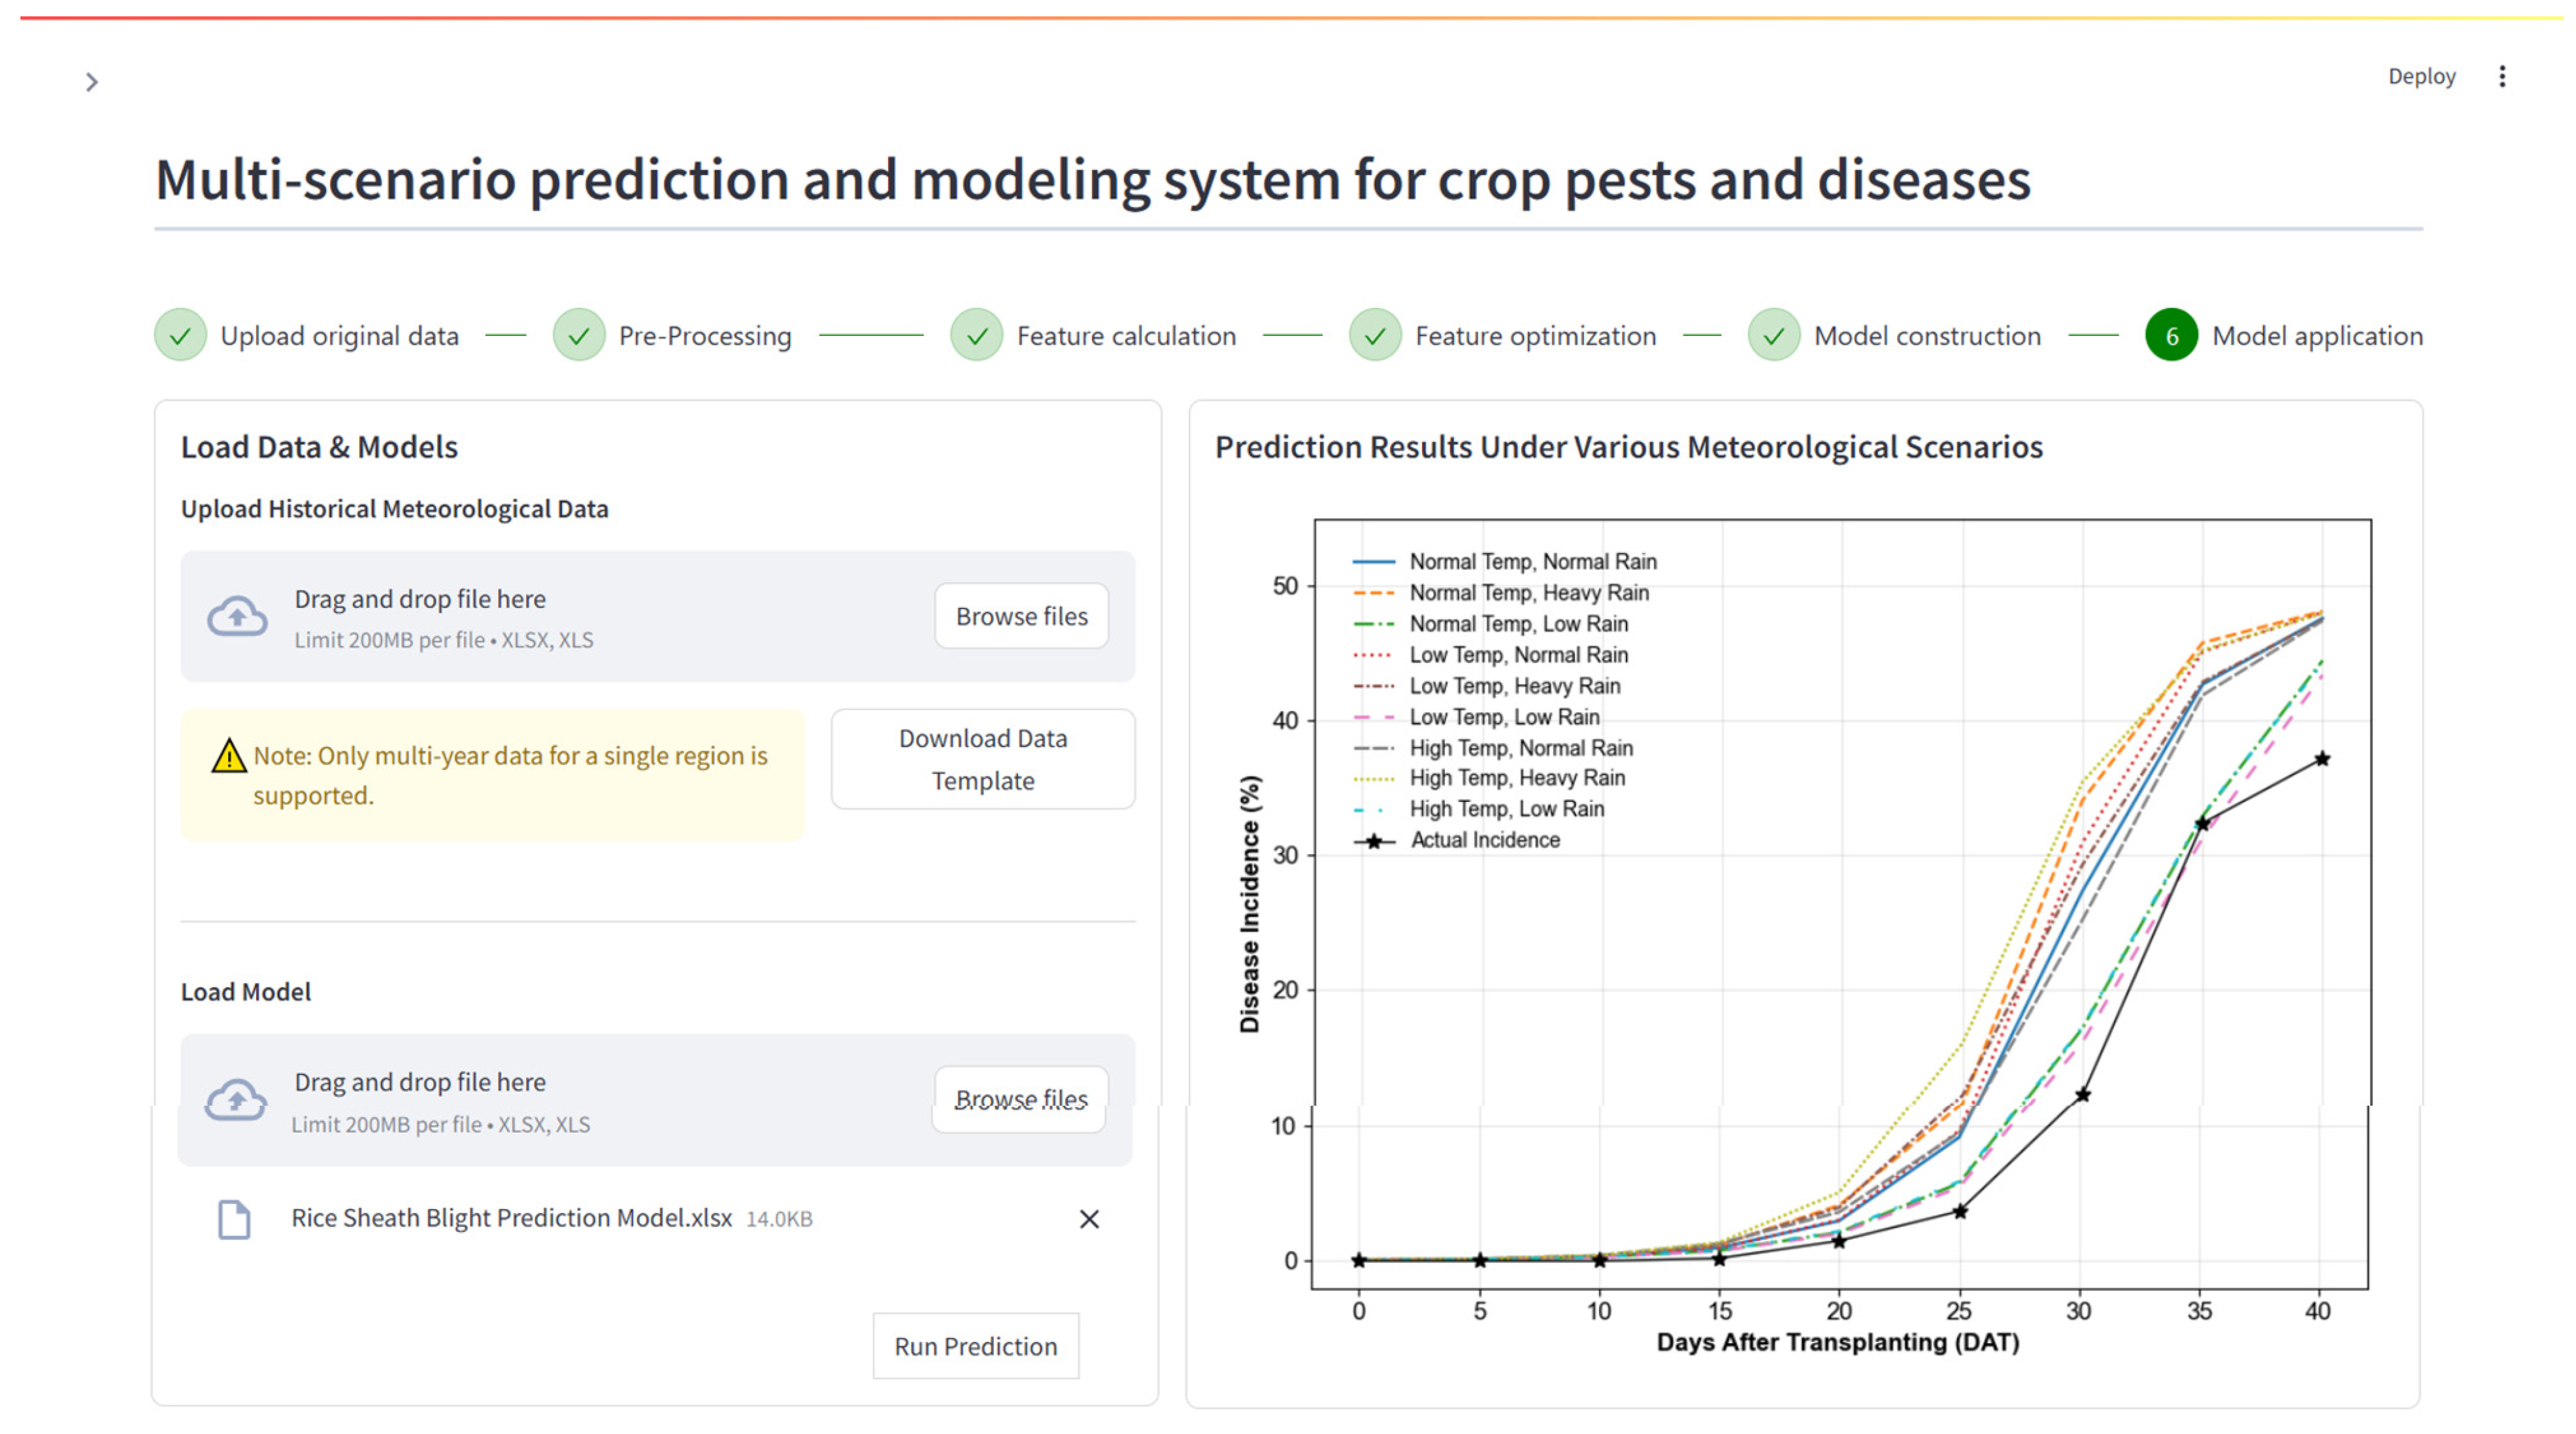
Figure 8: Model prediction results under different simulated meteorological scenarios. The right panel compares predicted disease incidence rates 40 days after transplanting across 9 different simulated climate scenarios.
4.1 Customizable Modeling for Crop Disease Forecasting Across Multiple Scenarios
The MSDFS provides plant protection managers and researchers with an automated and highly integrated tools that combines multi-source data ingestion, feature engineering, a diverse suite of modeling algorithms, and visualization tools together. This design substantially enhances both the efficiency and reliability of crop disease prediction. To date, only limited research has been reported on similar automated modeling systems. As the first multi-scenario forecasting modeling system in this field, MSDFS was designed to be adaptable to a wide range of practical scenarios, accounting for different crop disease types, geographical regions, management practices, and data availability. For example, some crop diseases (e.g., apple Marssonina blotch) progress relatively slow and require intervention only at critical growth stages. In such cases, static models are more suitable for prediction. In contrast, other crop diseases (e.g., rice sheath blight) spread rapidly and widely, necessitating large-scale dynamic prediction of their epidemic processes. In some cases, climate-dominated diseases can be predicted primarily using meteorological point data (e.g., potato late blight). In other cases, diseases are closely linked to crop nutritional status, density, and growth conditions (e.g., rice sheath blight and rice blast). So, satellite remote sensing data should be incorporated to characterize habitat conditions and to improve forecasting accuracy. Unlike most existing crop disease forecasting systems that predominantly rely on static, point-based models [29,30], MSDFS combines specialized dynamic models with spatial analysis capabilities based on remote sensing and meteorological data. This design enables the system to handle diverse application scenarios and to flexibly adjust input variables according to the types and availability of data.
In practical plant protection, static and dynamic scenarios play different but complementary roles in guiding disease forecasting and management. Static scenarios are based on fixed-time or representative environmental conditions and often rely on models such as machine learning classifiers or regressors. Their outputs provide relatively stable assessments of disease risk and are useful for seasonal planning, identifying high-risk areas, and arranging early prevention measures. Dynamic scenarios, built on continuous time-series inputs, focus on the temporal progression of disease. These models depict the development curve, including onset and peak periods, and thus support operational decisions such as scheduling field inspections and optimizing the timing of control actions. By incorporating both types of scenarios into the modeling framework, the system enables users to select approaches that match their specific objectives: static models offer guidance for medium- to long-term planning, while dynamic models assist with short-term, process-oriented interventions. This integrated design helps ensure that forecasting outputs can be applied in both strategic and operational decision-making contexts.
Beyond its scenario-adaptation capability, the system’s integrated workflow architecture ensures consistent data-model alignment throughout the analytical process. Clearly defined data templates guide the systematic collection and organization of heterogeneous inputs, including meteorological, remote sensing, and crop disease survey data. Standardized interfaces enforce variable formats, unify spatio-temporal labels, and preserve structural integrity across modules, while automated checks confirm data completeness before advancing to subsequent stages. Key parameters and intermediate results are visualized graphically, allowing users to monitor the process and make informed decisions. Automatically generated reports consolidate essential metrics and outcomes, facilitating interpretation for both technical and non-technical stakeholders. This design enables MSDFS to support diverse modeling scenarios with high reliability, flexibility, and user-oriented functionality.
Despite these advantages, the modeling performance is inevitably influenced by practical data limitations. In practical plant protection surveys, disease observations often exhibit sparsity, discontinuity, and uneven regional coverage due to constraints in sampling frequency, labor, and resources. Meanwhile, environmental datasets-though broader in coverage-may differ in spatial or temporal resolution, and satellite remote sensing can be affected by cloud contamination or missing scenes. These inconsistencies introduce challenges for feature extraction and spatio-temporal alignment, potentially leading to systematic biases and reduced transferability across regions or climatic conditions. Future improvements will therefore focus on standardizing data acquisition, incorporating multi-source data fusion and assimilation techniques, and integrating uncertainty quantification to mitigate the effects of incomplete or uneven datasets.
4.2 Integrated Climate Scenario Simulation Enhances Model Robustness Testing
Most existing crop disease prediction models are trained on historical observational data, which often limits their ability to capture system behavior under extreme weather events. Yet, in the context of climate change, such events are becoming increasingly frequent and have profound impacts on the occurrence and spread of agricultural diseases [31]. Previous studies have shown that climate change alters the geographic distribution of pathogens [32], and increases the outbreak risks of specific diseases across regions [33,34,35]. However, the adaptability of forecasting models under future or extreme climate conditions remains insufficiently tested.
The WSG module of MSDFS addresses this gap by producing synthetic datasets that represent nine types of extreme weather scenarios, thereby enabling direct assessment of model sensitivity and adaptability. This feature provides an objective framework for evaluating how forecasting models respond to climatic variability. Under high-temperature and high-rainfall scenarios, for example, the rice sheath blight model predicted an earlier and faster epidemic growth phase (Fig. 8), highlighting the model’s sensitivity to climatic extremes. Robustness, in turn, can be assessed through the AUDPC, which reflects the cumulative epidemic burden across scenarios. AUDPC values increased significantly under excessive rainfall compared to drought conditions (Table 6), indicating that the model captures scenario-dependent variations in cumulative disease intensity. Together, these findings demonstrate the added value of climate scenario simulations for evaluating model sensitivity and robustness, identifying limitations, and improving applicability under future climate uncertainty.
The MSDFS represents the first automated and customizable multi-scenario modeling system for crop disease forecasting that integrates heterogeneous data sources with climate scenario simulation. Although the system provides strong capabilities in data fusion, flexible model construction, and decision support, further enhancements are still required.
A major direction is to strengthen the system’s intelligence and adaptability through advanced artificial intelligence approaches. Integrating multimodal learning, deep learning, and hybrid modeling strategies that couple mechanistic disease models with neural network architectures is expected to improve spatio-temporal representation and generalizability across complex environments. Recent progress in AI-driven climate and environmental modeling, including precipitation downscaling and WaveNet-LSTM-based spatio-temporal simulation [36,37], offers valuable methodological insights for improving climate-disease coupling and automated feature learning within MSDFS.
Further refinement of system automation is also needed. While the current preprocessing and optimization modules are efficient for meteorological data, additional capabilities for automated remote sensing and geospatial data processing, such as image correction, spatial resampling, and multi-source feature extraction, will enhance robustness and streamline end-to-end workflows. At the same time, computational performance can be significantly improved by incorporating high-performance or distributed computing frameworks, enabling rapid processing of large-scale datasets and supporting real-time or near-real-time forecasting. The incorporation of IoT-based microclimate and disease monitoring devices will provide continuous data streams for dynamic model updating, strengthening the system’s responsiveness under changing environmental conditions.
Looking ahead, the system will be extended to agricultural authorities, research institutes, and local plant protection services as an open and flexible framework capable of supporting diverse data sources, modeling paradigms, and application scenarios. Establishing cloud-based regional disease databases and model repositories will facilitate large-scale deployment, real-time access, and long-term data accumulation. Collaboration with agricultural agencies will further support model validation and operational integration, enabling MSDFS to evolve into a practical and widely adopted tool for intelligent crop disease monitoring and management.
This study presented the design, development, and validation of the Multi-Scenario Crop Diseases Forecasting System (MSDFS), the first open-source system in this field to support multi-source data integration and multiple categories of forecasting models. The system accommodates four representative scenarios, static point-based, static grid-based, dynamic point-based, and dynamic grid-based, and provides a comprehensive workflow encompassing raw data processing, feature engineering, model construction, evaluation, and application. This design enables the development of highly customizable forecasting models adapted for diverse disease-crop-environment contexts. A distinctive feature of MSDFS is its weather scenario generator, which allows models to be evaluated under simulated extreme meteorological conditions, providing a practical framework to assess their adaptability and resilience in the face of climate variability, beyond reliance on historical data alone. System validation across four case studies demonstrated that MSDFS can effectively process heterogeneous, multi-source datasets and flexibly support a broad range of modeling approaches. The results confirmed that the system not only achieves robust forecasting performance but also facilitates customized model construction, evaluation, and deployment. By lowering technical barriers and providing user-friendly workflows, MSDFS offers tangible benefits for non-specialist users, including plant protection managers and farmers. In doing so, it contributes to the advancement of data-driven plant health management and provides a practical digital tool to support more proactive and adaptive strategies in crop disease control.
Acknowledgement:
Funding Statement: This research was supported by Zhejiang Provincial Natural Science Foundation of China (Grant No. LR25D010003); The Zhejiang Provincial Key Research and Development Program (Grant No. 2023C02018); National Natural Science Foundation of China (Grant No. 42401400).
Author Contributions: The authors confirm contribution to the paper as follows: Conceptualization, Mintao Xu and Jingcheng Zhang; methodology, Mintao Xu, Jingcheng Zhang and Zichao Jin; software, Mintao Xu; validation, Zichao Jin and Jingcheng Zhang; formal analysis, Huiqin Ma and Jingcheng Zhang; investigation, Yangyang Tian and Yujin Jing; resources, Jingcheng Zhang; data curation, Yangyang Tian and Yujin Jing; writing—original draft preparation, Mintao Xu and Zichao Jin; writing—review and editing, Yangyang Tian, Huiqin Ma and Jingcheng Zhang; visualization, Mintao Xu, Jiangxing Wu and Jing Zhai; supervision, Jingcheng Zhang and Huiqin Ma; project administration, Jingcheng Zhang; funding acquisition, Jingcheng Zhang. All authors reviewed the results and approved the final version of the manuscript.
Availability of Data and Materials: The data that support the findings of this study are available from the corresponding author, Jingcheng Zhang, upon reasonable request.
Ethics Approval: Not applicable.
Conflicts of Interest: The authors declare no conflicts of interest to report regarding the present study.
References
1. Fenu G , Malloci FM . Forecasting plant and crop disease: an explorative study on current algorithms. Big Data Cogn Comput. 2021; 5( 1): 2. doi:10.3390/bdcc5010002. [Google Scholar] [CrossRef]
2. Gai Y , Wang H . Plant disease: a growing threat to global food security. Agronomy. 2024; 14( 8): 1615. doi:10.3390/agronomy14081615. [Google Scholar] [CrossRef]
3. Savary S , Willocquet L . Modeling the impact of crop diseases on global food security. Annu Rev Phytopathol. 2020; 58: 313– 41. doi:10.1146/annurev-phyto-010820-012856. [Google Scholar] [CrossRef]
4. González-Domínguez E , Caffi T , Rossi V , Salotti I , Fedele G . Plant disease models and forecasting: changes in principles and applications over the last 50 years. Phytopathology. 2023; 113( 4): 678– 93. doi:10.1094/PHYTO-10-22-0362-KD. [Google Scholar] [CrossRef]
5. Shah DA , Paul PA , De Wolf ED , Madden LV . Predicting plant disease epidemics from functionally represented weather series. Philos Trans R Soc Lond B Biol Sci. 2019; 374( 1775): 20180273. doi:10.1098/rstb.2018.0273. [Google Scholar] [CrossRef]
6. Chergui N , Kechadi MT . Data analytics for crop management: a big data view. J Big Data. 2022; 9( 1): 123. doi:10.1186/s40537-022-00668-2. [Google Scholar] [CrossRef]
7. Kishi S , Sun J , Kawaguchi A , Ochi S , Yoshida M , Yamanaka T . Characteristic features of statistical models and machine learning methods derived from pest and disease monitoring datasets. R Soc Open Sci. 2023; 10( 6): 230079. doi:10.1098/rsos.230079. [Google Scholar] [CrossRef]
8. Lee KT , Jeon HW , Park SY , Cho J , Kim KH . Comparison of projected rice blast epidemics in the Korean Peninsula between the CMIP5 and CMIP6 scenarios. Clim Change. 2022; 173( 1–2): 12. doi:10.1007/s10584-022-03410-2. [Google Scholar] [CrossRef]
9. Savary S , Nelson A , Willocquet L , Pangga I , Aunario J . Modeling and mapping potential epidemics of rice diseases globally. Crop Prot. 2012; 34: 6– 17. doi:10.1016/j.cropro.2011.11.009. [Google Scholar] [CrossRef]
10. Wang J , Zhang D . Intelligent pest forecasting with meteorological data: an explainable deep learning approach. Expert Syst Appl. 2024; 252: 124137. doi:10.1016/j.eswa.2024.124137. [Google Scholar] [CrossRef]
11. Xiao Y , Dong Y , Huang W , Liu L . Regional prediction of Fusarium head blight occurrence in wheat with remote sensing based Susceptible-Exposed-Infectious-Removed model. Int J Appl Earth Obs Geoinf. 2022; 114: 103043. doi:10.1016/j.jag.2022.103043. [Google Scholar] [CrossRef]
12. Chakraborty AK , Miry R , Greiner R , Lewis MA , Wang H , Guan T , et al. Deep learning for disease outbreak prediction: a parallel LSTM-CNN model. J R Soc Interface. 2025; 22( 229): 20250046. doi:10.1098/rsif.2025.0046. [Google Scholar] [CrossRef]
13. Hazra J , Padmanaban M . Sustainable farming—a spatio-temporal adaptation of late blight disease prediction using multi-modal data. In: Proceedings of the IGARSS 2023—2023 IEEE International Geoscience and Remote Sensing Symposium; 2023 Jul 16–21; Pasadena, CA, USA. doi:10.1109/IGARSS52108.2023.10282280. [Google Scholar] [CrossRef]
14. Otero M , Velasquez LF , Basile B , Onrubia JR , Pujol AJ , Pijuan J . Data-driven predictive models based on artificial intelligence to anticipate the presence of Plasmopara viticola and Uncinula necator in southern European winegrowing regions. In: Artificial intelligence research and development. Amsterdam, The Netherlands: IOS Press; 2022. p. 164– 7. doi:10.3233/FAIA220333. [Google Scholar] [CrossRef]
15. de Oliveira Aparecido LE , de Souza Rolim G , da Silva Cabral De Moraes JR , Costa CTS , de Souza PS . Machine learning algorithms for forecasting the incidence of Coffea arabica pests and diseases. Int J Biometeorol. 2020; 64( 4): 671– 88. doi:10.1007/s00484-019-01856-1. [Google Scholar] [CrossRef]
16. Chaiyana A , Khiripet N , Ninsawat S , Siriwan W , Shanmugam MS , Virdis SGP . Early prediction of cassava mosaic disease onset based on remote sensing and climatic data. Comput Electron Agric. 2025; 230: 109836. doi:10.1016/j.compag.2024.109836. [Google Scholar] [CrossRef]
17. Li L , Dong Y , Xiao Y , Liu L , Zhao X , Huang W . Combining disease mechanism and machine learning to predict Wheat Fusarium head blight. Remote Sens. 2022; 14( 12): 2732. doi:10.3390/rs14122732. [Google Scholar] [CrossRef]
18. Araújo SO , Peres RS , Ramalho JC , Lidon F , Barata J . Machine learning applications in agriculture: current trends, challenges, and future perspectives. Agronomy. 2023; 13( 12): 2976. doi:10.3390/agronomy13122976. [Google Scholar] [CrossRef]
19. Cravero A , Pardo S , Sepúlveda S , Muñoz L . Challenges to use machine learning in agricultural big data: a systematic literature review. Agronomy. 2022; 12( 3): 748. doi:10.3390/agronomy12030748. [Google Scholar] [CrossRef]
20. Madasamy B , Balasubramaniam P , Dutta R . Microclimate-based pest and disease management through a forewarning system for sustainable cotton production. Agriculture. 2020; 10( 12): 641. doi:10.3390/agriculture10120641. [Google Scholar] [CrossRef]
21. Brown ME , Mugo S , Petersen S , Klauser D . Designing a pest and disease outbreak warning system for farmers, agronomists and agricultural input distributors in east Africa. Insects. 2022; 13( 3): 232. doi:10.3390/insects13030232. [Google Scholar] [CrossRef]
22. Hesselbarth MHK , Sciaini M , With KA , Wiegand K , Nowosad J . landscapemetrics: an open-source R tool to calculate landscape metrics. Ecography. 2019; 42( 10): 1648– 57. doi:10.1111/ecog.04617. [Google Scholar] [CrossRef]
23. Brennan JM , Egan D , Cooke BM , Doohan FM . Effect of temperature on head blight of wheat caused by Fusarium culmorum and F. graminearum. Plant Pathol. 2005; 54( 2): 156– 60. doi:10.1111/j.1365-3059.2005.01157.x. [Google Scholar] [CrossRef]
24. Cruz DR , Leandro LFS , Munkvold GP . Effects of temperature and pH on Fusarium oxysporum and soybean seedling disease. Plant Dis. 2019; 103( 12): 3234– 43. doi:10.1094/PDIS-11-18-1952-RE. [Google Scholar] [CrossRef]
25. Zhang J , Huang Y , Pu R , Gonzalez-Moreno P , Yuan L , Wu K , et al. Monitoring plant diseases and pests through remote sensing technology: a review. Comput Electron Agric. 2019; 165: 104943. doi:10.1016/j.compag.2019.104943. [Google Scholar] [CrossRef]
26. Meentemeyer RK , Haas SE , Václavík T . Landscape epidemiology of emerging infectious diseases in natural and human-altered ecosystems. Annu Rev Phytopathol. 2012; 50: 379– 402. doi:10.1146/annurev-phyto-081211-172938. [Google Scholar] [CrossRef]
27. Han J , Miao C , Gou J , Zheng H , Zhang Q , Guo X . A new daily gridded precipitation dataset for the Chinese mainland based on gauge observations. Earth Syst Sci Data. 2023; 15( 7): 3147– 61. doi:10.5194/essd-15-3147-2023. [Google Scholar] [CrossRef]
28. Luo Y , Zhang Z , Chen Y , Li Z , Tao F . ChinaCropPhen1km: a high-resolution crop phenological dataset for three staple crops in China during 2000–2015 based on leaf area index (LAI) products. Earth Syst Sci Data. 2020; 12( 1): 197– 214. doi:10.5194/essd-12-197-2020. [Google Scholar] [CrossRef]
29. Pavan W , Fraisse CW , Peres NA . Development of a web-based disease forecasting system for strawberries. Comput Electron Agric. 2011; 75( 1): 169– 75. doi:10.1016/j.compag.2010.10.013. [Google Scholar] [CrossRef]
30. Zhang C , Cai J , Xiao D , Ye Y , Chehelamirani M . Research on vegetable pest warning system based on multidimensional big data. Insects. 2018; 9( 2): 66. doi:10.3390/insects9020066. [Google Scholar] [CrossRef]
31. Chaloner TM , Gurr SJ , Bebber DP . Plant pathogen infection risk tracks global crop yields under climate change. Nat Clim Change. 2021; 11( 8): 710– 5. doi:10.1038/s41558-021-01104-8. [Google Scholar] [CrossRef]
32. Bebber DP , Ramotowski MAT , Gurr SJ . Crop pests and pathogens move polewards in a warming world. Nat Clim Change. 2013; 3( 11): 985– 8. doi:10.1038/nclimate1990. [Google Scholar] [CrossRef]
33. Deutsch CA , Tewksbury JJ , Tigchelaar M , Battisti DS , Merrill SC , Huey RB , et al. Increase in crop losses to insect pests in a warming climate. Science. 2018; 361( 6405): 916– 9. doi:10.1126/science.aat3466. [Google Scholar] [CrossRef]
34. Lahlali R , Taoussi M , Laasli SE , Gachara G , Ezzouggari R , Belabess Z , et al. Effects of climate change on plant pathogens and host-pathogen interactions. Crop Environ. 2024; 3( 3): 159– 70. doi:10.1016/j.crope.2024.05.003. [Google Scholar] [CrossRef]
35. Hessane A , El Youssefi A , Farhaoui Y , Aghoutane B , Abdellaoui Alaoui EA , Nayyar A . Artificial intelligence-driven prediction system for efficient management of Parlatoria blanchardi in date palms. Multimed Tools Appl. 2025; 84( 15): 15293– 329. doi:10.1007/s11042-024-19635-5. [Google Scholar] [CrossRef]
36. Yusuf B , Shabri A , Rezaiy R . An innovative hybrid drought modelling approach using wavelet-long short-term memory (W-LSTM) with standardized precipitation index (SPI) data for Badeggi district, Niger State-Nigeria. Discov Appl Sci. 2025; 7( 10): 1129. doi:10.1007/s42452-025-07649-z. [Google Scholar] [CrossRef]
37. Fang W , Qin H , Lin Q , Jia B , Yang Y , Shen K . Deep learning integration of multi-model forecast precipitation considering long lead times. Remote Sens. 2024; 16( 23): 4489. doi:10.3390/rs16234489. [Google Scholar] [CrossRef]
Cite This Article
 Copyright © 2025 The Author(s). Published by Tech Science Press.
This work is licensed under a Creative Commons Attribution 4.0 International License , which permits unrestricted use, distribution, and reproduction in any medium, provided the original work is properly cited.
 Downloads
 Citation Tools