
 Submit a Paper
 Propose a Special lssue
 Open Access
ARTICLE

Growth Dilatory Effects of PEG and Sucrose on Geranium wallichianum: An In Vitro Approach for Conservation
1 Department of Biotechnology, COMSATS University Islamabad, Abbottabad Campus, Abbottabad, 22060, Pakistan
2 Department of Horticulture, MNS University of Agriculture, Multan, 60000, Pakistan
3 Department of Arid Land Agriculture, College of Agricultural and Food Sciences, King Faisal University, Al-Ahsa, 31982, Saudi Arabia
4 Pests and Plant Diseases Unit, College of Agricultural and Food Sciences, King Faisal University, Al-Ahsa, 31982, Saudi Arabia
5 Agricultural Biotechnology Department, College of Agricultural and Food Sciences, King Faisal University, Al-Ahsa, 31982, Saudi Arabia
* Corresponding Authors: Yasar Sajjad. Email: ; Ahmed Mahmoud Ismail. Email:
(This article belongs to the Special Issue: Plant Biodiversity (Cultivated and Wild Flora) and Its Utility in Plant Breeding)
Phyton-International Journal of Experimental Botany 2025, 94(3), 987-1006. https://doi.org/10.32604/phyton.2025.062351
Received 16 December 2024; Accepted 12 February 2025; Issue published 31 March 2025
 View Full Text
 Download PDF
Abstract
The medicinal herb Geranium wallichianum belongs to the family Geraniaceae. The East Asian Himalayas are its primary habitat. Overexploitation and overharvesting pose a threat to this plant, given its extensive ethnomedical utilization in the community. In Pakistan, its population has already declined by over 75%. Given its critical medicinal importance, urgent conservation efforts are needed to prevent extinction. The aim of the current research was to determine the effectiveness of sucrose and polyethylene glycol (PEG) in decelerating the growth of this medicinally important species. Nodal segments were utilized as explant with varying levels of polyethylene glycol (PEG) (0.5% and 1.5%) and sucrose (4% and 8%) as treatments on different growth attributes. Over a 45-day period, PEG treatments (0.5% and 1.5%) proved more efficient compared to sucrose in suppressing in vitro growth, with reduced shoot lengths (0.92 and 0.57 cm), dry weight (0.04 and 0.02 g), and fresh weight (0.06 and 0.04 g). PEG also significantly enhanced phenolic levels (0.96 and 0.19 mg/g) and soluble sugars (4.07 and 4.12 mg/g) while reducing total protein level (2.38 and 2.32 mg/g) and total chlorophyll content (0.17 and 0.14 mg/g). The Pearson correlation analysis showed a negative association between phenolic levels and total chlorophyll content, chlorophyll a, and chlorophyll b. The length of the shoot had a negative relationship with phenolic level but a positive relationship with both fresh and dry weight. The principal component analysis revealed that total sugars and phenolics that were grouped separately from other variables led to stronger responses to osmotic stress. These outcomes suggested that higher PEG was successful in reducing in vitro growth throughout short-term preservation in comparison to sucrose. The outcomes of this research could be applied for the in vitro conservation of medical plants in the future.Keywords
In developing nations like Pakistan, over 80% of population depends upon herbal remedies for primary healthcare, with nearly 25% of recommended pharmaceuticals originating from wild plants [1]. Worldwide, the demand of medicinal plants continues to grow due to the rising interest in secondary metabolites and natural health products obtained from these plants [2,3]. Pakistan’s diverse climate, geography, and phytogeographical zones support around 6000 species and 1572 genera of wild plants, predominantly found in the Karakoram, Indus, and Himalayan provinces, including 428 species that are endemic [4]. The northern areas of Pakistan are abundant in medicinal plants, which are deeply rooted in traditional use by local populations. For many residents, these plants serve as their sole primary income source. However, Pakistan’s plant biodiversity faces numerous threats, including habitat destruction, overgrazing, desertification, unauthorized trade, industrial contamination, excessive need for natural resources, and a lack of essential awareness [5].
Geranium wallichianum, a plant of the family Geraniaceae, is widely named “Ratanjot” in Pakistan and normally known as “Shepherd’s needles”. Other names for this plant include “Wallach cranesbill”, “Sra zeal” [6], “ratinloog”, and “rattenjot” [7]. G. wallichianum is a tall, upright plant featuring multiple branches, that predominantly occur in the Himalayan region at elevations of 7000–10,000 feet, extending from Nepal to Kashmir. In Pakistan, it grows in areas such as Hazara, Swat, Murree Hills, Lowari Top, Gilgit, Chitral, Dir, Shogran Valley, and Baluchistan. Globally, its range spans the East Asia-Himalayan region, encompassing Afghanistan, Bangladesh, Nepal, India, and Bhutan [8]. G. wallichianum holds significant ethno botanical importance. Its floral extract is utilized to treat vision impairments and purify the blood, while the leaves are beneficial for liver ailments. The plant rhizomes are used to address various health concerns, including ear infections, toothache, constringent, and eye problems [9]. The whole plant (G. wallichianum) is used to treat stomach acidity, stomach pain, backache, stiffness, and gastric complications [10]. G. wallichianum is seen as facing an indigenous extinction in Pakistan [5]. This species is endemic to Pakistan, and its population has declined by more than 75% (91). The main risks to this plant stem from over-harvesting and over-exploitation, due to its considerable ethnomedicinal significance [11].
Various conservation initiatives have been implemented to protect vital medicinal plants. However, to effectively conserve threatened and endangered species, it is crucial to adopt long-term and diverse strategies. Both traditional methods, such as in situ and ex-situ conservation, and recent biotechnological techniques, including cryopreservation, in vitro conservation, and micropropagation, are valuable tools for preserving plant biodiversity [12]. Ex-situ conservation of plants relies on factors like species, techniques employed, and the intended duration of storage, each involving various costs, challenges, and scientific limitations. Conversely, in vitro conservation facilitates the concurrent safeguarding of plant genetic diversity, ensures year-round access to healthy planting material for farmers, and enables the monitoring of gene integrity through molecular analysis [13]. Among in vitro conservation strategies, slow growth approaches, especially those involving fewer subcultures, minimize the rate of germplasm loss due to handling mistakes like contamination. These strategies also mitigate the risks associated with genetic instability and reduce the demand for labor and storage space in the preservation of germplasm.
This method is often referred to as “slow growth storage” owing to the utilization of specific chemical, nutritional, or physical conditions that restrict the growth of plantlets [13]. In micropropagation facilities, the slow growth technique serves as a successful method for storing plant materials in a small space for short to medium terms. This technique enables the affordable production of premium cultivars at a reduced cost, and meets the market demand [14]. Microplants are cultured onto Murashige and Skoog [15] (MS) medium enriched with growth inhibitors or osmotic stress agents, then maintained within controlled conditions of reduced light intensity, low temperature, and adjusted photoperiods to minimize sub-culturing frequency [16]. Slow-growth methods have been applied to preserve plants like Glycyrrhiza glabra [17], Coleus forskohlliBriq [18], Ullucus tuberosus [19], Rhazya stricta and Lavandula dentata [20].
The slow growth storage approach for in vitro preservation can be implemented through various methods, such as applying growth inhibitors and osmotic agents [21], dark storage with controlled light spectra [22], encapsulation [23], adjusting growth media via lowering sucrose and media concentrations [24], combining diluted media with growth inhibitory agents [25,26] and utilizing specific light spectra [22]. Altering the media through lowering sugar, minerals, growth regulators, or osmotic agent levels (e.g., mannitol and sorbitol) can suppress cell division, considerably hindering callus development and shoot growth. Diluting MS medium to reduce macronutrients is one method to slow in vitro culture growth [25]. To prolong the interval between subcultures, methods for in vitro plant storage are utilized [27]. While studies on in vitro micropropagation to boost explant development and the production of seedlings are ongoing, advancing in vitro storage is equally important. Therefore, research into the in vitro preservation of ornamental plants is crucial for preserving germplasm, maintaining sterile cultures, and conserving rare and exotic species.
This study employed osmotic regulators to deaccelerate growth and prolong subculturing intervals. Osmotic stress agents in culture media primarily function by reducing photosynthesis via the closure of stomata, lowering water potential, and decreasing turgor pressure when applied at optimal concentrations. Effective osmotic regulators include mannitol, sorbitol, sucrose, ribose, 2.2-dimethyl hydrazide, and polyethylene glycol (PEG) [28]. Sucrose serves as the ideal energy supply for in vitro culture [29] and is also employed as an osmotic regulator to slow the mature explants’ development. Elevated sucrose content acts to decelerate the development of various plant species cultured in vitro [30]. Furthermore, PEG is widely used in in vitro and in vivo osmotic stress research as an optimal, inert, and non-ionic substance. It lowers tissue’s water potential by binding the water molecules and remains localized due to its inability to penetrate cell walls [31].
This research focused on studying the capability of PEG and sucrose in slowing down G. wallichianum growth, thereby developing an in vitro conservation system to facilitate reduced growth. The study’s objectives were to investigate the effectuation of PEG and sucrose on the growth factors of G. wallichianum in vitro and to analyze the influence of these osmotic agents on crucial biochemical parameters of G. wallichianum. This is essential since the rising requirement for G. wallichianum’s therapeutic value has significantly reduced its population, endangering its survival. This conservation system will help to preserve viability and genetic stability by extending the period between in vitro subcultures and lowering the need for space, plant growth regulators, and other growth retardants.
The G. wallichianum nodal segments (Fig. 1) served as explants for this study, which was conducted at the Department of Biotechnology, COMSATS University Islamabad, Abbottabad Campus, Pakistan. The plant was gathered through its flowering phase from Galyat, Pakistan, verified by a taxonomist’ plant, and accustomed in the department’s nursery.
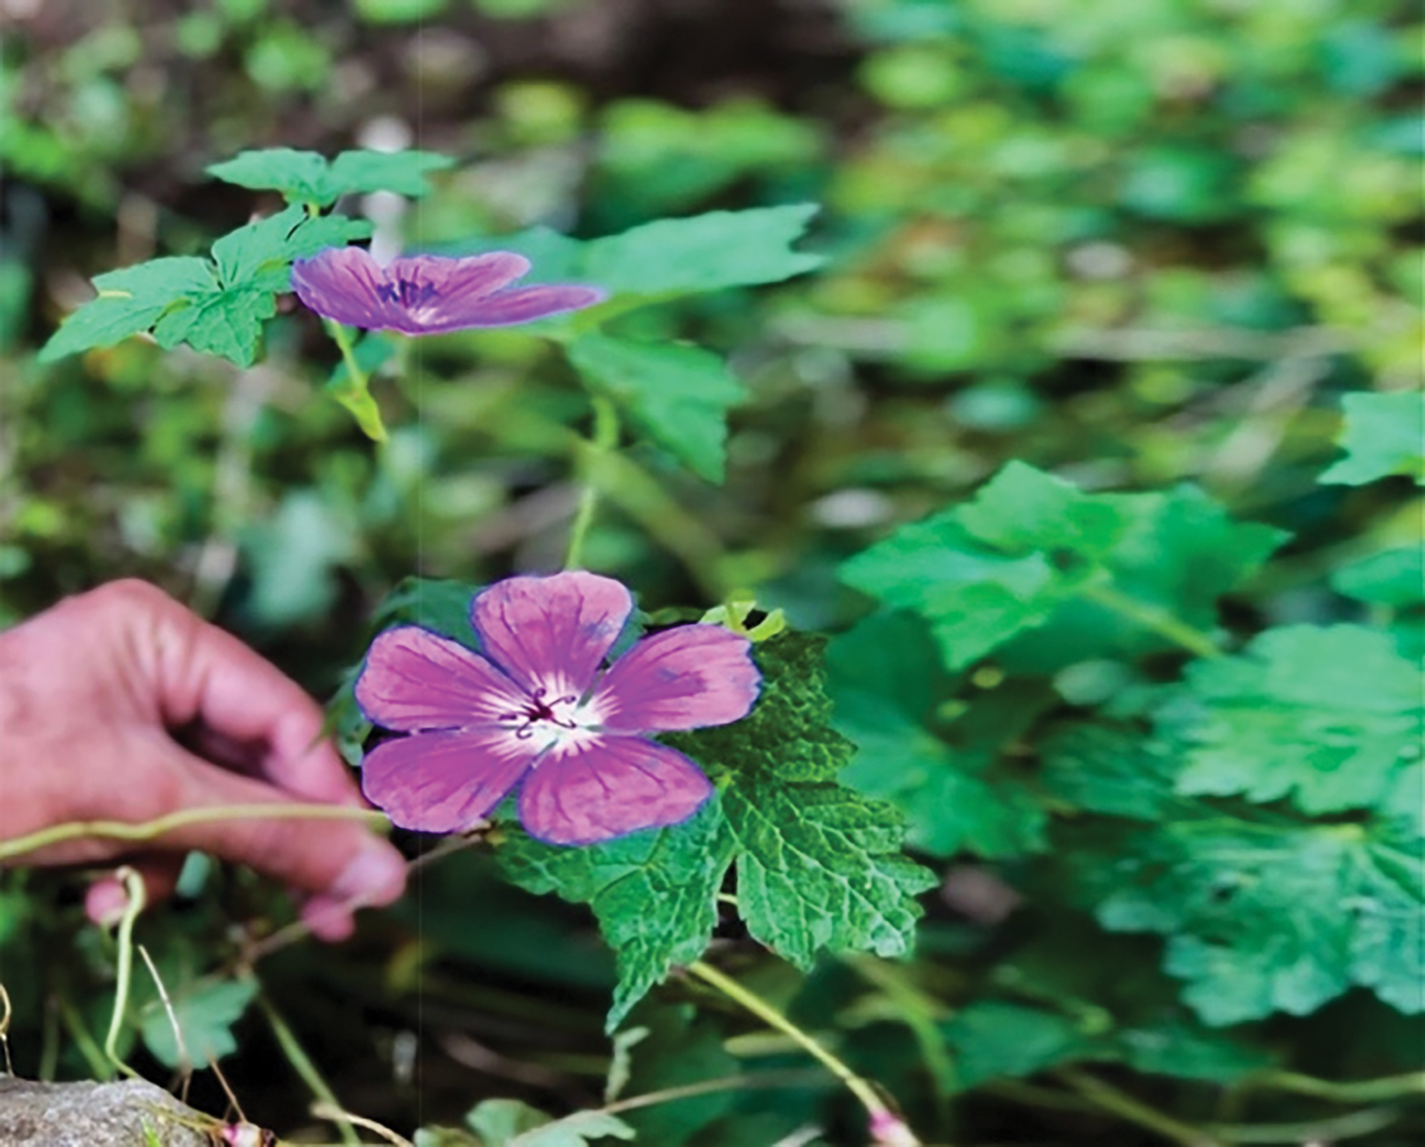
Figure 1: Geranium wallichianum at the nursery of the Department of Biotechnology, CUI Abbottabad Campus
2.2 Surface Sterilization of Explants
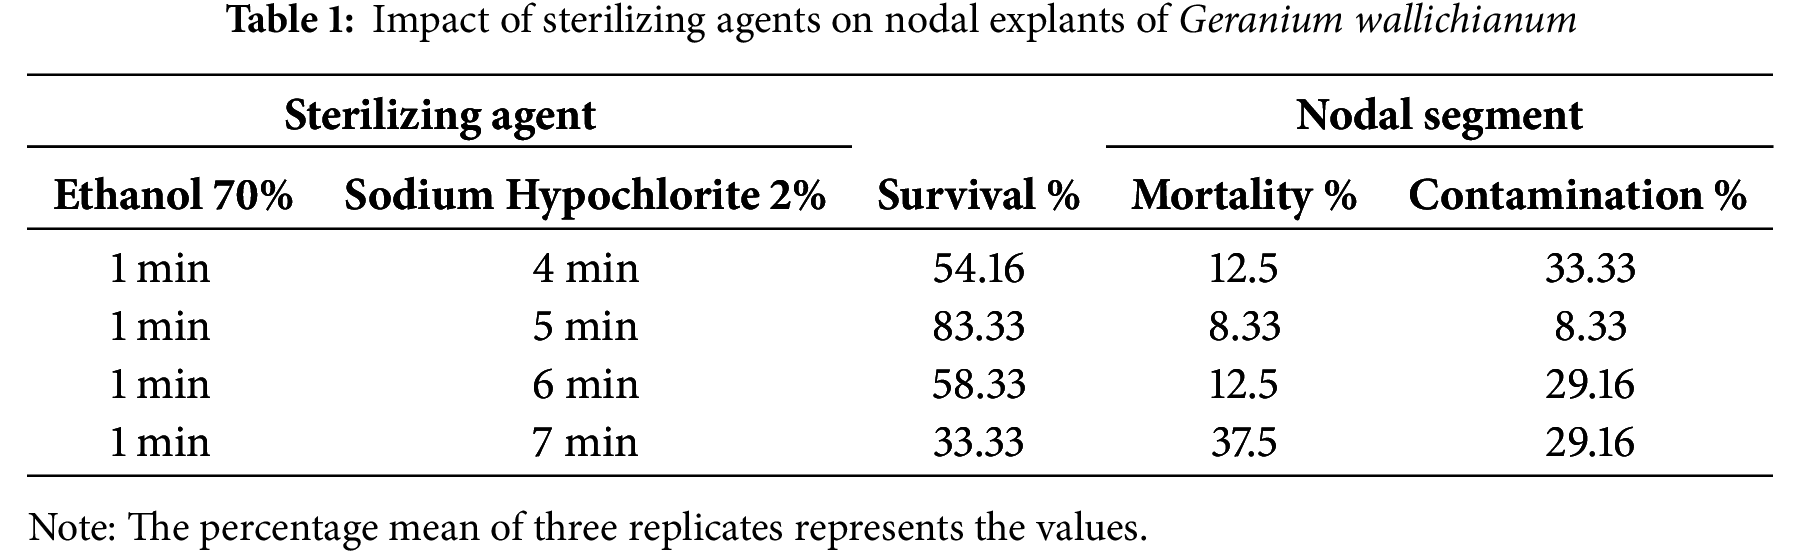
The protocol of Munir et al. [32] was followed to surface sterilize the nodal explants, with few adjustments, as indicated in Table 1. The explants were divided into minute slices, subjected to a 1-minute treatment with 70% ethanol (Sigma-Aldrich, Saint Louis, MO, USA) and a 5-min treatment with 2% sodium hypochlorite (Sigma-Aldrich, Saint Louis, MO, USA), and washed thrice with sterile distilled water. The explants were subsequently positioned onto autoclaved filter paper in a Petri plate for 1 min to allow them to air dry prior to being fully inoculated into the culture medium. Within aseptic conditions, the explants were placed on a basic MS medium [15] following surface sterilization. In order to establish the culture, the culture medium was kept at 25°C ± 2°C and a photoperiod of 16 h in a controlled environment chamber. The light intensity was 3000 lx. After one week of culture, various parameters, including contamination, explant mortality (blackening or browning), and survival rate, were documented (Table 1).
2.3 PEG and Sucrose Treatments
The PEG and sucrose are osmotic stress inducers and are applied to limit the in vitro growth of G. wallichianum. Two weeks after explants growth on MS [15] media, a well-established culture was subcultured on MS media enriched with sucrose and PEG (CAS 25322-68-3) at variable concentrations. Sucrose accounted for the sole carbon source that was introduced into the medium. For the preparation of simple MS culture media, 3% sucrose (control) and 10 mg/mL agar (Sigma-Aldrich, Saint Louis, MO, USA, bacterial grade) were used for solidification. The solution pH was fixed at 5.6, and the mixture was kept for 20 min in an autoclave (121°C) at 15-psi pressure. In order to examine the impact of high sucrose concentrations and polyethylene glycol on the in vitro reduced growth of G. wallichianum, the MS culture media was enriched with varying concentrations of sucrose (4% and 8%) and PEG (0.5% and 1.5%). The sterile culture medium, treated with PEG and sucrose, was where the explants were moved. They were subsequently placed in a growth chamber with controlled conditions, subjected to a 16-hour light/dark cycle, and maintained at 23°C ± 2°C. The culture was morphologically and biochemically evaluated after 15, 30, and 45 days following PEG and sucrose treatments.
The length of the shoot (cm), survival rate (%), and fresh and dried weight (g) of nodal explants were documented at specific durations of 15, 30, and 45 days of culturing. The nodal explants’ heights were assessed visually using a ruler. The explants were gently extracted from the culture medium, dried with tissue paper, and weighed to determine both their fresh and dried weight. The electronic balance was employed to record the explant fresh weight. After weighing, the explants were set onto fresh aluminium foil and oven-dried at 100°C for 24 h. The dried explants were measured for dry weight with the same electronic balance. Explant cultures showing signs of death or brownish nodal explants were classified as non-surviving, while those exhibiting healthy growth were considered to be surviving. The explant survival rate was computed by dividing the surviving explants’ number by the counts of explants initially cultured, then multiplying by 100.
The analysis of soluble sugars, total phenolics, protein content, and chlorophyll was conducted 15, 30, and 45 days post-cultivation using the experimental procedures outlined below.
2.5.1 Estimation of Total Soluble Sugars
The nodal explant extracts were prepared utilizing ethanol (80%). These extracts were then mixed with 25 mL of anthrone reagent, which was a solution of 0.15 g anthrone (Merck, Darmstadt, Germany) in 100 mL of 72% H2SO4 (Sigma-Aldrich, Saint Louis, MO, USA). The absorbance was quantified spectrophotometrically at 625 nm utilizing the IRMECO Model U2020, after the mixture was heated for 15 min at 97°C. Using a glucose standard, the total soluble sugars was assessed [33].
2.5.2 Determination of Total Phenolics
The technique reported by Ainsworth et al. [34] was utilized to quantify the total phenolic content. The 3-minute centrifugation at 10,000 rpm was undergone by the plant extracts, which were formulated with 80% methanol (Sigma-Aldrich, Saint Louis, MO, USA). Subsequently, 300 µL of extract was combined with 700 µL of 10% Folin and Ciocalteu reagent (Merck, Darmstadt, Germany). The ultimate mixture was completed by incorporating 700 mM sodium carbonate (Na2CO3) and incubating at ambient temperature (25°C) for an hour. The phenolic content was determined by measuring its absorbance at 765 nm spectrophotometrically (IRMECO Model U2020) and employing the standard gallic acid (Sigma-Aldrich, Saint Louis, MO, USA) [35,36].
2.5.3 Determination of Chlorophyll Content
To determine the chlorophyll content, the extract was obtained through pulverizing fresh explants within 10 mL acetone (80%, Sigma-Aldrich, Saint Louis, MO, USA) for 12 h. Chlorophyll a and b levels were measured spectrophotometrically (IRMECO Model U2020) at 645 and 663 nm, respectively, after centrifuging the mixture at 10,000 rpm for 3–5 min to acquire the supernatant [37]. The total chlorophyll, along with chlorophyll a and b, was obtained by averaging the readings from three replicates using these equations [38]:
Chlorophyll a content (mg g−1) = 12.7 (A663) − 2.69 (A645) × W/1000 × V
Chlorophyll b content (mg g−1) = 22.9 (A645) − 4.68 (A663) × W/1000 × V
Total chlorophyll content (mg g−1) = Chlorophyll (a + b)
In these equations, V represents the whole extract volume (mL), W denotes the sample fresh weight (g), and A denotes the absorbance at the specified wavelengths.
2.5.4 Determination of Total Proteins
The Bradford [39] technique was employed for total protein content estimation. Extracts (0.5 g) underwent homogenization within phosphate buffer (pH 7.4), then underwent 20 min of centrifugation at 8000 rpm. Afterward, the supernatant was mixed with 2.9 mL of Coomassie blue dye (Sigma-Aldrich, Saint Louis, MO, USA) and left to react for an hour at ambient temperature. The standard curve was created using bovine serum albumin (BSA; Sigma-Aldrich, Saint Louis, MO, USA), and absorbance was recorded spectrophotometrically at 600 nm (IRMECO Model U2020).
2.6 Experimental Design and Statistical Analysis
The experiment was conducted using a fully randomized design, incorporating three biological replicates, every consisting of eight explants (n = 8). The resulting data were analyzed using a two-way analysis of variance (ANOVA), considering treatments and days as the primary factors, followed by the least significant difference (LSD) test at p < 0.05. The Pearson correlation analysis was employed for dependent variables and principal component analysis (PCA) was employed for treatments by utilizing IBM SPSS software (version 26).
The impact of osmotic stress inducers on morphological aspects, comprising shoot length, survival rate, and the shoot’s fresh and dry weights, is depicted in Fig. 2.
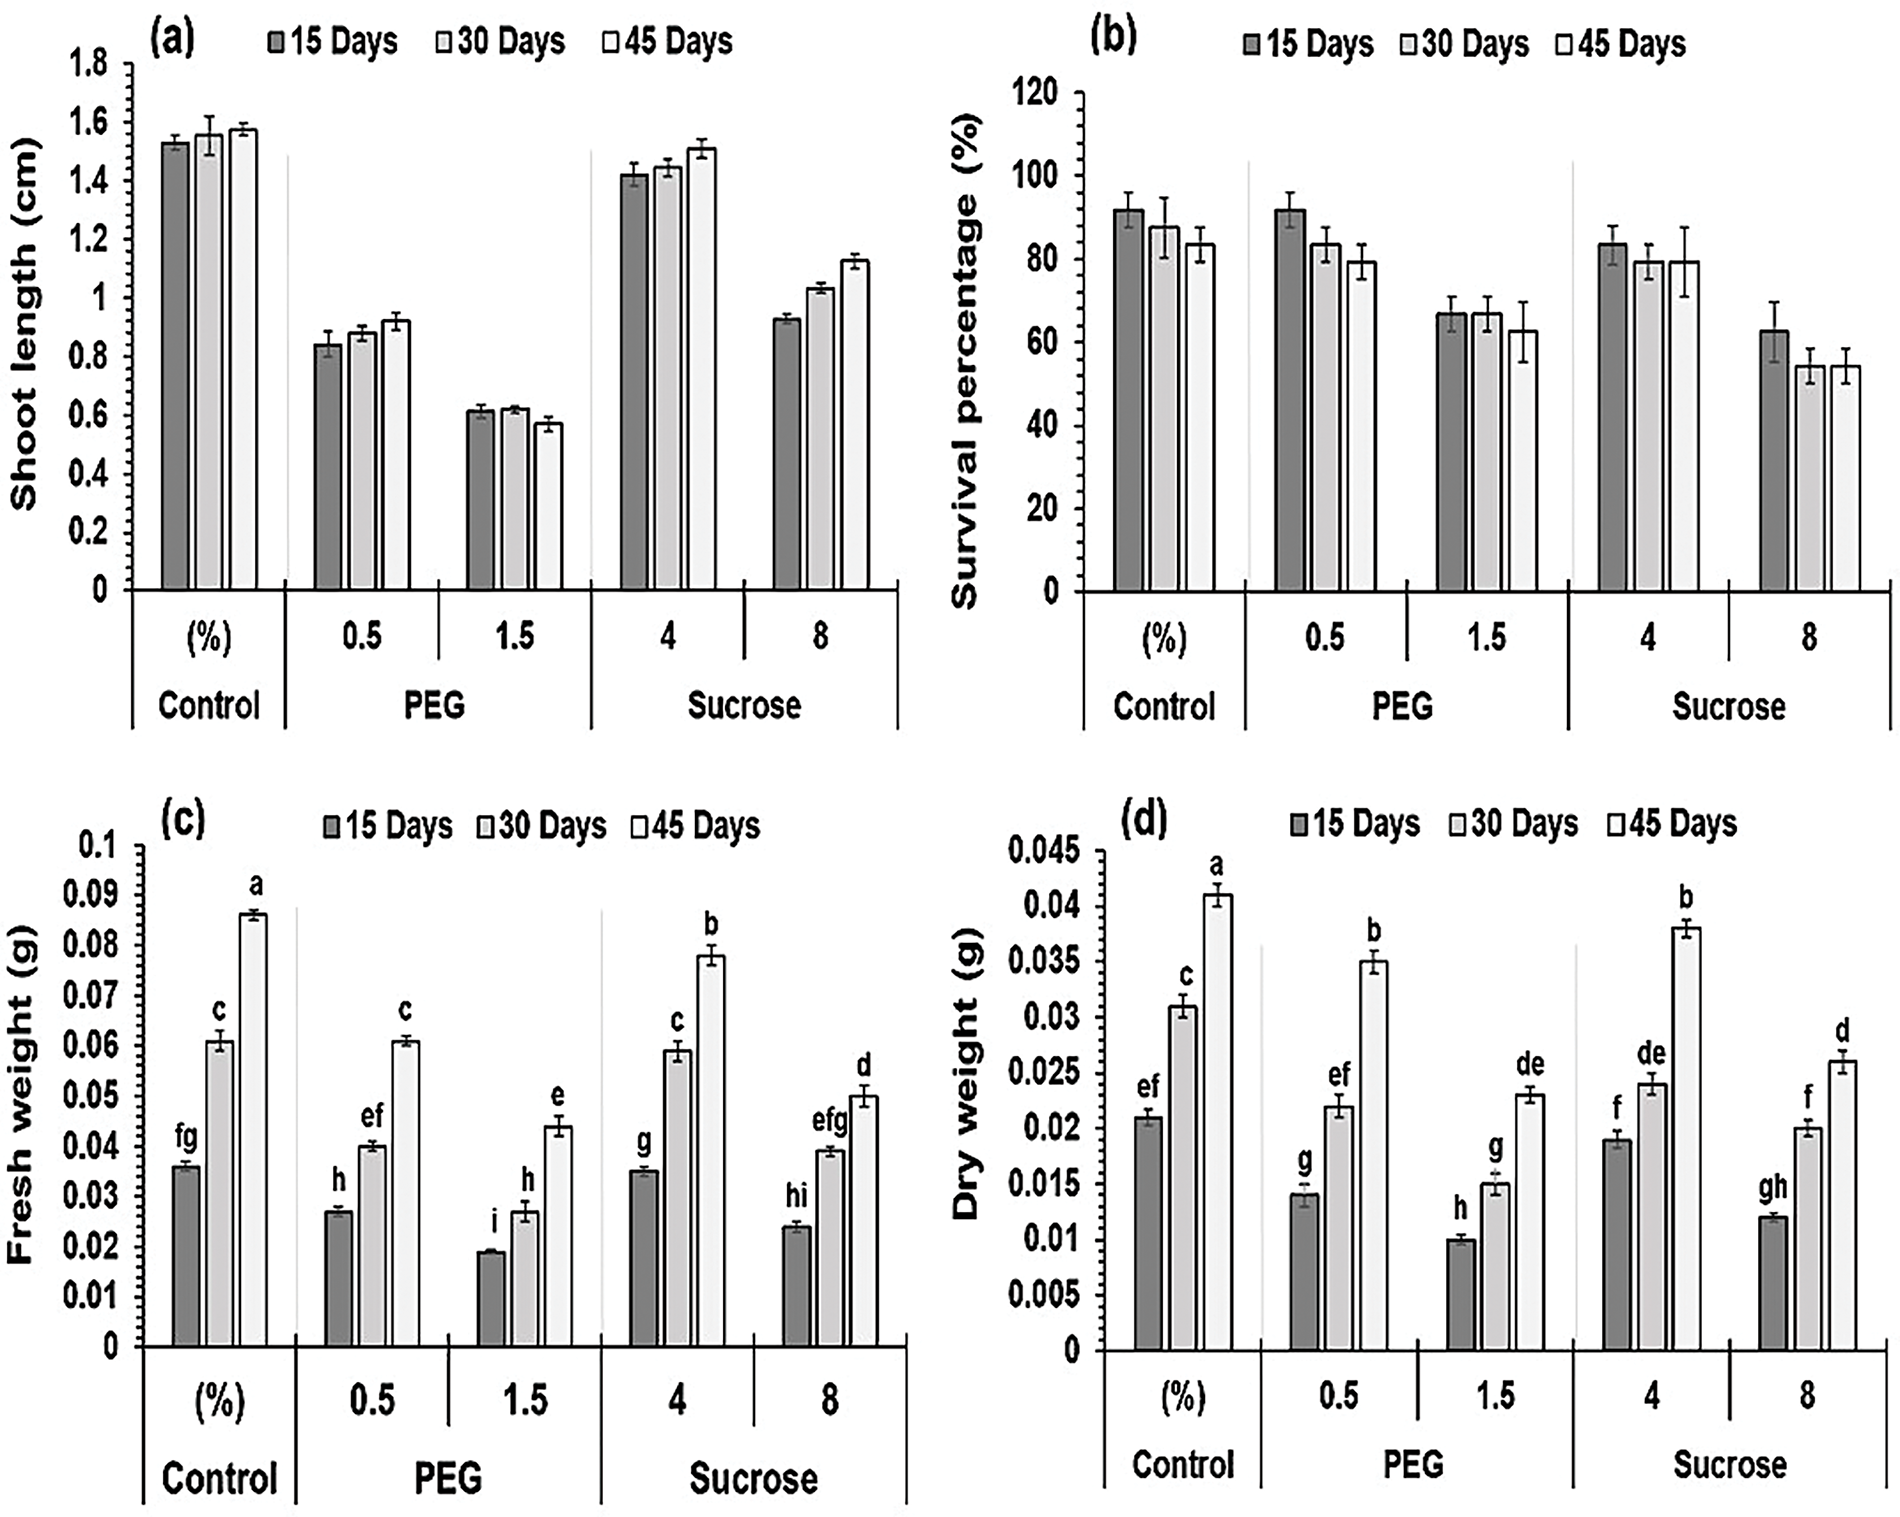
Figure 2: Impact of treatments and duration on the nodal explants’ growth. (a) Shoot length, (b) Survival rate, (c) Fresh weight, (d) Dry weight. Data are expressed as mean ± SE from three independent experiments, illustrated as bars with error bars. Bars with distinct letters designate a significant difference following the LSD test at p < 0.05
3.2 Impact of PEG and Sucrose Levels on Shoot Length of Nodal Explant
Fig. 2a illustrates the impact of the concentrations of varying sucrose and PEG on the length of the explant shoot. Analysis of variance was conducted on shoot length data, revealing that treatments significantly affected the results over time. The greatest decline in shoot length due to 8% sucrose was observed to be 0.93, 1.03, and 1.12 cm at 15, 30, and 45 days, respectively (Fig. 3). At intervals of 15, 30, and 45 days, the length of the shoot of explants1 treated with PEG (0.5%) decreased to 0.84, 0.88, and 0.92 cm, respectively, relative to the control values of 1.52, 1.55, and 1.57 cm. In contrast, an elevated PEG level (1.5%) significantly reduced the shoot length to 0.61, 0.62, and 0.57 cm, respectively (Fig. 3). The medium containing 4% sucrose yielded the most significant length of the shoot (1.45 cm) at the 45-day mark, demonstrating a significant difference from other treatments and time periods. While 1.5% PEG resulted in the shortest (0.60 cm) shoot length.
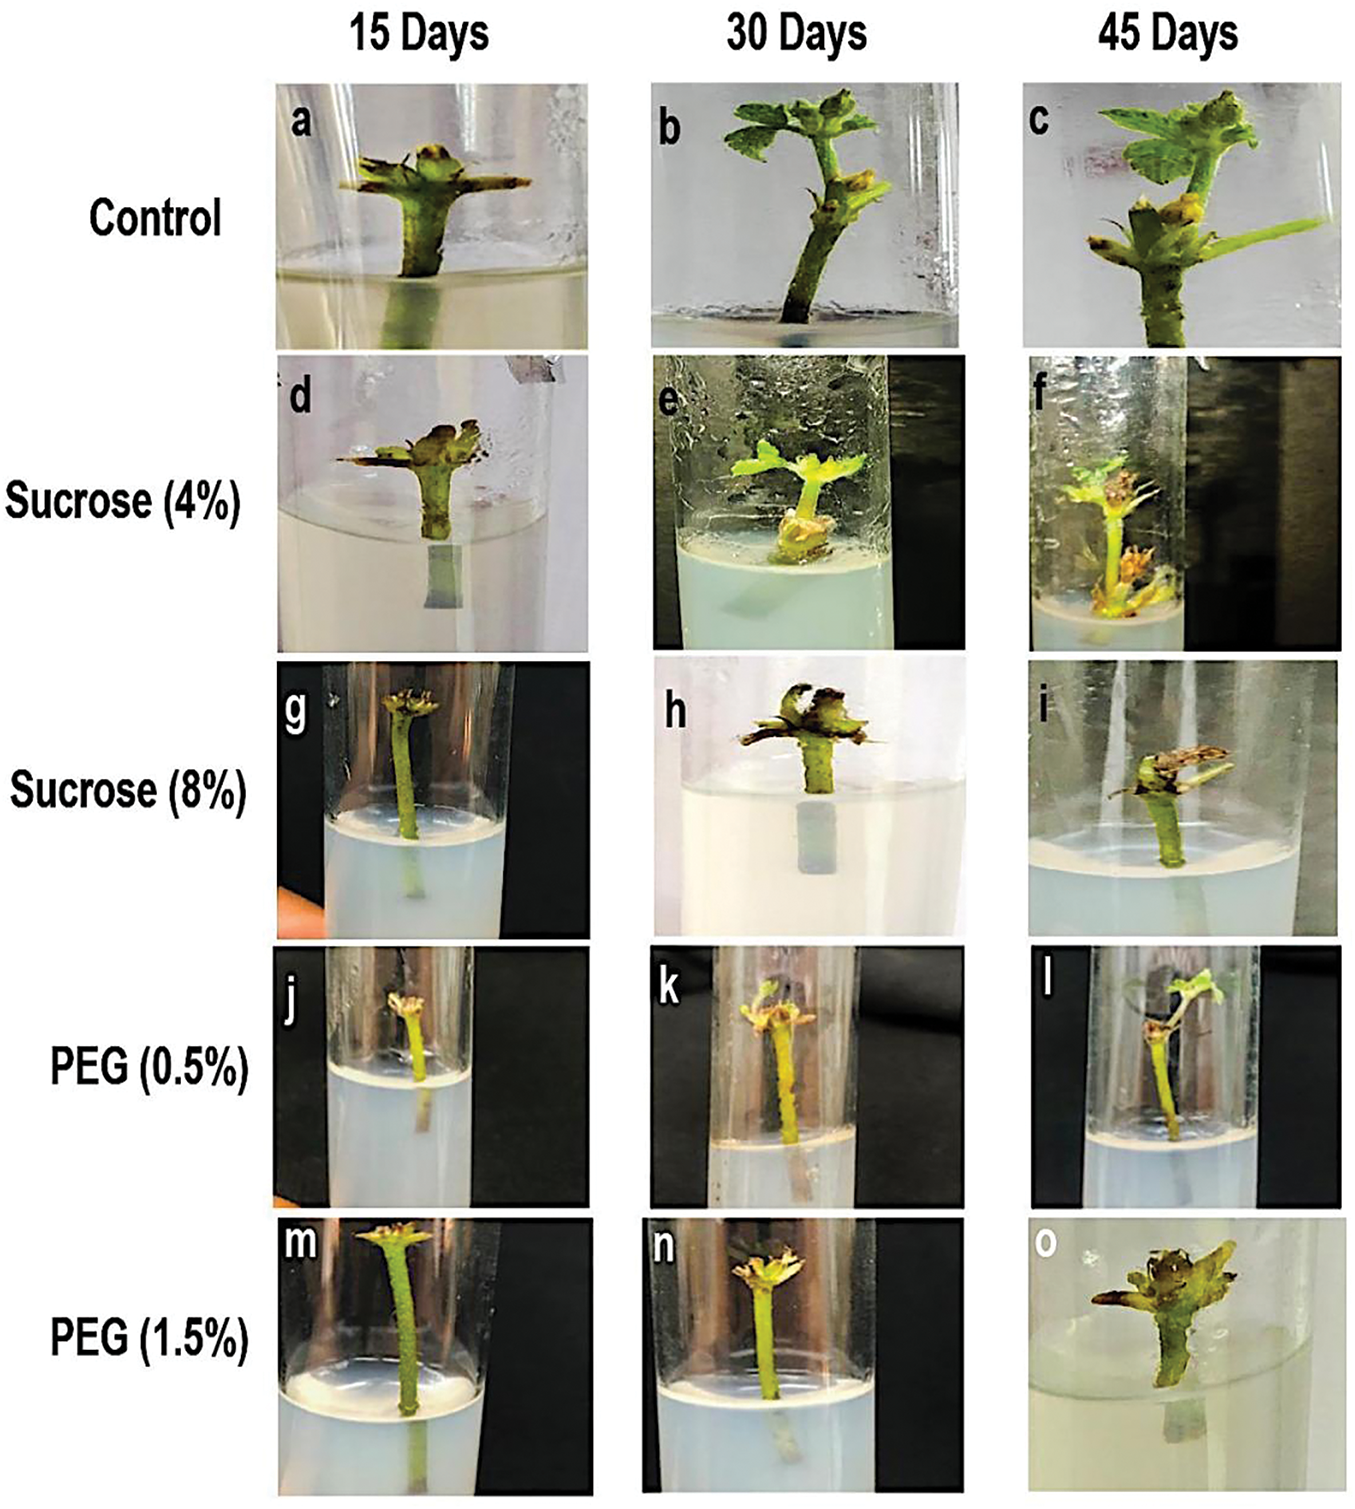
Figure 3: Impact of PEG and sucrose levels on the nodal explant morphology at 15-, 30- and 45-day. Control: (a, b, c); 4% sucrose: (d, e, f); 8% sucrose: (g, h, i); 0.5% PEG: (j, k, l) and 1.5% PEG: (m, n, o)
3.3 Nodal Explant Survival Percentage under Sucrose and PEG Treatments
Analysis of the variance of the survival percentage demonstrated the significant impact of the treatments. The survival rate declined with higher levels of sucrose and PEG. Nodal explants exposed to PEG revealed a higher survival rate compared to those treated with sucrose. Media with sucrose (4%) and PEG (0.5%) yielded the highest survival rates, 83.3% and 87.5% after 15 days while reduced to 79.2% and 83.3% after 30 days. The lowest survival rates were achieved with media containing the maximum concentrations of sucrose (8%) and PEG (1.5%): 62.5% and 66.66% at 15 days, 54.16% and 66.66% at 30 days, and 54.16% and 62.5% at 45 days, relative to the control (Fig. 2b). The data illustrated in Fig. 2b demonstrate that the medium with 0.5% PEG and a 15-day interval yielded the maximum survival percentages (91.67%). On the other hand, the medium containing 8% sucrose and a 15-day interval resulted in minimal survival percentages (83.33%).
3.4 Impact of Sucrose and PEG Levels on the Nodal Explant Weight
Fresh and dry weights were evaluated by analysis of variance, revealing a significant influence of treatments over time. Fig. 2c,d illustrates a gradual decline in the explant dry and fresh weights as sucrose and PEG concentrations increase. Over 15 days, the explant’s maximum fresh and dry weights were recorded at 0.03 and 0.01 g, respectively, with 0.5% PEG in the medium. On the contrary, the explant’s minimum dry and fresh weights recorded were 0.01 and 0.02 g, respectively, at 1.5% PEG. After 15 days, the explant’s fresh and dry weights followed a similar trend, with 0.03 and 0.02 g at 4% sucrose medium, while 8% sucrose medium showed the minimum values at 0.02 and 0.01 g, respectively.
The control and 4% sucrose media produced satisfactory results following 45 days. The control medium gave the greatest fresh (0.08 g) and dry weights (0.02 g), while 4% sucrose medium resulted in 0.09 and 0.04 g for fresh and dry weights. The minimum fresh and dry weights observed were 0.04 and 0.02 g, respectively, in PEG (1.5%) enriched medium. The explant’s dry and fresh weights in the medium enriched with sucrose (8%) were 0.03 and 0.05 g, respectively. The data in Fig. 2c,d reveal that the medium enriched with 4% sucrose induced the maximum fresh (0.09 g) and dry (0.04 g) weights of nodal cultures, after 45 days. The media with 0.5% and 1.5% PEG at a 15-day interval produced the minimum fresh and dry weights, measured at (0.02 vs. 0. 03 g) and (0.01 vs. 0.02 g), respectively.
Fig. 4a displays the total soluble sugar analysis results. The analysis of variance on total soluble sugars showed significant impacts from the durations, treatments, and their interaction. After 15, 30, and 45 days, the explants cultured in a 1.5% PEG-enriched medium-exhibited higher total soluble sugars (3.96, 4.06, and 4.12 mg g−1). Explants cultured on media containing 8% and 4% sucrose, showed increases in total soluble sugars (2.64, 2.95, and 3.20 mg g−1) and (2.61, 2.77, and 2.95 mg g−1), respectively, in comparison to the control group. These increases happened over a period of 15 days, 30 days, and 45 days. Total soluble sugars also increased significantly (3.63, 3.93, and 4.07 mg g−1) in a 0.5% PEG-enriched medium at 15, 30, and 45-day intervals.
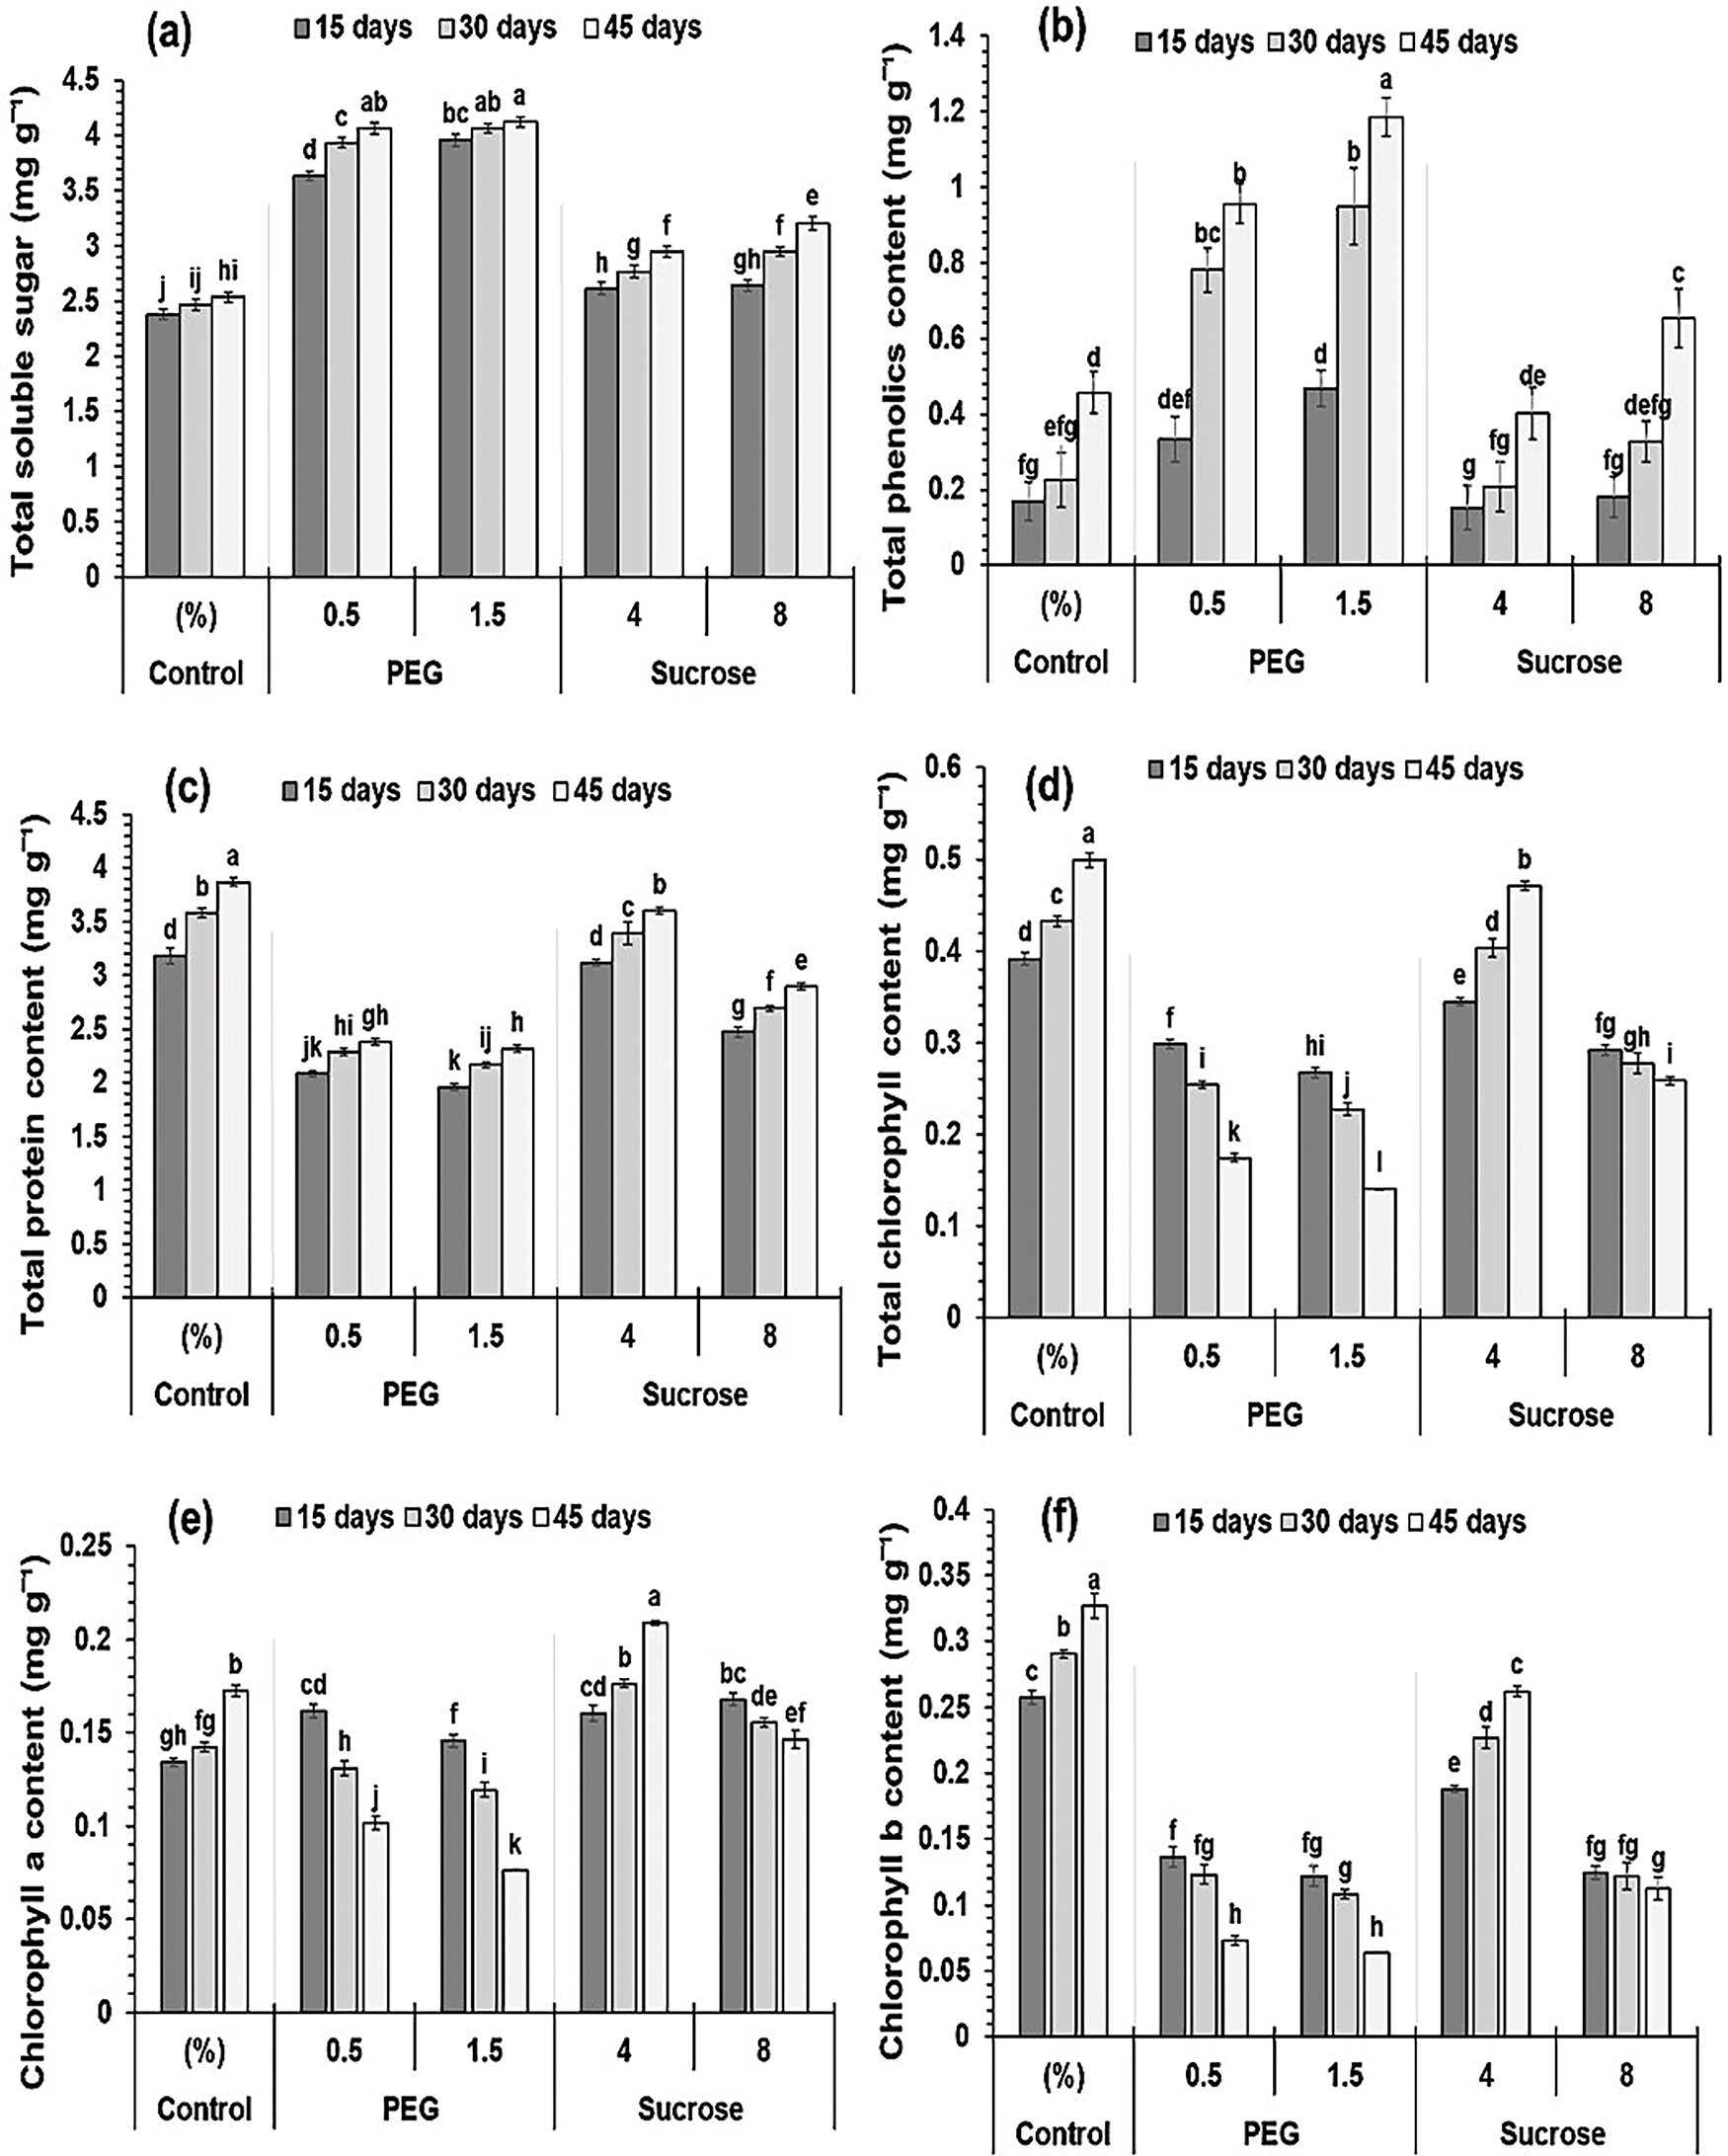
Figure 4: Effect of treatments and days on nodal explants biochemical measures (mg/g). (a) Total soluble sugars, (b) Total phenolic content, (c) Total protein content, (d) Total chlorophyll content, (e) Chlorophyll a content, (f) Chlorophyll b content. Data are expressed as mean ± SE from three independent experiments, illustrated as bars with error bars. Within each panel, bars with distinct letters designate a significant distinction following the LSD test at p < 0.05
3.5.2 Total Phenolics Contents
Fig. 4b presents the findings from the total phenolic content test, revealing that treatment, time, and their interaction significantly influenced the results. When compared with the control medium, 8%, and 4% sucrose caused the total phenolic content to rise slightly (0.18, 0.33, and 0.65 mg g−1) and (0.15, 0.21, and 0.40 mg g−1), respectively. However, the medium with 0.5% PEG caused the total phenolic level to rise greatly (0.33, 0.78, and 0.96 mg g−1). The medium comprising 1.5% PEG caused the total phenolic content to rise twice as much (0.47, 0.95, and 1.19 mg g−1) compared to the control.
The nodal explant’s protein levels were notably influenced by the treatments, days, and their interaction (Fig. 4c). The total protein content at 15-, 30-, and 45-day intervals decreased slightly (2.47, 2.69, and 2.89 mg g−1) and (3.12, 3.39, and 3.60 mg g−1) in the 8% and 4% sucrose-enriched medium relative to the control. Conversely, the medium containing 0.5% PEG caused a great significant decline in total protein levels, recorded at 2.08, 2.28, and 2.38 mg g−1. The medium comprising PEG 1.5% caused a twofold decline in total protein content, with values of 1.96, 2.17, and 2.32 mg g−1, relative to the control.
The findings indicated that chlorophyll levels were significantly impacted by treatments, days, and their interaction. The duration did not affect chlorophyll b levels; however, the treatments and their interaction with days exhibited great significance (Fig. 4e,f). Chlorophyll b levels were lowest in the medium with 1.5% PEG (0.12, 0.11, and 0.06 mg g−1), preceded by 0.5% PEG (0.14, 0.12, and 0.07 mg g−1), 8% sucrose (0.12, 0.12, and 0.11 mg g−1), and the highest levels were found in the medium with 4% sucrose (0.19, 0.23, and 0.27 mg g−1) at 15, 30, and 45 days. Similarly, chlorophyll levels were lowest in the 1.5% PEG medium (0.14, 0.12, and 0.08 mg g−1), then 0.5% PEG (0.16, 0.13, and 0.10 mg g−1), 8% sucrose (0.17, 0.15, and 0.15 mg g−1), and second highest in the 4% sucrose medium (0.16, 0.18, and 0.21 mg g−1).
Analysis of variance on the whole chlorophyll content data indicated that treatments, days, and their interaction exhibited great significance. The medium comprising 1.5% and 0.5% PEG had the lowest level of total chlorophyll in comparison with the control (0.27, 0.23, and 0.14 mg g−1) and (0.29, 0.25, and 0.17 mg g−1) at 15-, 30-, and 45-day intervals. Nevertheless, the media with 8% and 4% sucrose had a minimal reduction in total chlorophyll content (0.29, 0.28, and 0.26 mg g−1) and (0.34, 0.40, and 0.47 mg g−1), respectively (Fig. 4d).
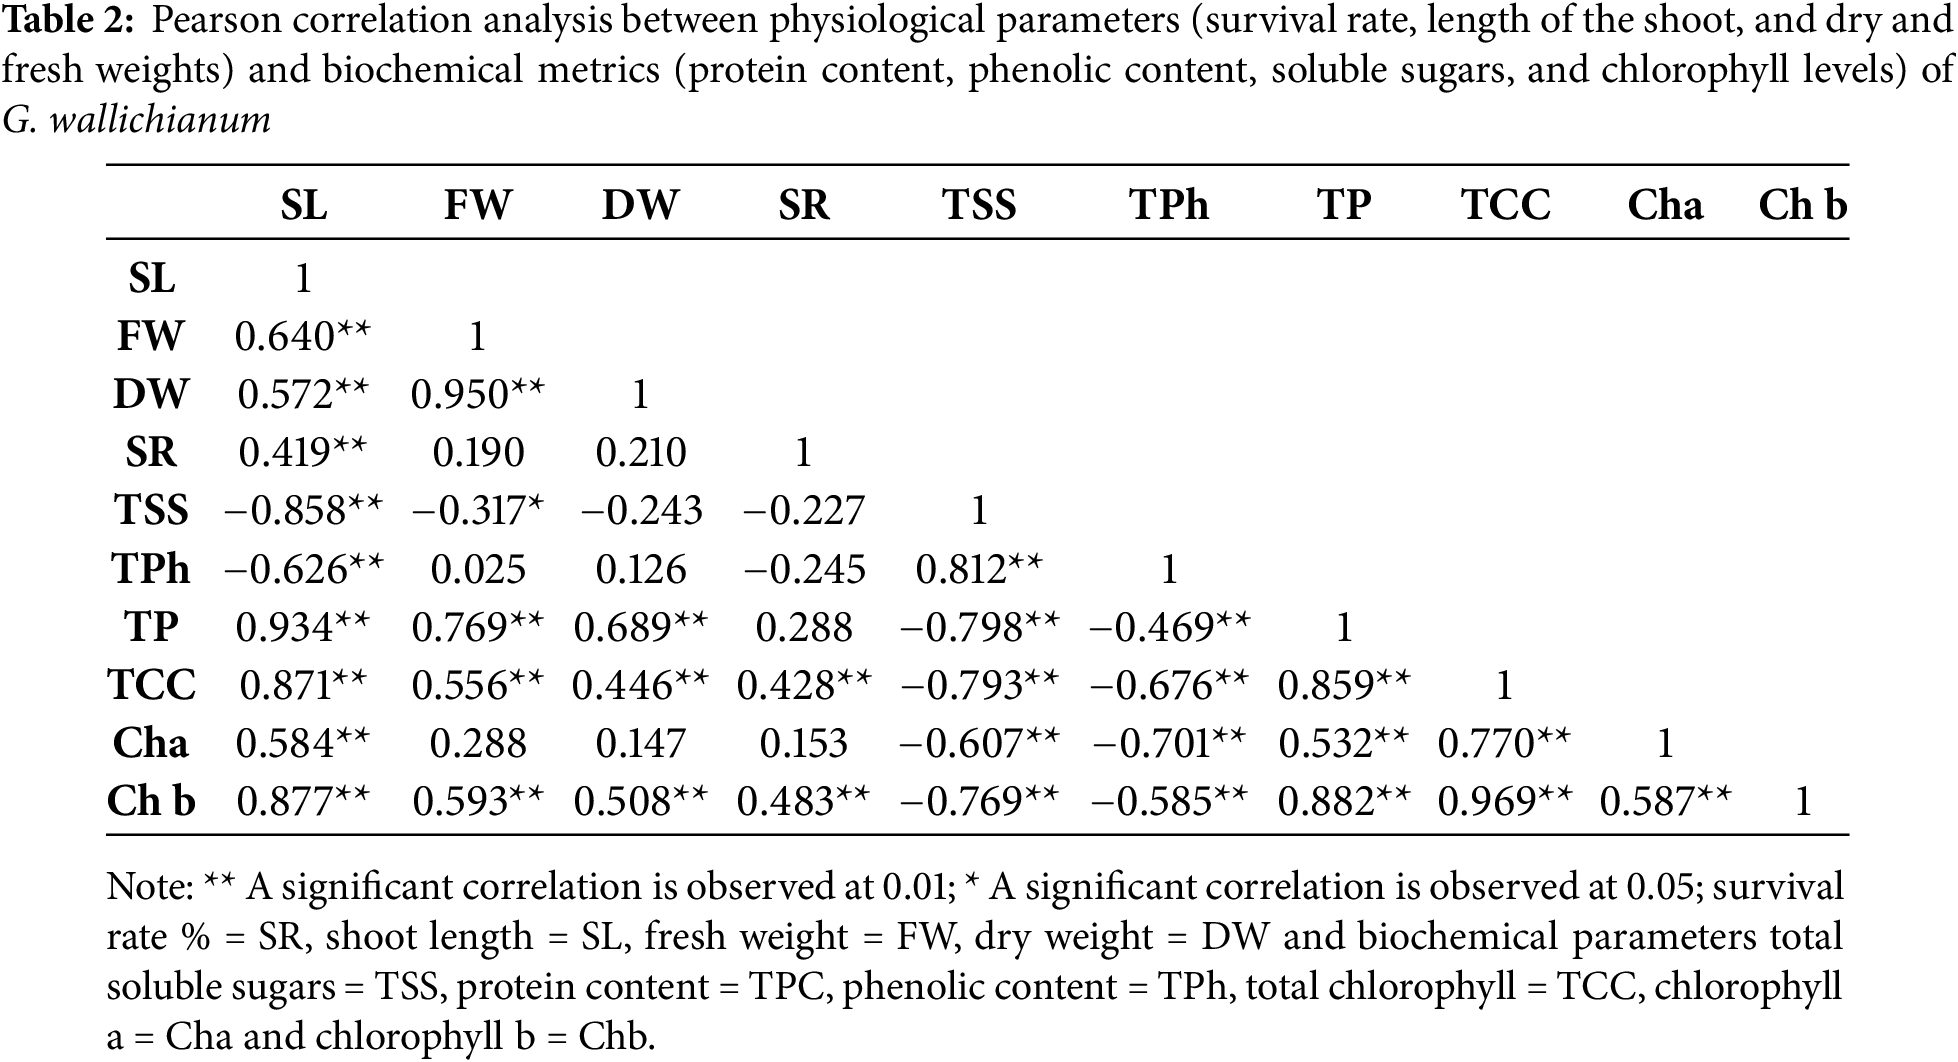
3.6 Pearson Correlation Analysis
The data in Table 2 indicate a notable negative association (p < 0.01) amid shoot length and total phenolic content. The total phenolic content exhibited a significant negative correlation (p < 0.01) with chlorophyll a, b, and total chlorophyll content. The length of the shoot exhibited a positive and significant correlation with both shoot dry and fresh weight (p < 0.01).
3.7 Principal Component Analysis (PCA)
The variance was contributed 99.5% by the first principal component (PC1), while the second component (PC2) contributed 0.4%, as shown in Fig. 5. Together, these two components explain 99.9% of the variance.
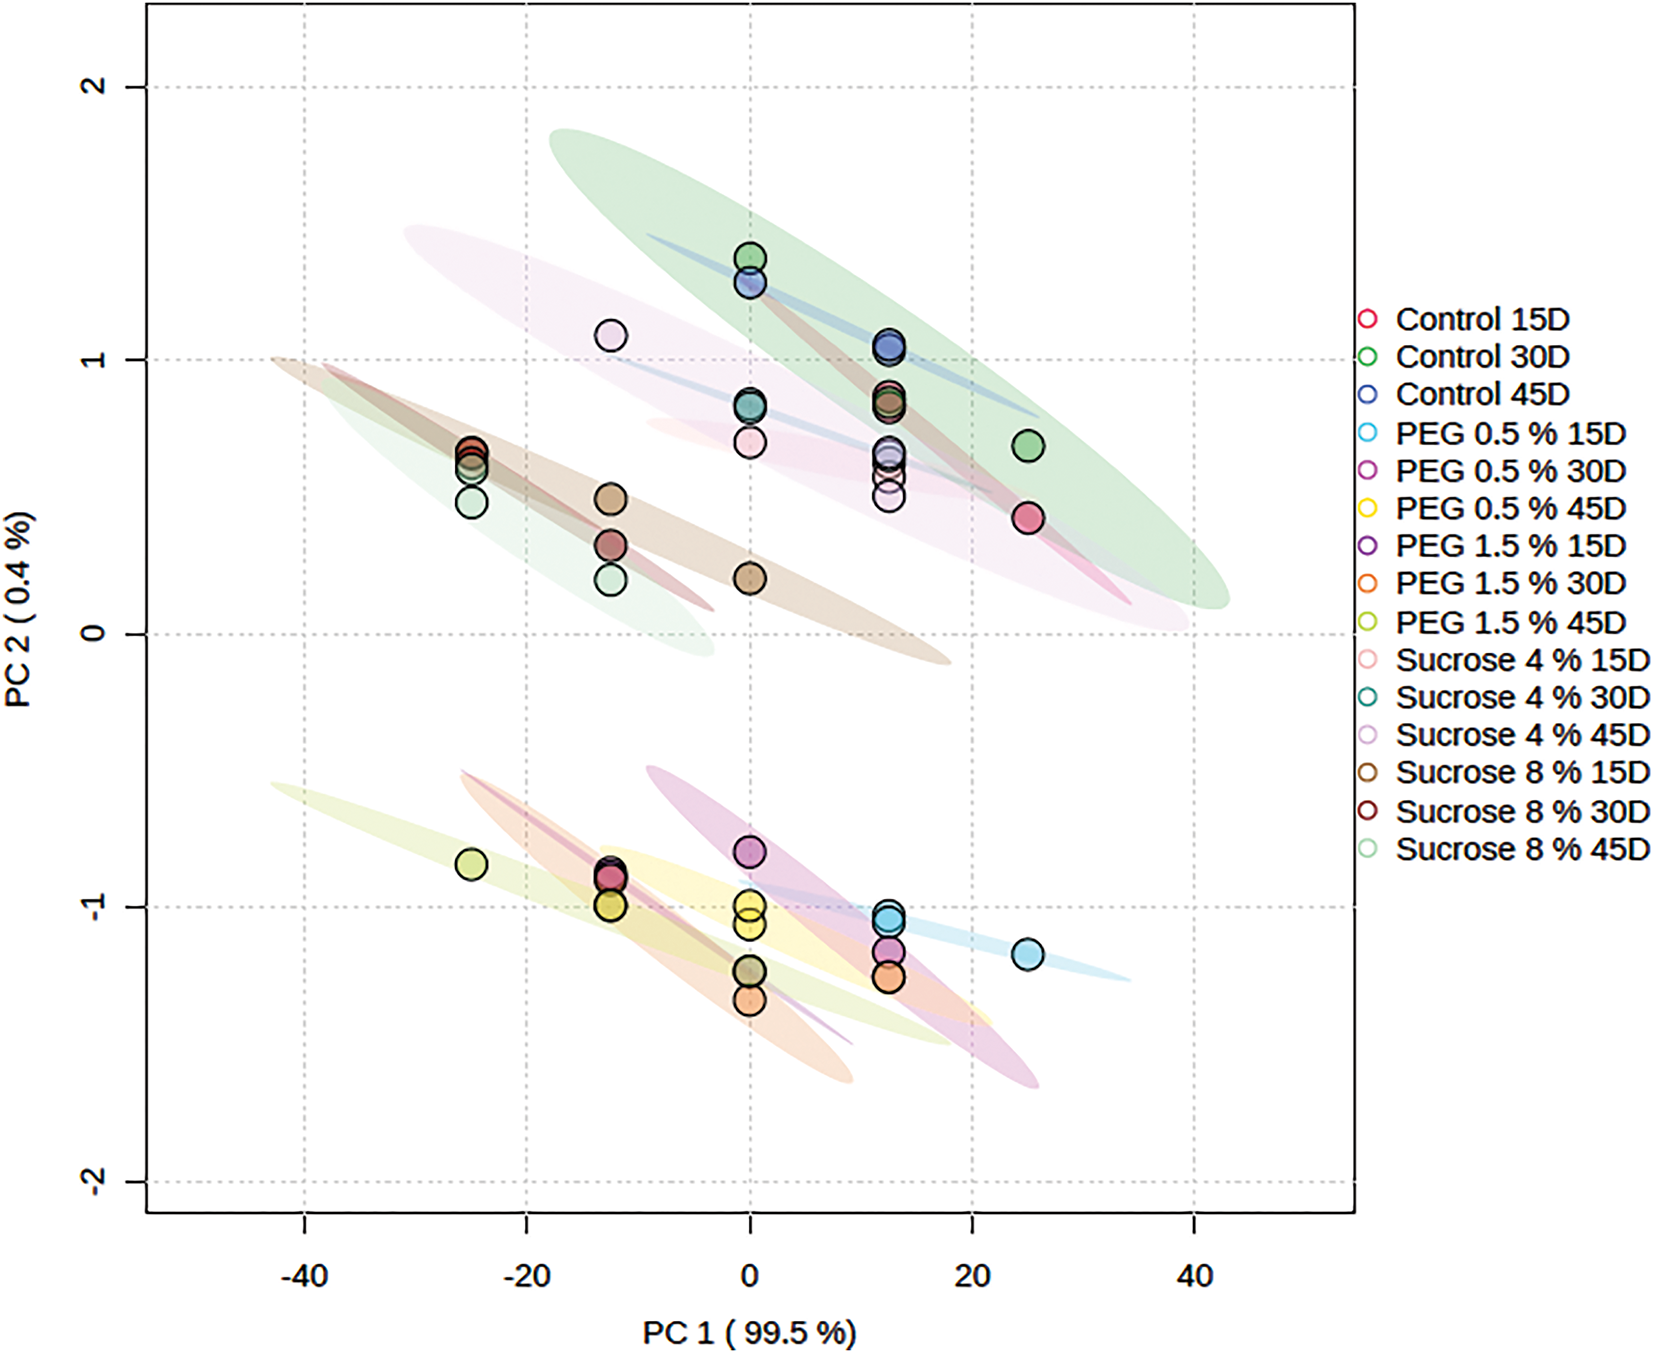
Figure 5: Principal component analysis of studied variables (survival %, length of the shoot, dry and fresh weight) and biochemical metrics (phenolic content (TOC), total soluble sugars (TSS), protein content (TPC) and chlorophyll a and b content) from the in vitro culture of G. wallichianum in reaction to various PEG and sucrose treatments
3.8 Heatmap and Hierarchical Clustering
Heatmap hierarchical clustering was done to define the trait–treatment association (Fig. 6). The treatments were positioned along the X-axis, while the Y-axis displayed the survival rate as well as physiological and biochemical parameters (Fig. 6). The treatments were categorized into two main groups, A and B, each of which was categorized into five smaller groups, numbered 1 to 5 (Fig. 6). The survival rate, and physiological and biochemical parameters under investigation were organized into two primary clusters, which were further sub-grouped into three sub-clusters numbered 1 through 3 (Fig. 6). The results of parameter clustering indicated a distinct separation between the sucrose and PEG samples in comparison to the control group. Both the 0.5% and 1.5% PEG concentrations dramatically decreased the growth attributes compared to the 4% and 8% sucrose concentrations, yet the low concentrations showed a very good survival rate. The in vitro cultivated nodal segments may have been experiencing osmotic stress because PEG treatment led to increased levels of soluble sugars and total phenolics compared to sucrose treatment, accompanied by a decrease in protein and chlorophyll levels.
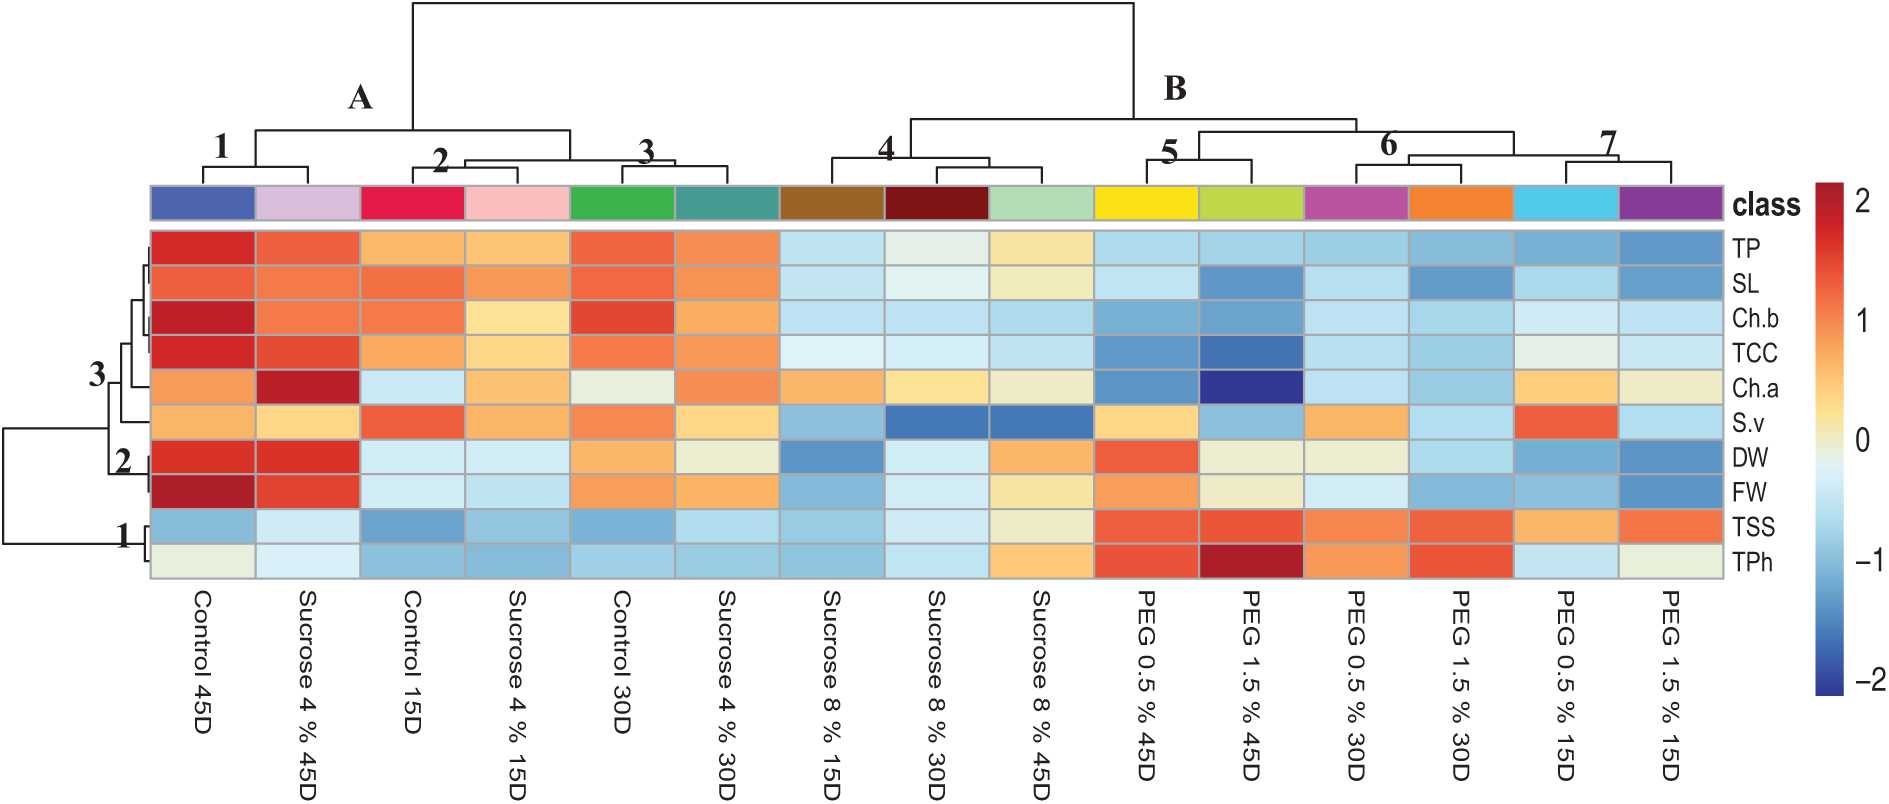
Figure 6: Hierarchical clustering and heatmap of investigated physiological parameters survival rate % (SR), dry weight (DW), fresh weight (FW) and shoot length (SL), alongside biochemical metrics (total soluble sugars (TSS), protein content (TPC), phenolic content (TPh), total chlorophyll (TCC) and chlorophyll a and b contents) from the in vitro culture of G. wallichianum in response to various treatments of sucrose and PEG at 15, 30, and 35 days. Red and blue shades represent strong and weak associations, respectively, between treatments and investigated parameters
G. wallichianum is at risk of extinction in northern Pakistan due to overharvesting for its medicinal properties. Ex situ conservation methods have been employed to study various endangered plants [40], but knowledge of this species’ protection remains limited. The results suggest that osmotic stress inducers can effectively inhibit the growth of nodal explants temporarily, offering the potential for long-term in vitro preservation.
In this study, osmotic stress was induced using PEG and sucrose, both of which decreased the nodal explants’ growth rate along with their fresh and dry weights. Notably, these reductions were consistent across various day intervals (15, 30, and 45 days), aligning with findings by Sakthivelu et al. [41]. Growth rate and fresh and dry weight were markedly lower at PEG concentrations of 0.5% and 1.5% compared to sucrose levels of 4% and 8%. This decline can be attributed to a significant rise in osmotic pressure in the medium, diminishing nutrient and water absorption by reducing turgor pressure and severely inhibiting cell elongation. A comparison between PEG and sucrose suggests that PEG exerts a stronger impact on G. wallichianum growth compared to sucrose. Comparable findings have been reported for Lathyrus sativus [42], Milk thistle [43], and several durum wheat varieties [44]. Razavizadeh et al. [45] indicated that incorporating PEG into the culture medium triggered osmotic stress in Thymus vulgaris explants. This stress led to reduced fresh weight and explant length, mirroring observations in other plants exposed to drought conditions. Similar trends have also been documented in studies on various aromatic plants [46–48]. Stressed plants often exhibit decreased growth traits, such as weight and height, which may result from changes in their metabolic processes [49]. Research indicates that plants adjust their physiological, anatomical, and morphological traits to improve stress tolerance triggered by PEG. Similarly, G. wallichianum decreased its entire biomass to conserve energy and enhance water absorption, as observed in this research. The reduced fresh weight during drought conditions can be linked to a marked decline in canopy structure, photosynthesis, and phytohormones that regulate stomatal closure, leading to reduced transpiration and lower carbon assimilation [49,50]. Its in vitro application has been effective to controlling the in vitro growth of plants [51].
Hessini et al. [52] proposed that higher levels of total soluble sugars in plants may enhance stress tolerance. Plants’ ability to manage osmotic balance and water regulation during stress conditions leads to the build-up of various nutrients, including organic acids, proline alcohols, soluble sugars, and glycine betaine. Increased water pressure could elevate the soluble sugars in different plant species [53]. Soluble sugars primarily serve to sustain turgor pressure and boost their concentration, which enhances starch breakdown through the action of hydrolytic enzymes during stress [54]. Additional stress factors comprise producing non-photosynthetic sugars, decreased leaf transport, and elevated sugar levels in leaves during water stress [55]. According to Ramak et al. [56], sugar accumulation within the stressed plant’s shoots intensifies drought impact through maintaining osmotic balance and preventing dissociation, as observed in Onobrychis goneifoli and O. radiate. Kumari et al. [57] reported comparable outcomes for medical plants like Sinopodophyllum hexandrum, as well as in beans studied by Subbarao et al. [58], and soybeans by Niakan et al. [59] and Rikan et al. [60]. Our research confirms these outcomes, showing markedly elevated soluble sugars in PEG-treated G. wallichianum relative to the control. During osmotic stress, the elevated levels of entire soluble sugars may be attributed to the interruption of starch and the activity of amylase [61]. The build-up of sugars and osmotic regulators helps regulate growth under stress via reducing reactive oxygen species (ROS) through a reinforced antioxidant system [62,63]. This study found an increase in soluble sugars during osmotic stress, likely resulting from elevated fructose and glucose from the enhanced sucrose and starch hydrolysis. Soluble sugars also serve other vital roles, including an energy source and osmotic protectors, helping plants withstand stress.
Phenolic compounds are crucial in maintaining osmotic balance and notably build-up during osmotic stress [64], as seen in this study. The phenolic content in plants contributes to their stress tolerance. Citrus sinensis exhibited a notable rise in antioxidant activity and phenolic content [65]. Razavizadeh et al. [45] reported that PEG treatment in T. vulgaris cultures significantly affected phenolic compound production, as these compounds are vital for plant defense. It is suggested that stress conditions may stimulate phenolic biosynthesis because of oxidative stress [66]. Additionally, Zhuang et al. [67] noticed a significant association between 1,1-diphenyl-2-picrylhydrazine and phenolics, and among total phenolics and antioxidant activity or reducing iron. In our study, explants exhibited the highest phenolic levels upon treatment with both PEG (0.5% and 1.5%) concentrations, in comparison with sucrose treatments. The notable build-up of phenolics may serve as a defensive mechanism, helping to maintain stable levels of stable protein and ROS.
Chlorophyll accumulation in plant tissues serves as a reliable marker for the detrimental impacts of various stressors. Intense stress leads to the build-up of hydrogen peroxide, which may result in a reduction of protein and chlorophyll levels. Additionally, stress can trigger the breakdown of chloroplast structure by activating chlorophyllase [68]. The decline in chlorophyll levels may be linked to heightened enzyme activity or damage to the plastid envelope and thylakoids caused by ROS. Stressed plants tend to produce less chlorophyll, a sign of oxidative stress. As a result, the disruption of ion balance limits chlorophyll synthesis, leading to a declined chlorophyll concentration and metabolism [69]. In our study, explant cultures treated with PEG (0.5% and 1.5%) showed a marked reduction in chlorophyll compared to those treated with sucrose (4% and 8%). Moreover, Tátrai et al. [70] reported that PEG supplementation into the culture media led to the generation of ROS, which contributed to chlorophyll degradation through lipid peroxidation. It has also been demonstrated that PEG enrichment negatively impacts the in vitro cultures’ physiological, phytochemical, and morphological features, including Tagetes erecta seedlings [71], Hordeum vulgare [72], and Allium hirtifolium [73].
According to Sobhkhizi et al. [74] stress affects chlorophyll a and b in nodal cultures by triggering proteolysis of chloroplasts, leading to the degradation of chlorophyll, a key factor. Water stress is accompanied by reduced chlorophyll levels in plants like Carthamus tinctoriu s [75], Paulownia imperialis [76], and beans [77]. As per Martínez-Santos et al. [49], higher PEG levels reduced the chlorophyll levels in the shoots of Vanilla planifolia. Similarly, in an in vitro Orchidaceae culture, Gao et al. [48] noticed reduced chlorophyll levels in Dendrobium officinale shoots treated with 0%, 1%, 3%, and 5% PEG. Suis et al. [78] observed that exposing Aranda Broga Blue Bell protocorm-like bodies to PEG (15%) led to decreased chlorophyll levels. Ex vivo research has indicated decreased chlorophyll levels in V. planifolia exposed to osmotic stress [79]. Osmotic stress impairs the efficiency of photosynthesis by disrupting the flow of energy between photosystem I (PSI) and photosystem II (PSII) [80].
In our study, cultures treated with PEG (0.5% and 1.5%) showed lowered protein levels compared to those exposed to sucrose. Previous research has indicated that PEG treatment decreases the soluble protein levels in Vigna unguiculata and several Nicotiana tabacum species [81]. PEG triggers oxidative stress in plants, leading to damage to membranes and active proteins, thereby reducing the total protein content in G. wallichianum. As per Martínez-Santos et al. [49] findings, as PEG concentration increased, soluble protein levels in V. planifolia shoots declined, though protein levels were still elevated in PEG treatments compared to controls. The increased soluble proteins at 1% PEG can be attributed to the production of hydrophilins [82], aquaporins [83], dehydrins [84], antioxidant enzymes [85], and chaperonin [86],which help plants manage oxidative and osmotic stress [87]. In crops like rice [88], legumes [89], soybean leaves [59], and onions [90], a reduction in protein content in shoot tissues is closely linked to rising stress levels. Razavizadeh et al. [45] reported reduced protein levels in seedlings of T. vulgaris exposed to 2%, 4%, 6%, and 8% PEG. Likewise, Gao et al. [48] reported reduced protein levels in D. officinale shoots experiencing osmotic stress from 1%, 3%, and 5% PEG. Our study explored the biochemical and morphological reactions of G. wallichianum nodal cultures to varying sucrose and PEG concentrations within a short duration (45 days). Growth analysis showed that lower sucrose (4%) and PEG (0.5%) concentrations did not adversely affect growth, while higher PEG levels notably inhibit growth compared to the control. However, the current research work focused on short-term control of the in vitro growth of G. wallichianum, which can be considered its limitation. Therefore, this research could be expanded to assess the long-term osmotic stressors’ impacts on the in vitro preservation of medicinal plants with slow growth.
Our study attempts to develop a strategy for in vitro conservation by slowing down the G. wallichianum growth in a regulated setting utilizing osmotic stress agents like PEG and sucrose in response to the threat of its extinction from overharvesting and utilization. PEG concentrations (0.1% and 0.5%) significantly reduced morphological growth attributes relative to sucrose (4% and 8%). PEG treatments increased the amounts of soluble sugars and total phenolics compared to the sucrose treatment which confirms its stress inducer role. Following this, there was a decline in chlorophyll and total protein levels, indicating that the nodal segments cultured in the lab were experiencing osmotic stress. The findings revealed that PEG is more useful in reducing G. wallichianum in vitro growth than sucrose. However, there is a need to explore further the role of PEG and sucrose on long-term in vitro growth and conservation of G. wallichianum, which can be extended to other medicinally important plants.
Acknowledgement: The authors wish to express their sincere gratitude to the Deanship of Scientific Research and the Vice Presidency for Graduate Studies and Scientific Research at King Faisal University, Saudi Arabia, for their support of this project through grant number KFU242733.
Funding Statement: This work was financially supported by the Deanship of Scientific Research, Vice Presidency for Graduate Studies and Scientific Research, King Faisal University, Saudi Arabia, grant number KFU242733.
Author Contributions: Conceptualization: Zubair Ashraf and Yasar Sajjad; Methodology: Zubair Ashraf; Formal analysis and investigation: Sabaz Ali Khan and Gulzar Akhtar; Writing—preparation of the original draft: Yasar Sajjad, Zubair Ashraf, Ahmed Mahmoud Ismail and Tarek A. Shalaby; Writing—review and editing: Yasar Sajjad, Bader Alsubaie and Othman Al-Dossary; Funding acquisition: Ahmed Mahmoud Ismail; Resources: Zubair Ashraf; Supervision: Yasar Sajjad. All authors reviewed the results and approved the final version of the manuscript.
Availability of Data and Materials: Available data are provided in the manuscript.
Ethics Approval: Not applicable.
Conflicts of Interest: The authors declare no conflicts of interest to report regarding the present study.
References
1. SharifAA, Asif H, Younis W, Riaz H, Ishfaq AB, Assiri AM. Indigenous medicinal plants of Pakistan used to treat skin diseases: a review.Chin Med. 2018;13(1):52–78. doi:10.1186/s13020-018-0210-0. [Google Scholar] [PubMed] [CrossRef]
2. Islam F, Bibi S, Meem AFK, Islam MM, Rahaman MS, Bepary S, et al. Natural bioactive molecules: an alternative approach to the treatment and control of COVID-19. Int J Mol Sci. 2021;22(23):12638. doi:10.3390/ijms222312638. [Google Scholar] [PubMed] [CrossRef]
3. Jamshidi-Kia F, Lorigooini Z, Amini-Khoei H. Medicinal plants: past history and future perspective. J Herbmed Pharmacol. 2018;7(1):1–7. doi:10.15171/jhp.2018.01. [Google Scholar] [CrossRef]
4. Bano A, Ahmad M, Ben Hadda T, Saboor A, Sultana S, Zafar M, et al. Quantitative ethnomedicinal study of plants used in the skardu valley at high altitude of Karakoram-Himalayan range, Pakistan. J Ethnobiol Ethnomed. 2014;10(1):43. doi:10.1186/1746-4269-10-43. [Google Scholar] [PubMed] [CrossRef]
5. Asad U, Abdur R. Conservation status of threatened medicinal plants of Mankial Valley Hindukush Range, Pakistan. Int J Biodivers Conserv. 2014;6(1):59–70. doi:10.5897/IJBC2012.123. [Google Scholar] [CrossRef]
6. Razzaq A, Hadi F, Rashid A, Ibrar M, Ali U. Exploration of medicinal plants and their conservation status at higher altitude of district shangla, khyber pakhtunkhwa, Pakistan. American-Eurasian J Agric Environ Sci. 2015;15(3):328–31. doi:10.5829/idosi.aejaes.2015.15.3.12542. [Google Scholar] [CrossRef]
7. Ishtiaq M, Maqbool M, Ajaib M, Ahmed M, Hussain I, Khanam H, et al. Ethnomedicinal and folklore inventory of wild plants used by rural communities of valley Samahni, District Bhimber Azad Jammu and Kashmir, Pakistan. PLoS One. 2021;16(1):e0243151. doi:10.1371/journal.pone.0243151. [Google Scholar] [PubMed] [CrossRef]
8. Malik S, Ahmad S, Sadiq A, Alam K, Wariss HM, Ahmad I, et al. A comparative ethno-botanical study of Cholistan (an arid area) and Pothwar (a semi-arid area) of Pakistan for traditional medicines. J Ethnobiol Ethnomed. 2015;11(1):31. doi:10.1186/s13002-015-0018-2. [Google Scholar] [PubMed] [CrossRef]
9. Vikram SR. Indigenous uses of medicinal and edible plants of Nanda Devi biosphere reserve-a review based on previous studies. Glob J Res Med Plants Indig Med. 2014;3(2):57. [Google Scholar]
10. Ahmad KS, Qureshi R, Hameed M, Ahmad F, Nawaz T. Conservation assessment and medicinal importance of some plants resources from Sharda, Neelum valley, Azad Jammu and Kashmir, Pakistan. Int J Agric Biol. 2012;14(6):997–1000. [Google Scholar]
11. Shaheen S, Bibi Y, Hussain M, Iqbal M, Saira H, Safdar I, et al. A review on Geranium wallichianum D-don ex-sweet: an endangered medicinal herb from Himalaya region. Med Aromat Plants. 2017;6(2):288–93. doi:10.4172/2167-0412.1000288. [Google Scholar] [CrossRef]
12. Agrawal A, Singh S, Malhotra EV, Meena DPS, Tyagi RK. In vitro conservation and cryopreservation of clonally propagated horticultural species. In: Conservation and utilization of horticultural genetic resources. Singapore: Springer; 2019. p. 529–78. doi:10.1007/978-981-13-3669-0_18. [Google Scholar] [CrossRef]
13. Kulak V, Longboat S, Brunet ND, Shukla M, Saxena P. In vitro technology in plant conservation: Relevance to biocultural diversity. Plants. 2022;11(4):503. doi:10.3390/plants11040503. [Google Scholar] [CrossRef]
14. Gupta N, Jain V, Joseph MR, Devi S. A review on micropropagation culture method. Asian J Pharm Res Dev. 2020;8(1):86–93. doi:10.22270/ajprd.v8i1.653. [Google Scholar] [CrossRef]
15. Murashige T, Skoog F. A revised medium for rapid growth and bio assays with tobacco tissue cultures. Physiol Plant. 1962;15(3):473–97. doi:10.1111/j.1399-3054.1962.tb08052.x. [Google Scholar] [CrossRef]
16. Gopal J, Sukh Chauhan N. Slow growth in vitro conservation of potato germplasm at low temperature. Potato Res. 2010;53(3):141–9. doi:10.1007/s11540-010-9158-x. [Google Scholar] [CrossRef]
17. Uzundzhalieva K, Ruseva R, Kachakova S. Ex situ and in vitro conservation of Glicyrrhiza glabra L.—crop wild relative from Fabaceae. Ecologia Balkanica. 2014;5:9–13. [Google Scholar]
18. Dube P, Gangopadhyay M, Dewanjee S, Ali MN. Establishment of a rapid multiplication protocol of Coleus forskohlii Briq. and in vitro conservation by reduced growth. Indian J Biotechnol. 2011;10(2):228–31. [Google Scholar]
19. Hammond Hammond SD, Viehmannova I, Zamecnik J, Panis B, Hlasna Cepkova P. Efficient slow-growth conservation and assessment of clonal fidelity of Ullucus tuberosus Caldas microshoots. Plant Cell Tissue Organ Cult PCTOC. 2019;138(3):559–70. doi:10.1007/s11240-019-01653-z. [Google Scholar] [CrossRef]
20. Attia AO, Dessoky EDS, Al-Sodany YM, Ismail IA. Ex situ preservation for some endemic and rare medicinal plants in Taif. KSA Biotechnol Biotechnol Equip. 2017;31(5):912–20. doi:10.1080/13102818.2017.1356690. [Google Scholar] [CrossRef]
21. Dewi IS, Jawak G, Roostika I, Sabda M, Purwoko BS, Adil WH. Konservasi in vitro tanaman jeruk besar (Citrus maxima (burm.) merr.) kultivar srinyonya menggunakan osmotikum Dan retardan. J AgroBiogen. 2016;6(2):84–90. doi:10.21082/jbio.v6n2.2010.p84-90. [Google Scholar] [CrossRef]
22. Rodrigues PHV, Oliveira EL, Demetrio CA, Ambrosano GB, Piedade SMS. Effects of different light spectra on the slow-grown in vitro storage and quality of banana plantlets cv. Prata Catarina (AAB). Plant Cell Tissue Organ Cult. 2022;150(2):479–85. doi:10.1007/s11240-022-02280-x. [Google Scholar] [CrossRef]
23. Hassanen SA. In vitro preservation by encapsulation of shoot tips of Aerva lanata (L.) Juss. ex Schult. as a rare medicinal plant. Int J Res Agric Sci. 2021;8(3):2348–3997. [Google Scholar]
24. BudiartoK, RahardjoIB,Hanudin WN. In vitro storage of two Lilies accessions through modification of culture media. J Agro. 2020;7:1–13. doi:10.15575/4179. [Google Scholar] [CrossRef]
25. Syahid SF. In vitro conservation of medicinal plant St. John’s wort (Hypericum perforatum L.) through dilution of basic medium. AGROSCRIPT J Appl Agric Sci. 2021;3(1):11–8. doi:10.36423/agroscript.v3i1.589. [Google Scholar] [CrossRef]
26. Syahid SF, Palindung LS. In vitro conservation of Valeriana officinalis L. through minimal growth. E3S Web Conf. 2023;373:03025. doi:10.1051/e3sconf/202337303025. [Google Scholar] [CrossRef]
27. Benelli C, Tarraf W, Izgu T, De Carlo A. In vitro conservation through slow growth storage technique of fruit species: an overview of the last 10 years. Plants. 2022;11(23):3188. doi:10.3390/plants11233188. [Google Scholar] [PubMed] [CrossRef]
28. Dubois M, Inzé D. Plant growth under suboptimal water conditions: early responses and methods to study them. J Exp Bot. 2020;71(5):1706–22. doi:10.1093/jxb/eraa037. [Google Scholar] [PubMed] [CrossRef]
29. Gago J, Martínez-Núñez L, Landín M, Flexas J, Gallego PP. Modeling the effects of light and sucrose on in vitro propagated plants: a multiscale system analysis using artificial intelligence technology. PLoS One. 2014;9(1):e85989. doi:10.1371/journal.pone.0085989. [Google Scholar] [PubMed] [CrossRef]
30. Sanghamitra P, Samantaray S, Bagchi TB, Mandal BB. Conservation of medicinal yam in vitro: effect of ionic strength, sucrose, mannitol, ABA and low temperature. Ind Jour Hort. 2019;76(4):701. doi:10.5958/0974-0112.2019.00110.5. [Google Scholar] [CrossRef]
31. Akte J, Yasmin S, Bhuiyan M, Khatun F, Roy J, Goswami K. In vitro screening of rice genotypes using polyethylene glycol under drought stress. Progress Agric. 2016;27(2):128–35. doi:10.3329/pa.v27i2.29321. [Google Scholar] [CrossRef]
32. Munir M, Iqbal S, Baloch JUD, Khakwani AA. In vitro explant sterilization and bud initiation studies of four strawberry cultivars. J Appl Hortic. 2015;17(3):192–8. doi:10.37855/jah.2015.v17i03.36. [Google Scholar] [CrossRef]
33. Riazi A, Matsuda K, Arslan A. Water-stress induced changes in concentrations of proline and other solutes in growing regions of young barley leaves. J Exp Bot. 1985;36(11):1716–25. doi:10.1093/jxb/36.11.1716. [Google Scholar] [CrossRef]
34. Ainsworth EA, Gillespie KM. Estimation of total phenolic content and other oxidation substrates in plant tissues using Folin-Ciocalteu reagent. Nat Protoc. 2007;2(4):875–7. doi:10.1038/nprot.2007.102. [Google Scholar] [PubMed] [CrossRef]
35. Gill SS, Tuteja N. Polyamines and abiotic stress tolerance in plants. Plant Signal Behav. 2010;5(1):26–33. doi:10.4161/psb.5.1.10291. [Google Scholar] [PubMed] [CrossRef]
36. Vicas SI, Cavalu S, Laslo V, Tocai M, Costea TO, Moldovan L. Growth, photosynthetic pigments, phenolic, glucosinolates content and antioxidant capacity of broccoli sprouts in response to nanoselenium particles supply. Not Bot Horti Agrobo. 2019;47(3):821–8. doi:10.15835/nbha47311490. [Google Scholar] [CrossRef]
37. Lichtenthaler HK. Chlorophylls and carotenoids: pigments of photosynthetic biomembranes. Methods Enzymol. 1987;148:350–82. doi:10.1016/0076-6879(87)48036-1. [Google Scholar] [CrossRef]
38. Arnon DI. Copper enzymes in isolated chloroplasts. Polyphenoloxidase in Beta vulgaris. Plant Physiol. 1949;24(1):1–15. doi:10.1104/pp.24.1.1. [Google Scholar] [PubMed] [CrossRef]
39. Bradford MM. A rapid and sensitive method for the quantitation of microgram quantities of protein utilizing the principle of protein-dye binding. Anal Biochem. 1976;72(1–2):248–54. doi:10.1016/0003-2697(76)90527-3. [Google Scholar] [PubMed] [CrossRef]
40. Rodrigues V, Kumar A, Gokul S, Verma RS, Rahman LU, Sundaresan V. Micropropagation, encapsulation, and conservation of Decalepis salicifolia, a vanillin isomer containing medicinal and aromatic plant. Vitro Cell Dev Biol Plant. 2020;56(4):526–37. doi:10.1007/s11627-020-10066-z. [Google Scholar] [CrossRef]
41. Sakthivelu G, Devi MKA, Giridhar P, Rajasekaran T, Ravishankar GA, Nedev T, et al. Drought-induced alterations in growth, osmotic potential and in vitro regeneration of soybean cultivars. Gen Appl Plant Physiol. 2008;34 (1–2):103–12. [Google Scholar]
42. Piwowarczyk B, Kamińska I, Rybiński W. Influence of PEG generated osmotic stress on shoot regeneration and some biochemical parameters in Lathyrus culture. Czech J Genet Plant Breed. 2014;50(2):77–83. doi:10.17221/110/2013-cjgpb. [Google Scholar] [CrossRef]
43. Bekheet SA, Gabr A, Reda A, El Bahr MK. Micropropagation and assessment of genetic stability of in vitro raised jojoba (Simmondsia chinensis link.) plants using SCoT and ISSR markers. Plant Tissue Cult Biotech. 2016;25(2):165–79. doi:10.3329/ptcb.v25i2.26252. [Google Scholar] [CrossRef]
44. Bouiamrine E, Diouri M. Response of durum wheat (Triticum durum Desf.) callus culture to osmosisinduced drought stress caused by polyethylene glycol (PEG). Ann Biol Res. 2014;3(9):4555–63. [Google Scholar]
45. Razavizadeh R, Farahzadianpoor F, Adabavazeh F, Komatsu S. Physiological and morphological analyses of Thymus vulgaris L. in vitro cultures under polyethylene glycol (PEG)-induced osmotic stress. Vitro Cell Dev Biol Plant. 2019;55(3):342–57. doi:10.1007/s11627-019-09979-1. [Google Scholar] [CrossRef]
46. Bettaieb I, Zakhama N, Wannes WA, Kchouk ME, Marzouk B. Water deficit effects on Salvia officinalis fatty acids and essential oils composition. Sci Hortic. 2009;120(2):271–5. doi:10.1016/j.scienta.2008.10.016. [Google Scholar] [CrossRef]
47. Lutts S, Almansouri M, Kinet JM. Salinity and water stress have contrasting effects on the relationship between growth and cell viability during and after stress exposure in durum wheat callus. Plant Sci. 2004;167(1):9–18. doi:10.1016/j.plantsci.2004.02.014. [Google Scholar] [CrossRef]
48. Gao H, Xu D, Zhang H, Cheng X, Yang Q. Effects of culture medium composition and PEG on hyperhydricity in Dendrobium officinale. Vitro Cell Dev Biol Plant. 2020;56(2):143–9. doi:10.1007/s11627-020-10075-y. [Google Scholar] [CrossRef]
49. Martínez-Santos E, Cruz-Cruz CA, Spinoso-Castillo JL, Bello-Bello JJ. In vitro response of Vanilla (Vanilla planifolia Jacks. ex Andrews) to PEG-induced osmotic stress. Sci Rep. 2021;11(1):22611. doi:10.1038/s41598-021-02207-0. [Google Scholar] [PubMed] [CrossRef]
50. Shao HB, Chu LY, Jaleel CA, Zhao CX. Water-deficit stress-induced anatomical changes in higher plants. C R Biol. 2008;331(3):215–25. doi:10.1016/j.crvi.2008.01.002. [Google Scholar] [PubMed] [CrossRef]
51. Al-Khayri JM, Al-Bahrany AM. Growth, water content, and proline accumulation in drought-stressed callus of date palm. Biologia Plant. 2004;48(1):105–8. doi:10.1023/b:biop.0000024283.74919.4c. [Google Scholar] [CrossRef]
52. Hessini K, Martínez JP, Gandour M, Albouchi A, Soltani A, Abdelly C. Effect of water stress on growth, osmotic adjustment, cell wall elasticity and water-use efficiency in Spartina alterniflora. Environ Exp Bot. 2009;67(2):312–9. doi:10.1016/j.envexpbot.2009.06.010. [Google Scholar] [CrossRef]
53. Hernandez JO, An JY, Combalicer MS, Chun JP, Oh SK, Park BB. Morpho-anatomical traits and soluble sugar concentration largely explain the responses of three deciduous tree species to progressive water stress. Front Plant Sci. 2021;12:738301. doi:10.3389/fpls.2021.738301. [Google Scholar] [PubMed] [CrossRef]
54. Bartels D, Sunkar R. Drought and salt tolerance in plants. Crit Rev Plant Sci. 2005;24(1):23–58. doi:10.1080/07352680590910410. [Google Scholar] [CrossRef]
55. Hu MY, Li H, Zhang YJ, Liu Q. Photosynthesis and related physiological characteristics affected by exogenous glucose in wheat seedlings under water stress. Acta Agron Sin. 2009;35(4):724–32. (In Chinese). doi:10.3724/SP.J.1006.2009.00724. [Google Scholar] [CrossRef]
56. Ramak P, Khavari-Nejad R, Heidary Sharifabad H, Rafiei M. The effect of water deficient stress on total non-stractural carbohydrates in Onobrychis radiata and Onobrychis viciifolia. Iranian J Rangelands Plant Breed Genet Res. 2004;12(3):317–26. doi:10.22092/ijrfpbgr.2004.115416. [Google Scholar] [CrossRef]
57. Kumari A, Dogra V, Joshi R, Kumar S. Stress-responsive cis-regulatory elements underline podophyllotoxin biosynthesis and better performance of Sinopodophyllum hexandrum under water deficit conditions. Front Plant Sci. 2022;12:751846. doi:10.3389/fpls.2021.751846. [Google Scholar] [PubMed] [CrossRef]
58. Subbarao GV, Nam NH, Chauhan YS, Johansen C. Osmotic adjustment, water relations and carbohydrate remobilization in pigeonpea under water deficits. J Plant Physiol. 2000;157(6):651–9. doi:10.1016/S0176-1617(00)80008-5. [Google Scholar] [CrossRef]
59. Niakan M, Ghorbanli M. The effect of drought stress on growth, photosynthetic factors, content of protein, Na and K content in two cultivars of soybean. Rostaniha. 2007;8(1):4–7. [Google Scholar]
60. Rikan MH, Reza H, Jameei R. Evaluation of resistance for drought and salinity in four barley (Hordeum vulgaris L.) cultivars in germination stage. Pajouhesh Sazandegi. 2007;20(174):134–42. [Google Scholar]
61. Villadsen D, Rung JH, Nielsen TH. Osmotic stress changes carbohydrate partitioning and fructose-2, 6-bisphosphate metabolism in barley leaves. Funct Plant Biol. 2005;32(11):1033–43. doi:10.1071/FP05102. [Google Scholar] [PubMed] [CrossRef]
62. Ahanger MA, Tomar NS, Tittal M, Argal S, Agarwal RM. Plant growth under water/salt stress: ros production; antioxidants and significance of added potassium under such conditions. Physiol Mol Biol Plants. 2017;23(4):731–44. doi:10.1007/s12298-017-0462-7. [Google Scholar] [PubMed] [CrossRef]
63. Keunen E, Peshev D, Vangronsveld J, Van Den Ende W, Cuypers A. Plant sugars are crucial players in the oxidative challenge during abiotic stress: extending the traditional concept. Plant Cell Environ. 2013;36(7):1242–55. doi:10.1111/pce.12061. [Google Scholar] [PubMed] [CrossRef]
64. Minocha R, Majumdar R, Minocha SC. Polyamines and abiotic stress in plants: a complex relationship. Front Plant Sci. 2014;5(5):175. doi:10.3389/fpls.2014.00175. [Google Scholar] [PubMed] [CrossRef]
65. Huang R, Xia R, Lu Y, Hu L, Xu Y. Effect of pre-harvest salicylic acid spray treatment on post-harvest antioxidant in the pulp and peel of ‘Cara cara’ navel orange (Citrus sinenisis L. Osbeck). J Sci Food Agric. 2008;88(2):229–36. doi:10.1002/jsfa.3076. [Google Scholar] [CrossRef]
66. Karuppusamy S. A review on trends in production of secondary metabolites from higher plants by in vitro tissue, organ and cell cultures. J Med Plants Res. 2009;3(13):1222–39. [Google Scholar]
67. Zhuang H, Du J, Wang Y. Antioxidant capacity changes of 3 cultivar Chinese pomegranate (Punica granatum L.) juices and corresponding wines. J Food Sci. 2011;76(4):C606–11. doi:10.1111/j.1750-3841.2011.02149.x. [Google Scholar] [PubMed] [CrossRef]
68. Noreen S, Ashraf M, Hussain M, Jamil A. Exogenous application of salicylic acid enhances antioxidative capacity in salt-stressed sunflower (Helianthus annuus L.) plants. Pak J Bot. 2009;41(1):473–9. [Google Scholar]
69. Siddiqi KS, Husen A. Significance of brassinosteroids and their derivatives in the development and protection of plants under abiotic stress. Biologia. 2021;76(10):2837–57. doi:10.1007/s11756-021-00853-3. [Google Scholar] [CrossRef]
70. Tátrai ZA, Sanoubar R, Pluhár Z, Mancarella S, Orsini F, Gianquinto G. Morphological and physiological plant responses to drought stress in Thymus citriodorus. Int J Agron. 2016;2016(10):4165750. doi:10.1155/2016/4165750. [Google Scholar] [CrossRef]
71. Liao WB, Huang GB, Yu JH, Zhang ML. Nitric oxide and hydrogen peroxide alleviate drought stress in marigold explants and promote its adventitious root development. Plant Physiol Biochem. 2012;58:6–15. doi:10.1016/j.plaphy.2012.06.012. [Google Scholar] [PubMed] [CrossRef]
72. Hellal FA, El-Shabrawi HM, Abd El-Hady M, Khatab IA, El-Sayed SA, Abdelly C. Influence of PEG induced drought stress on molecular and biochemical constituents and seedling growth of Egyptian barley cultivars. J Genet Eng Biotechnol. 2018;16(1):203–12. doi:10.1016/j.jgeb.2017.10.009. [Google Scholar] [PubMed] [CrossRef]
73. Ghassemi-Golezani K, Farhadi N, Nikpour-Rashidabad N. Responses of in vitro-cultured Allium hirtifolium to exogenous sodium nitroprusside under PEG-imposed drought stress. Plant Cell Tissue Organ Cult. 2018;133(2):237–48. doi:10.1007/s11240-017-1377-2. [Google Scholar] [CrossRef]
74. Sobhkhizi A, Rayni M, Barzin H, Noori M. Influence of drought stress on photosynthetic enzymes, chlorophyll, protein and relative water content in crop plants. Int J Biosci. 2014;5(7):89–100. doi:10.12692/ijb/5.7.89-100. [Google Scholar] [CrossRef]
75. Siddiqi EH, Ashraf M, Hussain M, Jamil A. Assessment of inter-cultivar variation for salt tolerance in safflower (Carthamus tinctorius L.) using gas exchange characteristics as selection criteria. Pak J Bot. 2009;41(5):2251–9. [Google Scholar]
76. Ayala-Astorga GI, Alcaraz-Meléndez L. Salinity effects on protein content, lipid peroxidation, pigments, and proline in Paulownia imperialis (Siebold & Zuccarini) and Paulownia fortunei (Seemann & Hemsley) grown in vitro. Electron J Biotechnol. 2010;13(5):1–15. doi:10.2225/vol13-issue5-fulltext-13. [Google Scholar] [CrossRef]
77. Beinsan C, Camen D, Sumalan R, Babau M. Study concerning salt stress effect on leaf area dynamics and chlorophyll content in four bean local landraces from Banat area. In: 44th Croatian and 5th International Symposium on Agriculture ; 2003; Croatia. Vol. 119, p. 416–9. [Google Scholar]
78. Suis M, Ping K, Keong C, Subramaniam S. Biochemical and physiological responses to polyethylene glycol (PEG) treatment in protocorm-like bodies (PLBs) of Aranda Broga Blue Bell. Emir J Food Agric. 2015;27(10):776. doi:10.9755/ejfa.2015-04-080. [Google Scholar] [CrossRef]
79. Chandran S, Puthur JT. Assorted response of mutated variants of Vanilla planifolia Andr. towards drought. Acta Physiol Plant. 2009;31(5):1023–9. doi:10.1007/s11738-009-0321-4. [Google Scholar] [CrossRef]
80. Wang W, Wang C, Pan D, Zhang Y, Luo B, Ji J. Effects of drought stress on photosynthesis and chlorophyll fluorescence images of soybean (Glycine max) seedlings. Int J Agric Biol Eng. 2018;11(2):196–201. doi:10.25165/j.ijabe.20181102.3390. [Google Scholar] [CrossRef]
81. Soni P, Rizwan M, Bhatt KV, Mohapatra T, Singh G. In-vitro response of Vigna aconitifolia to drought stress induced by PEG-6000. J Stress Physiol Biochem. 2011;7(3):108–21. [Google Scholar]
82. Battaglia M, Olvera-Carrillo Y, Garciarrubio A, Campos F, Covarrubias AA. The enigmatic LEA proteins and other hydrophilins. Plant Physiol. 2008;148(1):6–24. doi:10.1104/pp.108.120725. [Google Scholar] [PubMed] [CrossRef]
83. Hussain SS, Iqbal MT, Arif MA, Amjad M. Beyond osmolytes and transcription factors: drought tolerance in plants via protective proteins and aquaporins. Biol Plant. 2011;55(3):401–13. doi:10.1007/s10535-011-0091-x. [Google Scholar] [CrossRef]
84. Chiappetta A, Muto A, Bruno L, Woloszynska M, Van Lijsebettens M, Bitonti MB. A dehydrin gene isolated from feral olive enhances drought tolerance in Arabidopsis transgenic plants. Front Plant Sci. 2015;6:392. doi:10.3389/fpls.2015.00392. [Google Scholar] [PubMed] [CrossRef]
85. Sewelam N, Kazan K, Schenk PM. Global plant stress signaling: reactive oxygen species at the cross-road. Front Plant Sci. 2016;7:187. doi:10.3389/fpls.2016.00187. [Google Scholar] [PubMed] [CrossRef]
86. Zia R, Nawaz MS, Siddique MJ, Hakim S, Imran A. Plant survival under drought stress: implications, adaptive responses, and integrated rhizosphere management strategy for stress mitigation. Microbiol Res. 2021;242(2):126626. doi:10.1016/j.micres.2020.126626. [Google Scholar] [PubMed] [CrossRef]
87. Li X, Tang Q, Tang H, Chen W. Identifying antioxidant proteins by combining multiple methods. Front Bioeng Biotechnol. 2020;8:858. doi:10.3389/fbioe.2020.00858. [Google Scholar] [PubMed] [CrossRef]
88. Sikuku P, Netondo G, Onyango J, Musyimi D. Chlorophyll fluorescence, protein and chlorophyll content of three nerica rainfed rice varieties under varying irrigation regimes. J Agric Biol Sci. 2010;5(2):19–25. [Google Scholar]
89. Ashraf M, Foolad M. Pre-sowing seed treatment—a shotgun approach to improve germination, plant growth, and crop yield under saline and non-saline conditions. Adv Agron. 2005;88:223–71. doi:10.1016/S0065-2113(05)88006-X. [Google Scholar] [CrossRef]
90. Arvin M, Kazemipour N. Effects of salinity and drought stresses on growth, chemical and biochemical components in four onion fooding Allium cepa. Iran J Agric Sci. 2001;4(4):41–51. [Google Scholar]
Cite This Article
 Copyright © 2025 The Author(s). Published by Tech Science Press.
This work is licensed under a Creative Commons Attribution 4.0 International License , which permits unrestricted use, distribution, and reproduction in any medium, provided the original work is properly cited.
 Downloads
 Citation Tools