
 Submit a Paper
 Propose a Special lssue
 Open Access
ARTICLE

Enhancing Salt Stress Tolerance in Portulaca oleracea L. Using Ascophyllum nodosum Biostimulant
Department of Biological Sciences, College of Science, University of Jeddah, Jeddah, 21493, Saudi Arabia
* Corresponding Author: Zahra Alhawsa. Email:
(This article belongs to the Special Issue: Abiotic Stress in Agricultural Crops)
Phyton-International Journal of Experimental Botany 2025, 94(4), 1319-1337. https://doi.org/10.32604/phyton.2025.061918
Received 06 December 2024; Accepted 13 March 2025; Issue published 30 April 2025
 View Full Text
 Download PDF
Abstract
Salinity stress is a major constraint on agricultural productivity, particularly in arid and semi-arid regions. This study evaluated the potential of Ascophyllum nodosum extract (ANE) in mitigating salinity-induced stress and enhancing the growth and physiological performance of Portulaca oleracea L. under NaCl concentrations of 0, 50, 70, and 100 mM for 50 days. A two-way ANOVA assessed the effects of NaCl concentration, ANE treatment, and their interaction. The results showed that ANE significantly increased plant height at 50 mM NaCl (p = 0.0011) but had no effect at higher salinity levels (p > 0.05). Shoot dry weight was significantly influenced by the interaction of NaCl and ANE (p = 0.0064), with ANE increasing biomass at 0 mM but decreasing it at 100 mM NaCl. However, ANE did not significantly affect root dry weight (p > 0.05). Physiological responses indicated a significant increase in proline content at 50 mM NaCl (p = 0.0011), supporting improved osmotic adjustment. Total soluble protein was significantly enhanced at all salinity levels except 100 mM NaCl (p < 0.01). Regarding ionic regulation, ANE had no significant effect on leaf sap pH (p > 0.05) but increased electrical conductivity (EC) at 70 and 100 mM NaCl (p < 0.01), suggesting a role in ion homeostasis under high salinity. Photosynthetic pigments responded positively to ANE, with significant increases in chlorophyll “a” (p < 0.0001) and carotenoid content (p < 0.0001), while chlorophyll “b” remained unchanged (p > 0.05). These findings highlight ANE’s potential as a sustainable biostimulant for improving salinity tolerance, particularly at moderate NaCl levels. Future research should focus on molecular mechanisms and long-term field applications to optimize ANE’s role in enhancing soil and crop productivity under salinity stress.Keywords
Salinity currently affects 20%–33% of agricultural and irrigated lands globally, and this impact is projected to rise to over 50% by 2050 [1,2]. Salinity refers to the concentration of dissolved inorganic solutes, such as Na+, Mg++, Ca++, K+, Cl−, SO4−, HCO3−, NO3, and CO3−, in soil and water [3,4]. Halophytes, representing about 1% of the global plant population, are plants that can thrive and reproduce at salinity levels as high as 200 mM NaCl [5]. Salinity stress is among the most critical abiotic factors impacting a plant’s ionic and osmotic balance, leading to various physiological, morphological, molecular, and biochemical changes that adversely affect growth and productivity [6,7].
High soil salinity disrupts nutrient uptake and balance, leading to osmotic stress that causes stomatal closure, reduced CO2 uptake, and impaired photosynthesis. This decline in photosynthetic efficiency is driven by both stomatal and non-stomatal factors, such as reactive oxygen species (ROS) accumulation and ionic imbalances in chloroplasts [8,9]. Soil salinity is commonly measured by electrical conductivity, with values exceeding 4 dS m−1 indicating salinity [10]. Salinity adversely affects plant water potential, ionic balance, and tissue-specific functions, potentially causing toxicity [11]. Effective nutrient and water management are essential for optimal growth, but salinity undermines these efforts, reducing yield and quality [12–14].
Algae-based biostimulants offer viable solutions for ensuring agricultural sustainability [15]. Bonomelli et al. [16] demonstrated that Ascophyllum nodosum extract mitigates salinity stress in avocado by enhancing nutrient uptake and physiological resilience. Similarly, microalgae-cyanobacteria extracts improved tomato growth under salinity by boosting nutrient absorption, photosynthesis, and antioxidant activity [17]. Senousy et al. [18] also showed that algal extracts from Chlorella vulgaris and Dunaliella salina reduced oxidative damage and improved stress tolerance in beans. These findings highlight the effectiveness of algal biostimulants in enhancing salinity resilience across crops.
High-value compounds derived from algae, such as carotenoids and fatty acids, hold significant potential for enhancing plant growth and development. Carotenoids play crucial roles in essential processes like respiration, photosynthesis, and regulating plant responses to stress and pathogen defenses [19]. Similarly, fatty acids, which are essential components of the lipid bilayer in cellular membranes, are vital for coordinating numerous cellular processes critical to plant function [20–22].
The current study underscores the relevance and novelty of investigating Portulaca oleracea L., a moderately salt-tolerant plant with significant nutritional and medicinal value, as a model for evaluating the biostimulant potential of Ascophyllum nodosum extract. While P. oleracea employs inherent mechanisms such as osmotic adjustment and ionic balance to tolerate salinity, high salinity levels still limit its growth and productivity. By analyzing the physiological and biochemical responses of P. oleracea under NaCl-induced stress, this study aims to explore how A. nodosum extract can further enhance its salt stress tolerance. The findings are expected to contribute to broader applications of environmentally friendly biostimulants, offering a sustainable solution to salinity challenges in agriculture.
2.1 Seed Source and Viability Testing
Seeds of Portulaca oleracea L. were procured from the local market in Medina (KSA), as recommended by local farmers. The seeds were tested for viability to ensure uniform and healthy germination. Surface sterilization was performed by rinsing the seeds three times with distilled water to remove any debris or microbial contamination.
2.2 Preparation of Ascophyllum nodosum Extract (ANE)
A biostimulant solution was prepared using ANE, obtained as a dry, pure product imported from Starwest Botanicals Organic Kelp Powder, USDA Organic Kosher Certified by Kosher Certification Services, Item #: 209385-51, Canada. ANE was prepared at a concentration of 2% by mixing 2 g of dried algae powder with 100 mL of distilled water as described by Verma et al. [23]. The mixture was stirred thoroughly and left to stand for 48 h, after which it was filtered through cheesecloth to obtain a clear extract.
2.3 Seed Germination Experiments
Uniform and healthy seeds of Portulaca oleracea L. were used for germination tests in sterilized Petri dishes. The experimental setup included treatments with distilled water (control), three NaCl concentrations (50, 70, and 100 mM), and ANE. For the algae treatment, seeds were pre-soaked in ANE for 24 h before being placed on a double layer of moistened filter paper in the Petri dishes. Fifty seeds were used per treatment, with three replicates per treatment. Germination was carried out under natural light at room temperature, with an average temperature of 32°C (October 2024). After 7 d, the germination rate was calculated as a percentage of seeds germinated per treatment.
Healthy seeds were sown in 12 cm diameter pots filled with sterilized clay loamy soil. The pots were watered with distilled water for the first 7 d to establish seedlings. Subsequently, treatments with NaCl solutions (50, 70, and 100 mM) or NaCl combined with ANE were applied weekly for 50 d. To avoid salt accumulation in the root zone, pots were flushed with the treatment solutions during watering. Growth measurements, including plant height, root penetration, and leaf area, were recorded after 30 and 50 d.
Growth parameters were measured at two intervals: 30- and 50-d post-germination.
Plant height was measured from the soil surface to the top of the leaves using a meter scale. Three plants per treatment were randomly selected for measurements.
Root length was measured, and the root penetration ratio was calculated using the formula:
where soil depth was standardized at 10 cm.
The leaf area was estimated for three randomly selected leaves using the formula by MacFarlane et al. [24]:
where R = 0.75, L is the leaf length, and B is the leaf width.
Fresh weights of roots and shoots were recorded immediately after harvesting. Samples were then dried at 75°C for 24 h to determine dry weights.
2.6 Physiological Measurements
The relative water content (RWC) was determined using the method described by Barrs et al. [25]. Fresh leaves were collected from plants and immediately weighed to obtain the fresh weight (FW). The leaves were then placed in petri dishes containing distilled water and allowed to rehydrate under natural light for 24 h. After rehydration, the leaves were blotted dry with filter paper to remove excess surface water and weighed to determine the turgid weight (TW). Subsequently, the leaves were dried in an oven at 75°C for 24 h to obtain the dry weight (DW).
The RWC was calculated using the following formula:
where R = 0.75, L is the leaf length, and B is the leaf width.
Fresh weights of roots and shoots were recorded immediately after harvesting. Samples were then dried at 75°C for 24 h to determine dry weights.
The photosynthetic pigments were extracted and quantified following the method described by Lichtenthaler [26], with slight modifications. Fresh, healthy leaves (0.02 g) were precisely weighed and ground in a mortar and pestle with a small amount of dimethylformamide (DMF) to ensure efficient extraction of pigments. The homogenized sample was then transferred into centrifuge tubes, and additional DMF was added to make up a final volume of 5 mL. The tubes were tightly capped and incubated in darkness at room temperature for 24 h to avoid photodegradation of pigments. After the incubation period, the mixture was centrifuged at 3000× g for 10 min to separate the supernatant containing the pigments.
Carotenoids were extracted from the leaf samples using a solvent extraction method, adapted from standard procedures [27]. Approximately 5 g of the homogenized sample was placed in a centrifuge tube with 10 mL of ethanol. The mixture was homogenized for 3 min using a Biohomogenizer (Thomas Scientific, BioSpec Products, Inc., Bartlesville, OK, USA). Subsequently, 8 mL of pentane was added, and the homogenization process was repeated for an additional 2 min. The mixture was centrifuged at 7000× g for 3 min, and the upper pentane layer, containing the carotenoids, was carefully transferred to another centrifuge tube using a Pasteur pipette. For the second extraction, 5 mL of distilled water and 2 g of sodium chloride were added to the residual sample, followed by the addition of 8 mL of pentane. The mixture was gently shaken and centrifuged as described previously. The pentane layers from both extractions were combined and evaporated under a stream of nitrogen to near dryness. The residue was reconstituted in an appropriate volume of pentane and transferred to a volumetric flask for further analysis [28]. The molar absorption coefficient (ε) for carotenoids extracted using pentane was 2500 M−1 cm−1 [29].
Chlorophyll a, chlorophyll b, and carotenoids were quantified using a UV-Vis spectrophotometrically. The absorbances were measured at 664.5, 647.4, and 452.5 nm for chlorophyll a, chlorophyll b, and carotenoids, respectively. The concentrations were calculated using the following equations:
where V is the solvent volume (mL), and W is the fresh weight of the sample, A = absorbance, ε = molar absorption coefficient (2500 M−1 cm−1), d = path length of the cuvette (1 cm).
Leaf Sap pH and Electrical Conductivity (EC)
To measure the pH and electrical conductivity (EC) of leaf sap, 2 g of fresh, healthy leaves were carefully selected, washed with distilled water to remove surface debris, and blotted dry with clean tissue paper. The leaves were cut into small pieces and soaked in 25 mL of distilled water in a clean glass beaker, which was covered to prevent contamination and evaporation. After 24 h at room temperature, the solution was gently stirred to homogenize the sap extract. The pH was measured using a calibrated pH meter, which was standardized with buffer solutions (pH 4.0, 7.0, and 9.0) prior to analysis. The electrode was immersed in the sap extract, and the pH value was recorded once the reading stabilized, ensuring the electrode was rinsed with distilled water between samples to avoid cross-contamination. Similarly, the EC was measured using a calibrated conductivity meter, with the probe immersed in the sap solution until the reading stabilized. The EC values were recorded in micro Siemens per centimetre (μS/cm), and the probe was rinsed with distilled water between measurements. Each measurement was performed in triplicate to ensure reproducibility, with average values calculated for statistical analysis. This methodology ensured accurate and reliable determination of the leaf sap’s pH and EC, reflecting the plant’s ionic balance and physiological response to treatments.
To determine the soluble protein content, the Bradford [30] method was employed using Coomassie Brilliant Blue G-250 dye. Fresh leaf samples weighing 0.5 g were collected, washed with distilled water to remove impurities, and homogenized in 5 mL of ice-cold phosphate buffer (pH 7.0) using a mortar and pestle. The homogenate was centrifuged at 10,000× g for 10 min at 4°C to separate the supernatant, which contained the soluble proteins.
For the preparation of the Bradford reagent, 0.1 g of Coomassie Brilliant Blue G-250 dye was dissolved in 50 mL of 95% ethanol. To this, 100 mL of 85% phosphoric acid was added, and the solution was diluted with distilled water to a final volume of one liter. The reagent was stored in a dark container at room temperature.
To perform the assay, 0.1 mL of the protein extract (supernatant) was mixed with 5 mL of the Bradford reagent in a clean test tube. The mixture was vortexed for 30 s to ensure uniform mixing and incubated at room temperature for 10 min to allow the color to develop. The absorbance of the resulting blue color was measured at 595 nm using a spectrophotometer. A blank solution was prepared by replacing the protein extract with distilled water.
For protein quantification, a standard curve was generated using bovine serum albumin (BSA). Serial dilutions of BSA (ranging from 0.2 to 1.0 mg/mL) were prepared, and their absorbances were measured under the same conditions as the samples. The protein concentration in the leaf extracts was calculated by comparing their absorbance values to the BSA standard curve.
All measurements were performed in triplicate to ensure accuracy and reproducibility. The results were expressed as milligrams of protein per gram of fresh leaf weight. This method provided a sensitive and reliable estimation of soluble protein content in the plant samples.
The soluble proline content in fresh leaf samples was estimated using the method described by Bates et al. [31] with slight modifications to ensure precision. Fresh leaf samples (0.5 g) were homogenized in 10 mL of 3% (w/v) sulfosalicylic acid using a mortar and pestle, and the homogenate was filtered through Whatman No. 1 filter paper to obtain a clear extract. A 2 mL aliquot of the filtered extract was mixed with 2 mL of glacial acetic acid and 2 mL of freshly prepared acid-ninhydrin reagent, which was prepared by dissolving 1.25 g of ninhydrin in 30 mL of glacial acetic acid and 20 mL of 6 M phosphoric acid under constant stirring. The mixture was incubated in a boiling water bath (100°C) for 1 h, with test tubes covered to prevent evaporation, and then rapidly cooled in an ice bath to stop the reaction. Following this, 4 mL of toluene was added to each test tube, and the contents were vortexed for 30 s to extract the proline-ninhydrin complex into the upper toluene layer. The pink-colored toluene layer was carefully separated and its absorbance measured at 520 nm using a UV-Vis spectrophotometer, with toluene used as the blank. A standard curve was prepared using known concentrations of L-proline (10–100 μg/mL) and processed similarly to establish a linear relationship between absorbance and proline concentration. The proline content in the leaf samples was quantified by comparing absorbance values against the standard curve and expressed as micromoles of proline per gram of fresh weight. All measurements were performed in triplicate to ensure accuracy and reproducibility, providing reliable data on the proline accumulation as a key indicator of plant stress response.
The data obtained from the experiments were analyzed using SPSS v26. All measurements were performed in triplicate, and results were expressed as mean ± standard deviation (SD). The Shapiro-Wilk test was used to assess the normality of the data, while Levene’s test was conducted to check the homogeneity of variance.
A two-way analysis of variance (ANOVA) was performed to evaluate the main effects of NaCl concentration and ANE treatment, as well as their interaction. Sidak’s multiple comparisons test was used as a post hoc analysis to determine significant differences between treatments. A significance level of p ≤ 0.05 was considered statistically significant.
3.1 Plant Growth and Morphological Parameters
The growth parameters of Portulaca oleracea were assessed after 50 days under different NaCl concentrations with and without ANE treatment to determine whether ANE had a significant impact. Two-way ANOVA revealed that ANE significantly influenced plant height (p = 0.0006), while NaCl concentration also had a significant effect (p = 0.0479). However, their interaction was not significant (p = 0.0672), indicating that ANE’s effect on height was independent of salinity levels. Post hoc analysis showed that ANE significantly increased height at 50 mM NaCl (p = 0.0011), but no significant differences were found at other salinity levels (p > 0.05) (Fig. 1). These findings suggest that ANE may have a beneficial effect under moderate salinity stress but does not consistently enhance plant height across all salinity levels.
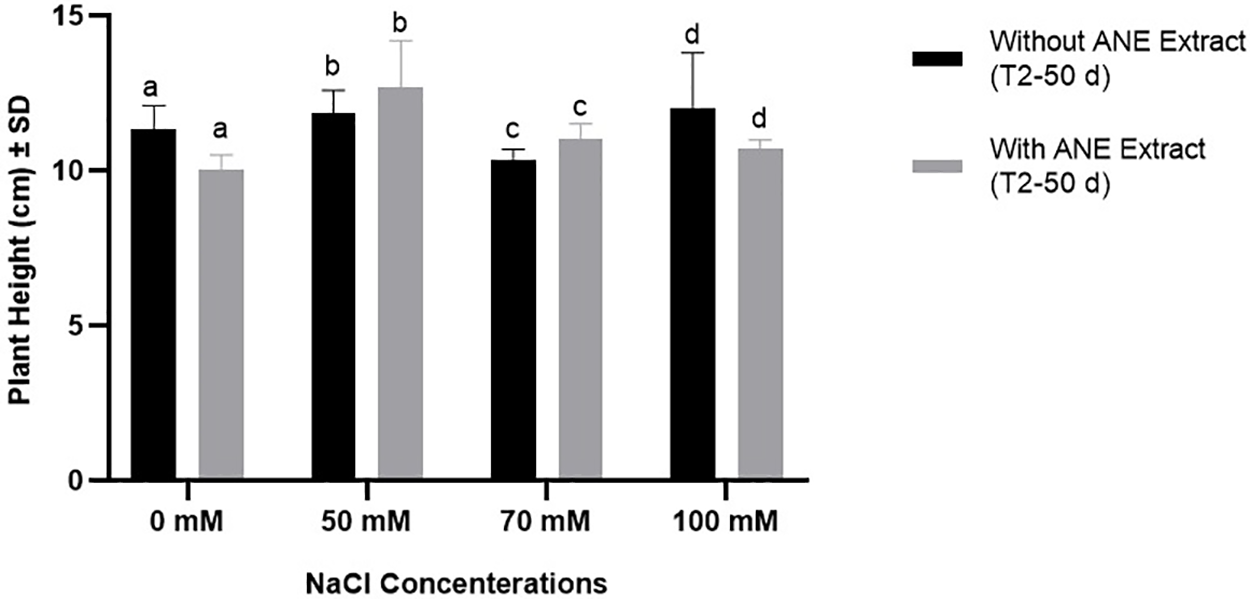
Figure 1: Effect of ANE treatment on the height of Portulaca oleracea under different NaCl concentrations (0, 50, 70, and 100 mM) after 50 days. Bars represent mean ± SD. Black bars indicate plants grown without ANE, while gray bars indicate plants with ANE treatment. Different letters above bars denote significant differences among NaCl concentrations based on Sidak’s multiple comparisons test (p < 0.05). A statistically significant difference between treatments was observed only at 50 mM NaCl (p = 0.0011), whereas no significant differences were detected at other concentrations (p > 0.05). Bars represent the mean plant height (cm) after 50 d of treatment with NaCl alone or in combination with ANE extract. Statistical significance is indicated by different letters above the bars, where bars with the same letter are not significantly different at p < 0.05
For leaf area, neither NaCl concentration nor ANE treatment had a significant effect (p > 0.05 for all comparisons). Despite some numerical variations, ANE application did not significantly alter leaf area at any NaCl concentration (Fig. 2).
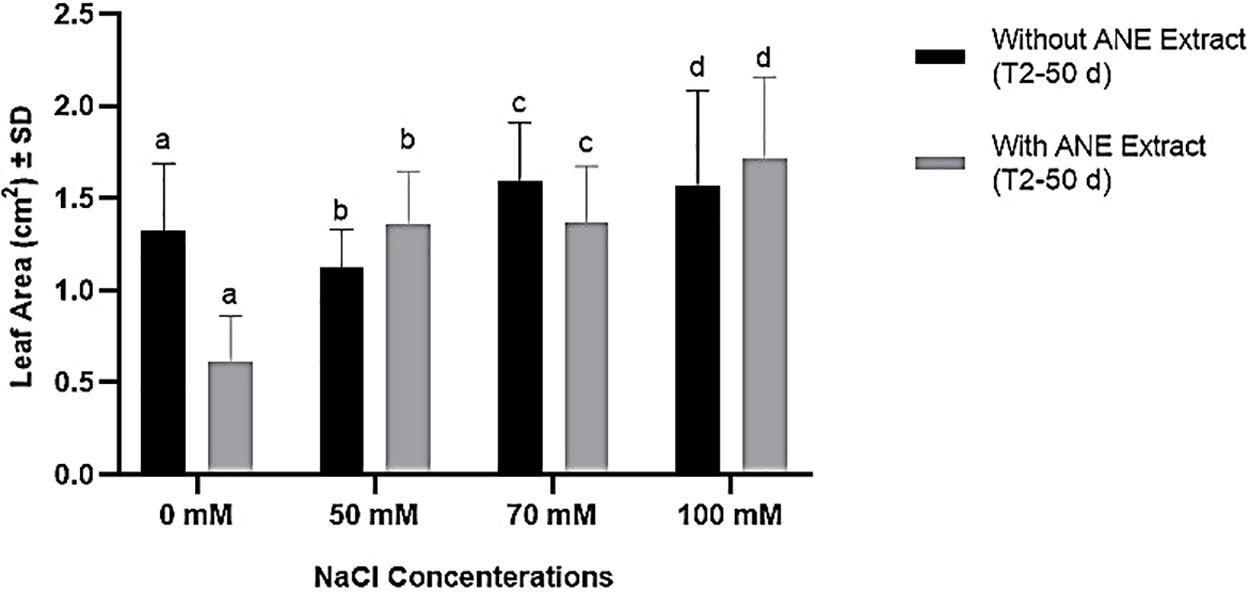
Figure 2: Effect of ANE treatment on the leaf area of Portulaca oleracea under different NaCl concentrations (0, 50, 70, and 100 mM) after 50 days. Bars represent mean ± SD. Black bars indicate plants grown without ANE, while gray bars indicate plants with ANE treatment. Different letters above bars indicate significant differences among NaCl concentrations based on Sidak’s multiple comparisons test (p < 0.05). However, no significant differences were detected between ANE-treated and untreated plants at any NaCl concentration (p > 0.05)
The shoot and root dry weights of Portulaca oleracea were assessed after 50 days under different NaCl concentrations with and without ANE treatment. Two-way ANOVA revealed a significant interaction effect on shoot dry weight (p = 0.0064), indicating that ANE’s impact varied depending on salinity level. However, NaCl concentration (p = 0.2120) and ANE treatment alone (p = 0.0547) had no significant effects. Post hoc analysis showed that ANE significantly influenced shoot dry weight only at 0 mM (p = 0.0064) and 100 mM NaCl (p = 0.0001), while no significant differences were observed at 50 or 70 mM NaCl (p > 0.05) (Fig. 3). These results suggest that ANE’s impact on shoot biomass was inconsistent and salinity dependent.
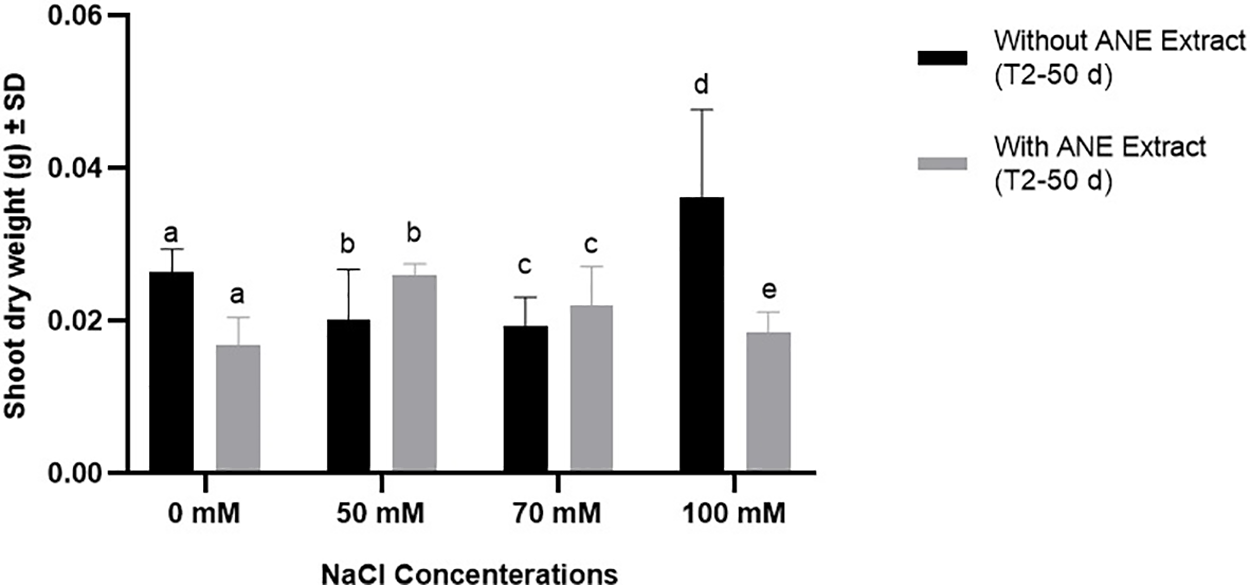
Figure 3: Effect of ANE treatment on the shoot dry weight of Portulaca oleracea under different NaCl concentrations (0, 50, 70, and 100 mM) after 50 days. Bars represent mean ± SD. Black bars indicate plants grown without ANE, while gray bars indicate plants with ANE treatment. Different letters above bars indicate significant differences among NaCl concentrations based on Sidak’s multiple comparisons test (p < 0.05). A significant difference between ANE-treated and untreated plants was observed at 0 mM NaCl (p = 0.0064) and 100 mM NaCl (p = 0.0001), whereas no significant differences were detected at 50 and 70 mM NaCl (p > 0.05)
For root dry weight, ANE treatment did not have a significant effect at any NaCl concentration (p > 0.05 for all comparisons), nor did NaCl concentration or their interaction (p = 0.1541). Despite minor numerical variations, ANE did not significantly enhance root biomass under salinity stress (Fig. 4). Overall, ANE had limited and inconsistent effects on shoot biomass and no significant impact on root biomass, suggesting that its effectiveness in improving plant growth under salinity stress is conditional and not uniform.
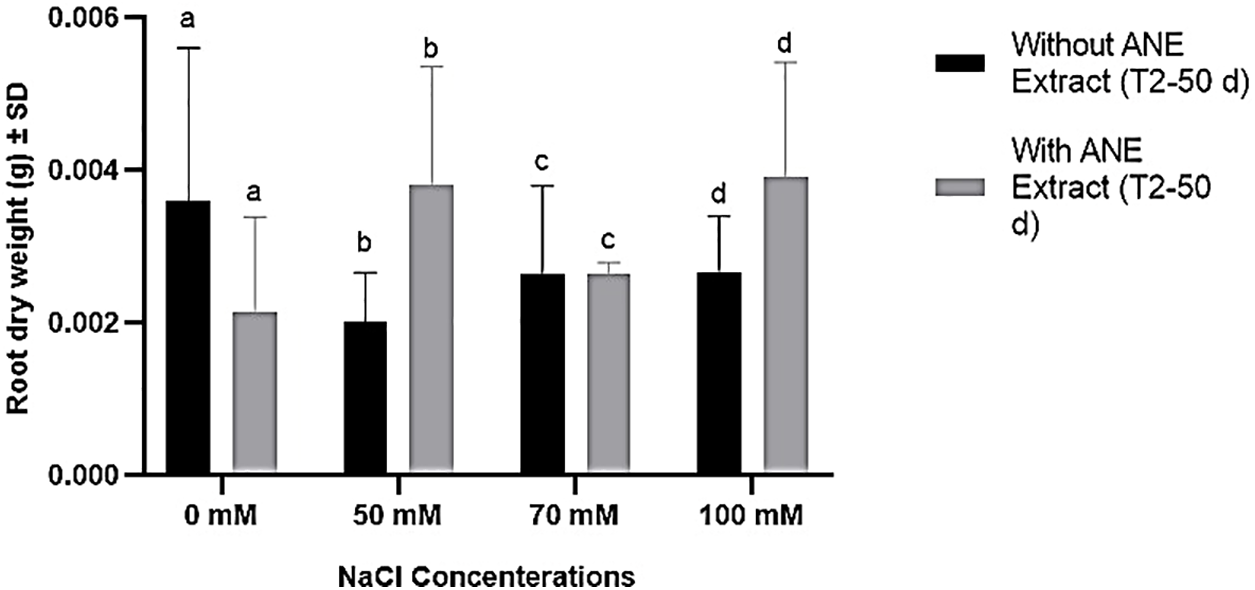
Figure 4: Effect of ANE treatment on the root dry weight of Portulaca oleracea under different NaCl concentrations (0, 50, 70, and 100 mM) after 50 days. Bars represent mean ± SD. Black bars indicate plants grown without ANE, while gray bars indicate plants with ANE treatment. Different letters above bars indicate significant differences among NaCl concentrations based on Sidak’s multiple comparisons test (p < 0.05). However, no significant differences were observed between ANE-treated and untreated plants at any NaCl concentration (p > 0.05)
The levels of proline and total soluble protein in Portulaca oleracea were assessed after 50 days under different NaCl concentrations with and without ANE treatment. Two-way ANOVA revealed distinct effects for both parameters, with ANE treatment significantly influencing total soluble protein content but showing mixed effects on proline accumulation.
For proline content, ANE had a significant impact at 50 mM NaCl (p = 0.0011), but no significant differences were observed at 0, 70, or 100 mM NaCl (p > 0.05). This indicates that ANE enhanced proline accumulation only under moderate salinity stress (50 mM NaCl), while no significant effects were detected at other salinity levels (Fig. 5).
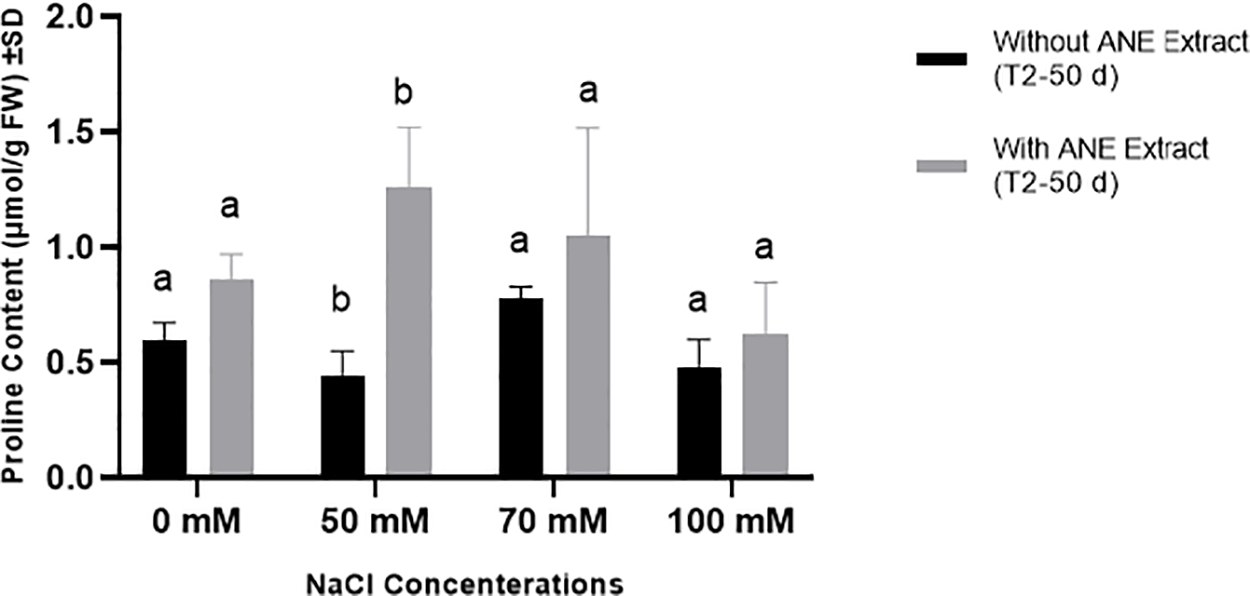
Figure 5: Effect of ANE treatment on Proline Content (μmol/g FW) ± SD in Portulaca oleracea under different NaCl concentrations (0, 50, 70, and 100 mM) after 50 days. Black bars represent plants grown without ANE, while gray bars represent plants with ANE treatment. Different letters above bars indicate significant differences (p < 0.05) among NaCl concentrations based on Sidak’s multiple comparisons test. ANE significantly increased proline content at 50 mM NaCl but had no significant impact at other NaCl concentrations
In contrast, total soluble protein content was significantly increased by ANE at 0, 50, and 70 mM NaCl (p < 0.0001 at 0 and 50 mM; p = 0.0021 at 70 mM NaCl), whereas no significant effect was observed at 100 mM NaCl (p = 0.2921). These findings suggest that ANE positively influenced total soluble protein accumulation under low to moderate salinity conditions but did not enhance protein content under severe salinity stress (Fig. 6).
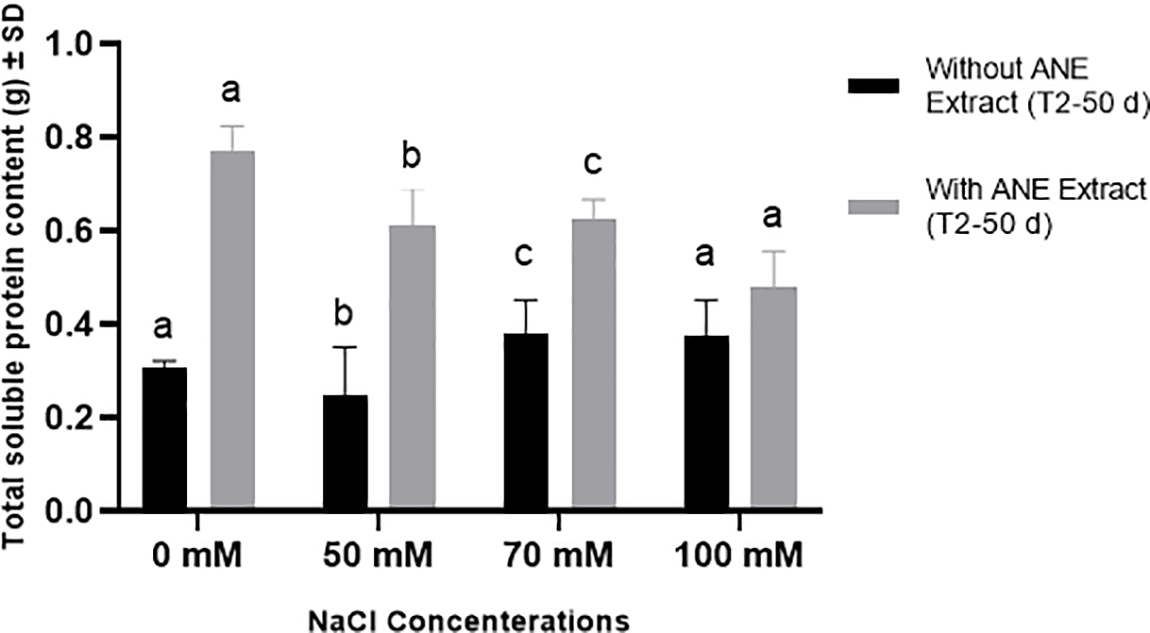
Figure 6: Effect of ANE treatment on Total Soluble Protein Content (g) ± SD in Portulaca oleracea under different NaCl concentrations (0, 50, 70, and 100 mM) after 50 days. Black bars represent plants grown without ANE, while gray bars represent plants with ANE treatment. Different letters above bars indicate significant differences (p < 0.05) among NaCl concentrations based on Sidak’s multiple comparisons test. ANE significantly increased total soluble protein content at 0, 50, and 70 mM NaCl, while no significant difference was observed at 100 mM NaCl
Overall, ANE treatment effectively increased total soluble protein content across most NaCl levels and enhanced proline accumulation only at 50 mM NaCl. These results suggest that ANE may contribute to osmotic stress tolerance by boosting total soluble proteins across different salinity levels, while its role in proline accumulation is limited to moderate salinity stress.
The leaf sap pH of Portulaca oleracea was significantly influenced by NaCl concentration (p = 0.0193), while ANE treatment (p = 0.9178) and its interaction with NaCl (p = 0.1267) had no significant effects. Post hoc analysis confirmed no significant differences (p > 0.05) between ANE-treated and untreated plants at any NaCl level, indicating that ANE did not impact pH regulation under salinity stress (Fig. 7).
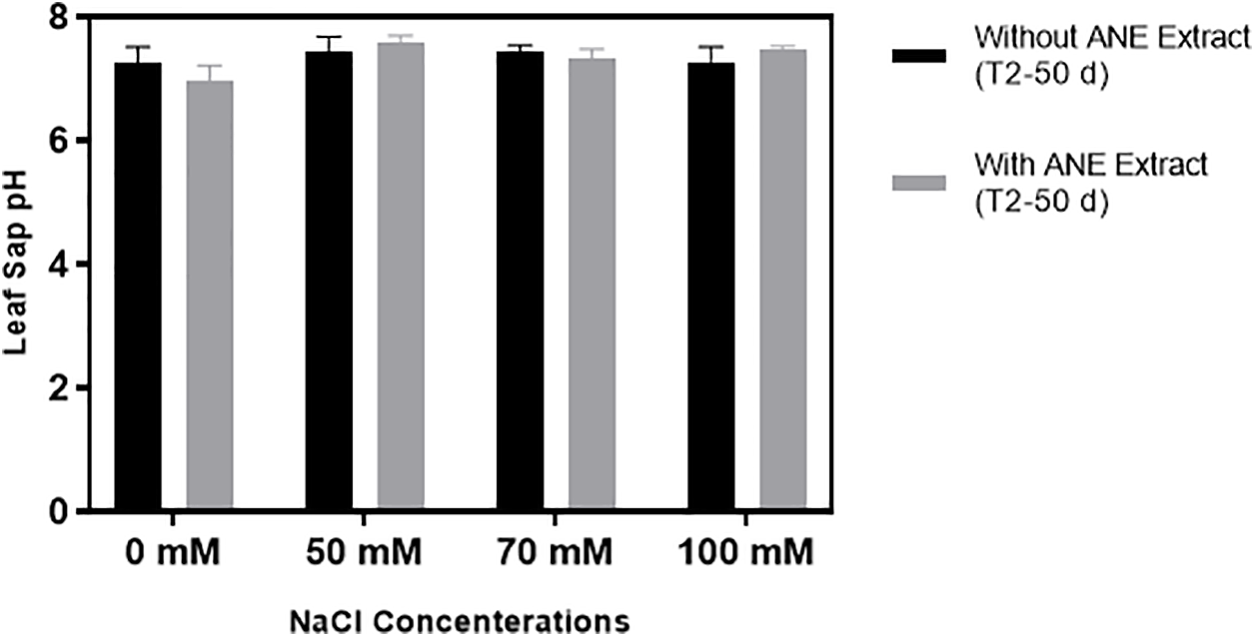
Figure 7: Effect of ANE treatment on Leaf Sap pH (± SD) in Portulaca oleracea under different NaCl concentrations (0, 50, 70, and 100 mM) after 50 days. Black bars represent plants grown without ANE, while gray bars represent plants with ANE treatment. No significant differences (p > 0.05) were detected among treatments, as determined by Sidak’s multiple comparisons test
In contrast, EC was significantly affected by NaCl concentration (p = 0.0193), but ANE treatment alone was not significant (p = 0.9178). However, post hoc analysis revealed that ANE significantly increased EC at 70 and 100 mM NaCl (p < 0.01), while no significant changes were observed at 0 and 50 mM NaCl (p > 0.05) (Fig. 8). These results suggest that ANE had no effect on pH but increased EC under high salinity conditions.
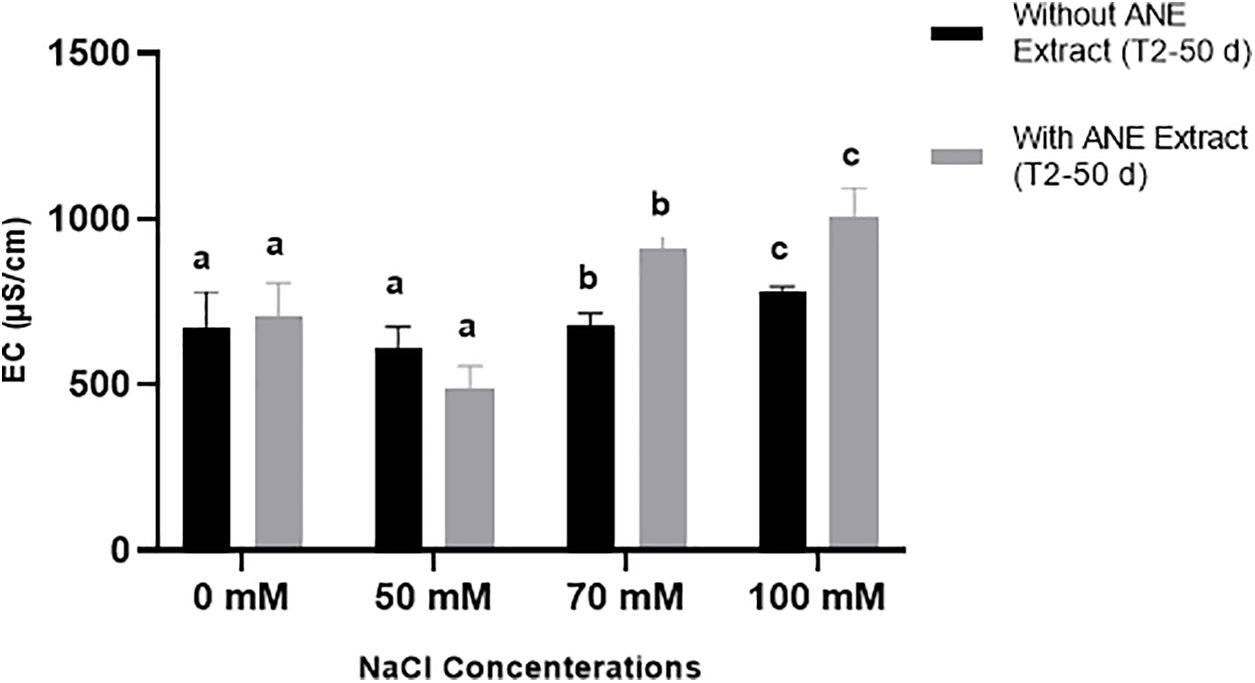
Figure 8: Effect of ANE treatment on Electrical Conductivity (EC) (μS/cm) ± SD in Portulaca oleracea under different NaCl concentrations (0, 50, 70, and 100 mM) after 50 days. Black bars represent plants grown without ANE, while gray bars represent plants with ANE treatment. Different letters above bars indicate significant differences (p < 0.05) among NaCl concentrations based on Sidak’s multiple comparisons test. ANE significantly increased EC at 70 and 100 mM NaCl, while no significant differences were observed at 0 and 50 mM NaCl
The levels of Chlorophyll “a”, Chlorophyll “b”, and carotenoids in Portulaca oleracea were analyzed under different NaCl concentrations with and without ANE treatment after 50 days. Two-way ANOVA revealed significant differences in some parameters, while others remained unaffected by ANE application or NaCl concentration.
For Chlorophyll “a”, ANE significantly increased chlorophyll content across all NaCl concentrations (p < 0.0001 for 0, 70, and 100 mM NaCl; p = 0.0025 for 50 mM NaCl), indicating that ANE positively influenced Chlorophyll “a” accumulation regardless of salinity level. Post hoc Sidak’s multiple comparisons test showed that Chlorophyll “a” level was significantly higher in ANE-treated plants compared to untreated plants at all salinity levels (Fig. 9A).
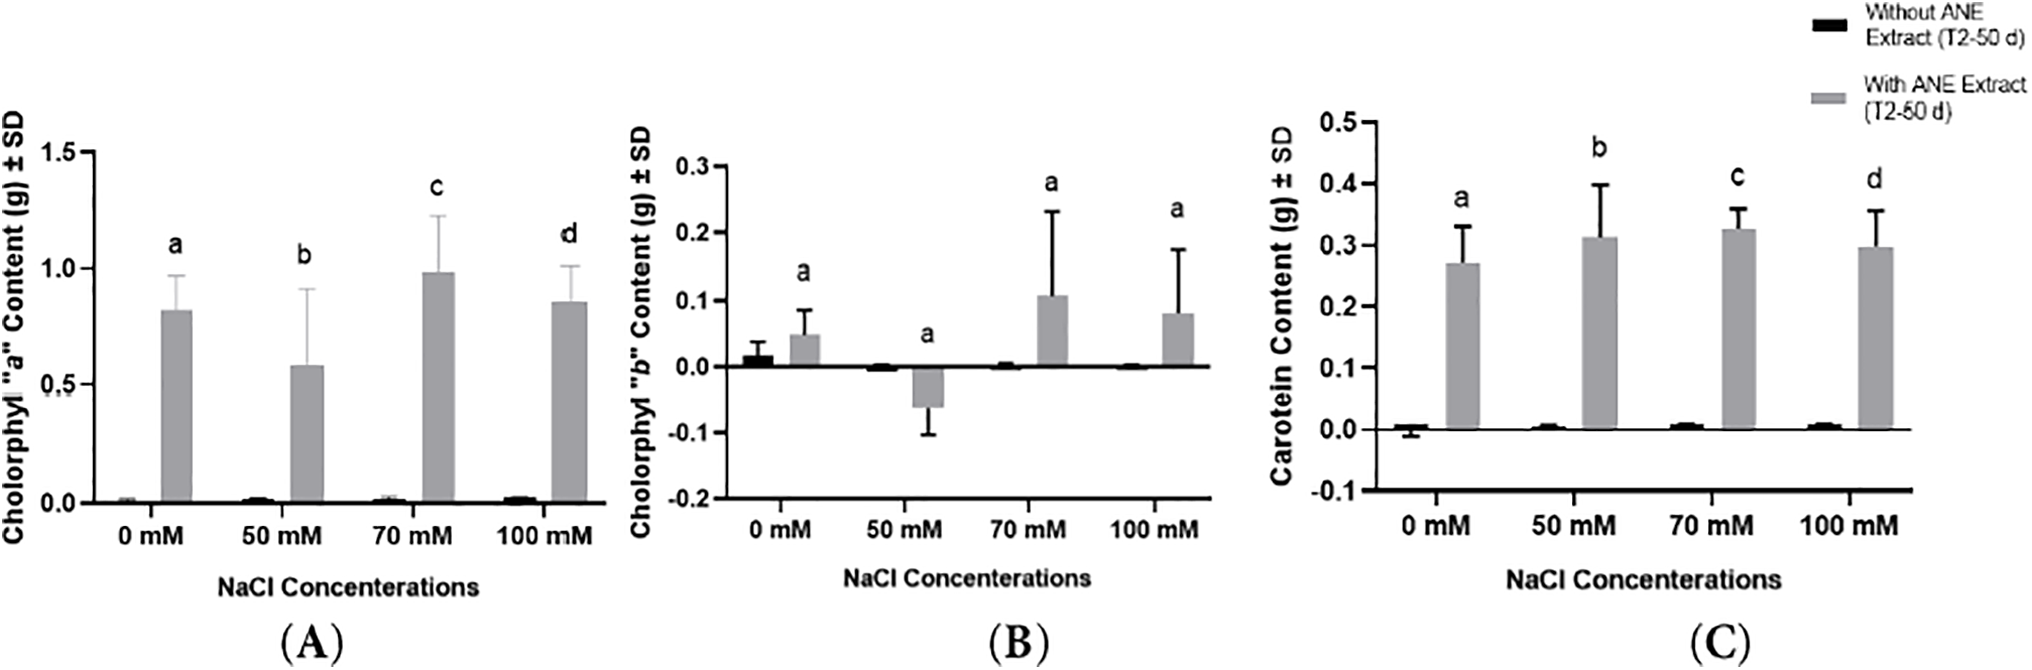
Figure 9: Effect of ANE treatment on (A) Chlorophyll “a”, (B) Chlorophyll “b”, and (C) Carotenoid content of Portulaca oleracea under different NaCl concentrations (0, 50, 70, and 100 mM) after 50 days. Bars represent mean ± SD. Black bars indicate plants grown without ANE, while gray bars indicate plants with ANE treatment. Different letters above bars indicate significant differences (p < 0.05) among NaCl concentrations based on Sidak’s multiple comparisons test. ANE significantly increased Chlorophyll “a” and carotenoid content but had no significant impact on Chlorophyll “b”
In contrast, Chlorophyll “b” did not show any significant changes due to ANE treatment (p > 0.05 for all NaCl concentrations). Despite numerical variations, none of the comparisons between ANE-treated and untreated plants were statistically significant (Fig. 9B), suggesting that ANE did not enhance Chlorophyll “b” content under any salinity level.
For carotenoids, ANE application resulted in a highly significant increase across all NaCl concentrations (p < 0.0001 for all comparisons). This suggests that ANE effectively enhanced carotenoid content, irrespective of salinity level (Fig. 9C).
Overall, these findings indicate that ANE significantly improved Chlorophyll “a” and carotenoid content but had no impact on Chlorophyll “b” under different NaCl concentrations. The significant increases in Chlorophyll “a” and carotenoids suggest a potential protective role of ANE in enhancing photosynthetic pigments under salinity stress, while the unchanged Chlorophyll “b” levels indicate that its biosynthesis was not affected by ANE treatment.
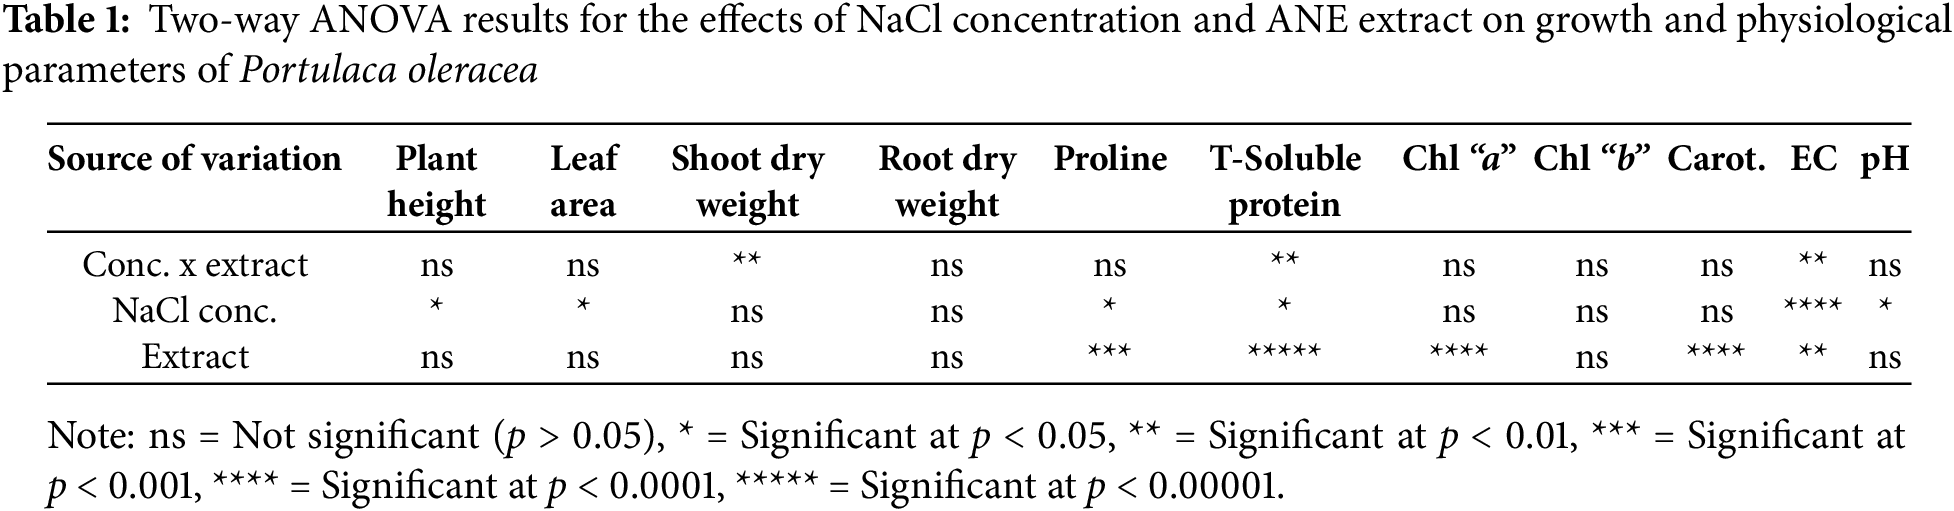
The results of this study demonstrate that both NaCl concentration and ANE extract influenced the growth and physiological responses of Portulaca oleracea. NaCl concentration significantly affected plant height and leaf area (p < 0.05), while ANE treatment had a strong effect on proline, total soluble protein, chlorophyll “a”, carotenoids, and EC (p < 0.01) (Table 1). Significant interaction effects were observed for shoot dry weight, total soluble protein, and EC, indicating that ANE’s impact varied depending on the NaCl concentration.
One-Way ANOVA was performed to compare the effects of NaCl concentration (0, 50, 70, and 100 mM) and extract condition (W/O ANE vs. ANE) on Shoot Dry Weight, Total Soluble Protein, and EC (Table 2). The null hypothesis was that there is no significant difference between the groups, while the alternative hypothesis was that there is a significant difference. For horizontal analysis within each NaCl concentration, small letters (a, b, etc.) indicate significant differences within each extract condition (W/O ANE or ANE). If values share the same letter, they are not significantly different, whereas different letters indicate significant differences. For vertical analysis between the two extract conditions at each NaCl concentration, capital letters (A, B) show significant differences between W/O ANE and ANE at that concentration. The same capital letters indicate no significant difference, while different capital letters indicate a significant difference.
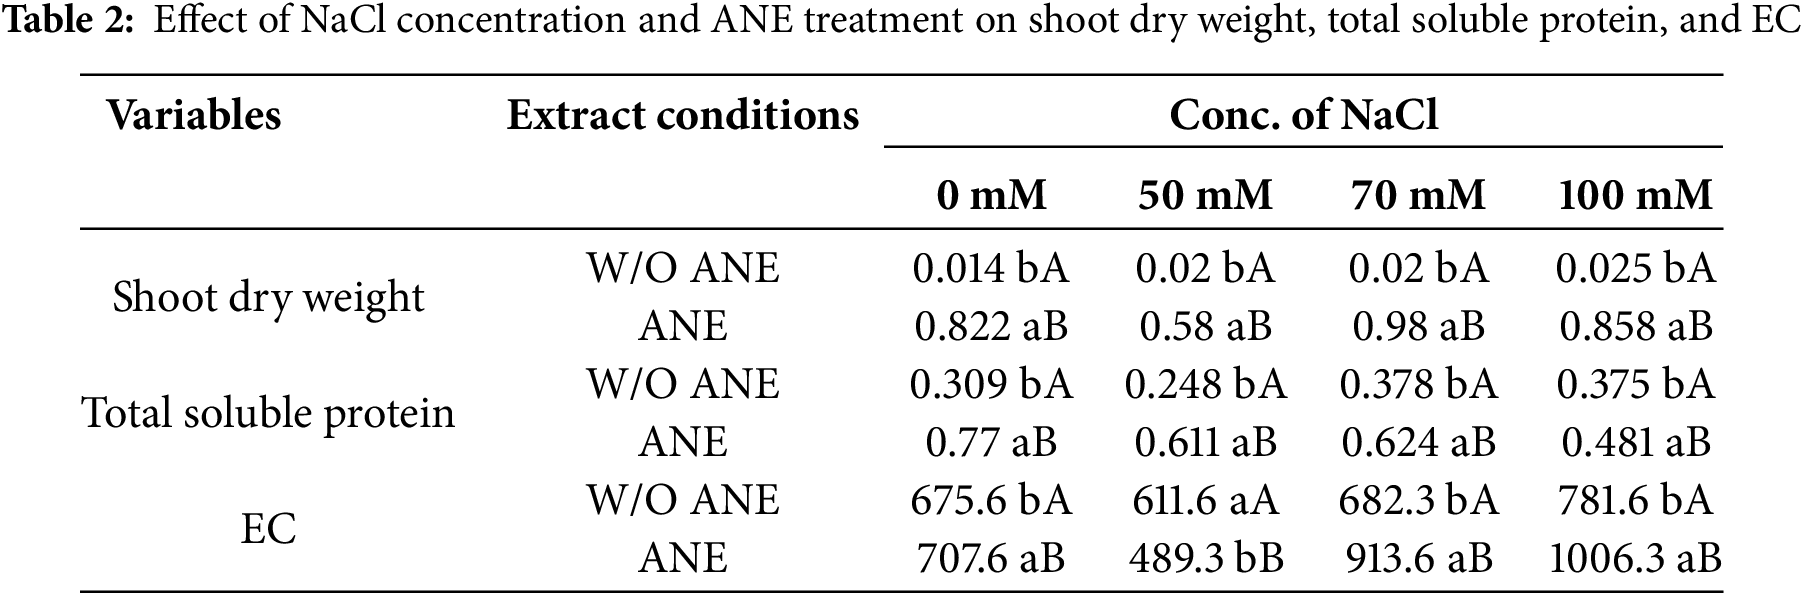
The small and capital letters (such as b, B, a, A) are used to indicate statistical differences between the groups, based on the results of the One-Way ANOVA test. Small letters (a, b, etc.) compare within rows (NaCl concentrations under the same extract condition). Capital letters (A, B) compare between columns (W/O ANE vs. With ANE at each NaCl concentration). If no significant differences were found, all values are marked ‘a’ for within-row and ‘A’ for between-column comparisons.
For shoot dry weight, W/O ANE showed a modest increase from 0.014 at 0 mM NaCl to 0.025 at 100 mM NaCl, indicating a slight positive effect of increasing NaCl concentration. In contrast, with ANE addition, shoot dry weight increased significantly, from 0.58 at 50 mM NaCl to 0.98 at 70 mM NaCl, with 70 mM NaCl showing the highest value. The effect of extract conditions within each NaCl concentration was also analyzed (Table 2). At 0 mM NaCl, ANE resulted in significantly higher shoot dry weight (0.822) compared to W/O ANE (0.014). At 50 mM NaCl, ANE resulted in a significantly higher shoot dry weight (0.58) compared to W/O ANE (0.020). At 70 mM and 100 mM NaCl, ANE treatment resulted in significantly higher shoot dry weight (0.98 and 0.858, respectively) compared to W/O ANE (0.020 and 0.025, respectively).
For total soluble protein, W/O ANE showed a slight decrease from 0.309 at 0 mM NaCl to 0.248 at 50 mM NaCl, followed by an increase at 70 mM NaCl (0.378) and 100 mM NaCl (0.375). This suggests that NaCl concentration affects total soluble protein, with the highest content observed at 70 mM NaCl. In the presence of ANE, total soluble protein increased from 0.77 at 0 mM NaCl to 0.624 at 70 mM NaCl before slightly decreasing at 100 mM NaCl (0.481). The effect of extract conditions within each NaCl concentration was significant, with ANE showing significantly higher total soluble protein compared to W/O ANE at all NaCl concentrations (Table 2).
For EC, W/O ANE showed a steady increase from 675.6 at 0 mM NaCl to 781.6 at 100 mM NaCl, suggesting that NaCl concentration influences EC. With ANE treatment, EC increased sharply from 489.3 at 50 mM NaCl to 913.6 at 70 mM NaCl and reached the highest value of 1006.3 at 100 mM NaCl. The effect of extract conditions within each NaCl concentration was also significant, with ANE-treated samples exhibiting significantly higher EC values than W/O ANE at 70 mM and 100 mM NaCl (Table 2).
The effect of NaCl concentration within each extract condition on proline content was also evaluated (Table 3). For W/O ANE, proline content increased significantly from 0.600 at 0 mM NaCl to 0.775 at 70 mM NaCl before slightly decreasing to 0.478 at 100 mM NaCl. This suggests that NaCl concentration initially increases proline accumulation but levels off at higher concentrations. For ANE-treated Portulaca oleracea plants, proline content increased from 0.858 at 0 mM NaCl to 1.264 at 50 mM NaCl before slightly decreasing at 100 mM NaCl (0.622). The effect of extract conditions within each NaCl concentration was significant, with ANE-treated samples showing significantly higher proline content than W/O ANE at all NaCl concentrations (Table 4).
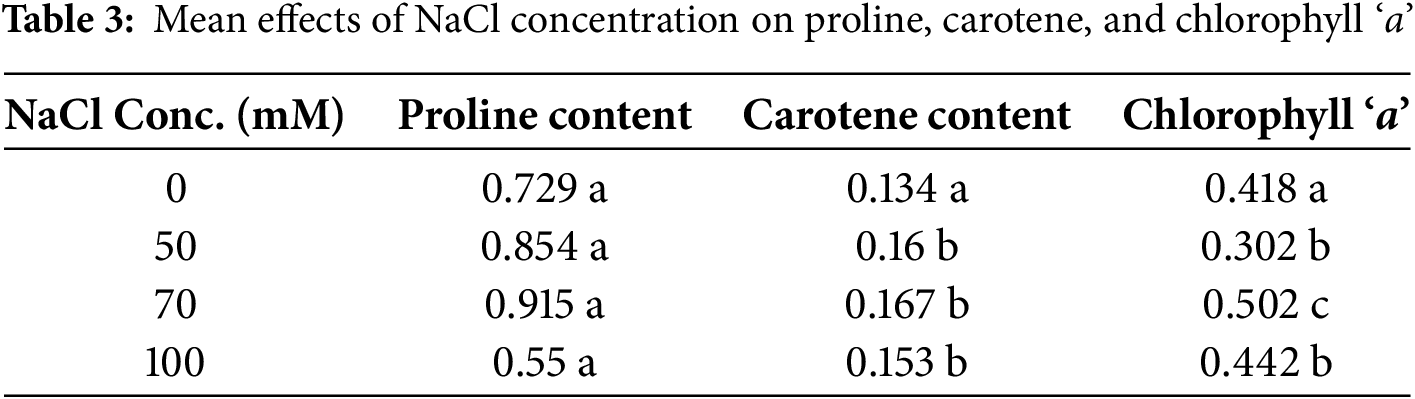
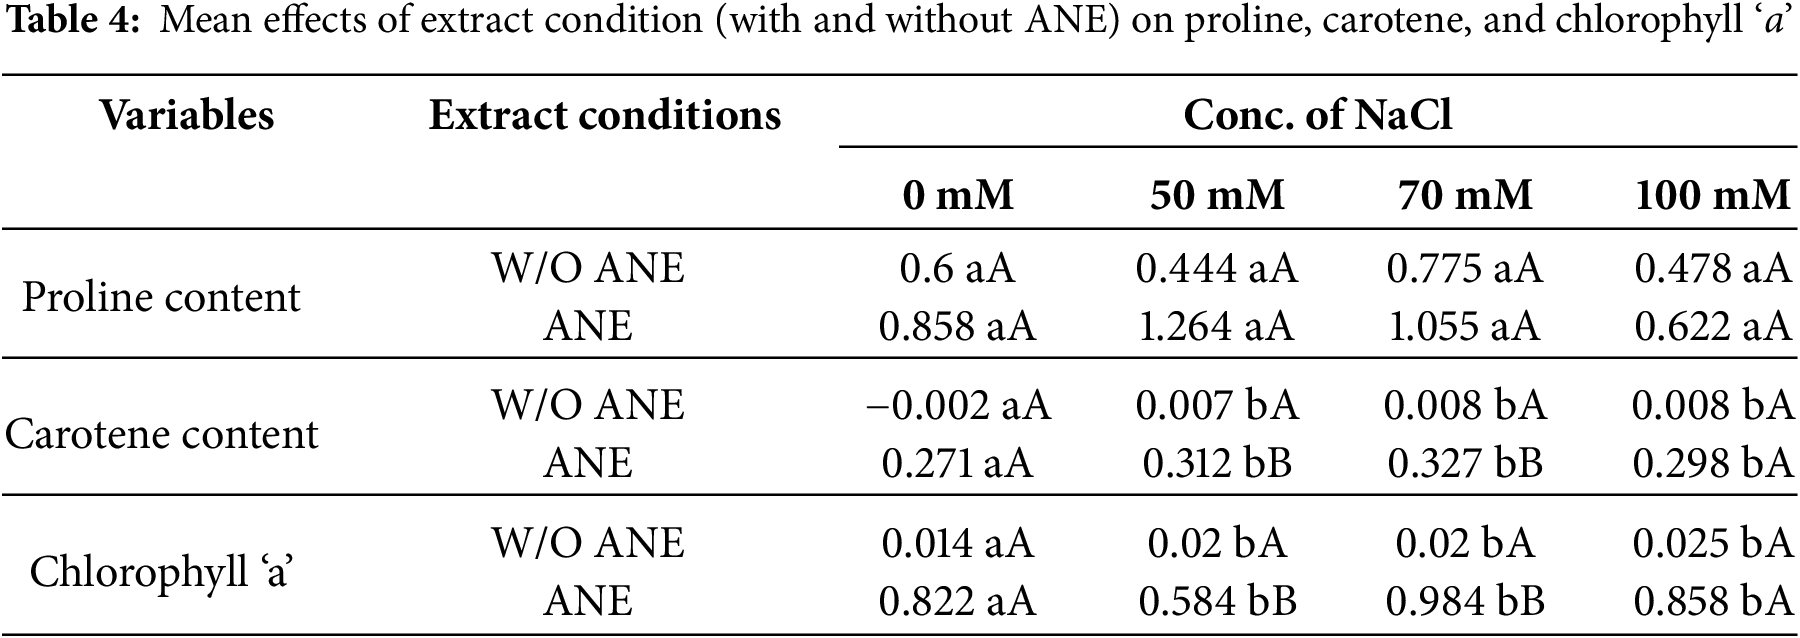
Different letters indicate significant differences (p < 0.05) among concentrations. If no significant difference was found, all values are marked ‘a’.
Small letters (a, b, etc.) compare different NaCl concentrations within the same treatment (either W/O ANE or with ANE). Capital letters (A, B) compare W/O ANE and With ANE for each NaCl concentration. If no significant differences were found within a row, only ‘a’ is used. If no significant differences were found between extract conditions at the same NaCl concentration, only ‘A’ is used.
For chlorophyll ‘a’, W/O ANE showed a slight increase from 0.014 at 0 mM NaCl to 0.025 at 100 mM NaCl, indicating a modest positive trend. With ANE, chlorophyll ‘a’ content increased significantly from 0.822 at 0 mM NaCl to 0.984 at 70 mM NaCl before slightly decreasing at 100 mM NaCl (0.858). The effect of extract conditions within each NaCl concentration was significant, with ANE-treated samples exhibiting significantly higher chlorophyll ‘a’ content than W/O ANE across all NaCl concentrations (Table 4).
For carotene content, W/O ANE showed a minor increase from −0.002 at 0 mM NaCl to 0.008 at 100 mM NaCl, indicating a slight upward trend. With ANE, carotene content increased significantly from 0.271 at 0 mM NaCl to 0.327 at 70 mM NaCl before slightly decreasing to 0.298 at 100 mM NaCl. The effect of extract conditions within each NaCl concentration was also significant, with ANE-treated samples consistently exhibiting higher carotene content than W/O ANE across all NaCl concentrations (Table 4).
These results confirm that ANE plays a significant role in enhancing the effects of NaCl concentration on physiological and biochemical parameters. The significant interactions observed for shoot dry weight, total soluble protein, and EC suggest that ANE modulates plant responses under salt stress, particularly at 70 mM NaCl, where the most pronounced effects were noted (Table 2). For proline, chlorophyll ‘a’, and carotene content, NaCl concentration and extract conditions independently influenced their accumulation, with ANE consistently enhancing their levels across all treatments (Tables 3 and 4).
Salinity stress is a major challenge to global agriculture, affecting plant growth, productivity, and physiological processes by inducing osmotic stress, ionic imbalances, and oxidative damage [32]. The use of biostimulants such as Ascophyllum nodosum extract (ANE) has gained attention as a sustainable strategy to mitigate salinity-induced stress and improve plant resilience [33,34]. In this study, the impact of ANE on Portulaca oleracea L. was assessed under NaCl concentrations of 0, 50, 70, and 100 mM for 50 days. A two-way ANOVA was conducted to evaluate the effects of NaCl concentration, ANE treatment, and their interaction on plant growth, physiological responses, and stress tolerance mechanisms.
The results revealed that ANE significantly enhanced plant height at 50 mM NaCl (p = 0.0011), but no significant effect was observed at higher salinity levels (p > 0.05). This suggests that ANE is most effective at moderate salinity, potentially due to an optimal threshold where the extract can alleviate osmotic stress without being overwhelmed by excessive ionic toxicity. At higher NaCl concentrations, severe stress may surpass the protective capacity of ANE, limiting its impact on plant growth. Previous studies have shown similar findings in wheat, barley, and Arabidopsis thaliana, where seaweed extract treatments improved plant height and biomass under salinity stress by enhancing nutrient uptake and activating stress-responsive genes [35,36]. Jithesh et al. [37] and Shukla et al. [38] demonstrated that ANE treatment improved growth parameters in Arabidopsis thaliana under NaCl stress by increasing the expression of genes involved in osmotic adjustment and antioxidant defense. However, at 70 and 100 mM NaCl, ANE did not significantly improve plant height, suggesting that its effectiveness diminishes under severe salinity stress.
A significant interaction between NaCl concentration and ANE treatment (p = 0.0064) indicates that ANE’s impact on shoot dry weight depends on salinity levels. ANE significantly increased biomass at 0 mM NaCl, enhancing growth under non-stress conditions, but had no effect at 50 or 70 mM NaCl. At 100 mM NaCl, shoot dry weight decreased in ANE-treated plants, likely due to severe osmotic stress outweighing its benefits. Similar trends have been observed in Capsicum annuum L., where biostimulants improve growth under moderate salinity but lose efficacy under extreme stress.
Conversely, root dry weight was not significantly affected by ANE treatment (p > 0.05), indicating that the extract did not contribute to root biomass accumulation under the tested conditions. This lack of response suggests that ANE’s impact on root development may be limited by factors such as nutrient availability, soil composition, or its ability to effectively reach the rhizosphere. Previous studies on seaweed-based biostimulants suggest that their influence on root growth is often species-dependent and can vary with environmental conditions [39,40]. Further investigations are needed to assess whether ANE’s effects on root biomass can be enhanced through different application methods or in combination with other soil amendments. The ability of ANE to influence root growth is likely dependent on additional factors such as nutrient availability, soil conditions, and plant species-specific responses, as suggested by prior research on seaweed-based biostimulants [39,40].
Osmotic adjustment plays a crucial role in plant stress tolerance, with proline and soluble proteins being key components in maintaining cellular homeostasis under salinity stress. The results demonstrated that ANE significantly increased proline content at 50 mM NaCl (p = 0.0011), whereas no significant changes were observed at other salinity levels (p > 0.05), suggesting its role in osmotic regulation., indicating its role in osmotic regulation. However, no significant differences were observed at 0, 70, or 100 mM NaCl (p > 0.05). This aligns with previous studies that have shown ANE-induced proline accumulation as a protective mechanism against salinity stress in Arabidopsis thaliana and other crops [41,42].
Total soluble protein content significantly increased at 0, 50, and 70 mM NaCl (p < 0.01), suggesting that ANE enhances stress-related protein synthesis, contributing to osmotic balance and oxidative stress mitigation. However, at 100 mM NaCl (p = 0.2921), ANE had no effect, indicating that severe salinity stress may exceed its protective capacity. The significant interaction between NaCl and ANE (p < 0.01) further supports ANE’s role in protein accumulation under mild-to-moderate salinity, aligning with findings in wheat and Arabidopsis, where biostimulants improve protein metabolism but lose efficacy under extreme salt stress.
Leaf sap pH and electrical conductivity (EC) are key indicators of ionic regulation and osmotic balance under salinity stress. The results showed that ANE had no significant effect on leaf sap pH (p > 0.05), indicating that it does not alter intracellular pH homeostasis under saline conditions. This contrasts with previous studies where ANE was reported to stabilize pH in stressed plants, suggesting that species-specific metabolic pathways may influence its regulatory effects. Additionally, environmental conditions such as soil composition and ion availability could play a role in determining pH homeostasis in response to ANE treatment. This contrasts with previous studies where ANE stabilized pH in stressed plants, likely due to differences in species-specific responses and environmental factors [43].
However, EC significantly increased at 70 and 100 mM NaCl (p < 0.01) with ANE treatment, suggesting improved ionic regulation under high salinity. This increase in EC may indicate enhanced osmotic adjustment, supporting water uptake and cell turgor under salinity stress. However, it is also possible that the rise in EC reflects excessive ion accumulation, which could negatively impact plant metabolism and growth at higher NaCl concentrations. Further studies are needed to determine whether ANE promotes selective ion uptake to maintain a favorable Na+/K+ balance or contributes to salt accumulation in plant tissues. Increased EC levels indicate enhanced ion accumulation, which can contribute to osmotic balance and stress tolerance. Previous studies have demonstrated that seaweed extracts regulate key ionic ratios, including K+/Na+ and Ca2+/Na+, thereby improving ion transport and mitigating sodium toxicity [44,45]. These findings suggest that ANE supports ionic homeostasis under severe salinity stress, although further research is needed to determine its long-term impact on nutrient assimilation and ion balance.
Salinity stress negatively impacts photosynthesis by reducing chlorophyll content and disrupting light-harvesting complexes. In this study, ANE significantly increased chlorophyll “a” (p < 0.0001) and carotenoid content (p < 0.0001), while chlorophyll “b” remained unchanged (p > 0.05). The selective increase in chlorophyll “a” and carotenoids suggests that ANE optimizes photosynthetic efficiency and antioxidative defense mechanisms under salinity stress.
Chlorophyll “a” is the primary pigment responsible for light absorption, while carotenoids play a crucial role in photoprotection by scavenging reactive oxygen species (ROS). The increase in carotenoid content highlights ANE’s potential in enhancing stress tolerance by preventing oxidative damage [46,47]. Similar findings have been reported in okra (Abelmoschus esculentus) and Arabidopsis thaliana, where ANE application increased chlorophyll and carotenoid levels, contributing to improved plant resilience under abiotic stress [47–49]. Additionally, ANE has been shown to improve growth, fruit yield, and water productivity in tomatoes under water-deficit stress by optimizing photosynthetic efficiency and maintaining physiological activity. It also stabilizes cell membranes, mitigates ROS bursts, and strengthens antioxidant defense, thereby enhancing overall plant performance [50].
The stability of chlorophyll “b” levels suggests that ANE selectively enhances pigments most critical for photosynthetic performance without altering the overall chlorophyll composition. The unchanged chlorophyll “b” levels, despite significant increases in chlorophyll “a” and carotenoids, may indicate a specific ANE effect on light-harvesting efficiency rather than a broad alteration of pigment composition. This selective enhancement likely optimizes energy absorption and conversion under stress conditions while maintaining the balance of light-harvesting complexes. Previous studies have shown that seaweed-based biostimulants can fine-tune photosynthetic mechanisms to improve stress resilience without affecting non-essential pigment fractions. This targeted response ensures resource-efficient energy conversion and highlights ANE’s role in fine-tuning photosynthetic mechanisms under stress conditions.
These results highlight the potential of ANE as a biostimulant for enhancing salinity tolerance in Portulaca oleracea. While ANE significantly improved shoot dry weight and protein content under moderate salinity, its benefits diminished at high NaCl concentrations, indicating a threshold beyond which salt stress becomes detrimental. The increase in EC at higher salinity suggests that ANE may assist in ionic regulation, but further studies are needed to determine whether this is due to enhanced Na+/K+ balance or increased ion accumulation. Future research should focus on the molecular mechanisms underlying ANE’s effects and its long-term benefits for crop productivity under saline conditions.
Acknowledgement: The authors would like to express their appreciation to the University of Jeddah for providing a supportive research environment during this study. All individuals mentioned in this section have provided their consent to be acknowledged.
Funding Statement: The authors received no specific funding for this study.
Author Contributions: Nouf Asiri conducted the experiments, contributed to data collection, and participated in manuscript writing. Rewaa Jalal conceptualized and designed the study, analyzed the data, and contributed to manuscript preparation. Zahra Alhawsa assisted with methodology development and statistical analysis. All authors reviewed the results and approved the final version of the manuscript.
Availability of Data and Materials: The datasets generated and/or analyzed during the current study are available from the corresponding author on reasonable request.
Ethics Approval: Not applicable.
Conflicts of Interests: The authors declare no conflicts of interest to report regarding the present study.
References
1. Soda N, Sharan A, Gupta BK, Singla-Pareek SL, Pareek A. Evidence for nuclear interaction of a cytoskeleton protein (OsIFL) with metallothionein and its role in salinity stress tolerance. Sci Rep. 2016;6:34762. doi:10.1038/srep34762. [Google Scholar] [PubMed] [CrossRef]
2. Machado R, Serralheiro R. Soil salinity: effect on vegetable crop growth. management practices to prevent and mitigate soil salinization. Horticulturae. 2017;3(2):30. doi:10.3390/horticulturae3020030. [Google Scholar] [CrossRef]
3. Corwin DL. Soil salinity. In: Soil constraints on crop production. Newcastle upon Tyne; UK: Cambridge Scholars Publishing UK; 2022. p. 139–71. [Google Scholar]
4. Tanji KK. Nature and extent of agricultural salinity. In: Agricultural salinity assessment and management. Reston, VA, USA: Amer Society of Civil Engineers; 1990. p. 71–92. [Google Scholar]
5. Rozema J, Flowers T. Crops for a salinized world. Science. 2008;322(5907):1478–80. doi:10.1126/science.1168572. [Google Scholar] [PubMed] [CrossRef]
6. Yeo AR, Flowers SA, Rao G, Welfare K, Senanayake N, Flowers TJ. Silicon reduces sodium uptake in rice (Oryza sativa L.) in saline conditions and this is accounted for by a reduction in the transpirational bypass flow. Plant Cell Environ. 1999;22(5):559–65. doi:10.1046/j.1365-3040.1999.00418.x. [Google Scholar] [CrossRef]
7. Qadir M, Quillérou E, Nangia V, Murtaza G, Singh M, Thomas RJ, et al. Economics of salt-induced land degradation and restoration. Nat Resour Forum. 2014;38(4):282–95. doi:10.1111/1477-8947.12054. [Google Scholar] [CrossRef]
8. Tomeo NJ, Rosenthal DM. Variable mesophyll conductance among soybean cultivars sets a tradeoff between photosynthesis and water-use-efficiency. Plant Physiol. 2017;174(1):241–57. doi:10.1104/pp.16.01940. [Google Scholar] [PubMed] [CrossRef]
9. Zuo Z, Ye F, Wang Z, Li S, Li H, Guo J, et al. Salt acclimation induced salt tolerance in wild-type and chlorophyl b-deficient mutant wheat. Plant Soil Environ. 2021;67(1):26–32. doi:10.17221/429/2020-PSE. [Google Scholar] [CrossRef]
10. Zaman M, Shahid SA, Heng L. Introduction to soil salinity, sodicity and diagnostic techniques. In: Shahid SA, Zaman M, Heng L, editors. Guideline for salinity assessment, mitigation and adaptation using nuclear and related techniques. Berlin/Heidelberg, Germany: Springer; 2018. p. 1–42. doi:10.1007/978-3-319-96190-3_1. [Google Scholar] [CrossRef]
11. Mbarki S, Sytar O, Cerda A, Zivcak M, Rastogi A, He X, et al. Strategies to mitigate the salt stress effects on photosynthetic apparatus and productivity of crop plants. In: Kumar V, Wani S, Suprasanna P, Tran L, editors. Salinity responses and tolerance in plants. Vol. 1: targeting sensory, transport and signaling mechanisms. Berlin/Heidelberg, Germany: Springer International Publishing; 2018. p. 85–136. doi:10.1007/978-3-319-75671-4_4. [Google Scholar] [CrossRef]
12. Kaleem F, Shabir G, Aslam K, Rasul S, Manzoor H, Shah SM, et al. An overview of the genetics of plant response to salt stress: present status and the way forward. Appl Biochem Biotechnol. 2018;186(2):306–34. doi:10.1007/s12010-018-2738-y. [Google Scholar] [PubMed] [CrossRef]
13. Khan A, Tan DKY, Afridi MZ, Luo H, Tung SA, Ajab M, et al. Nitrogen fertility and abiotic stresses management in cotton crop: a review. Environ Sci Pollut Res Int. 2017;24(17):14551–66. doi:10.1007/s11356-017-8920-x. [Google Scholar] [PubMed] [CrossRef]
14. Ahmad R, Jamil S, Shahzad M, Zörb C, Irshad U, Khan N, et al. Metabolic profiling to elucidate genetic elements due to salt stress. CLEAN Soil Air Water. 2017;45(12):1600574. doi:10.1002/clen.201600574. [Google Scholar] [CrossRef]
15. Chojnacka K, Wieczorek PP, Schroeder G, Michalak Ieditors. Algae biomass: characteristics and applications: towards algae-based products. Vol. 8. Berlin/Heidelberg, Germany: Springer; 2018. [Google Scholar]
16. Bonomelli C, Celis V, Lombardi G, Mártiz J. Salt stress effects on avocado (Persea americana Mill.) plants with and without seaweed extract (Ascophyllum nodosum) application. Agronomy. 2018;8(5):64. doi:10.3390/agronomy8050064. [Google Scholar] [CrossRef]
17. Mutale-joan C, Rachidi F, Mohamed HA, El Mernissi N, Aasfar A, Barakate M, et al. Microalgae-cyanobacteria-based biostimulant effect on salinity tolerance mechanisms, nutrient uptake, and tomato plant growth under salt stress. J Appl Phycol. 2021;33(6):3779–95. doi:10.1007/s10811-021-02559-0. [Google Scholar] [CrossRef]
18. Senousy HH, Hamoud YA, Abu-Elsaoud AM, Mahmoud Al Zoubi O, Abdelbaky NF, Zia-Ur-Rehman M, et al. Algal bio-stimulants enhance salt tolerance in common bean: dissecting morphological, physiological, and genetic mechanisms for stress adaptation. Plants. 2023;12(21):3714. doi:10.3390/plants12213714. [Google Scholar] [PubMed] [CrossRef]
19. Cazzonelli CI, Nisar N, Hussain D, Carmody ME, Pogson BJ. Biosynthesis and regulation of carotenoids in plants—micronutrients, vitamins and health benefits. In: Pua EC, Davey MR, editors. Plant developmental biology—biotechnological perspectives. Vol. 2. Berlin/Heidelberg, Germany: Springer; 2010. p. 117–37. doi:10.1007/978-3-642-04670-4_8. [Google Scholar] [CrossRef]
20. Hou Q, Ufer G, Bartels D. Lipid signalling in plant responses to abiotic stress. Plant Cell Environ. 2016;39(5):1029–48. doi:10.1111/pce.12666. [Google Scholar] [PubMed] [CrossRef]
21. Granrut ADBD, Cacas JL. How very-long-chain fatty acids could signal stressful conditions in plants? Front Plant Sci. 2016;7:1490. doi:10.3389/fpls.2016.01490. [Google Scholar] [PubMed] [CrossRef]
22. Ali Q, Hasanuzzaman M editors. Plant-based biostimulants and plant stress responses. In: Plant ecophysiology and adaptation under climate change: mechanisms and perspectives I. Singapore: Springer; 2020. doi:10.1007/978-981-15-2156-0_22. [Google Scholar] [CrossRef]
23. Verma N, Sehrawat KD, Mundlia P, Sehrawat AR, Choudhary R, Rajput VD, et al. Potential use of Ascophyllum nodosum as a biostimulant for improving the growth performance of Vigna aconitifolia (jacq.) marechal. Plants. 2021;10(11):2361. doi:10.3390/plants10112361. [Google Scholar] [PubMed] [CrossRef]
24. MacFarlane C, Hoffman M, Eamus D, Kerp N, Higginson S, McMurtrie R, et al. Estimation of leaf area index in eucalypt forest using digital photography. Agric For Meteor. 2007;143(3–4):176–88. doi:10.1016/j.agrformet.2006.10.013. [Google Scholar] [CrossRef]
25. Barrs HD, Weatherley PE. A re-examination of the relative turgidity technique for estimating water deficits in leaves. Aust Jnl Bio Sci. 1962;15(3):413. doi:10.1071/bi9620413. [Google Scholar] [CrossRef]
26. Lichtenthaler HK. Chlorophylls and carotenoids: pigments of photosynthetic biomembranes. Meth Enzymol. 1987;148:350–82. doi:10.1016/0076-6879(87)48036-1. [Google Scholar] [CrossRef]
27. Rodriguez-Amaya DB, Kimura M. HarvestPlus handbook for carotenoid analysis. Washington, DC, USA: International Food Policy Research Institute; 2004. [Google Scholar]
28. Rodríguez-Rodríguez E, Bermejo LM, Ortega RM. Carotenoids: chemistry, sources and physiology. In: Encyclopedia of human nutrition. 4th ed. Vol. 1–4. Cambridge, MA, USA: Academic Press; 2023. p. 144–53. [Google Scholar]
29. Britton G, Liaaen-Jensen S, Pfander Heditors. Carotenoids Vol. 1B: spectroscopy. Basel, Switzerland: Birkhäuser; 1995. p. 13–62. doi:10.1007/978-3-0348-9228-7 [Google Scholar] [CrossRef]
30. Bradford MM. A rapid and sensitive method for the quantitation of microgram quantities of protein utilizing the principle of protein-dye binding. Anal Biochem. 1976;72:248–54. doi:10.1016/0003-2697(76)90527-3. [Google Scholar] [PubMed] [CrossRef]
31. Bates LS, Waldren RP, Teare ID. Rapid determination of free proline for water-stress studies. Plant Soil. 1973;39(1):205–7. doi:10.1007/BF00018060. [Google Scholar] [CrossRef]
32. Emilia DA, Luisa DA, Stefania DP, Petronia C. Use of biostimulants to improve salinity tolerance in agronomic crops. In: Hasanuzzaman M, editor. Agronomic crops. Singapore: Springer; 2020. p. 1–42. doi:10.1007/978-981-15-0025-1_21. [Google Scholar] [CrossRef]
33. Carillo P, Ciarmiello LF, Woodrow P, Corrado G, Chiaiese P, Rouphael Y. Enhancing sustainability by improving plant salt tolerance through macro- and micro-algal biostimulants. Biology. 2020;9(9):253. doi:10.3390/biology9090253. [Google Scholar] [PubMed] [CrossRef]
34. Rouphael Y, Colla G. Biostimulants in agriculture. Front Plant Sci. 2020;11:40. doi:10.3389/fpls.2020.00040. [Google Scholar] [PubMed] [CrossRef]
35. Najafi Vafa Z, Sohrabi Y, Mirzaghaderi G, Heidari G. Soil microorganisms and seaweed application with supplementary irrigation improved physiological traits and yield of two dryland wheat cultivars. Front Plant Sci. 2022;13:855090. doi:10.3389/fpls.2022.855090. [Google Scholar] [PubMed] [CrossRef]
36. Hariharan G, Vathshalyan N, Galahitigama H, Wimalasiri U, Don Kapila Kumara G. Potential of foliar application of seaweed extracts as a biostimulant for abiotic stress alleviation on crop production. Rev Agric Sci. 2024;12:295–312. doi:10.7831/ras.12.0_295. [Google Scholar] [CrossRef]
37. Jithesh MN, Shukla PS, Kant P, Joshi J, Critchley AT, Prithiviraj B. Physiological and transcriptomics analyses reveal that Ascophyllum nodosum extracts induce salinity tolerance in Arabidopsis by regulating the expression of stress responsive genes. J Plant Growth Regul. 2019;38(2):463–78. doi:10.1007/s00344-018-9861-4. [Google Scholar] [CrossRef]
38. Shukla PS, Mantin EG, Adil M, Bajpai S, Critchley AT, Prithiviraj B. Ascophyllum nodosum-based biostimulants: sustainable applications in agriculture for the stimulation of plant growth, stress tolerance, and disease management. Front Plant Sci. 2019;10:655. doi:10.3389/fpls.2019.00655. [Google Scholar] [PubMed] [CrossRef]
39. Yildiztekin M, Tuna AL, Kaya C. Physiological effects of the brown seaweed (Ascophyllum nodosum) and humic substances on plant growth, enzyme activities of certain pepper plants grown under salt stress. Acta Biol Hung. 2018;69(3):325–35. doi:10.1556/018.68.2018.3.8. [Google Scholar] [PubMed] [CrossRef]
40. De Saeger J, Van Praet S, Vereecke D, Park J, Jacques S, Han T, et al. Toward the molecular understanding of the action mechanism of Ascophyllum nodosum extracts on plants. J Appl Phycol. 2020;32(1):573–97. doi:10.1007/s10811-019-01903-9. [Google Scholar] [CrossRef]
41. Ghosh UK, Islam MN, Siddiqui MN, Cao X, Khan MR. Proline, a multifaceted signalling molecule in plant responses to abiotic stress: understanding the physiological mechanisms. Plant Biol. 2022;24(2):227–39. doi:10.1111/plb.13363. [Google Scholar] [PubMed] [CrossRef]
42. Shukla PS, Borza T, Critchley AT, Hiltz D, Norrie J, Prithiviraj B. Ascophyllum nodosum extract mitigates salinity stress in Arabidopsis thaliana by modulating the expression of miRNA involved in stress tolerance and nutrient acquisition. PLoS One. 2018;13(10):e0206221. doi:10.1371/journal.pone.0206221. [Google Scholar] [PubMed] [CrossRef]
43. Di Stasio E, Van Oosten MJ, Silletti S, Raimondi G, Dell’Aversana E, Carillo P, et al. Ascophyllum nodosum-based algal extracts act as enhancers of growth, fruit quality, and adaptation to stress in salinized tomato plants. J Appl Phycol. 2018;30(4):2675–86. doi:10.1007/s10811-018-1439-9. [Google Scholar] [CrossRef]
44. Munns R, Tester M. Mechanisms of salinity tolerance. Annu Rev Plant Biol. 2008;59:651–81. doi:10.1146/annurev.arplant.59.032607.092911. [Google Scholar] [PubMed] [CrossRef]
45. Hosseini S, Shabani L, Sabzalian MR, Gharibi S. Foliar spray of commercial seaweed and amino acid-derived biostimulants promoted phytoremediation potential and salinity stress tolerance in halophytic grass, Puccinellia distans. Int J Phytorem. 2023;25(4):415–29. doi:10.1080/15226514.2022.2088688. [Google Scholar] [PubMed] [CrossRef]
46. Huang L, Li Z, Liu Q, Pu G, Zhang Y, Li J. Research on the adaptive mechanism of photosynthetic apparatus under salt stress: new directions to increase crop yield in saline soils. Ann Appl Biol. 2019;175(1):1–17. doi:10.1111/aab.12510. [Google Scholar] [CrossRef]
47. Ali J, Jan I, Ullah H, Ahmed N, Alam M, Ullah R, et al. Influence of Ascophyllum nodosum extract foliar spray on the physiological and biochemical attributes of okra under drought stress. Plants. 2022;11(6):790. doi:10.3390/plants11060790. [Google Scholar] [PubMed] [CrossRef]
48. Babar M. A comprehensive review on drought stress response in cotton at physiological, biochemical and molecular level. Pure Appl Biol. 2023;12(1):610–22. doi:10.19045/bspab.2023.120063. [Google Scholar] [CrossRef]
49. Ahmed M, Ullah H, Piromsri K, Tisarum R, Cha-um S, Datta A. Effects of an Ascophyllum nodosum seaweed extract application dose and method on growth, fruit yield, quality, and water productivity of tomato under water-deficit stress. S Afr N J Bot. 2022;151:95–107. doi:10.1016/j.sajb.2022.09.045. [Google Scholar] [CrossRef]
50. Zulfiqar F, Akram NA, Ashraf M. Osmoprotection in plants under abiotic stresses: new insights into a classical phenomenon. Planta. 2019;251(1):3. doi:10.1007/s00425-019-03293-1. [Google Scholar] [PubMed] [CrossRef]
Cite This Article
 Copyright © 2025 The Author(s). Published by Tech Science Press.
This work is licensed under a Creative Commons Attribution 4.0 International License , which permits unrestricted use, distribution, and reproduction in any medium, provided the original work is properly cited.
 Downloads
 Citation Tools