
 Submit a Paper
 Propose a Special lssue
 Open Access
ARTICLE

Optimizing Ethanol Concentrations to Enhance Growth and Bioactive Compound Production in Agastache rugosa Cultivated in a Plant Factory
1 Department of Horticultural Science, Chungnam National University, Daejeon, 34134, Republic of Korea
2 Faculty of Agriculture and Forestry, Tay Bac University, Son La, 360000, Vietnam
3 Department of Bio-AI Convergence, Chungnam National University, Daejeon, 34134, Republic of Korea
4 Rural Research Institute, Korea Rural Community Corporation, Ansan, 15634, Republic of Korea
5 Department of Biological and Agricultural Engineering, University of California, Davis, CA 95691, USA
6 Faculty of Heath Science, Tay Bac University, Son La, 360000, Vietnam
* Corresponding Author: Jongseok Park. Email:
# These authors contributed equally to this work
(This article belongs to the Special Issue: Advances in Molecular Insights of Plant Secondary Metabolites: Biosynthesis, Regulation, and Applications)
Phyton-International Journal of Experimental Botany 2025, 94(4), 1253-1267. https://doi.org/10.32604/phyton.2025.062507
Received 19 December 2024; Accepted 27 March 2025; Issue published 30 April 2025
 View Full Text
 Download PDF
Abstract
Agastache rugosa, a medicinal plant known for its bioactive compounds, has gained attention for its pharmacological and commercial potential. This study aimed to optimize ethanol concentration to enhance growth and bioactive compound production in A. rugosa cultivated in a controlled plant factory system. Ethanol treatments at 40 and 80 mM significantly promoted both vegetative and reproductive growth. Plants treated with these concentrations exhibited higher net photosynthetic rates (A) and intercellular CO2 concentration (Ci) compared to the untreated control, whereas stomatal conductance (gs) and transpiration rate (E) remained unaffected. Chlorophyll and carotenoid concentrations, and SPAD values, significantly increased with ethanol treatment. Total flavonoid and total phenolic contents as well as 2,2-diphenyl-1-picrylhydrazyl (DPPH) radical-scavenging activities were significantly higher in plants treated with ethanol than in the untreated control. Ethanol treatments led to a significant enhancement in the activities of antioxidant enzymes, including superoxide dismutase, peroxidase, and catalase. Furthermore, ethanol treatment elevated rosmarinic acid concentrations in roots and tilianin and acacetin levels in flowers. Collectively, ethanol at 40 and 80 mM effectively enhanced growth, photosynthesis, antioxidant defense, and bioactive compound production in A. rugosa cultivated in a plant factory. These findings provide valuable insights for improving cultivation of medicinal plants with high pharmaceutical and nutraceutical value.Keywords
The Lamiaceae family, commonly known as the mint family, comprises over 7000 species distributed across tropical, subtropical, and temperate regions worldwide [1]. Agastache rugosa, a member of this family, has highly been valued for its essential oil, which has diverse applications in culinary arts, pharmaceuticals, medicine, and cosmetics [2]. This medicinal herb is renowned for its antioxidant [3], antimicrobial [4], analgesic [5], anticancer [6], cardiovascular [7], anti-inflammatory properties [8], as well as its potential to enhance the human immune system response [9]. Plant polyphenols, including hydroxybenzoic acids and simple phenols, contribute to its bioactivity [10]. The primary bioactive compounds in A. rugosa are acacetin, tilianin, and rosmarinic acid (RA) [11]. Acacetin, a flavone, has been used to treat cancers, metabolic disorders, inflammation, and infections [12]. Tilianin, a potent flavonoid glycoside, exhibits anti-inflammatory, antidiabetic, neuroprotective, antihypertensive, cardioprotective, antioxidant, anti-atherogenic, and antidepressant effects [13]. RA, an ester of 3,4-dihydroxyphenyllactic acid and caffeic acid, possesses numerous pharmacological applications, including anti-apoptotic, anti-inflammatory, antioxidant, and antitumor properties [14]. With growing concerns about the nutritional value and bioactive quality of food sources, along with environmental and economic considerations for sustainable crop management, there is an increasing need for profitable, sustainable, and ecologically sound strategies to enhance the quality of A. rugosa. Improving growth and bioactive compound production has long been a key objective in medicinal plant research [15]. Biotechnological approaches such as growth regulators, elicitors, and stress inducers have been used to achieve these goals [16,17].
Ethanol has been investigated for its potential to influence plant growth and bioactive compound production [18]. It has shown to act as an elicitor in plants, inducing stress responses that enhance bioactive compound synthesis [19]. Ethanol application has been shown to increase biomass and secondary metabolites levels in several herb species [18]. In oilseed rape seedlings, ethanol at low concentrations (0.0125–0.05 mL L−1) stimulated root tip growth and enhanced biomass and NPK accumulation, with 0.05 mL L−1 being the most effective. However, a higher concentration (0.25 mL L−1) significantly inhibited the growth [20]. Similarly, ethanol at low concentrations increased shoot dry weights in sweet wormwood and sweet basil [18], whereas higher ethanol concentrations reduced leaf area and shoot fresh weight (FW) in both Korean mint and sweet basil compared to untreated control. Total phenolic contents and 2,2-diphenyl-1-picrylhydrazyl (DPPH) radical scavenging activity increased with higher ethanol concentrations in these herbs, but total flavonoid contents showed no clear trend [18].
However, the effects of ethanol on A. rugosa remain largely unexplored. Given its medicinal importance, understanding how ethanol influences its growth and bioactive compound production could provide valuable insights for optimizing cultivation practices and enhancing phytochemical yields. This study aims to examine the effects of ethanol spray concentration on the growth, antioxidant enzyme activities, and bioactive compound contents of A. rugosa. By analyzing plant morphology, biomass, antioxidant enzyme activities, and secondary metabolite levels under different ethanol concentrations, this research seeks to elucidate the potential benefits and mechanisms underlying ethanol-induced changes. The findings could contribute to the development of improved cultivation techniques for A. rugosa, supporting its use in both traditional and modern medicinal applications.
2.1 Seedling Growing Conditions
A. rugosa seeds (Danong Seed Co., Ltd., Seoul, Republic of Korea) were germinated in trays in a room at 21.2 ± 4°C and 75.5 ± 9% RH. LED lighting provided a photosynthetic photon flux density (PPFD) of 190 ± 14 μmol m2 s−1 under a 16-h light/8-h dark cycle. Two weeks after sowing, seedlings were watered with Hoagland solution (pH 6.3, EC 1.15 dS m−1).
Four weeks after sowing, seedlings were moved to a deep flow technique system in a plant factory with controlled conditions: 22.5 ± 3°C, 67.5 ± 12% RH, and a PPFD of 223 ± 9 μmol m2 s−1 under a 16-h light/8-h dark cycle. Plants were grown for 39 days in Hoagland solution (pH 6.53, EC 2.03 dS m−1). Ethanol (10, 20, 40, 80 mM) was sprayed three times weekly from 7 days after transplanting (DAT), while controls received distilled water. Samples were collected at 39 DAT for analysis. The experiment was replicated twice at different times under identical conditions and locations.
2.3 Measurement of Plant Growth Parameters
Plant growth parameters included number of flower branches, number of leaves, leaf length, width, and area, stem and root lengths, and flower, leaf, stem, shoot, and root FW. Dry weights (DW) of all plant organs were measured after oven-drying at 70°C for 7 days. Flower DW, leaf area (LA), and leaf DW ratio were calculated relative to total DW, while specific LA was determined by LA/leaf DW.
2.4 Determination of Photosynthetic Characteristics
A portable LI-6400 system (Model LI-6400; Li-Cor Co., Inc., Lincoln, NE, USA) was used to measure net photosynthetic rate (A), intercellular CO2 concentration (Ci), stomatal conductance (gs), and transpiration rate (E). Leaf chamber conditions were set at 25°C, 60% RH, 1000 μmol m−2 s−1 PPFD, 400 μmol mol−1 CO2, and 500 cm3 s−1 airflow. SPAD values were measured using a Minolta 502 chlorophyll meter (Model 502; Minolta Camera Co., Ltd., Osaka, Japan).
2.5 Determination of Photosynthetic Pigments and 2,2-Diphenyl-1-Picrylhydrazyl (DPPH) Radical Scavenging Activity
Twenty mg of dried powder was extracted in 2 mL of 90% methanol, centrifuged, and the supernatant analyzed for chlorophyll (Chl) a, Chl b, carotenoids, and DPPH activity using an Epoch spectrophotometer at specified wavelengths, following Lam et al. [16,17].
2.6 Determination of Total Flavonoids and Total Phenolics
Total flavonoid and phenolic concentrations were measured colorimetrically as described by Lam et al. [16].
Enzyme extracts were prepared using an updated protocol based on the nitro blue tetrazolium (NBT) method described by Lam et al. [16]. The SOD (EC 1.15.1.1) assay was prepared with EDTA, NBT, methionine, riboflavin, PBS, and 20 μL of sample extract. The reaction was exposed to 200 μmol m−2 s−1 LED light for 8 min, and absorbance was recorded at 560 nm. The POD (EC 1.11.1.7) assay consisted of guaiacol, PBS, H2O2, and 20 μL of sample extract, with activity assessed based on tetraguaiacol formation at 560 nm. The CAT (EC 1.11.1.6) assay included 3.4 μL of 3% H2O2, 193.6 μL PBS, and 3 μL of sample extract, with absorbance measured at 240 nm after 4–5 min.
2.8 Determination of RA, Tilianin, Acacetin, and Acacetin Glycosides
RA, tilianin, acacetin, and acacetin glycosides [acacetin 1, 7-O-(2″-O-acetyl) β-D-glucopyranoside; acacetin 2, 7-O-(6″-O-malonyl) β-D-glucopyranoside; and acacetin 3, 7-O-(2″-O-acetyl-6″-O-malonyl) β-D-glucopyranoside] were analyzed by HPLC following the methods described by Lam et al. [16]. Briefly, 200 mg dried powder was extracted in methanol, sonicated, centrifuged, and filtered. A 10 μL sample was injected into a C18 column (250 × 4.6 mm, 5 μm) at 30°C, using a gradient of formic acid in water (A) and acetonitrile (B) at 0.8 mL/min: 20% B (0–5 min), 20%–50% B (5–10 min), 50% B (10–20 min), 50%–100% B (20–22 min).
The experiment used a completely randomized design with two independent temporal replicates at the same location. Growth parameters and SPAD values were measured on five plants per replicate, while other measurements were taken from three plants per replicate. Statistical analysis was performed using SPSS 20.0, with one-way ANOVA and Tukey’s HSD test (p < 0.05) to assess differences among treatments.
The growth of A. rugosa plants significantly increased with ethanol treatment, particularly at 40 and 80 mM (Fig. 1). Leaf length and width were significantly higher in plants treated with ethanol at 20 and 40 mM and at 20, 40, and 80 mM, respectively, than in the untreated control (Fig. 2A,B). Both the numbers of flower branches and leaves were significantly higher in plants treated with ethanol at 80 mM than in the untreated control (Fig. 2C,D), although the number of flower branches were also higher at 10 or 40 mM (Fig. 2C). Stem length and root DW were highest in plants treated with ethanol at 40 mM (Figs. 2F and 3G), whereas stem FW and DW, as well as root length and FW were highest at 80 mM (Figs. 2I and 3B,C,F). Shoot FW was significantly higher in plants treated with ethanol at 40 and 80 mM than in the untreated control (Fig. 3A). Leaf, shoot, and whole plant DW were also significantly higher in plants treated with ethanol at 20, 40, and 80 mM than in the untreated control (Figs. 3E,H and 4A). However, specific leaf area decreased with ethanol treatment at 10 or 20 mM (Fig. 3I). Leaf and flower weight ratios were highest in plants treated with ethanol at 20 mM (Fig. 4C,D). However, leaf area, flower and leaf FW, flower DW, and leaf area ratio were not significantly affected by ethanol treatment (Figs. 2E,H,G, 3D and 4B).
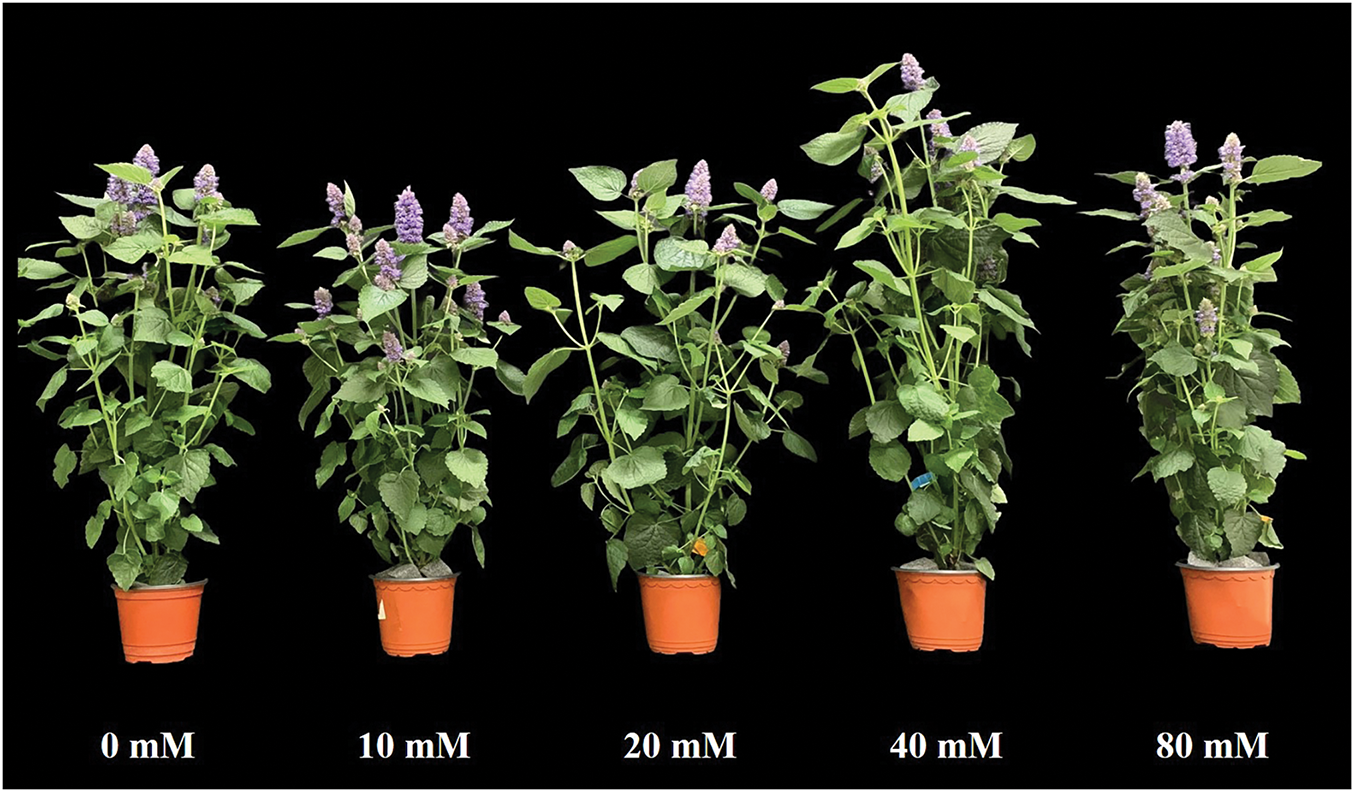
Figure 1: Representative images of A. rugosa grown in a plant factory for 39 days, sprayed three times weekly with ethanol concentrations (0, 10, 20, 40, and 80 mM)
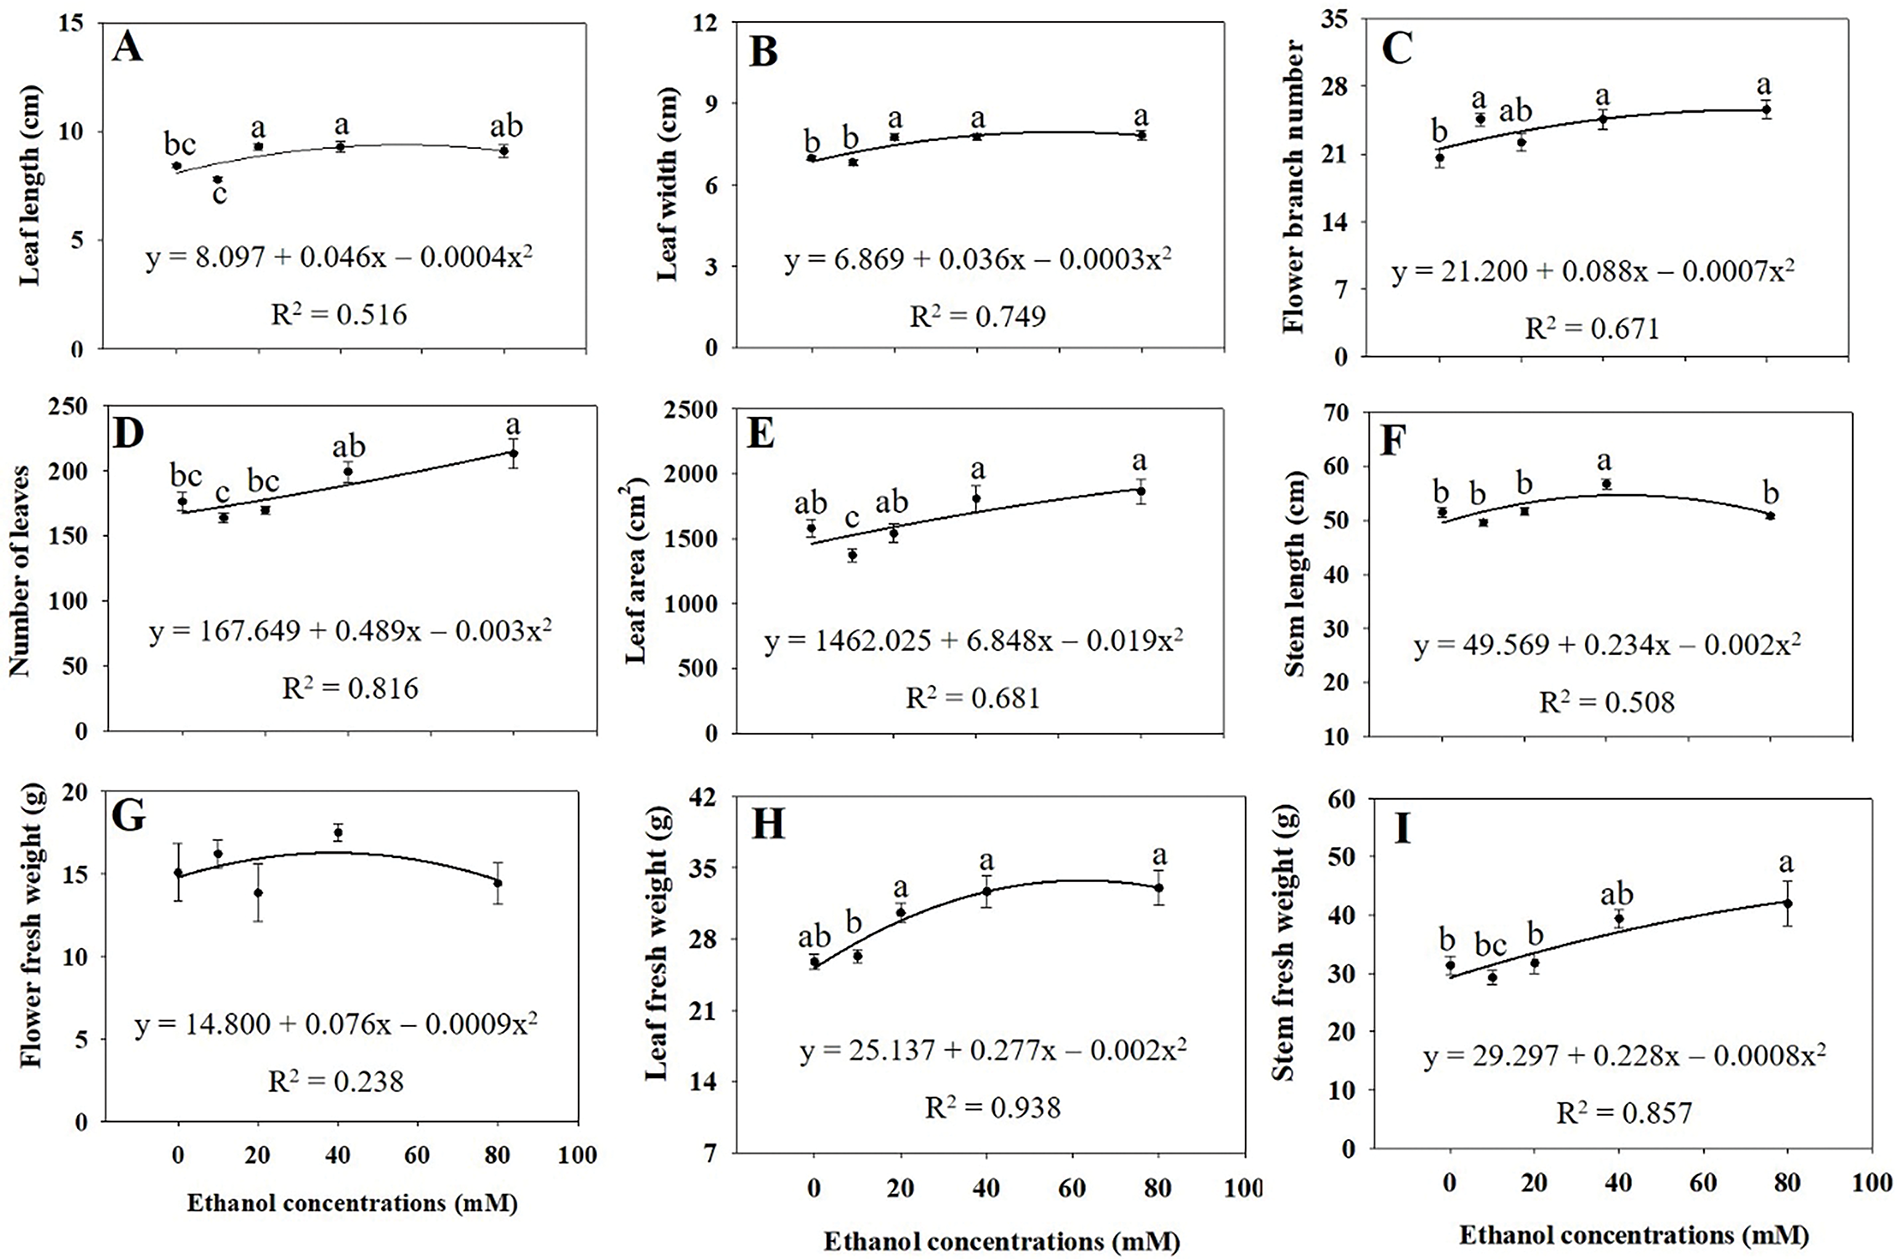
Figure 2: Leaf length (A), leaf width (B), number of flower branches (C), number of leaves (D), leaf area (E), stem length (F), and fresh weights of flower (G), leaf (H), and stem (I) of A. rugosa, sprayed with ethanol concentrations (0, 10, 20, 40, and 80 mM) three times a week. Vertical bars indicate standard errors from five samples. Means with the same letter are not significantly different (p < 0.05, Tukey’s HSD test)
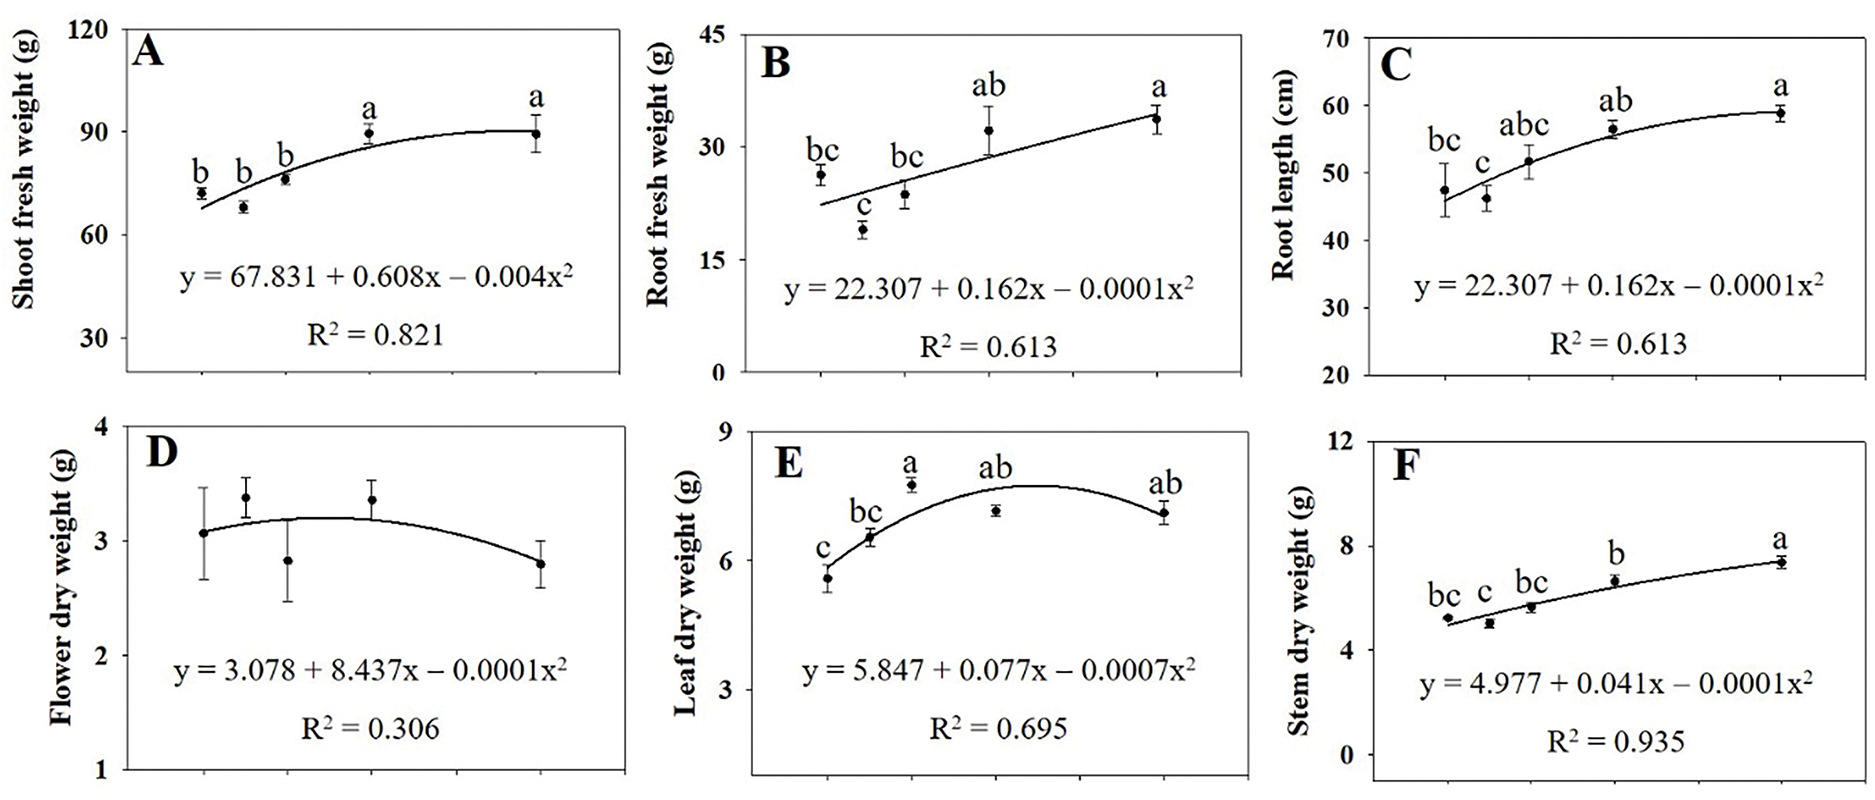
Figure 3: Shoot fresh weight (A), root fresh weight (B), root length (C), dry weights of flower (D), leaf (E), stem (F), root (G), and shoot (H), and specific leaf area (I) of A. rugosa, sprayed with ethanol (0, 10, 20, 40, 80 mM) three times weekly. Vertical bars indicate standard errors from five samples. Means with the same letter are not significantly different (p < 0.05, Tukey’s HSD test)
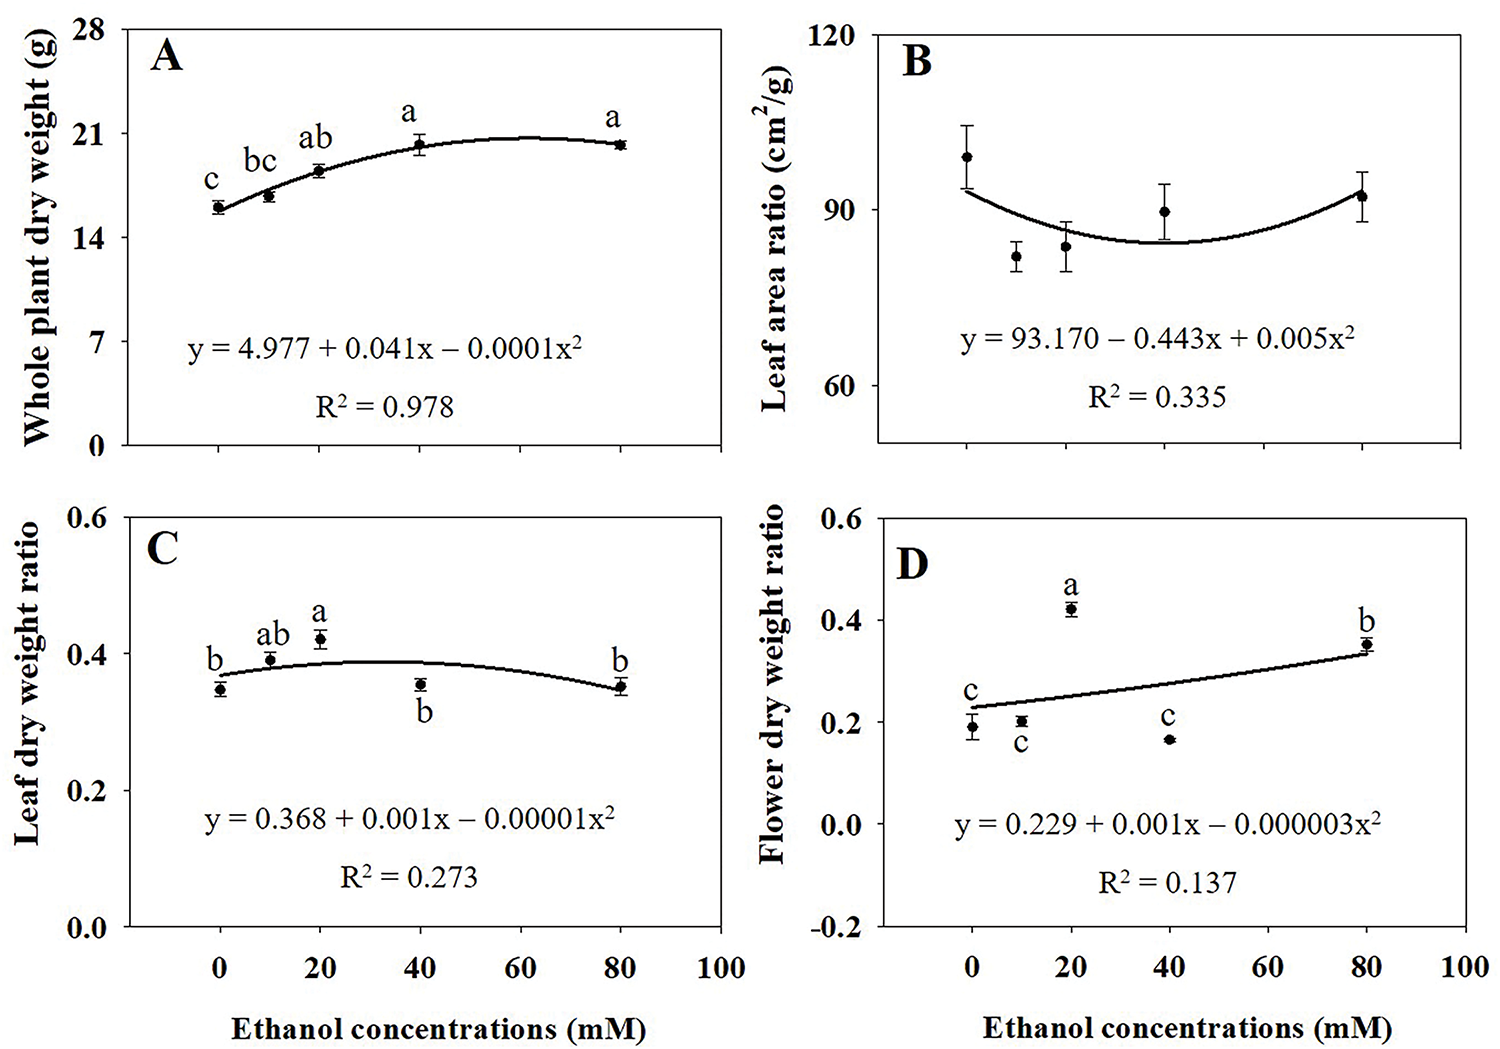
Figure 4: Whole plant dry weight (A), leaf area ratio (B), leaf dry weight ratio (C), and flower dry weight ratio (D) of A. rugosa, sprayed with ethanol (0, 10, 20, 40, 80 mM) three times weekly. Vertical bars indicate standard errors from five replicates. Means with the same letter are not significantly different (p < 0.05, Tukey’s HSD test)
3.2 Photosynthetic Characteristics and Pigments
Net photosynthetic rate (A) was significantly higher in plants treated with ethanol at 40 and 80 mM than in the untreated control (Fig. 5A). Intercellular CO2 concentration (Ci) was highest in plants treated with ethanol at 40 mM (Fig. 5C). However, stomatal conductance (gs) and transpiration rate (E) were not significantly affected by ethanol treatment (Fig. 5B,D).
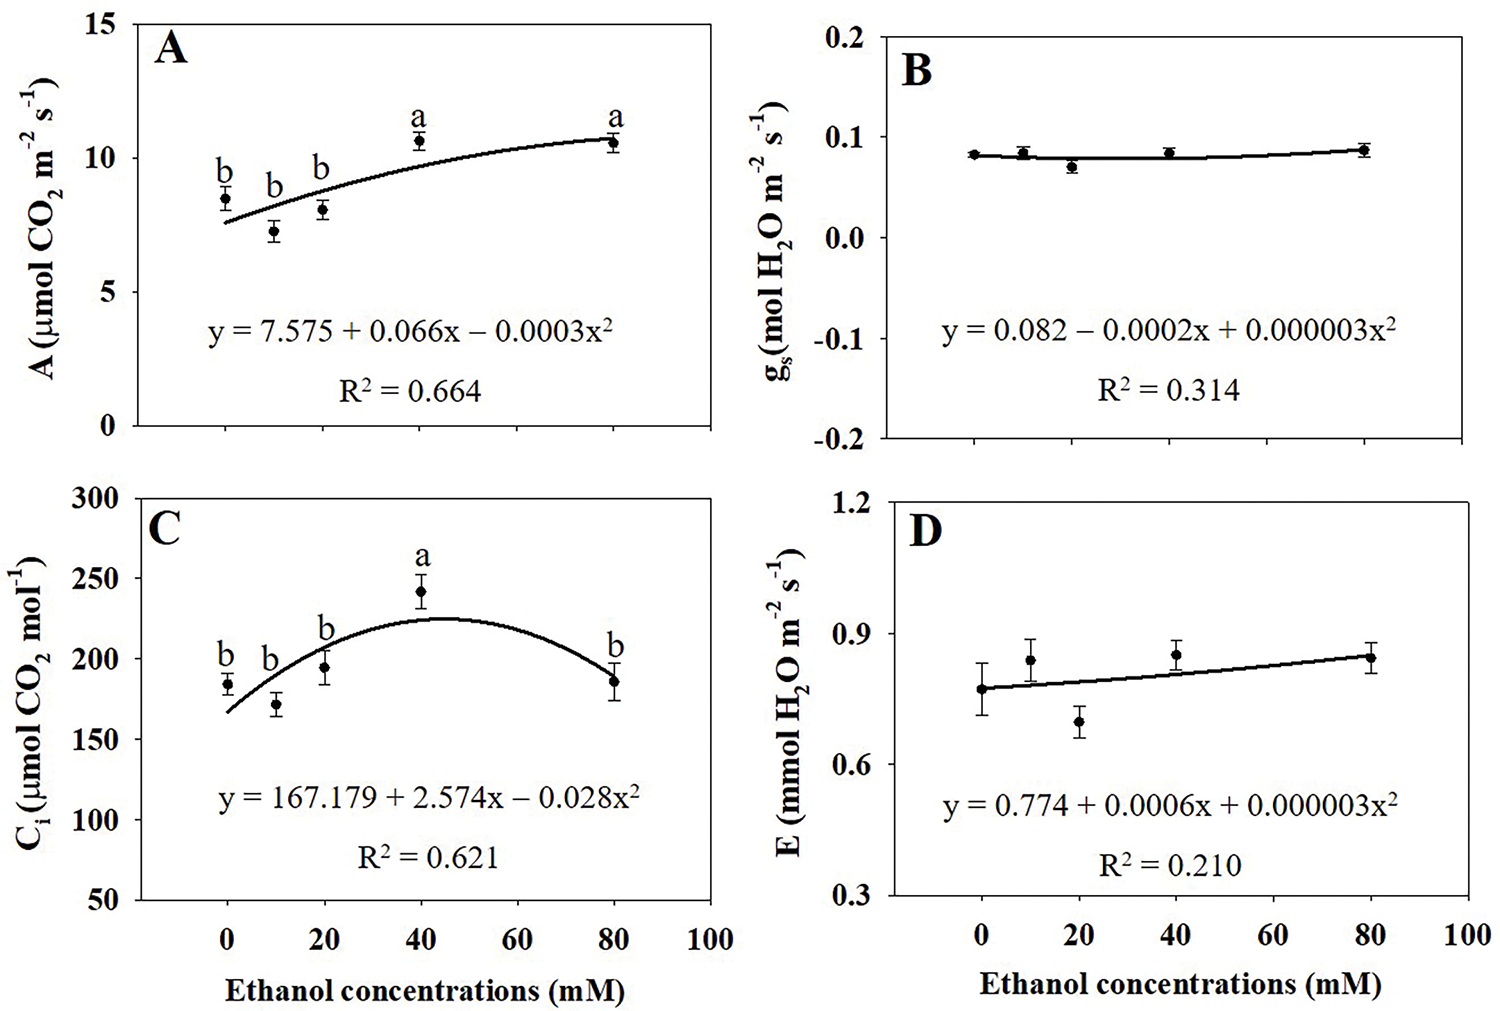
Figure 5: Net photosynthetic rate (A), stomatal conductance (B), intercellular CO2 concentration (C), and transpiration rate (D) of A. rugosa, sprayed with ethanol (0, 10, 20, 40, 80 mM) three times weekly. Vertical bars indicate standard errors from three replicates. Means with the same letter are not significantly different (p < 0.05, Tukey’s HSD test)
Chl a, Chl b, and total Chl concentrations significantly increased with ethanol treatment, except for Chl b concentration at 40 mM (Fig. 6A,B,D). The Chl a/b ratio tended to decrease with increasing ethanol concentration (Fig. 6C). Total carotenoid concentrations were highest in plants treated with ethanol at 40 mM (Fig. 6E). Additionally, SPAD values significantly increased with ethanol treatment at 40 and 80 mM (Fig. 6F).
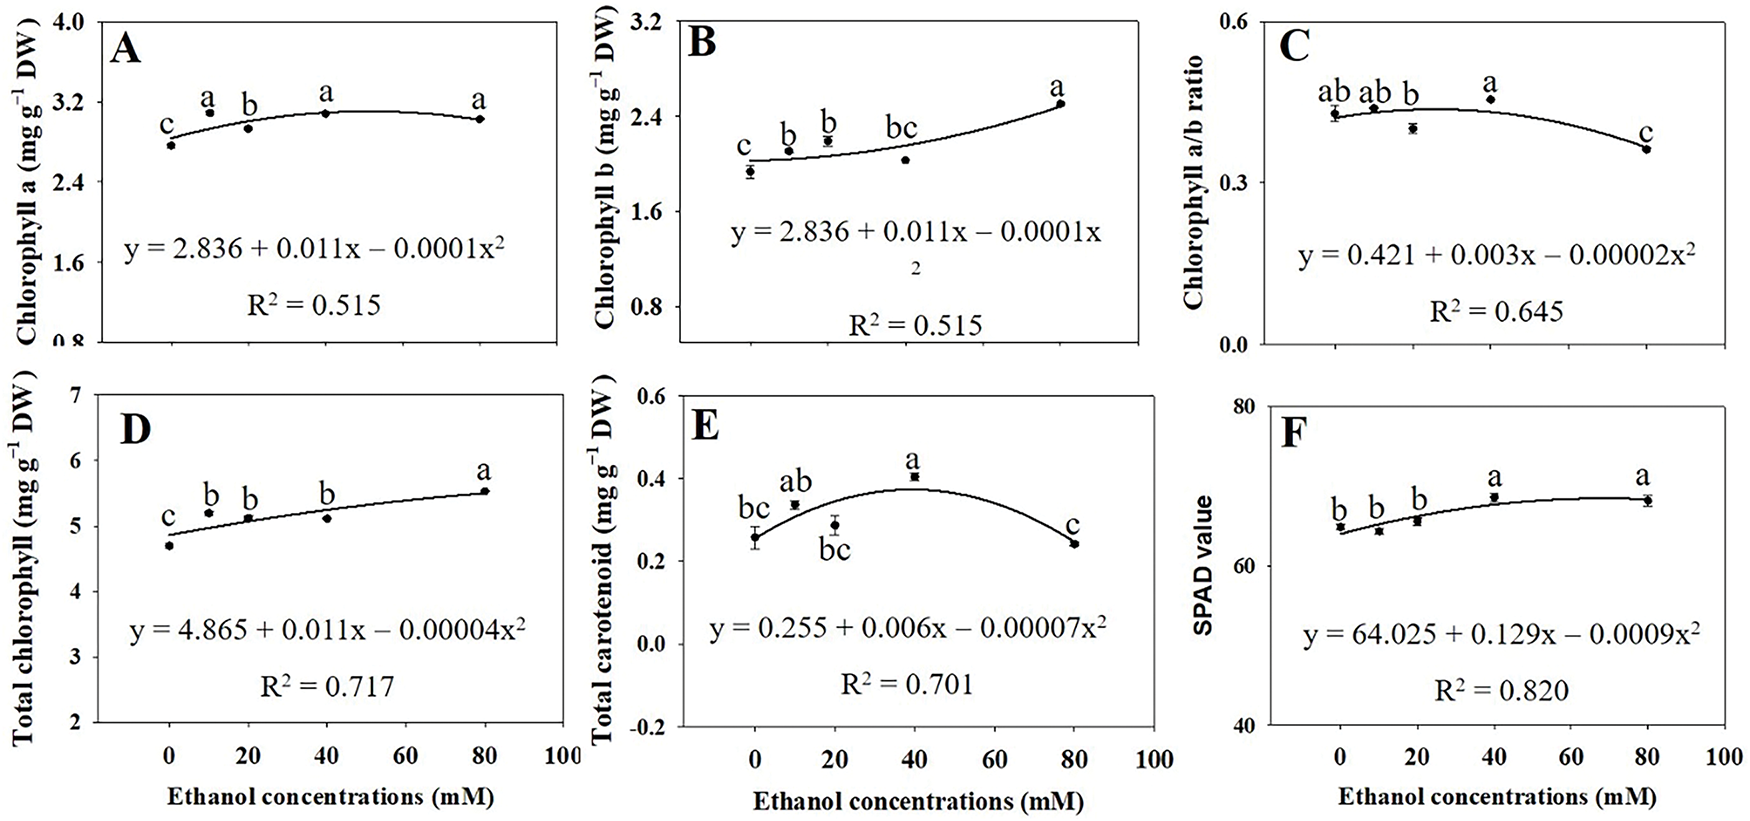
Figure 6: Chlorophyll a (A), chlorophyll b (B), chlorophyll a/b ratio (C), total chlorophyll (D), carotenoids (E), and SPAD (F) in A. rugosa, sprayed with ethanol (0, 10, 20, 40, and 80 mM) three times weekly. Bars show standard errors (n = 5). Means with the same letter are not significantly different (p < 0.05, Tukey’s HSD test)
3.3 Antioxidant Capacity and Total Flavonoid and Total Phenolic Concentrations
Total flavonoid concentrations significantly increased by 17.2% and 14.2% with ethanol treatment at 40 and 80 mM, respectively, compared to the control (Fig. 7B). Total phenolic concentrations increased by 15.6%, 18.2%, and 21.1% at 20, 40, and 80 mM, respectively (Fig. 7C). Additionally, DPPH radical-scavenging activity increased by 55.3% at 80 mM (Fig. 7A).
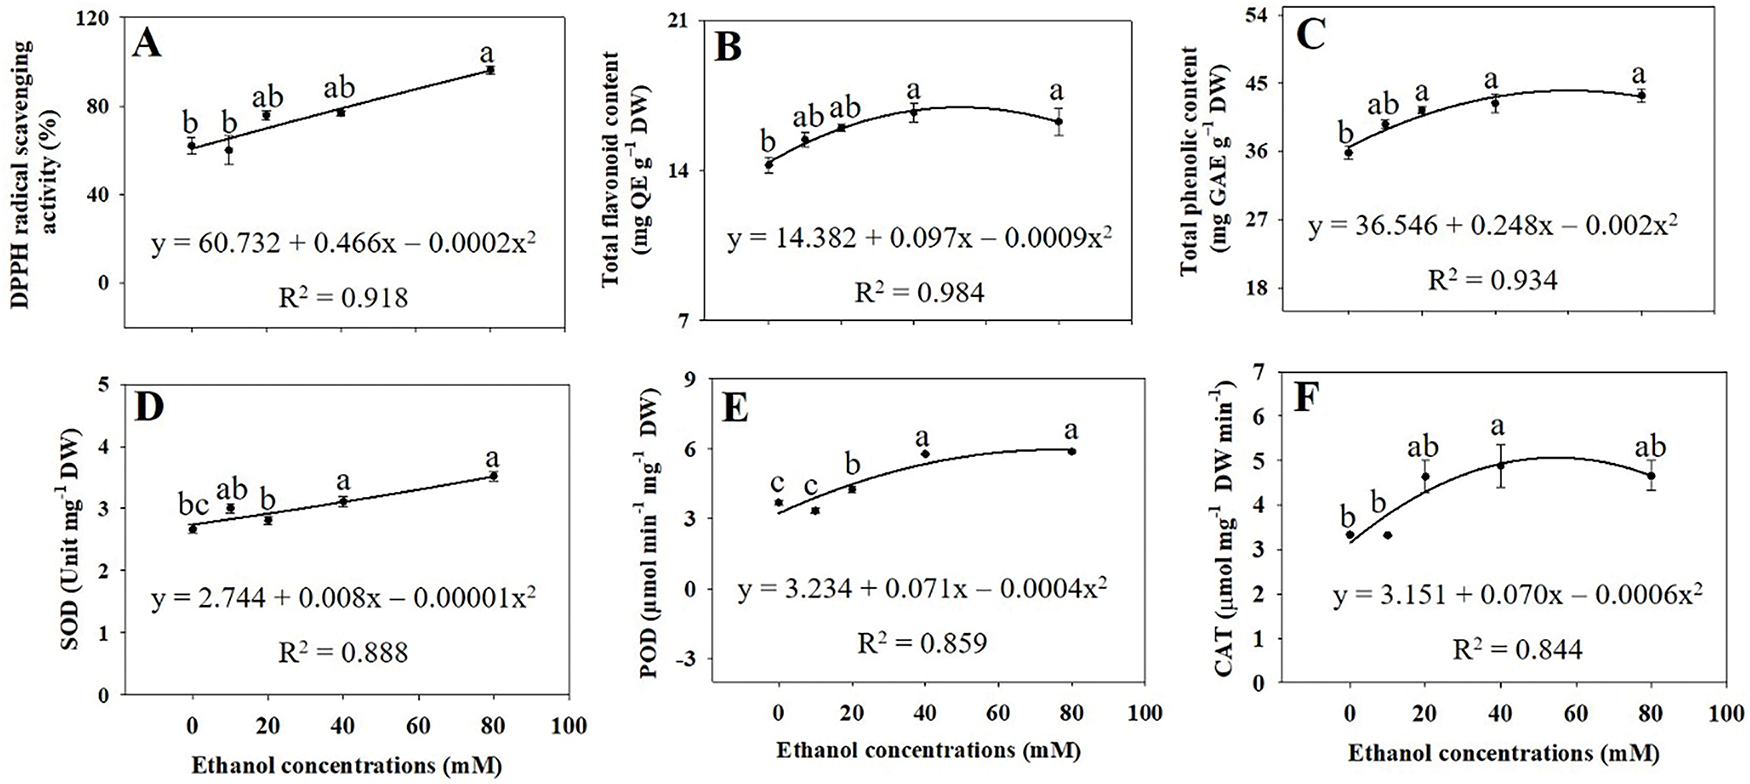
Figure 7: DPPH radical scavenging (A), total flavonoids (B), total phenolics (C), SOD (D), POD (E), and CAT (F) activity in A. rugosa, sprayed with ethanol (0, 10, 20, 40, and 80 mM) three times weekly. Bars show standard errors (n = 3). Means with the same letter are not significantly different (p < 0.05, Tukey’s HSD test)
SOD activity increased by 16.5% and 31.8% with the ethanol treatment at 40 and 80 mM, respectively, compared to the control (Fig. 7D). POD activity increased by 1.15-, 1.56-, and 3.26-fold with ethanol treatment at 20, 40, and 80 mM, respectively (Fig. 7E). CAT activity was highest at 40 mM, showing a 1.46-fold increase compared to the control (Fig. 7F).
3.4 RA, Tilianin, and Acacetin Concentrations and Contents
RA, tilianin, and acacetin concentrations varied across A. rugosa organs, with roots having the highest RA and flowers the highest tilianin and acacetin. Ethanol treatment at 80 mM maximized RA in roots and tilianin and acacetin in flowers (Fig. 8A–C). In contrast, RA content in leaves and tilianin contents in flowers were highest with ethanol treatment at 20 and 40 mM, respectively (Fig. 8D,E). With ethanol treatments, acacetin content decreased in flowers but increased in stems (Fig. 8F).
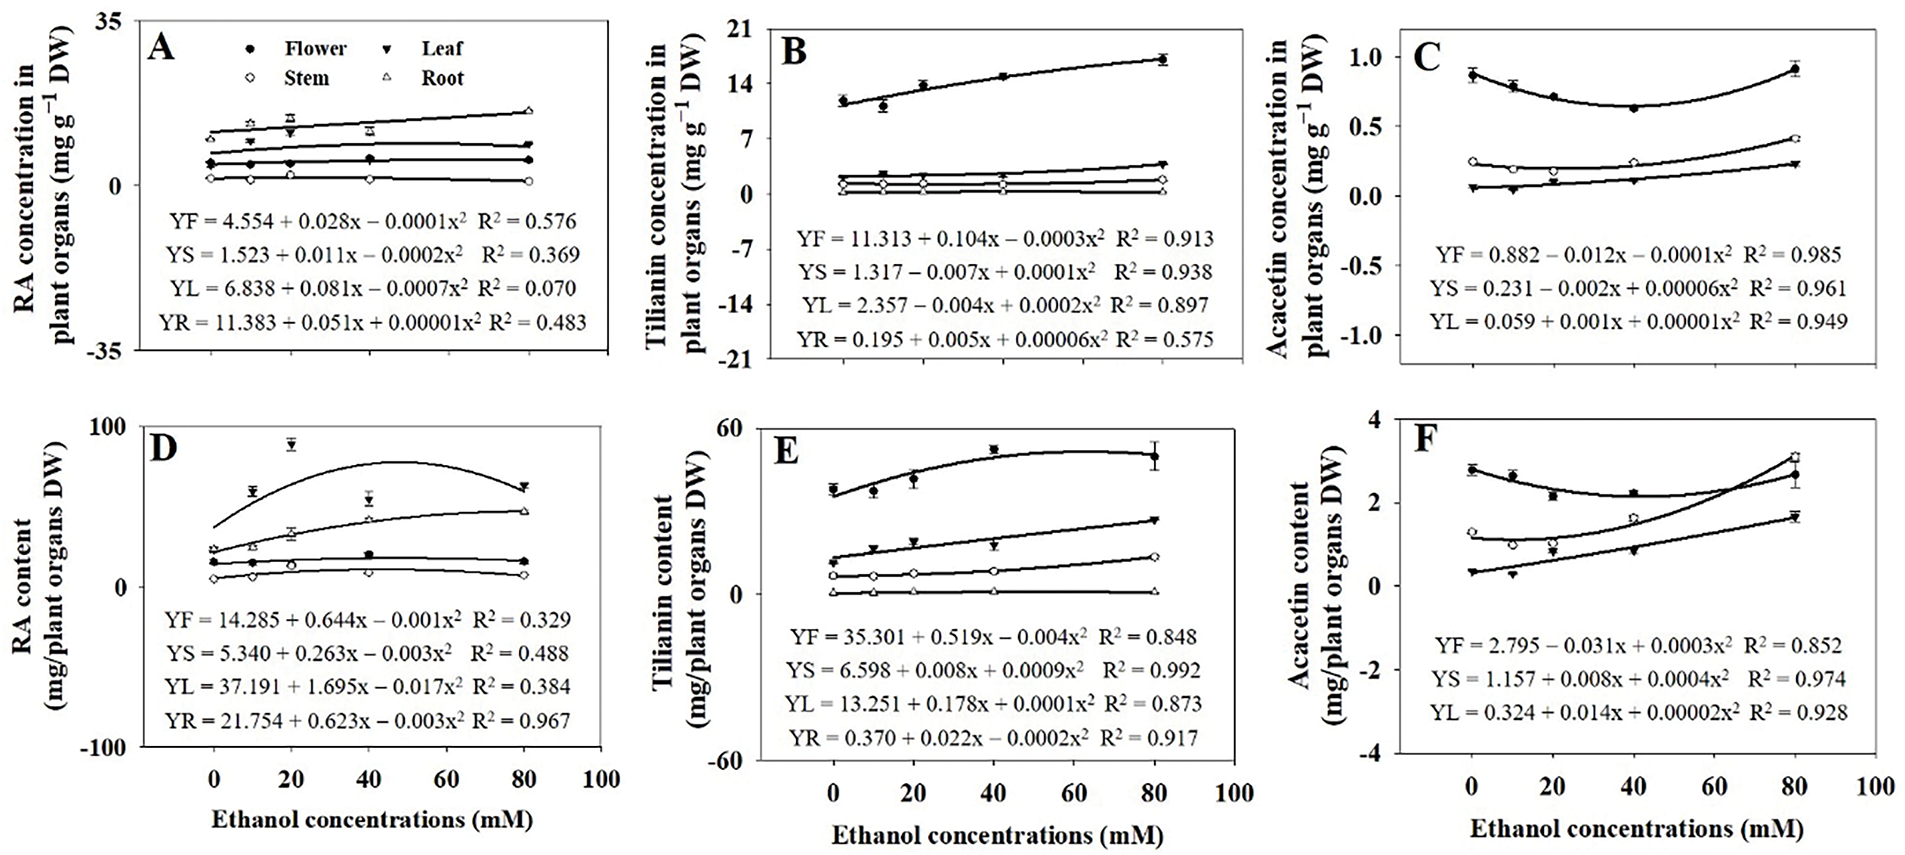
Figure 8: Rosmarinic acid (RA) (A,D), tilianin (B,E), and acacetin (C,F) concentrations and contents in A. rugosa organs (F: flower, S: stem, L: leaf, R: root), sprayed with ethanol (0, 10, 20, 40, and 80 mM) three times weekly. Bars show standard errors (n = 3). Means with the same letter are not significantly different (p < 0.05, Tukey’s HSD test)
Whole plant RA concentrations significantly increased with ethanol treatments at all concentrations examined (Fig. 9A). Whole plant tilianin and acacetin concentrations were highest at 80 mM (Fig. 9B,C). Additionally, whole plant RA contents significantly increased with ethanol treatments at all concentrations examined (Fig. 9D). In contrast, the increases in both whole plant tilianin and acacetin contents were significant only at 40 and 80 mM (Fig. 9E,F).
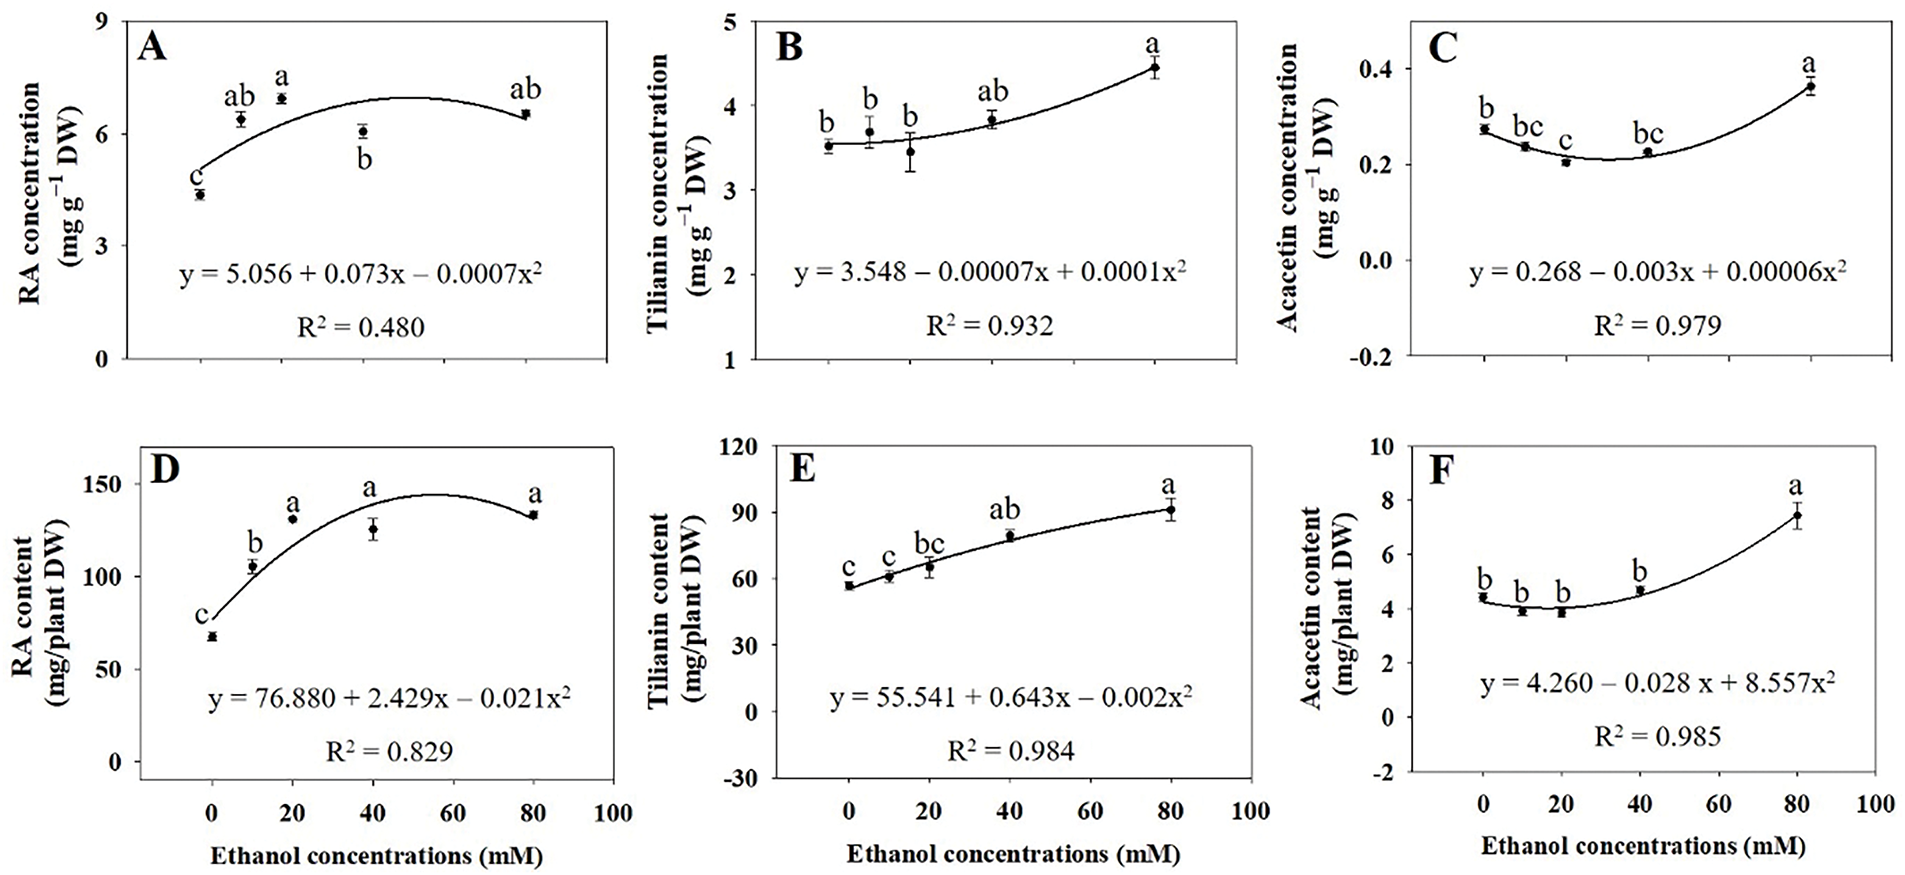
Figure 9: RA (A,D), tilianin (B,E), and acacetin (C,F) concentrations and contents in whole A. rugosa plants, sprayed with ethanol (0, 10, 20, 40, and 80 mM) three times weekly. Bars show standard errors (n = 3). Means with the same letter are not significantly different (p < 0.05, Tukey’s HSD test)
3.5 Acacetin Glycoside Concentrations and Contents
Flowers exhibited the highest concentrations of the three acacetin glycosides (acacetin 1, 2, and 3) compared to other organs of A. rugosa (Fig. 10). The concentrations and contents of the three acacetin glycosides increased with ethanol treatments. Acacetin 1 concentration and content increased by 20.3% and 54.6%, respectively, with ethanol treatment at 40 mM, compared to the respective controls (Fig. 11A,D). Acacetin 2 concentrations were not significant affected by the ethanol treatment (Fig. 11B), but its contents increased by 35.5% and 36.7% with ethanol treatment at 40 and 80 mM, respectively, compared to the control (Fig. 11E). Both acacetin 3 concentration and content were significantly higher in plants treated with ethanol at 40 and 80 mM than in the untreated control (Fig. 11C,F).
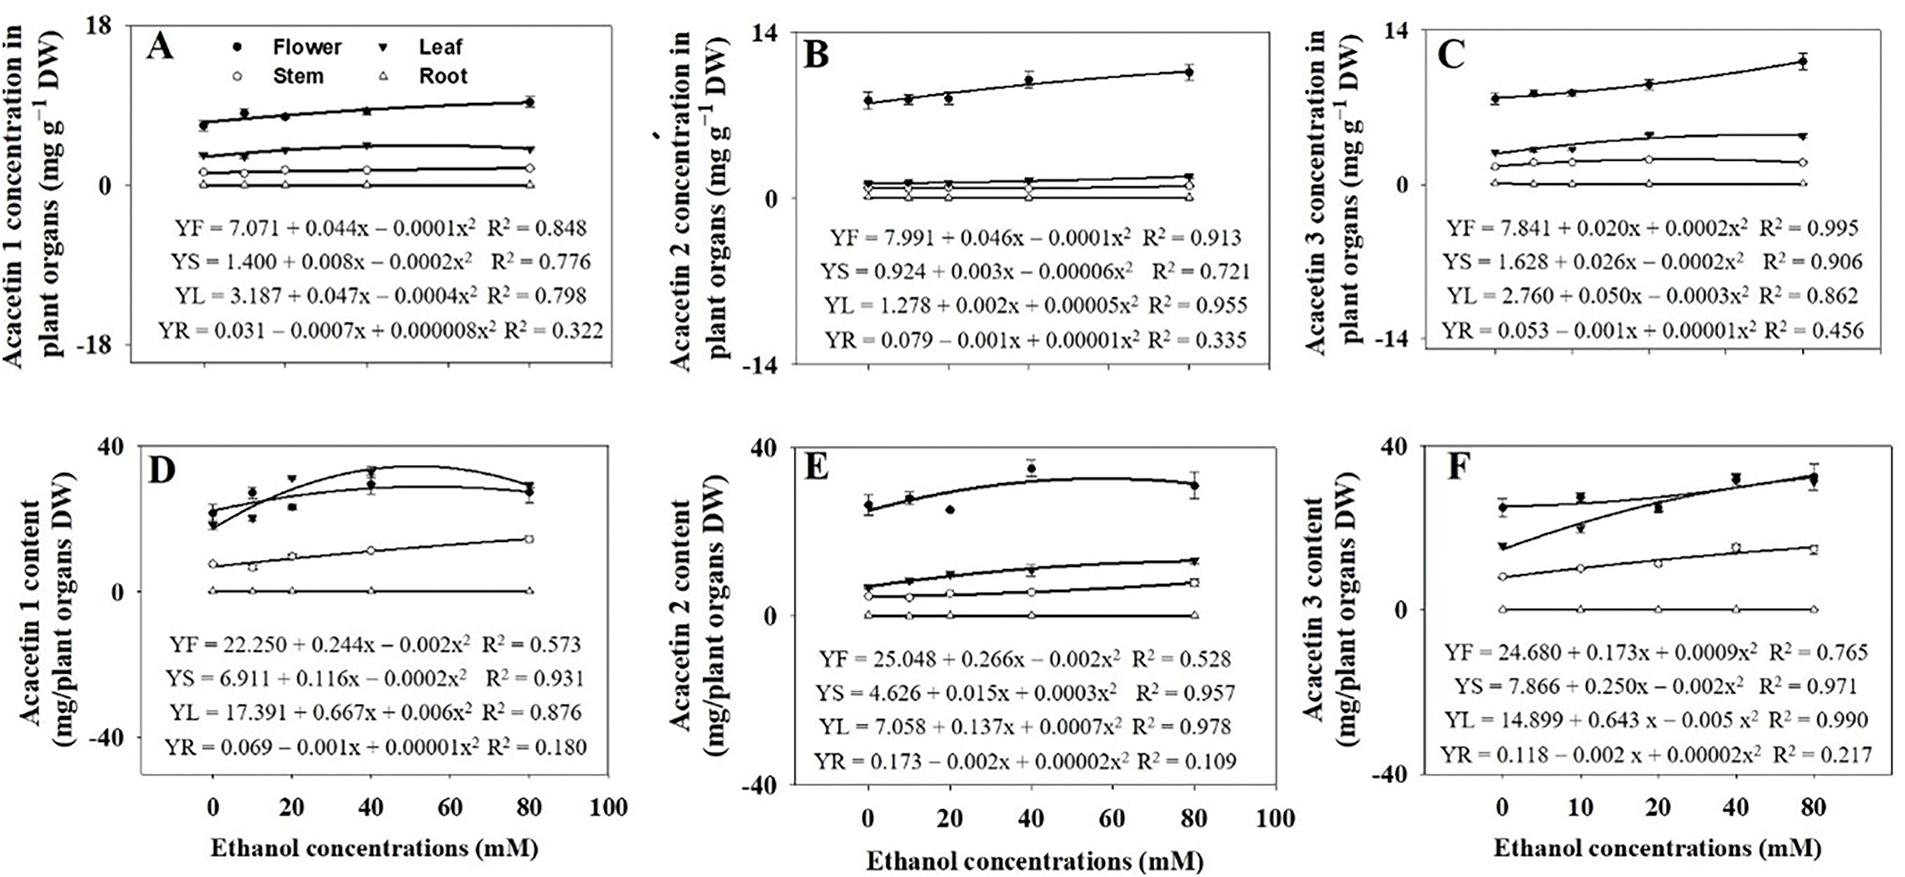
Figure 10: Acacetin 1 (A,D), acacetin 2 (B,E), and acacetin 3 (C,F) concentrations and contents in A. rugosa organs (F: flower, S: stem, L: leaf, R: root), sprayed with ethanol (0, 10, 20, 40, and 80 mM) three times weekly. Bars show standard errors (n = 3). Means with the same letter are not significantly different (p < 0.05, Tukey’s HSD test)
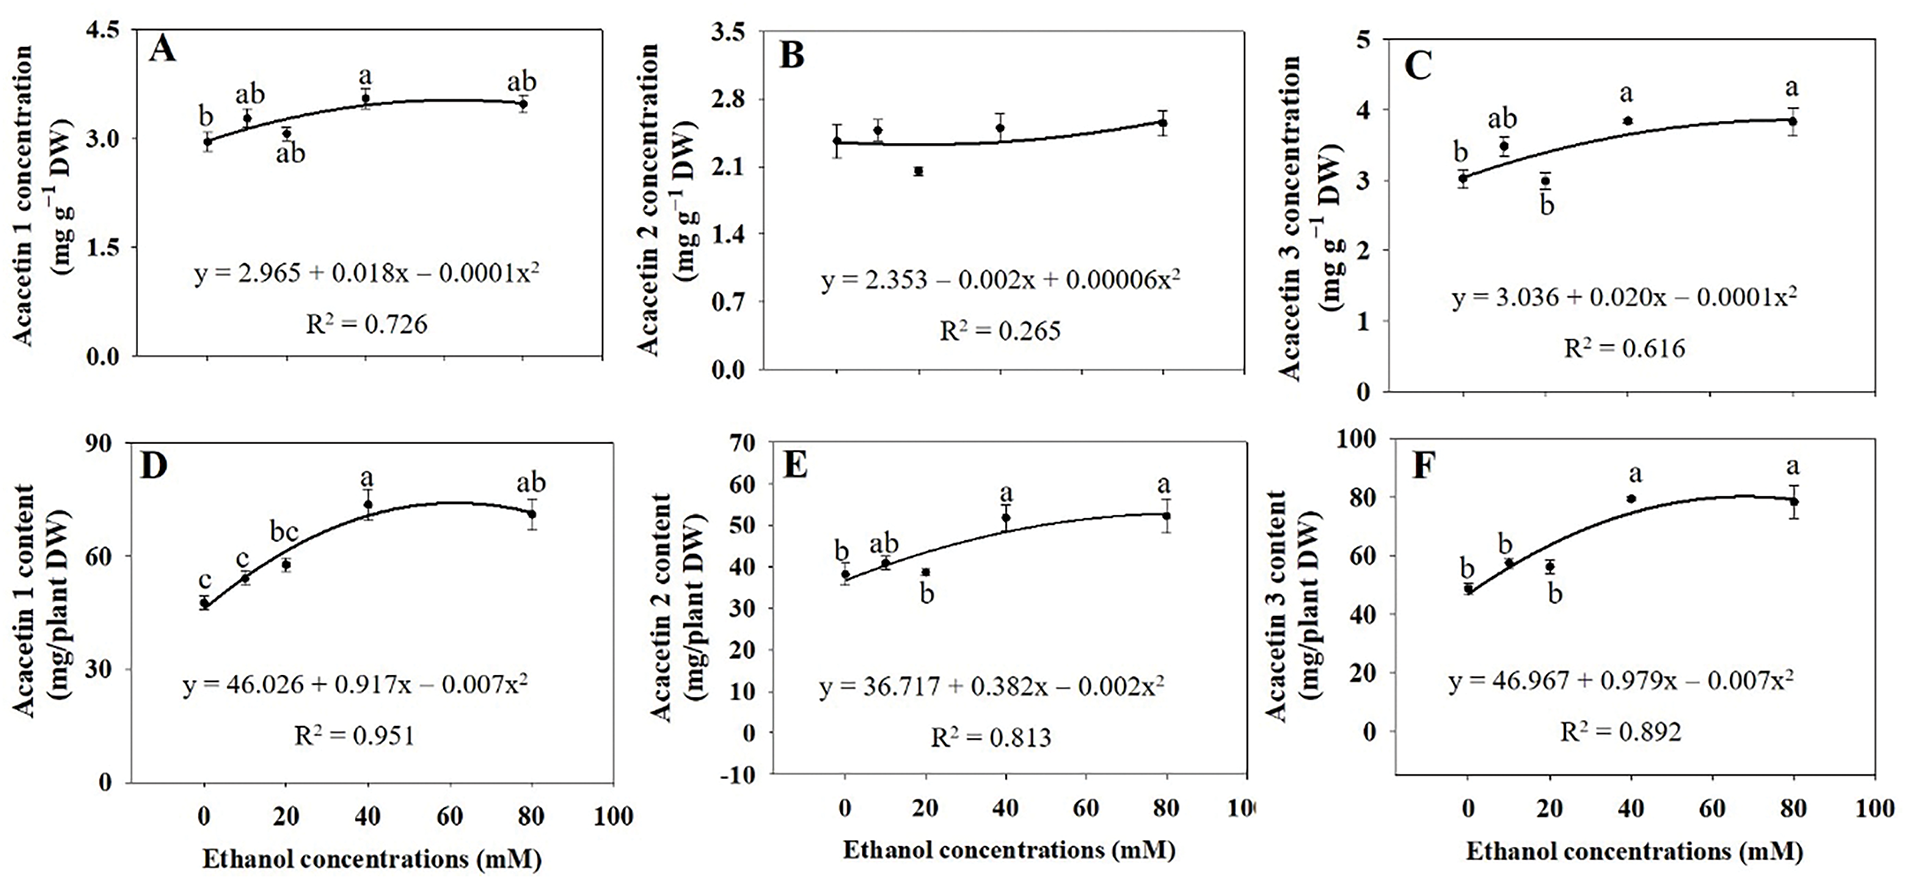
Figure 11: Acacetin 1 (A,D), acacetin 2 (B,E), and acacetin 3 (C,F) concentrations and contents in whole A. rugosa plants, sprayed with ethanol (0–80 mM) three times weekly. Bars show standard errors (n = 3). Means with the same letter are not significantly different (p < 0.05, Tukey’s HSD test)
Ethanol treatments significantly enhanced the growth of A. rugosa. Particularly in terms of leaf length and width (Fig. 2A,B), indicating that ethanol promoted leaf expansion. Additionally, both the number of leaves and flower branches increased with ethanol treatment (Figs. 2C,D), suggesting that ethanol plays a dural role in promoting both vegetative and reproductive growth. This effect may be attributed to ethanol’s influence on hormonal balances or stress responses which promote branching and leaf production under certain conditions [20,21]. Both stem and root growth also increased with ethanol treatment (Figs. 2F,I and 3B,C,F,G), suggesting that ethanol enhances nutrient and water uptake, possibly by promoting below-ground growth, which in turn supports greater above-ground growth [20]. The highest stem length and root DW at 40 mM, coupled with the maximum stem and root FW, root length, and stem DW at 80 mM, further illustrate ethanol’s role in promoting both above-ground and below-ground growth. Root architectural traits, which contribute to plant productivity, are strongly influenced by growth conditions [22].
However, leaf area, flower and leaf FW, flower DW, and leaf area ratio were not significantly affected by ethanol treatment (Figs. 2E,H,G, 3D and 4B). These results indicated that the effects of ethanol treatment on growth parameters were not uniform, but rather concentration-dependent and selective. Leaf, shoot, and whole plant DW were significantly higher in plants treated with ethanol at 20, 40, and 80 mM than in the untreated control (Figs. 3E,H and 4A), whereas shoot FW was higher at 40 and 80 mM (Fig. 3A). Specific LA decreased with ethanol treatment at 10 and 20 mM (Fig. 3I), suggesting thicker, possibly more stress-resistant leaves. The leaf and flower weight ratios, which indicate the balance between vegetative and reproductive growth, were highest in plants treated with the ethanol treatment at 20 mM (Fig. 4C,D). Similarly to our study, leaf and stem growth in tomato were significantly higher when treated with 15% or 20% alcohol (methanol or ethanol), compared to the untreated control [23]. Both foliar and soil application of ethanol also increased fruit weight and yield in strawberry [24]. Ethanol treatment has also been reported to enhance the growth of soybean plants, including shoot height, root length, root DW, shoot DW, total LA per trifoliate, and leaf succulence [25]. These findings demonstrate that exogenous ethanol can promote plant growth.
4.2 Photosynthetic Characteristics and Pigments
Ethanol, particularly at 40 and 80 mM, significantly enhanced photosynthetic activity and pigment content. This suggests a mild stress response that optimizes photosynthesis, improving energy use and efficiency. The net photosynthetic rate (A) showed a tendency to increase as ethanol concentrations rose, with a significant enhancement observed at 40 and 80 mM ethanol compared to the controls (Fig. 5A). Interestingly, despite this increase in photosynthesis, there were no significant differences in stomatal conductance (gs) or transpiration rate (E) between ethanol-treated plants and the control group (Fig. 5B,D). Because the photosynthetic rate was determined by stomatal or no stomatal limitations [26]. The intercellular CO2 concentration (Ci) reached its maximum under the 40 mM ethanol treatment (Fig. 5C). The increased Ci at 40 mM indicates enhanced CO2 diffusion, contributing to a higher net photosynthetic rate, possibly due to a hormesis effect. Since gs and E remained unchanged, the increase in Ci may reflect greater CO2 assimilation efficiency due to improved internal CO2 fixation capacity or adjustments in photosynthetic enzymes. Typically, an increase in net photosynthesis is accompanied by higher gs, facilitating CO2 uptake. However, the stable gs observed here implies that ethanol might be improving photosynthesis through non-stomatal mechanisms. The increased Ci at 40 mM suggests enhanced internal CO2 diffusion and fixation efficiency, likely due to improved enzymatic activity or structural adjustments in the photosynthetic apparatus.
Chl a, Chl b, and total Chl concentrations significantly increased with ethanol treatment (Fig. 6A,B,D), whereas Chl a/b ratio tended to decrease with increasing ethanol concentration (Fig. 6C). These observations suggest that ethanol treatment improve the light absorption capacity of the photosynthetic machinery, consistent with the growth promoting effects of ethanol (Fig. 1), The increased total carotenoid concentrations (Fig. 6E) and SPAD values (Fig. 6F) could further contribute to enhanced photoprotection as well as light absorption.
In soybean, ethanol treatment at 20 mM enhanced photosynthetic capacity as evidenced by increased CO2 fixation and energy metabolism, pigment production, water retention, and oxidative stress protection [27]. Ethanol treatment also significantly increased Chl a, Chl b, total Chl, and total carotenoid contents in both drought-stressed and well-watered plants compared to their respective controls [27]. Similar increases in Chl contents have been observed with ethanol treatment in Arabidopsis thaliana [28] and strawberry [24]. Together with our results, these findings suggest that ethanol, particularly at moderate concentrations, exerts positive hormetic effects on photosynthesis and consequently growth.
4.3 Antioxidant Capacity and Total Flavonoid and Total Phenolic Contents
DPPH radical-scavenging activities significantly increased with ethanol treatment, particularly at 80 mM (Fig. 7A). This increase in DPPH radical-scavenging activities was consistent with the higher total flavonoid (Fig. 7B) and total phenolic contents (Fig. 7C), suggesting that ethanol enhances the antioxidant defense system. Both flavonoids and phenolics are well known for their role in combating oxidative stresses and their contents have been positively correlated with antioxidant capacity in various plant species [29,30]. Therefore, our results support that both flavonoids and phenolics are key contributors to overall defense system in plants [27–29].
Activities of SOD, POD, and CAT significantly increased with ethanol treatments (Fig. 7D–F), suggesting that ethanol upregulates these three antioxidant enzymes [31]. Since SOD, POD, and CAT detoxify superoxide, peroxide, and H2O2, respectively, converting them into less harmful molecules [31] enhanced protection against oxidative stresses. POD plays a critical role in scavenging hydrogen peroxide and other peroxides, preventing their accumulation and subsequent cellular damage [32]. The significant rise in POD activity, particularly under higher ethanol concentrations, indicates a robust activation of the plant’s peroxidase system, likely contributing to enhanced stress tolerance [33]. CAT is essential for decomposing hydrogen peroxide into water and oxygen, thus preventing the harmful effects of this reactive oxygen species [34].
4.4 RA, Tilianin, Acacetin, and Acacetin Glycoside Concentrations and Contents
RA was found to be most concentrated in roots, whereas tilianin and acacetin were primarily found in flowers (Fig. 8), consistent with the findings of Tuan et al. [35]. Ethanol treatment increased RA in roots and tilianin and acacetin in flowers, especially at 80 mM (Fig. 8A–C). RA and tilianin were highest in leaves and flowers (Fig. 8D,E), while acacetin decreased in flowers but increased in stems (Fig. 8F), indicating metabolic shifts between organs. Additionally, the ethanol treatment significantly increased both concentrations and contents of the three acacetin glycosides, except for acacetin 2 concentrations (Figs. 10 and 11). Given that ethanol acts as an abiotic stressor [31], these increases in bioactive compounds could be a result of the defense responses triggered by ethanol exposure [36]. In response to ethanol, specific metabolic pathways leading to the production of secondary metabolites [18], such as RA, tilianin, and acacetin, may be activated through the upregulation of genes involved in their biosynthesis [37]. For example, the phenylpropanoid pathway, responsible for flavonoid production like RA, could be more active with ethanol treatment, leading to increased synthesis of these bioactive compounds. Ethanol treatments may enhance enzyme activity and cell membrane permeability, aiding the accumulation of bioactive compounds, though further research is needed to confirm these mechanisms.
Ethanol treatment at 40 and 80 mM significantly enhanced plant growth and the biosynthesis of key secondary metabolites in A. rugosa, particularly RA, tilianin, and acacetin, with the highest accumulation in roots and flowers. It also improved photosynthetic pigments, antioxidant activity, and total flavonoid and phenolic content. These findings suggest ethanol as a potential enhancer for both growth and metabolite production. Future studies should investigate the molecular mechanisms and key genes involved in this process.
Acknowledgement: Not applicable.
Funding Statement: This work was supported by Korea Institute of Energy Technology Evaluation and Planning (KETEP) grant funded by the Korea government (MOTIE) (20212020800050, Development and demonstration of rooftop greenhouse-building integrated system using distributed polygeneration).
Author Contributions: Conceptualization, Vu Phong Lam, Jongseok Park; performing experiments, Vu Phong Lam, Dao Nhan Loi, Xin Wang, Jongwon Do; data analysis, Vu Phong Lam, Isaya Kisekk, Nguyen Thi Thanh Nga, Jongseok Park; writing—original draft preparation, Vu Phong Lam, Dao Nhan Loi, Isaya Kisekk, Nguyen Thi Thanh Nga; writing—review and editing, Vu Phong Lam, Jongseok Park; supervision, Jongseok Park. All authors reviewed the results and approved the final version of the manuscript.
Availability of Data and Materials: The datasets generated and/or analyzed during the current study are available from the corresponding author upon reasonable request.
Ethics Approval: Not applicable.
Conflicts of Interest: The authors declare no conflicts of interest to report regarding the present study.
References
1. Sim LY, Abd RNZ, Husain K. Lamiaceae: an insight on their anti-allergic potential and its mechanisms of action. Front Pharmacol. 2019;10:667. doi:10.3389/fphar.2019.00677. [Google Scholar] [PubMed] [CrossRef]
2. Zielinska S, Matkowski A. Phytochemistry and bioactivity of aromatic and medicinal plants from the genus Agastache (Lamiaceae). Phytochem Rev. 2014;13(2):391–416. doi:10.1007/s11101-014-9349-1. [Google Scholar] [PubMed] [CrossRef]
3. Yeo HJ, Park CH, Park YE, Hyeon H, Kim JK, Lee SY, et al. Metabolic profiling and antioxidant activity during flower development in Agastache rugosa. Physiol Mol Biol Plants. 2021;27(3):445–55. doi:10.1007/s12298-021-00945-z. [Google Scholar] [PubMed] [CrossRef]
4. Gong HY, He LJ, Li SY, Zhang C, Ashraf MA. Antimicrobial, antibiofilm and antitumor activities of essential oil of Agastache rugosa from Xinjiang, China. Saudi J Biol Sci. 2016;23(4):524–30. doi:10.1016/j.sjbs.2016.02.020. [Google Scholar] [PubMed] [CrossRef]
5. Gong HY, Li SY, He LJ, Kasimu R. Microscopic identification and in vitro activity of Agastache rugosa (Fisch et Mey) from Xinjiang, China. BMC Complement Altern Med. 2017;17(1):95. doi:10.1186/s12906-017-1605-7. [Google Scholar] [PubMed] [CrossRef]
6. Lashkari A, Najafi F, Kavoosi G, Niazi S. Evaluating the In vitro anti-cancer potential of estragole from the essential oil of Agastache foeniculum [Pursh.] Kuntze. Biocatal Agric Biotechnol. 2020;27:101727. doi:10.1016/j.bcab.2020.101727. [Google Scholar] [CrossRef]
7. Cao P, Xie PY, Wang XB, Wang JM, Wei JF, Kang WY. Chemical constituents and coagulation activity of Agastache rugosa. BMC Complement Altern Med. 2017;17(1):93. doi:10.1186/s12906-017-1592-8. [Google Scholar] [PubMed] [CrossRef]
8. Nam HH, Kim JS, Lee J, Seo YH, Kim HS, Ryu SM, et al. Pharmacological effects of Agastache rugosa against gastritis using a network pharmacology approach. Biomolecules. 2020;10(9):1298. doi:10.3390/biom10091298. [Google Scholar] [PubMed] [CrossRef]
9. Oh Y, Lim HW, Huang YH, Kwon HS, Jin CD, Kim K, et al. Attenuating properties of Agastache rugosa leaf extract against ultraviolet-B-induced photoaging via up-regulating glutathione and superoxide dismutase in a human keratinocyte cell line. J Photochem Photobiol B Biol. 2016;163(Suppl 2):170–6. doi:10.1016/j.jphotobiol.2016.08.026. [Google Scholar] [PubMed] [CrossRef]
10. Sarker U, Ercisli S. Salt eustress induction in red amaranth (Amaranthus gangeticus) augments nutritional, phenolic acids and antiradical potential of leaves. Antioxidants. 2022;11(12):2434. doi:10.3390/antiox11122434. [Google Scholar] [PubMed] [CrossRef]
11. Jang AK, Rashid MM, Lee G, Kim DY, Ryu HW, Oh SR, et al. Metabolites identification for major active components of Agastache rugosa in rat by UPLC-Orbitap-MS: comparison of the difference between metabolism as a single component and as a component in a multi-component extract. J Pharm Biomed Anal. 2022;220(2):114976. doi:10.1016/j.jpba.2022.114976. [Google Scholar] [PubMed] [CrossRef]
12. Singh S, Gupta P, Meena A, Luqman S. Acacetin, a flavone with diverse therapeutic potential in cancer, inflammation, infections and other metabolic disorders. Food Chem Toxicol. 2020;145(8):111708. doi:10.1016/j.fct.2020.111708. [Google Scholar] [PubMed] [CrossRef]
13. Akanda MR, Uddin MN, Kim IS, Ahn D, Tae HJ, Park BY. The biological and pharmacological roles of polyphenol flavonoid tilianin. Eur J Pharmacol. 2019;842(1):291–7. doi:10.1016/j.ejphar.2018.10.044. [Google Scholar] [PubMed] [CrossRef]
14. Luo CX, Zou L, Sun HJ, Peng JY, Gao C, Bao LC, et al. A review of the anti-inflammatory effects of rosmarinic acid on inflammatory diseases. Front Pharmacol. 2020;11:153. doi:10.3389/fphar.2020.00153. [Google Scholar] [PubMed] [CrossRef]
15. Selwal N, Rahayu F, Herwati A, Latifah E, Suhara C, Suastika IBK, et al. Enhancing secondary metabolite production in plants: exploring traditional and modern strategies. J Agric Food Res. 2023;14(2023):100702. doi:10.1016/j.jafr.2023.100702. [Google Scholar] [CrossRef]
16. Lam VP, Loi DN, Shin J, Mi LK, Park J. Optimization of salicylic acid concentrations for increasing antioxidant enzymes and bioactive compounds of Agastache rugosa in a plant factory. PLoS One. 2024;19(7):e0306340. doi:10.1371/journal.pone.0306340. [Google Scholar] [PubMed] [CrossRef]
17. Lam VP, Beomseon L, Anh VK, Loi DN, Kim S, Kwang-Ya L, et al. Effectiveness of silver nitrate application on plant growth and bioactive compounds in Agastache rugosa (Fisch. & C.A.Mey.) kuntze. Heliyon. 2023;9(9):e20205. doi:10.1016/j.heliyon.2023.e20205. [Google Scholar] [PubMed] [CrossRef]
18. Shin J, Lee YJ, Hahm S, Lee KY, Park J. Effects of exogenous ethanol treatment in nutrient solution on growth and secondary metabolite contents of three herb species in an indoor vertical farming system. Plants. 2023;12(22):3842. doi:10.3390/plants12223842. [Google Scholar] [PubMed] [CrossRef]
19. Shin SB, Lee JK, Ko MJ. Enhanced extraction of bioactive compounds from propolis (Apis mellifera L.) using subcritical water. Sci Rep. 2023;13(1):15038. doi:10.1038/s41598-023-42418-1. [Google Scholar] [PubMed] [CrossRef]
20. Wu ZM, Yang L, Jiang LH, Zhang ZH, Song HX, Rong XM, et al. Low concentration of exogenous ethanol promoted biomass and nutrient accumulation in oilseed rape (Brassica napus L.). Plant Signal Behav. 2019;14(12):1681114. doi:10.1080/15592324.2019.1681114. [Google Scholar] [PubMed] [CrossRef]
21. Matsui A, Todaka D, Tanaka M, Mizunashi K, Takahashi S, Sunaoshi Y, et al. Ethanol induces heat tolerance in plants by stimulating unfolded protein response. Plant Mol Biol. 2022;110(1–2):131–45. doi:10.1007/s11103-022-01291-8. [Google Scholar] [PubMed] [CrossRef]
22. Rahnama A, Fakhri S, Meskarbashee M. Root growth and architecture responses of bread wheat cultivars to salinity stress. Agron J. 2019;111(6):2991–8. doi:10.2134/agronj2018.12.0795. [Google Scholar] [CrossRef]
23. Rowe RN, Farr DJ, Richards BAJ. Effects of foliar and root applications of methanol or ethanol on the growth of tomato plants (Lycopersicon-Esculentum Mill). New Zealand J Crop Hortic Sci. 1994;22(3):335–7. doi:10.1080/01140671.1994.9513842. [Google Scholar] [CrossRef]
24. Yavarpanah Z, Alizadeh M, Seifi E. Effects of foliar and root applications of hydro-alcoholic solutions on physiological and biochemical attributes and fruit yield and weight of strawberry. J Plant Physiol Breed. 2015;5(1):47–54. [Google Scholar]
25. Das AK, Anik TR, Rahman MM, Keya SS, Islam MR, Rahman MA, et al. Ethanol treatment enhances physiological and biochemical responses to mitigate saline toxicity in soybean. Plants. 2022;11(3):272. doi:10.3390/plants11030272. [Google Scholar] [PubMed] [CrossRef]
26. Rahnama A, James RA, Poustini K, Munns R. Stomatal conductance as a screen for osmotic stress tolerance in durum wheat growing in saline soil. Funct Plant Biol. 2010;37(3):255–63. doi:10.1071/Fp09148. [Google Scholar] [CrossRef]
27. Rahman MM, Mostofa MG, Das AK, Anik TR, Keya SS, Ahsan SM, et al. Ethanol positively modulates photosynthetic traits, antioxidant defense and osmoprotectant levels to enhance drought acclimatization in soybean. Antioxidants. 2022;11(3):516. doi:10.3390/antiox11030516. [Google Scholar] [PubMed] [CrossRef]
28. Nguyen HM, Sako K, Matsui A, Suzuki Y, Mostofa MG, Van Ha C, et al. Ethanol enhances high-salinity stress tolerance by detoxifying reactive oxygen species in Arabidopsis thaliana and rice. Front Plant Sci. 2017;3(8):1001. doi:10.3389/fpls.2017.01001. [Google Scholar] [PubMed] [CrossRef]
29. Dias MC, Pinto D, Silva AMS. Plant flavonoids: chemical characteristics and biological activity. Molecules. 2021;26(17):5377. doi:10.3390/molecules26175377. [Google Scholar] [PubMed] [CrossRef]
30. Saini N, Anmol A, Kumar S, Wani A, Bakshi M, Dhiman Z. Exploring phenolic compounds as natural stress alleviators in plants—a comprehensive review. Physiol Mol Plant Pathol. 2024;133(2024):102383. doi:10.1016/j.pmpp.2024.102383. [Google Scholar] [CrossRef]
31. Sako K, Nagashima R, Tamoi M, Seki M. Exogenous ethanol treatment alleviates oxidative damage of under conditions of high-light stress. Plant Biotechnol. 2021;38(3):339–44. doi:10.5511/plantbiotechnology.21.0715a. [Google Scholar] [PubMed] [CrossRef]
32. Rahman MM, Ghosh PK, Akter M, Al Noor MM, Rahman MA, Keya SS, et al. Green vanguards: harnessing the power of plant antioxidants, signal catalysts, and genetic engineering to combat reactive oxygen species under multiple abiotic stresses. Plant Stress. 2024;13:100547. doi:10.1016/j.stress.2024.100547. [Google Scholar] [CrossRef]
33. Mishra N, Jiang CK, Chen L, Paul A, Chatterjee A, Shen GX. Achieving abiotic stress tolerance in plants through antioxidative defense mechanisms. Front Plant Sci. 2023;14:1110622. doi:10.3389/fpls.2023.1110622. [Google Scholar] [PubMed] [CrossRef]
34. Shields HJ, Traa A, Van Raamsdonk JM. Beneficial and detrimental effects of reactive oxygen species on lifespan: a comprehensive review of comparative and experimental studies. Front Cell Dev Biol. 2021;11(9):628157. doi:10.3389/fcell.2021.628157. [Google Scholar] [PubMed] [CrossRef]
35. Tuan PA, Park WT, Xu H, Park NI, Park SU. Accumulation of tilianin and rosmarinic acid and expression of phenylpropanoid biosynthetic genes in Agastache rugosa. J Agric Food Chem. 2012;60(23):5945–51. doi:10.1021/jf300833m. [Google Scholar] [PubMed] [CrossRef]
36. Diot A, Groth G, Blanchet S, Chervin C. Responses of animals and plants to physiological doses of ethanol: a molecular messenger of hypoxia? FEBS J. 2024;291(6):1102–10. doi:10.1111/febs.17056. [Google Scholar] [PubMed] [CrossRef]
37. Sahana GR, Balasubramanian B, Joseph KS, Pappuswamy M, Liu WC, Meyyazhagan A, et al. A review on ethanol tolerance mechanisms in yeast: current knowledge in biotechnological applications and future directions. Process Biochem. 2024;138:1–13. doi:10.1016/j.procbio.2023.12.024. [Google Scholar] [CrossRef]
Cite This Article
 Copyright © 2025 The Author(s). Published by Tech Science Press.
This work is licensed under a Creative Commons Attribution 4.0 International License , which permits unrestricted use, distribution, and reproduction in any medium, provided the original work is properly cited.
 Downloads
 Citation Tools