
 Submit a Paper
 Propose a Special lssue
 Open Access
ARTICLE

Integration of Organic Amendments with Chemical Fertilizers Boosts Crop Yields, Nutrient Uptake, and Soil Fertility in Farm and Char Lands
1 Department of Soil Science, Bangladesh Agricultural University, Mymensingh, 2202, Bangladesh
2 Department of Biology, College of Science, Taif University, P.O. Box 11099, Taif, 21944, Saudi Arabia
3 Department of Biotechnology, College Sciences, Taif University, P.O. Box 11099, Taif, 21944, Saudi Arabia
4 Department of Genetics and Plant Breeding, Bangladesh Agricultural University, Mymensingh, 2202, Bangladesh
* Corresponding Authors: Tahsina Sharmin Hoque. Email: ; Mohammad Anwar Hossain. Email:
(This article belongs to the Special Issue: Plant and Environments)
Phyton-International Journal of Experimental Botany 2025, 94(6), 1711-1733. https://doi.org/10.32604/phyton.2025.062465
Received 18 December 2024; Accepted 06 May 2025; Issue published 27 June 2025
 View Full Text
 Download PDF
Abstract
Improving crop productivity and soil fertility through the balanced application of inorganic and organic nutrient sources is a sustainable approach in modern agriculture. Char land soils, widely distributed in riverine Bangladesh, are generally low in organic matter status and deficient in necessary nutrient elements for crop production. Addressing this challenge, the present study was conducted to investigate the effects of various organic nutrient sources with inorganic fertilizers on crop yields, nutrient uptake, and soil fertility in farm (L1) and char land (L2) of Brahmaputra River in Mymensingh, Bangladesh from 2022 (Y1) to 2023 (Y2). For each location, eight treatments viz. T1 (Control), T2 [100% recommended fertilizer dose (RFD)], T3 (75% RFD), T4 (75% N from RFD + 25% N from cow dung), T5 (75% N from RFD + 25% N from poultry manure), T6 (75% N from RFD + 25% N from vermicompost), T7 (75% N from RFD + 25% N from household compost) and T8 (75% N from RFD + 25% N from rice straw compost) were arranged in a randomized complete block design with three replications using Wheat–Mungbean–T. Aman rice cropping pattern where three way interaction was considered for results. Treatment T5 performed the best in both years in both locations as it enhanced the yield components (p < 0.05) and caused yield increment over control. The yield improvement in Char land soils was higher than that in farm soils. For all three crops, treatment T5 consistently augmented the uptake of nitrogen, phosphorus, potassium, and sulphur by different parts of the crops and improved soil fertility properties such as organic matter status, cation exchange capacity, total nitrogen, available phosphorus, and sulphur as well as exchangeable potassium in both locations in both years. Cost and return analysis of different treatments for the whole cropping system showed that the highest marginal benefit-cost ratio (16.35 and 15.07) and gross return (about Tk 768,595/ha and 728,341/ha) were obtained from the T5 treatment in farm soils and Char land soils, respectively. Followed by poultry manure, vermicompost performed well in addition to mineral fertilizers for improving crop yield and soil fertility but its economic efficiency was less due to high input cost. These findings may be useful to the smallholder farmers in char areas, who could benefit from increased productivity, reduced reliance on chemical fertilizers, and improved soil health, contributing to the long-term sustainability of char land agriculture.Keywords
Supplementary Material
Supplementary Material FileTo meet the growing global food demand, modern agricultural system focuses on maximizing crop production through strategies like using high-yielding varieties, chemical fertilizers and intensive cultivation practices. Increasing cropping intensity involving high-yielding crop varieties, improper fertilization and irrigation, and indiscriminate use of agrochemicals cause soil degradation and fertility depletion [1]. The continued rise in the use of chemical fertilizers is leading to higher production costs and greater environmental pollution. Besides, unbalanced use of these fertilizers with little or no addition of organic manures has affected soil health, causing a substantial decrease in soil organic matter (SOM), which is the single index of soil fertility [2]. Low organic matter content and poor nutrient status are considered one of the major reasons for the low productivity of many soils, including char land areas. Consequently, the maintenance of soil fertility is necessary for sustainable agriculture and future food security. Hence, the strategy of organic matter and balanced fertilizer management is essential to achieve improved and sustainable crop production.
The application of organic materials integrated with chemical fertilizers has been advocated as the best approach to provide greater stability in crop production [3,4] and improvement of soil fertility [5,6]. Combining organic manures like farmyard manure (FYM), green manure (GM), or wheat or rice straw (WS or RS) with chemical fertilizers effectively boosts crop yields, improves nutrient balance, and enhances soil fertility by increasing soil organic carbon (SOC) and macronutrients such as nitrogen (N), phosphorus (P), potassium (K) and sulphur (S) as well as micronutrients in long-term rice-based cropping systems [7–9]. Many researchers have highlighted the role of organic manures and composts as a source of nutrients and a means of soil rejuvenation [10–12]. Organic amendments restore SOM, improve nutrient availability, boost cation exchange capacity (CEC), buffer soil pH, and aid carbon sequestration. High-quality SOM enhances nutrient retention and cycling, water retention, disease suppression, crop productivity, and promotes long-term soil health and sustainability [13]. They are easily available, environment-friendly alternatives to mineral fertilizers.
Poultry manure (PM) is rich in nutrients, containing 3%–5% N, 1.5%–3.5% P, 1.5%–3% K, and significant micronutrients, with a pH of 6–7 [14]. When combined with urea, it improves cereal yield components more effectively than other organic manures [15]. Since poultry excreta is no longer used as fuel, it can serve as an excellent source of manure for field crops [16]. Vermicompost (VC) improves soil fertility by adding essential nutrients like NPK, enhances microbial activity, and boosts water retention, making the soil healthier and more productive naturally [17–19]. It contains 1.45% N, 0.46% P, 0.55% K, 0.39% S, and 1.32 ppm boron (B) [20], which helps uptake and store more nutrients. Cow dung (CD) is widely used organic manure, valued for its high nutrient and organic matter content. It improves soil fertility by increasing organic C and enhancing the activity of beneficial microorganisms, leading to better nutrient availability for plants [21]. Composting recycles agricultural wastes into organic matter that enhances soil quality and crop productivity and improves soil properties by forming humic substances, making it more fertile and addressing issues like acidity and salinity [22]. To maintain optimal organic matter and nutrient levels, regular incorporation and recycling of organic wastes into the soil are essential [23]. The latest trends in nutrient recycling focus on enhancing the efficiency of organic amendments to improve soil health and nutrient availability [24]. Rice straw can enhance soil fertility, but its burning leads to nutrient loss and environmental pollution, with significant reductions in N (80%), P (25%), K (21%), silicon (Si) (4%–60%), and SOM [25]. In contrast, fields treated with rice straw compost (RSC) showed improvements in both plant health and soil quality, resulting in increases in nutrient levels such as organic C (5.69%), N (16.67%), P (7.53%), and K (42.34%) [26]. Besides these, recent trends focus on biochar’s role in carbon sequestration, precision application, optimized feedstock selection, and integration with organic amendments to enhance long-term soil health and crop productivity as it enhances soil fertility, improves water retention, reduces bulk density, and improves nutrient cycling, making it beneficial for sustainable agriculture [27].
Wheat, mungbean, and T. Aman rice are important crops for the agricultural landscape in Bangladesh, collectively addressing the country’s food security. Wheat serves as a vital supplement to rice, offering higher protein content, vitamins, and minerals, thereby enhancing the nutritional quality of diets [21]. Mungbean, a short-duration leguminous crop, not only fits well into the cropping system between wheat and T. Aman rice but also enriches the soil with N, promoting better soil health [28]. On the other hand, rice is a staple food for over half of the world’s population, providing more than 21% of human caloric intake globally [29]. Wheat–Mungbean–T. Aman rice cropping pattern requires a limited amount of irrigation water, maximizes land use efficiency, improves overall productivity, and helps meet the food demands of the growing population [28]. This cropping pattern with organic amendments is an eco-friendly and sustainable strategy that aligns with farmers’ financial capacity, risk tolerance, and expected returns. This approach optimizes key investment factors, including capital allocation, input cost dynamics, and return on investment [30,31]. Organic amendments reduce dependency on synthetic fertilizers and improve nutrient-use efficiency, thereby lowering production costs. Additionally, the diversified cropping system promotes efficient resource utilization, enhances soil health through biological nitrogen fixation and organic matter buildup, and stabilizes farm income by mitigating financial and yield risks. Using organic amendments showed significant positive effects on these crops and increased the yield of rice (33.4%–52.5%), wheat (20%–42.8%), and mungbean (up to 84%) over the control [32,33].
In Bangladesh, many charlands have formed along the banks of the Padma, Jamuna, and Meghna rivers, covering 5% of the country’s total area (7200 sq. km) and are home to 6.5 million people [34]. These regions have poor soil fertility because of sandy texture, frequent flooding, and erosion. As a result, char soils are often deficient in essential nutrients like N, P, and K and have poor water retention, which makes crop production difficult [35]. Organic amendments such as compost, manure, and crop residues can improve these soils by increasing nutrient content, enhancing soil structure, and boosting microbial activity. This leads to better water retention, reduced soil erosion, increased crop productivity, and long-term fertility. However, very little research activities have been performed on using organic matter to improve char soils. The addition of C-enriched materials like CD, PM, FYM, VC, composts, and crop residues e.g., rice straw (RS), etc. can improve the health of char soils and help accumulate more C. Integrate organic amendments with chemical fertilizers is hypothesized to improve soil fertility and boost crop productivity in Wheat–Mungbean–T. Aman rice cropping systems, particularly in farm and char land soils. Intensive farming and unbalanced chemical fertilizer without using organic manure have degraded soils with low organic matter status and caused environmental hazards, particularly in resource-poor areas like char lands. To maintain sustainable agriculture in farm and char land soils, it is crucial to develop a strong workable, and compatible nutrient management package through organic and inorganic sources for various crops based on scientific facts, local conditions, and economic viability [36]. Therefore, the study was undertaken to determine the potentiality of various organic manures and composts integrated with chemical fertilizers on crop yield for Wheat–Mungbean–T. Aman rice cropping patterns and to evaluate the improvement of soil fertility on both farm and char land soils.
The experiment was conducted at two locations viz. Soil Science Field Laboratory of Bangladesh Agricultural University (BAU) and a farmer’s field in Brahmaputra Charland (Char Gobadia) in Mymensingh district during the 2022–23 growing seasons (Fig. 1). In both locations, the experiment was performed for two consecutive years (Y1 = year 2022 and Y2 = year 2023) to evaluate the impact of organic materials integrated with chemical fertilizers on crop productivity and soil fertility. Both the lands were located at an elevation of 18 m above sea level, at a latitude of 24°75′ N and a longitude of 90°50′ E for BAU farm whereas 24°43′ N and a longitude of 90°28′ E for char. The region experiences a subtropical climate with three seasons named Rabi, Kharif 1, and Kharif 2. Kharif 1 spanning from mid-March to mid-July, is characterized by high temperatures and low rainfall whereas Kharif 2 lasts from mid-July to mid-October by high humidity and significant rainfall. In contrast, the Rabi season, from October to February, has minimal rainfall and moderately low temperatures.
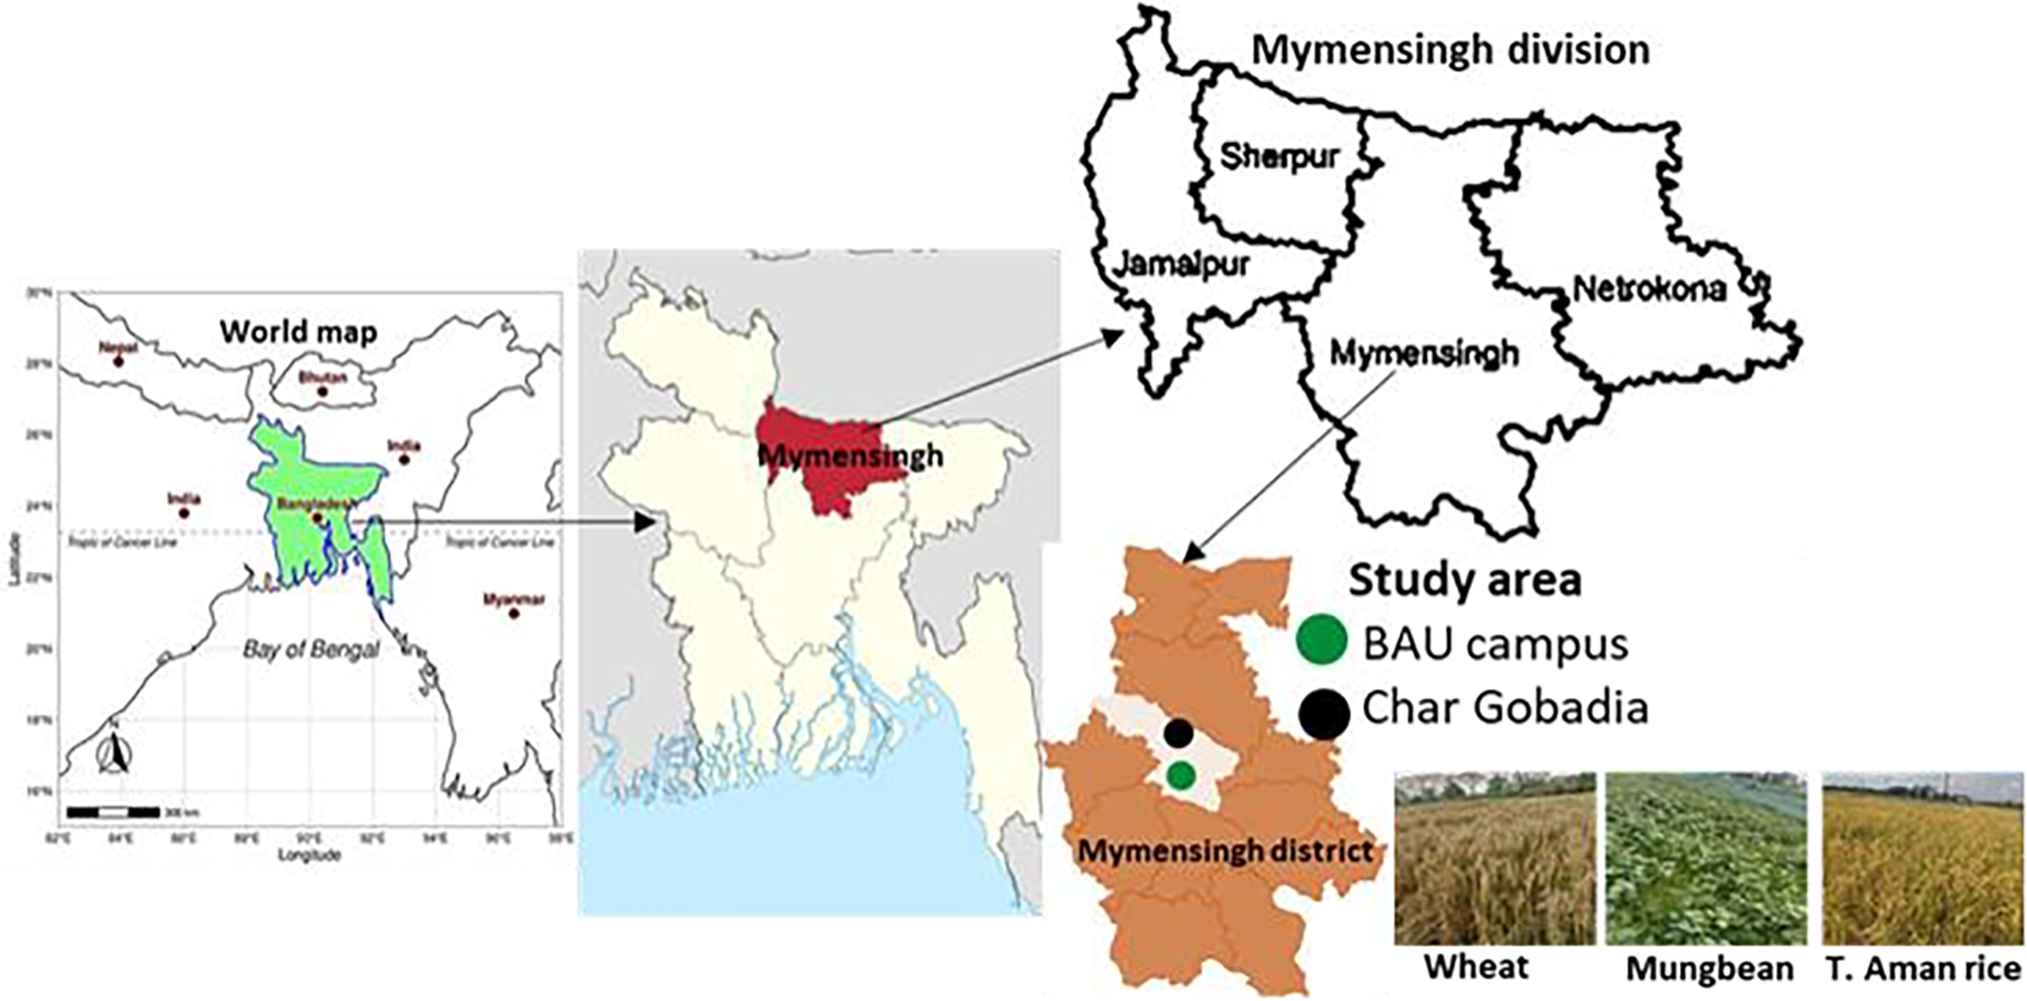
Figure 1: Study location of the field experiment
The soil at both locations was characterized as medium-high land, which is well-drained and generally suitable for various crops. The soil of the BAU farm was predominantly silt loam in texture with pH 6.55 and CEC of 7.5 milliequivalent/100 g soil (me%). This soil exhibited 1.81% soil organic matter (SOM), 0.17% total N, 7.43 ppm available P, 0.071 me% exchangeable K, and 9.98 ppm available S. The farmer’s field had loam textured soil with pH 6.63 and CEC 6.49 me%. The SOM content of this soil was 1.32%, total N 0.12%, available P 5.12 ppm, exchangeable K 0.06 me%, and available S 8.12 ppm.
The mechanical analysis of soil was carried out using the hydrometer method [37], and the textural class was identified based on the USDA system by placing the percentages of sand, silt, and clay on Marshall’s Triangular Coordinate. Soil pH was measured with a glass electrode pH meter, and SOC% was determined through the wet oxidation method proposed by Walkley et al. [38]. SOM% was calculated by multiplying SOC% with van Bemmelen factor (1.73). CEC was determined by the sodium saturation method [39], using 1 N NH4OAc to replace Na+ ions. The Na+ concentration was then measured with a flame photometer (JENWAY PFP 7, Cambridgeshire, UK). Total N was measured using the semi-micro Kjeldahl method [40], and available P was assessed using the Olsen method [41] and determined using a spectrophotometer (JENWAY 6300, Cambridgeshire, UK). Exchangeable K was analyzed with a flame photometer using 1 N ammonium acetate (NH4OAc) at pH 7, while available S was determined using a spectrophotometer with 0.15% calcium chloride (CaCl2) solution as extractant.
The field experiment was arranged in a Randomized Complete Block Design (RCBD) with three replications considering location, treatment and year as three factors. There were eight treatments which included T1 (control), T2[100% recommended dose of fertilizer (RFD)], T3 (75% RFD), T4 [75% N from RFD + 25% N from cow dung (CD)], T5 [75% N from RFD + 25% N from poultry manure (PM)], T6 [75% N from RFD + 25% N from vermicompost (VC)], T7 [75% N from RFD + 25% N from household compost (HC)], and T8 [75% N from RFD + 25% N from rice straw compost (RSC)]. The experiment consisted of 24 plots (8 treatments × 3 replications) in the BAU field (L1) and 24 plots in the Farmer’s field (L2), each measuring 4 m × 2.5 m (10 m2). Land preparation involved repeated plowing and cross-plowing using a power tiller, with each plowing followed by laddering to ensure fine tilth.
The cropping sequence was Wheat–Mungbean–T. Aman rice, whose varieties included BARI Gom 30, Binamoog-8, and BRRI dhan71, respectively. The seeds of these crops were collected from the divisional office of BADC (Bangladesh Agricultural Development Corporation) at Mymensingh in Bangladesh. Wheat was grown in November-March with a seed rate of 125 kg ha−1, mungbean in March—June with a seed rate of 30 kg ha−1, and T. Aman rice cultivated in July-October at a spacing of 20 cm × 20 cm with 3 seedlings hill−1. All the crops were sown manually. The first crop in the sequence received organic amendments according to the Integrated Plant Nutrition System (IPNS), while the second and third crops were fertilized using chemical fertilizers only. CD and PM were sourced from the BAU farm, VC was obtained from the local market of Mymensingh Sadar, and HC and RSC were collected from farmers’ homes and fields near BAU farm. Nutrient application, including N, P, K, S, Zn, and B was based on the Fertilizer Recommendation Guide [42], using urea for N, triple super phosphate (TSP) for P, muriate of potash (MoP) for K, gypsum for S, zinc oxide for Zn, and boric acid for B. These fertilizers were bought from the local market of Mymensingh Sadar. For wheat, the rates of N, P, K, S, Mg, Zn, and B were 120, 16, 60, 10, 4, 1.5, and 1 kg ha−1, respectively. For Mungbean, the rates of N, P, K, S, and Zn were 18, 18, 16, 4, and 1 kg ha−1, respectively. For T. Aman rice, the rates of N, P, K, and S were 90, 8, 50, and 4 kg ha−1, respectively. These rates for each crop were used as 100% of RFD [42]. Intercultural operations such as irrigation, weeding, and pest control were performed as needed throughout the cropping season.
2.5 Data Record and Plant Sample Analysis
Yield and yield-contributing parameters for different crops were recorded, including plant height, the number of effective tillers hill−1 for rice, total pod and seed number plant−1 for mungbean, number of filled grains spike−1 or panicle−1, grain yield, and straw or stover yield. Data were recorded from five randomly selected plants per plot, excluding the outer two rows and row ends. Grain yield and straw or stover yields were measured at 14% moisture and converted to biological yield using the following equation and expressed in t ha−1.
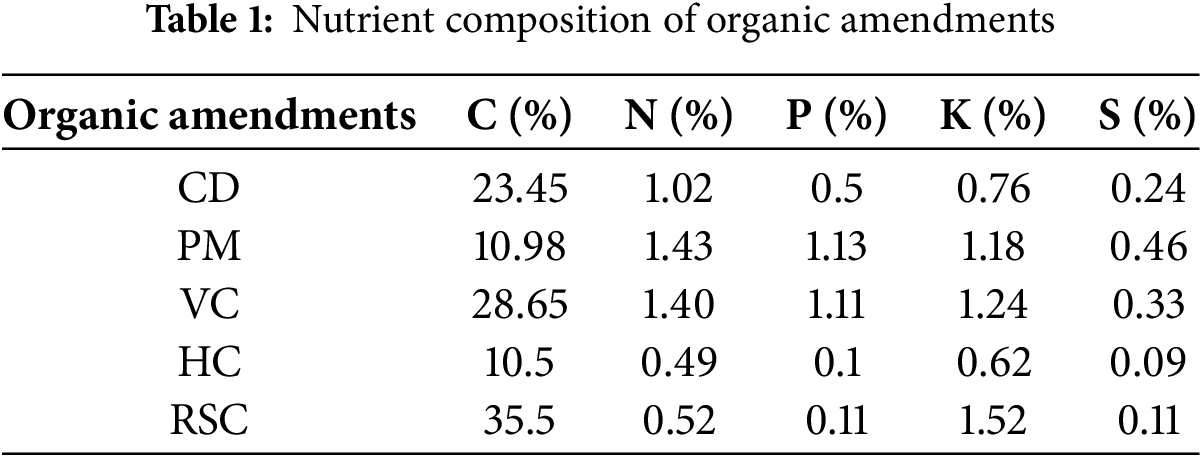
Representative samples of grain, straw, stover and organic amendments were oven-dried at 65°C for 72 h and then ground to a fine powder using a ball mill grinder. After passing through a 20-mesh sieve, the samples were stored in paper bags inside a desiccator until nutrient analysis Table 1. Total %N was determined using the Kjeldahl digestion method, following the protocol of Nelson and Sommers [43]. For total P, K, and S estimation, samples were digested with HNO3-HClO4 (3:1) di-acid mixture [44]. P and S were measured using colorimetric and turbidimetric methods with a spectrophotometer (JENWAY 6300, Cambridgeshire, UK) while K was analyzed using a flame photometer (JENWAY PFP 7, Cambridgeshire, UK) based on the Knudsen et al.'s [45] protocol. For each nutrient uptake in different plant parts, the total content of that nutrient and the yield of the plant parts were used. Nutrient uptake by plant parts was calculated using the following equation.
The cost of production under different treatments was calculated based on total production volume and total production cost. Gross return was defined by the sum of the local market price of products and by-products of the cultivated crops per hectare area in the year [46]. The marginal benefit-cost ratio (MBCR) was used as a tool for the analysis of system profitability. It is the ratio of marginal or added benefits and costs. Yield and added benefits of crops due to different treatments were calculated. The analysis was computed for the system productivity of Wheat–Mungbean–T. Aman rice cropping pattern for 2 years. Only variable costs, i.e., manure or compost and chemical fertilizer were considered for each crop. The added cost and added benefit were computed. To compare the different treatments with the control treatment the following equation was used.
where, Ti = T2, T3, …, T8 treatments
T1 = control treatment
Variable cost = Manure or compost and chemical fertilizers
Gross return = Yield × price
The data on different parameters were statistically analyzed using three-way ANOVA to obtain significant differences among location, treatments and year with the help of software package R (version 4.3.1). Where the LSD test was significant, treatment means were separated by Duncan’s Multiple Range Test (DMRT) using the statistical package R at a 5% level of significance (p < 0.05). To separate differences among treatment combinations means, Post-hoc tests were performed using the Least Significant Difference (LSD) test [47].
3.1 Effect of Treatments on the Yield Parameters of Crops
The experiment demonstrated that different treatments significantly impacted the yield parameters of BARI Gom 30, Binamoog-8, and BRRI dhan71, both at the BAU farm and char land during the 2022–23 growing seasons (Table 2). For all three crops, treatment T5 (75% N from RFD + 25% N from PM) consistently produced superior yield-related parameters, while the control (T1) exhibited the lowest performance.
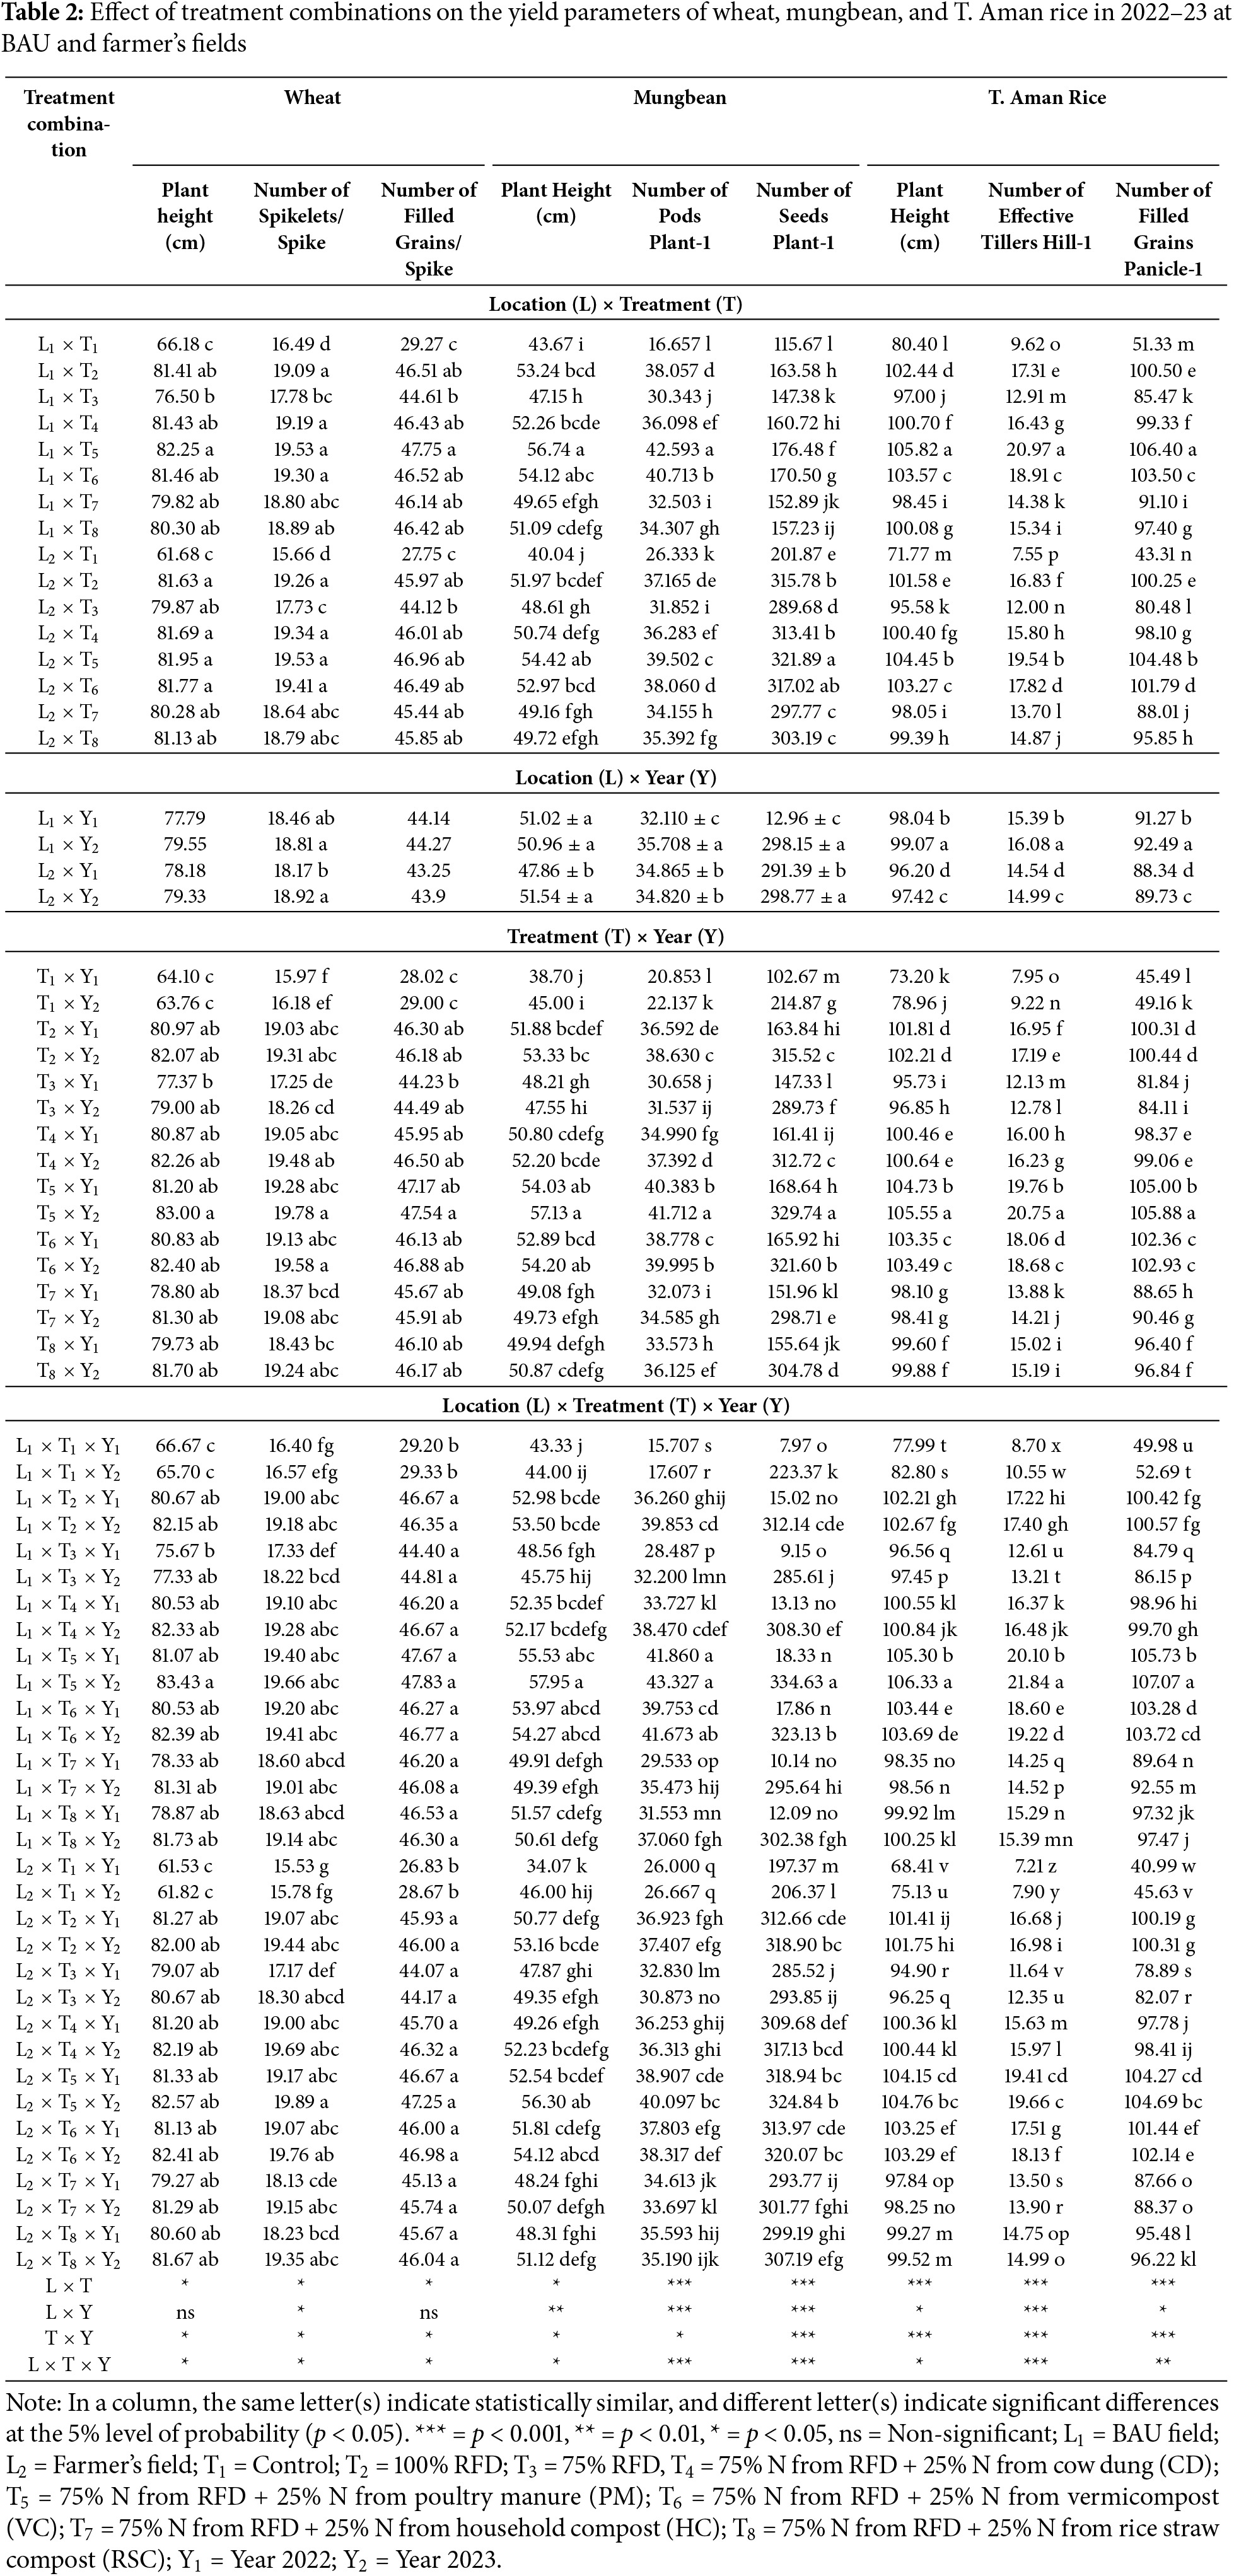
Significant differences in wheat plant height, number of spikelets/spike, and number of filled grains/spike were observed across treatments, locations, and years. The three-way combination L1 × T5 × Y2 (75% RFD + 25% PM at BAU farm in 2023) produced the tallest plants (83.43 cm), most spikelets (19.66/spike), and highest number of grains (47.83 grains/spike), representing 25.2%, 19.9%, and 67.7% increases respectively over L1 × T1 × Y1. In contrast, the poorest performance occurred in L2 × T1 × Y1 (control treatment at farmer’s field in 2022) with 61.53 cm height, 15.53 spikelets/spike, and 26.83 grains/spike. Two-way analysis revealed T5 consistently outperformed across locations (82.25 cm in L1 vs. 81.95 cm in L2) and years (83.00 cm in Y2 vs. 81.20 cm in Y1), while L1 generally performed better than L2 (Table 2).
For mungbean, significant differences in plant height, number of pods/plant, and number of seeds/plant were observed across treatments, locations, and years. The three-way interaction (Location × Treatment × Year) significantly affected mungbean yield parameters (p < 0.001). The combination L2 × T5 × Y2 (75% RFD + 25% PM at farmer’s field in 2023) produced the tallest plants (56.30 cm), highest pod count (40.10/plant), and maximum number of seeds (324.84 seeds/plant), representing increases of 34.6%, 88.5%, and 4075% respectively over the control (L1 × T1 × Y1). In contrast, the poorest performance occurred in L1 × T1 × Y1 (control treatment at BAU farm in 2022) with 43.33 cm height, 15.71 pods, and only 7.97 seeds. Two-way analysis revealed T5 consistently outperformed across locations (55.58 cm plant height overall) and years (329.74 seeds in Y2 vs. 168.64 in Y1), while L2 generally performed better than L1 (Table 2).
3.1.3 T. Aman Rice (BRRI Dhan71)
Significant differences in T. Aman rice plant height, number of effective tillers/hill, and number of filled grains/panicle were observed across treatments, locations, and years. The three-way interaction (Location × Treatment × Year) significantly influenced rice growth parameters (p < 0.01). The combination L1 × T5 × Y2 (75% RFD + 25% PM at BAU farm in 2023) produced the tallest plants (106.33 cm), most number of tillers (21.84/hill), and highest number of grains (107.07 grains/panicle), representing increases of 55.4%, 202.9%, and 161.2% respectively over the control (L2 × T1 × Y1). In contrast, the poorest performance occurred in L2 × T1 × Y1 (control treatment at farmer’s field in 2022) with 68.41 cm height, 7.21 tillers, and 40.99 grains. Two-way analysis revealed T5 consistently outperformed across locations (105.14 cm plant height overall) and years (105.88 grains in Y2 vs. 105.00 in Y1), while L1 generally yielded better than L2 (Table 2).
Across both locations, treatments and years, L1 × T5 × Y2 and L2 × T5 × Y2 (75% N from RFD + 25% N from PM in 2023 at BAU field and Char land soils, respectively) consistently achieved the highest grain/seed yield for wheat, mungbean, and T. Aman rice (Table S1). For all crop yields, the treatments can be arranged as T5 > T6 > T2 > T4 > T8 > T7 > T3 > T1.
The biological yield for the Wheat–Mungbean–T. Aman rice pattern was significantly influenced by the treatments at two locations in both years (Fig. 2). The main effects and two-way interaction effects of the factors were mostly significant for the three crops (Table S2). Treatment T5 (75% N from RFD + 25% N from PM) continuously yielded higher than other treatments for all the crops in both years at both locations.
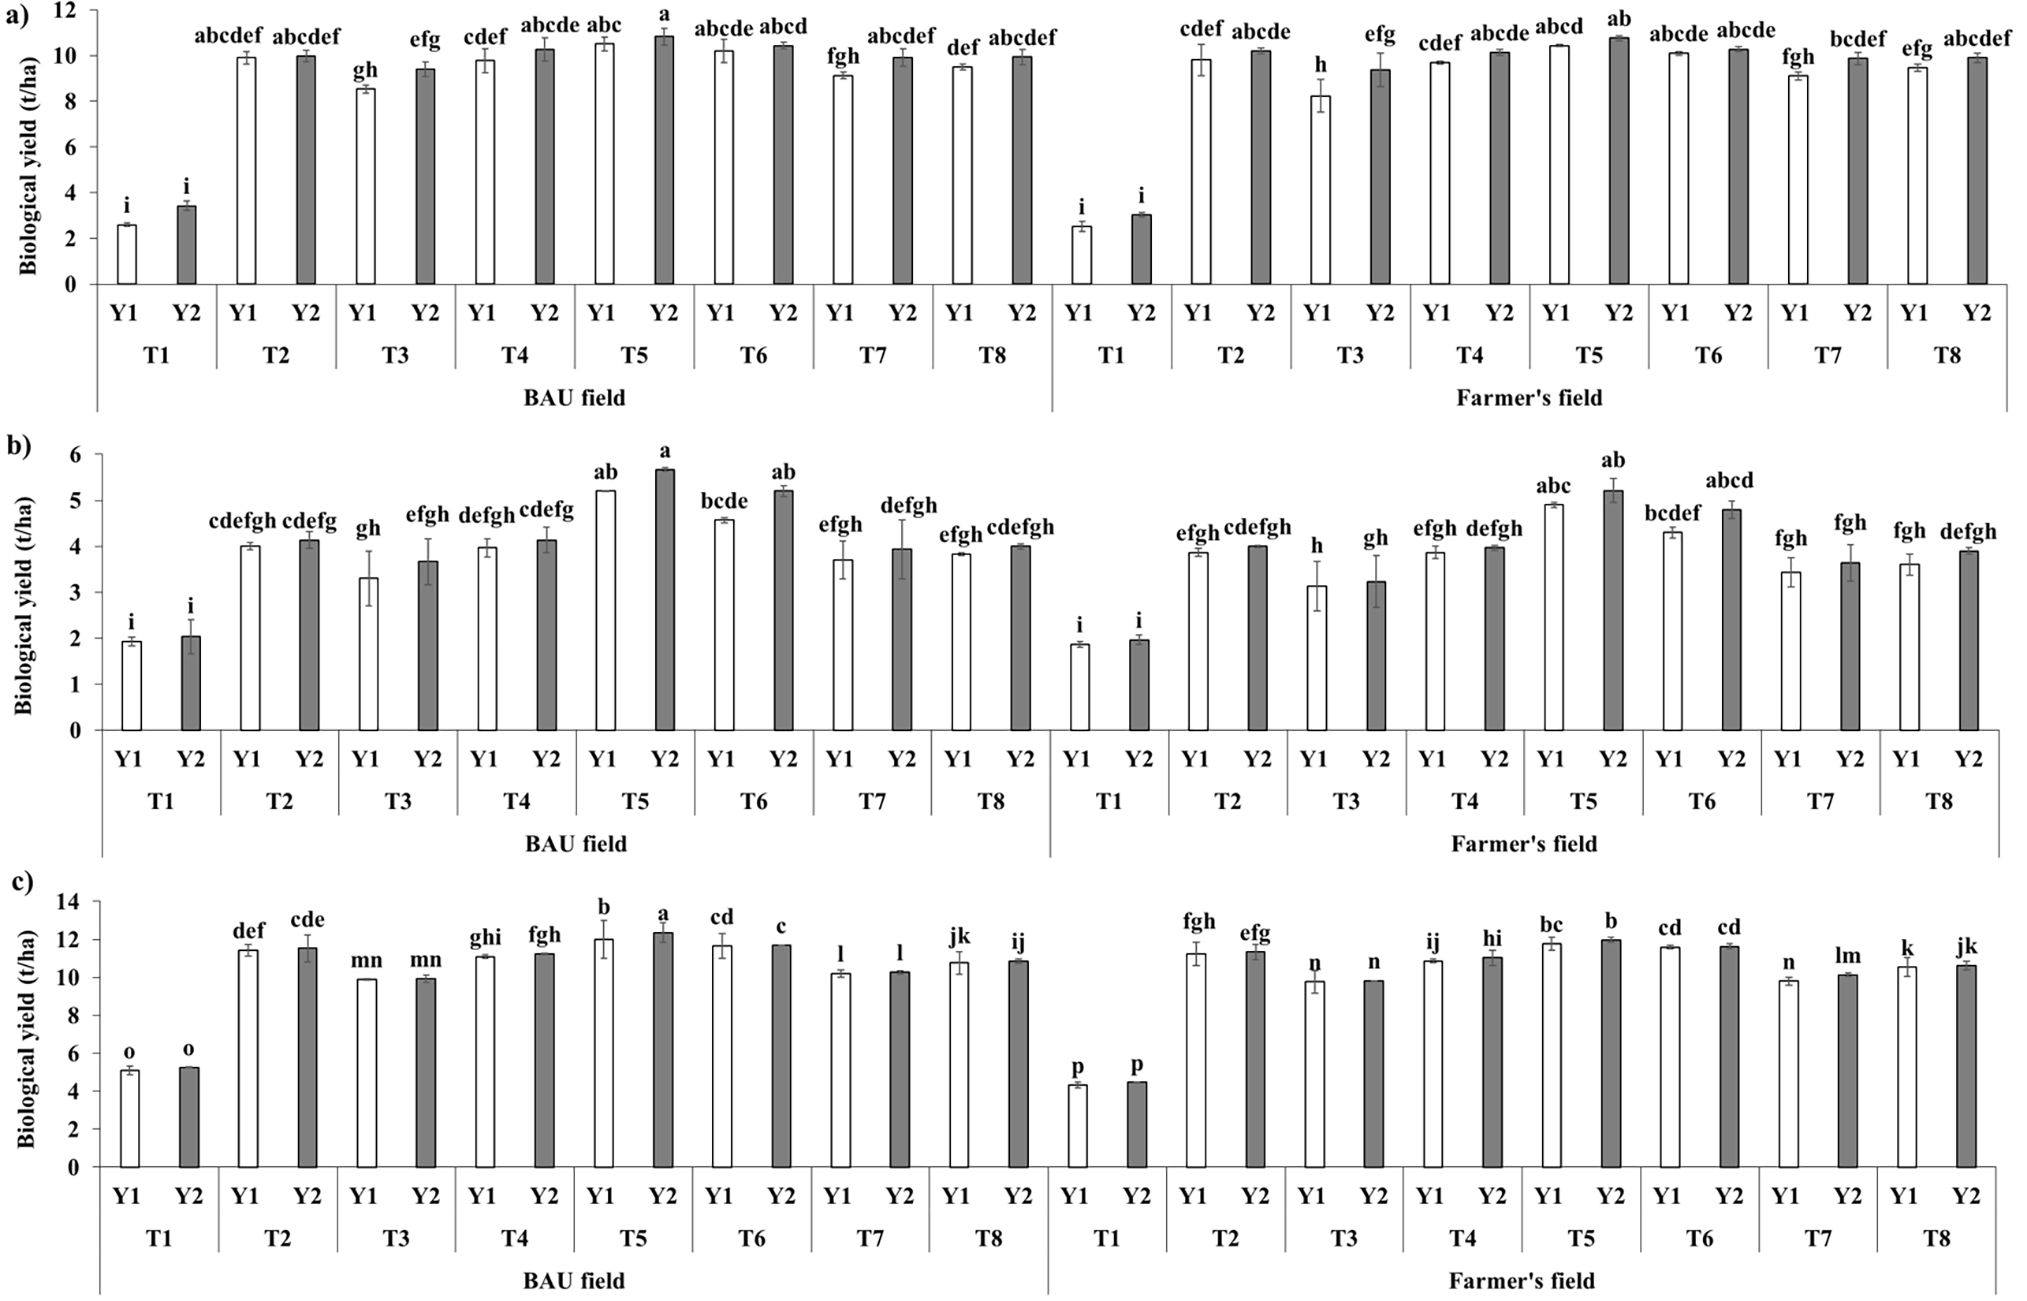
Figure 2: Effect of interaction among location, treatment and year on the biological yield of wheat (a), mungbean (b), and rice (c) at both BAU field and farmer’s field. Different lowercase letter(s) on top of each bar represent significant differences among treatments at 5% level of probability (p < 0.05) according to DMRT. Error bars represent standard error means. L1 = BAU field; L2 = Farmer’s field; T1 = Control; T2 = 100% RFD; T3 = 75% RFD, T4 = 75% N from RFD + 25% N from cow dung (CD); T5 = 75% N from RFD + 25% N from poultry manure (PM); T6 = 75% N from RFD + 25% N from vermicompost (VC); T7 = 75% N from RFD + 25% N from household compost (HC); T8 = 75% N from RFD + 25% N from rice straw compost (RSC); Y1 = Year 2022; Y2 = Year 2023
The three-way interaction effects of location, treatment, and year on wheat biological yield revealed significant variations. At the BAU field (L1), the combination L1 × T5 × Y2 (10.83 t ha−1) produced the highest biological yield, followed by L1 × T5 × Y1 (10.50 t ha−1), L1 × T6 × Y2 (10.43 t ha−1), and L1 × T6 × Y1 (10.20 t ha−1), all of which were statistically similar. These results indicate that T5 consistently enhanced wheat productivity, particularly in the second year (Y2). In contrast, the lowest yields were recorded in L1 × T1 × Y1 (2.60 t ha−1) and L1 × T1 × Y2 (3.43 t ha−1), where T1 (control) was applied, highlighting the inefficiency of no fertilization. Similarly, at the farmer’s field (L2), L2 × T5 × Y2 (10.77 t ha−1) and L2 × T5 × Y1 (10.43 t ha−1) were the top-performing combinations, while L2 × T1 × Y1 (2.53 t ha−1) and L2 × T1 × Y2 (3.03 t ha−1) were the least productive.
For mungbean, the interaction effects of location, treatment, and year on biological yield were also significant. At the BAU field (L1), the combination L1 × T5 × Y2 (5.67 t ha−1) achieved the highest biological yield, followed by L1 × T5 × Y1 (5.20 t ha−1), L1 × T6 × Y2 (5.20 t ha−1), and L1 × T6 × Y1 (4.57 t ha−1). These results indicate that T5 and T6 performed well for enhancing mungbean productivity, particularly in the second year (Y2). Conversely, the lowest yields were observed in L1 × T1 × Y1 (1.93 t ha−1) and L1 × T1 × Y2 (2.03 t ha−1), where no fertilization (T1) was applied. At the farmer’s field (L2), L2 × T5 × Y2 (5.20 t ha−1) and L2 × T5 × Y1 (4.90 t ha−1) were the best-performing combinations, while L2 × T1 × Y1 (1.87 t ha−1) and L2 × T1 × Y2 (1.97 t ha−1) were the least productive.
The interaction effects of location, treatment, and year on biological yield of T. Aman rice were highly significant. At the BAU field (L1), the combination L1 × T5 × Y2 (12.37 t ha−1) produced the highest biological yield, followed by L1 × T5 × Y1 (12.00 t ha−1), L1 × T6 × Y2 (11.70 t ha−1), and L1 × T6 × Y1 (11.67 t ha−1). In contrast, the lowest yields were recorded in L1 × T1 × Y1 (5.10 t ha−1) and L1 × T1 × Y2 (5.27 t ha−1), where no fertilization (T1) was applied. Similarly, at the farmer’s field (L2), L2 × T5 × Y2 (11.97 t ha−1) and L2 × T5 × Y1 (11.77 t ha−1) were the top-performing combinations, while L2 × T1 × Y1 (4.33 t ha−1) and L2 × T1 × Y2 (4.47 t ha−1) were the least productive. These findings highlight the consistent superiority of T5 across both locations and years, underscoring its potential to significantly improve T. Aman rice biological yield.
For all crops, if only treatments were considered, they can be arranged as T5 > T6 > T2 > T4 > T8 > T7 > T3 > T1 in case of biological yield.
3.3 Nutrient Uptake by the Crops
Nutrient concentrations in different parts of the plant samples were mostly significant across different locations, treatments and years combinations. The concentration of different nutrients (N, P, K and S) in grain and straw parts are given in Table S3–S5.
A significant interaction effect of different factors (locations, treatments and years) was found on the uptake of nutrients for all the crops (Figs. 3–5; Table S6). The nutrient uptake by BARI Gom30 varied significantly across different treatment combinations (Fig. 3). For N uptake, the values ranged from 21.73 kg ha−1 in the L2 × T1 × Y1 treatment combination to 115.5 kg ha−1 in the L1 × T5 × Y2 combination. P uptake showed a range from 3.156 kg ha−1 in the L2 × T1 × Y1 treatment to 29.215 kg ha−1 in the L1 × T5 × Y2 treatment combination. K uptake varied between 21.79 kg ha−1 in the L2 × T1 × Y1 treatment combination and 106.23 kg ha−1 in the L1 × T5 × Y2 treatment combination. S uptake ranged from 4.002 kg ha−1 in the L2 × T1 × Y1 treatment to 20.69 kg ha−1 in the L1 × T5 × Y2 treatment combination.
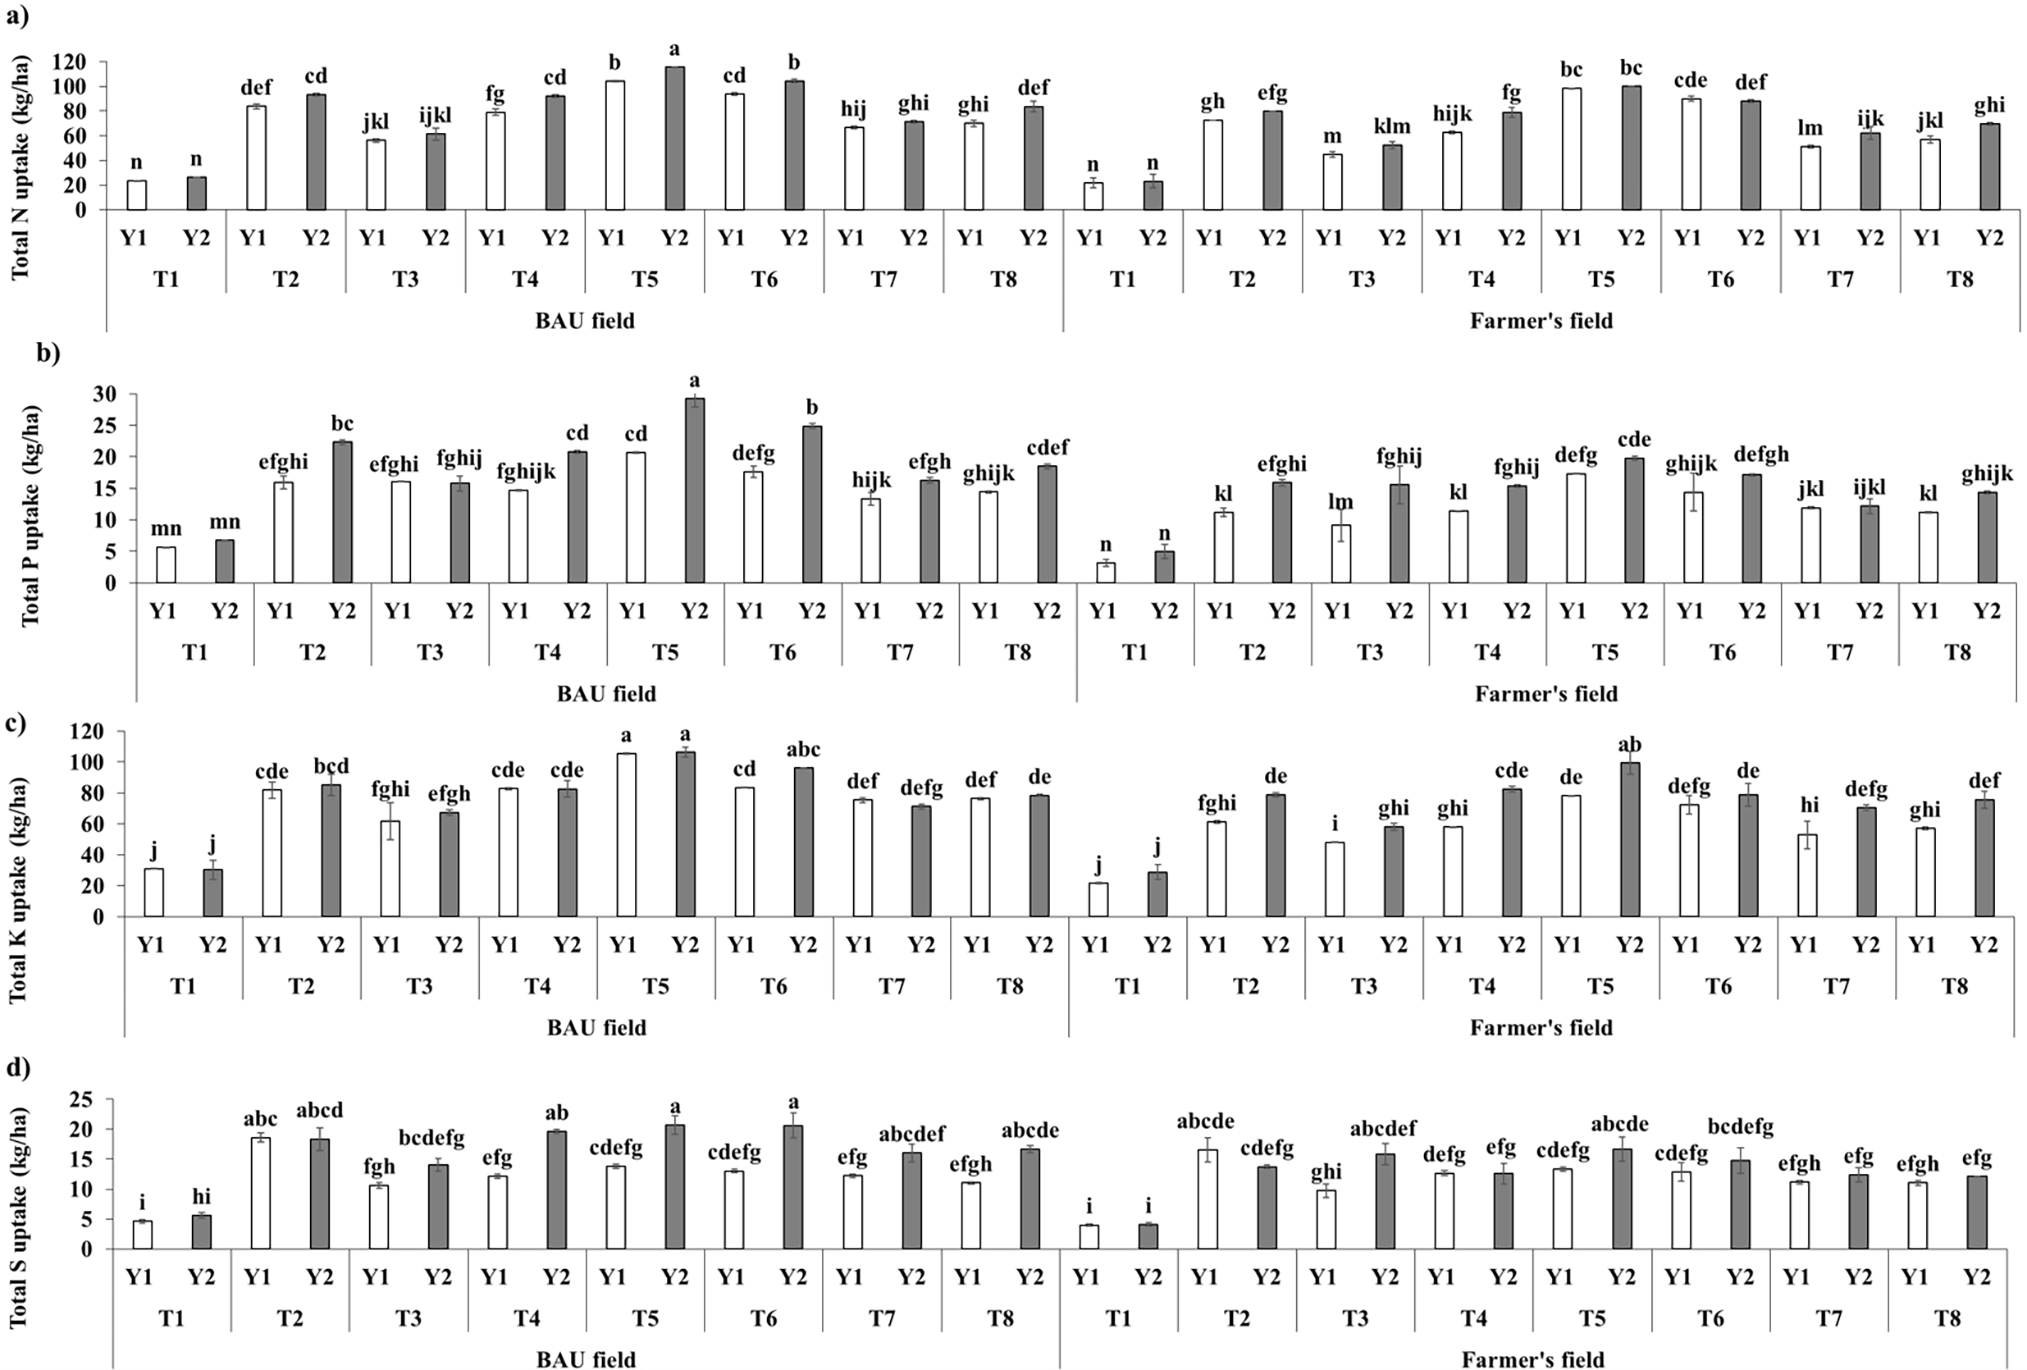
Figure 3: Effect of interaction among location, treatment and year on total uptakes of nitrogen (a), phosphorus (b), potassium (c), and sulphur (d) by wheat in BAU field and farmer’s field. Different lowercase letter(s) on top of each bar represent significant differences among treatments at the 5% level of probability (p < 0.05) according to DMRT. Error bars represent standard error means. L1 = BAU field; L2 = Farmer’s field; T1 = Control; T2 = 100% RFD; T3 = 75% RFD, T4 = 75% N from RFD + 25% N from cow dung (CD); T5 = 75% N from RFD + 25% N from poultry manure (PM); T6 = 75% N from RFD + 25% N from vermicompost (VC); T7 = 75% N from RFD + 25% N from household compost (HC); T8 = 75% N from RFD + 25% N from rice straw compost (RSC); Y1 = Year 2022; Y2 = Year 2023
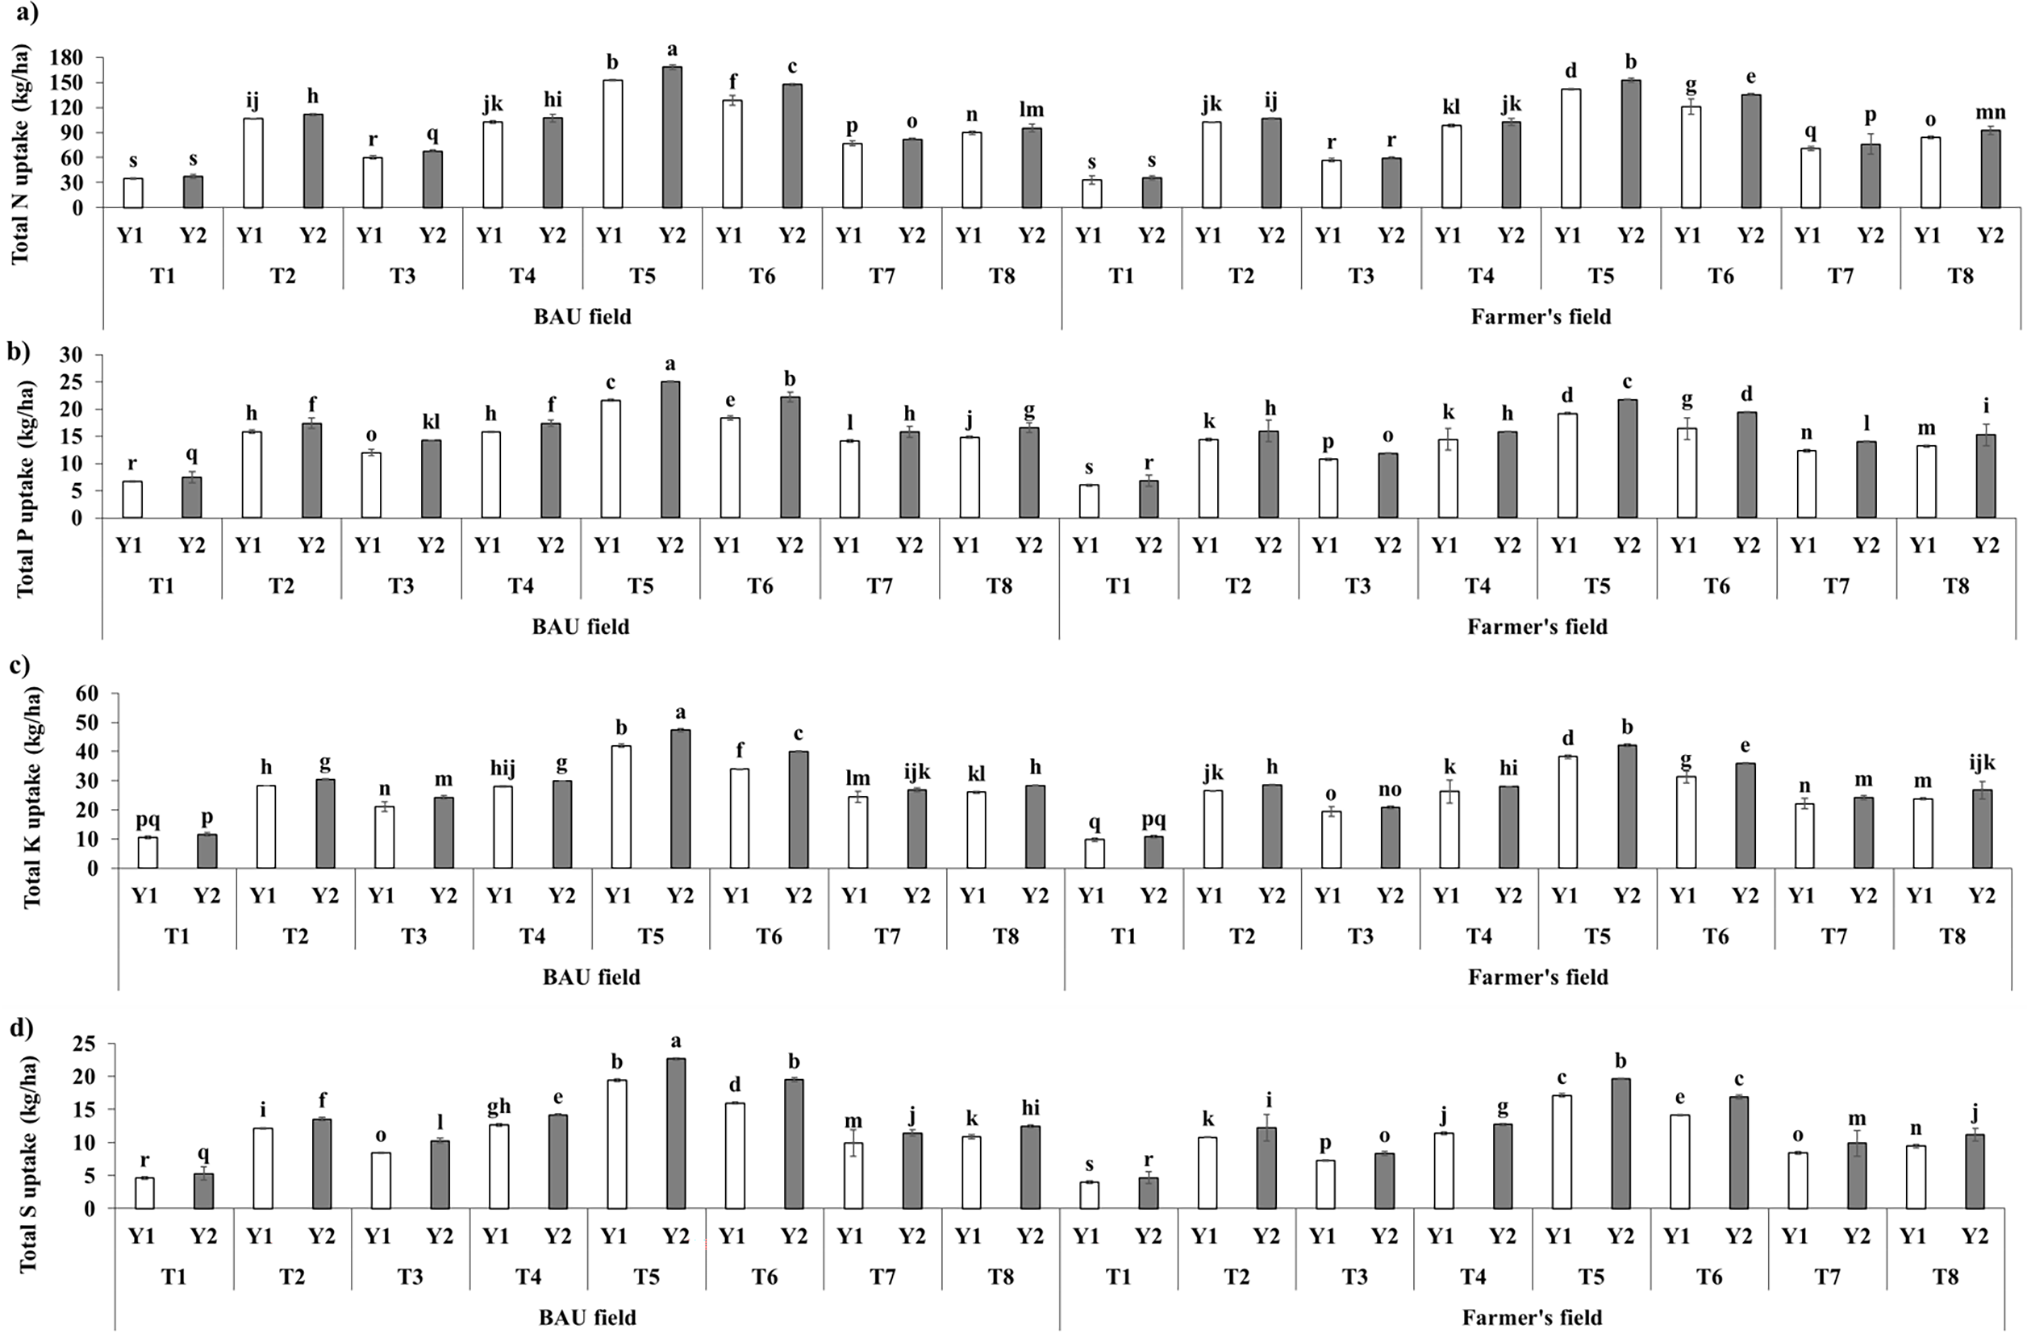
Figure 4: Effect of interaction among location, treatment and year on total uptakes of nitrogen (a), phosphorus (b), potassium (c), and sulphur (d) by mungbean in BAU field and farmer’s field. Different lowercase letter(s) on top of each bar represent significant differences among treatments at the 5% level of probability (p < 0.05) according to DMRT. Error bars represent standard error means. L1 = BAU field; L2 = Farmer’s field; T1 = Control; T2 = 100% RFD; T3 = 75% RFD, T4 = 75% N from RFD + 25% N from cow dung (CD); T5 = 75% N from RFD + 25% N from poultry manure (PM); T6 = 75% N from RFD + 25% N from vermicompost (VC); T7 = 75% N from RFD + 25% N from household compost (HC); T8 = 75% N from RFD + 25% N from rice straw compost (RSC); Y1 = Year 2022; Y2 = Year 2023
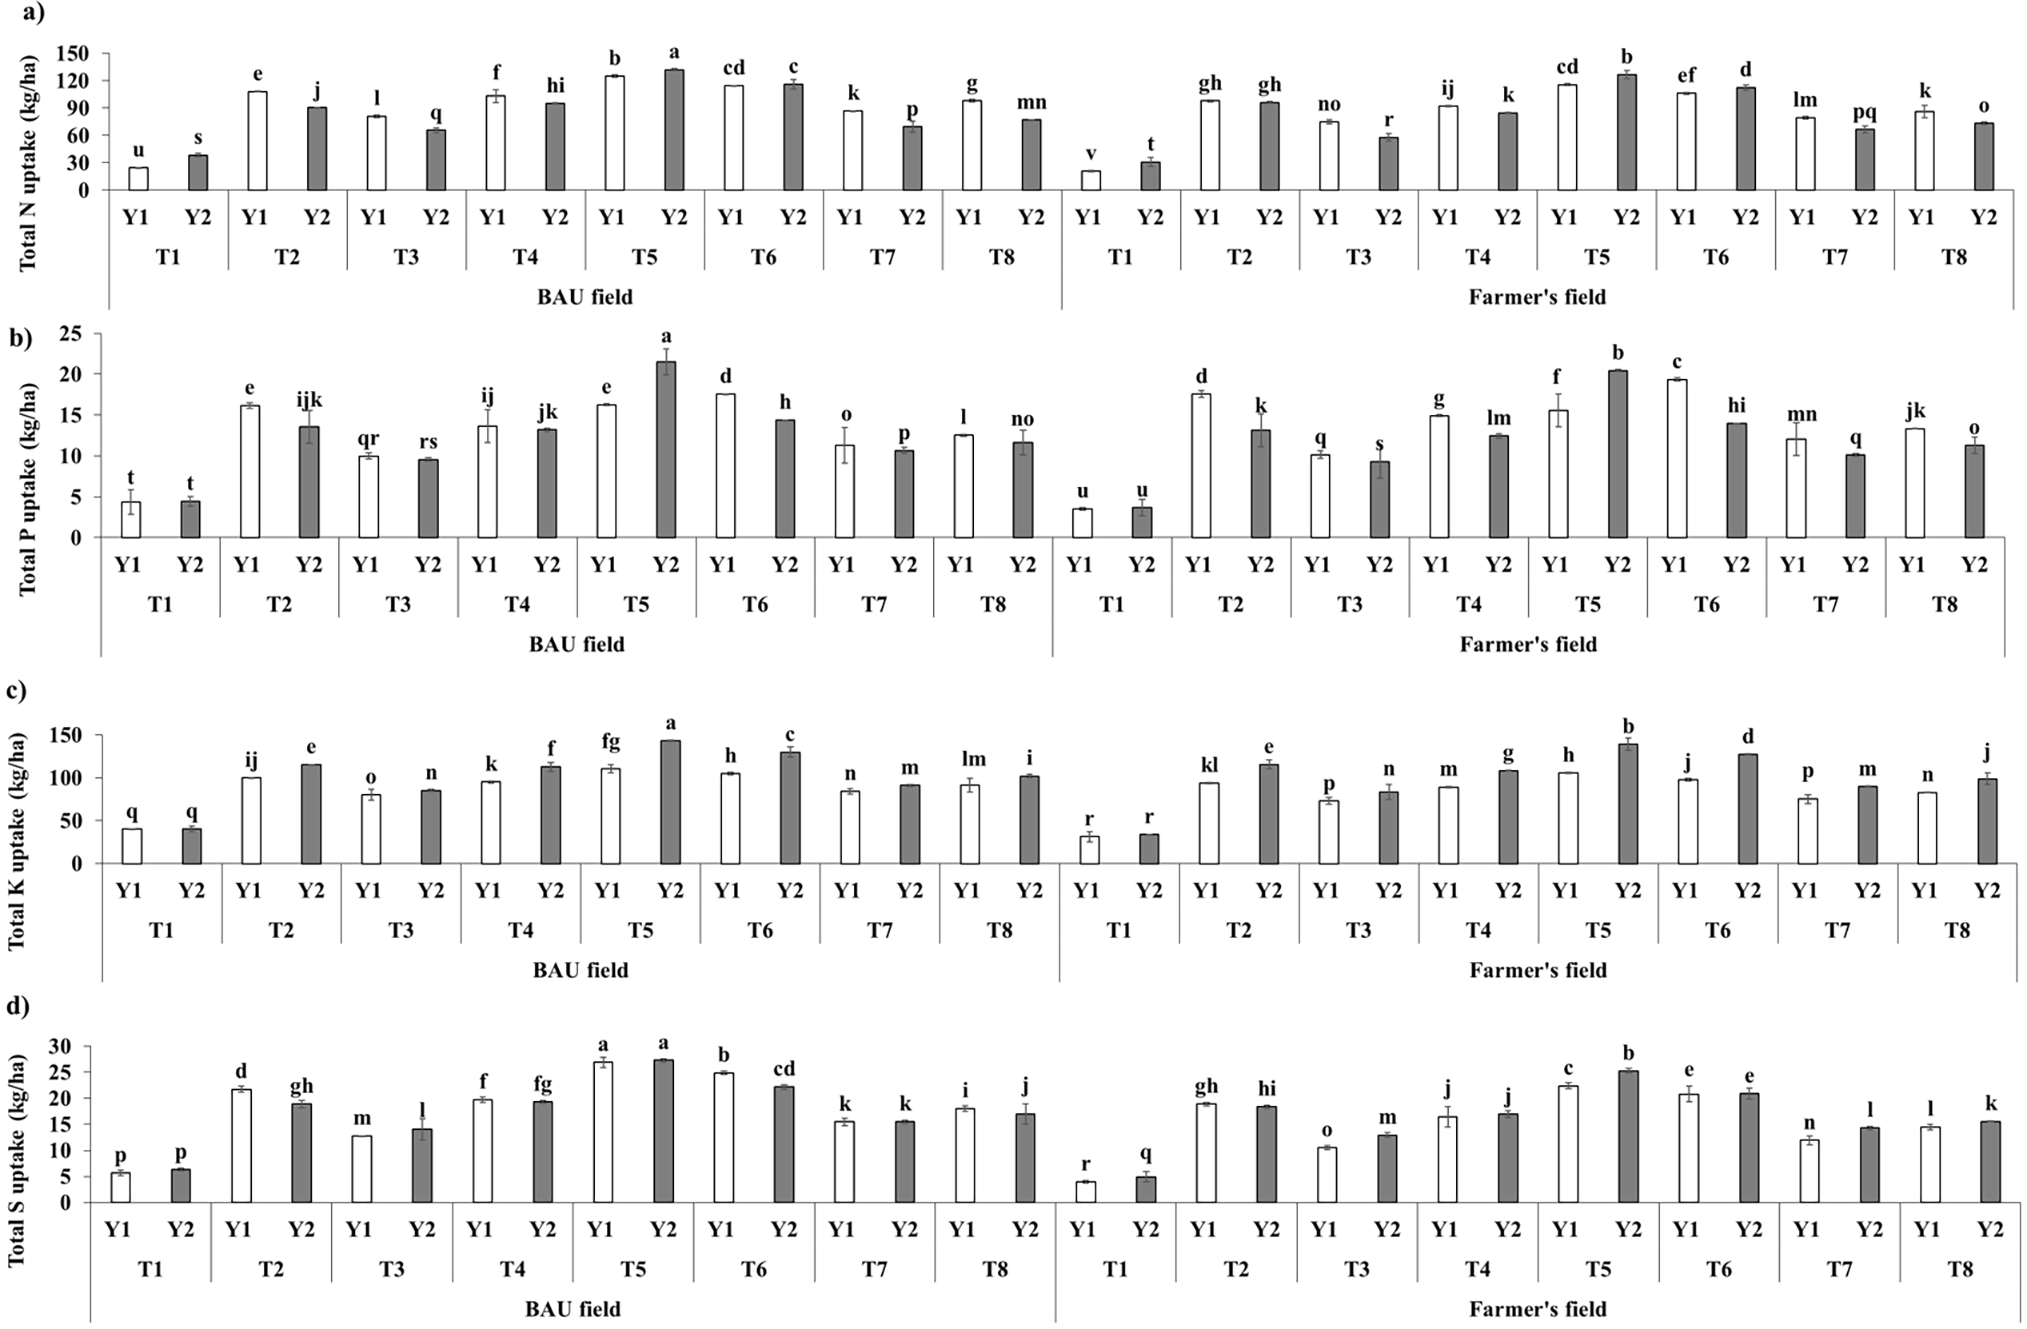
Figure 5: Effect of interaction among location, treatment and year on total uptakes of nitrogen (a), phosphorus (b), potassium (c), and sulphur (d) by T. Aman rice in BAU field and farmer’s field. Different lowercase letter(s) on top of each bar represent significant differences among treatments at the 5% level of probability (p < 0.05) according to DMRT. Error bars represent standard error means. L1 = BAU field; L2 = Farmer’s field; T1 = Control; T2 = 100% RFD; T3 = 75% RFD, T4 = 75% N from RFD + 25% N from cow dung (CD); T5 = 75% N from RFD + 25% N from poultry manure (PM); T6 = 75% N from RFD + 25% N from vermicompost (VC); T7 = 75% N from RFD + 25% N from household compost (HC); T8 = 75% N from RFD + 25% N from rice straw compost (RSC); Y1 = Year 2022; Y2 = Year 2023
The nutrient uptake by Binamoog-8 showed a wide range across different locations, treatment and year combinations (Fig. 4). N uptake ranged from 33.19 kg ha−1 in the L2 × T1 × Y1 treatment at the farmer’s field to 168.17 kg ha−1 in the L1 × T5 × Y2 treatment at the BAU field. P uptake varied between 5.983 kg ha−1 in the L2 × T1 × Y1 treatment at the farmer’s field and 25.005 kg ha−1 in the L1 × T5 × Y2 treatment at the BAU field. K uptake ranged from 9.74 kg ha−1 in the L2 × T1 × Y1 treatment at the farmer’s field to 47.28 kg ha−1 in the L1 × T5 × Y2 treatment at the BAU field. S uptake varied between 3.994 kg ha−1 in the L2 × T1 × Y1 treatment at the farmer’s field and 22.666 kg ha−1 in the L1 × T5 × Y2 treatment at the BAU field.
The nutrient uptake by BRRI dhan71 exhibited a wide range across different locations, treatments, and years (Fig. 5). N uptake ranged from 20.96 kg ha−1 in the L2 × T1 × Y1 treatment at the farmer’s field to 132.13 kg ha−1 in the L1 × T5 × Y2 treatment at the BAU field. P uptake varied between 3.538 kg ha−1 in the L2 × T1 × Y1 treatment at the farmer’s field and 21.493 kg ha−1 in the L1 × T5 × Y2 treatment at the BAU field. K uptake ranged from 31.33 kg ha−1 in the L2 × T1 × Y1 treatment at the farmer’s field to 143.14 kg ha−1 in the L1 × T5 × Y2 treatment at the BAU field. S uptake varied between 3.974 kg ha−1 in the L2 × T1 × Y1 treatment at the farmer’s field and 27.267 kg ha−1 in the L1 × T5 × Y2 treatment at the BAU field.
For all three crops cultivated, the increase in uptake of N, P, K, and S was more pronounced in the second year compared to the first year.
3.4 Marginal Benefit-Cost Ratio (MBCR)
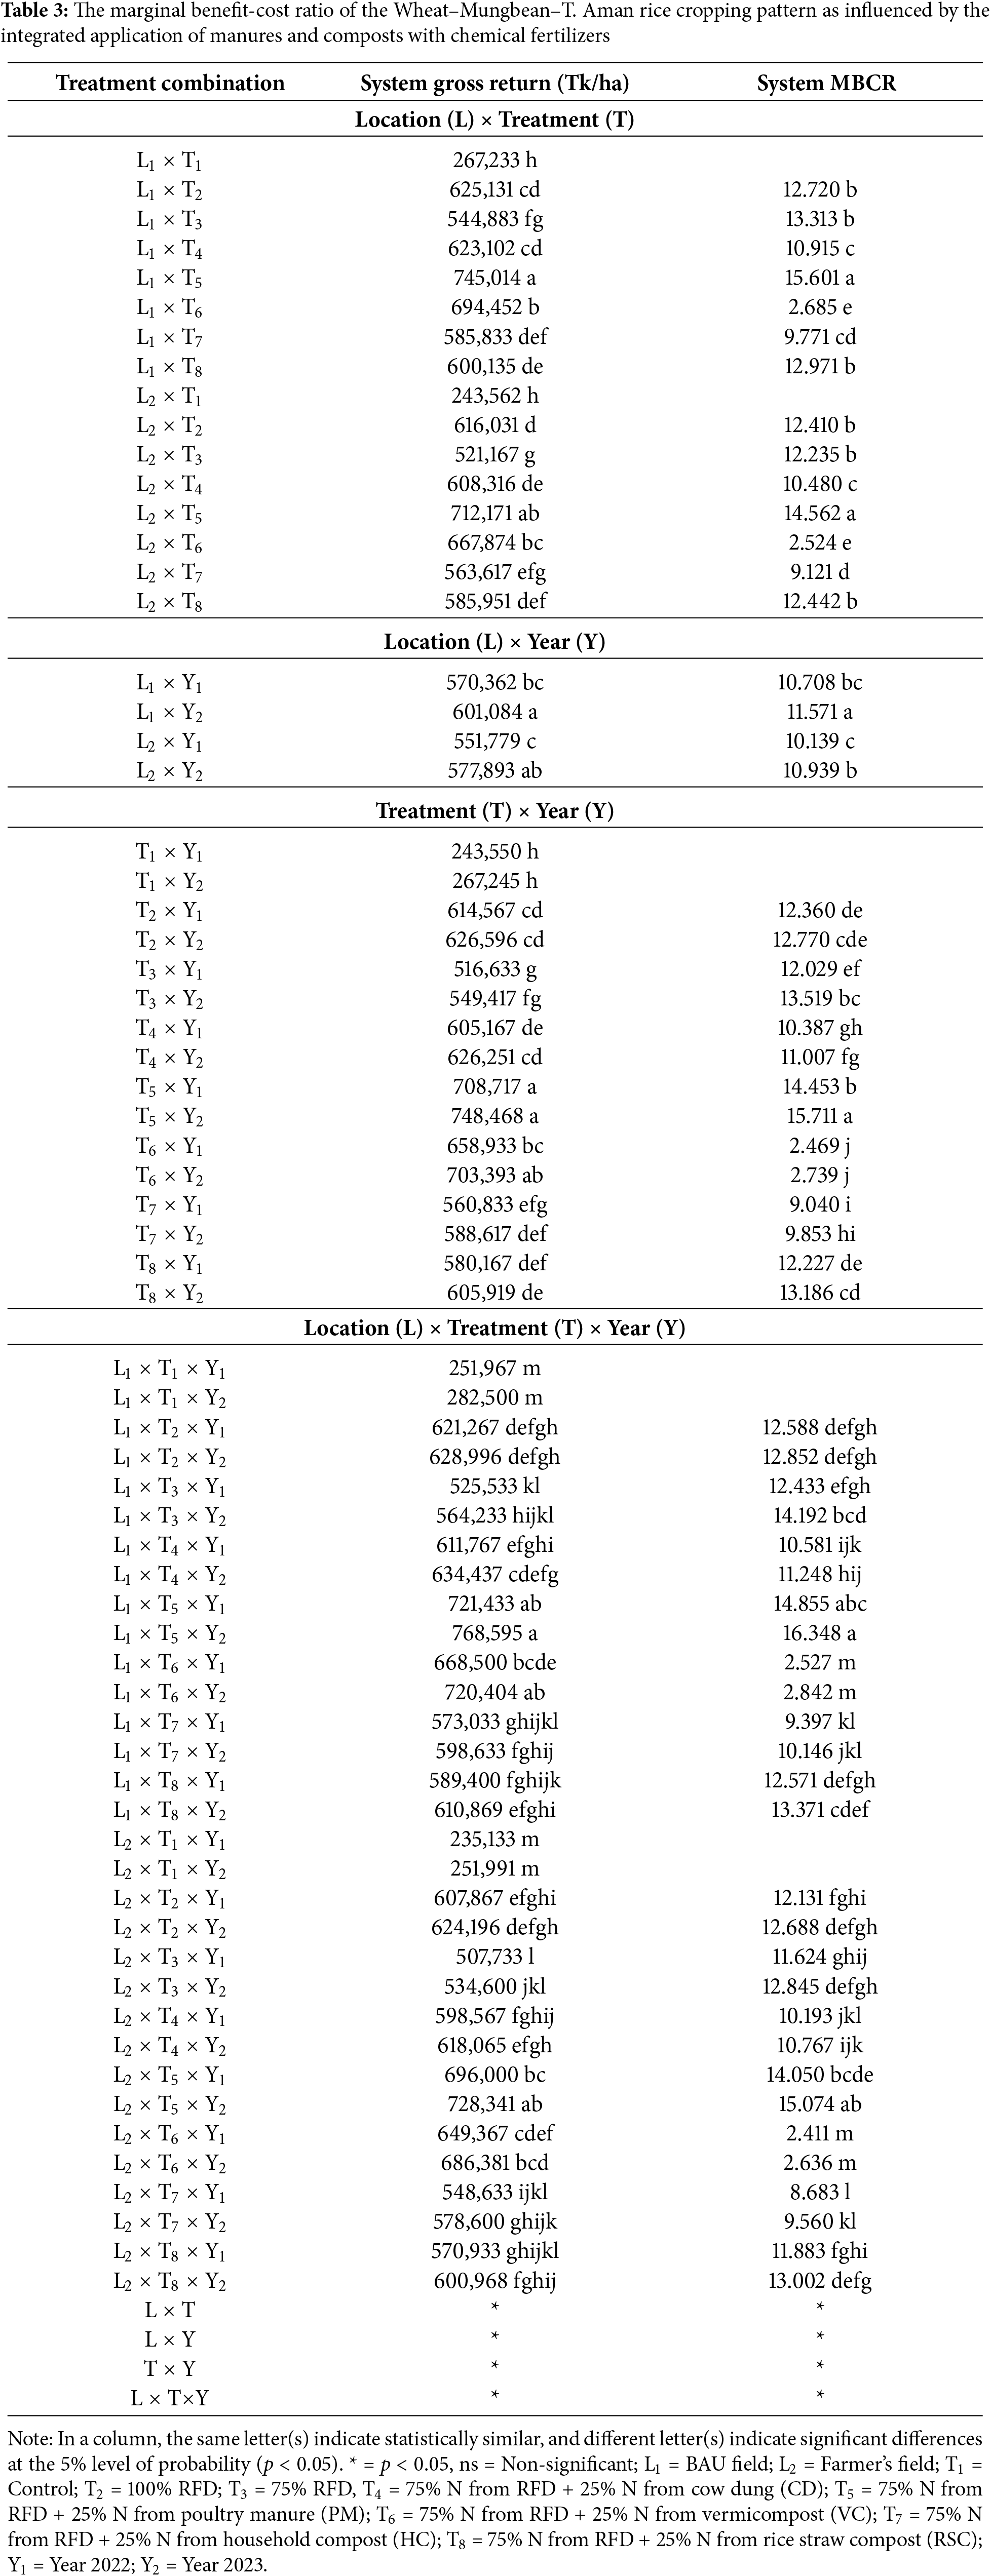
The system gross returns and marginal benefit-cost ratio (MBCR) of the Wheat–Mungbean–T. Aman rice cropping pattern was significantly influenced by the integrated application of manures and composts with chemical fertilizers at both locations in both years (Table 3, Table S7). The most profitable combination was the L1 × T5 × Y2 treatment (BAU field, 75% N RFD + 25% N from PM in second year), which achieved the highest system gross return of Tk 768,595/ha and the highest MBCR of 16.35. This combination outperformed all others; in contrast, the least profitable combination was the L2 × T1 × Y1 treatment (Farmer’s field, control treatment in Year 2022), which recorded the lowest system gross return of Tk 235,133/ha and was economically inefficient. The BAU field (L1) consistently showed higher returns and MBCR values compared to the Farmer’s field (L2). Among treatments, T5 consistently delivered superior results across both locations and years, while the control treatment (T1) performed poorly. Year 2023 (Y2) generally showed higher gross returns than Year 2022 (Y1), though with slight variations in MBCR.
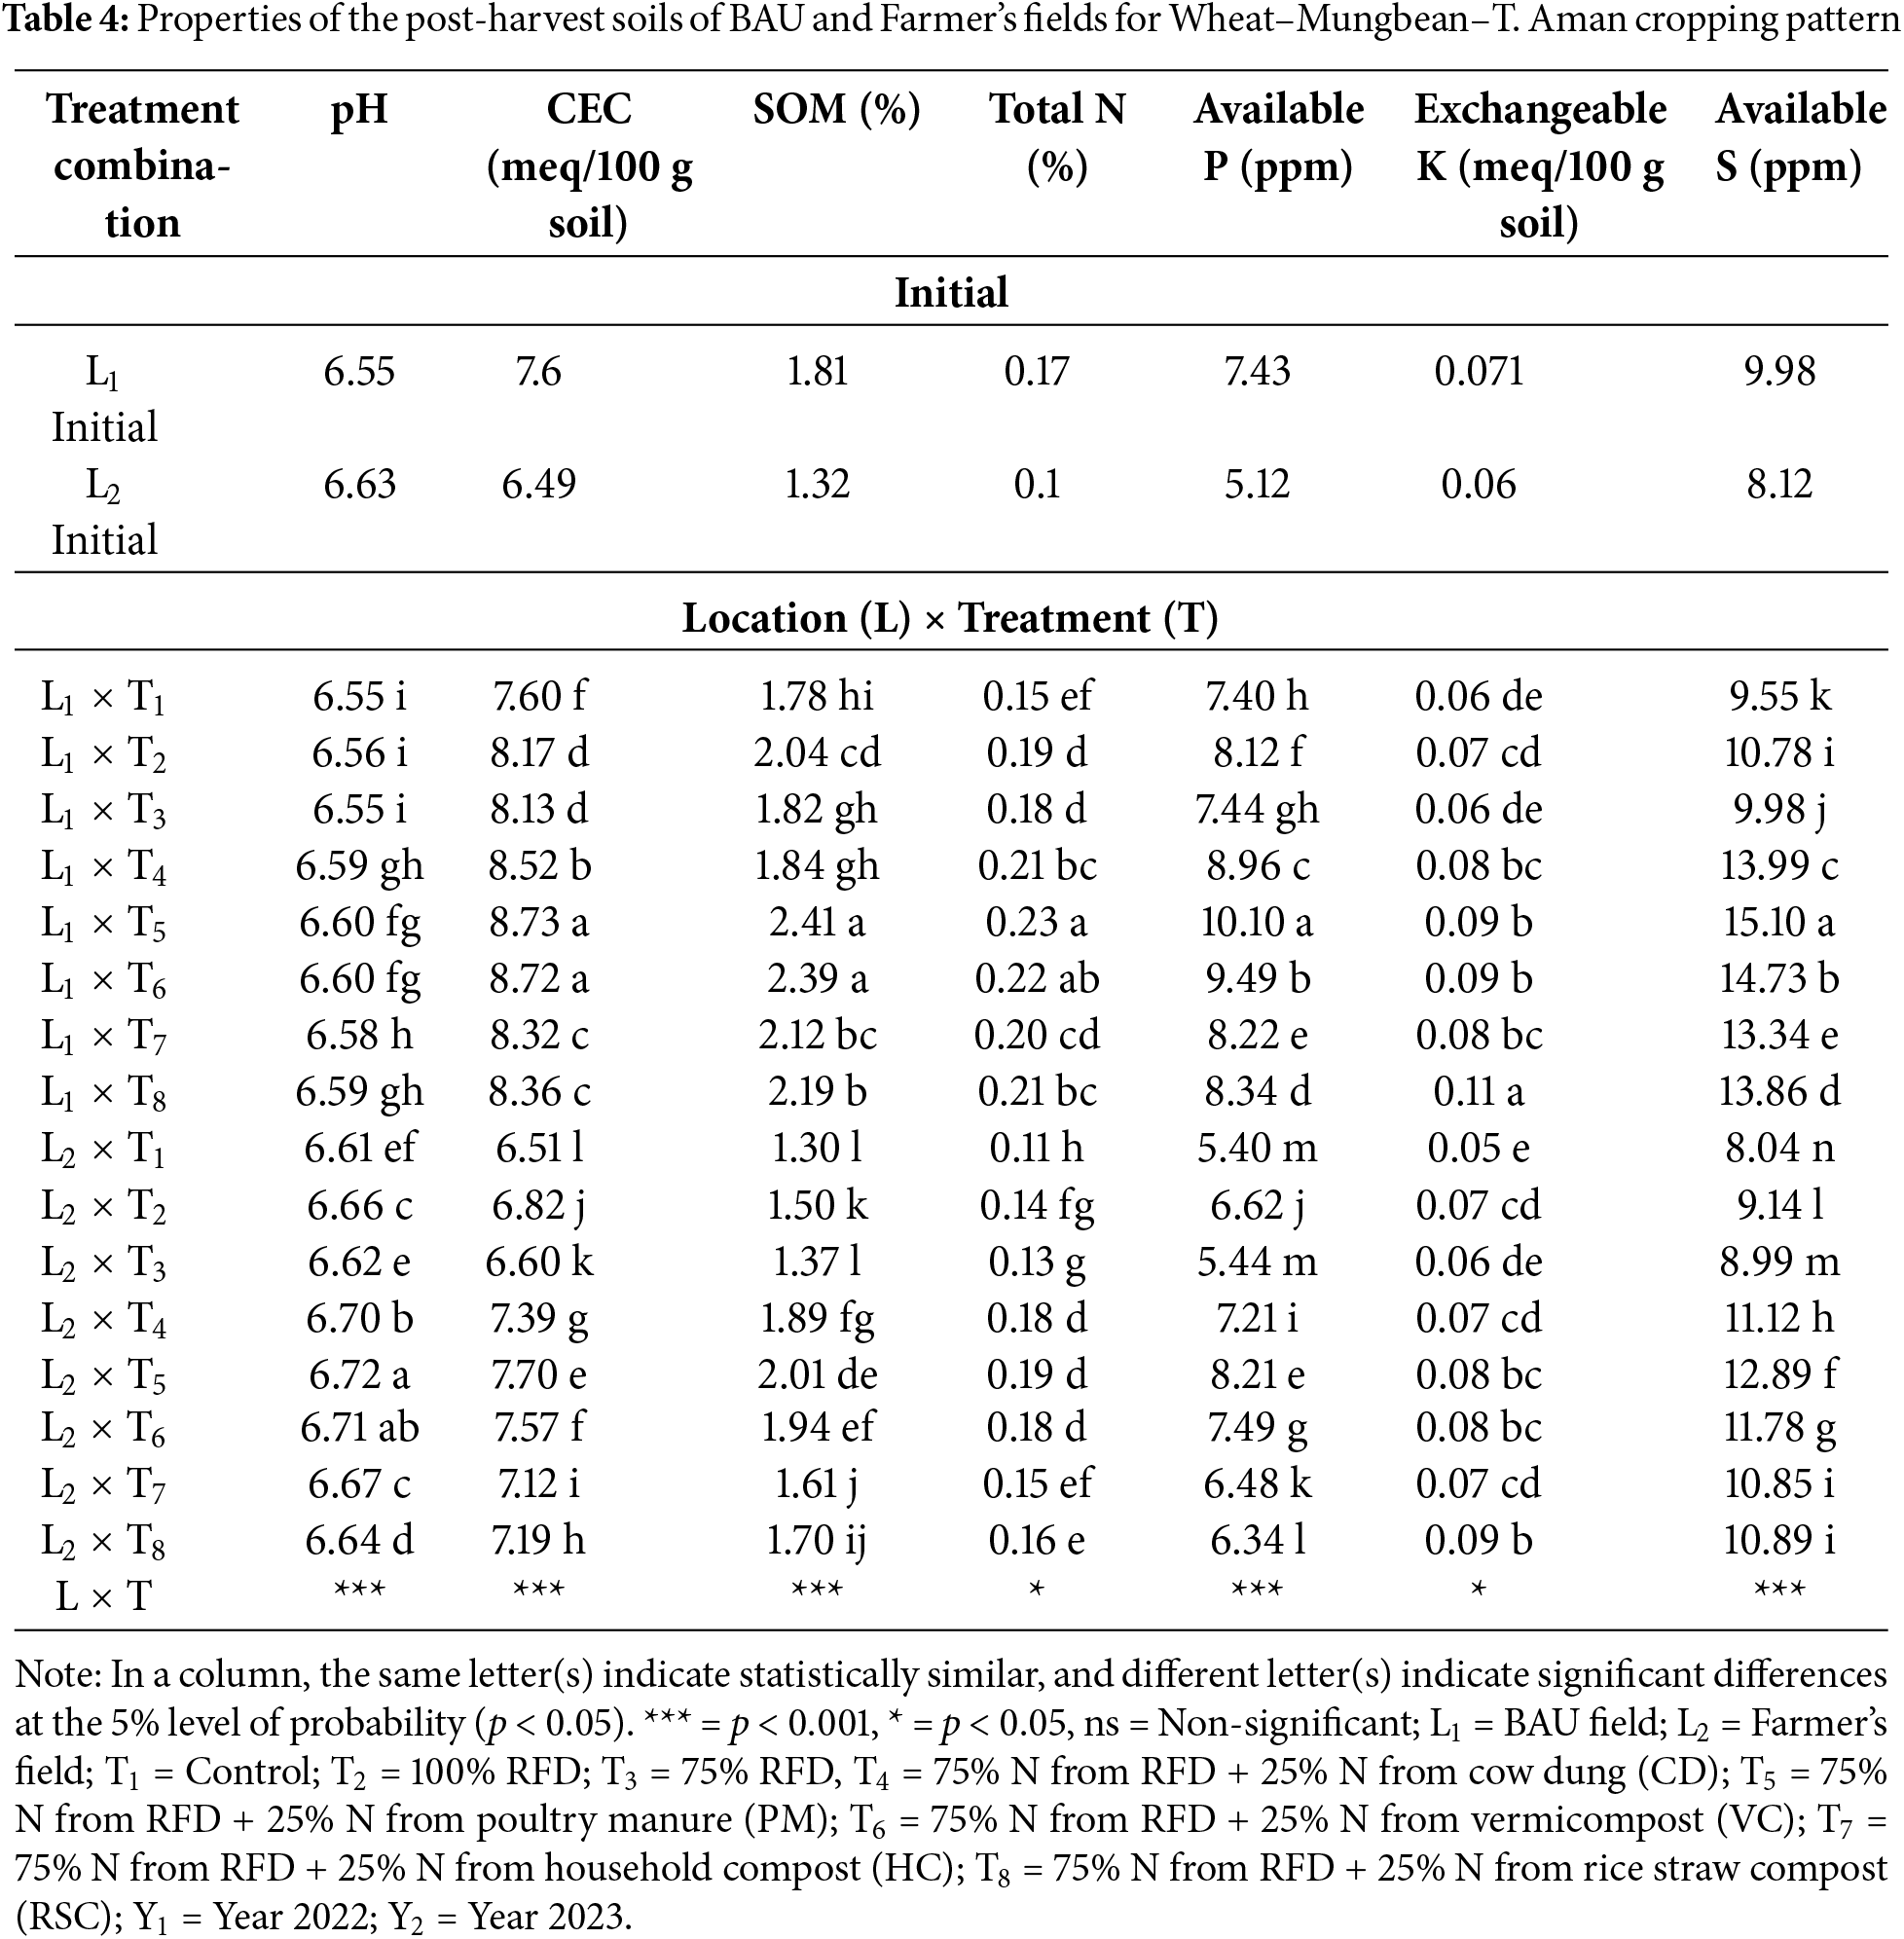
3.5 Properties of POST-Harvest Soils
Analysis of post-harvest soils revealed significant variations in chemical and fertility properties among different factors in both the BAU farm and Farmers field in both years (Table 4). BAU field showed better chemical and fertility properties than the farmer’s field. The pH of the soil in both locations was slightly affected by the treatments. The two-way interaction of location and treatment for the Wheat–Mungbean–T. Aman cropping pattern was significant for all the properties of post-harvest soil (Table 4). CEC was significantly increased from low to medium levels through the combination L1 × T5 (8.73 meq/100 g soil), followed by L1 × T6 (8.72 meq/100 g soil), which were statistically similar. In the Farmer’s field, L2 × T5 and L2 × T6 recorded CEC values of 7.70 and 7.57 meq/100 g soil, respectively, indicating consistent improvement across locations. SOM also increased significantly, with L1 × T5 achieving the highest SOM content of 2.41%, up from an initial 1.81%, and L1 × T6 reaching 2.39%. In the Farmer’s field, L2 × T5 and L2 × T6 recorded SOM values of 2.01% and 1.94%, respectively, up from an initial 1.32%. The increase in SOM directly influenced the total N content, which rose significantly across treatments. L1 × T5 recorded the highest N content at 0.23%, followed by L1 × T6 at 0.22%, while L2 × T5 and L2 × T6 recorded 0.19% and 0.18%, respectively. Available P and S levels were also significantly enhanced, particularly in L1 × T5, which recorded 10.10 ppm for P and 15.10 ppm for S, and in L2 × T5, which recorded 8.21 ppm for P and 12.89 ppm for S. Exchangeable K was significantly higher in L1 × T8 (75% N from RFD + 25% N from rice straw compost) at 0.11 meq/100 g soil, followed by L2 × T8 at 0.09 meq/100 g soil. In contrast, the control treatment in both locations (L1 × T1 and L2 × T1) showed the lowest levels of all the nutrients.
The gradual decline of soil fertility is leading to a concerning issue in crop yields that is alarming for scientists, policymakers, and farmers. Applying organic manures combined with inorganic fertilizers has improved crop yield and yield-related traits. This includes increases in plant height, the number of productive tillers hill−1, the number of grains panicle−1/spike−1, as well as grain and straw yield noted by various researchers when they combine organic manures with inorganic fertilizers [21,48–50]. In this study, the growth and yield parameters of wheat, mungbean, and T. Aman rice were significantly improved by the integrated applications of organic and inorganic fertilizers. The highest biological yield for wheat, mungbean and T. Aman rice was observed in L1 × T5 × Y2 combinations (25% N from PM with 75% N fertilizer at BAU field in 2023) with 10.83, 5.67 and 12.37 t ha−1. PM with chemical fertilizers also performed well in the farmer’s field in the second year (L2 × T5 × Y2:25% N from PM with 75% N fertilizer at the farmer’s field in 2023). This indicates that PM with chemical fertilizers is the most productive treatment across both locations and crops. The treatment combination L1 × T5 × Y2 caused the maximum biological yield increase with an average of 328.06%, 203.57% and 185.41%, respectively, over L2 × T1 × Y1 combination (No fertilization at farmer’s field in 2022) that recorded the lowest biological yield among all combinations. After PM, 25% N from VC with 75% RFD (T6) showed better performance, followed by 25% N from CD with 75% RFD (T4) and 100% RFD (T2) at both locations in both years. Yield parameters and yield for all three crops were better at location L1 (BAU field) and in the second year (Y2) which might be due to better fertility status and management practices throughout the cropping seasons. However, the yield improvement in Char land soil was higher than in farm soil which might be due to the difference in their baseline fertility and physico-chemical properties. Char soils are typically nutrient-poor and lack organic matter, making them highly responsive to organic amendments [35]. PM is considered one of the best types of animal manure for providing high N and balanced nutrients [18]. According to Ojo et al. [51], poultry manure effluent contains more organic carbon (OC), N, P, K, iron (Fe), and zinc (Zn) than rice bran and cow dung effluent. On the other hand, VC is particularly effective in increasing vegetative growth, root development, and yield components, as seen in studies where the application of VC resulted in the best outcomes [52,53].
In this study, the highest total uptake of macronutrients by the crops, including N, P, K, and S was recorded in treatment combination L1 × T5 × Y2 (75% N from RFD + 25% N from PM in BAU field in 2023). After L1 × T5 × Y2, treatment combination L2 × T5 × Y2 (75% N from RFD + 25% N from PM in Char land soils in 2023) performed well for nutrient uptake. Followed by T5, treatment T6 (75% N from RFD + 25% N from VC) also showed better performance for nutrient uptake in combination with locations and years for the three crops under study. Organic materials improve nutrient availability by microbial activity, which boosts nutrient cycling. PM improves nutrient uptake by crops more effectively than NPK fertilizer alone due to its adequate supply of macro and micronutrients, including calcium (Ca) and magnesium (Mg), which are often lacking in NPK fertilizers [54]. Combining PM with NPK fertilizer enhances the residual effect of nutrients in the soil. Like PM, plants also absorbed nutrients more effectively when VC was applied with chemical fertilizers compared to chemical fertilizers alone. This result aligns with Ravimycin [55] and Moeinnamini et al. [56], who reported that nutrient uptake by crops was significantly increased than control by applying VC.
Economic analysis was done to find out the economically better treatment (s). The cost and return analysis showed that T5 treatment (75% N from RFD + 25% N from PM) at BAU field (L1) in second year (Y2) had the highest gross return (about Tk 768,595/ha) and MBCR (16.35) followed by same treatment (T5) at Char land soils (L2) in second year (Y2) (Gross return Tk 728,341/ha and MBCR 15.07), making it the most profitable treatment. The higher MBCR for T5 treatment is due to its ability to boost grain yields across all crops in the system while keeping input costs relatively moderate compared to other integrated treatments. Treatment T6 (75% N from RFD + 25% N from VC) in both locations in both years also had higher gross return but due to the high price of vermicompost, its economic efficiency was low. Singh et al. [57] reported that combining organic manures with chemical fertilizers in IPNS improves gross return, added benefit, and MBCR. Sarker et al. [58] reported that higher gross return and MBCR were observed in Wheat–Mungbean–T. Aman rice cropping pattern, due to favorable input-output balance.
Soil treated with organic amendments exhibited notable increases in soil chemical properties like CEC, organic matter, and availability of key macro elements such as N, P, K, S, Ca, and Mg compared to untreated soil [59]. Adding organic materials like animal manure and CD improves microbial activity and helps reduce metal toxicity [21]. In this experiment, BAU field showed T5 (75% N from RFD + 25% N from PM) consistently caused the highest improvements in CEC, SOM, total N, exchangeable K, and available P and S in the soils of both fields after harvest, making it the most effective treatment for enhancing soil fertility. Again, treatment T6 (75% N from RFD + 25% N from VC), being mostly statistically at par with treatment T5, showed substantial improvements in most of the parameters such as SOM, total N, and exchangeable K. However, K content in both soils was highest in treatment T8 (75% N from RFD + 25% N from RSC), as RSC contains more K than other organic manures or composts. Chemical and fertility properties of soil were better in BAU field because farm soils are actively cultivated and managed with fertilization, crop rotation, and organic matter incorporation, while char land soils, often formed by river deposits, may lack these nutrients and adequate management practices [35]. Organic amendments in Char lands enhance soil structure, water retention, and nutrient availability, leading to more improvements in soil fertility from low to medium [42] compared to farmlands, which already have better soil fertility. PM and VC applications increase soil pH, enhance SOC, and improve soil health [59,60]. According to Li et al. [61], organic amendments with low C/N ratios can enhance the deposition of crop root exudates into stable organic C in soil and promote crop growth. Crop root exudates play a crucial role in forming stable SOC by directly associating with soil minerals [62]. In contrast, organic amendments must first degrade into small molecules before stabilizing SOC [63]. PM helps soil water retention and microbial activity, and promotes soil fertility, whereas VC aids in the slow release of P through microbial activity [64] and boosts soil P mineralization rates [65,66]. Besides these organic amendments increase nutrient availability, reduce K fixation, and raise CEC of soil [67–69]. However, the nutrient contents of organic amendments are highly variable. Users must understand and manage manure and compost variability to optimize their agronomic and environmental benefits. Manure requires careful management to avoid over- or under-application and to address the long-term environmental impacts of both application and storage [70]. To sustain crop productivity, farmers should use balanced inorganic fertilizers and integrate organic manures to improve soil health [35]. Applying organic manure at least once a year along with chemical fertilizers can help maintain soil fertility and ensure long-term sustainable yields [71]. In the char lands of Bangladesh, where soil fertility is poor, using organic materials along with chemical fertilizers is therefore, essential for enhancing physicochemical properties of soil and sustaining agricultural productivity [72].
The reduction in chemical fertilizers can mitigate potential risks to human health associated with the excessive use of chemical fertilizers. Furthermore, crops produced from integrated organic and inorganic farming systems offer superior food value. The economic implementation of this sustainable farming system highlights its potential to enhance the economic viability of small-scale farmers [73]. The findings of the present study could help the government and other organizations to take proper steps to improve the livelihood of char people [35] by increasing crop production and better soil management practices. However, long-term field trials in other char areas using different cropping patterns are needed to better understand nutrient balance, fertility restoration, and changes in physicochemical properties of soils, as multi-year trials in multi-locations can make findings more applicable. To provide deeper insights into farmers’ benefits, using appropriate technology and cost-efficient organic amendments is crucial to predict improvement in crop yield and soil fertility.
From the present study, it was found that organic manures or composts could compensate for up to 25% of the recommended doses of inorganic fertilizers, and by combining both organic and inorganic sources of nutrients, a substantial increase in the yield parameters, yields and nutrient uptake of wheat, mungbean and T. Aman rice can be achieved. The integrated plant nutrition system can improve soil health by boosting soil fertility parameters in both farm and char lands. Particularly in char soils with poor fertility and low organic matter status, the integrated approach should be practiced for the betterment of the livelihood of char farmers. Although PM and VC performed well, the economic efficiency of the latter was low. Therefore, based on cost-effectiveness and superior performance, the use of poultry manure might be an industrially promising and economically sustainable approach for small-scale farmers in Wheat–Mungbean–T. Aman rice cropping pattern in char land areas.
Acknowledgement: The authors extend their appreciation to Taif University, Saudi Arabia, for supporting this work through project number (TU-DSPP-2025-30). The authors gratefully acknowledge the financial support from the Science and Technology Fellowship Trust, Bangladesh to carry out this research work.
Funding Statement: This research was funded by Taif University, Saudi Arabia, Project No. (TU-DSPP-2025-30). The Science and Technology Fellowship Trust (SL No. 39.00.0000.035.22.013.19.144) under the Ministry of Science and Technology of Bangladesh partially financed the current research.
Author Contributions: Conceptualization, Tahsina Sharmin Hoque, Md. Anwarul Abedin and Md. Anamul Hoque; methodology, Tahsina Sharmin Hoque, Md. Anwarul Abedin and Krisna Rani Sarker; software, Nusrat Jahan Mim; validation, Nusrat Jahan Mim, Krisna Rani Sarker and Tahsina Sharmin Hoque; formal analysis, Nusrat Jahan Mim and Krisna Rani Sarker; investigation, Krisna Rani Sarker; data curation, Nusrat Jahan Mim and Tahsina Sharmin Hoque; supervision, Tahsina Sharmin Hoque, Md. Anwarul Abedin and Md. Anamul Hoque; writing—original draft preparation, Krisna Rani Sarker and Nusrat Jahan Mim; writing—review and editing, Tahsina Sharmin Hoque, Md. Anwarul Abedin, Md. Anamul Hoque, Ahmed Gaber, Mohammed M. Althaqafi and Mohammad Anwar Hossain. All authors reviewed the results and approved the final version of the manuscript.
Availability of Data and Materials: Data available on request from the authors.
Ethics Approval: Not applicable.
Conflicts of Interest: The authors declare no conflicts of interest to report regarding the present study.
Supplementary Materials: The supplementary material is available online at https://www.techscience.com/doi/10.32604/phyton.2025.062465/s1.
References
1. Moges A, Dagnachew M, Yimer F. Land use effects on soil quality indicators: a case study of abo-wonsho southern Ethiopia. Appl Environ Soil Sci. 2013;2013(1):784989–9. doi:10.1155/2013/784989. [Google Scholar] [CrossRef]
2. Haynes RJ. Labile organic matter fractions as central components of the quality of agricultural soils: an overview. Adv Agron. 2005;85:221–68. doi:10.1016/S0065-2113(04)85005-3. [Google Scholar] [CrossRef]
3. Islam MM, Karim AJMS, Jahiruddin M, Majid NM, Miah MG, Ahmed MM, et al. Effects of organic manure and chemical fertilizers on crops in the radish-stem amaranth-Indian spinach cropping pattern in homestead area. Aust J Crop Sci. 2011;5(11):1370–8. [Google Scholar]
4. Sood MC. Integrated nutrient supply and management for potato production in mid hills of Shimla. Potato J. 2007;34(1–2):101–2. [Google Scholar]
5. Heitkamp F, Raupp J, Ludwig B. Soil organic matter pools and crop yields as affected by the rate of farmyard manure and use of biodynamic preparations in a sandy soil. Org Agric. 2011;1(2):111–24. doi:10.1007/s13165-011-0010-7. [Google Scholar] [CrossRef]
6. Iqbal A, Tang X, Ali I, Yuan P, Khan R, Khan Z, et al. Integrating low levels of organic fertilizer improves soil fertility and rice yields in paddy fields by influencing microbial communities without increasing CH4 emissions. Appl Soil Ecol. 2023;189(3):104951. doi:10.1016/j.apsoil.2023.104951. [Google Scholar] [CrossRef]
7. Ali ME, Islam MR, Jahiruddin M. Effect of integrated use of organic manures with chemical fertilizers in the rice-rice cropping system and its impact on soil health. Bangladesh J Agric Res. 2009;34(1):81–90. doi:10.3329/bjar.v34i1.5754. [Google Scholar] [CrossRef]
8. Bilkis S, Islam MR, Jahiruddin M, Rahman MM. Integrated use of manure and fertilizers increases rice yield, nutrient uptake, and soil fertility in the boro-fallow-t. aman rice cropping pattern. SAARC J Agric. 2017;15(2):147–61. doi:10.3329/sja.v15i2.35159. [Google Scholar] [CrossRef]
9. Saha BK, Rose MT, Wong VNL, Cavagnaro TR, Patti AF. Nitrogen dynamics in soil fertilized with slow-release brown coal-urea fertilizers. Sci Rep. 2018;8:14577. doi:10.1038/s41598-018-33050-7. [Google Scholar] [CrossRef]
10. Ghuman BS, Sur HS. Effect of manuring on soil properties and yield of rain-fed wheat. J Indian Soc Soil Sci. 2006;54(1):6–11. [Google Scholar]
11. Adeleye EO, Ayeni LS, Ojeniyi SO. Effect of poultry manure on soil physico-chemical properties, leaf nutrient content, and yield of yam (Dioscorea rotundata) on Alfisol in South Western Nigeria. J Am Sci. 2010;6(10):871–8. [Google Scholar]
12. Jeptoo A, Aguyoh JN, Saidi M. Improving carrot yield and quality through the use of bio-slurry manure. Sustain Agric Res. 2013;2(1):164–72. doi:10.5539/sar.v2n1p164. [Google Scholar] [CrossRef]
13. Aytenew M, Bore G. Effects of organic amendments on soil fertility and environmental quality: a review. J Plant Sci. 2020;8(5):112–9. doi:10.11648/j.jps.20200805.12. [Google Scholar] [CrossRef]
14. Chastain JP, Camberato JJ, Albrecht JE. Nutrient content of livestock and poultry manure. Clemson Univ. 2001;32:36. [Google Scholar]
15. Khaliq T, Mahmood T, Kamal J, Masood A. Effectiveness of farmyard manure, poultry manure, and nitrogen for corn (Zea mays L.) productivity. Int J Agric Biol. 2004;6:260–3. [Google Scholar]
16. Farid MS, Mamun MAA, Matin MA, Jahiruddin M. Combined effect of cow dung, poultry manure, dhaincha, and fertilizers on the growth and yield of rice. J Agrofor Environ. 2011;5:51–4. [Google Scholar]
17. Saranraj P, Stella D. Vermicomposting and its importance in improvement of soil nutrients and agricultural crops. Novus Nat Sci Res. 2012;1(1):14–23. [Google Scholar]
18. Hoque TS, Hasan AK, Hasan MA, Nahar N, Dey DK, Mia S, et al. Nutrient release from vermicompost under anaerobic conditions in two contrasting soils of Bangladesh and its effect on wetland rice crop. Agriculture. 2022;12(3):376. doi:10.3390/agriculture12030376. [Google Scholar] [CrossRef]
19. Iqbal A, Hussain Q, Mo Z, Hua T, Mustafa AE, Tang X. Vermicompost supply enhances fragrant-rice yield by improving soil fertility and eukaryotic microbial community composition under environmental stress conditions. Microorganisms. 2024;12(6):1252. doi:10.3390/microorganisms12061252. [Google Scholar] [PubMed] [CrossRef]
20. Singh SK, Kumar M, Singh RP, Bohra JS, Srivastava JP, Singh SP, et al. Conjoint application of organic and inorganic sources of nutrients on yield, nutrient uptake and soil fertility under rice (Oryza sativa)-wheat (Triticum aestivum) system. J Indian Soc Soil Sci. 2018;66(3):287–94. doi:10.5958/0974-0228.2018.00035.x. [Google Scholar] [CrossRef]
21. Azad MAK, Ahmed T, Eaton TE, Hossain MM. Organic amendments with poultry manure and cow dung influence the yield and status of nutrient uptake in wheat (Triticum aestivum). Am J Plant Sci. 2022;13(7):994–1005. doi:10.4236/ajps.2022.137066. [Google Scholar] [CrossRef]
22. Ho TTK, Tra VT, Le TH, Nguyen NKQ, Tran CS, Nguyen PT, et al. Compost to improve sustainable soil cultivation and crop productivity. Case Stud Chem Environ Eng. 2022;6:100211. doi:10.1016/j.cscee.2022.100211. [Google Scholar] [CrossRef]
23. Arfat MY, Sher A, Ul-Allah S, Sattar A, Ijaz M, Manaf A, et al. Organic manure for promoting sustainable agriculture. In: Hasanuzzaman M, Hawrylak-Nowak B, Islam T, editors. Biostimulants for crop production and sustainable agriculture. Oxfordshire, UK: CABI; 2022. p. 110–21. doi: 10.1079/9781789248098.0008. [Google Scholar] [CrossRef]
24. Minofar B, Milčić N, Maroušek J, Gavurová B, Maroušková A. Understanding the molecular mechanisms of interactions between biochar and denitrifiers in N2O emissions reduction: pathway to more economical and sustainable fertilizers. Soil Tillage Res. 2025;248:106405. doi:10.1016/j.still.2024.106405. [Google Scholar] [CrossRef]
25. Mandal KG, Misra AK, Hati KM, Bandyopadhyay KK, Ghosh PK, Mohanty M. Rice residue-management options and effects on soil properties and crop productivity. J Food Agric Environ. 2004;2(1):224–31. [Google Scholar]
26. Danapriatna N, Ismarani I, Lutfiadi R, Dede M. Effect of straw compost (Oryza sativa L.) on crop production. Pertanika J Trop Agric Sci. 2023;46(3):1047–62. doi:10.47836/pjtas.46.3.17. [Google Scholar] [CrossRef]
27. Strunecký O, Shreedhar S, Kolář L, Maroušková A. Changes in soil water retention following biochar amendment. Energy Sources Part A Recover Util Env Eff. 2025;47(1):7145–52. doi:10.1080/15567036.2021.1916652. [Google Scholar] [CrossRef]
28. Khan M, Sultana N, Akter N, Zaman MS, Choudhury AK. Increasing cropping intensity and productivity through mungbean inclusion in wheat-fallow-T. Aman rice cropping pattern. Bangladesh J Agric Res. 2018;43(2):333–43. doi:10.3329/bjar.v43i2.37336. [Google Scholar] [CrossRef]
29. Mohidem NA, Hashim N, Shamsudin R, Che Man H. Rice for food security: revisiting its production, diversity, rice milling process and nutrient content. Agriculture. 2022;12(6):741. doi:10.3390/agriculture12060741. [Google Scholar] [CrossRef]
30. Pavolová P, Bakalár T, Kyšeľa K, Klimek M, Hajduová Z, Zawada M. The analysis of investment into industries based on portfolio managers. Acta Montan Slovaca. 2021;26(1):161–70. [Google Scholar]
31. Akbari M, Loganathan N, Tavokolian H, Mardani A, Streimikiene D. The dynamic effect of micro-structural shocks on private investment behavior. Acta Montan Slovaca. 2021;26(1):1–17. [Google Scholar]
32. Das B, Pooniya V, Shivay YS, Zhiipao RR, Biswakarma N, Kumar D, et al. Twenty-one years’ impact of using organic amendments on the productivity of rice-wheat rotation and soil properties. Field Crops Res. 2024;309:109311. doi:10.1016/j.fcr.2024.109311. [Google Scholar] [CrossRef]
33. Diatta AA, Bassène C, Manga AGB, Abaye O, Thomason W, Battaglia M, et al. Integrated use of organic amendments increased mungbean (Vigna radiata (L.) Wilczek) yield and its components compared to inorganic fertilizers. Urban Agric Reg Food Syst. 2023;8(1):e20048. doi:10.1002/uar2.20048. [Google Scholar] [CrossRef]
34. Alam RM, Malak MA, Quader MA. Livelihood vulnerability of char land people in Brahmaputra Jamuna River system. Jagannath Univ J Life Earth Sci. 2018;4(1):54–64. [Google Scholar]
35. Ali MM, Tarafder M, Mohsin N, Ma H. Soil characterization and fertility assessment of char lands for increased cropping intensity and crop productivity. Prog Agric. 2020;31(1):56–67. doi:10.3329/pa.v31i1.48313. [Google Scholar] [CrossRef]
36. Kannaiyan. Bio-fertilizers—key factor in organic farming. In: The hindu survey of Indian agriculture. Chennai, India: Kasturi & Sons Ltd.; 2000. p. 165–73. [Google Scholar]
37. Black CA. Methods of soil analysis: part 1. Madison, WI, USA: American Society of Agronomy; 1965. [Google Scholar]
38. Walkey AJ, Black AI. Estimation of organic carbon by chromic acid titration method. J Soil Sci. 1934;25:259–60. [Google Scholar]
39. Chapman HD. Cation exchange capacity. In: Black CA, editor. Methods soil analysis. Madison, WI, USA: American Society of Agronomy; 1965. p. 891–901. [Google Scholar]
40. Bremner JM. Methods of soil analysis. Part II. Chemical and microbiological properties. In: Black CA, editor. Agronomy monographs. Madison, WI, USA: American Society of Agronomy; 1965. p. 529–80. [Google Scholar]
41. Olsen SR, Cole CU, Watanabe FS, Dean LA. Estimation of available phosphorus in soil by extraction with sodium bicarbonate. Washington, DC, USA: United States Department of Agriculture; 1954. Circular No.: 939. [Google Scholar]
42. Fertilizer Recommendation Guide (FRG). Fertilizer recommendation guide-2018. Farmgate, Dhaka: Bangladesh Agricultural Research Council (BARC); 2018. [Google Scholar]
43. Nelson DW, Sommer LE. Total carbon, organic carbon, and organic matter. In: Page AL, Keeney DR, Baker DE, Miller RH, Ellis RJ, Rhoades JD, editors. Methods of soil analysis: part 2, chemical and microbiological properties. 2nd ed. Madison, WI, USA: Soil Science Society of America, American Society of Agronomy; 1982. p. 539–79. [Google Scholar]
44. Piper CS. Soil and plant analysis: a laboratory manual of methods for the examination of soils and the determination of the inorganic constituents of plants. Scotland, UK: Hans Publishers; 1966. [Google Scholar]
45. Knudsen D, Peterson GA, Pratt PF. Lithium, sodium, and potassium. In: Page AL, Miller RH, Keeney DR, editors. Methods of soil analysis: part 2. Madison, WI, USA: American Society of Agronomy; 1982. p. 225–45. [Google Scholar]
46. Chowdhury AKMHU, Haque ME, Haque MJ. Farmers response towards cultivation of BRRI dhan 47 in the coastal saline area. Int J Sustain Agric Technol. 2012;8(1):13–8. [Google Scholar]
47. Gomez KA, Gomez AA. Statistical procedures for agricultural research. New York, NY, USA: John Wiley & Sons; 1984. [Google Scholar]
48. Gopinath KA, Saha S, Mina BL, Pande H, Kundu S, Gupta HS. Influence of organic amendments on growth, yield and quality of wheat and on soil properties during transition to organic production. Nutr Cycl Agroecosyst. 2008;82(1):51–60. doi:10.1007/s10705-008-9168-0. [Google Scholar] [CrossRef]
49. Hewidy M, Traversa A, Ben Kheder M, Ceglie F, Cocozza C. Short-term effects of different organic amendments on soil properties and organic broccoli growth and yield. Compost Sci Util. 2015;23(3):207–15. doi:10.1080/1065657X.2015.1038400. [Google Scholar] [CrossRef]
50. Agegnehu G, Nelson PN, Bird MI. Crop yield, plant nutrient uptake and soil physicochemical properties under organic soil amendments and nitrogen fertilization on Nitisols. Soil Tillage Res. 2016;160:1–13. doi:10.1016/j.still.2016.02.003. [Google Scholar] [CrossRef]
51. Ojo OF, Ogunwande GA, Adesanwo OO, Olatoberu FT. Effect of effluent from biodigestion of pre-treated rice bran and animal manure on the dry matter yield and nutrient uptake of Amaranthus viridis. Food Nutr Sci. 2021;12(12):1255–68. doi:10.4236/fns.2021.1212092. [Google Scholar] [CrossRef]
52. Al-Tawarah B, Alasasfa MA, Mahadeen AY. Efficacy of compost and vermicompost on growth, yield and nutrients content of common beans crop (Phaseolus vulgaris L.). J Ecol Eng. 2024;25(2):215–26. doi:10.12911/22998993/176862. [Google Scholar] [CrossRef]
53. Gebrehiwot W, Berhe T, Tadele T, Tekulu K, Kahsu G, Mebrahtom S, et al. Evaluation of different level of vermicompost on yield and yield components of wheat at vertisols of L/machew district. Asian Soil Res J. 2020:21–7. doi:10.9734/asrj/2020/v4i230089. [Google Scholar] [CrossRef]
54. Ayeni LS, Adetunji MT. Integrated application of poultry manure and mineral fertilizer on soil chemical properties, nutrient uptake, yield, and growth components of maize. Nat Sci. 2010;8(1):60–7. [Google Scholar]
55. Ravimycin T. Effects of vermicompost (VC) and farmyard manure (FYM) on the germination percentage, growth, biochemical, and nutrient content of coriander (Coriandrum sativum L.). Int J Adv Res Biol Sci. 2016;3(6):91–8. [Google Scholar]
56. Moeinnamini A, Weisany W, Hadi MRHS, Torkashvand AM, Mohammadinejad A. Enhancing photosynthesis pigment, protein content, nutrient uptake and yield in maize (Zea mays L.) cultivars using vermicompost, livestock manure and Azotobacter chroococcum. J Soil Sci Plant Nutr. 2024;24(4):6999–7009. doi:10.1007/s42729-024-02019-x. [Google Scholar] [CrossRef]
57. Singh RK, Bohra JS, Nath T, Singh Y, Singh K. Integrated assessment of diversification of rice-wheat cropping system in Indo-Gangetic plain. Arch Agron Soil Sci. 2011;57(5):489–506. doi:10.1080/03650341003641771. [Google Scholar] [CrossRef]
58. Sarker MAZ, Alam MA, Hossain A, Mannaf MA. Agro-economic performance of crop diversification in rice-based cropping systems of northwest Bangladesh. Agric For Fish. 2014;3(4):264–70. [Google Scholar]
59. Angelova VR, Akova VI, Artinova NS, Ivanov KI. The effect of organic amendments on soil chemical characteristics. Bulg J Agric Sci. 2013;19(5):958–71. [Google Scholar]
60. Soremi AO, Adetunji MT, Adejuyigbe CO, Bodunde JG, Azeez JO. Effects of poultry manure on some soil chemical properties and nutrient bioavailability to soybean. J Agric Ecol Res Int. 2017;11(3):1–10. doi:10.9734/JAERI/2017/32419. [Google Scholar] [CrossRef]
61. Li J, Chen L, Zhang C, Han C, Feng B, Ma D, et al. Organic amendments with low C/N ratios enhanced the deposition of crop root exudates into stable soil organic carbon in a sodic soil. Plant Soil. 2025;8:1–8. [Google Scholar]
62. Menichetti L, Ekblad A, Kätterer T. Contribution of roots and amendments to soil carbon accumulation within the soil profile in a long-term field experiment in Sweden. Agric Ecosyst Environ. 2015;200:79–87. doi:10.1016/j.agee.2014.11.003. [Google Scholar] [CrossRef]
63. Mazzilli SR, Kemanian AR, Ernst OR, Jackson RB, Piñeiro G. Greater humification of belowground than aboveground biomass carbon into particulate soil organic matter in no-till corn and soybean crops. Soil Biol Biochem. 2015;85:22–30. doi:10.1016/j.soilbio.2015.02.014. [Google Scholar] [CrossRef]
64. Arancon NQ, Edwards CA, Bierman P. Influences of vermicomposts on field strawberries: part 2. Effects on soil microbiological and chemical properties. Bioresour Technol. 2006;97(6):831–40. doi:10.1016/j.biortech.2005.04.016. [Google Scholar] [PubMed] [CrossRef]
65. Marinari S, Masciandaro G, Ceccanti B, Grego S. Influence of organic and mineral fertilisers on soil biological and physical properties. Bioresour Technol. 2000;72(1):9–17. doi:10.1016/S0960-8524(99)00094-2. [Google Scholar] [CrossRef]
66. Sharpley AN, Syers JK. Seasonal variation in casting activity and in the amounts and release to solution of phosphorus forms in earthworm casts. Soil Biol Biochem. 1977;9(4):227–31. doi:10.1016/0038-0717(77)90026-8. [Google Scholar] [CrossRef]
67. Germida J, Siciliano J. Microbially mediated processes. In: Sumner ME, editor. Handbook of soil science. Boca Raton, FL, USA: CRC Press; 2000. p. 95–117. [Google Scholar]
68. Olk DC, Cassman KG. Reduction of potassium fixation by organic matter in vermiculitic soils. In: Mulongoy K, Merckx R, editors. Soil organic matter dynamics and sustainability of tropical agriculture. Hoboken, NJ, USA: John Wiley & Sons, Inc.; 1993. p. 307–15. [Google Scholar]
69. Khoshgoftarmanesh AH, Kalbasi M. Effect of municipal waste leachate on soil properties and growth and yield of rice. Commun Soil Sci Plant Anal. 2002;33(13–14):2011–20. doi:10.1081/CSS-120005745. [Google Scholar] [CrossRef]
70. Wander M. Managing manure fertilizers in organic systems. eOrganic. 2019 [cited 2025 Feb 30]. Available from: https://eorganic.org/node/3132. [Google Scholar]
71. Mollah M, Islam N, Sarkar M. Integrated nutrient management for potatomungbean-T. aman rice cropping pattern under level barind agroecological zone. Bangladesh J Agric Res. 2011;36(4):711–22. doi:10.3329/bjar.v36i4.11761. [Google Scholar] [CrossRef]
72. Afrad MSI, Rahman GKMM, Alam MS, Ali MZ, Barau AA. Effects of organic and inorganic fertilizers on growth and yield of different crops at charlands in Bangladesh. Asian J Adv Agric Res. 2021;17(3):27–40. doi:10.9734/ajaar/2021/v17i330198. [Google Scholar] [CrossRef]
73. Varma N, Wadatkar H, Salve R, Kumar TV. Advancing sustainable agriculture: a comprehensive review of organic farming practices and environmental impact. J Exp Agric Int. 2024;46(7):695–703. doi:10.9734/jeai/2024/v46i72623. [Google Scholar] [CrossRef]
Cite This Article
 Copyright © 2025 The Author(s). Published by Tech Science Press.
This work is licensed under a Creative Commons Attribution 4.0 International License , which permits unrestricted use, distribution, and reproduction in any medium, provided the original work is properly cited.
 Downloads
 Citation Tools