
 Submit a Paper
 Propose a Special lssue
 Open Access
ARTICLE

Spatial-Temporal Variations of Nitrogen and Phosphorus Applications and Runoff Losses in Vegetable Field in Southern China during Last Three Decades
1 College of Life Sciences, Anhui Normal University, Wuhu, 241000, China
2 State Key Laboratory of Soil and Sustainable Agriculture, Institute of Soil Science, Chinese Academy of Sciences (CAS), Nanjing, 210008, China
3 Co-Innovation Center for Sustainable Forestry in Southern China, College of Forest and Grassland, Nanjing Forestry University, Nanjing, 210037, China
4 University of Chinese Academy of Sciences, Beijing, 100049, China
* Corresponding Author: Ju Min. Email:
Phyton-International Journal of Experimental Botany 2025, 94(6), 1735-1750. https://doi.org/10.32604/phyton.2025.063868
Received 26 January 2025; Accepted 08 May 2025; Issue published 27 June 2025
 View Full Text
 Download PDF
Abstract
Over the past three decades, the expansion of intensive vegetable farming in southern China has led to excessive nitrogen (N) and phosphorus (P) fertilizer application, causing substantial N and P runoff losses. This study investigated four major vegetable production regions in southern China—the upper reaches of the Yangtze River (U-YR), the middle lower reaches of the Yangtze River (ML-YR), the Southeast Coast (SC), and the Pearl River basin (PR)—analyzing 175 published articles to characterize spatiotemporal patterns of N and P fertilizer applications and associated runoff losses from 1992 to 2021. The result showed that the runoff losses of total N per year (TNy) from the U-YR and PR regions gradually increased by 141%–186% over the past three decades, while that from the other two areas decreased gradually by 17%–28%. Meanwhile, four regions generated gradually increased runoff total P per year (TPy) with 3.5%–221%. In U-YR and PR regions, the cultivated area for vegetable production increased by 68% and 28%, and the N application rates increased by 54% and 25%. Still, the soil organic matter (SOM) content decreased by 17% and 34%, respectively. However, they all showed a decreasing trend in the other two investigated regions. In the PR region, the increased planting area was attributed to newly cultivated vegetable fields, where there were serious TPy losses as the P application intensity increased by 87%. The cultivation area in the ML-YR region has little increased in the past thirty years but with significantly accumulated SOM and soil nutrient contents. In conclusion, the N and P fertilizers application as well as their runoff losses increased in the last three decades in southern China, but with significant variation among the four investigated regions. Sustainable management practices should be implemented to mitigate N and P non-point source pollution in intensive vegetable production systems.Keywords
The growing global population has driven increasing demand for vegetables. Global vegetable cultivation area reached 21.3 million hectares by 2021, with China accounting for 51% of this total [1]. Southern China, characterized by abundant rainfall and favorable temperatures, serves as the primary vegetable production region encompassing the Yangtze River Delta, Pearl River Delta, and southeastern coastal areas, representing 69.5% of China’s total vegetable cultivation area [2,3]. To sustain high vegetable yields, farmers apply substantial quantities of N and P fertilizers. Reported application rates reach 470 kg N ha−¹ yr−¹ and 285 kg P2O5 ha−¹ yr−¹ in intensive production systems [4]. Nevertheless, the corresponding nutrient use efficiencies remain suboptimal, consistently below 25% for N [5] and 30% for P [6]. Southern China received annual precipitation ranging from 1324 to 1656 mm during 2011–2021 [2], promoting significant runoff-mediated transport of residual soil N and P into adjacent aquatic ecosystems.
Quantitative assessments in Colombia’s Fuquene watershed demonstrated significant contributions of N and P runoff from fertilized potato fields to lake eutrophication [7]. Similarly, comparative studies in Croatia revealed vegetable fields generated 52- and 68-fold higher N and P losses, respectively, than grass-covered olive groves under simulated rainfall conditions [8]. The research on N and P loss in vegetable fields began with the problem of excessive input of inorganic fertilizer and accumulation of soil nutrients in China [9,10]. In response to concerns regarding excessive N and P fertilizer use, significant research attention has been directed toward understanding nutrient cycling in agricultural systems and its consequences for environmental health, with particular emphasis on water quality [11–13].
Recent studies in China have further highlighted the severity of environmental pollution associated with N and P pollutants from intensive vegetable fields [14]. For example, open intensive vegetable fields in the Hubei Three Gorges Reservoir area contribute to significant N and P losses, accounting for 56.1% and 57.1% of the local total emissions, respectively [15]. Recent research highlights critical nutrient management challenges in agricultural systems, particularly regarding vegetable production. Cucumber cultivation demonstrates seasonal P surpluses reaching 410 kg ha−¹, substantially elevating risks of P loss and aquatic eutrophication [16]. Concurrently, soil N cycling has been quantitatively linked to water quality degradation [14], with systematic assessments establishing region-specific N and P runoff coefficients in Chinese vegetable production systems [17]. In ecologically sensitive areas such as the Three Gorges Reservoir and Yangtze River’s mid-lower reaches, agricultural fertilizers and livestock operations emerge as dominant pollution sources [18]. Additionally, with vegetable cultivation in the Tiaoxi watershed exhibiting particularly high P loss potential due to intensive farming practices [19]. Compared with southern China, northern China has less rainfall and less runoff, leaching was therefore the main N and P lost path. Current research has systematically characterized the spatial-temporal patterns of N and P leaching in northern China’s major agricultural regions over the past five years, while similar comprehensive analyses remain notably lacking for southern China’s agricultural systems [20]. Previous studies have systematically quantified field-scale discharge coefficients and load amounts of N and P in vegetable cultivation systems, while identifying key factors influencing non-point source pollution. However, the impacts of agricultural management practices on N and P losses from vegetable fields remain poorly understood in southern China, particularly regarding their spatiotemporal patterns and underlying drivers.
Southern China, a global hub of population and industrial activity, exhibits substantial demand for vegetable production. Intensive vegetable cultivation practices in southern China highlight its significance as a primary vegetable production region. The cultivation area is expanding annually, predominantly through conversion of stable cereal fields. Annual fertilizer inputs for intensive vegetable production exceed cereal fields by 2–7 times, yet N and P utilization rates remain below 50%, resulting in substantial soil nutrient accumulation and elevated loss risks [21]. Meanwhile, recent advances in vegetable cultivation and fertilizer management technologies have been implemented to mitigate N and P losses. However, the effects of these agricultural management practices on N and P losses from vegetable fields in southern China remain unclear, particularly regarding their spatiotemporal patterns and underlying mechanisms. Comprehensive research on non-point source pollution from these systems is crucial, as it would provide scientific basis for accurate pollution load assessment and inform effective prevention and control strategies.
Therefore, considering the distribution of seven major river basins and deltas in China and the geographical positioning of that in southern provinces, this study focused on the following four areas: the upper (U-YR), the middle and lower reaches of the Yangtze River (ML-YR), the Southeast Coast (SC) and the Pearl River basin (PR). The N and P runoff loads in these four areas during past 30 years were estimated. We estimated N and P runoff loads in these regions over the past three decades (1992–2021) through systematic analysis of 175 published studies encompassing 13 provinces and 2 municipalities in southern China, supplemented by contemporaneous agricultural and environmental statistics. The study objectives were to: 1) to estimate N and P runoff loads in four major vegetable cultivation regions in southern China from last three decades (1992–2021); 2) to analyze the temporal and spatial characteristics of N and P fertilizer application and their runoff loss; and 3) to explore the possible mechanisms to explain the changes in N and P runoff.
Based on the distribution of major river basins and deltas in southern China, this study focuses on four representative regions: 1) the upper reaches of the Yangtze River (U-YR), including Yunnan, Sichuan, Guizhou provinces, and Chongqing city; 2) the middle and lower reaches of the Yangtze River (ML-YR), including of Hubei, Hunan, Anhui, Jiangxi, Jiangsu provinces, and Shanghai city; 3) the Southeast Coast (SC), including Zhejiang and Fujian provinces; 4) the Pearl River basin (PR), including Guangdong, Guangxi, and Hainan provinces. This study evaluates the N and P runoff load from vegetable fields by analyzing three key data components: vegetable cultivation area, N and P input via chemical fertilizers, and soil nutrients content. To support this assessment, based on the key words “vegetable field fertilization, soil nutrient, nitrogen and phosphorus loss”, we gathered 175 publications from the China Knowledge Resources Integration (CNKI) database, Web of Science, and PubMed, alongside area statistics from the National Bureau of Statistics of China [2]. This study utilizes a comprehensive dataset (1992–2021) spanning 13 provinces and 2 municipalities in southern China, encompassing three major watersheds and key vegetable production regions: the Yangtze River basin, Pearl River basin, and eastern coastal areas of the Pacific Ocean.
To enhance the precision of the data, when collecting the publications, this study established the following criteria: 1) the studies utilized N and P input data based on the standard fertilizer application practices according to local farmers. For input rate calculations, various fertilizer types—particularly compound fertilizers, urea, superphosphate, and similar formulations—were systematically converted to standardized N and P2O5 units based on their respective chemical compositions; 2) the data for fertilizer application and nutrient content represent values for a whole vegetable growing season; 3) to more accurately assess variations in runoff N and P loads across each watershed, this study categorized them into four distinct regions; 4) consequently, this study selects the last three decades encompassing these census years between 1992–2021 as the statistical timeframe. Therefore, our analysis primarily spans three periods of 1992–2001, 2002–2011, and 2012–2021, and across four regions of U-YR, ML-YR, SC, and PR, respectively.
We calculated the regional N and P runoff loadings according to the investigated vegetable cultivation area, N and P fertilizer application rates and N and P runoff loss factors. The amount of runoff loadings of total N and P per year/annually (TNy and TPy, Tg yr–1) were calculated according to the following formula:
Regional TNy/TPy runoff loading (Tg N/P yr−1 regional area−1)
= N/P fertilizer inputs per season (kg N/P hm–2) × regional plant area (kha) × N/P loss runoff loss ratio × multiple crop index × 10−8
In this research, TNy/TPy represents the annual total N/P runoff loss, the Tg (million tons) is 106 t. The N and P loss factors were set at 6.27% and 4.08%, respectively according to a review of Wang et al. [17]. The multiple crop index was assigned a value of 2.0, reflecting the average for each region [2]. Data on the vegetable sown area were sourced from the China Statistical Yearbook [2].
The equation for computing the runoff load per unit area is as follows:
TNy/TPy runoff loading (kg N/P ha–1 yr–1 regional area–1)
= Regional TNy/TPy runoff loading (Tg N/P yr–1 regional area–1)/regional plant area (kha)
3.1 Temporal and Spatial Changes in Vegetable Cultivation Areas
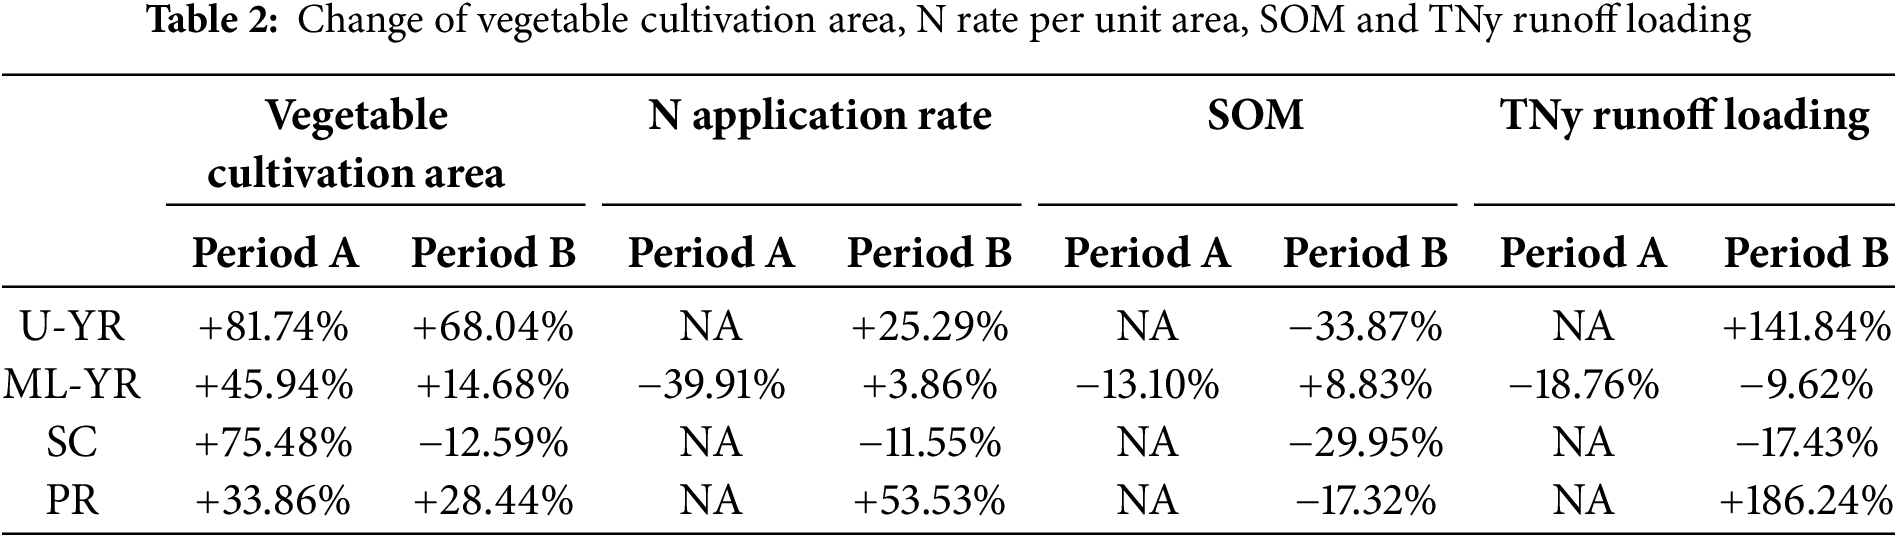
The average vegetable cultivation areas at U-YR, ML-YR, SC, and PR regions were 1.37, 2.72, 0.75, and 1.63 million ha during 1992–2001, and expanded to 2.50, 3.97, 1.31, and 2.18 million ha during 2002–2011, with 81.7%, 45.9%, 75.5%, and 33.9% increases, respectively (Fig. 1). By 2011, the cultivation areas in U-YR, ML-YR, SC and PR regions accounted for 25.1%, 39.9%, 13.2% and 21.9% of the vegetable cultivation area in the southern China, respectively. During 2012–2021, vegetable cultivation areas in the U-YR, ML-YR, and PR regions expanded to 4.20, 5.16, and 2.80 million ha, respectively, representing increases of 68.0%, 14.7%, and 28.4% compared with 2002–2011. However, the vegetable cultivation area in SC region decreased from 1.31 to 1.16 million ha, a decrease of 12.6%. By 2021, vegetable cultivation occupied 31.5%, 38.7%, 8.7%, and 21.0% of arable lands in southern China’s U-YR, ML-YR, SC, and PR regions, respectively. Vegetable cultivation areas in the U-YR and PR regions showed significant expansion during 2012–2021 compared to 2002–2011, with growth rates 2–5 times higher than other study regions. Notably, Sichuan (belonging to U-YR) and Guangxi (belonging to PR) exhibited the most pronounced increases at 21.7% and 48.9%, respectively.
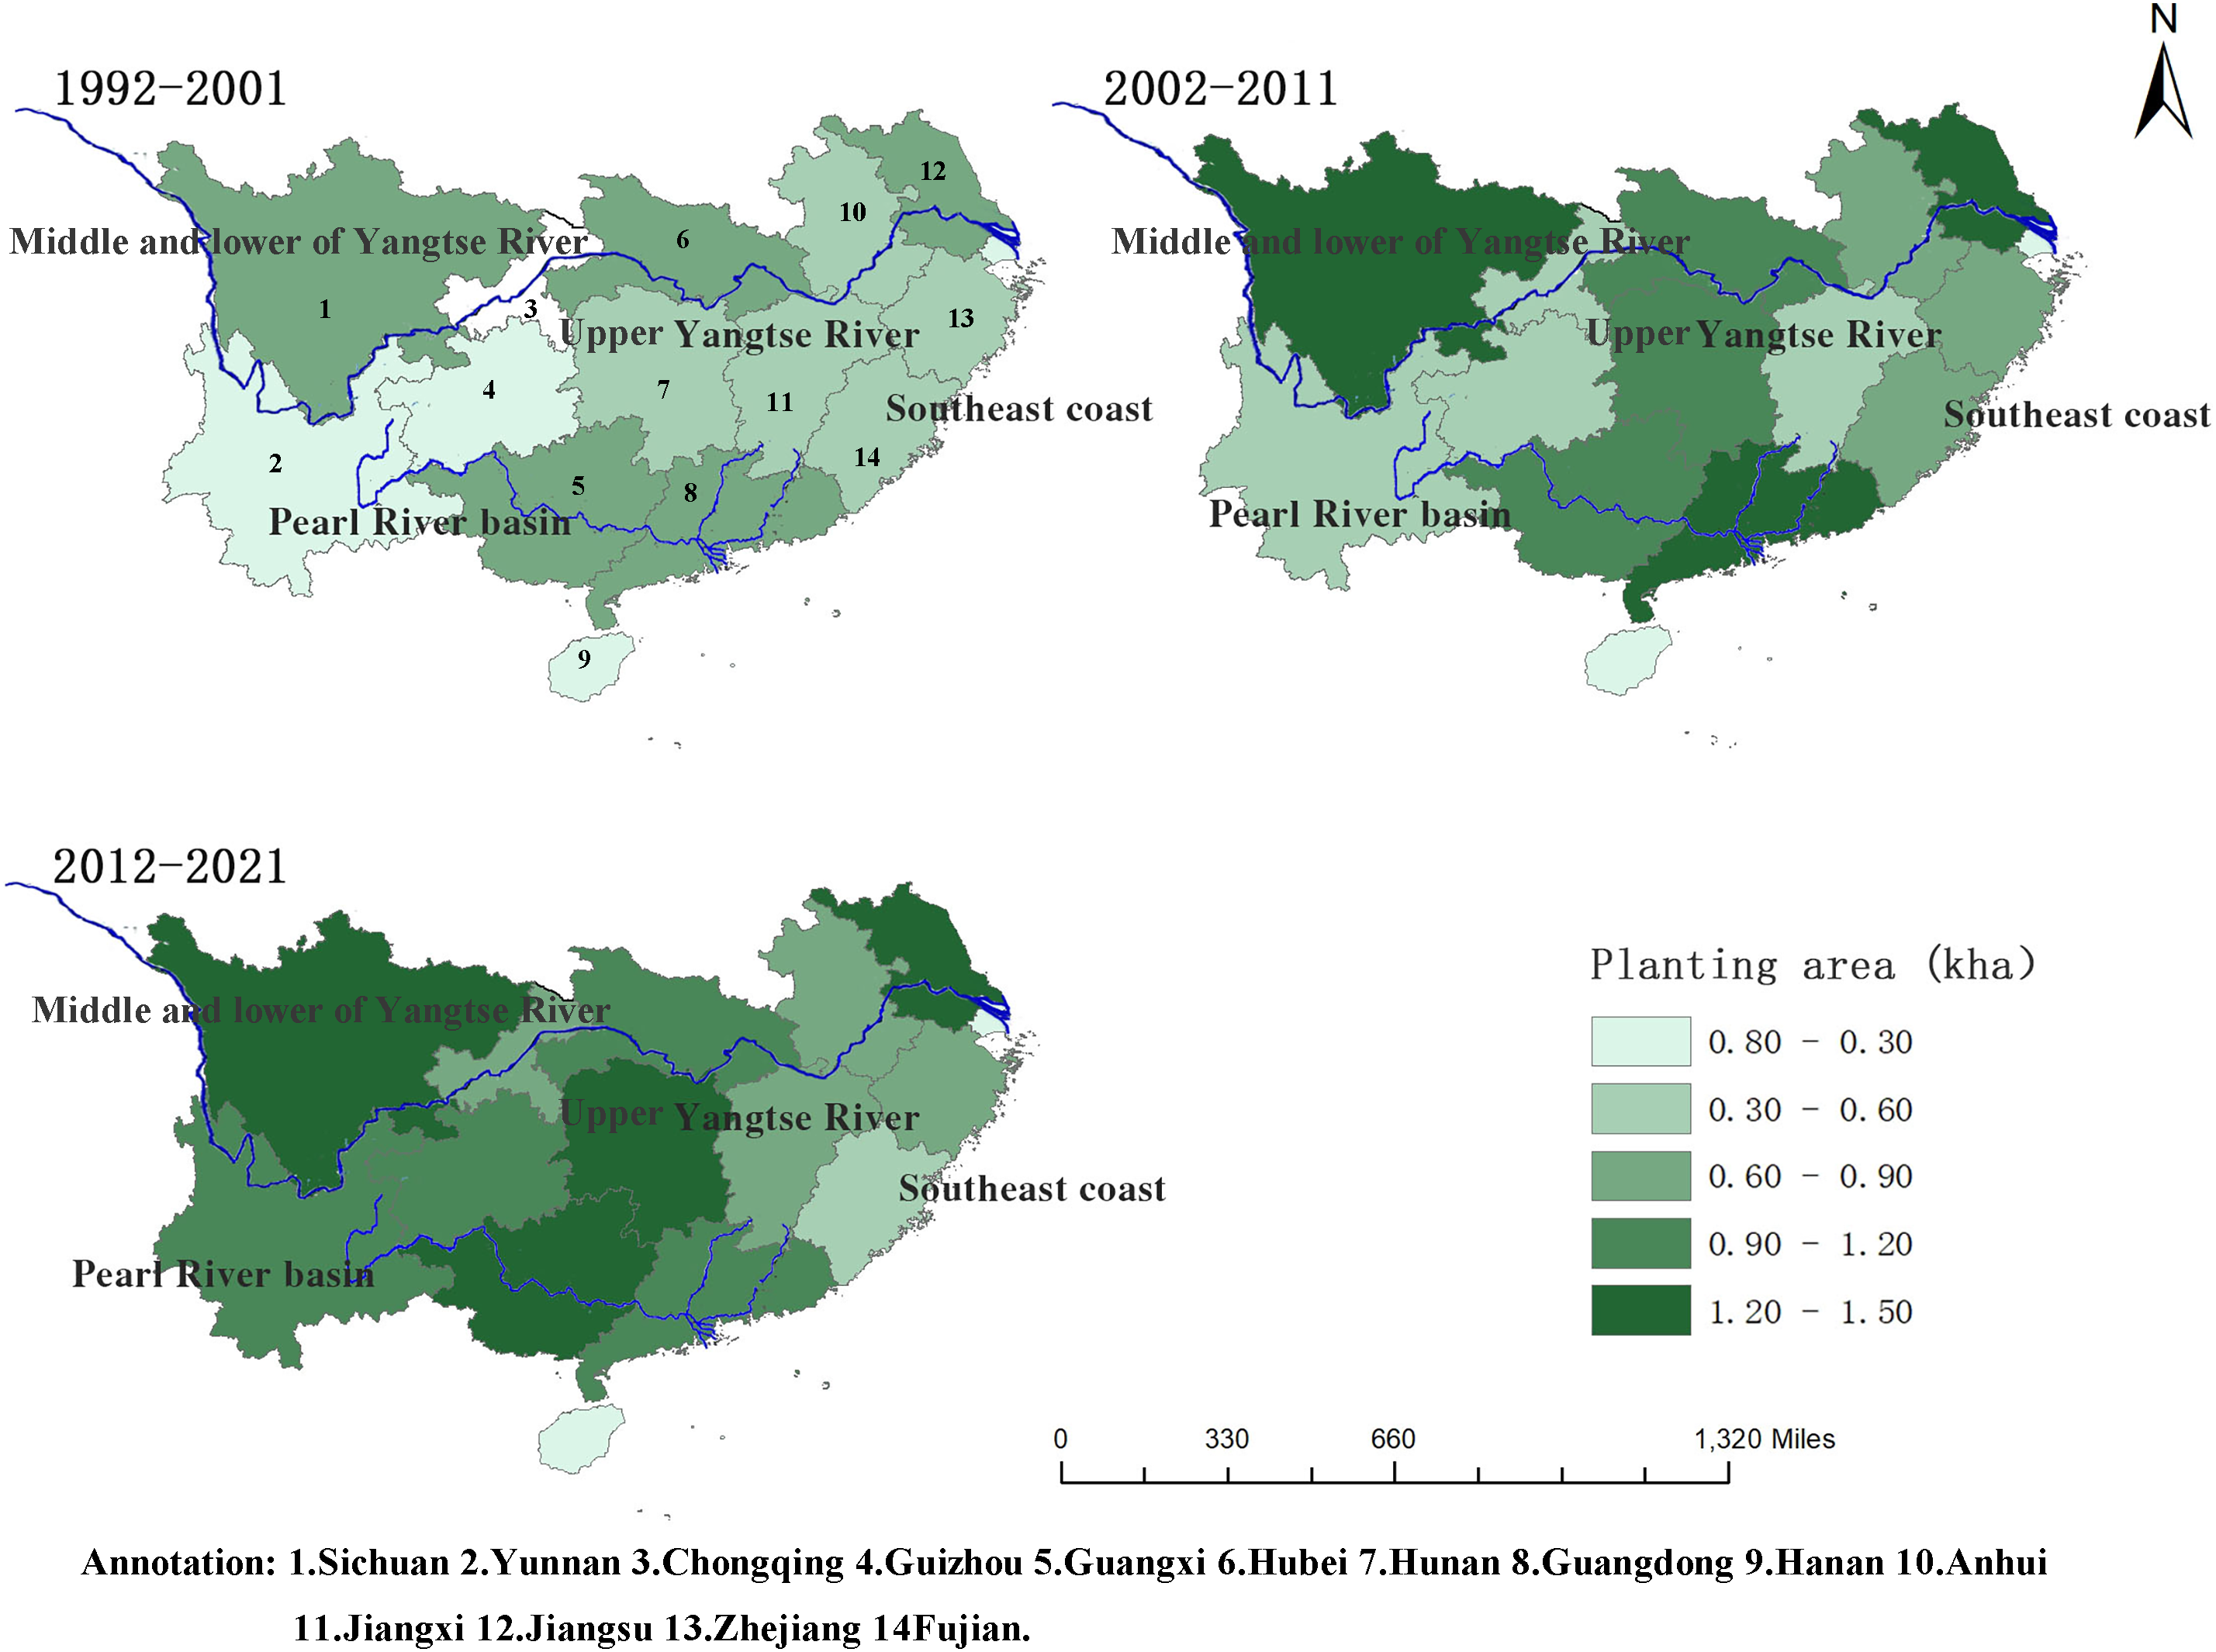
Figure 1: Temporal and spatial changes in vegetable cultivation area in southern China during last three decades, i.e., 1992–2001, 2002–2011, and 2012–2021. Note: U-YR region includes Yunnan, Sichuan, Guizhou, and Chongqing; ML-YR region includes Hubei, Hunan, Anhui, Jiangxi, Jiangsu, and Shanghai; SC region includes Zhejiang and Fujian; PR region includes Guangdong, Guangxi, and Hainan. Same below. The dataset was derived from vegetable cultivation area statistics for 1996, 2006, and 2016, representing decadal averages for 1992–2001, 2002–2011, and 2012–2021, respectively
3.2 Changes in Application Rates of N and P Fertilizers
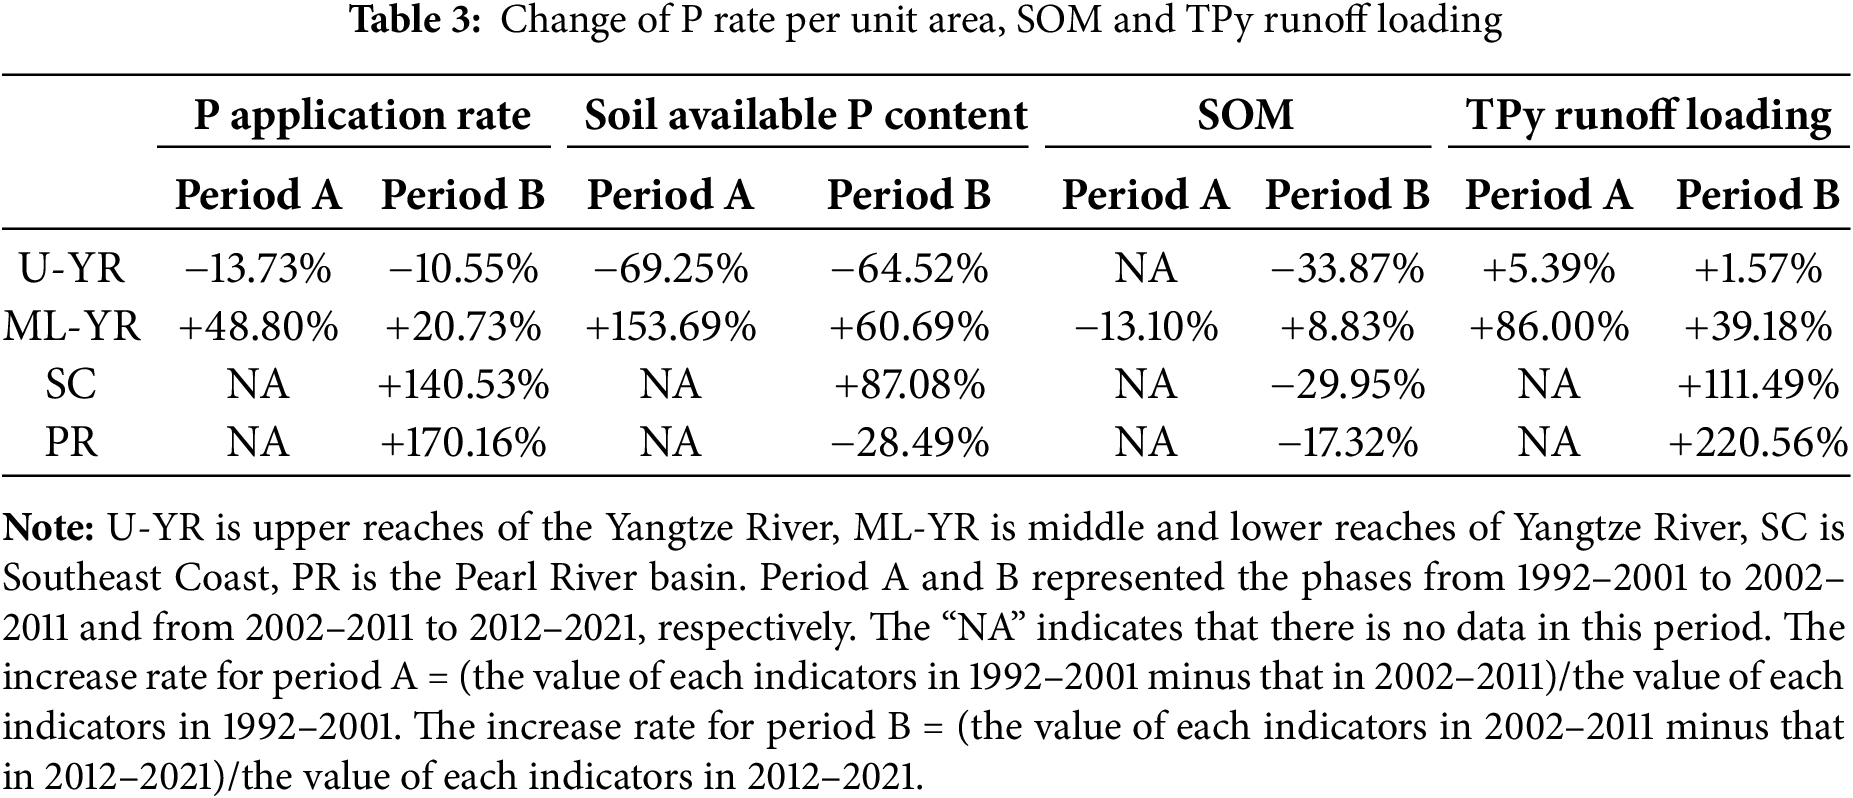
During the period of 2002 to 2021, the average application rates of N and P fertilizer per year in southern China for vegetable production were 333.0 kg N ha–1 and 217.0 kg P2O5 ha–1, respectively (Fig. 2). From 2002 to 2022, N and P fertilizer application rates increased by an average of 12.1% and 56.8%, respectively. Notably, the U-YR and PR regions exhibited the most substantial increases in N application, reaching average rates of 318.3 and 312.7 kg N ha−¹, respectively. Farmers in the U-YR and PR regions increased N and P fertilizer application by 25.3% and 53.5% respectively during 2012–2021 compared to 2002–2011. However, fertilizer N application rate in the ML-YR and SC regions exhibited a gradual decline over the same period, which decreased to 376.4 and 410.5 kg N ha–1, respectively. Notably, the ML-YR region showed a 40% reduction in N application rates for vegetable production from 1992–2001 to 2002–2011, with only a marginal (<4%) increase observed in 2012–2021. At the same time, there was a 11.6% decrease in N fertilizer application at SC region from 2002–2011 to 2012–2021 (Fig. 2). The average application rate P fertilizer in the U-YR and PR regions during 2002–2021 were 249.7 and 235.0 kg P2O5 ha–1, respectively. During 2012–2021, these values decreased by 11% but increased by 170% respectively compared to the previous decade (2002–2011). In the ML-YR and SC regions, P application rates increased gradually to average values of 171.6 and 217.7 kg P2O5 ha−¹, respectively, representing 21% and 141% increases during 2012–2021 relative to 2002–2011 (Fig. 2).
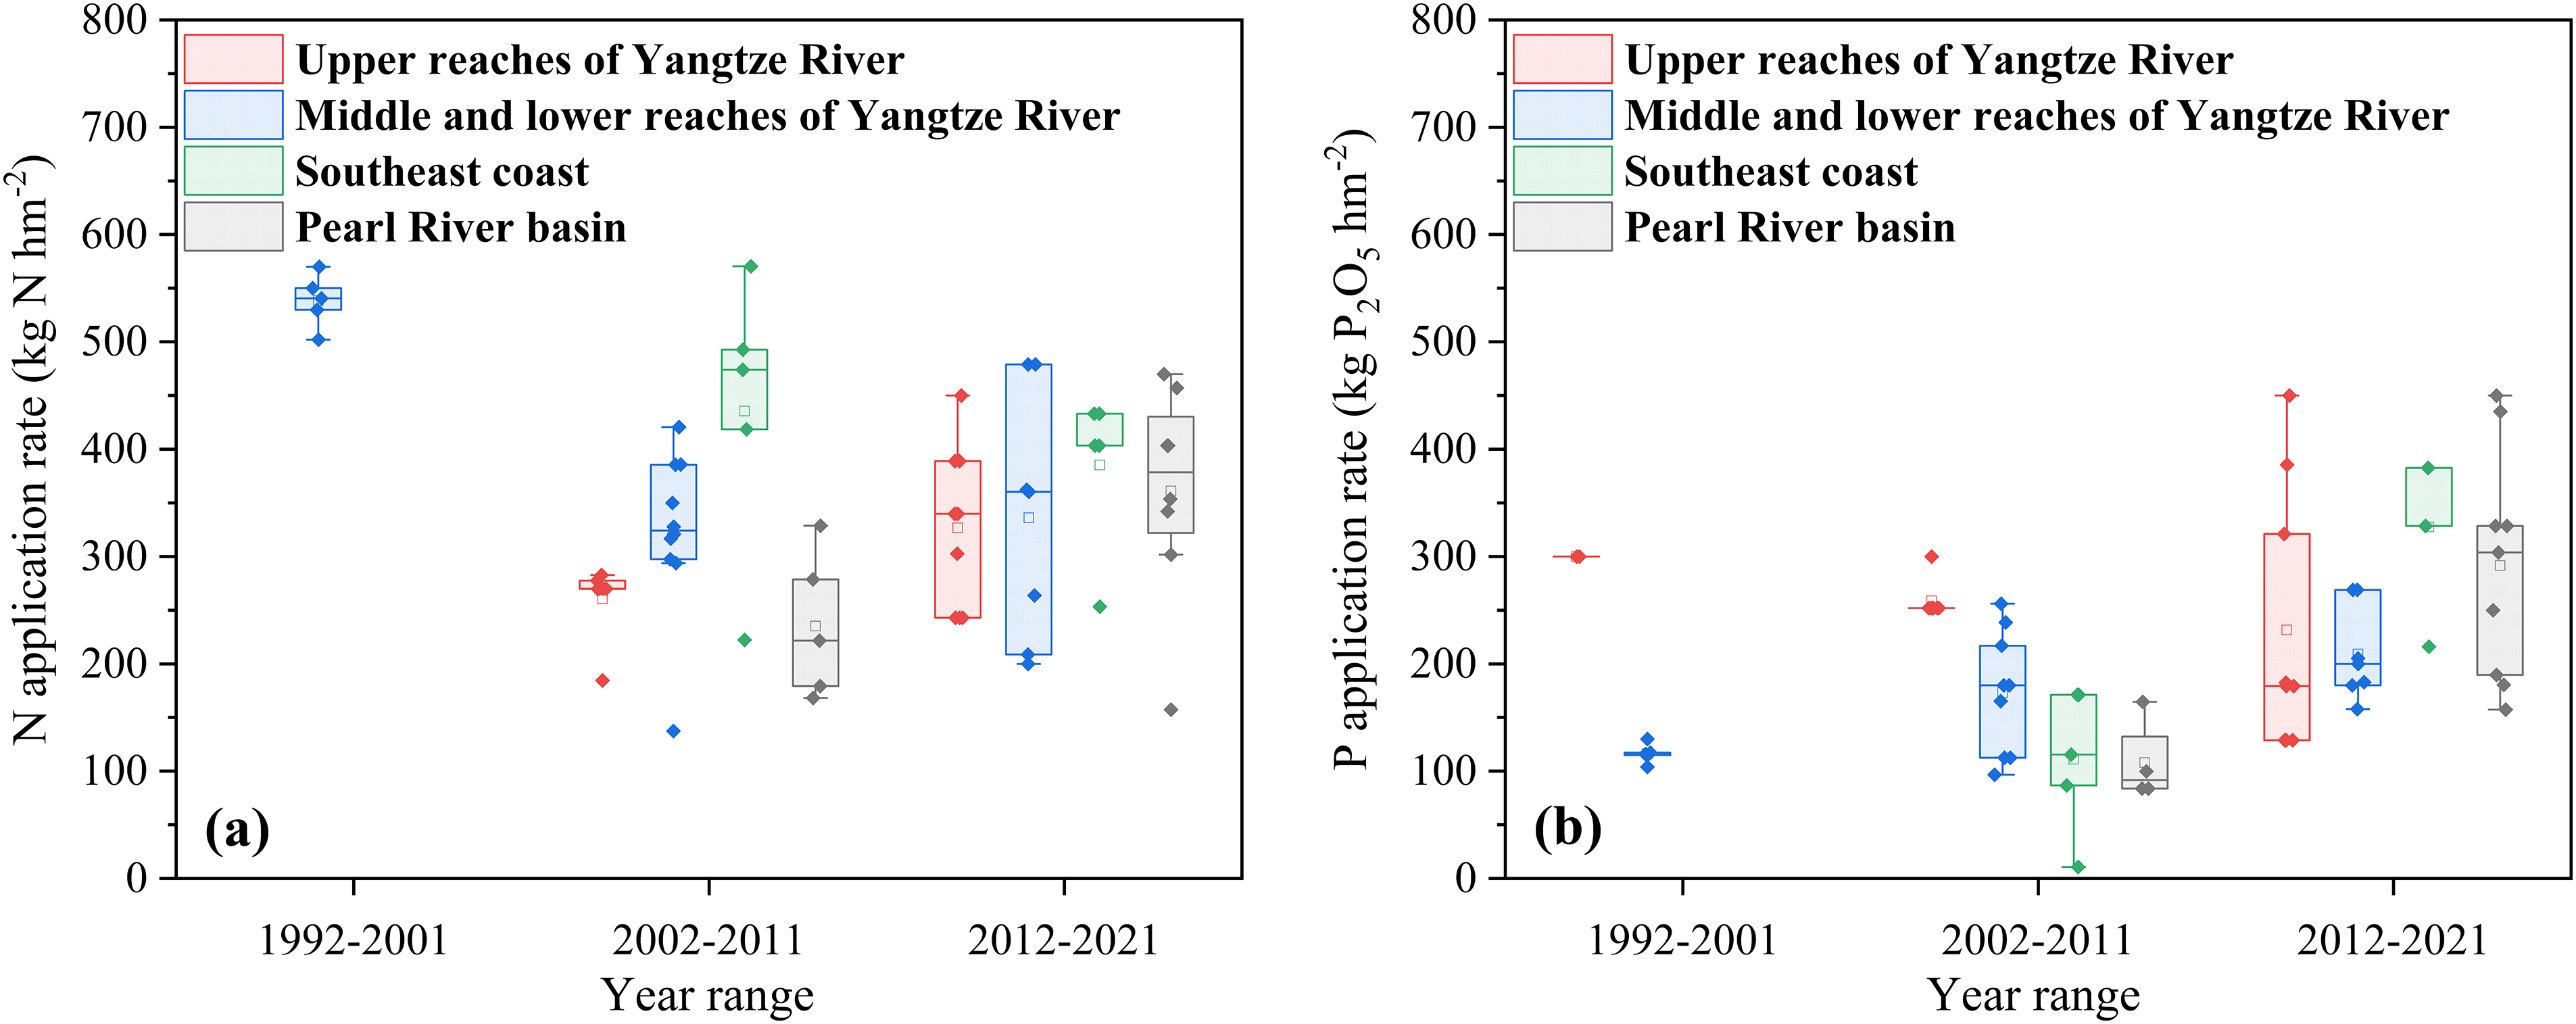
Figure 2: (a,b) Temporal and spatial changes in application rates of N and P fertilizers during last three decades, i.e., 1992–2001, 2002–2011, and 2012–2021, respectively. Upper reaches of Yangtze River, middle and lower reaches of Yangtze River, Southeast Coast and Pearl River basin are denoted as U-YR, ML-YR, SC and PR, respectively
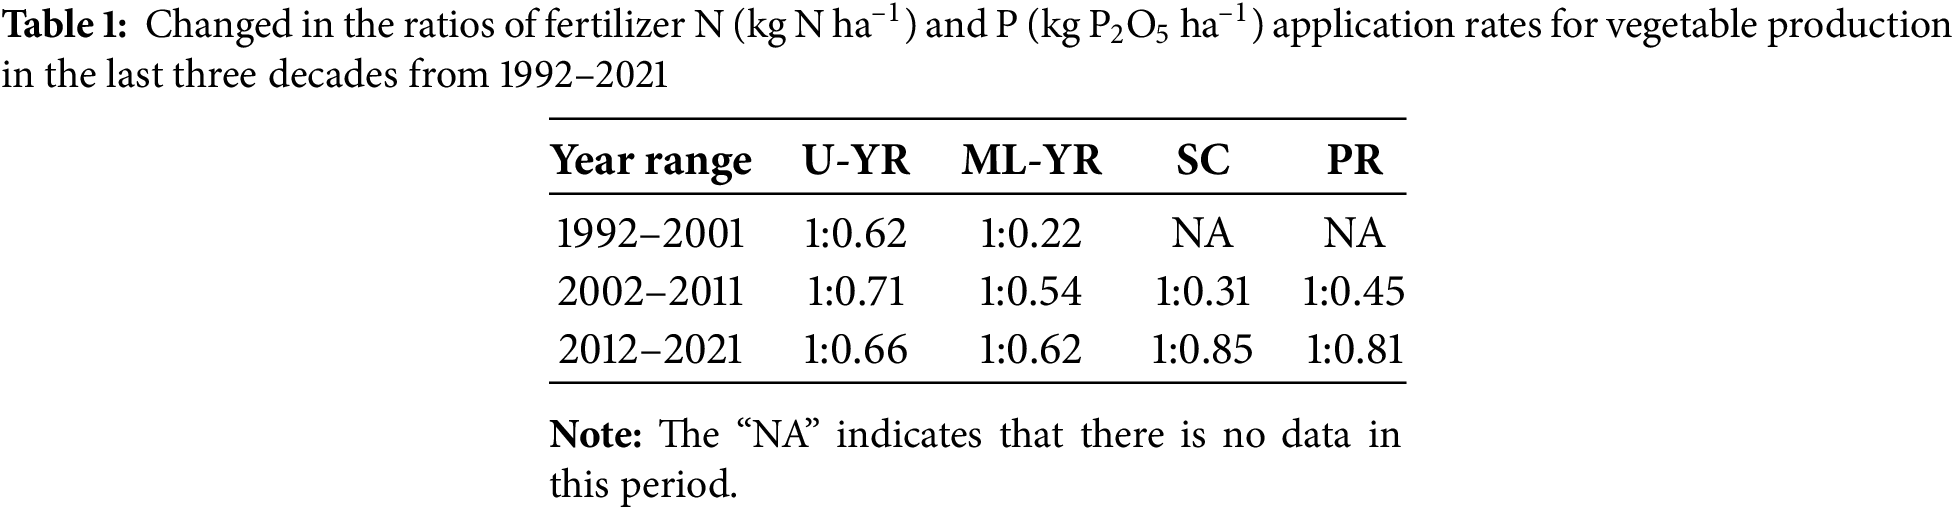
Furthermore, excluding the YR region, the other two major vegetable production areas in southern China showed significant declines in N:P fertilizer input ratios over the past two decades (Table 1). Especially, the U-YR and ML-YR experienced minimal changes from 1992 to 2021 with 1:0.62–1:0.71, while PR and SC had notable increases in the P fertilizer input ratio during 2002–2021, from 1:0.45 to 1:0.81. The observed changes demonstrate a growing emphasis on P fertilizer use in vegetable cultivation among farmers from the SC and PR regions during the 2002–2021 period.
3.3 Runoff Loads of N and P from Vegetable Plantations in Southern China
In the past 30 years, there was an increasing trend in TNy runoff observed in the U-YR and PR regions, but a decreasing trend in the ML-YR and SC regions (Fig. 3). Specifically, TNy runoff loads in the U-YR and PR regions during 2012–2021 were 142% and 186% higher, respectively, than during 2002–2011. Furthermore, compared with the previous 10 years, there was only 12% higher runoff N lost from the U-YR region during 2002–2011. The ML-YR and SC regions exhibited smaller fluctuations in TNy runoff load, decreasing by 10% and 17%, respectively, during 2012–2021 compared to 2002–2011. However, it is worth noting that due to the large cultivation area of these two regions, the TNy runoff load was still at a relatively high level, with an average of about 0.20 (0.01–0.40) Tg N regional area–1 yr–1, which was 0.5–2.3 times higher than other two regions in southern China (Fig. 3).
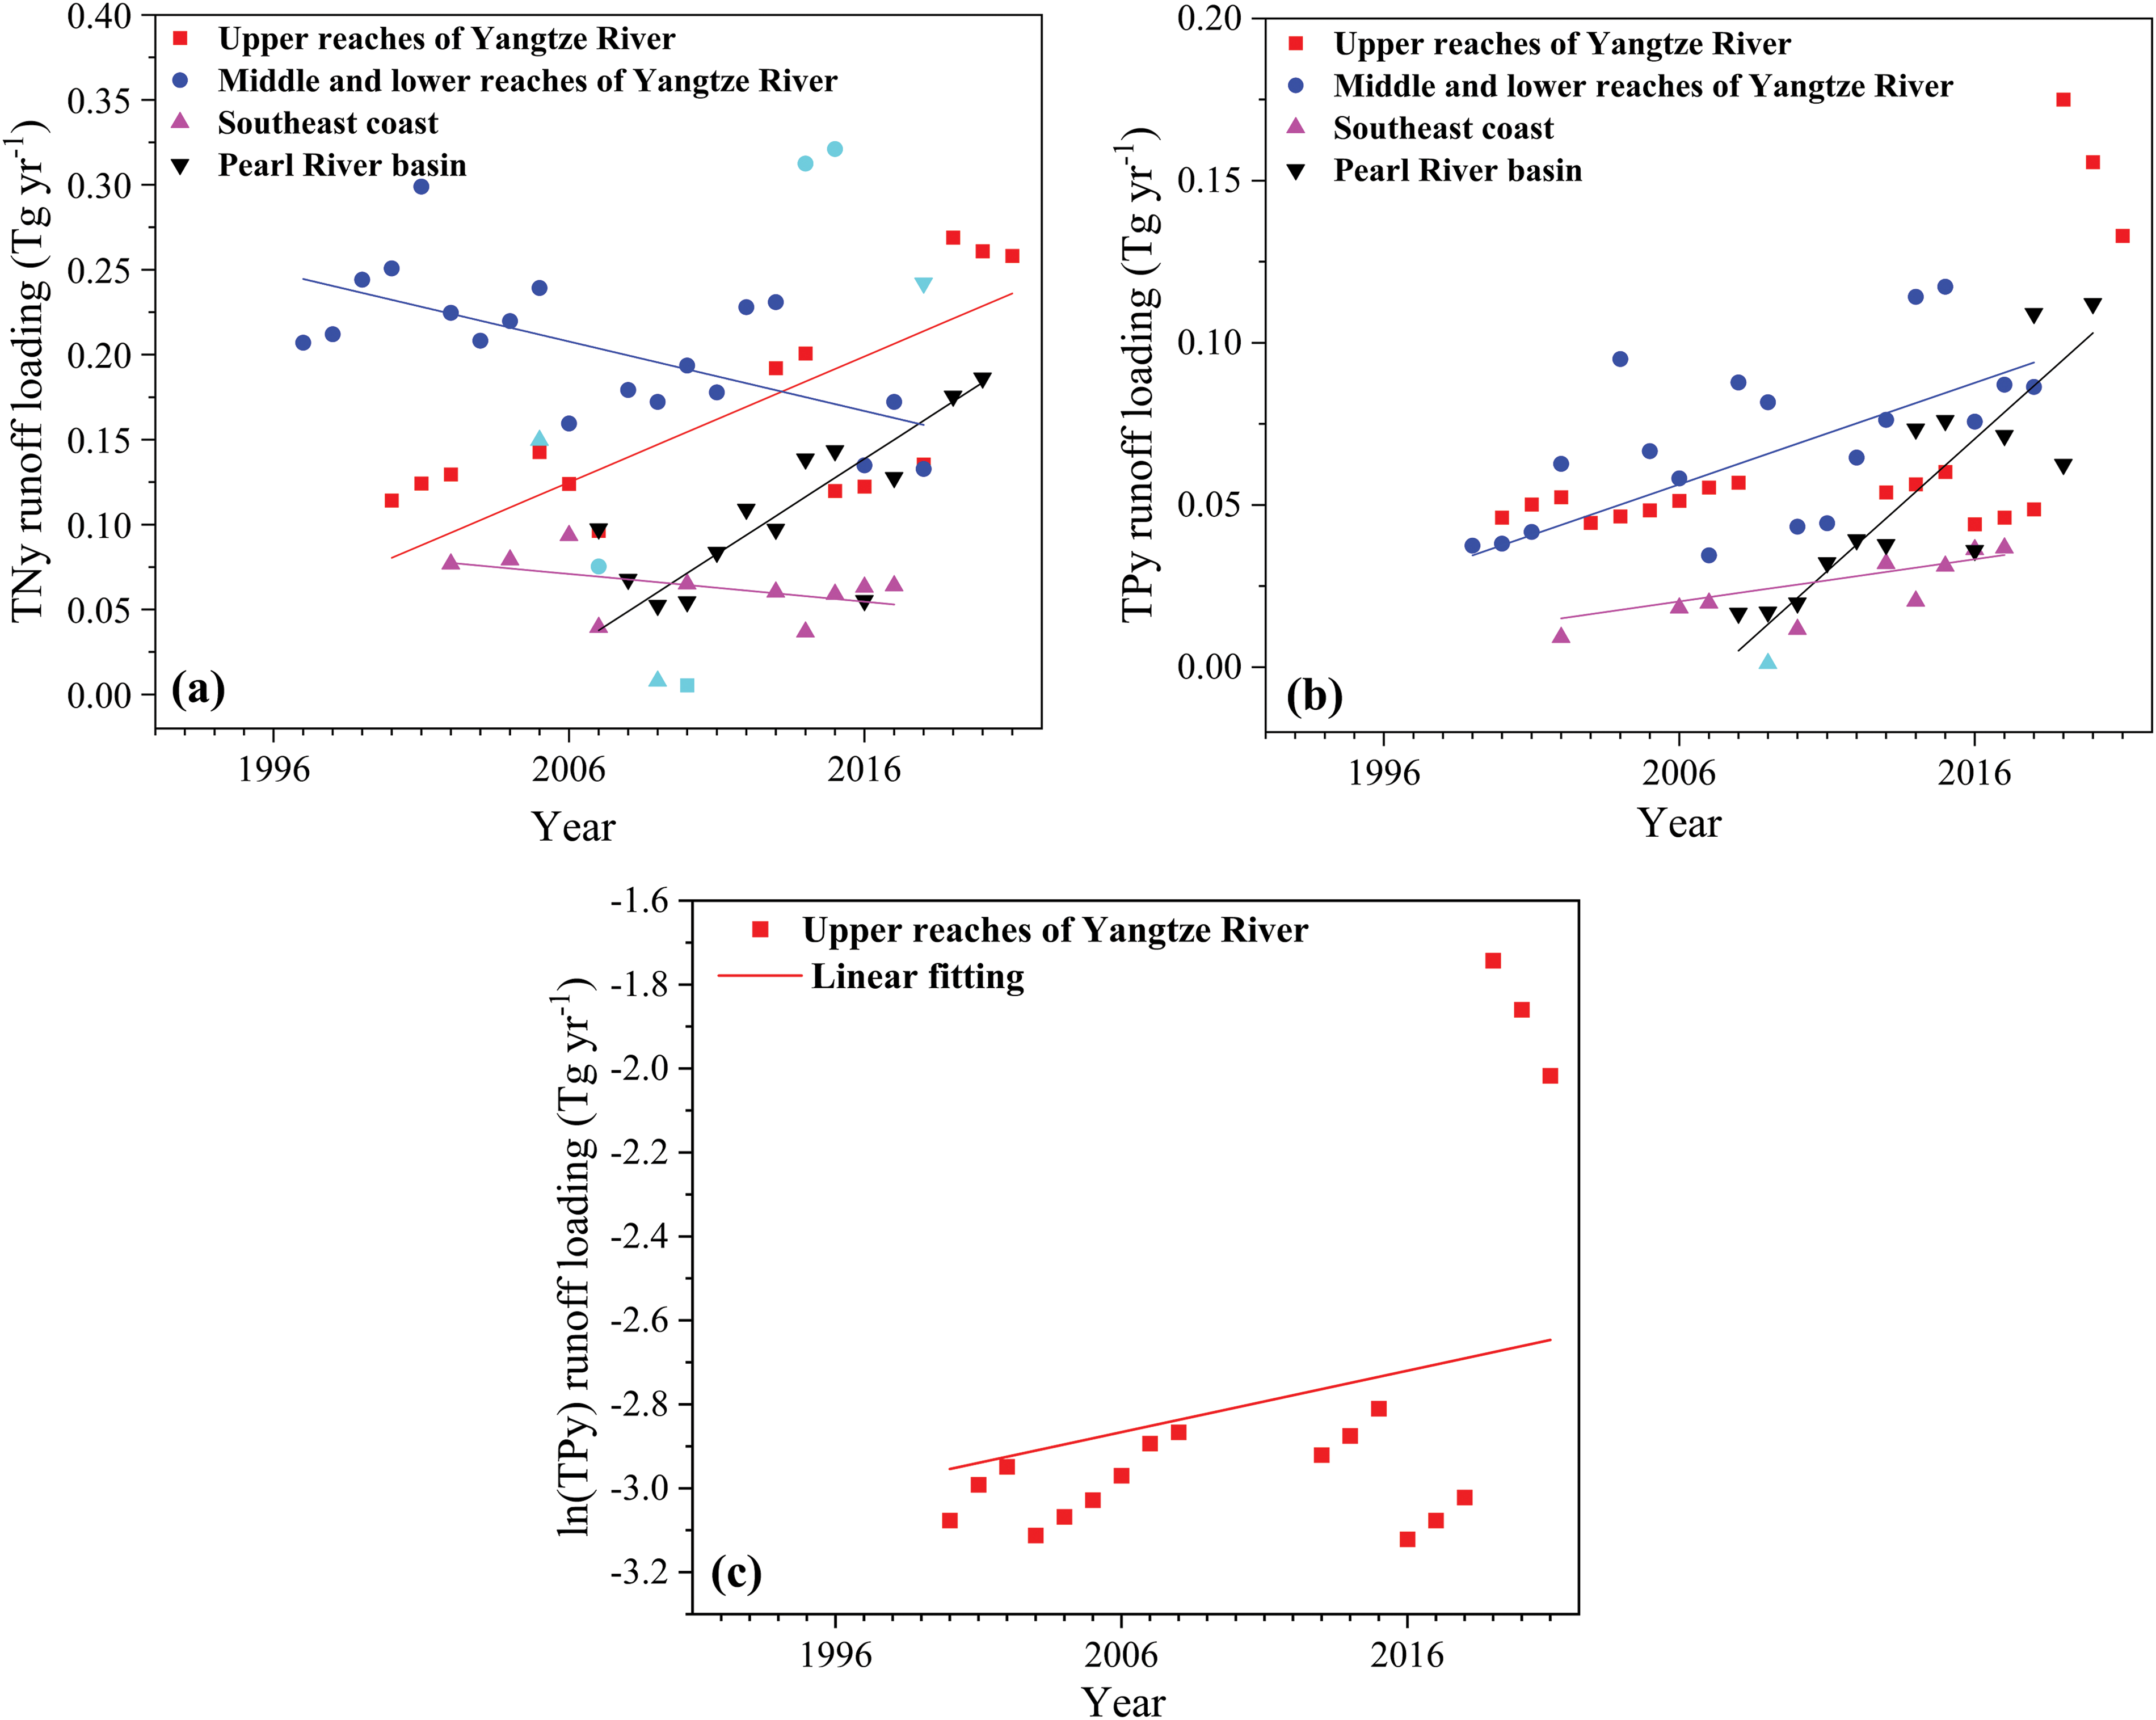
Figure 3: (a–c) Estimation and spatial-temporal variation of N and P runoff loading during last three decades that from 1992 to 2021. All trends adopt the method of linear fitting. Upper reaches of Yangtze River, middle and lower reaches of Yangtze River, Southeast Coast and Pearl River basin are denoted as U-YR, ML-YR, SC and PR, respectively. Note: The linear fitting of TNy runoff load have significant correlation with the experimental data. The equations are y = 0.913x – 1822.752 (R² = 0.49, p < 0.05, U-YR), y = −0.409x + 841.276 (R² = 0.30, p < 0.05, ML-YR), y = −0.015x – 27.629 (R² = 0.24, p < 0.05, SC), and y = 0.813x – 1626.673 (R² = 0.56, p < 0.05, PR) respectively in Fig. 3a. The linear fitting of TPy runoff load has a certain correlation with the experimental data. The equations are y = 0.015x – 32.234 (R² = 0.24, p < 0.05, U-YR), y = 0.287x – 569.722 (R² = 0.48, p < 0.05, ML-YR), y = 0.171x – 340.647 (R² = 0.72, p < 0.05, SC), and y = 0.718x – 1440.356 (R² = 0.73, p < 0.05, PR) respectively in Fig. 3b. In Fig. 3c, the vertical coordinate represents the logarithm of TPy, and a negative value indicates a smaller value. The original value of U-YR refers to the figure (shown in b). The TPy trend of U-YR is shown in Fig. 3c
In the past 30 years, there was increasing TPy runoff loads from the four investigated regions in southern China, among which the ML-YR and PR regions increased more significantly (Fig. 3). Compared to the 2002–2011 period, total phosphorus (TP) runoff loads in the U-YR, ML-YR, and PR regions during 2012–2021 increased to 0.086 (range: 0–0.173), 0.089 (0–0.179), and 0.067 (0–0.135) Tg P region−¹ yr−¹, representing increases of 1.6%, 39%, and 221%, respectively. Although showing a higher increase rate, the SC region maintained relatively low P runoff load, averaging 0.023 (0–0.046) Tg P regional area–1 yr–1 during 2002–2021, which approximately 2.4 times lower than the other three study regions in southern China.
Furthermore, all regions except PR exhibited consistent trends between unit-area runoff loads and regional N and P runoff loads (Fig. 4). The estimated N runoff load per unit area in the SC region was the highest, with 54.6 and 48.3 kg N ha–1 yr–1 during 2002–2011 and 2012–2021, respectively, which were 10.3%–38.2% higher on average than those in the other three regions during the same period. The P runoff load per unit area in the SC and PR regions was higher, reaching 25.9 kg P ha–1 yr–1 totally during 2012–2021, which gradually exceeds the Yangtze River delta (U-YR and ML-YR), with only 20.4 kg P ha–1 yr–1 totally (an increase of 27%).
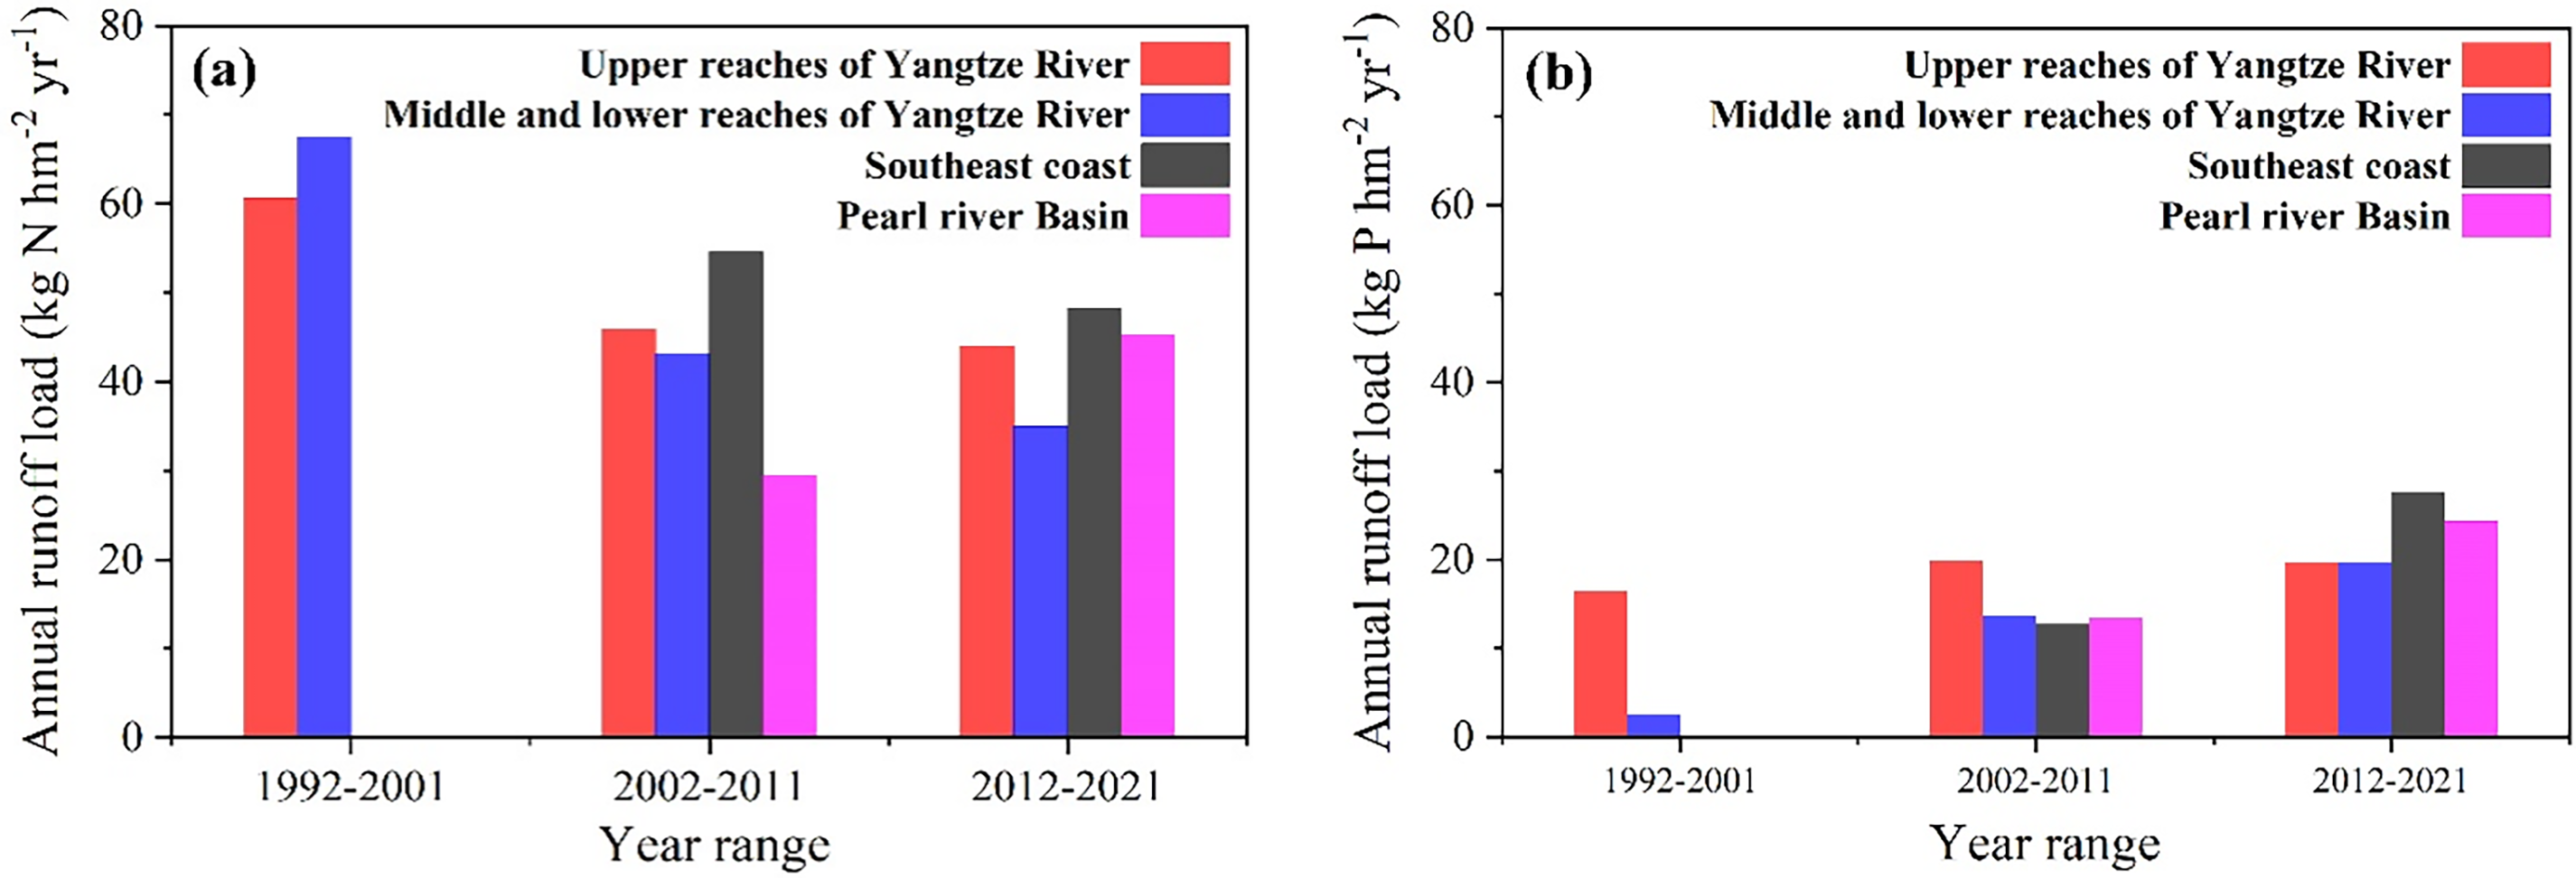
Figure 4: (a,b) Temporal and spatial changes of annual N and P runoff loading per unit area of vegetable production in southern China during last three decades (1992–2001, 2002–2011, and 2012–2021). Upper reaches of Yangtze River, middle and lower reaches of Yangtze River, Southeast Coast and Pearl River basin are denoted as U-YR, ML-YR, SC and PR, respectively
3.4 Temporal and Spatial Changes of Soil Nutrient Content
Residual soil N and P nutrients can directly or indirectly influence N and P runoff losses from both conventional farmland and vegetable production systems. Compared to the period of 2002–2011, the SOM contents measured in 2012–2021 decreased by 34%, 30%, and 17%, in the U-YR, SC, and PR, respectively, but increased by 8.8% in the ML-YR. Regional soil available N content changes from 2002–2011 to 2012–2021 were recorded as follows: SC (+68.6%), PR (+31.4%), ML-YR (+4.0%), and U-YR (–15.4%). Compared with the 2002–2011 period, available P contents in vegetable soils during 2012–2021 increased substantially by 87.1% and 60.7% in the SC and ML-YR regions, respectively, while decreasing by 28.5% and 64.5% in the PR and U-YR regions (Fig. 5).
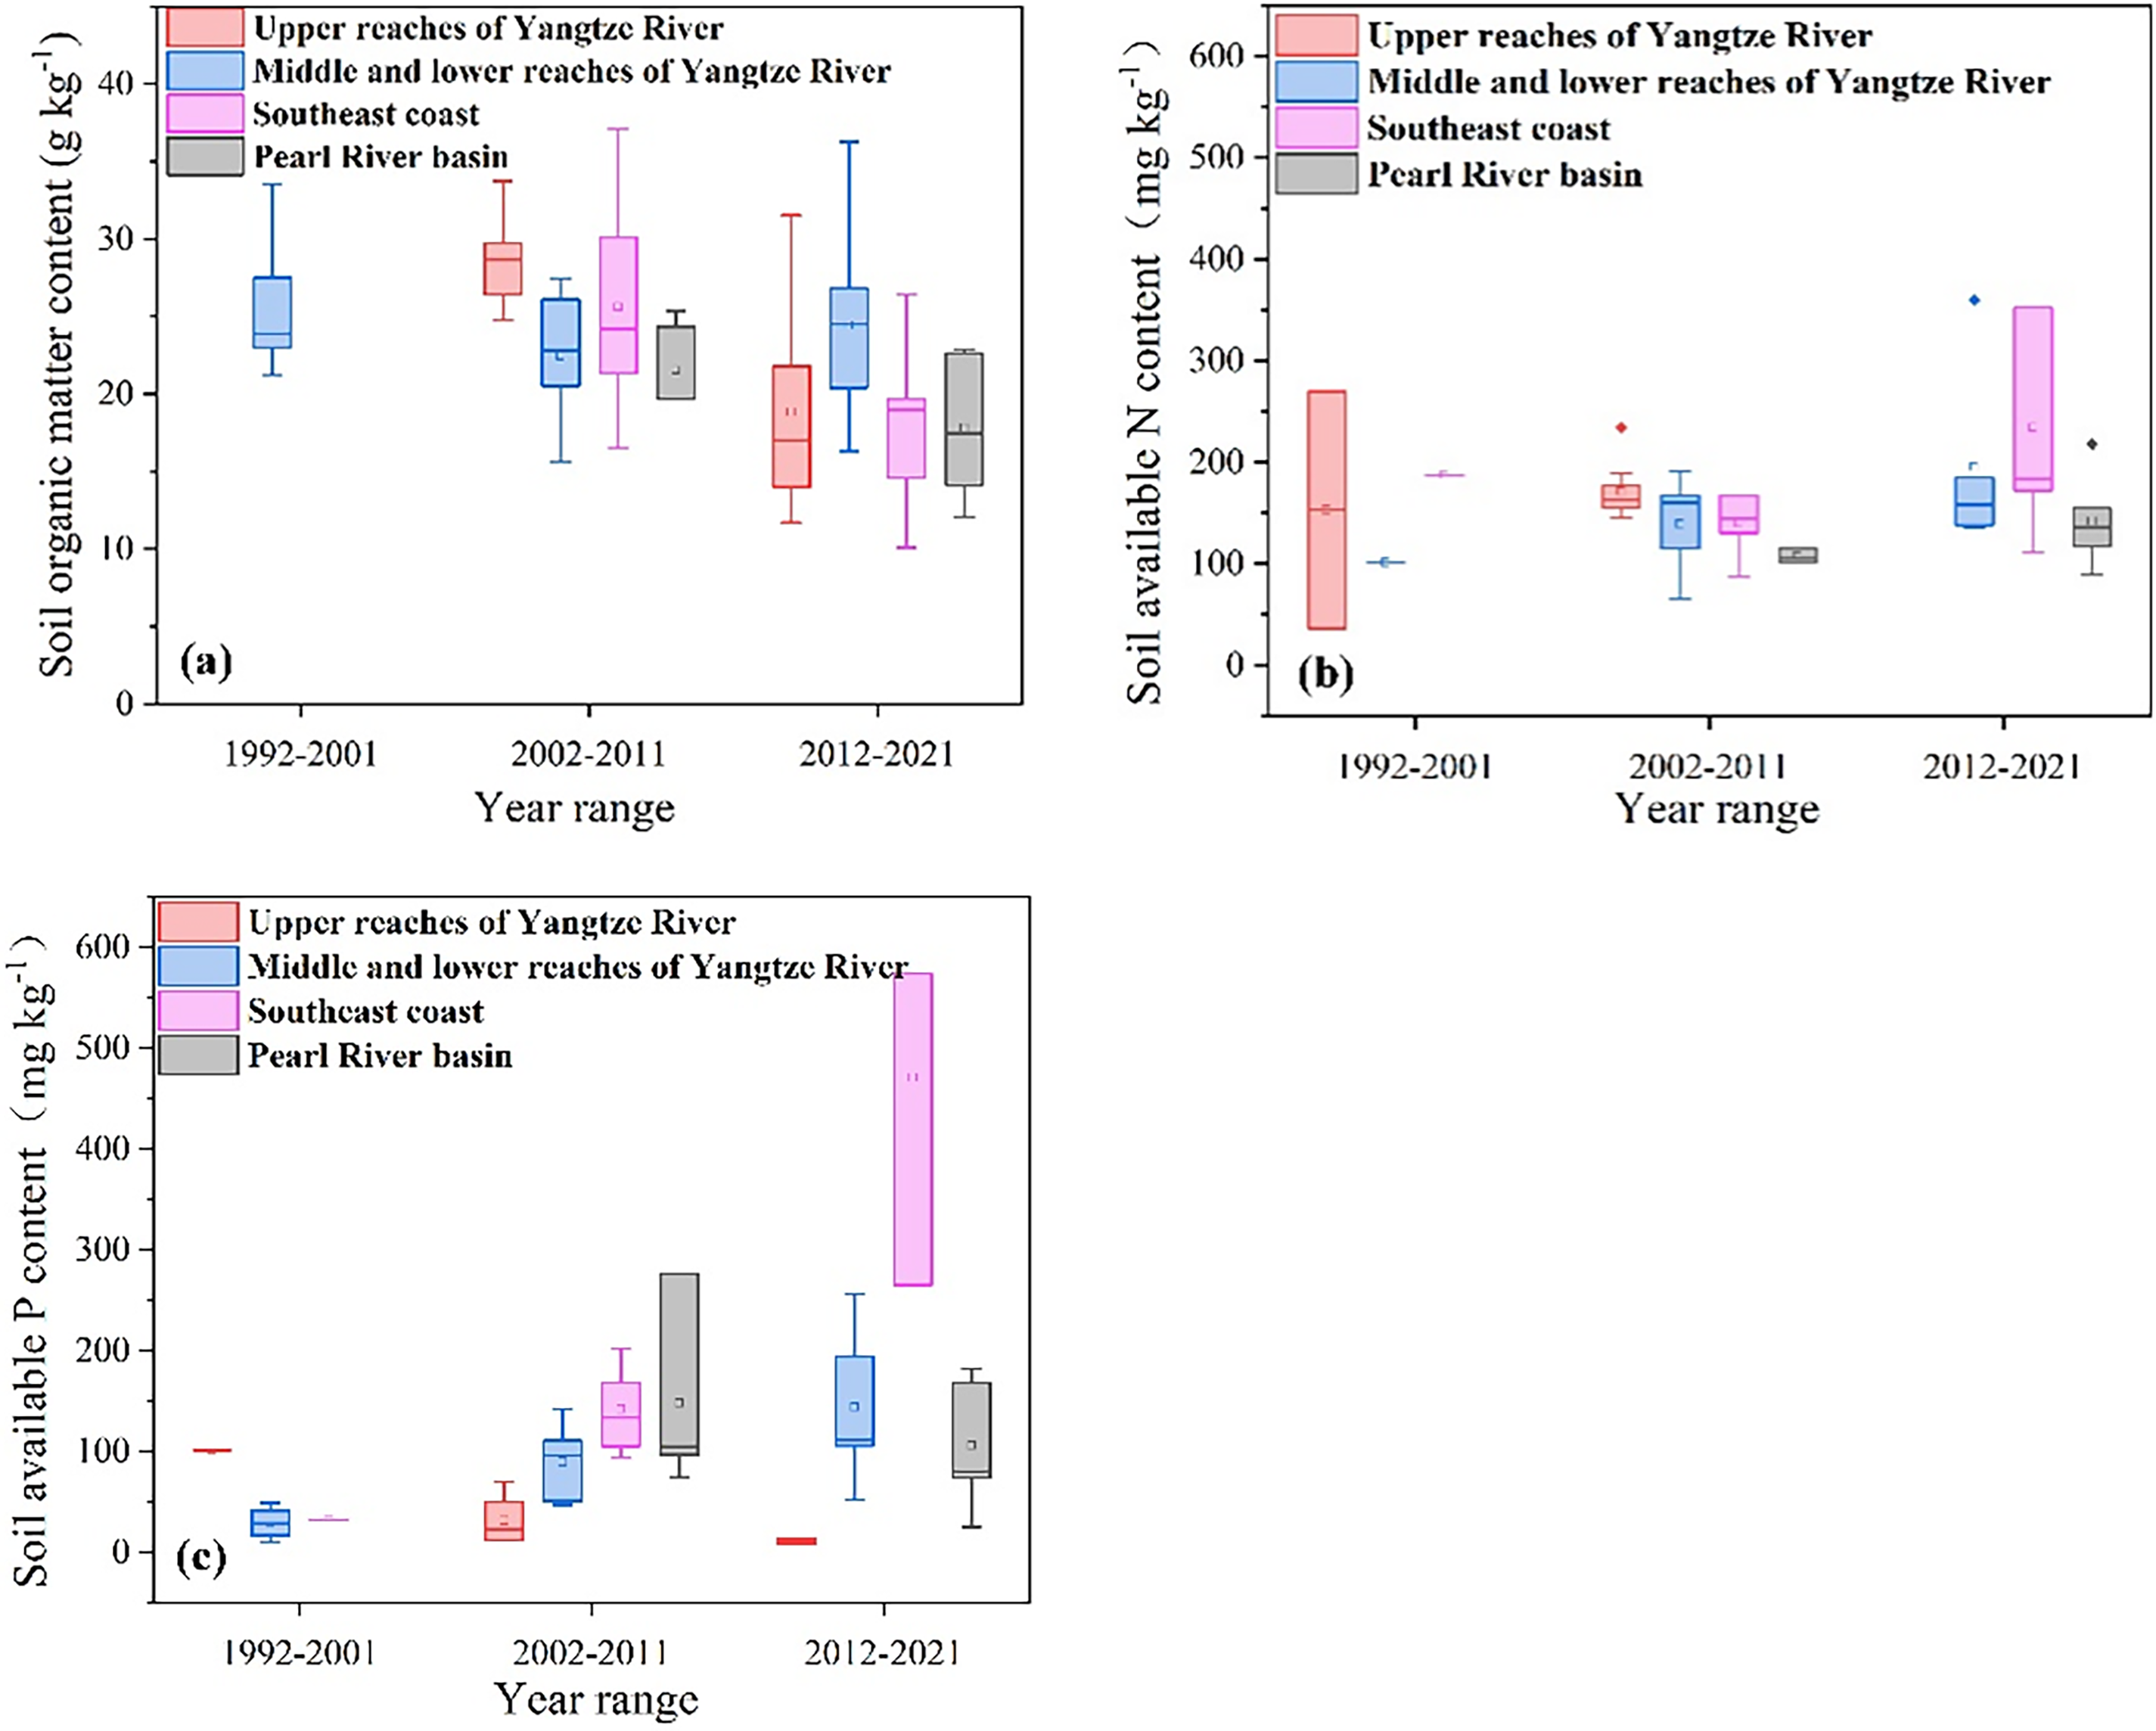
Figure 5: Temporal and spatial changes in contents of soil organic matter (a), soil available N (b), and soil available P (c) in last three decades (1992–2001, 2002–2011, and 2012–2021). Upper reaches of Yangtze River, middle and lower reaches of Yangtze River, Southeast Coast and Pearl River basin are denoted as U-YR, ML-YR, SC and PR, respectively
3.5 Cause Analysis of the Changing Trend of N and P Runoff Loads
During last three decades, the TNy runoff loads from vegetable fields gradually increased in the U-YR and PR regions, while they gradually decreased in the ML-YR and SC regions. During the same period, the TPy runoff loads in the Yangtze River (U-YR and ML-YR), PR, and SC regions increased annually. We conducted a preliminary analysis to elucidate the changing patterns of N and P runoff loads from intensive vegetable production systems in southern China. Between 2006 and 2016, vegetable cultivation areas expanded by 68% in U-YR and 28% in PR (Fig. 1). Notably, N fertilizer application rates during 2012–2021 were 25% (U-YR) and 54% (PR) higher than during 2002–2011 (Fig. 2). Consequently, TNy runoff loads increased dramatically by 142% and 186% in U-YR and PR, respectively (Fig. 3), with loss rates significantly exceeding those in other regions and progressively surpassing ML-YR levels (Table 2). During 2006–2016, the ML-YR and SC regions showed slower rates of new vegetable field establishment compared to other regions. and the SC region even witnessed a decline in vegetable cultivation area. Data in Fig. 5a suggested that the SOM content of vegetable soil in the ML-YR region was approximately 0.8 to 1.1 time higher than that recorded in other three regions. Similarly, the SC region exhibited an average soil available N content of 168 mg kg−¹, approximately 1.1–1.3 times higher than other investigated regions in southern China (Fig. 5b). Beside this situation, there was a modest increase in N fertilizer application rate in ML-YR by only 3.9% but a decrease in the SC by 11.6%, contributed to alleviating N runoff loss (Table 2).
The ML-YR region exhibited progressive expansion of vegetable cultivation area, with agricultural lands having extended production histories representing the dominant field type. During 1992–2021, SOM and available P contents ranged from 15.6 to 36.3 g kg−¹ and 46.5 to 141.7 mg kg−¹, respectively (Fig. 5). In the PR region, the significant expansion of vegetable cultivation area led to a 170% increase in P fertilizer application rates, rising from 108 kg P2O5 ha−¹ (2002–2011) to 292 kg P2O5 ha−¹ (2012–2021) (Fig. 2). This situation was attributed to the scarcity of soil nutrients, particularly characterized by an average soil available P content (<100 mg kg–1). The SC region also showed substantial growth in TPy runoff loss over the past decade, though its absolute values remained 241% lower than other regions (Table 3).
This study comprehensively examined the spatial-temporal dynamics of N and P runoff loads in vegetable fields at southern China, revealing the distinct interannual trends and regional disparities. These findings facilitate estimation of N and P runoff loads in critical watersheds, supporting non-point source pollution control. We previously investigated in the Taihu Lake region, which belong to ML-YR, and found that N runoff load from vegetable fields significantly decreased from 2002 to 2017 [22], which was further corroborated by our systematic analysis. However, the P runoff loads exhibited significant spatial variations, which was potentially due to the mitigation of residual soil P and the reduction of P fertilizer application in the Taihu Lake area (Fig. 3). Zhejiang Province, located in the ML-YR, was with an average losses of 15.0 kg N ha–1 per season of vegetable in 2010 according to Shan et al. [23]. Field experiments conducted from 2008 to 2010 in a Taihu Lake watershed revealed seasonal N and P loss loads from vegetable plots ranging from 9.3–70.9 kg N ha−¹ and 0.34–7.3 kg P2O5 ha−¹, respectively, demonstrating significant nutrient discharge variability within the same agricultural region [24]. We quantified runoff loss rates in the study area during 2002–2011 as 0.19 (0.01–0.38) to 0.26 (0.01–0.51) kg N ha−¹ and 0.046 (0–0.093) to 0.092 (0–0.185) kg P2O5 ha−¹, which increased to 0.13 (0.01–0.26) to 0.30 (0.01–0.59) kg N ha−¹ and 0.055 (0–0.111) to 0.128 (0–0.258) kg P2O5 ha−¹ during 2012–2021, consistent with our current findings. A longitudinal study of vegetable plots in Guangdong province (belonging to PR) measured N runoff losses at 23.3 kg ha−¹ in 2011, demonstrating significant nutrient discharge from intensive vegetable production systems [25]. Subsequently, quantitative experiments indicated that 4.7 kg of P2O5 ha−¹ was lost in runoff in each vegetable season in 2018 [26]. Our results demonstrated that N and P runoff loads from vegetable fields in the PR region during the study period ranged from 0.14 (0.01–0.26) to 0.35 (0.02–0.67) kg N ha−¹ and from 0.034 (0–0.069) to 0.085 (0–0.171) kg P2O5 ha−¹, respectively. From a global perspective, long-term monitoring of Norwegian farmlands (1991–2013) revealed TN runoff losses ranging from 2.0 to 69.2 kg N ha−¹ yr−¹, reflecting significant spatial-temporal variability [27]. This value is much higher than the average value in other regions of the Nord-Baltic Sea, but it is close to the average TN loss per unit area of vegetable plots in southern China from 1992 to 2011 (54.6 kg N ha−1 yr−1). It shows that China still needs to strengthen the continuous monitoring and targeted management of runoff N loss in vegetable fields on the basis of the existing management. Agricultural runoff in four Indian regions (1970–2020) showed accelerated N and P losses, with mean annual discharges increasing from 0.32 to 1.55 Tg N yr−¹ and 0.09 to 0.65 Tg P yr−¹, respectively—a rate surpassing that of southern China’s vegetable fields [28]. It is speculated that the annual rainfall in this region is higher than that in southern China. Therefore, comprehensive analysis of natural factors should be added in the future.
Spatiotemporal variations in N runoff loads were observed, with increasing trends in the U-YR and PR regions but decreasing trends in the ML-YR and SC regions (Fig. 3). This trend may be related to the N fertilizer application rates and techniques, and the expanding vegetable productions. A study conducted in Anhui province (belonging to ML-YR) demonstrated that optimized N fertilizer application rates and improved management practices could reduce N losses in vegetable fields by up to 90% [29]. Similarly, the results based on Zhejiang, belonging to the SC region, also demonstrated that decreasing N rate and incorporating organic fertilizers help to diminish the runoff N loss [30]. Recent studies have demonstrated the effectiveness of nitrogen fertilizer reduction and optimization strategies. In long-term cultivated vegetable fields, balanced fertilization practices have been increasingly adopted, leading to measurable decreases in soil N runoff losses. For instance, we found that the N runoff loads in the ML-YR (1992–2011) and SC (2002–2021) both experienced a relative reduction process. Furthermore, Tian et al. demonstrated that short-term N fertilizer reduction or omission in long-term over-fertilized soils maintains crop yields while reducing environmental N losses [31]. Therefore, promptly adjusting N fertilizer application rates in vegetable fields with long-term nutrient accumulation can effectively reduce soil nutrient losses. With the growth of China’s population, the demand for vegetables has increased, and the vegetable cultivation area in southern China has increased rapidly, particularly that of Guangxi and Guangdong province in the PR regions, as well as the U-YR region (Fig. 1). These two regions have become essential centers for China’s overwintering vegetable production. The high yield of vegetables in southern China significantly relies on N fertilizer input, leading to the excessive N application into newly reclaimed vegetable systems. Nitrogen fertilizer application was identified as a dominant driver of N losses in vegetable production systems within the PR region [32]. Furthermore, SOM content significantly influenced N runoff loads. Land use structure changes represent a primary determinant of surface SOM and soil organic carbon (SOC) dynamics [33,34]. Notably, the conversion of native soils or paddy fields (with inherently higher carbon storage capacity) to vegetable fields, particularly intensive cultivation systems, progressively depletes soil organic matter reserves [35,36]. The change of fertilizer application mode can directly lead to the change of organic matter [37,33]. According to the survey and data summary conducted by Lu et al. nitrogen fertilizer application in the U-YR and PR regions increased more from 2012 to 2021 than from 2002 to 2011, and due to the large number of newly cultivated vegetable plots (Table 2) [35]. Most of them are intensive vegetable plots [35], with small initial SOC reserves, weak soil fertilizer retention capacity, and a large overall loss of soil organic matter and C/N, resulting in a large increase in N runoff loads. However, despite a reduction in vegetable cultivation area in the SC region during 2012–2021 compared to 2002–2011, insufficient N fertilizer inputs (Table 2), coupled with slow soil organic matter accumulation and limited C/N ratio improvement, resulted in declining TN stocks. Due to the gradual increase of organic fertilizer replacement and straw returning ratio in ML-YR area in recent years [38,39], SOM reserves increased and TN loss was controlled.
Our results revealed increasing temporal trends in P runoff loads across all study regions, with particularly pronounced increases in the ML-YR and PR regions. In the ML-YR region, high P runoff loads may result from prolonged vegetable cultivation in soils with accumulated P exceeding system thresholds. This condition precipitates a more rapid increase in P runoff load compared to other three investigated regions in southern China. Open-air vegetable fields near Taihu Lake (belonging to ML-YR region) exhibited surface soil Olsen-P concentrations approaching 80 mg kg−¹, significantly exceeding environmental thresholds [40]. The P contents of vegetable soils with 15–30 years cultivation history always surpassed the soil P threshold, indicating an increased risk of runoff with prolonged cultivation in Hunan province [41]. In addition, vegetable yields remained stable despite increased chemical and organic P fertilizer inputs, while soil soluble P accumulation elevated runoff risks [42]. Similarly, subtropical Chinese vegetable soils showed annual P surpluses of 205–252 kg ha−¹ due to excessive fertilization and suboptimal management practices [43].
In areas with abundant rainfall, such as southern China, vegetable fields around natural water bodies easily discharge N and P pollutants into surface water through runoff due to their high residual level. There are studies have shown that, while irrigation expansion reduces riverine sediment loads, it exacerbates N and P losses from agricultural systems [11]. Besides leaching, runoff is another main pathway of N discharge from intensive vegetable system in southern China. Shan et al. reported that nitrogen loss from vegetable fields in the Taihu Lake area contributes 59% of the nitrogen required for eutrophication in the Taihu Lake waters [23]. In the southwestern China (U-YR), highland lakes are extensively bordered by agricultural lands, where vegetable production occupies 34% of the total cultivated area [44]. Traditional vegetable and flower cultivation practices in southwest China (belonging to U-YR region) contribute significantly to adjacent water N and P pollutions. Furthermore, mixed land use and seasonal fluctuations were found to amplify groundwater nitrate (NO3−) and total N concentrations, intensifying non-point source pollution in affected watersheds [44]. According to the data of China’s pollution census, the total N and P discharges from agriculture in southern China increased rapidly from 2016 to 2021. During the study period, total N and P discharges from vegetable fields in southern China increased by 85% and 121%, respectively, exhibiting a consistent upward trend. In China, the emissions of agricultural ammonia NH4+, total N and P pollutants from the southern regions were significantly more than those from the northern regions in 2021 [2]. Of which, the total N and P discharges reached 1.13 and 0.19 million tons respectively, representing 67.1% and 69.8% of national totals, with Guangdong, Sichuan, Hubei, Zhejiang, and Jiangsu provinces as the primary contributors. The Yangtze River (YR) and Pearl River (PR) regions represent China’s most significant agricultural sources of N and P pollution, accounting for 61% and 63% of national emissions, respectively. For instance, Guangdong and Sichuan provinces emitted approximately 16.5 and 10.4 t of total N, respectively, in 2021. Furthermore, approximately 32% of China’s agricultural N runoff loads in 2021 originated from the PR and U-YR regions [2]. These regions have emerged as China’s primary agricultural pollutant sources, with newly reclaimed vegetable fields representing significant contributors to N and P non-point source pollution.
This study examined China’s three decade period of rapid economic development, coinciding with substantial expansion of the vegetable industry toward western and southern regions. The accelerated growth in vegetable cultivations increased the risks of non-point source N and P pollutions, which should be paid more attentions. For long-term vegetable cultivation systems, improving crop utilization efficiency of accumulated soil nutrients is essential to mitigate N and P runoff risks. For example, balance the nitrogen fertilizer of U-YR and PR, and properly control the amount of new cultivation area while ensuring the yield in the area. Meanwhile, for newly cultivated vegetable fields, balanced N and P fertilizer application is crucial to minimize potential nutrient losses to aquatic ecosystems. The ML-YR region requires careful management of P accumulation through optimized N:P fertilizer ratios and reduced P application rates. And the PR region should focus on limiting both vegetable cultivation expansion and total P fertilizer inputs. However, besides two main variables of vegetable cultivated area and fertilizer application rate, the subtle differences of multiple cropping index between different regions need to be further refined. Moreover, our estimation of annual average N and P runoff losses from southern China’s vegetable fields did not account for regional extreme planting conditions. It has been demonstrated that the soil bulk density and soil slope with rainfall characteristics as well as irrigation methods are important driving forces of N and P migrations, which factors affecting runoff will be considered in the future.
This study synthesized data from published literature and official statistics to analyze spatiotemporal patterns in vegetable cultivation areas, N and P fertilizer inputs, and associated runoff losses across four regions (U-YR, ML-YR, PR, and SC) from 1992 to 2021. Results revealed a substantial expansion of vegetable production areas alongside increasing inorganic N and P fertilizer application rates. While total P runoff losses showed continuous growth throughout the study period, N losses increased during 1992–2011 but stabilized in the subsequent decade. The analysis identified cultivation area expansion, rather than fertilizer application rates alone, as the primary driver of nutrient runoff. These findings highlight the need for differentiated nutrient management strategies between newly established and long-term vegetable production systems. In the future, more summarization should be made to guide fertilizer management to cover the whole of China to mitigate non-point sources of N and P pollutants. Moreover, the relationship of N and P runoff losses from vegetable, their transformations, and transmissions until they enter into the adjacent lake or river environment should be built.
Acknowledgement: Not applicable.
Funding Statement: This research was funded by the National Key Research and Development Program of China, grant number 2021YFD1700801.
Author Contributions: Conceptualization, Yuhe Wang and Ju Min; methodology, Yuhe Wang and Ju Min; software, Yuhe Wang; validation, Yuhe Wang and Ju Min; formal analysis, Yuhe Wang; data curation, Yuhe Wang and Yaqiong Hao; writing—original draft preparation, Yuhe Wang; writing—review and editing, Yuhe Wang, Ju Min, Haijun Sun and Xiancan Zhu; visualization, Yuhe Wang; supervision, Ju Min. All authors reviewed the results and approved the final version of the manuscript.
Availability of Data and Materials: The data that support the findings of this study are available from the corresponding author, Ju Min, upon reasonable request.
Ethics Approval: Not applicable.
Conflicts of Interest: The authors declare no conflicts of interest to report regarding the present study.
References
1. FAO. Food and agriculture organization statistical databases; 2021 [cited 2025 Mar 14]. Available from: https://www.fao.org/statistics/. [Google Scholar]
2. National Bureau of Statistics of China. China Statistical Yearbook 1992–2022. Beijing: China Statistics Press; 1992–2022. [Google Scholar]
3. Liu ZH, Yang P, Wu WB, You LZ. Spatiotemporal changes of cropping structure in China during 1980-2011. J Geog Sci. 2018;28(11):1659–71. doi:10.1007/s11442-018-1535-4. [Google Scholar] [CrossRef]
4. Huang SW, Tang JW, Li CH, Zhang HZ, Yuan S. Reducing potential of chemical fertilizers and scientific fertilization countermeasure in vegetable production in China. J Plant Nutr Fert. 2017;23:1480–93. (In Chinese). [Google Scholar]
5. Ni B, Zhang W, Xu XC, Wang LG, Bol R, Wang KY, et al. Exponential relationship between N2O emission and fertilizer nitrogen input and mechanisms for improving fertilizer nitrogen efficiency under intensive plastic-shed vegetable production in China: a systematic analysis. Agric Ecosyst Environ. 2021;312:107353. doi:10.1016/j.agee.2021.107353. [Google Scholar] [CrossRef]
6. Zhang WN, Tang XM, Feng XH, Wang EL, Li HG, Shen JB, et al. Management strategies to optimize soil phosphorus utilization and alleviate environmental risk in China. J Environ Qual. 2019;48(5):1167–75. doi:10.2134/jeq2019.02.0054. [Google Scholar] [PubMed] [CrossRef]
7. Uribe N, Corzo G, Quintero M, van Griensven A, Solomatine D. Impact of conservation tillage on nitrogen and phosphorus runoff losses in a potato crop system in Fuquene watershed. Colombia Agric Water Manag. 2018;209(1):62–72. doi:10.1016/j.agwat.2018.07.006. [Google Scholar] [CrossRef]
8. Bogunovic I, Telak LJ, Pereira P, Filipovic V, Filipovic L, Percin A, et al. Land management impacts on soil properties and initial soil erosion processes in olives and vegetable crops. J Hydrol Hydromech. 2020;68(4):328–37. doi:10.2478/johh-2020-0033. [Google Scholar] [CrossRef]
9. Ju XT, Xing GX, Chen XP, Zhang SL, Zhang LJ, Liu XJ, et al. Reducing environmental risk by improving N management in intensive Chinese agricultural systems. Proc Natl Acad Sci U S A. 2009;9(19):3041–6. doi:10.1073/pnas.0902655106. [Google Scholar] [CrossRef]
10. Shi WM, Yao J, Yan F. Vegetable cultivation under greenhouse conditions leads to rapid accumulation of nutrients, acidification and salinity of soils and groundwater contamination in South-Eastern China. Nutr Cycling Agroecosyst. 2009;83(1):73–84. doi:10.1007/s10705-008-9201-3. [Google Scholar] [CrossRef]
11. Ding N, Tao FL, Chen Y. Effects of climate change, crop planting structure, and agricultural management on runoff, sediment, nitrogen and phosphorus losses in the Hai-River Basin since the 1980s. J Cleaner Prod. 2022;359(4):132066. doi:10.1016/j.jclepro.2022.132066. [Google Scholar] [CrossRef]
12. Deng CN, Zhang ZQ, Zhang CZ, Xu R, Nie C, Meng QJ, et al. A multi-spatial scale analysis of anthropogenic nitrogen and phosphorus inputs in a large river basin: environmental effect and policy impact. Reg Environ Change. 2024;24(3):123. doi:10.1007/s10113-024-02279-4. [Google Scholar] [CrossRef]
13. Xie H, Ringler C. Agricultural nutrient loadings to the freshwater environment: the role of climate change and socioeconomic change. Environ Res Lett. 2017;12(10):104008. doi:10.1088/1748-9326/aa8148. [Google Scholar] [CrossRef]
14. Yu CQ, Huang X, Chen H, Godfray HCJ, Wright JS, Hall JW, et al. Managing nitrogen to restore water quality in China. Nature. 2019;567(7749):516–20. doi:10.1038/s41467-024-55714-9. [Google Scholar] [CrossRef]
15. Liu FY, Xia Y, Huang M, Lei QL, Liu HB, Fan XP, et al. Characteristics of farmland surface runoff nitrogen and phosphorus loss under different planting patterns in the Three Gorges Reservoir area of Hubei Province. J Agric Resour Environ. 2018;35(6):550–8. (In Chinese). doi:10.3724/sp.j.1011.2012.00728. [Google Scholar] [CrossRef]
16. Guan XL, Liu CY, Li Y, Wang X, Liu Y, Zou C, et al. Reducing the environmental risks related to phosphorus surplus resulting from greenhouse cucumber production in China. J Cleaner Prod. 2022;332(3):130076. doi:10.1016/j.jclepro.2021.130076. [Google Scholar] [CrossRef]
17. Wang R, Min J, Kronzucker HJ, Li YL, Shi WM. N and P runoff losses in China’s vegetable production systems: loss characteristics, impact, and management practices. Sci Total Environ. 2019;663(2):971–79. doi:10.1016/j.scitotenv.2019.01.368. [Google Scholar] [PubMed] [CrossRef]
18. Xu W, Liu L, Zhu SJ, Sun AH, Wang H, Ding ZY. Identifying the critical areas and primary sources for agricultural non-point source pollution management of an emigrant town within the Three Gorges reservoir area. Environ Monit Assess. 2023;195(5):602. doi:10.1007/S10661-023-11180-2. [Google Scholar] [PubMed] [CrossRef]
19. Jin ZF, Xiao JZ, Ye HY, Fu GW, Li GY, Wu WB, et al. Determination of nitrogen sources and losses in surface runoff from different lands at a watershed scale. Environ Sci Pollut Res. 2023;30(22):63052–64. doi:10.1007/s11356-023-26459-7. [Google Scholar] [PubMed] [CrossRef]
20. Wang HY, Li JG, Fan BQ, Luo XS, Peng C, Zhai LM, et al. Characteristics and spatiotemporal rules of nitrogen and phosphorus leaching in farmland in major agricultural areas of northern China. Chin J Eco-Agric. 2021;29(1):11–8. (in Chinese). [Google Scholar]
21. Min J, Sun HJ, Kronzucker HJ, Wang Y, Shi WM. Comprehensive assessment of the effects of nitrification inhibitor application on reactive nitrogen loss in intensive vegetable production systems. Agric Ecosyst Environ. 2021;307:107227. doi:10.1016/j.agee.2020.107227. [Google Scholar] [CrossRef]
22. Min J, Ji RT, Wang X, Chen KW, Xu JT, Pan YF, et al. Changes of planting structure and nitrogen and phosphorus loss load of farmland in Taihu Lake region. Chin J Eco-Agric. 2020;28(8):1230–8. (In Chinese). [Google Scholar]
23. Shan LN, He YF, Chen J, Huang Q, Lian X, Wang HC, et al. Nitrogen surface runoff losses from a Chinese cabbage field under different nitrogen treatments in the Taihu Lake Basin. China Agric Water Manag. 2015;159(3):255–263. doi:10.1016/j.agwat.2015.06.008. [Google Scholar] [CrossRef]
24. Wang ZC, Qiu D, Du YY, Chen LG, Zhu PP, Zheng JC. Characteristics of surface runoff and nitrogen and phosphorus loss from typical vegetable fields in the Taihu Lake basin. Jiangsu J Agricul. 2012;28(6):1501–4. (In Chinese). [Google Scholar]
25. Li MJ, Yao JW, Wang RH, Zeng ZB, Ning JF, Ai SY. Characteristics of vegetable growth and nitrogen runoff in perennial vegetable plots under different nutrient management measures. J Plant Nutr Fert. 2015;21(05):1190–9. (In Chinese). [Google Scholar]
26. Li MJ, Ai SY, Ning JF, Wang RH, Yao JW, Yu DN. Runoff characteristics of phosphorus and potassium nutrients in perennial vegetable fields under different nutrient management measures. J Agric Resour Environ. 2019;36(01):33–42. (In Chinese). [Google Scholar]
27. Bechmann M. Long-term monitoring of nitrogen in surface and subsurface runoff from small agricultural dominated catchments in Norway. Agric Ecosyst Environ. 2014;198(6):13–24. doi:10.1016/j.agee.2014.05.010. [Google Scholar] [CrossRef]
28. Elsayed H, Beusen A, Prusty AK, Bouwman L. Long-term variations (1970—2020) and spatial patterns of nitrogen and phosphorus soil budgets and fates in Indian agriculture. Nutr Cycling Agroecosyst. 2024;130(1):1–16. doi:10.1007/s10705-024-10375-4. [Google Scholar] [CrossRef]
29. He CL, Ma YH, Li F, Jiang GY, Zhou WP. Effects of reducing fertilizer application on vegetable soil nutrient leaching and spring cabbage yield. Chin J Soil Sci. 2011;42(2):397–401. (In Chinese). [Google Scholar]
30. Xie SW, Feng HX, Yang F, Zhao ZD, Hu XD, Wei CY, et al. Does dual reduction in chemical fertilizer and pesticides improve nutrient loss and tea yield and quality? A pilot study in a green tea garden in Shaoxing, Zhejiang Province. China Environ Sci Pollut Res. 2019;26(3):2464–76. doi:10.1007/s11356-018-3732-1. [Google Scholar] [PubMed] [CrossRef]
31. Tian X, Zhang C, Ju XT. Crop responses to application of optimum nitrogen fertilizers on soils of various fertilities formed from long-term fertilization regimes. Eur J Agron. 2023;148:126857. doi:10.1016/j.eja.2023.126857. [Google Scholar] [CrossRef]
32. Zeng ZB, Li L, Yao J, Yu DN, Luo YJ, Ai SY. Effects of customary fertilization on nitrogen and phosphorus runoff in vegetable fields. J Soil Water Conserv. 2012;26(5):34–38+43. (In Chinese). [Google Scholar]
33. Figuerêdo KS, Pereira MTJ, Nick C, Silva IR, Oliveira TS. Long-term changes in organic matter stocks and quality in an Oxisol under intensive vegetable cultivation. Catena. 2020;188(3):104442. doi:10.1016/j.catena.2019.104442. [Google Scholar] [CrossRef]
34. Xu LY, Wang MY, Xie XQ, Shi XZ, Xu SX, Sun WX, et al. Sensitivity of soil aggregation to soil organic carbon fractions under land-use conversion from rice to organic vegetable cultivation. Catena. 2021;207(1—2):105661. doi:10.1016/j.catena.2021.105661. [Google Scholar] [CrossRef]
35. Lu M, Powlson DS, Liang Y, Chadwick DR, Long SB, Liu DY, et al. Significant soil degradation is associated with intensive vegetable cropping in a subtropical area: a case study in southwestern China. SOIL. 2021;7(2):333–46. doi:10.5194/soil-7-333-2021. [Google Scholar] [CrossRef]
36. Arshad M, Khedher KM, Ayed H, Mouldi A, Moghanm FS, El Ouni MH, et al. Effects of land use and cultivation histories on the distribution of soil organic carbon stocks in the area of the Northern Nile Delta in Egypt. Carbon Manage. 2020;11(4):341–54. doi:10.1080/17583004.2020.1790241. [Google Scholar] [CrossRef]
37. White KE, Brennan EB, Cavigelli MA, Smith RF. Winter cover crops increase readily decomposable soil carbon, but compost drives total soil carbon during eight years of intensive, organic vegetable production in California. PLoS One. 2020;15(2):e0228677. doi:10.1371/journal.pone.0228677. [Google Scholar] [PubMed] [CrossRef]
38. Fan MM, Lal R, Zhang H, Margenot AJ, Wu JT, Wu PB, et al. Variability and determinants of soil organic matter under different land uses and soil types in eastern China. Soil Tillage Res. 2020;198(1):104544. doi:10.1016/j.still.2019.104544. [Google Scholar] [CrossRef]
39. Xu XT, Bi RY, Song MX, Dong YB, Jiao Y, Wang BX, et al. Organic substitutions enhanced soil carbon stabilization and reduced carbon footprint in a vegetable farm. Soil Tillage Res. 2024;236:105955. doi:10.1016/j.still.2023.105955. [Google Scholar] [CrossRef]
40. Wang R, Shi WM, Li Y. Evaluation of phosphorus fertilizer reduction on annual phosphorus loss in intensive open field vegetable plots. Acta Pedo Sin. 2023;60(1):224–34. (In Chinese). [Google Scholar]
41. Qin HL, Quan Z, Liu XL, Li MD, Zong Y, Wu JS, et al. Analysis of soil phosphorus status and leaching risk in vegetable plots with different planting years in Changsha suburbs. Chin Agric Sci. 2010;43(9):1843–51. (In Chinese). doi:10.1016/s1671-2927(09)60261-3. [Google Scholar] [CrossRef]
42. Liu JL, Liao WH, Zhang ZX, Zhang HT, Wang XJ, Meng N. Yield effects of phosphorus fertilizer and organic fertilizer and environmental risk assessment of soil phosphorus accumulation. Chin Agric Sci. 2007;5(3):959–65. (In Chinese). doi:10.1007/s11703-008-0026-2. [Google Scholar] [CrossRef]
43. Zhang W, Zhang YW, An YL, Chen XP. Phosphorus fractionation related to environmental risks resulting from intensive vegetable cropping and fertilization in a subtropical region. Environ Pollut. 2021;269:116098. doi:10.1016/j.envpol.2020.116098. [Google Scholar] [PubMed] [CrossRef]
44. Cui RY, Zhang D, Hu WL, Zhao XM, Yan H, Liu GC, et al. Nitrogen in soil, manure and sewage has become a major challenge in controlling nitrate pollution in groundwater around plateau lakes, Southwest China. J Hydrol. 2023;620(7):129541. doi:10.1016/j.jhydrol.2023.129541. [Google Scholar] [CrossRef]
Cite This Article
 Copyright © 2025 The Author(s). Published by Tech Science Press.
This work is licensed under a Creative Commons Attribution 4.0 International License , which permits unrestricted use, distribution, and reproduction in any medium, provided the original work is properly cited.
 Downloads
 Citation Tools