
 Submit a Paper
 Propose a Special lssue
 Open Access
ARTICLE

Complete Genomic Sequence Analysis of Sweet Potato Virus 2 Isolates from the Shandong and Jiangsu Provinces in China
1 College of Horticulture, Ludong University, Yantai, 264025, China
2 Key Laboratory of Biology and Genetic Improvement of Sweet Potato, Xuzhou Institute of Agricultural Sciences in Jiangsu Xuhuai Area, Xuzhou, 221131, China
3 Muping Agricultural Technology Service and Extention Center, Yantai, 264100, China
* Corresponding Authors: Guowei Geng. Email: ; Hongxia Zhang. Email:
# These authors contributed equally to this work
Phyton-International Journal of Experimental Botany 2025, 94(6), 1841-1856. https://doi.org/10.32604/phyton.2025.066148
Received 31 March 2025; Accepted 19 May 2025; Issue published 27 June 2025
 View Full Text
 Download PDF
Abstract
Sweet potatoes are significant cash crops, however, their yield and quality are greatly compromised by viral diseases. In this study, the complete genomic sequences of two Sweet Potato Virus 2 (SPV2) isolates from infected sweet potato leaves in the Shandong (designated as SPV2-SDYT, GenBank No. PQ855660.1) and Jiangsu (designated as SPV2-JSXZ, GenBank No. PQ855661.1) provinces in China were obtained using 5′ RACE and RT-PCR amplification. Consistency, phylogeny, codon usage bias, recombination, and selection pressure analyses were conducted using the SPV2-SDYT and SPV2-JSXZ genome sequences. The complete genome sequences of SPV2-SDYT and SPV2-JSXZ were 10561 nucleotides (nt) in length, with respective nucleotide and amino acid identities of 99.25% and 99.12%, respectively. Both isolates were closely related to the SPV2 isolate from China (SPV2-LN). In both SPV2-SDYT and SPV2-JSXZ, the identity of the P1 protein was the highest, whereas that of the P3 protein was the lowest. There were 26 codons with relatively synonymous codon usage (RSCU) values greater than 1 in SPV2-SDYT and 27 codons with RSCU values greater than 1 in SPV2-JSXZ. High-frequency codons in their genomes were predominantly found to end with A/U. Recombination analysis revealed no major recombination sites in either SPV2-SDYT or SPV2-JSXZ. Further selection pressure analysis showed that the non-synonymous substitution rate/synonymous substitution rate (dN/dS) value of all 10 SPV2 proteins was less than 1. This is the first report on the evolutionary relationships of the 17 known SPV2 isolates. Our findings lay the molecular groundwork for preventing and controlling SPV2 infection in root-tuber crops. These findings also contribute to our understanding of the spread and evolution of SPV2, its pathogenic mechanisms, and the development of antiviral strategies against it.Keywords
The sweet potato, a twining vine crop plant, holds significant value across various domains, including food, nutrition, economy, and medicine, and plays a crucial role in human livelihood and daily life [1,2]. China boasts the largest sweet potato cultivation area and leads the world in both yield and exports [3]. Sweet potato viral diseases significantly affect the yield and variety of sweet potatoes [4,5]. Currently, over 30 sweet potato viruses have been identified globally, with more than 20 reported in China [6,7]. These viruses are classified into nine families: Potyviridae, Geminiviridae, Caulimoviridae, Bunyaviridae, Bromoviridae, Comoviridae, Closteroviridae, Luteoviridae, and Flexiviridae. The genus Potyvirus in the family Potyviridae comprises sweet potato feathery mottle virus (SPFMV), sweet potato latent virus (SPLV), sweet potato mild speckling virus (SPMSV), sweet potato virus G (SPVG), sweet potato virus C (SPVC), and sweet potato virus 2 (SPV2) [8–11]. SPFMV, SPVG, and SPVC show co-infection in the field. Infection with SPFMV or sweet potato chlorotic stunt virus (SPCSV), both of which belong to the genus Crinivirus, typically has a minimal impact on yield. However, co-infection with two or more viruses can result in yield losses of up to 50% [12–14].
SPV2 was first reported in Taiwan, China and Nigeria in 1988. Since then, it has been reported in mainland China, the United States, Australia, Spain, Greece, Korea, East Timor, and South Africa [15–18]. The virus particles of SPV2 are linear, measuring 850 nm in length, and form pinwheel- or scroll-like inclusions within the cytoplasm [19]. SPV2 is a positive single-stranded RNA virus characterized by a poly(A) tail at the 3′ end. It encodes a polyprotein that is cleaved by proteases into 11 mature proteins, including P1, PISPO, HC-Pro, P3, 6K1, CI, 6K2, VPg, NIa-Pro, NIb, and CP. Furthermore, the P3N-PIPO protein is produced via a translational frame-shifting strategy [20,21]. Studies have shown that not all sweet potato viruses of the genus Potyvirus possess PISPO and P3N-PIPO proteins. Specifically, SPLV and sweet potato mild mottle virus (SPMMV) do not encode PISPO proteins [22]. Studies have also shown that SPV2 is prevalent in sweet potatoes in China and has been detected in Shandong, Jiangsu, Henan, Liaoning, Shaanxi, Anhui, and other provinces. However, only one SPV2 Chinese sweet potato isolate from Guangxi Province (SPV2-LN, GenBank No. OR842902.1) has been reported to date. In the present study, we obtained the complete genomic sequences of SPV2-SDYT and SPV2-JSXZ and analyzed their consistency, phylogeny, codon usage bias, recombination, and selection pressure. This study aimed to enhance the understanding of the genomic characteristics and evolution of SPV2 isolates in China, thereby offering a theoretical foundation for the prevention and control of SPV2.
Symptomatic sweet potato leaves with chlorotic spots harboring sweet potato virus 2 were respectively collected in Yantai city, Shandong province, China and Xuzhou city, Jiangsu province, China. Using the currently known sequence of SPV2 as primers, RT-PCR amplification was performed and identified by sequencing and comparison as SPV2.
2.2 Total RNA Extraction and RT-PCR Amplification
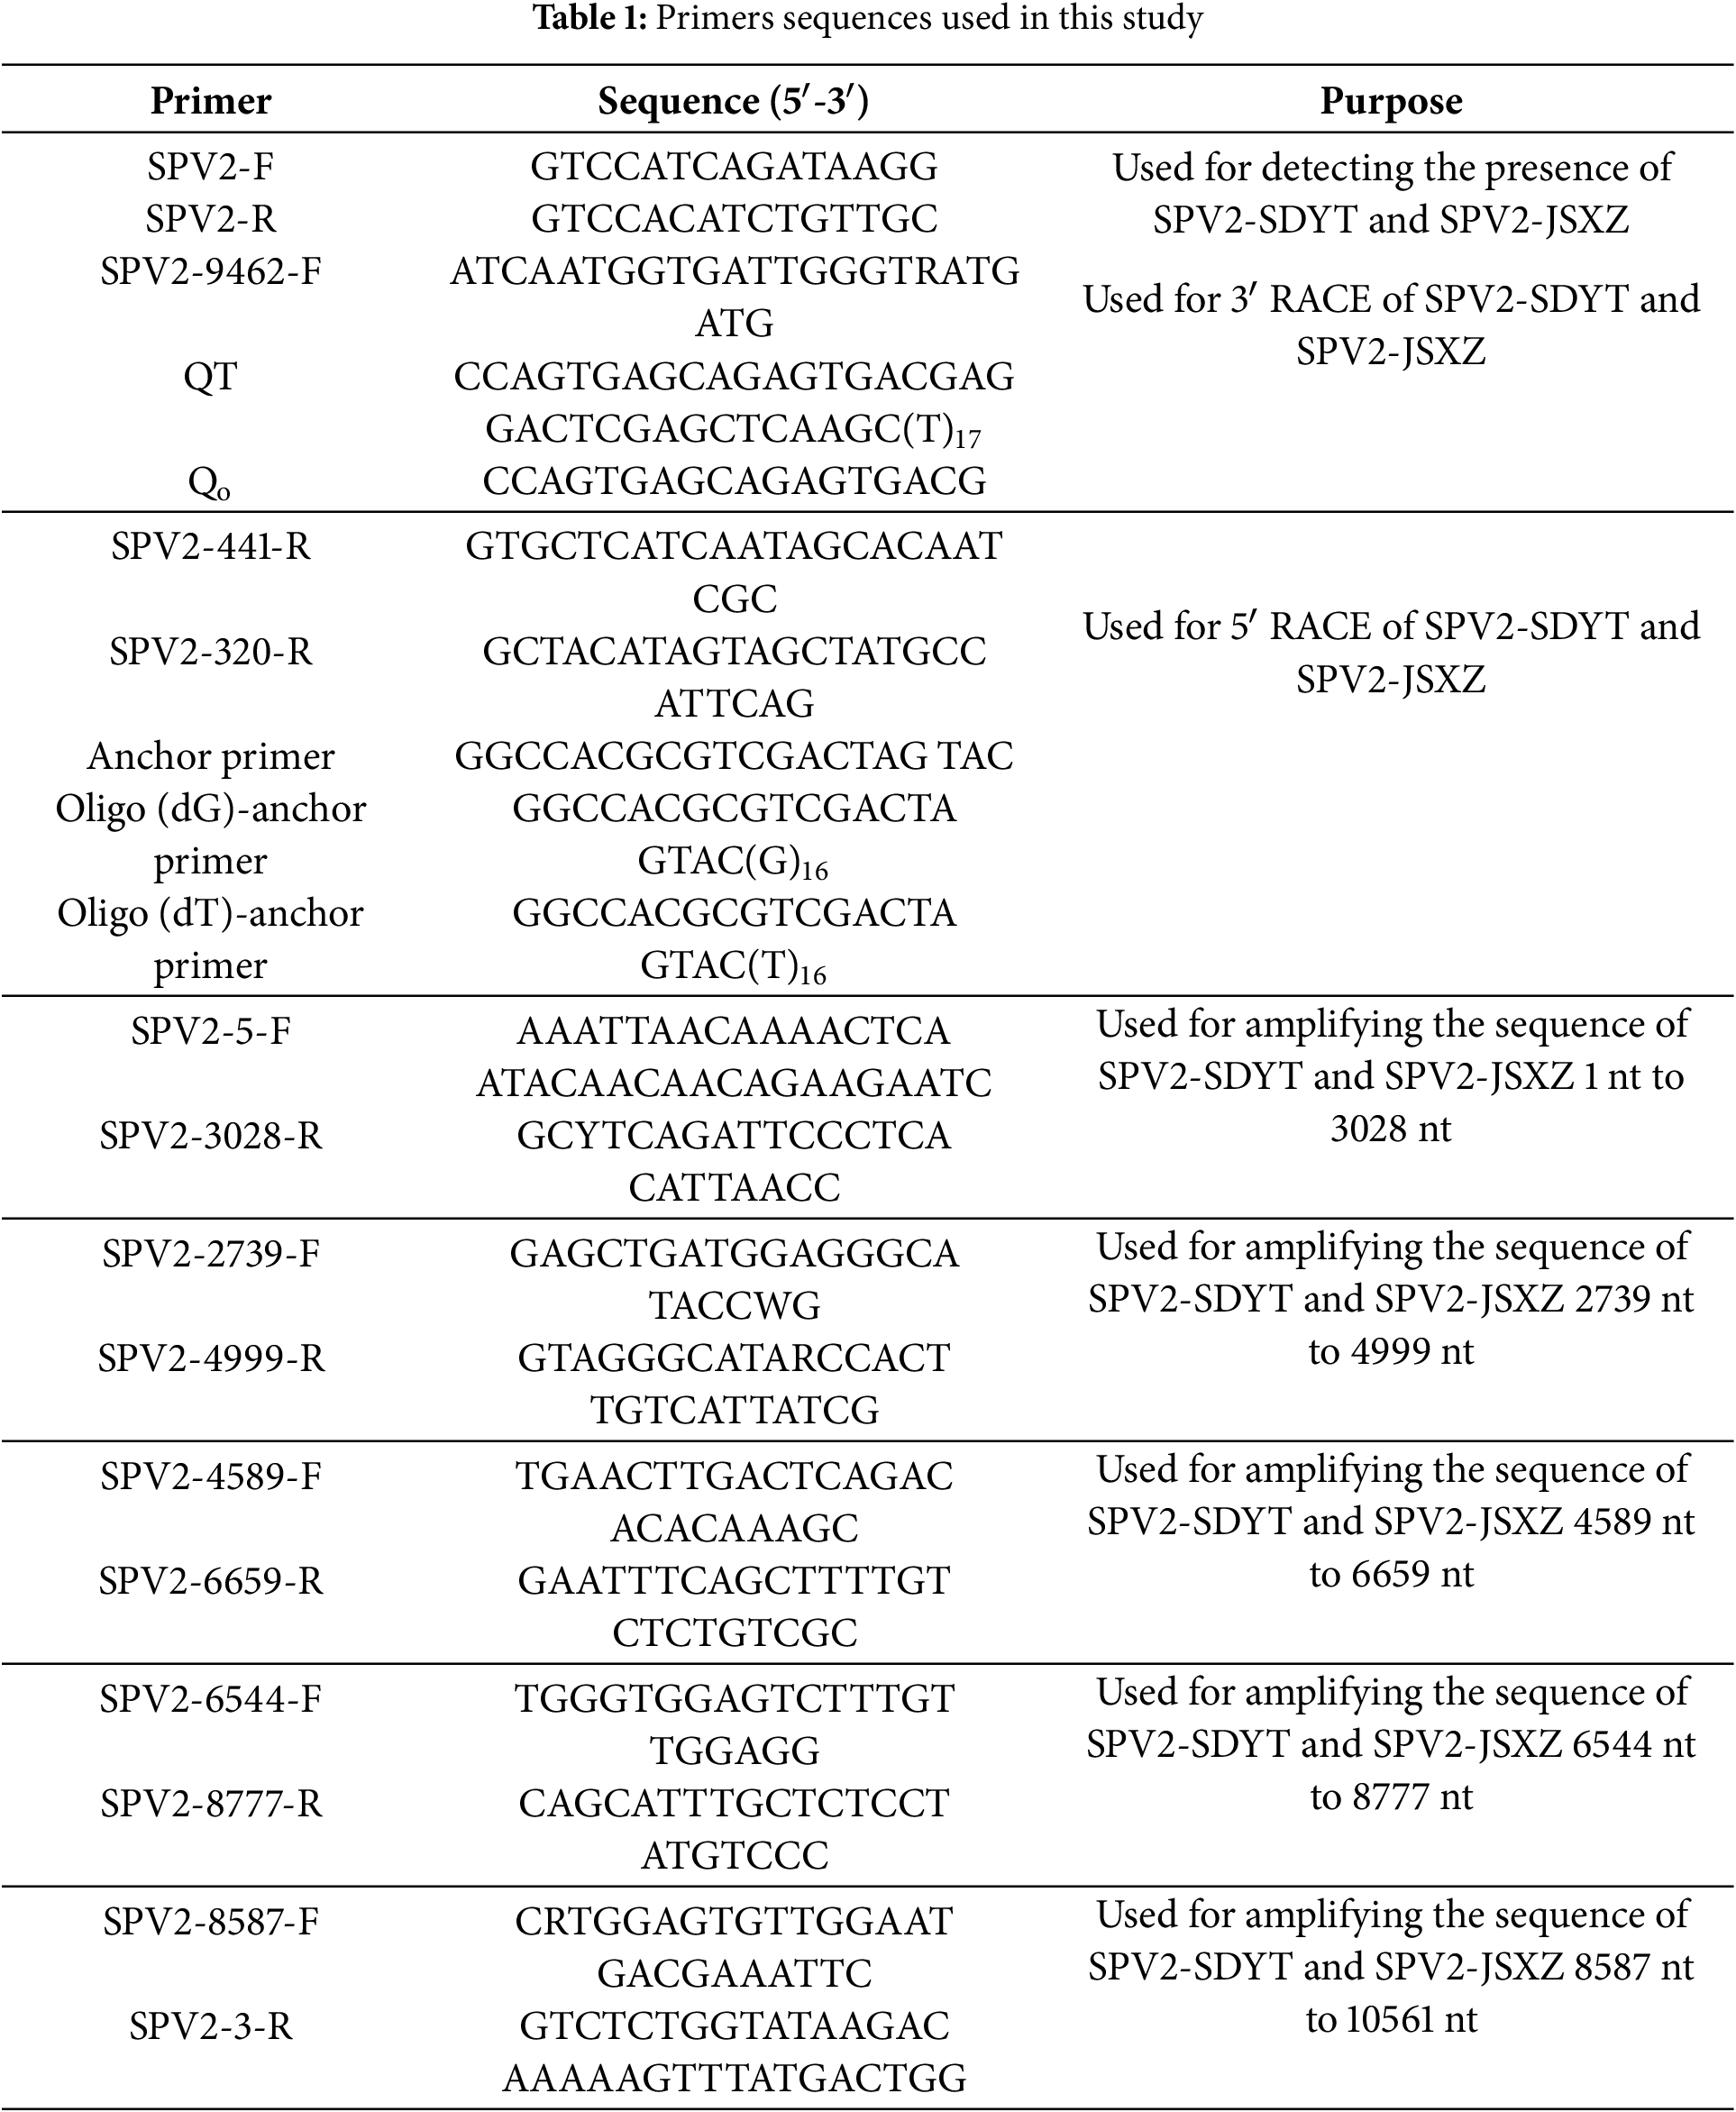
Total plant RNA was extracted using the M5 SuperPure Total RNA Extraction Reagent (Super TRlgent) (Mei5 Biotech, Beijing, China) according to the manufacturer’s instructions. The first strand of cDNA was prepared using M-MLV (H-) Reverse Transcriptase (Vazyme Biotech, Nanjing, China). The cDNA was stored in the refrigerator at −20°C. PCR amplification was performed using it as a template. By comparing the complete genome sequences of 15 other SPV2 sequences from the NCBI database, the primers were designed to amplify 5 overlapping segments of the complete genome (Table 1).
2.3 5′ RACE and Complete Genome Amplification
The 5′ UTR sequence of SPV2-SDYT and SPV2-JSXZ were amplified using 5′ RACE. For 5′ RACE, the first strand of cDNA was prepared using M-MLV (H-) Reverse Transcriptase (Vazyme Biotech). The specific RNAs in cDNA were removed by RNase H and RNase A (TaKara Biotech, San Jose, CA, USA). After purification by M5 Gel Extraction kit (Mei5 Biotech), add complementary homopolymeric tails to cDNA with Terminal Deoxynucleotidyl Transferase (TaKara Biotech). Two rounds of PCR amplification were performed, with SPV2-441-R and Oliga-dT/dG as primers for the first round and SPV2-320-R and Anchor-primer as primers for the second round (Table 1). PCR products were purified and ligated into the pMD18-T vector (TaKara Biotech). The complete genome sequences of SPV2-SDYT and SPV2-JSXZ was obtained via sequence assembly after sequencing.
2.4.1 Sequence and Consistency Analysis
To obtain the complete genome, sequence fragments of SPV2-SDYT and SPV2-JSXZ were assembled using ApE-A plasmid editor v2.0.45 and SnapGene 6.0.2 software. The complete genome sequences of 15 other SPV2 sequences obtained from the NCBI database were aligned together with SPV2-SDYT and SPV2-JSXZ complete genome sequences at the nucleotide and amino acid levels using SnapGene 6.0.2 software. The 5′ UTR, 3′ UTR and ORF sequences of SPV2-SDYT and SPV2-JSXZ and 15 other SPV2 sequences were figured out using ApE-A plasmid editor v2.0.45 software and used for one-to-one alignment with SnapGene 6.0.2 software. The P1, HC-Pro, P3, 6K1, CI, 6K2, VPg, NIa-Pro, NIb, and CP sequences of SPV2-SDYT and SPV2-JSXZ were determined by comparison with other SPV2 sequences known protein sequences and used for one-to-one alignment with SnapGene 6.0.2 software.
Phylogenetic tree was generated using the Neighbor-Joining method, with the No. of Bootstrap Replications set to 1000 and everything else left. The genetic distance was calculated with the pairwise method in MEGA11.
2.4.3 Codon Usage Bias Analysis
GC content of SPV2-SDYT and SPV2-JSXZ was calculated using online EMBOSS software. RSCU values were calculated with MEGA11 software. The RSCU value was higher than 1 if the codon was more preferred and utilised more frequently during gene expression. The RSCU value was 1 if the codon was used without preference. The RSCU value was less than 1 if the codon was low preferred and utilised less frequently during gene expression.
The complete genome sequence alignment used for the recombination analysis was conducted with MEGA11 software. Recombination analysis was performed using seven algorithms, including RDP, CENECONV, BOOTSCAN, MAXCHI, CHIMAERA, SISCAN and 3SEQ in the RDP4 software and everything else left. Recombination existed on the basis of support for more than 6 kinds of algorithms, otherwise, no recombination existed on the basis of support for less than 6 kinds of algorithms [23,24].
2.4.5 Selection Pressure Analysis
For selection pressure analysis, the codon selection pressure of 10 proteins in 17 SPV2 isolates were calculated with SLAC in the online Datamonkey software (http://www.datamonkey.org). The dN/dS values were used to analyze the selection pressure. dN/dS value greater than 1 was indicated positive selection, dN/dS value equal to 1 was indicated neutral selection, and dN/dS value less than 1 was indicated negative selection.
3.1 5′ RACE of SPV2-SDYT and SPV2-JSXZ
The 5′ end sequences of SPV2-SDYT and SPV2-JSXZ were obtained via 5′ RACE, with a second round of PCR amplification using the anchor primer and SPV2-320-R (Fig. 1A,B). SPV2-SDYT (5′-AAATTAACAAAACTCAATACAACAACAGAAGAATCAAGCAAACAAAAACAAACTCACGTTTTCA AAGTCTTTGAAGTTTACAATTCTCA-3′) and SPV2-JSXZ (5′-AAATTAACAAAACTCAATACAACAA CAGAAGAATCAAGCAAACAAAAACAAACTCACGTTTTCAAAGTCTTTGAAGTTTACAATTCTCA-3′) are shown in Fig. 1A,B, respectively. Identical 5′ UTR sequences were observed in both isolates (Fig. 1A,B).
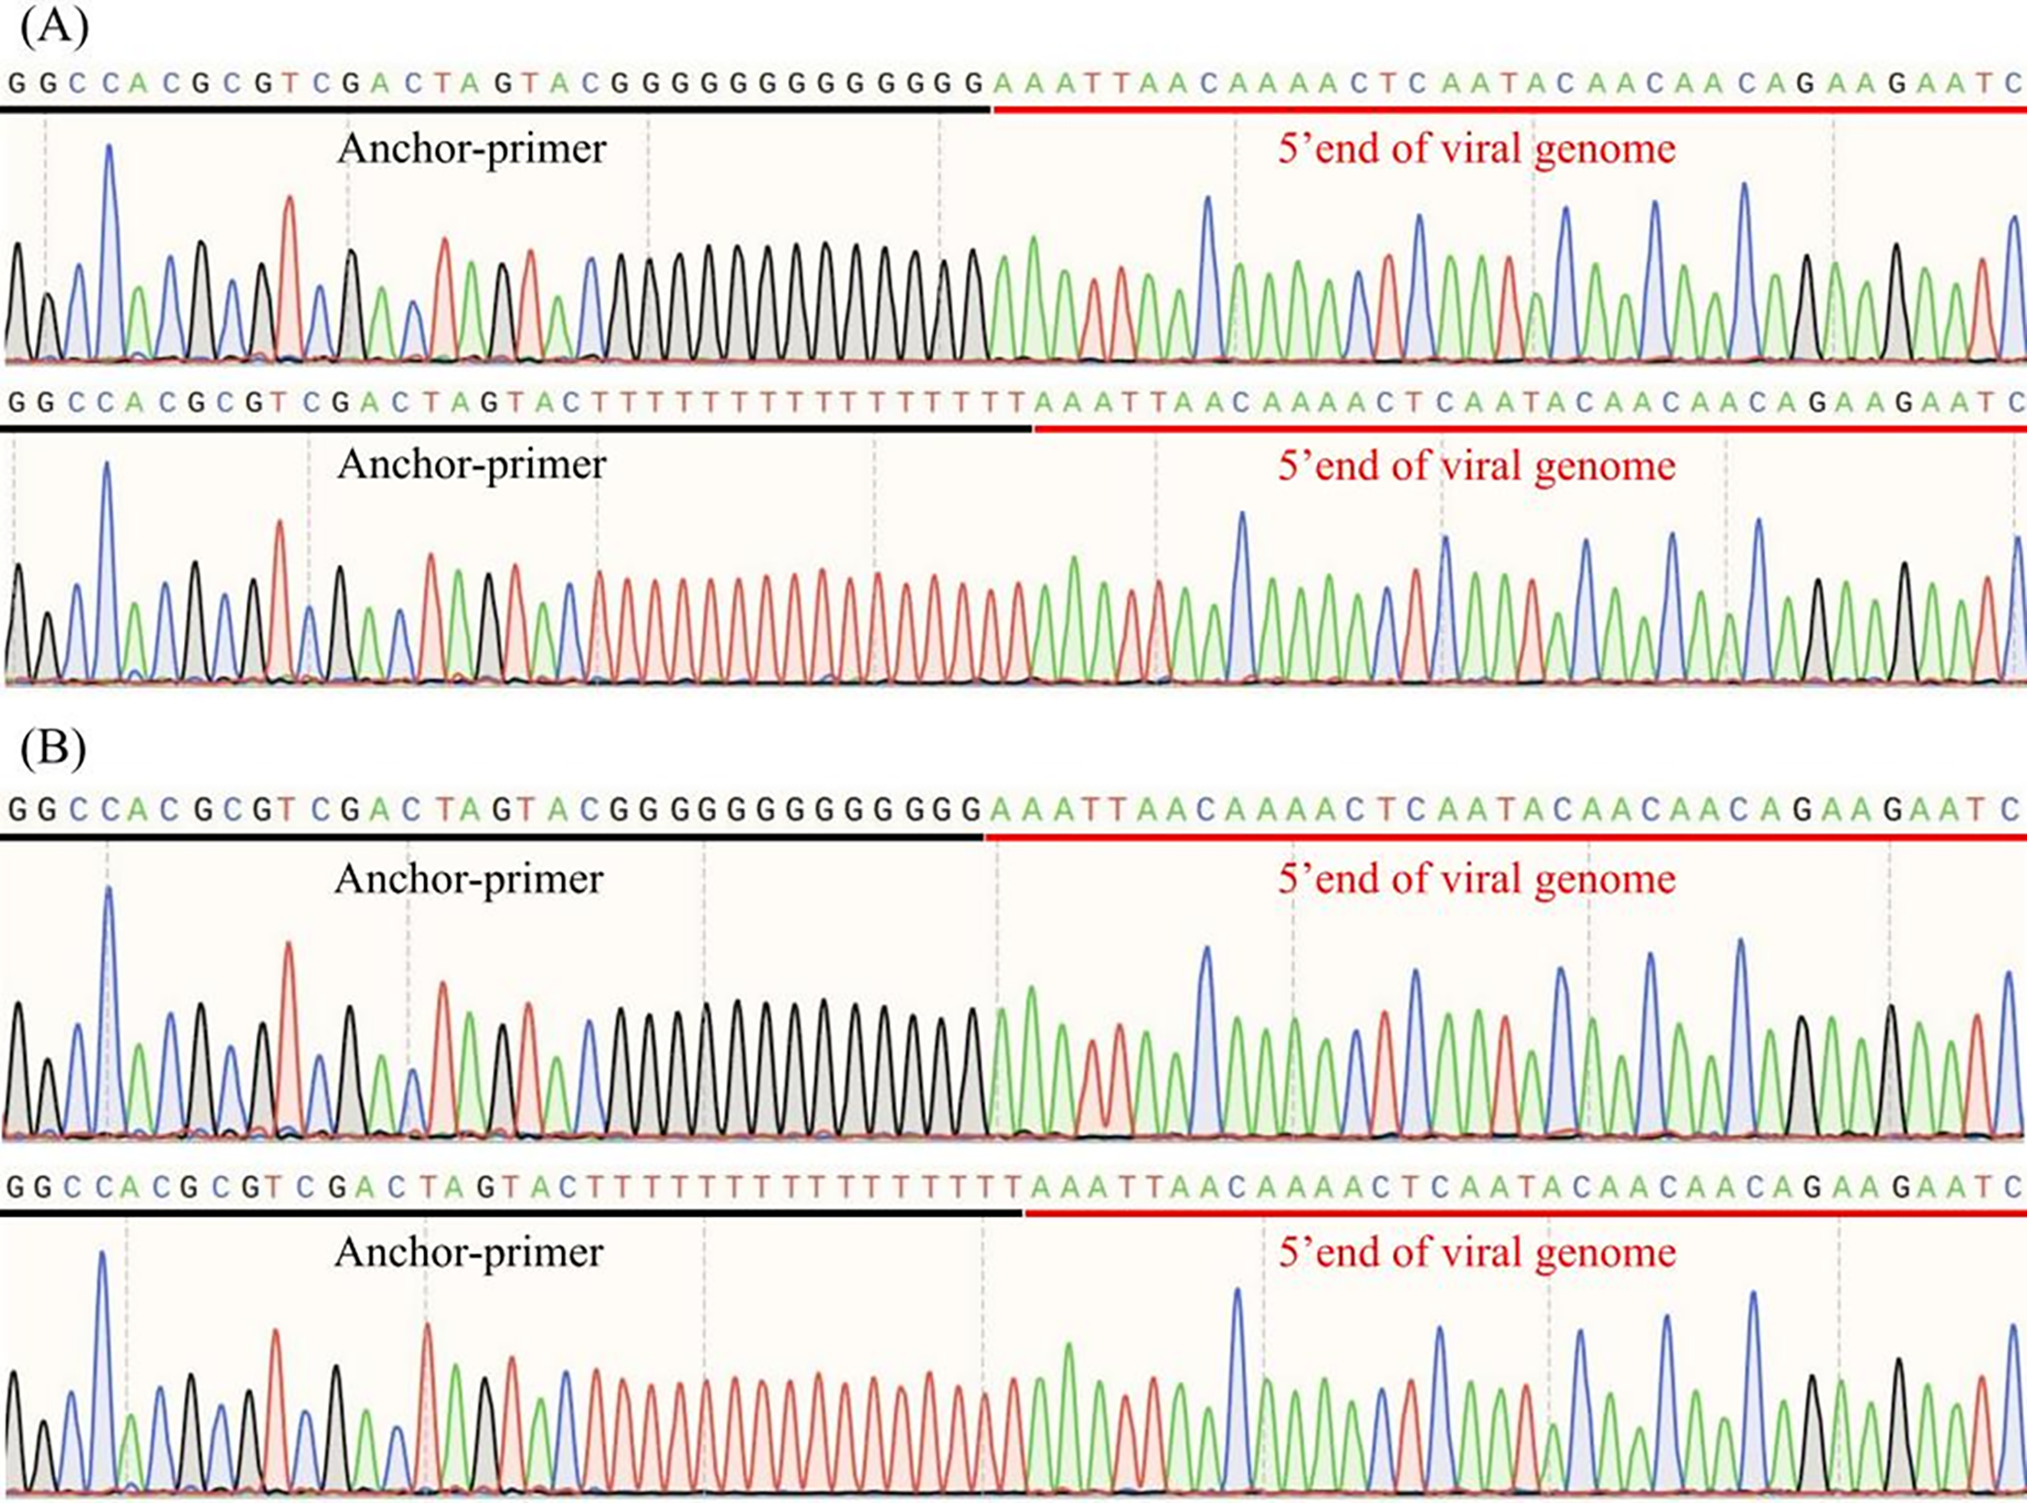
Figure 1: 5′ RACE analysis of SPV2-SDYT and SPV2-JSXZ. (A) Anchor-primer and 5′ end of viral genome sequences of SPV2-SDYT; (B) Anchor-primer and 5′ end of viral genome sequences of SPV2-JSXZ
3.2 Consistency Analysis of SPV2-SDYT and SPV2-JSXZ with 15 SPV2 Isolates
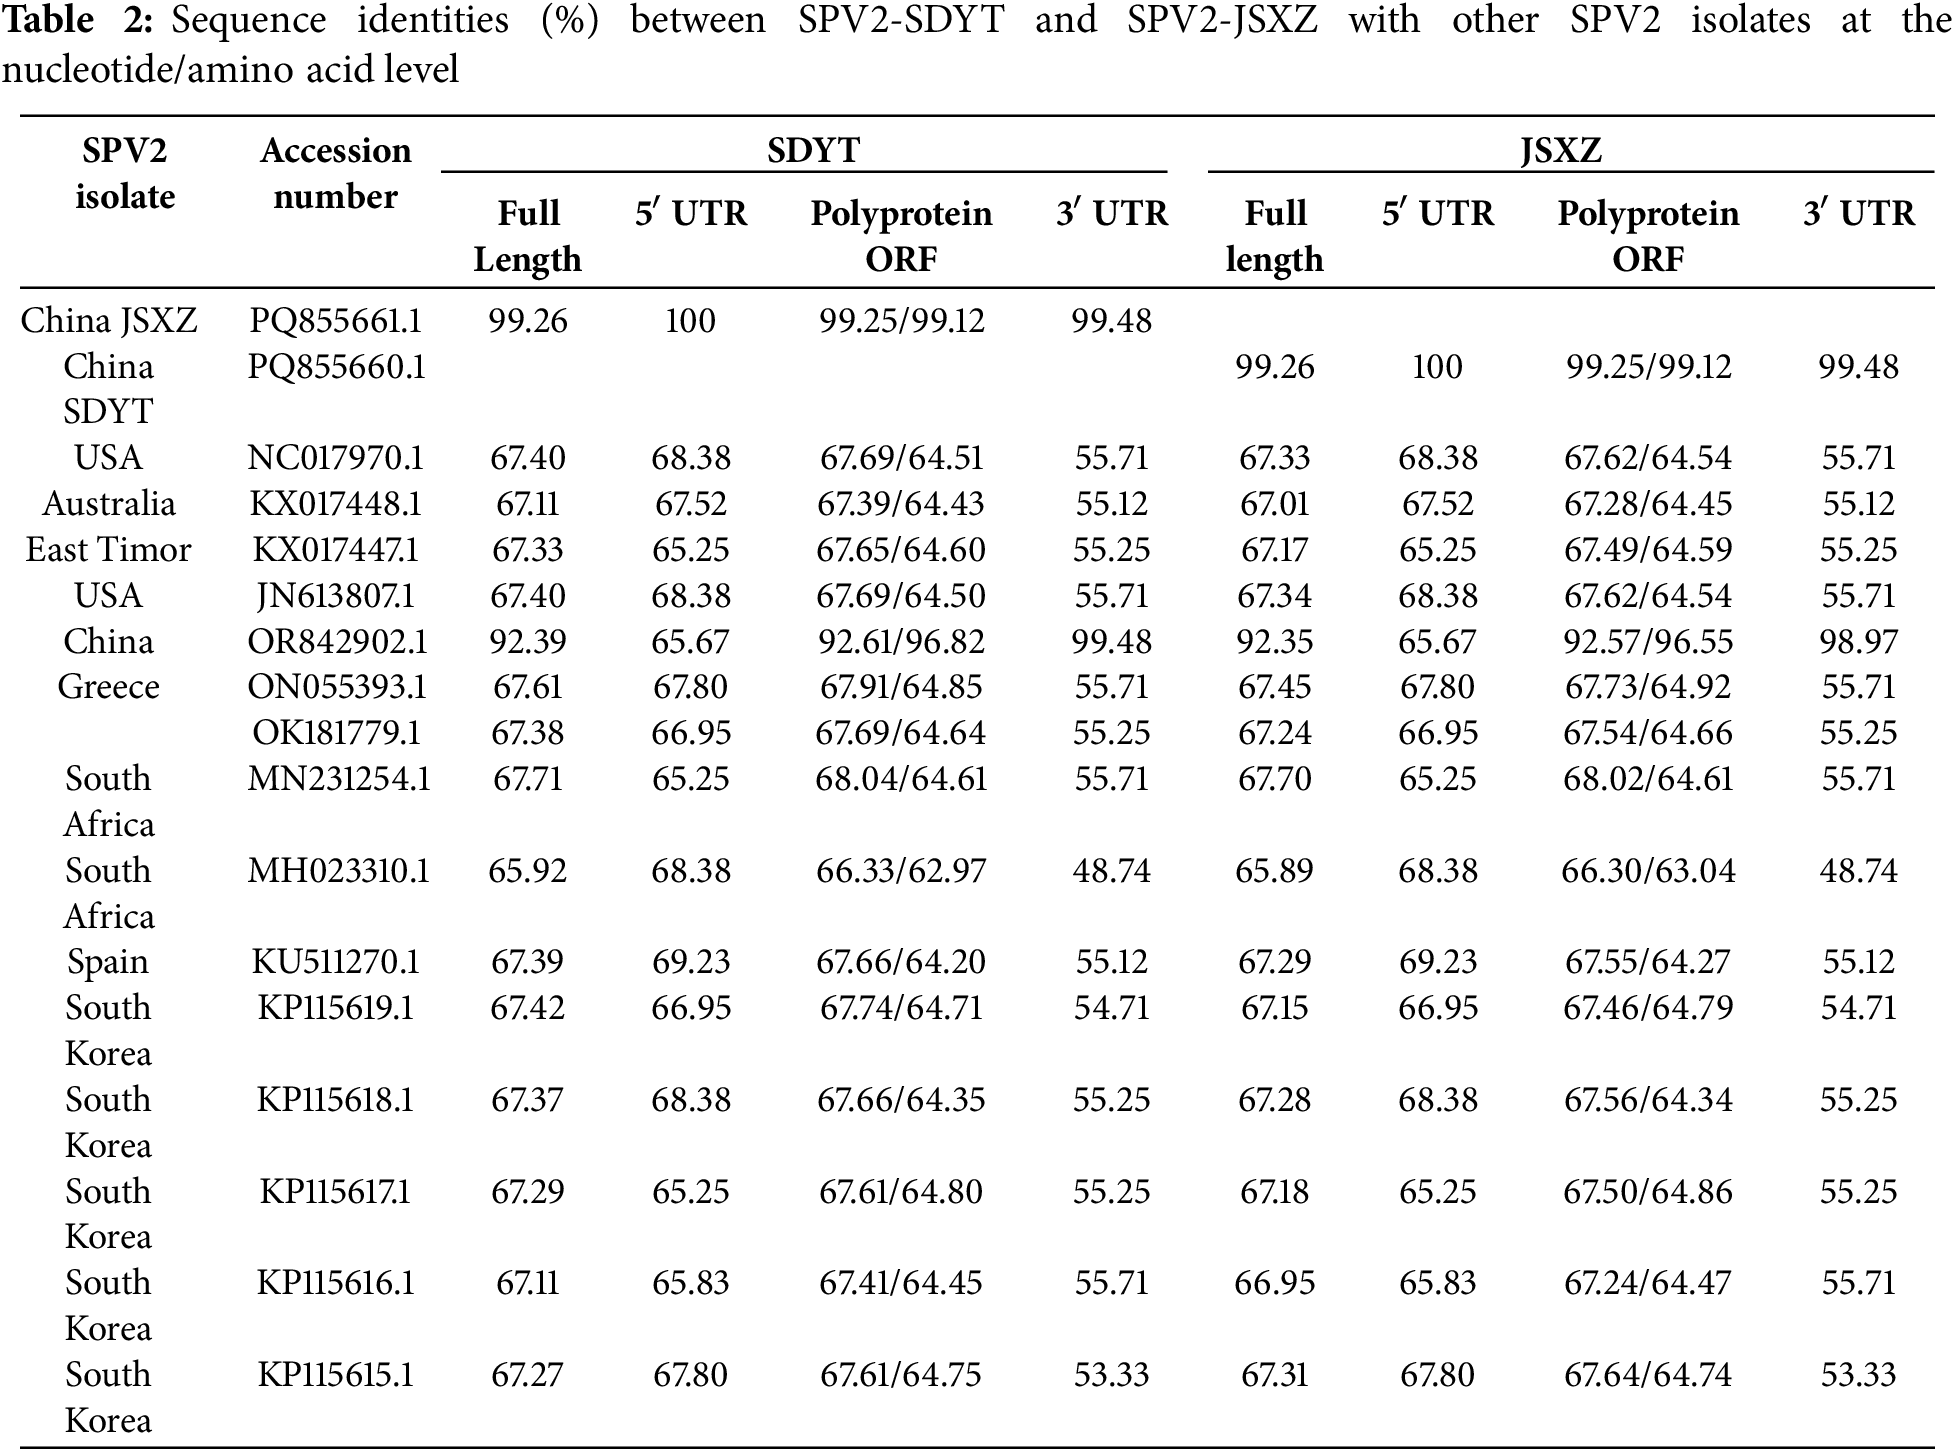
The sequence identities of SPV2-SDYT and SPV2-JSXZ with 15 other SPV2 isolates were analyzed at both the nucleotide and amino acid levels. The nucleotide and amino acid sequence identities of the ORFs of SPV2-SDYT and SPV2-JSXZ were 99.25% and 99.12%, respectively (Table 2). The complete genome sequence identities of SPV2-SDYT and SPV2-JSXZ with the other 15 SPV2 isolates ranged from 65.92% to 92.39% and 65.89% to 92.35%, respectively. The nucleotide sequence identities of the ORFs of SPV2-SDYT and SPV2-JSXZ with these 15 isolates were between 66.33% and 92.61% and 66.30% and 92.57%, respectively. For the amino acid sequence identities of the ORFs, SPV2-SDYT and SPV2-JSXZ showed similarities of 62.97%–96.82% and 63.04%–96.55%, respectively, with the other 15 isolates. The 5′ UTR sequence identities of SPV2-SDYT and SPV2-JSXZ with the other 15 isolates were both in the range of 65.25%–69.23%. The 3′ UTR sequence identities for SPV2-SDYT and SPV2-JSXZ showed similarities of 48.74%–99.48% and 48.74%–98.97%, respectively, with the other 15 isolates. Except for the 5′ UTR sequence, both SPV2-SDYT and SPV2-JSXZ showed the highest sequence identity with SPV2-LN (GenBank No. OR842902.1) and the lowest sequence identity with SSBles-74 ZA (GenBank No.MH023310.1). The maximum variation in the above results was observed in the 3′ UTR, indicating the presence of mutation hotspots in this region.
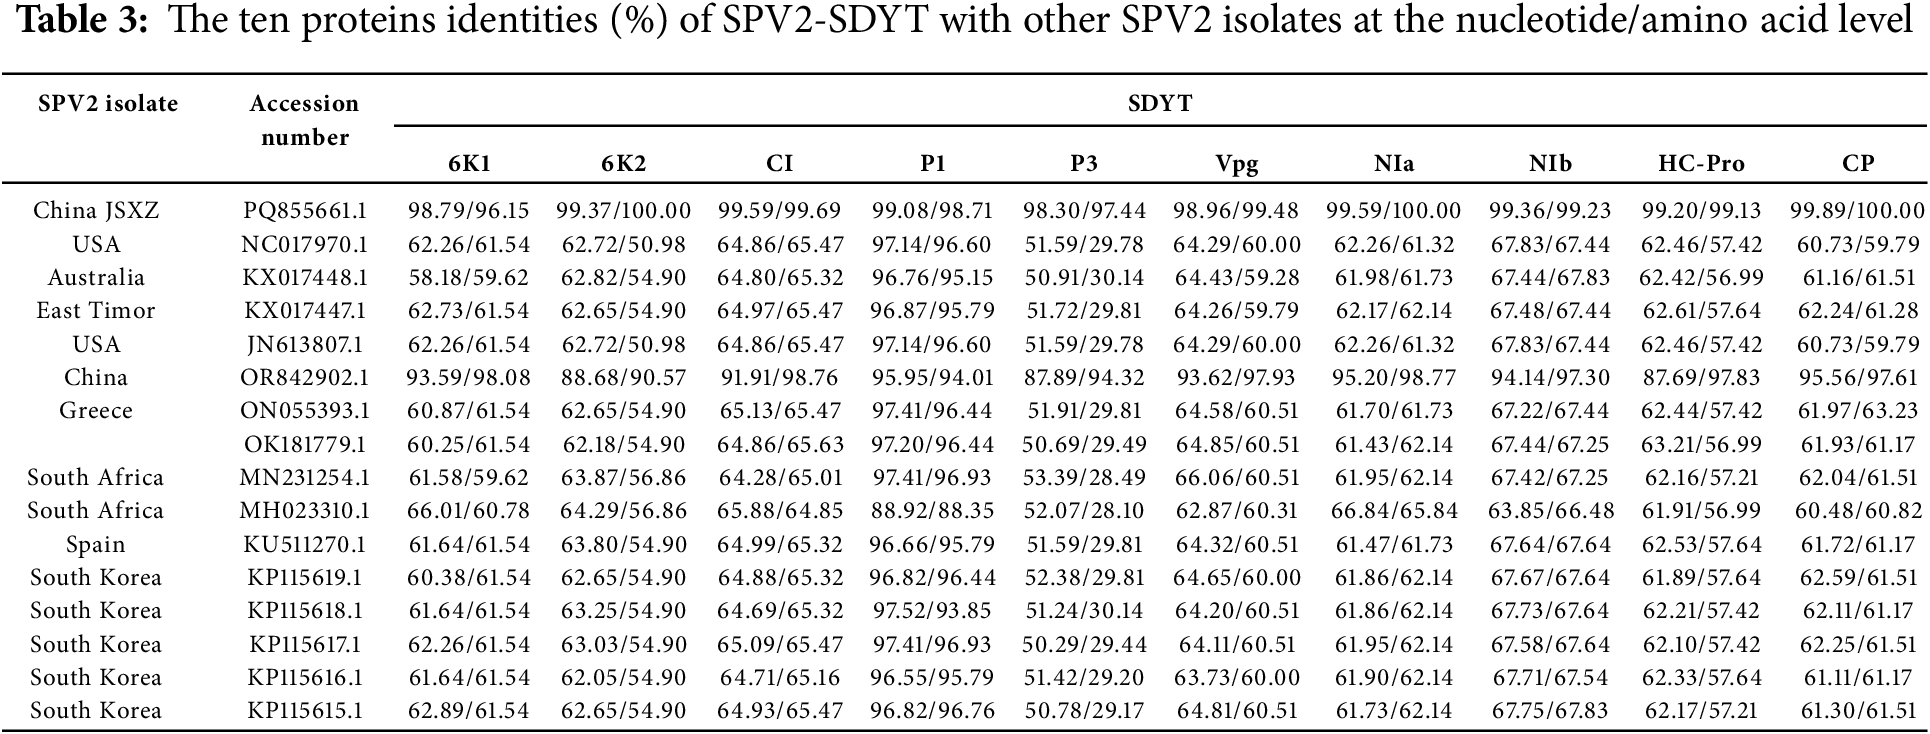
Ten proteins of SPV2-SDYT and SPV2-JSXZ along with 15 other SPV2 isolates were analyzed at both the nucleotide and amino acid levels. The nucleotide and amino acid identities of SPV2-SDYT with the 16 other SPV2 isolates were as follows (Table 3): 6K1: 58.18%–98.79% and 59.62%–98.08%, respectively; 6K2: 62.05%–99.37% and 50.98–100.00%, respectively; CI: 64.28%–99.59% and 64.85%–99.69%, respectively; P1: 88.92%–99.08% and 88.35%–98.71%, respectively; P3: 50.29%–98.30% and 28.10%–97.44%, respectively; Vpg: 62.87%–98.96% and 59.28%–99.48%, respectively; NIa: 61.43%–99.59% and 61.32%–100.00%, respectively; NIb: 63.85%–99.36% and 66.48%–99.23%, respectively; HC-Pro: 61.89%–99.20% and 56.99%–99.13%, respectively; CP: 60.48%–99.89% and 59.79%–100.00%, respectively.
Similarly, SPV2-JSXZ showed the following ranges of identity with the same isolates (Table 4): 6K1: 57.14%–98.79% and 61.54%–96.15%, respectively; 6K2: 59.26%–99.37% and 50.98%–100.00%, respectively; CI: 64.31%–99.59% and 64.70%–99.69%, respectively; P1: 88.92%–99.08% and 88.67%–98.71%, respectively; P3: 49.96%–98.30% and 28.37%–97.44%, respectively; VPg: 63.34%–98.96% and 59.28%–99.48%, respectively; NIa: 61.31%–99.59% and 61.32%–100.00%, respectively; NIb: 63.81%–99.36% and 66.41%–99.23%, respectively; HC-Pro: 61.95%–99.20% and 56.55%–99.13%, respectively; CP: 60.48%–99.89% and 59.79%–100.00%, respectively.
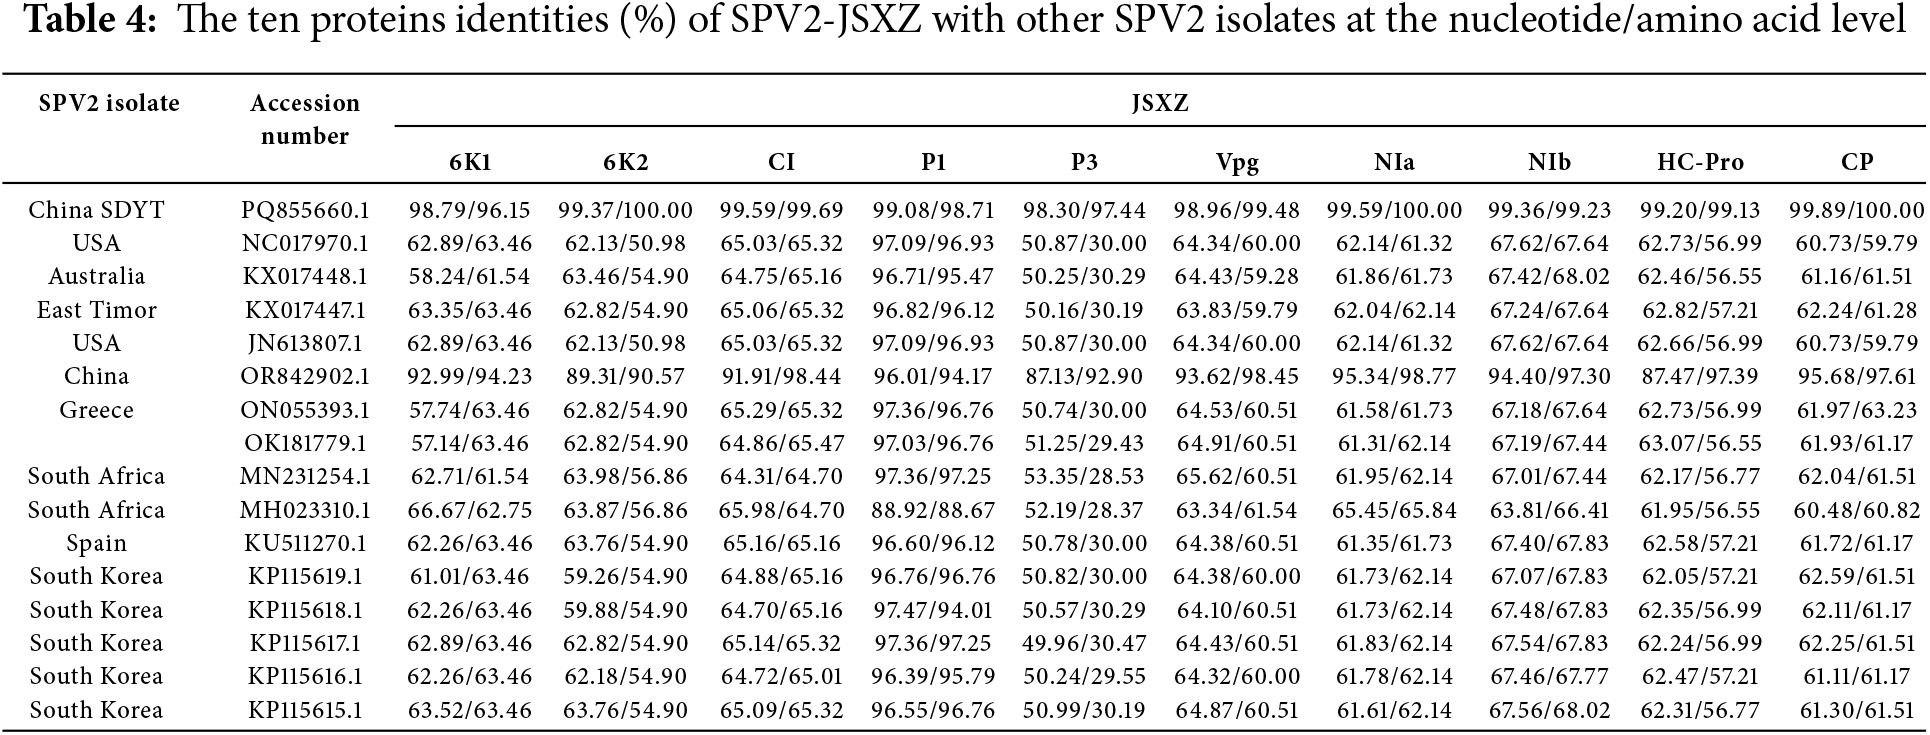
In both SPV2-SDYT and SPV2-JSXZ, the P1 protein showed the highest levels of identity, while the P3 protein exhibited the lowest.
3.3 Phylogenetic and Genetic Distance Analysis
To clarify the phylogenetic relationship between SPV2-SDYT and SPV2-JSXZ and the other 15 reported SPV2 strains, a phylogenetic tree was constructed using the NJ method in MEGA11 (Fig. 2). The results showed that the samples clustered into two groups. The first group included the United States (GenBank No. NC_017970.1, GenBank No. JN613807.1), Australia (GenBank No. KX017448.1), Spain (GenBank No. KU511270.1), Greece (GenBank No. ON055393.1), Korea (GenBank No. KP115619.1, GenBank No. KP115618.1, GenBank No. KP115617.1, GenBank No. KP115616.1, GenBank No. KP115615.1), Timor-Leste (GenBank No. KX017447.1), and South African isolates (GenBank No. MN231254.1, GenBank No. MH023310.1). Fourteen isolates were included in this study. Of these, the South African isolate (GenBank No. MH023310.1) was far from the others, indicating that it was distantly related to the other isolates in this group. The second group included SPV2-SDYT (GenBank No. PQ855660), SPV2-JSXZ (GenBank No. PQ855661), and SPV2-LN (GenBank No. OR842902.1), indicating that the three Chinese isolates were distantly related to the 14 isolates from other countries and that SPV2 evolution may have been geographically influenced.
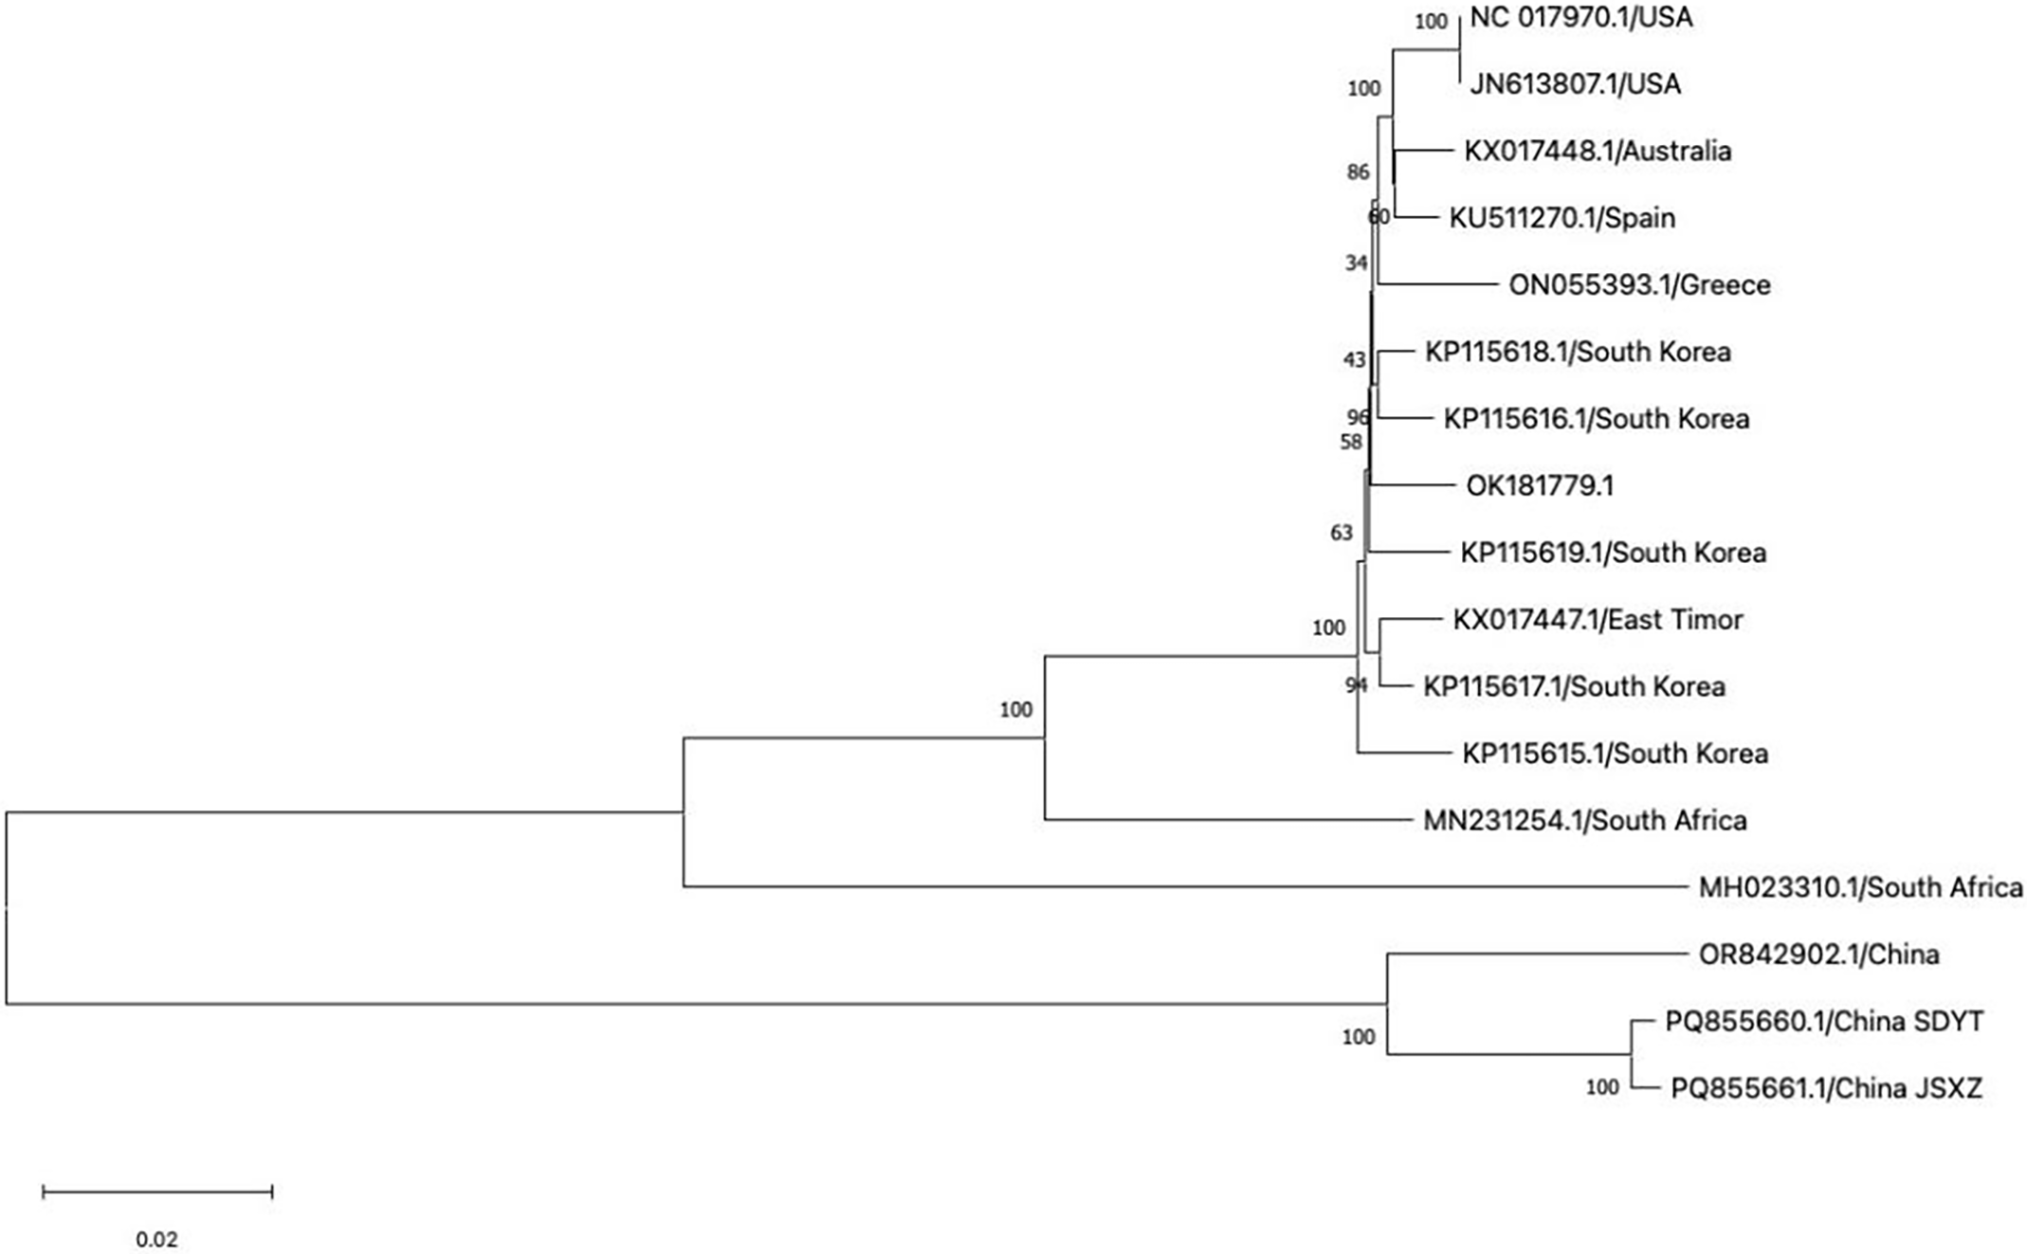
Figure 2: Phylogenetic tree of the 17 SPV2 isolates from different countries. The bootstrap value is 1000. The scale bar stands for a genetic distance of 0.020
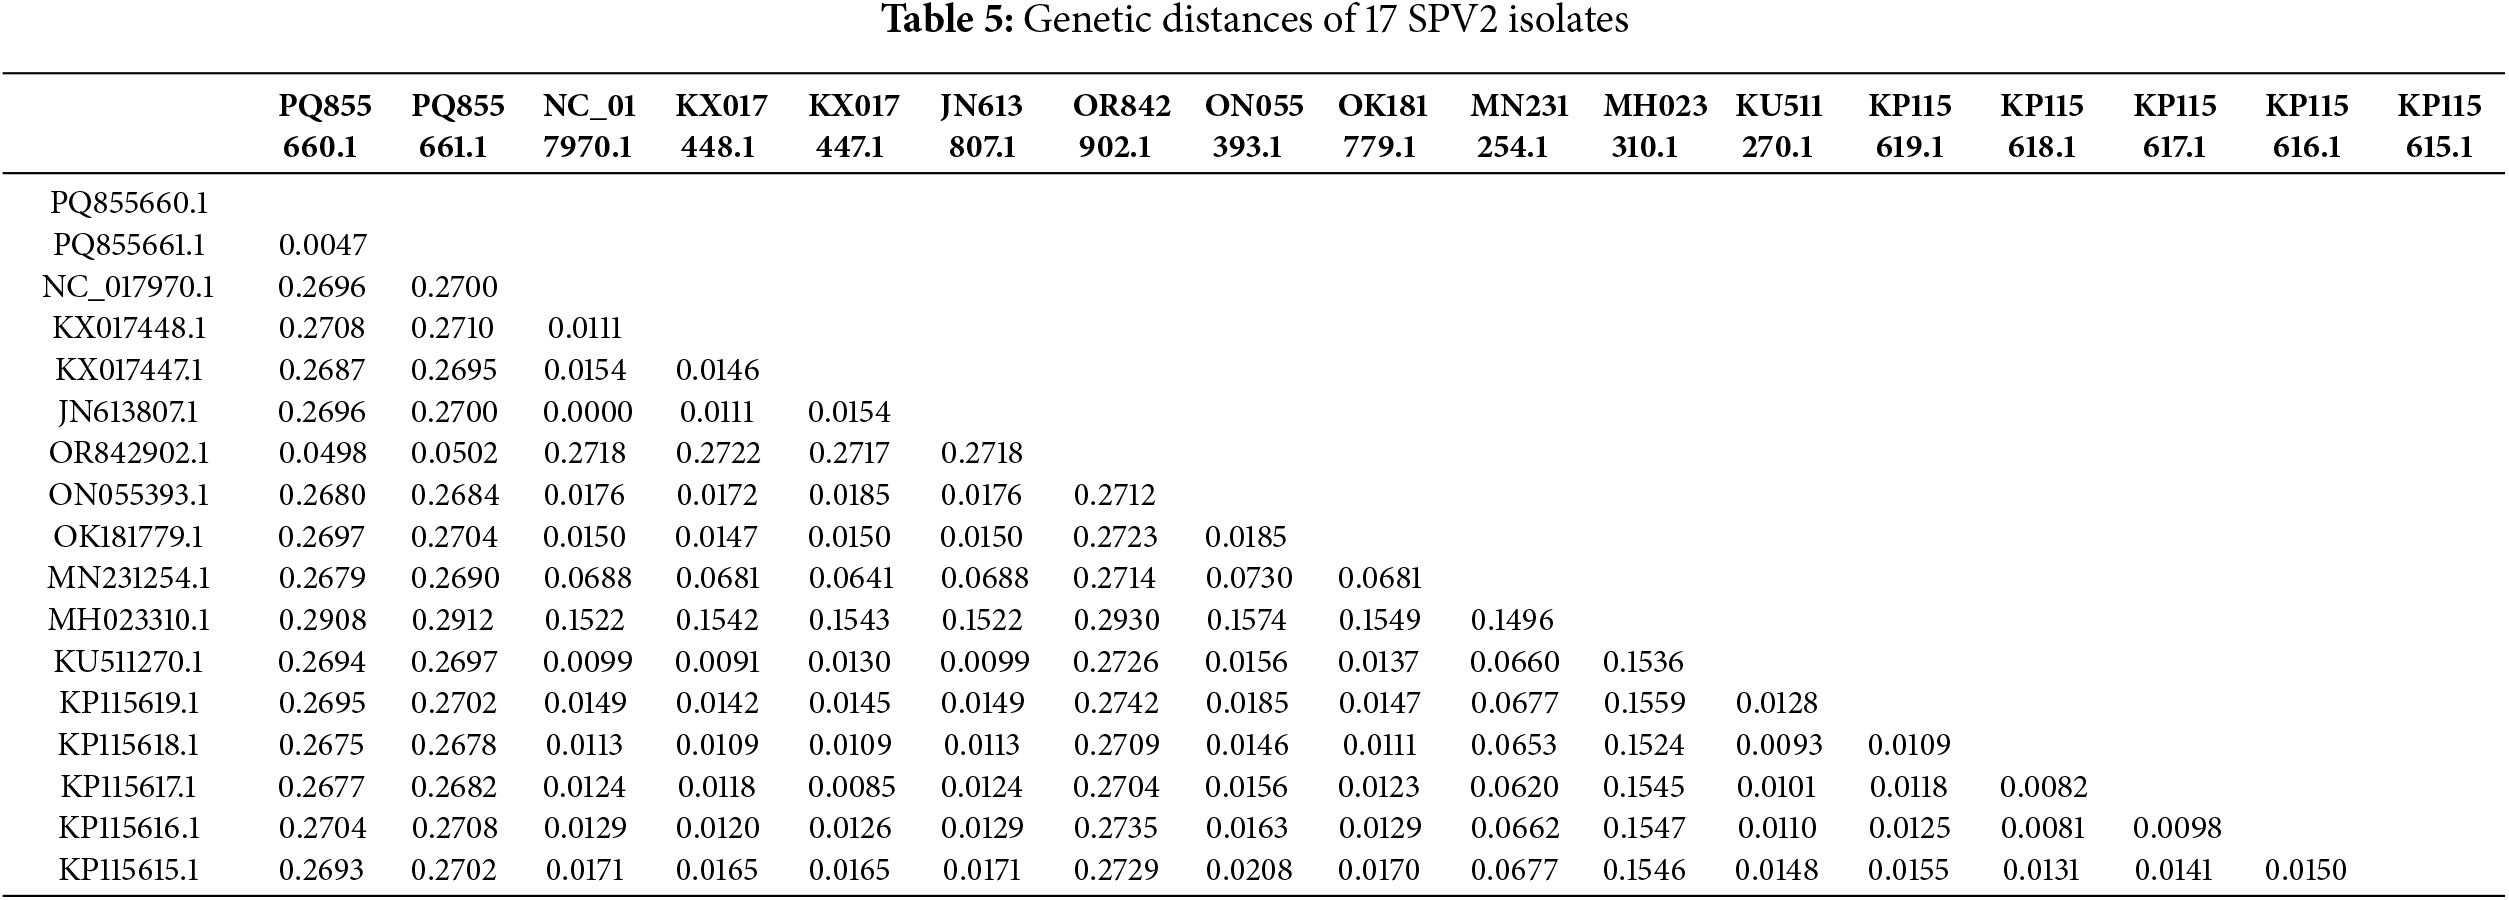
To further clarify the degree of genetic variation in the 17 SPV2 isolates that had been reported so far by NCBI, including SPV2-SDYT and SPV2-JSXZ, genetic distance was calculated using the pairwise method in MEGA11 (Table 5). The results showed that the genetic distances of SPV2-SDYT and SPV2-JSXZ from SPV2-LN (GenBank No. OR842902.1) were the lowest, with values of 0.0498 and 0.0502, respectively, whereas their genetic distance from SSBles-74 ZA (GenBank No. MH023310.1) was the highest, with values of 0.2908 and 0.2912, respectively. The Fst values of the 17 SPV2 isolates were greater than 0.25, except for that of SPV2-LN (GenBank No. OR842902.1), indicating a significant degree of genetic differentiation among SPV2 populations. These results are consistent with those of the phylogenetic tree analysis, indicating that geography may be an important factor influencing the genetic evolution of SPV2.
3.4 Codon Preference in SPV2-SDYT and SPV2-JSXZ
Codon usage bias analysis was performed to explore the preferences of SPV2-SDYT and SPV2-JSXZ for different codons during translation. Relative synonymous codon usage (RSCU) values were calculated using the MEGA11 software. The results showed that the RSCU values of SPV2-SDYT and SPV2-JXSZ were similar, with the most and least abundant amino acids being leucine (Leu: 8.8%) and tryptophan (Trp: 1.2%), respectively (Fig. 3A,B). The first, second, and third codon GC contents (GC1, GC2, and GC3, respectively) in SPV2-SDYT were 50.79%, 36.75%, and 42.94%, respectively. The first, second, and third codon GC contents (GC1, GC2, and GC3, respectively) in SPV2-JSXZ were 50.70%, 36.69%, and 42.99%, respectively. The frequency of the third codon GC content in SPV2-SDYT and SPV2-JSXZ was lower than that in A/U, indicating that the codon terminal bases were mainly A/U. It can be inferred that the codon preference of the two isolates was greatly affected by the pressure of natural selection. There were 26 codons with RSCU values greater than 1 and 35 codons with values less than 1 in SPV2-SDYT. There were 27 codons with RSCU values greater than 1 and 34 codons with values less than 1 in SPV2-JSXZ. There were fewer codons with RSCU values greater than 1 than with values less than 1, indicating that the overall codon usage bias was relatively weak for SPV2-SDYT and SPV2-JSXZ.
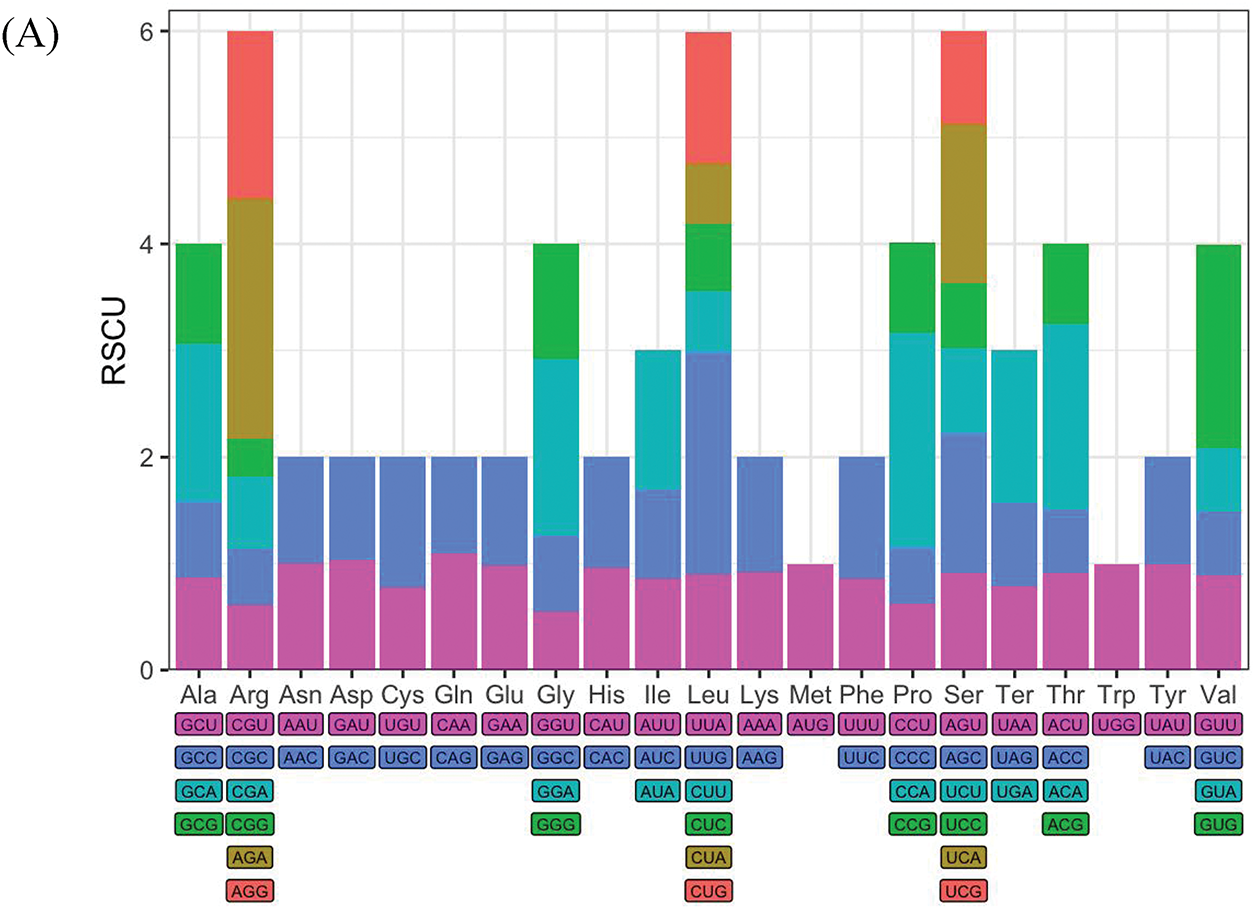
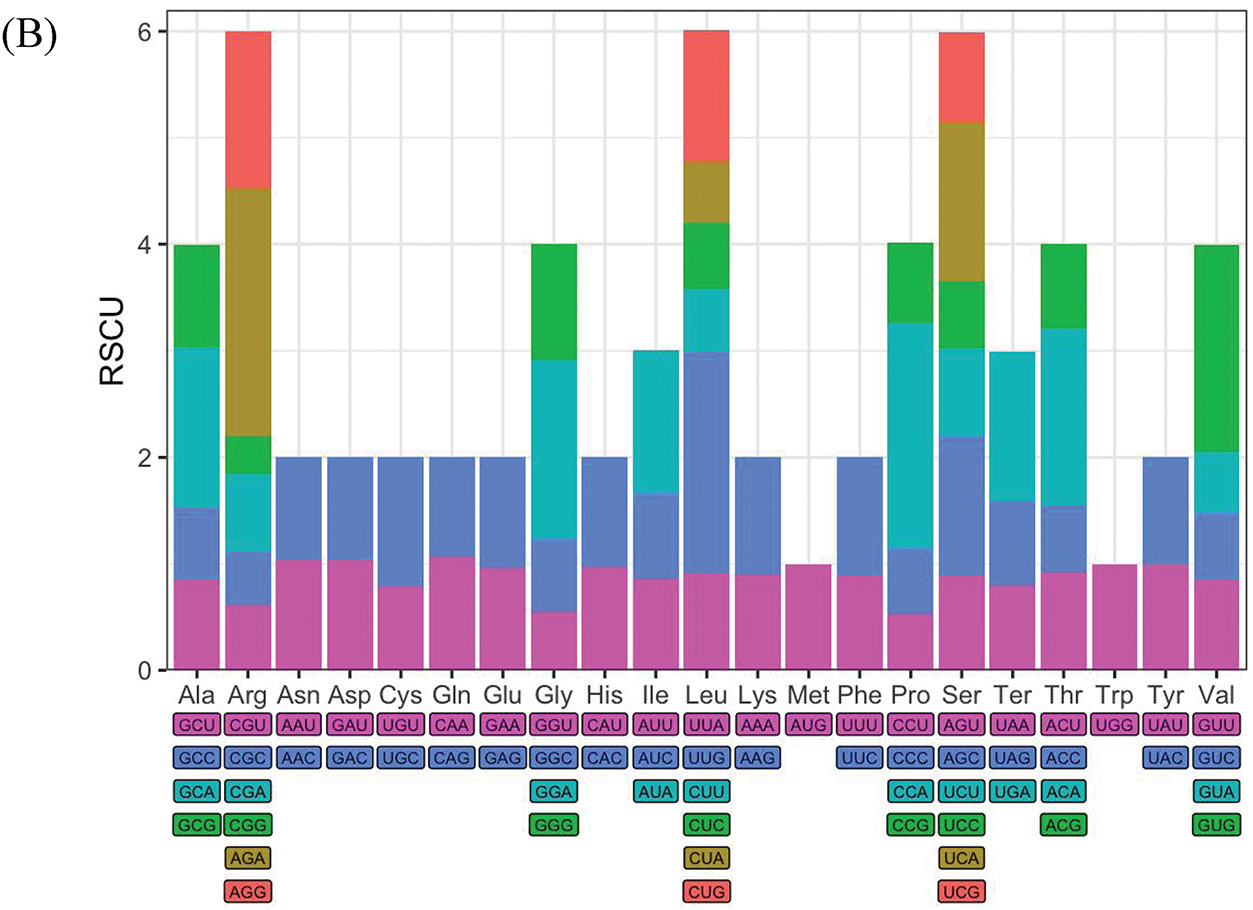
Figure 3: Condon preference analysis. (A) The RSCU value of codons in SPV2-SDYT; (B) The RSCU value of codons in SPV2-JSXZ. RSCU value greater than 1 means that the codon is relatively frequently used
We further performed recombination analysis using RDP4 and identified six recombination sites in 17 SPV2 isolates, with three recombination sites found in the South African isolate (GenBank No. MH023310.1), one recombination site found in the South African isolate (GenBank No. MN231254.1), and two recombination sites found in the Greek isolate (GenBank No. ON055393.1) (Table 6). Among the six recombination sites, four were supported by seven types of algorithms and two were supported by six types of algorithms, with SSBles-74 ZA (GenBank No. MH023310.1), which showed the most recombination sites and covered the complete genome, implying an increase in genetic diversity (Fig. 4).
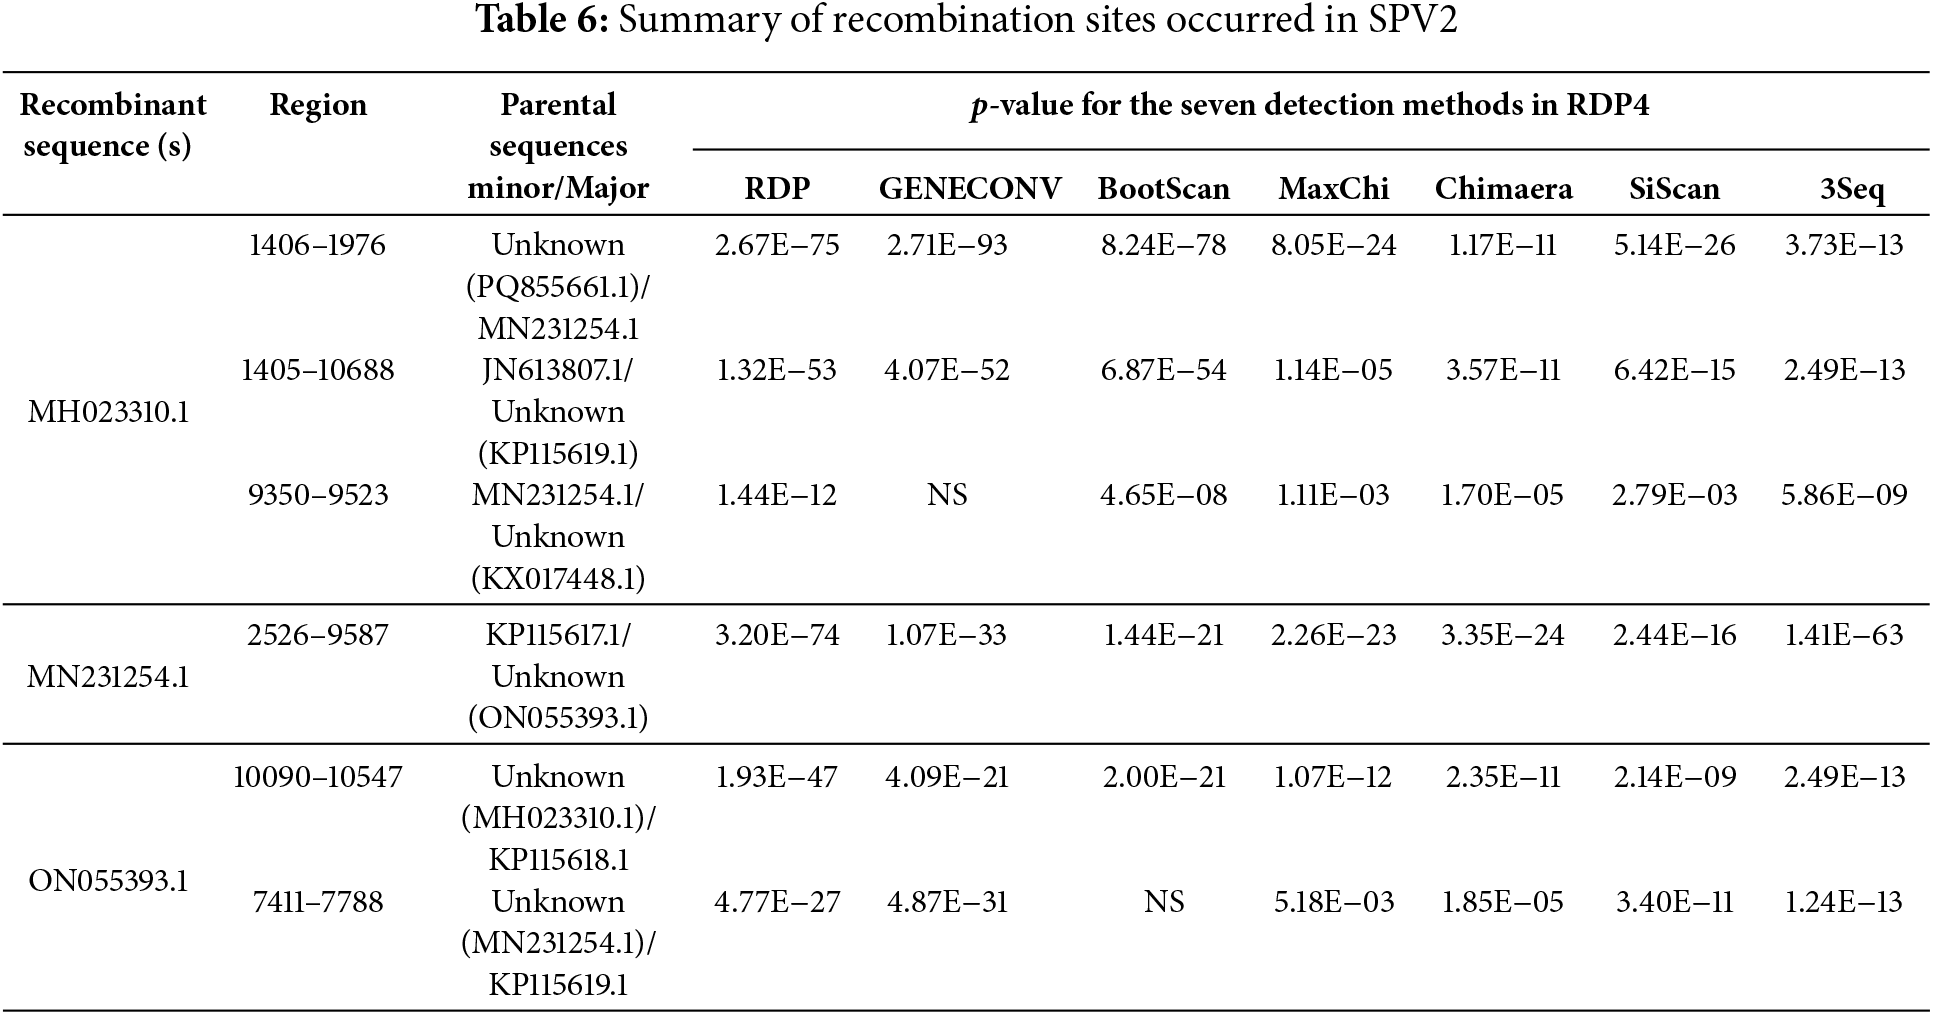
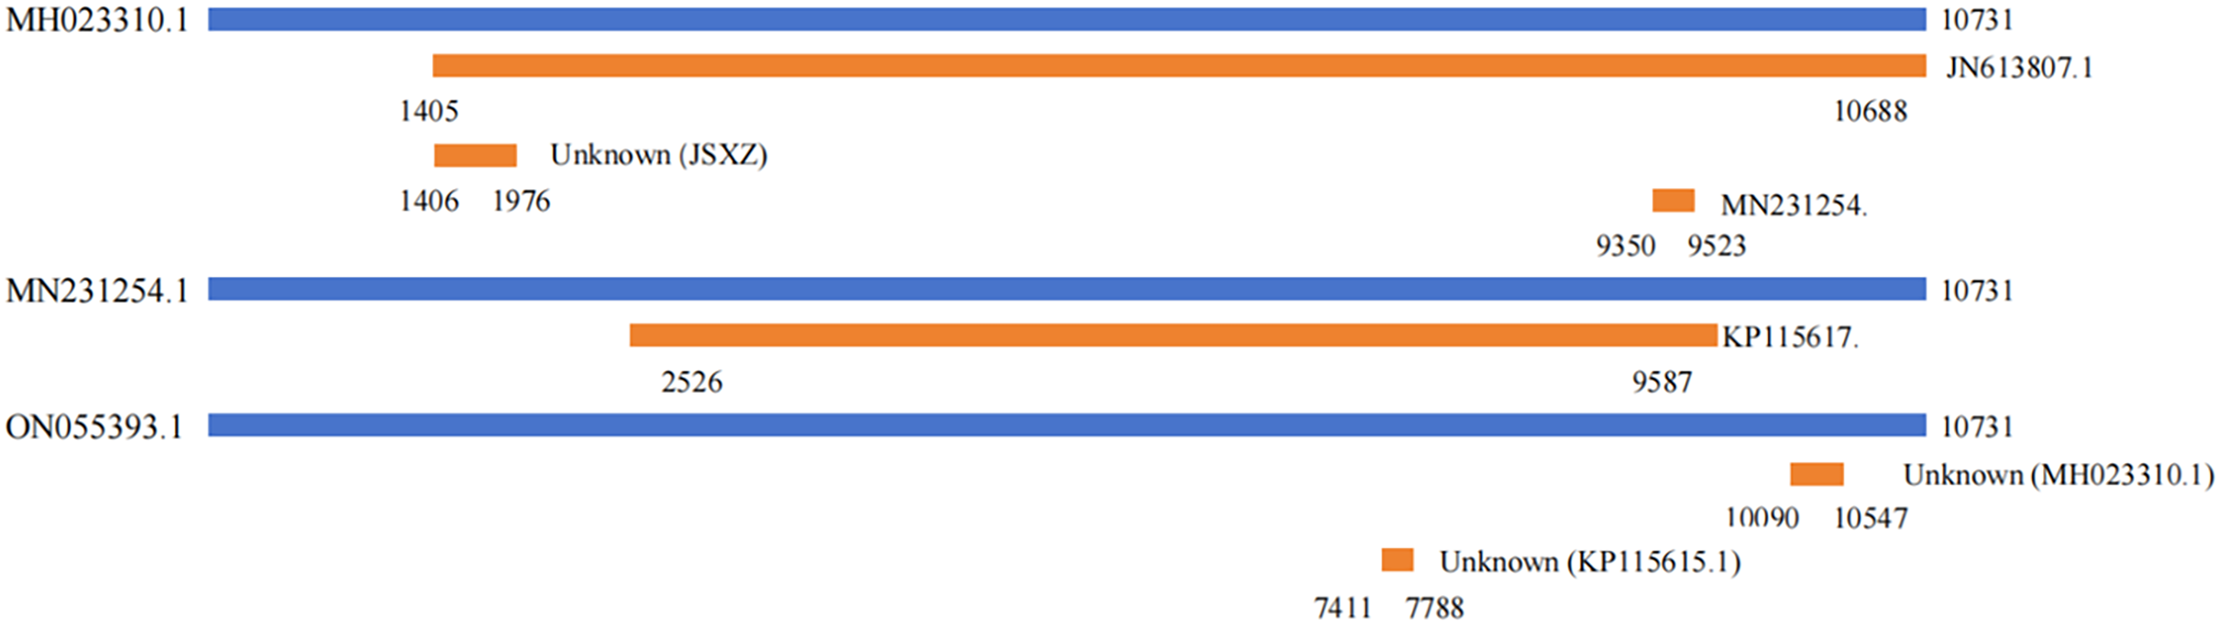
Figure 4: Recombinant analysis of SPV2 complete genomic sequence
3.6 Selection Pressure Analysis
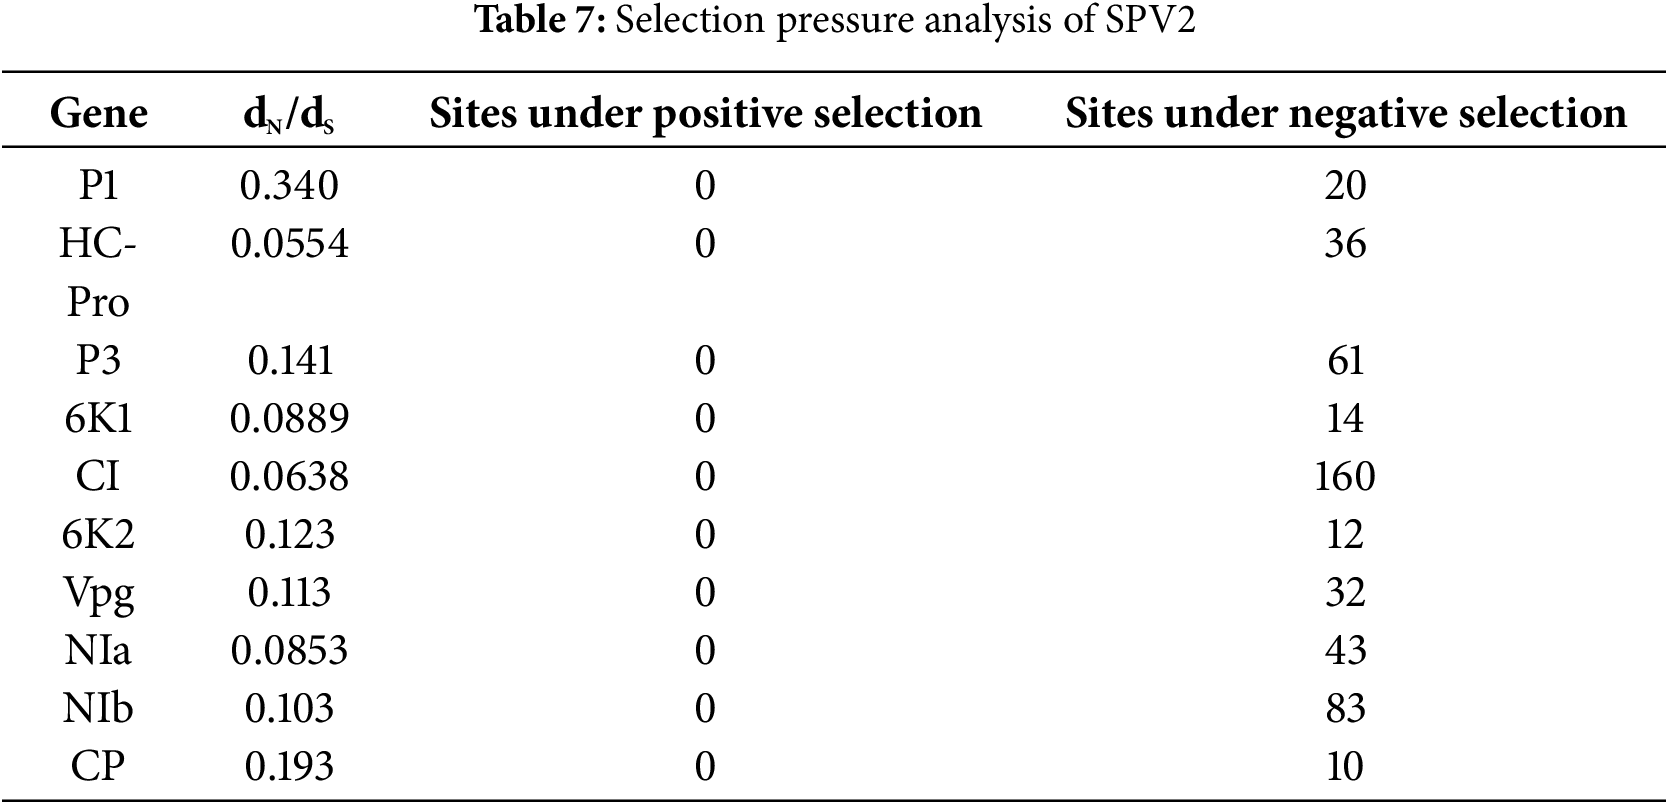
To analyze the selection pressure of SPV2 during the evolutionary process, dN/dS values were calculated for 10 proteins, including P1, HC-Pro, P3, 6K1, CI, 6K2, Vpg, NIa, NIb, and CP, in SPV2 isolates using the online Datamonkey software. The results showed that the dN/dS values of all SPV2 proteins were less than 1, and none had negative selection sites. The highest number of negative selection sites was observed in the CI protein (160 sites), whereas the lowest number of negative selection sites was observed in the CP protein (10 sites) (Table 7). The purifying selection pressure was unevenly distributed across the complete genome, with the strongest purifying selection observed in HC-Pro (dN/dS = 0.0554) and the weakest in P1 (dN/dS = 0.340) (Table 7). These findings indicate that negative selection plays a crucial role in the evolution of SPV2.
SPV2 is widespread in China, and mixed infections with other viruses can have a serious impact on the development of the sweet potato industry and cause severe economic losses worldwide. In this study, we obtained the complete genome sequences of SPV2-SDYT and SPV2-JSXZ using 5′ RACE and RT-PCR amplification and analyzed the structural characteristics and phylogenetic relationships of the SPV2 genome by aligning sequence identities, measuring genetic distances, and constructing phylogenetic evolutionary trees (Figs. 1A,B and 2). Genome size may differ within the same species owing to various factors, such as gene duplication and the environment [25]. The complete genome sequences of the 17 SPV2 isolates ranged from 10,561 to 10,732 nt, with SPV2-SDYT and SPV2-JSXZ being 10,561 nt in length. According to the phylogenetic tree, geoenvironmental factors strongly influenced the results. We found that one group contained three Chinese isolates and the other contained isolates from other countries. Among the isolates from other countries, the South African isolate was distantly related, whereas the isolates from the United States, Australia, Spain, Greece, Korea, and East Timor were closely related (Fig. 2). This may be related to the high genetic diversity of the SPV2 strains. The appearance of SPV2-SDYT and SPV2-JSXZ not only enriched the SPV2 Chinese isolates and showed interspecific evolution but also provided a scientific basis for understanding the origin and evolution of viruses.
Codon usage bias can be affected by various factors, including GC content, gene size and location, tRNA abundance and interactions, gene recombination rates, mutations, natural selection, and mRNA folding. As high tRNA abundance is better able to participate in translation and improve translation efficiency, most highly expressed genes tend to use codons with high tRNA abundance [26]. We observed that codon preference was closely related to tRNA abundance and interactions in SPV2-SDYT and SPV2-JSXZ (Fig. 3A,B). GC content is another important factor that influences codon preference. Codons containing G and C were mostly found in genomes with high GC content, whereas those containing A and U were mostly found in genomes with low GC content [27]. The frequency of codon GC content in SPV2-SDYT and SPV2-JSXZ was lower than that in A/U, suggesting that the preferred codons in the genome were mainly A/U. The codon with the largest RSCU in SPV2-SDYT and SPV2-JSXZ was AGA, at 2.25 and 2.33, respectively.
Recombination plays a crucial role in the evolution of viral genomes by enhancing genetic diversity and facilitating the emergence of new viruses. It also serves as a valuable tool for vaccine development and gene therapy [28]. Six recombination events were observed in SSBles-74 ZA, SPV2, and SPV2-SP1, indicating that recombination was not the main driving force for SPV2 evolution (Table 6) (Fig. 4).
Selection pressure is a driving force of biological evolution. The nonsynonymous substitution rate (dN) can result in amino acid changes, whereas the synonymous substitution rate (dS) cannot [29]. The direction and rate of gene evolution, identification of functionally important genes, and functional divergence of genes are affected by dN/dS values [30,31]. We observed that the dN/dS values for all SPV2 proteins were less than 1, indicating that negative selection had occurred (Table 7). Negative selection pressure may reduce variation, suggesting that SPV2 has evolved to retain only mutations that are favorable for survival. Our observations also indicated that negative selection may be the main driving force of SPV2.
In this study, complete genomic sequences of SPV2 isolates from the Shandong and Jiangsu provinces in China were obtained using 5′ RACE and RT-PCR amplification. To the best of our knowledge, this is the first report of the complete genome sequence of sweet potatoes from China. Consistency, phylogeny, codon usage bias, recombination, and selection pressure analyses indicated that they were closely related to the SPV2 isolate from China (SPV2-LN). The complete genome sequence identities of SPV2-SDYT and SPV2-JSXZ with the SPV2 isolate from China (SPV2-LN) were 92.39% and 92.35%, respectively. The three Chinese isolates belonged to the same group in the phylogenetic tree, and geographic factors affected the evolution of SPV2. High-frequency codons in the genomes were predominantly found to end with A/U. Recombination was not the main driver of SPV2 evolution, negative selection may have been the main driver. SPV2 can infest sweet potatoes singly and cause mild symptoms, whereas the synergism of sweet potatoes with other sweet potato viruses can cause severe symptoms and greater economic losses.
Acknowledgement: We are grateful for the critical reading by Prof. Nianwei Qiu at Qufu Normal University.
Funding Statement: This work was funded by the National Natural Science Foundation of China (32100132), Shandong Province Natural Sciences Foundation of China (ZR2021QC008), ‘Youth Innovation Team Program’ in College of Shandong Province of China (2022KJ119), and supported by Young Talent of Lifting Engineering for Science and Technology in Shandong, China (SDAST2024QT085).
Author Contributions: Zichen Li: Investigation, methodology, resources, writing—original draft. Jukui Ma: Conceptualization, formal analysis, supervision. Minjun Liu: methodology, validation. Guowei Geng: Conceptualization, methodology, validation, formal analysis, investigation, writing—original draft, writing—review & editing, visualization, funding acquisition. Hongxia Zhang: Conceptualization, methodology, resources, writing—original draft, writing—review & editing, supervision, project administration. All authors reviewed the results and approved the final version of the manuscript.
Availability of Data and Materials: The authors confirm that the data supporting the findings of this study are available within the article.
Ethics Approval: Not applicable.
Conflicts of Interest: The authors declare no conflicts of interest to report regarding the present study.
References
1. Bovell-Benjamin AC. Sweet potato: a review of its past, present, and future role in human nutrition. Adv Food Nutr Res. 2007;52(9):1–59. doi:10.1016/S1043-4526(06)52001-7. [Google Scholar] [PubMed] [CrossRef]
2. Behera S, Chauhan VBS, Pati K, Bansode V, Nedunchezhiyan M, Verma AK, et al. Biology and biotechnological aspect of sweet potato (Ipomoea batatas L.a commercially important tuber crop. Planta. 2022;256(2):40. doi:10.1007/s00425-022-03938-8. [Google Scholar] [PubMed] [CrossRef]
3. Yang Y, Chen Y, Bo Y, Liu Q, Zhai H. Research progress in the mechanisms of resistance to biotic stress in sweet potato. Genes. 2023;14(11):2106. doi:10.3390/genes14112106. [Google Scholar] [PubMed] [CrossRef]
4. Kokkinos CD, Clark CA, Mcgregor CE. The effect of sweet potato virus disease and its viral components on gene expression levels in sweetpotato. J Am Soc Hortic Sci. 2006;131(5):657–66. doi:10.1007/978-3-540-38918-76602. [Google Scholar] [CrossRef]
5. Jones RAC. Global plant virus disease pandemics and epidemics. Plants. 2021;10(2):233. doi:10.3390/plants10020233. [Google Scholar] [PubMed] [CrossRef]
6. Wei KJ, Jiang AM, Jiang S, Huang YJ, Jiang SY, Su XL, et al. New isolate of sweet potato virus 2 from Ipomoea nil: molecular characterization, codon usage bias, and phylogenetic analysis based on complete genome. Virol J. 2024;21(1):222. doi:10.1186/s12985-024-02500-0. [Google Scholar] [PubMed] [CrossRef]
7. Liu H, Zhao F, Qiao Q, Zhang D, Wang Y, Wang S, et al. Complete genome sequence of a divergent sweet potato chlorotic stunt virus isolate infecting Calystegia hederacea in China. Arch Virol. 2021;166(7):2037–40. doi:10.1007/s00705-021-05076-0. [Google Scholar] [PubMed] [CrossRef]
8. Mukasa SB, Rubaihayo PR, Valkonen JPT. Interactions between a crinivirus, an ipomovirus and a potyvirus in coinfected sweetpotato plants. J Plant Pathol. 2010;55(3):458–67. doi:10.1111/j.1365-3059.2006.01350.x. [Google Scholar] [CrossRef]
9. Untiveros M, Fuentes S, Salazar LF. Synergistic interaction of sweet potato chlorotic stunt virus (Crinivirus) with Carla-, Cucumo-, Ipomo-, and potyviruses infecting sweet potato. Plant Dis. 2007;91(6):669–76. doi:10.1094/PDIS-91-6-0669. [Google Scholar] [PubMed] [CrossRef]
10. Chase O, Javed A, Byrne MJ, Thuenemann EC, Lomonossoff GP, Ranson NA, et al. CryoEM and stability analysis of virus-like particles of potyvirus and ipomovirus infecting a common host. Commun Biol. 2023;6(1):433. doi:10.1038/s42003-023-04799-x. [Google Scholar] [PubMed] [CrossRef]
11. Clark CA, Davis JA, Abad JA, Cuellar WJ, Fuentes S, Kreuze JF, et al. Sweetpotato viruses: 15 years of progress on understanding and managing complex diseases. Plant Dis. 2012;96(2):168–85. doi:10.1094/PDIS-07-11-0550. [Google Scholar] [PubMed] [CrossRef]
12. Bednarek R, David M, Fuentes S, Kreuze J, Fei Z. Transcriptome analysis provides insights into the responses of sweet potato to sweet potato virus disease (SPVD). Virus Res. 2021;295:198293. doi:10.1016/j.virusres.2020.198293. [Google Scholar] [PubMed] [CrossRef]
13. Wang S, Liu ST, Qiao Q, Zhang DS, Qin YH, Zhang ZC. Methodology for identification of disease resistance of sweet potato cultivars to sweet potato virus disease and yield loss estimation. J Plant Prot. 2014;41(2):176–81. doi:10.13802/j.cnki.zwbhxb.2014.02.009. [Google Scholar] [CrossRef]
14. Zhang ZC, Qiao Q, Qin YH, Zhang DS, Tian YT. First evidence for occurrence of sweet potato virus disease (SPVD) caused by dual infection of Sweet potato feathery mottle virus and Sweet potato chlorotic stunt virus in China. Acta Phytopathol Sinica. 2012;42(3):328–33. doi:10.13926/j.cnki.apps.2012.03.014. [Google Scholar] [CrossRef]
15. Trenado HP, Lozano G, Valverde RA, Navas-Castillo J. First report of sweet potato virus G and sweet potato virus 2 infecting sweet potato in Spain. J Plant Disease. 2010;91(12):1687–7. doi:10.1094/PDIS-91-12-1687C. [Google Scholar] [PubMed] [CrossRef]
16. Tairo F, Jones RAC, Valkonen JPT. Potyvirus complexes in sweetpotato: occurrence in Australia, serological and molecular resolution, and analysis of the sweet potato virus 2 (SPV2) component. Plant Dis. 2006;90(9):1120–8. doi:10.1094/PD-90-1120. [Google Scholar] [PubMed] [CrossRef]
17. Kwak HR, Kim J, Kim MK, Seo JK, Jung MN, Kim JS, et al. Molecular characterization of five potyviruses infecting korean sweet potatoes based on analyses of complete genome sequences. Plant Pathol J. 2015;31(4):388–401. doi:10.5423/PPJ.OA.04.2015.0072. [Google Scholar] [PubMed] [CrossRef]
18. Qin Y, Zhang Z, Qiao Q, Zhang D, Tian Y, Wang Y. Molecular variability of sweet potato chlorotic stunt virus (SPCSV) and five potyviruses infecting sweet potato in China. Arch Virol. 2013;158(2):491–5. doi:10.1007/s00705-012-1503-8. [Google Scholar] [PubMed] [CrossRef]
19. Urcuqui-Inchima S, Haenni AL, Bernardi F. Potyvirus proteins: a wealth of functions. Virus Res. 2001;74(1–2):157–75. doi:10.1016/s0168-1702(01)00220-9. [Google Scholar] [PubMed] [CrossRef]
20. Miao R, Ye Z, MacFarlane S, Li Y, Mao Q, Tian Y, et al. The P3N-PIPO protein encoded by wheat yellow mosaic virus is a pathogenicity determinant and promotes its pathogenicity through interaction with NbRLK6 in nicotiana benthamiana. Viruses. 2022;14(10):2171. doi:10.3390/v14102171. [Google Scholar] [PubMed] [CrossRef]
21. Rodamilans B, Valli A, Mingot A, San León D, López-Moya JJ, García JA. An atypical RNA silencing suppression strategy provides a snapshot of the evolution of sweet potato-infecting potyviruses. Sci Rep. 2018;8(1):15937. doi:10.1038/s41598-018-34358-y. [Google Scholar] [PubMed] [CrossRef]
22. Li F, Xu D, Abad J, Li R. Phylogenetic relationships of closely related potyviruses infecting sweet potato determined by genomic characterization of Sweet potato virus G and Sweet potato virus 2. Virus Genes. 2012;45(1):118–25. doi:10.1007/s11262-012-0749-2. [Google Scholar] [PubMed] [CrossRef]
23. Martin DP, Lemey P, Posada D. Analysing recombination in nucleotide sequences. Mol Ecol Resour. 2011;11(6):943–55. doi:10.1111/j.1755-0998.2011.03026.x. [Google Scholar] [PubMed] [CrossRef]
24. Maag JLV. gganatogram: an R package for modular visualisation of anatograms and tissues based on ggplot2. F1000Research. 2018;7:1576. doi:10.12688/f1000research.16409.2. [Google Scholar] [PubMed] [CrossRef]
25. Faizullah L, Morton JA, Hersch-Green EI, Walczyk AM, Leitch AR, Leitch IJ. Exploring environmental selection on genome size in angiosperms. Trends Plant Sci. 2021;26(10):1039–49. doi:10.1016/j.tplants.2021.06.001. [Google Scholar] [PubMed] [CrossRef]
26. Wan XF, Xu D, Kleinhofs A, Zhou J. Quantitative relationship between synonymous codon usage bias and GC composition across unicellular genomes. BMC Evol Biol. 2004;4(1):19. doi:10.1186/1471-2148-4-19. [Google Scholar] [PubMed] [CrossRef]
27. Parvathy ST, Udayasuriyan V, Bhadana V. Codon usage bias. Mol Biol Rep. 2022;49(1):539–65. doi:10.1007/s11033-021-06749-4. [Google Scholar] [PubMed] [CrossRef]
28. Stedman KM. Viral recombination: ecology, evolution, and pathogenesis. Viruses. 2018;10(7):358. doi:10.3390/v10070358. [Google Scholar] [PubMed] [CrossRef]
29. Shen X, Song S, Li C, Zhang J. Synonymous mutations in representative yeast genes are mostly strongly non-neutral. Nature. 2022;606(7915):725–31. doi:10.1038/s41586-022-04823-w. [Google Scholar] [PubMed] [CrossRef]
30. Mugal CF, Wolf JBW, Kaj I. Why time matters: codon evolution and the temporal dynamics of dN/dS. Mol Biol Evol. 2014;31(1):212–31. doi:10.1093/molbev/mst192. [Google Scholar] [PubMed] [CrossRef]
31. Spielman SJ, Wilke CO. The relationship between dN/dS and scaled selection coefficients. Mol Biol Evol. 2015;32(4):1097–108. doi:10.1093/molbev/msv003. [Google Scholar] [PubMed] [CrossRef]
Cite This Article
 Copyright © 2025 The Author(s). Published by Tech Science Press.
This work is licensed under a Creative Commons Attribution 4.0 International License , which permits unrestricted use, distribution, and reproduction in any medium, provided the original work is properly cited.
 Downloads
 Citation Tools