
 Submit a Paper
 Propose a Special lssue
 Open Access
ARTICLE

Optimizing Nitrogen Rate and Biostimulant Application to Improve Onion (Allium cepa L.) Yield and Nutrient Use Efficiency
1 Faculty of Agriculture, University of Novi Sad, Dositej Obradović Square 8, Novi Sad, 21000, Serbia
2 Department of Vegetable Sciences and Floriculture, Mendel University in Brno, Lednice, 69144, Czech Republic
3 Institute of Field and Vegetable Crops, National Institute of the Republic of Serbia, Novi Sad, 21000, Serbia
4 Faculty of Agriculture, University of Belgrade, Belgrade, 11080, Serbia
* Corresponding Author: Jelena Popović-Đorđević. Email:
(This article belongs to the Special Issue: Optimizing Crops Production: Agronomic, Chemical and AI-assisted Approaches)
Phyton-International Journal of Experimental Botany 2025, 94(7), 1997-2013. https://doi.org/10.32604/phyton.2025.065535
Received 15 March 2025; Accepted 05 June 2025; Issue published 31 July 2025
 View Full Text
 Download PDF
Abstract
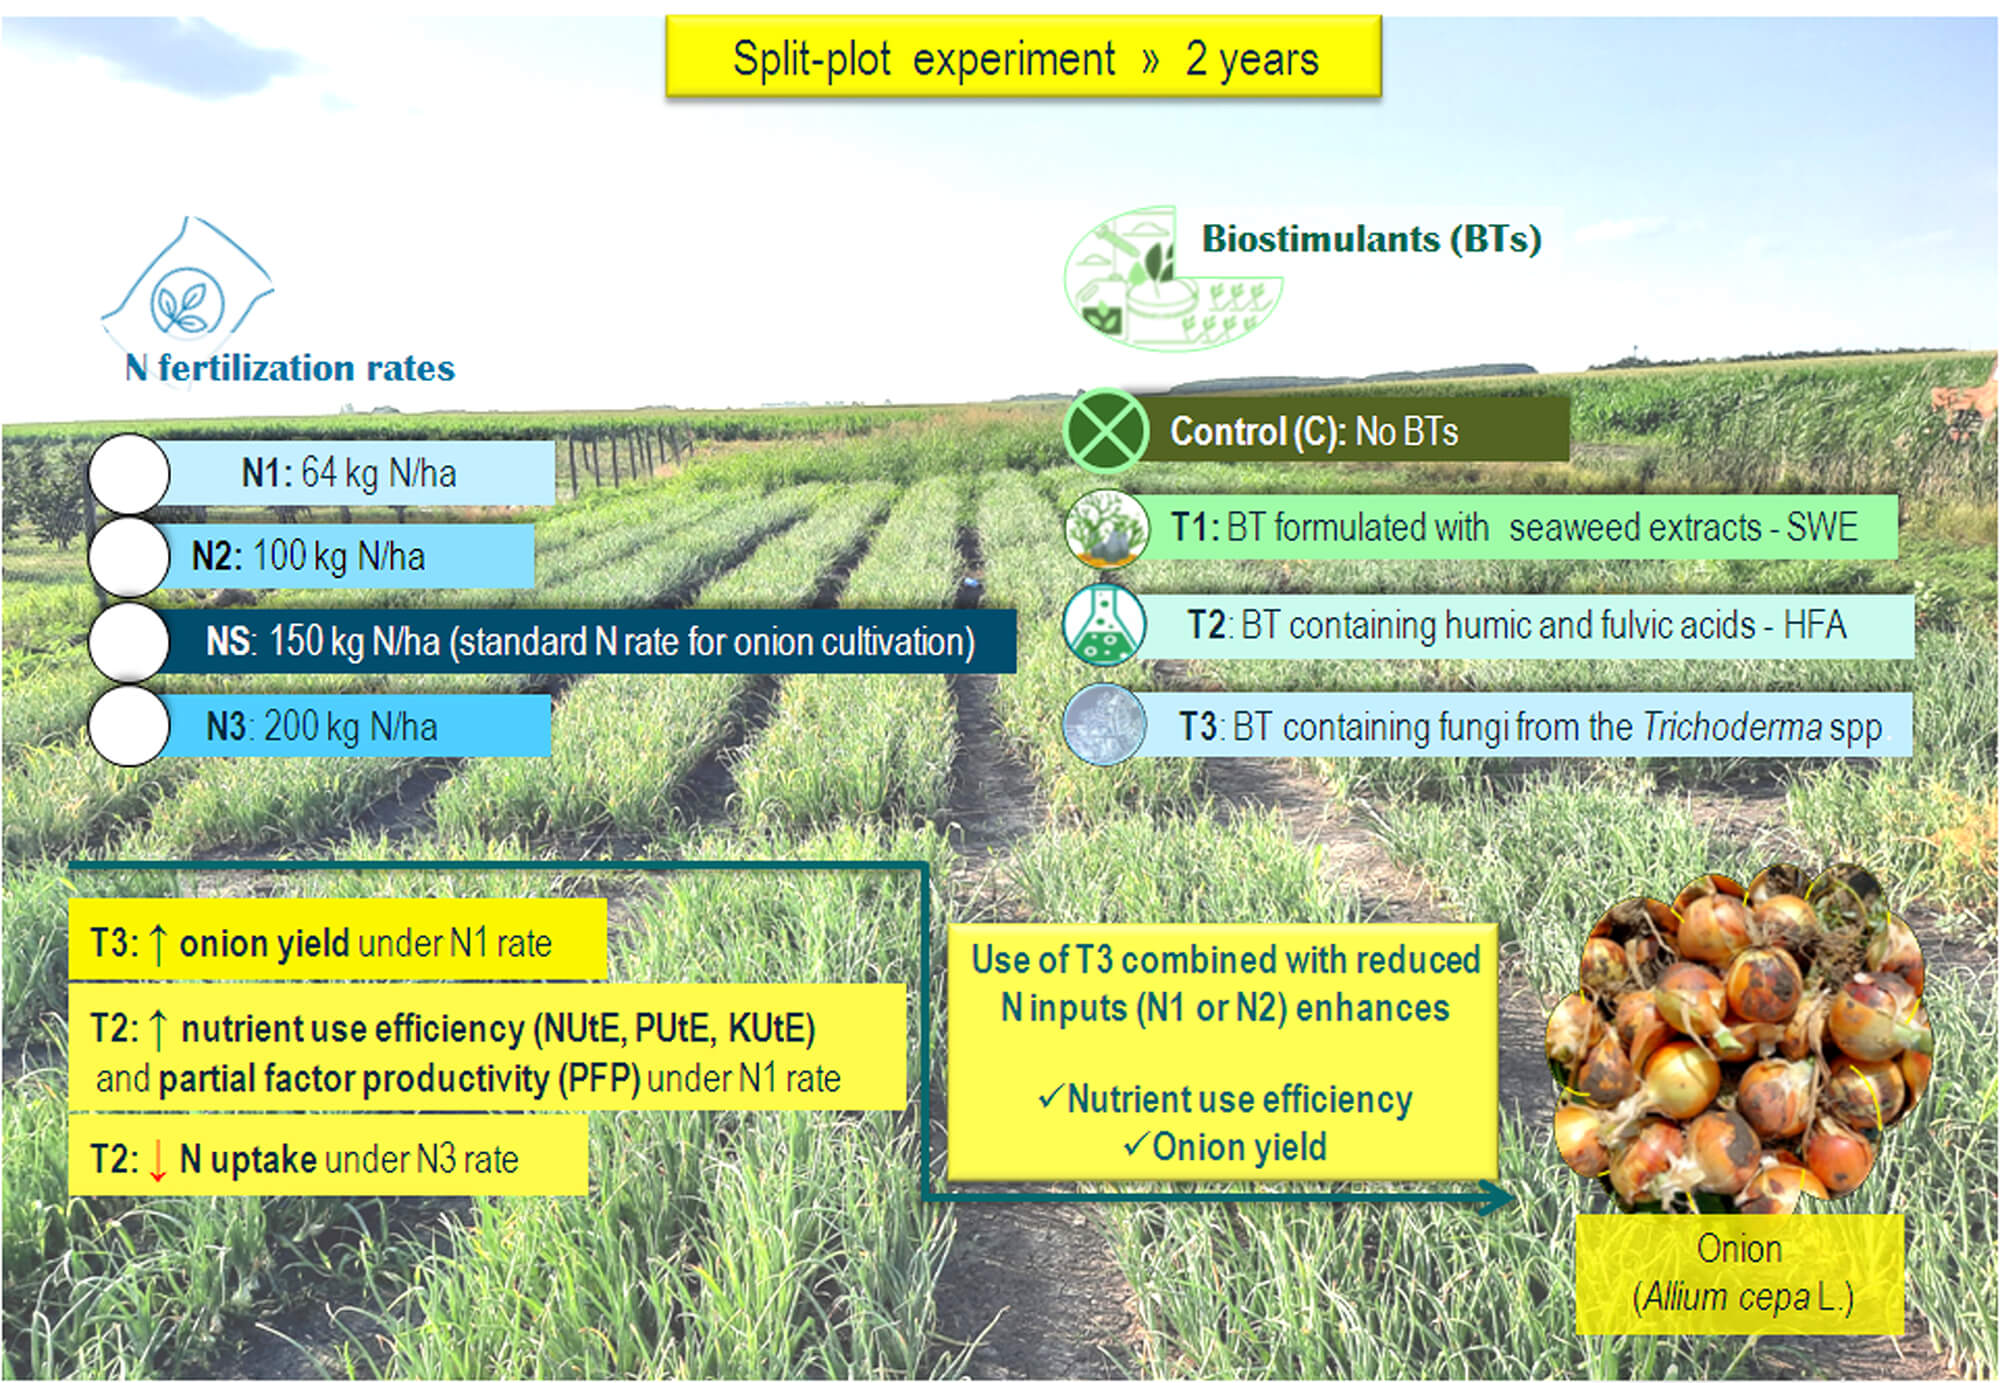
Onion (Allium cepa L.) is a widely cultivated vegetable valued for its taste, aroma, and nutritional content. Biostimulants (BTs) are substances that stimulate plant growth and development. This study explores the impact of BTs and nitrogen (N) fertilization on the yield and nutrient use efficiency of directly seeded onions, addressing the challenges of excessive N application and promoting sustainable practices. A two-year field experiment was conducted using a split-plot design with three replications. Treatments included a control (C), a seaweed extract-based BT (T1), humic and fulvic acids (T2), and Trichoderma spp. (T3). N rates applied were 64 kg N/ha (N1), 100 kg N/ha (N2), 150 kg N/ha as the standard (NS), and 200 kg N/ha (N3). Compared to the C × NS treatment, T1 × N1 increased yield by 7.6% with a saving of 50 kg N/ha; T2 × N3 increased yield by 19.4%; and T3 × N1 increased yield by 11.7% with a saving of 86 kg N/ha. The T2 treatment reduced N uptake under excessive N rate (T2 × N3), indicating a potential protective effect against stress induced by high N levels. Treatment with T1 improved nutrient use efficiency (NUtE, PUtE, KUtE) and partial factor productivity (PFP) under reduced N conditions (T1 × N1). The study advises farmers to apply T3 under reduced N rates (N1 and N2) to improve yield and highlights that all three BTs enhance nutrient use efficiency, providing promising strategies to boost onion productivity while minimizing nutrient losses in direct seeding cultivation.Graphic Abstract
Keywords
Onions (Allium cepa L.) are widely cultivated vegetables known for their taste, aroma, and high nutritional value. Additionally, onions are rich in nutrients, packed with health-promoting compounds such as phenols, flavonoids, sugars, and proteins [1,2].
According to FAO [3], the average onion yield in Serbia is 8.5 t/ha, while certain countries with geographical boundaries intersecting the 45° northern latitude achieve higher yields, such as 31.2 t/ha in Italy, 36.8 t/ha in France, and 48.1 t/ha in Japan. With the potential of some onion cultivars to yield 70–100 t/ha [4,5], it becomes imperative to increase yields and enhance production competitiveness in both domestic and global markets.
Nitrogen (N) plays a key role in determining the yield and quality of vegetable crops. For example, in cucumber (Cucumis sativus L.), excessive N application has been shown to reduce yield [6], while in root celery (Apium graveolens L.) it can affect the phenolic content and antioxidant status [7]. In onion grown from sets, N fertilization has been shown to increase bulb yield [2]. In the Vojvodina Province (Republic of Serbia), farmers typically apply one-third of the total N rate in autumn (prior to plowing), another third in spring (7–10 days before sowing), and the remaining portion is supplied through three to five equal applications, mostly via fertigation, during the growing season of directly seeded onion.
In pursuit of higher yields, farmers often use excessive or imbalanced N rates, which can lead to soil acidification and deteriorate the soil environment, ultimately negatively affecting crop growth and yield [8,9]. According to the World Bank [10], fertilizer prices fell by more than 17% year-over-year in the fourth quarter of 2024 but remain above the 2015–2019 average due to continued global demand and trade restrictions. Despite this moderate decline, further price fluctuations are expected, underscoring the importance of improving nutrient use efficiency through sustainable practices. Therefore, it is essential to improve the nutrient use efficiency, particularly of N, phosphorus (P), and potassium (K), to reduce the application of mineral fertilizers, contributing to cost-effective production and environmental preservation, while ensuring high yields and bulb quality. One potential solution is the implementation of various biostimulants (BTs) [11,12].
BTs are substances that stimulate plant nutrition in the presence of varying nutrient availability [11,13]. Drawing from this definition, Calvo et al. [14] and Rouphael and Colla [15] highlight that applying BTs can improve vegetable yield and nutrient efficiency when nutrients are limited. The most common BTs on the market are based on seaweed extracts (SWE), humic and fulvic acids (HFA), and Trichoderma spp. For example, the application of BTs based on SWE and Trichoderma spp. increased lettuce (Lactuca sativa L.) yield and nutrient use efficiency under reduced N rates compared to standard fertilization practices [12,16]. Additionally, the application of humic substances increased the yield and N use efficiency of green peppers (Capsicum annuum L.) and the P content in garlic bulbs (Allium sativum L.) [17,18]. In the case of onions grown from seedlings, SWE enhanced N accumulation in bulbs [19]. For tomatoes (Solanum lycopersicum L.), the effect of Trichoderma spp. on N accumulation in fruit depended on the cultivar [20].
BTs are increasingly recognized in global agricultural strategies for their role in enhancing nutrient use efficiency, reducing reliance on mineral fertilizers, and supporting environmentally sustainable farming [2,5]. Their use also aligns with the goals of initiatives such as the European Green Deal [21] and the FAO’s guidelines [22] on sustainable soil management, which emphasize reducing nutrient losses, preserving soil health, and promoting resource-efficient agriculture. Integrating BTs into vegetable systems such as onion production offers a promising path toward achieving high yields with reduced environmental impact, especially under lower fertilizer inputs.
Considering the significance of onions in human nutrition worldwide, while numerous studies have investigated the influence of BTs [19,23,24] and N fertilization [25–29] on onion yields or nutrient efficiency obtained from seedlings, there is limited knowledge regarding their effects on bulbs produced through direct seeding. This knowledge gap underscores the need for further research to explore the potential benefits and limitations of BTs and N on directly seeded onion production. By addressing this research gap, valuable insights into the effects of BTs and N can be gained on onion production by direct seeding, contributing to the implementation of more efficient and sustainable agricultural practices.
This study investigates the effect of BTs and N fertilization on onion yield and N, P, and K uptake and accumulation under direct seeding cultivation. Based on reviewed literature, the hypothesis is that BTs will reduce the required amount of N fertilizer while achieving high yields and nutrient efficiency compared to standard fertilization practices.
The field experiment was carried out in the Vojvodina Province (45.26° N and 19.83° E), a prominent vegetable production region in Republic of Serbia, during the years 2021 and 2022. This region forms part of the Pannonian Plain, typical for vegetable cultivation across much of Southeastern Europe, making the findings broadly applicable beyond national borders. Details about the experimental site are explained in the article by Vojnović et al. [30]. Briefly, in 2021, prior to the establishment of the experiment, the soil had moderate levels of P2O5 (10.6 mg 100 g−1) and high levels of K2O (48.2 mg 100 g−1) and was classified as weakly organic (1.7%). The following year (2022), the soil showed an optimal content of P2O5 (16.0 mg 100 g−1) and a high content of K2O (32.2 mg 100 g−1), with a slightly higher level of humus (1.9%).
Regarding meteorological data (Fig. 1), during both years, the highest average daily temperature was recorded in July. In 2021, this temperature was 2.7°C higher than the long-term average, while in 2022 it was 3.2°C higher. Additionally, the highest precipitation was also recorded in July, with values exceeding the long-term average by 25.3 mm in 2021 and 40.1 mm in 2022. Meteorological data were obtained from a digital meteorological station Vantage Pro2™ by Davis Instruments (Hayward, CA, USA) powered by solar panels. The station was factory-calibrated and periodically validated against data from the nearest national meteorological station of the Republic Hydrometeorological Service of Serbia (RHMSS) to ensure accuracy [31].
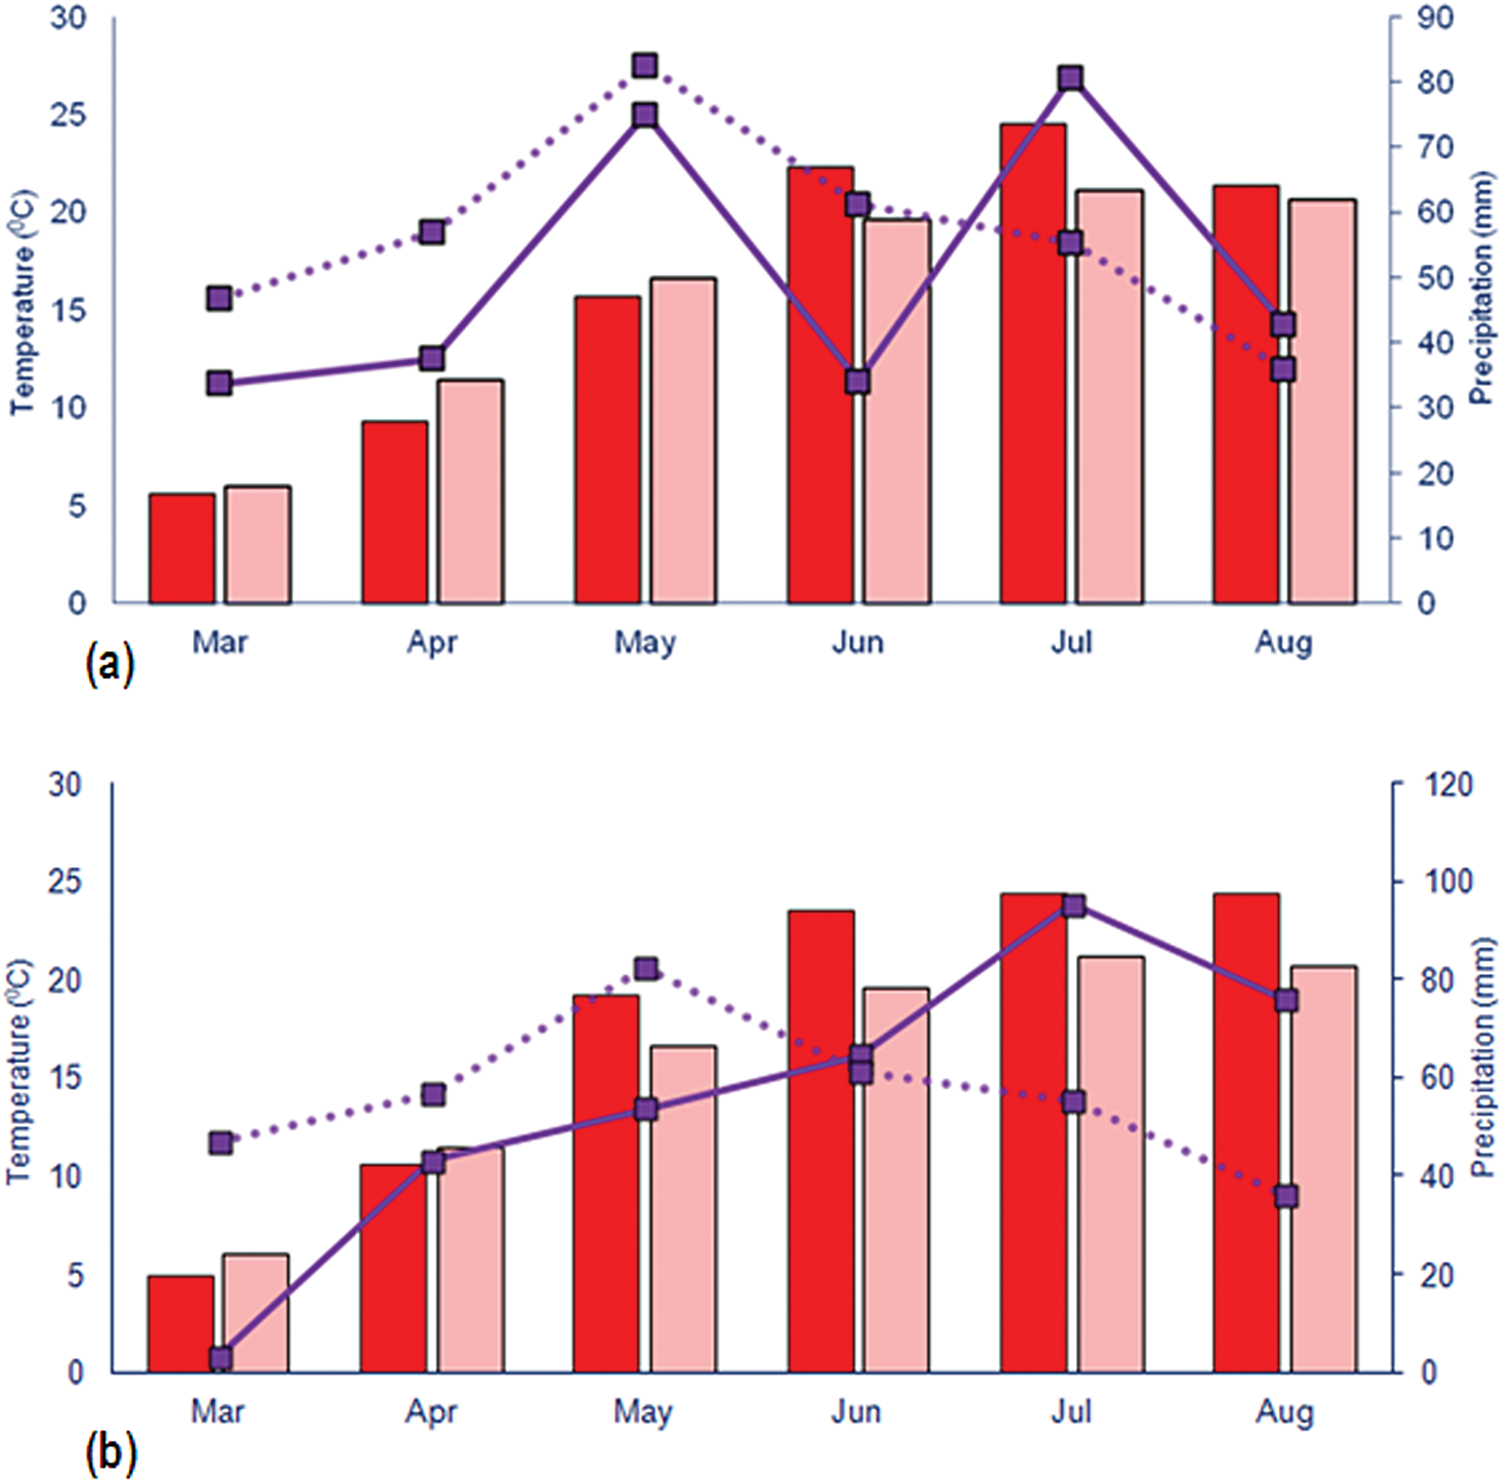
Figure 1: Weather conditions during the experiment in 2021 (a) and 2022 (b). The dark red bars represent the average daily air temperature, while the pink bars indicate the multi-year average temperature (1991–2020). The solid purple line shows the amount of precipitation, and the dashed line represents the multi-year precipitation average
2.2 Experimental Treatments and Agrotechnical Practices
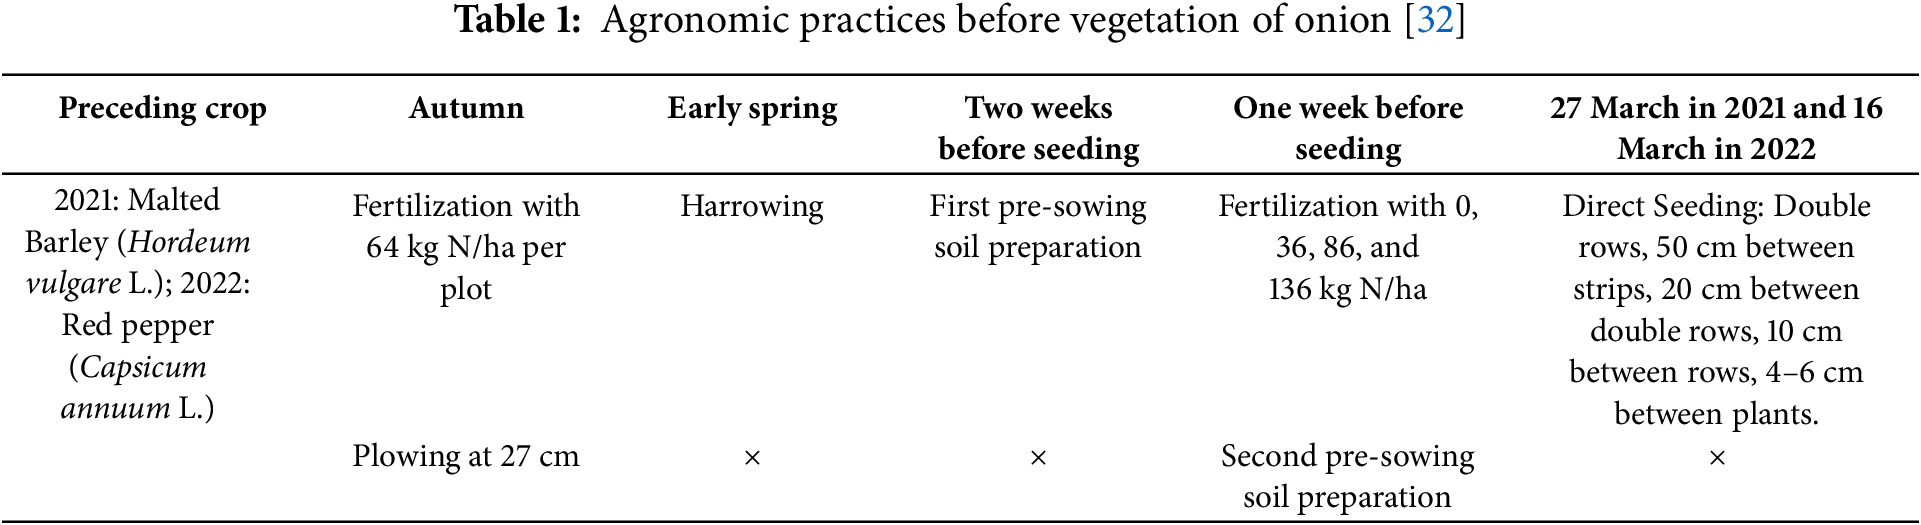
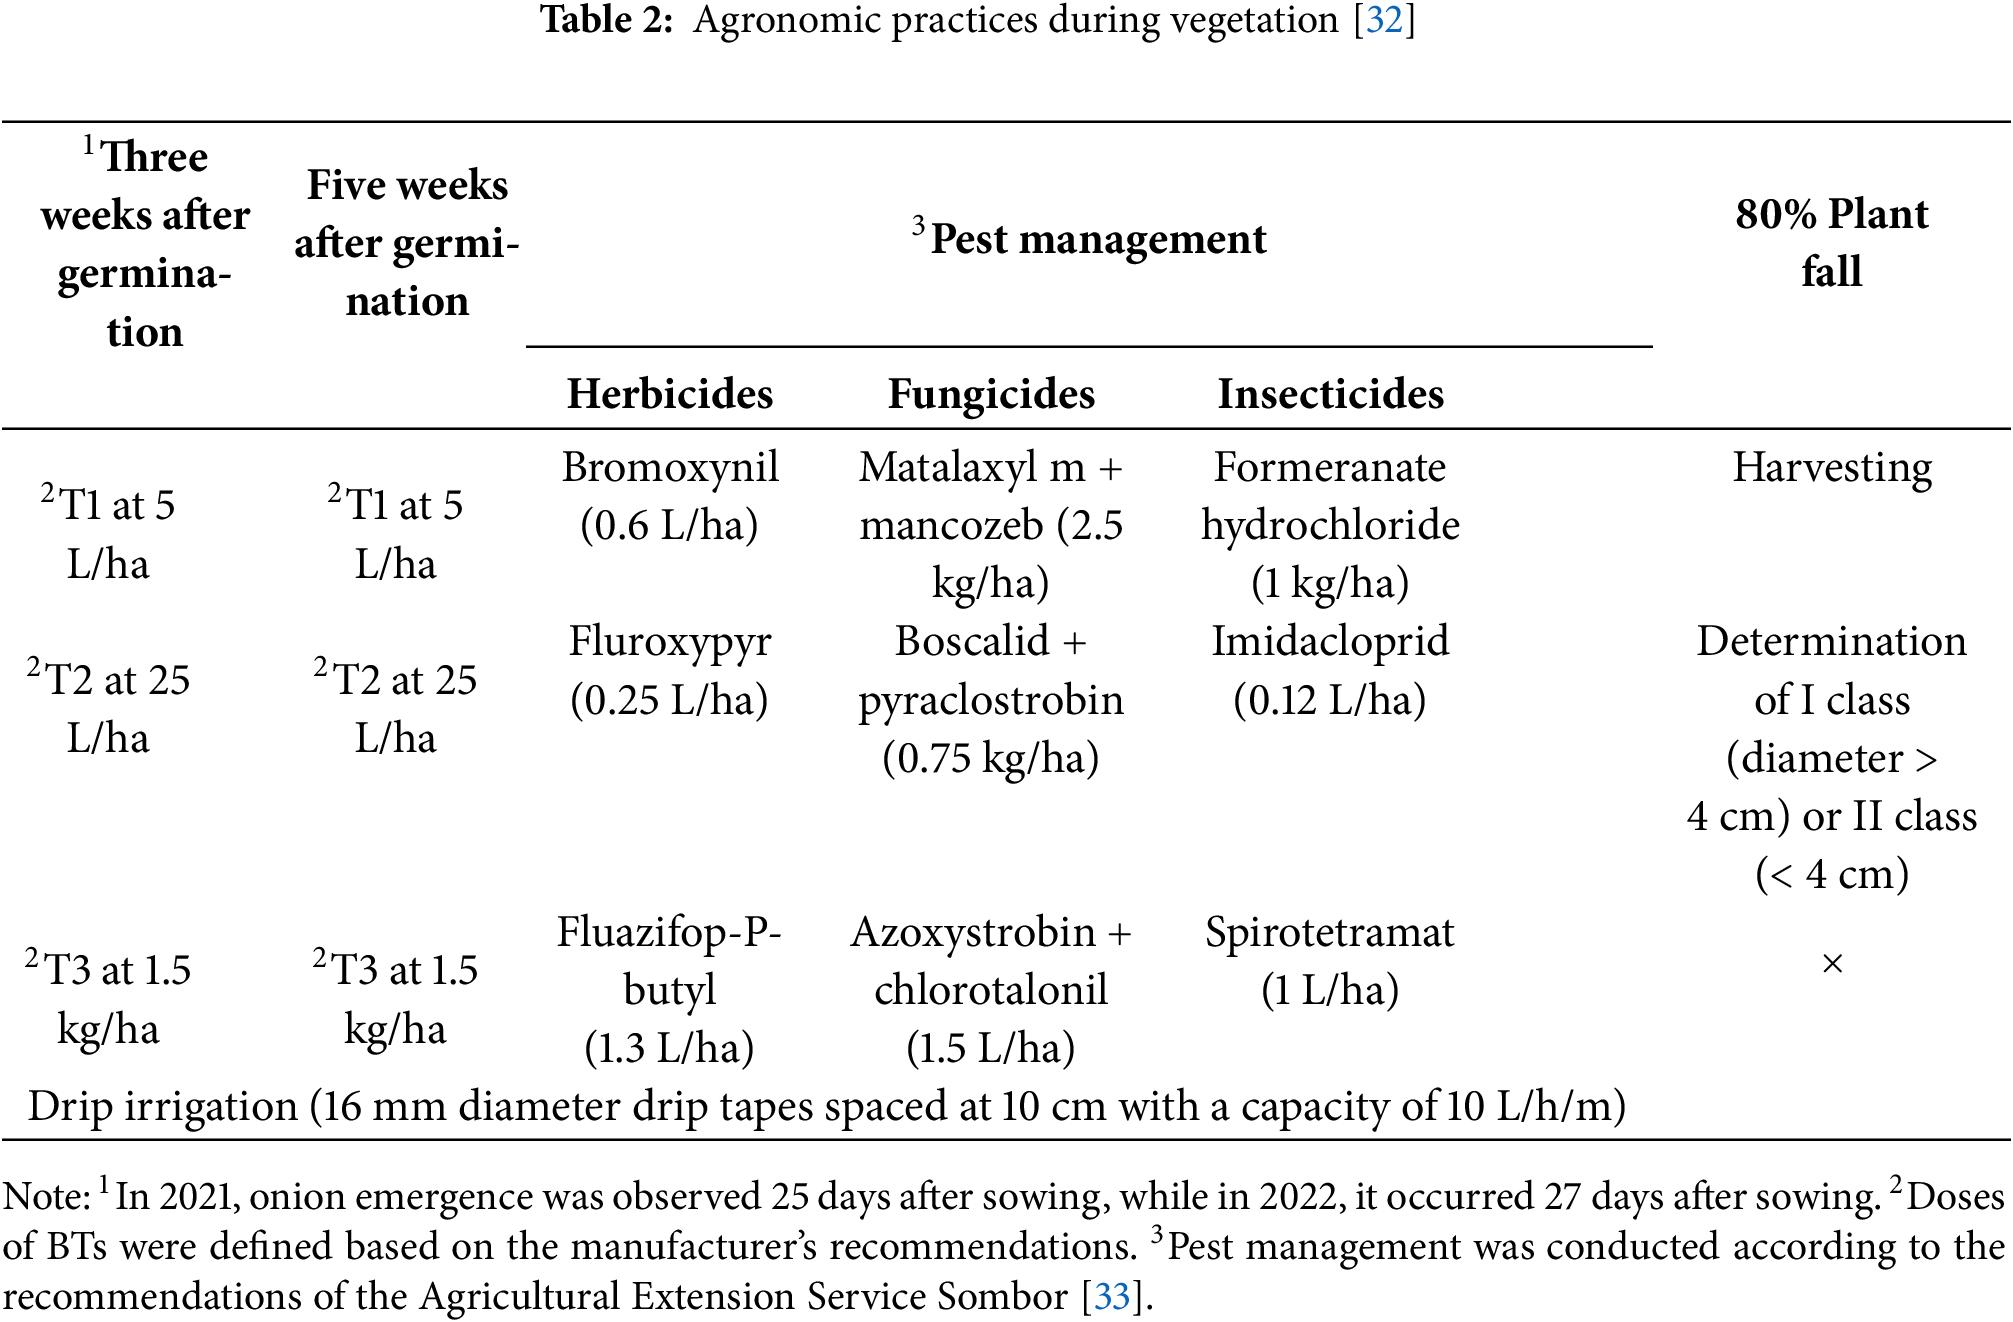
The field trial was designed as a two-factorial study using a split-plot design, with a randomized block arrangement and three replications. This layout was selected as optimal due to the practical requirements of BTs application via drip irrigation, which made whole-plot randomization more efficient and minimized field variability. The main plots consisted of various BTs treatments: Control (C): without BTs; Agasi® (T1)—BT formulated with seaweed extract (SWE) (Ecklonia radiata and Laminaria spp.) of composition 2.64% N, and 1.43% K2O; HumiBlack® (T2)—BT containing humic and fulvic acids (HFA) (1.7% K2O); Tifi® (T3)—incorporates fungi from the Trichoderma spp. genus. The sub plots included different N fertilization rates: 64 kg N/ha (N1); 100 kg N/ha (N2); 150 kg N/ha as standard N rate for onion cultivation (NS); 200 kg N/ha (N3). The main plot size was 30 m2 (1.5 m × 20 m) and the subplot size was 7.5 m2 (1.5 m × 5 m). The total size of the experiment was 360 m2, consisting of 12 main plots and 48 subplots. The onion cultivar used in the experiment was Elenka F1 (Cora Seeds®, Cesena, Italy), characterized by bronze-colored dry outer scales. This cultivar is intended for fresh consumption, and its bulbs are suitable for long-term storage. Seeds were purchased from a certified agricultural retailer in Serbia. Agronomic management practices applied in the experiment with onions are explained in Vojnović et al. [2] and Vojnović et al. [32]. Briefly, for better clarity and overview to farmers, all agronomic practices are summarized in Tables 1 and 2.
2.3 Laboratory and Biometric Analyses
The bulbs N, P2O5, and K2O content was measured in the dried fifteen randomly selected bulbs per plot. The N content was measured using the Kjeldahl method [34], the P2O5 content was measured using a colorimeter [35], and the K2O content was analyzed using a flame photometer [36].
To assess the BTs effectiveness on onion plant nutrition and mineral distribution and yields under varying N rates, element efficiency indicators, including N utilization efficiency (NUtE), P utilization efficiency (PUtE), K utilization efficiency (KUtE), partial factor productivity (PFP) was calculated using the following formulas [37–40]:
Before analyzing variance (ANOVA), the distribution’s normality was checked using the Shapiro-Wilk test [41]. The experimental results were analyzed using a two-factor ANOVA and the LSD test (p ≤ 0.05) to assess the significance of differences between treatment means. The effects of BTs on the N, P2O5, and K2O uptake by 10 t of yield are presented separately for each year to provide comprehensive insight into the influence of BTs on mineral element distribution in yield. Results are presented as a two-year average for the interaction of BT × N in N, P2O5, and K2O removal by 10 t bulbs, along with nutrient efficiency indicators (NUtE, PUtE, KUtE, and PFP) and bulb yield. Statistical analyses were conducted using Statistica® 14 software from TIBCO Software Inc. (Palo Alto, CA, USA).
BTs and N significantly influenced onion yield (Fig. 2). On the T1 plot, the highest bulb yield was recorded with the T1 × NS treatment (73.0 t/ha), which was 15.3% higher than the C × NS treatment (63.3 t/ha). On the same plot, the yield with the lowest nitrogen rate (T1 × N1) did not significantly differ from the C × N3 treatment.
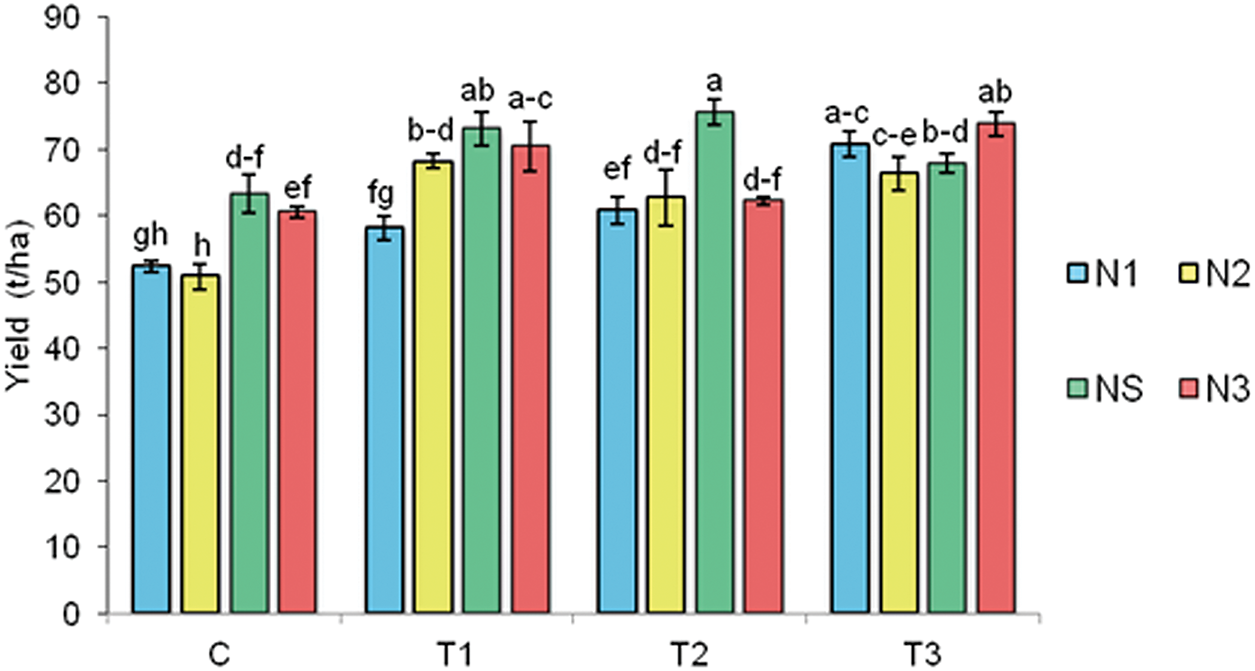
Figure 2: Two-year average of onion yield. C—control without BTs; T1—BT based on SWE; T2—BT based on HFA; T3—BT based on Trichoderma spp. N1—64 kg N/ha; N2—100 kg N/ha; NS—150 kg N/ha (standard rate); N3—200 kg N/ha. Bars marked with the same letter do not significantly differ at p ≤ 0.05 according to the LSD test. The lines in the bars represent the standard error of the mean
In the interaction of T2 and N, the highest yield was obtained with the T2 × NS treatment (75.6 t/ha), which was 19.4% higher than the C × N3 treatment. The bulb yield in the T2 × N1 treatment (60.76 t/ha) did not statistically differ from the standard fertilization (C × NS).
On the T3 treatment, the highest onion yield was recorded with the T3 × N3 treatment (73.8 t/ha), 16.6% higher than the C × NS treatment. There was also a significant difference of 11.8% in favor of the T3 × N1 treatment (70.7 t/ha) compared to the C × NS treatment.
3.2 N, P2O5, and K2O Removal by 10 t of Onion Bulbs
Observing the effect of the BTs, it was noticed that in 2021, the highest N removal per 10 t of onion bulb yield was in the T1 treatment (18.1 kg), which was 4.0% higher compared to the C (17.4 kg) (Fig. 3). During 2022, the highest N removal per 10 t of yield was in the T3 treatment (18.0 kg), which was 11.8% higher compared to the C.
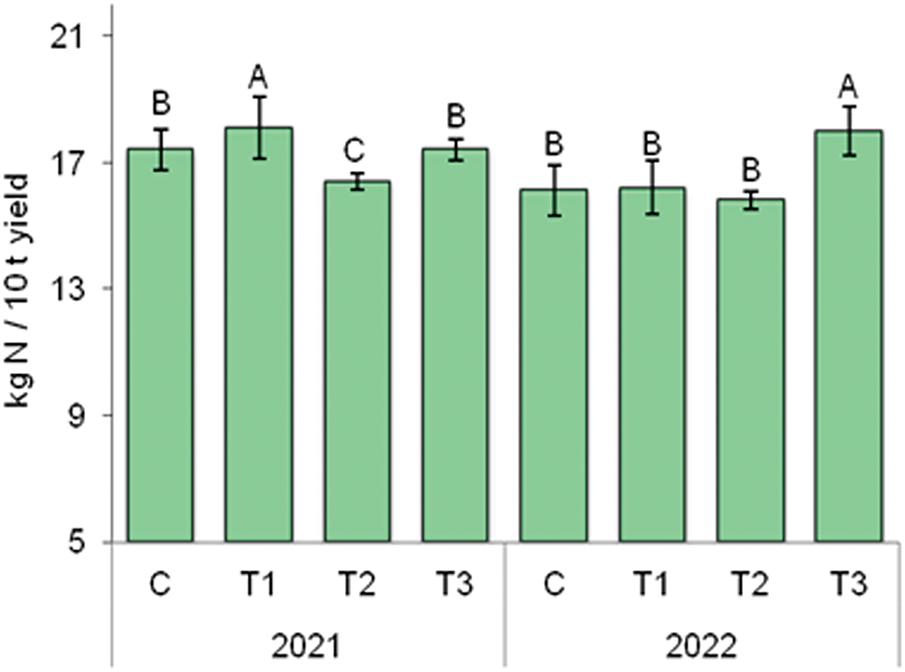
Figure 3: The effect of BTs on N removal by 10 t of onion bulbs. C—control without BT; T1—BT based on SWE; T2—BT based on HFA; T3—BT based on Trichoderma spp. Bars marked with the same letter do not significantly differ at p ≤ 0.05 according to the LSD test. The lines in the bars represent the standard error of the mean
The effect of the BTs differently altered the P2O5 content in onion bulbs during both years of the study (Fig. 4). In 2021, the highest P2O5 removal was observed in the control and T1 (6 kg each), while the lowest was in the T3 (5.4 kg). The following year, the highest P2O5 removal per unit yield was in the T2 (5.8 kg), which was 3.6% higher than the control.
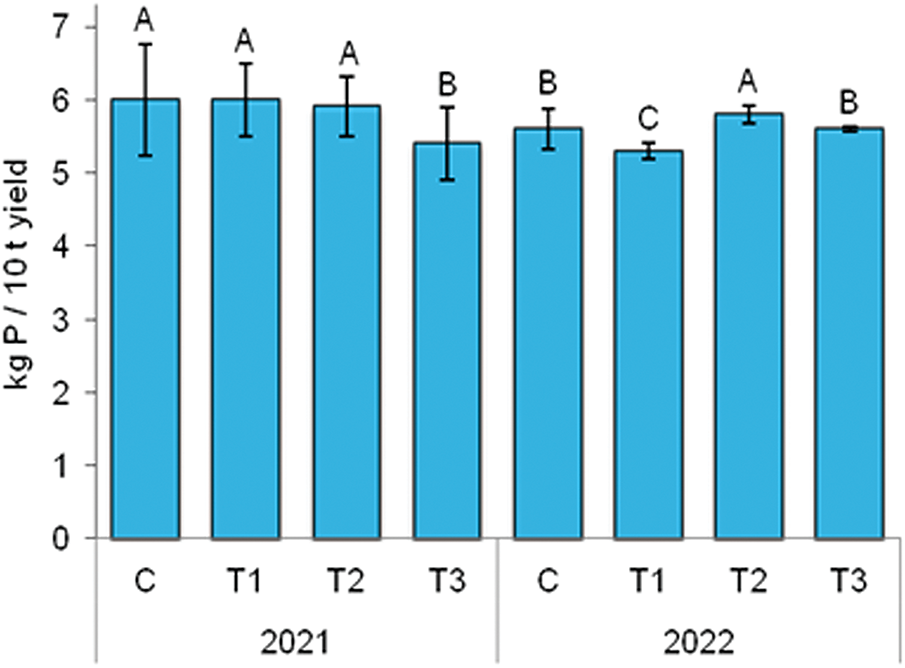
Figure 4: The effect of BTs on P2O5 removal by 10 t of onion bulbs. C—control without BTs; T1—BT based on SWE; T2—BT based on HFA; T3—BT based on Trichoderma spp. Bars marked with the same letter do not significantly differ at p ≤ 0.05 according to the LSD test. The lines in the bars represent the standard error of the mean
In 2021, the highest K2O removal with 10 t of onion bulbs was observed in the C (41.6 kg), while the lowest was in the T2 (32.1 kg), and their difference was significant (Fig. 5). A similar trend was observed in 2022, where the significantly highest K2O removal was in the control (38.4 kg), and the lowest was in the T2 (31.0 kg).
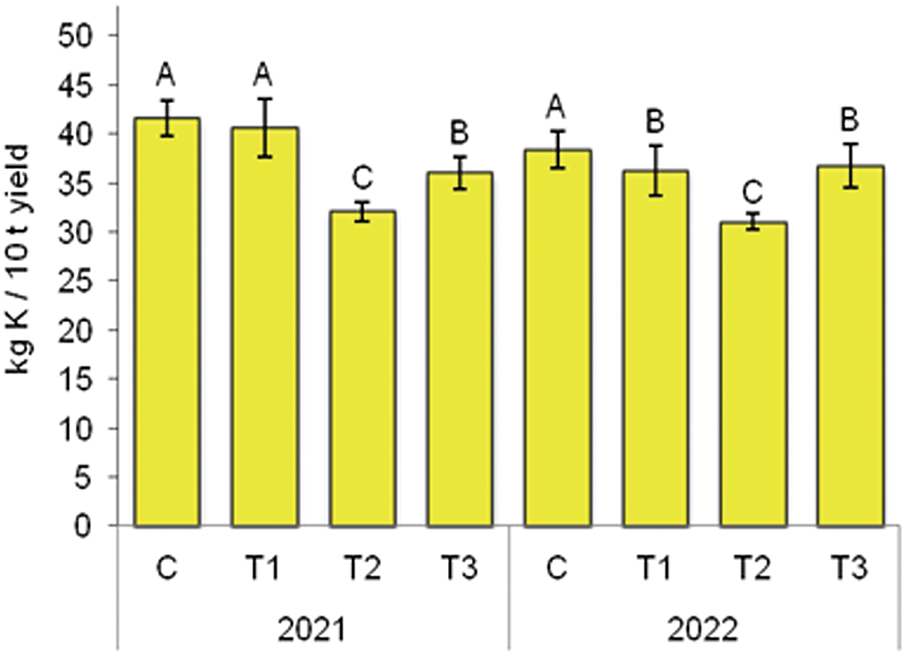
Figure 5: The effect of BTs on K2O removal by 10 t of onion bulbs. C—control without BTs; T1—BT based on SWE; T2—BT based on HFA; T3—BT based on Trichoderma spp. Bars marked with the same letter do not significantly differ at p ≤ 0.05 according to the LSD test. The lines in the bars represent the standard error of the mean
3.3 Interaction of BTs and N on Nutrient Removal by 10 t of Onion Bulbs
BTs and N significantly affected N removal by 10 t yield of onion bulbs (Table 3). The T1 treatment showed the highest N removal in the T1 × N3 (20.9 kg), which was 21.5% higher than the C × NS (17.2 kg). The effect of T1 was evident in the T1 × NS (19.2 kg) compared to the C × NS, with an 11.6% difference. The BT named T2 significantly increased N removal at lower N rates.
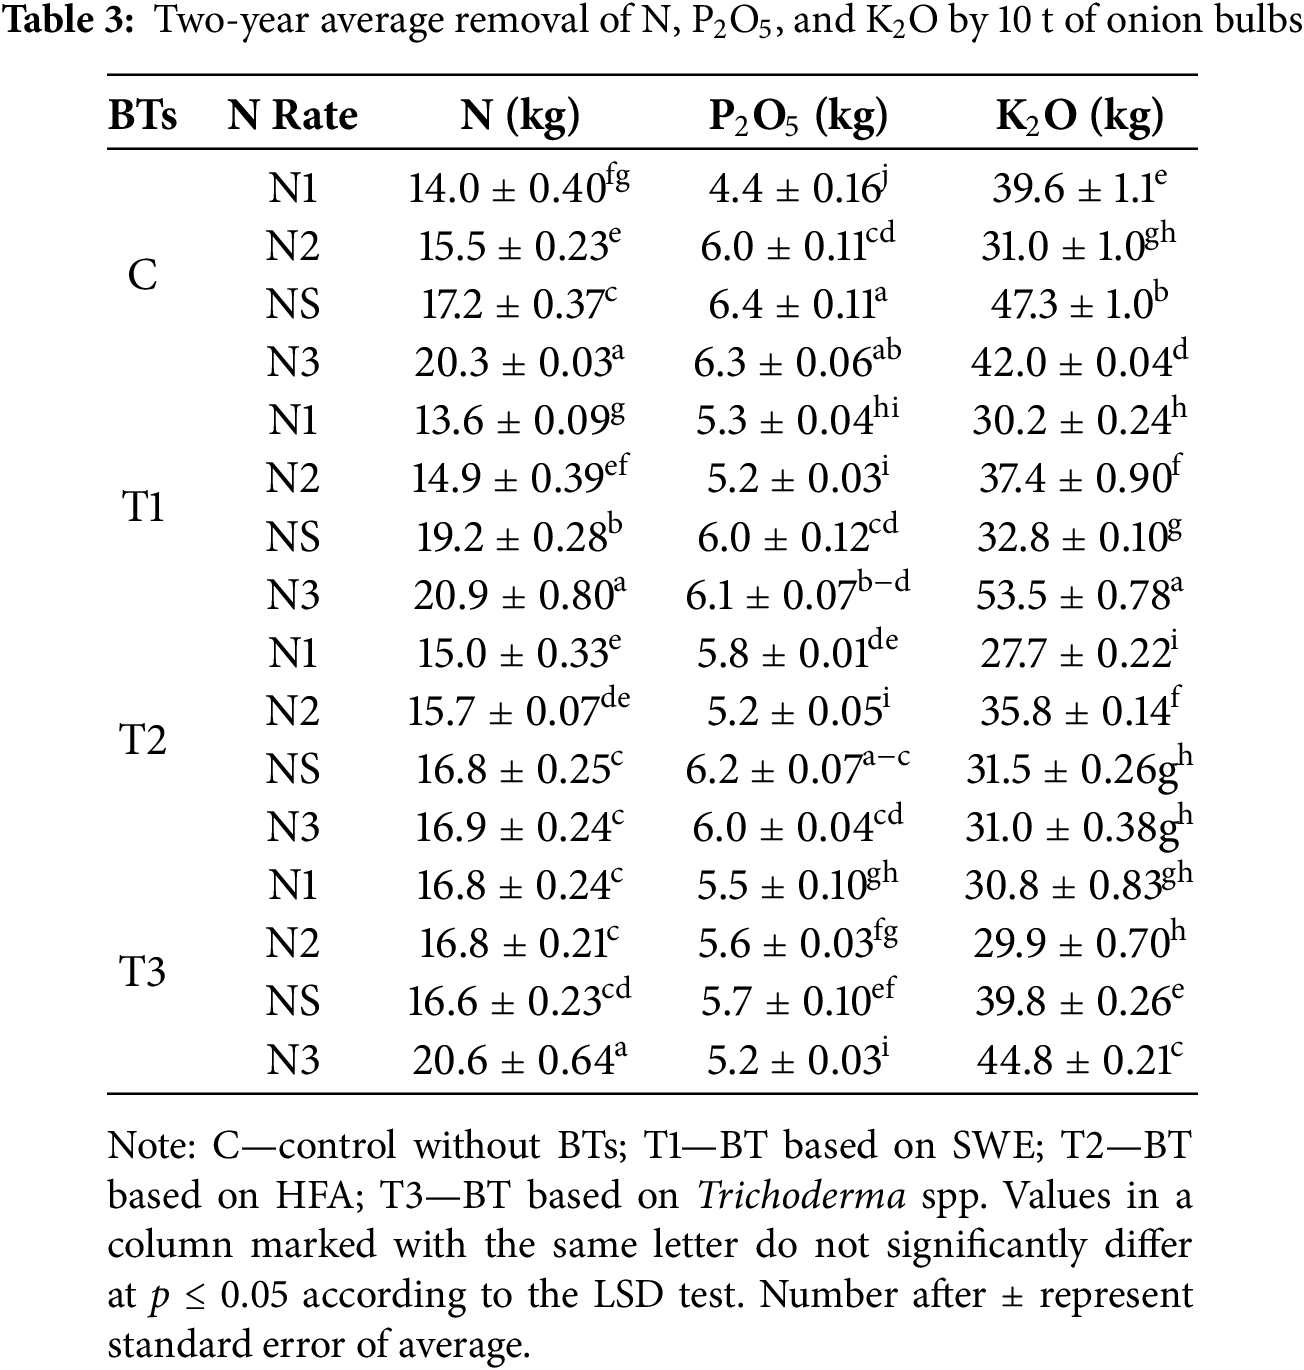
In the T3 and N interaction, the highest N removal with 10 t of onion bulbs was recorded in the T3 × N3 (20.6 kg), which was 19.6% higher than C × NS. Other N treatments in T3 showed significantly lower N removal than T3 × N3.
The removal of P2O5 with 10 t of bulbs varied based on the BTs and N treatments (Table 3). The highest P2O5 removal was observed in the T1 × N3 (6.1 kg), while the lowest was in the T1 × N2 (5.2 kg), with a significant difference between them. Moreover, all treatments with N rates on T1 significantly reduced P2O5 removal compared to C × NS.
In the T2 treatment, the highest P2O5 removal by bulb yield was observed in the T2 × NS (6.2 kg), while the lowest was in the T2 × N2 (5.2 kg), with a significant difference between them.
The application of T3 significantly reduced P2O5 removal. Treatments N1, N2, NS, and N3 on T3 plots exhibited significantly lower P2O5 removal than C × NS by yield of 10 t of onion bulbs.
The interaction between BTs and N significantly influenced the K2O content in onion bulbs (Table 3). The highest K2O removal was observed on T1 × N3 (53.5 kg), showing a 13.1% increase compared to C × NS (47.3 kg).
In the T2 plots, the highest K2O removal was observed in the T2 × N2 (35.5 kg), while the lowest was in the T2 × N1 (27.7 kg), with a significant difference between them. Compared to the standard N rate (C × NS), all interactions of T2 and N showed significantly lower K2O removal by bulb yield.
On the T3 treatment, the highest K2O removal was observed in the T3 × N3 (44.8 kg), while the lowest was in the T3 × N2 (29.9 kg), and their difference was significant. All interactions in the T3 treatment were significantly lower in K2O removal with bulb yield than C × NS.
3.4 Nutrient Efficiency Indicators (NUtE, PUtE, KUtE, and PFP)
The BTs significantly influenced NUtE as shown in Fig. 6a. The highest, but not significantly, NUtE was observed in the T2 treatment, reaching 625.0 kg of onion bulbs/kg N, which is 1.8% higher than the C, which recorded 614.2 kg of onion bulbs/kg N. Significant differences were observed between T3 and other treatments.
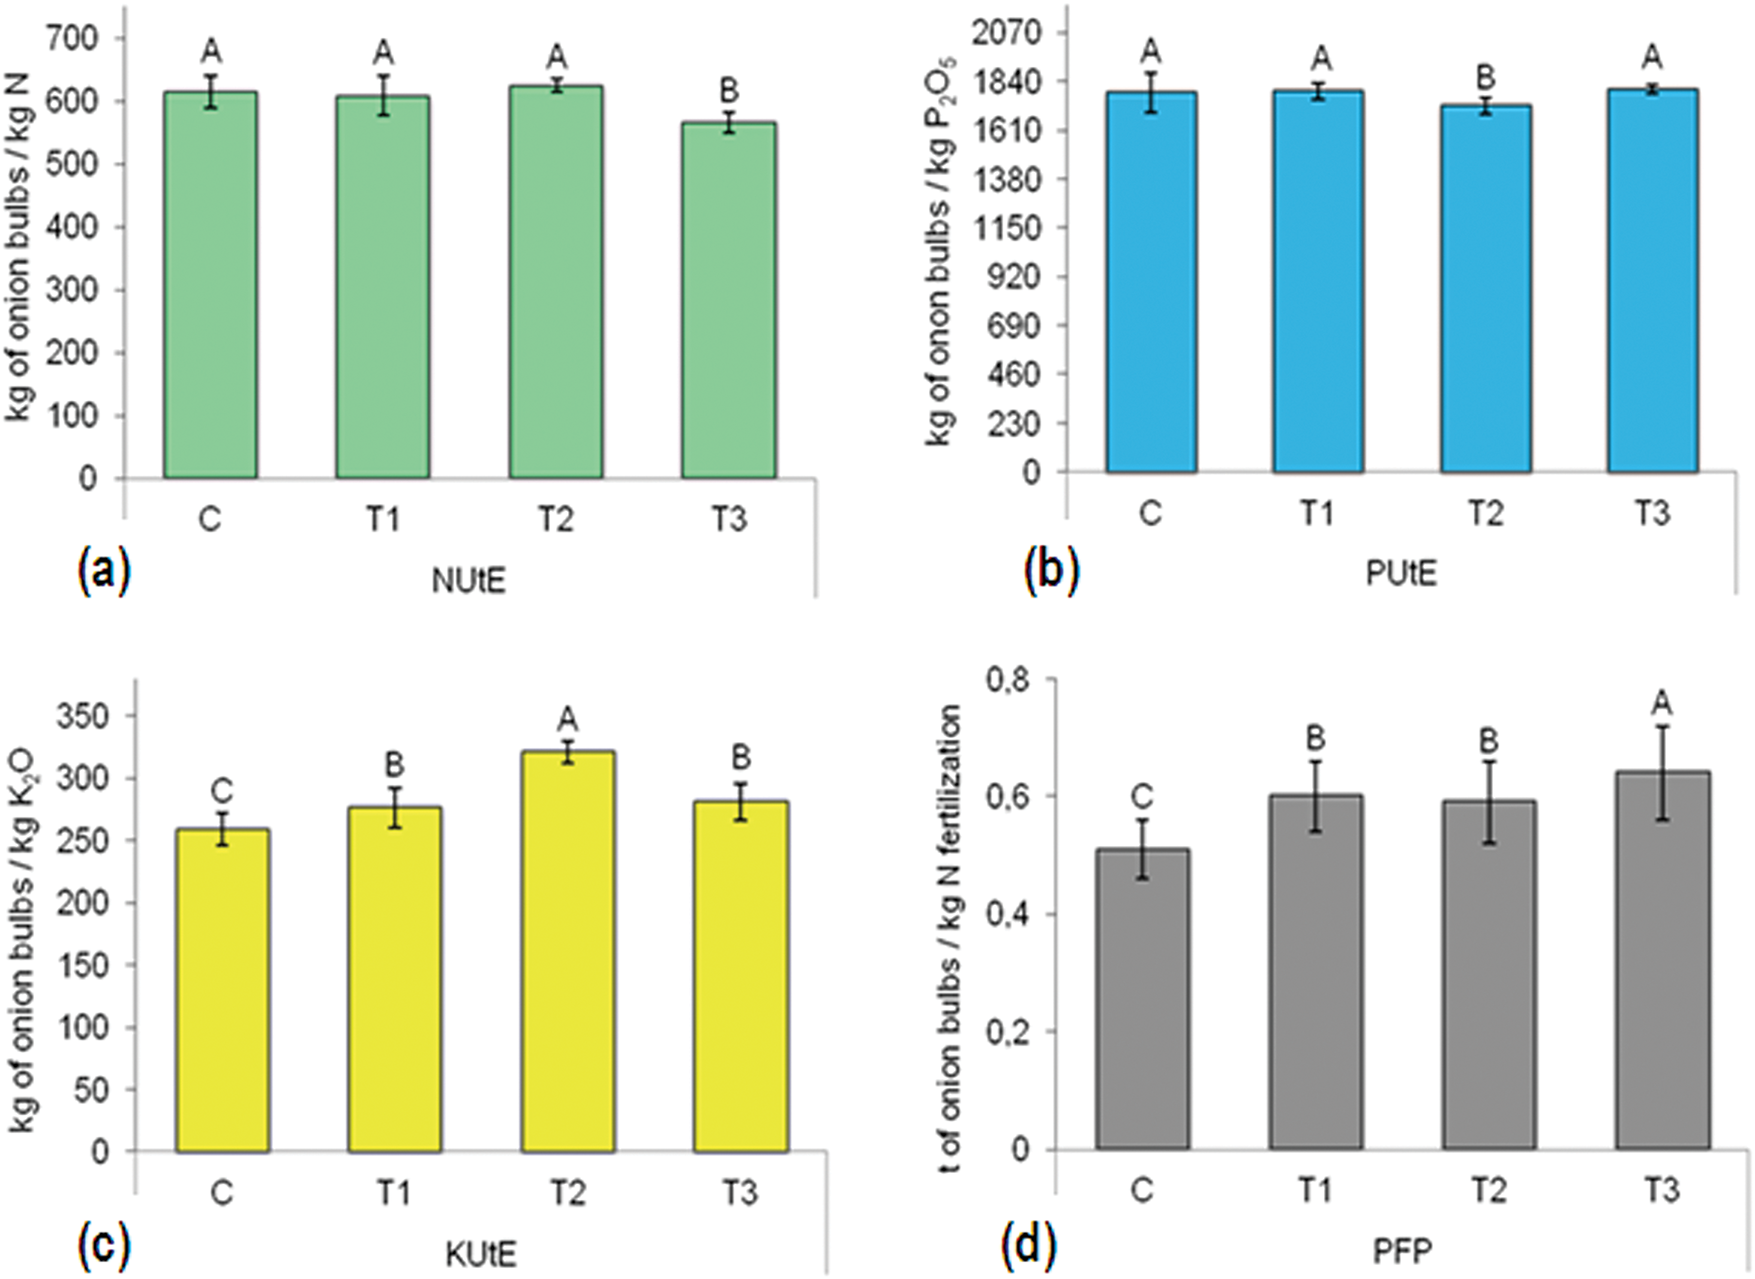
Figure 6: Two-year average of the effect of BTs on nutrient use efficiency indicators: (a) NUtE—N utilization efficiency; (b) PUtE—P2O5 utilization efficiency; (c) KUtE—K2O utilization efficiency; (d) PFP—partial factor productivity. C—control without BTs; T1—BT based on SWE; T2—BT based on HFA; T3—BT based on Trichoderma spp. Bars marked with the same letter do not significantly differ at p ≤ 0.05 according to the LSD test. The lines in the bars represent the standard error of the mean
In terms of PUtE, the highest value was found in the T3 treatment (1802.1 kg of onion bulbs/kg P2O5), while the lowest PUtE was recorded in the T2 (1722.4 kg of onion bulbs/kg P2O5). There was a significant difference between these two treatments (Fig. 6b).
The BTs also affected KUtE. The highest KUtE was recorded in the T2 treatment, with 321.4 kg of onion bulbs/kg K2O, while the lowest was observed in the C, with 259.0 kg of onion bulbs/kg K2O. This represents a significant difference of 24.1% (Fig. 6c). Also, T1 and T3 were significantly higher than C.
Additionally, BTs had a significant impact on PFP (Fig. 6d). The highest PFP was observed in the T3 treatment, at 0.64 t of onion bulbs/kg N fertilization, while the lowest PFP was in the C, at 0.5 t of onion bulbs/kg N fertilization. This marks a significant difference of 25.5%.
3.5 Interaction of BTs and N on Nutrient Efficiency Indicators
BTs and N significantly influenced NUtE in onion bulb yield (Table 4). The highest NUtE on T1-treated plots was observed in the T1 × N1 treatment (741.1 kg of onion bulbs/kg N), while the lowest was in the T1 × N3 (490.7 kg of onion bulbs/kg N), with a significant difference of 250.3 kg of onion bulbs.
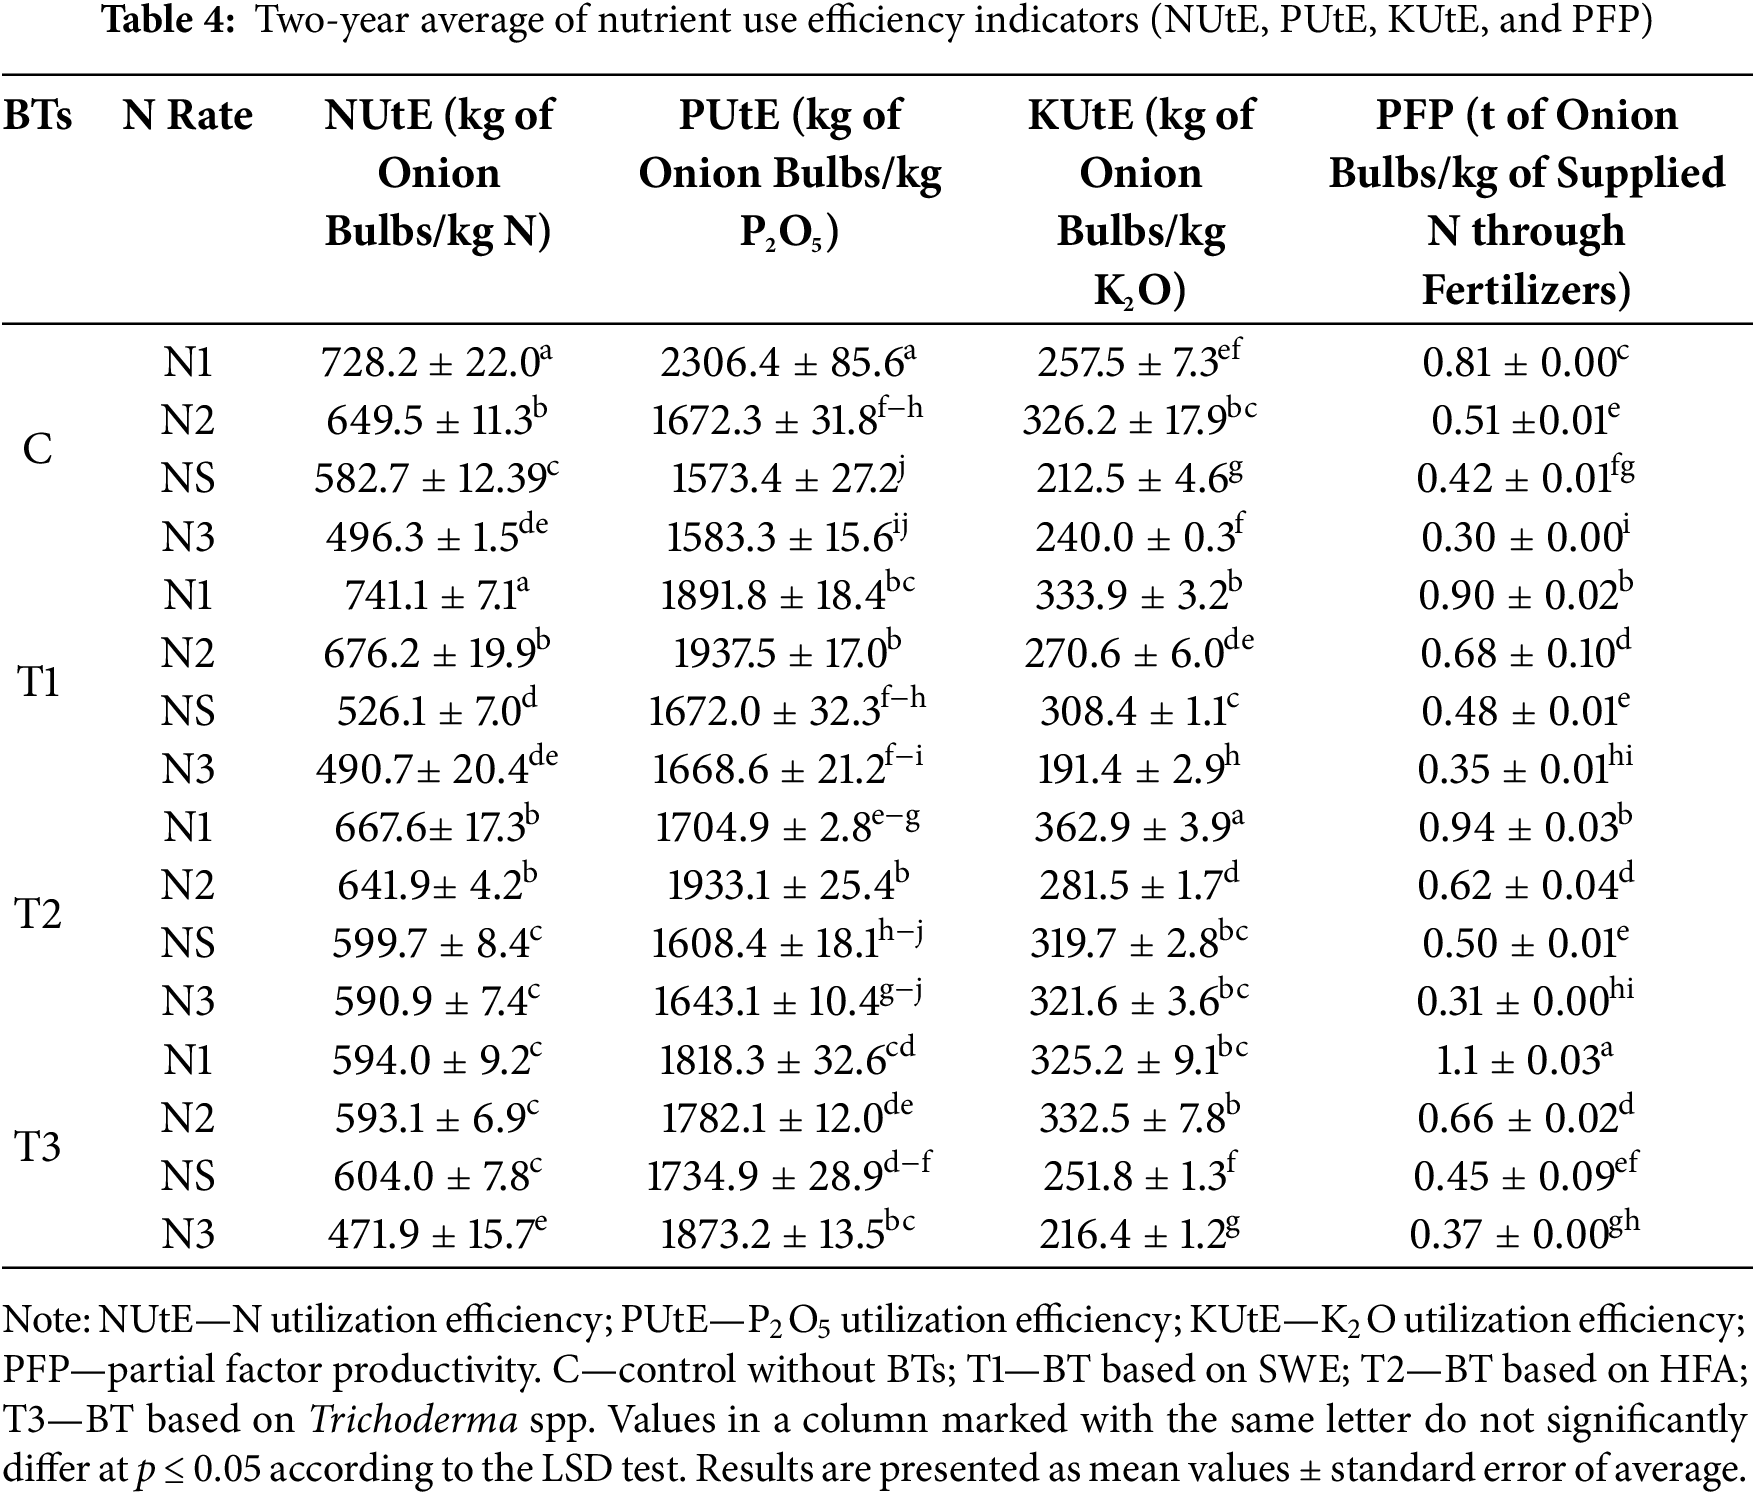
In the interaction of T2 and N, the highest NUtE was observed in the T2 × N1 treatment (667.6 kg of onion bulbs/kg N), which was significantly lower than C × N1 (728.2 kg of onion bulbs/kg N).
The highest NUtE on T3-treated plots was observed in the T3 × NS treatment (604.0 kg of onion bulbs/kg N), while the lowest was recorded in the T3 × N3 treatment (471.9 kg of onion bulbs/kg N). Compared to the standard C × NS, only the T3 × N3 treatment showed a significant decrease of 23.8%, while other treatments were statistically equivalent.
BTs and N influenced the PUtE in onion cultivation (Table 4). On T1-treated plots, the highest PUtE was observed in the T1 × N2 treatment (1937.5 kg of onion bulbs/kg P2O5), significantly higher than C × N2 (1672.3 kg of onion bulbs/kg P2O5), with a difference of 15.8%.
In the interaction of T2 and N, the highest PUtE was observed in the T2 × N1 treatment (1933.1 kg of onion bulbs/kg P2O5), which was significantly lower than C × N1 (2306.4 kg of onion bulbs/kg P2O5), with a difference of 15.6%. There was a significant difference in PUtE between T2 × N1 and C × NS.
In the interaction with all N rates, the T3 treatment significantly increased PUtE compared to the C. The highest PUtE was observed in the T3 × N3 treatment (1873.2 kg of onion bulbs/kg P2O5), significantly higher than C × N3 (1583.3 kg of onion bulbs/kg P2O5), with a difference of 18.3%. The T3 × NS treatment (1734.9 kg of onion bulbs/kg P2O5) was significantly higher than C × NS, with a difference of 10.3%.
The KUtE depends on applying BTs and N rates (Table 3). On T1-treated plots, the highest KUtE was observed in the T1 × N1 treatment (333.9 kg of onion bulbs/kg K2O), significantly higher than C × N1 (257.5 kg of onion bulbs/kg K2O) and C × NS (212.5 kg of onion bulbs/kg K2O).
The highest KUtE was observed in the T2 × N1 treatment (362.9 kg of onion bulbs/kg K2O), which was 40.9% higher than C × N1.
On T3-treated plots, the highest KUtE was observed in the T3 × N2 treatment (325.2 kg of onion bulbs/kg K2O), and the lowest was in the T3 × N3 treatment (216.4 kg of onion bulbs/kg K2O), with a significant difference between them. Compared to the standard N rate (C × NS), the T3 × NS treatment was significantly higher.
The application of BTs and N influenced the PFP (Table 3). The T1 × NS treatment (0.48 t of onion bulbs/kg N fertilization) significantly increased PFP by 14.3% compared to the standard C × NS (0.42 t of onion bulbs/kg N fertilization).
In the interaction of T2 and N, the highest PFP was observed in the T2 × N1 treatment (0.94 t of onion bulbs/kg N fertilization), while the lowest was in the highest N rate, T2 × N3 (0.31 t of onion bulbs/kg N fertilization), with a significant difference between them.
On the T3-treated plots, the highest PFP was observed in the T3 × N1 treatment (1.1 t of onion bulbs/kg N fertilization), which was significantly higher than C × N1 (0.81 t of onion bulbs/kg N fertilization), with a difference of 35.8%.
In this study, the application of BTs significantly altered the yield and nutrient efficiency of directly seeded onions. On a two-year average, the T3 treatment significantly increased bulb yield in all N rates. However, the beneficial effect of Trichoderma spp. was particularly evident under reduced N rates (T3 × N1), where it significantly increased onion yield compared to the standard fertilization rate (C × NS). This effect can be explained by the fact that fungi from the Trichoderma spp. genus synthesize and release auxins, peptides, and various organic compounds that directly stimulate plant growth and development [16].
When combined with reduced N fertilization, T1 and T2 also demonstrated favorable effects on bulb yield, as observed in the two-year average. Specifically, in plots treated with T1 × N1 and T2 × N1, yields were statistically equivalent to C × NS. Similar results have been confirmed in studies with lettuce (Lactuca sativa L.) and onion (Allium cepa L.) [12,42]. This is consistent with Abbas et al. [19], who emphasize that SWE are rich in auxins and cytokinins, which are associated with cell division and elongation in plants. Reducing N input from 150 to 64 kg N/ha resulted in a saving of 86 kg N per hectare. To supply this amount with ammonium nitrate (33% N), a farmer would need approximately 260.6 kg/ha of fertilizer. Based on the updated market price of 0.53 €/kg [43], this reduction corresponds to a cost saving of approximately 138.9 €/ha.
The T1 treatment increased N removal per 10 t of bulb yield under the NS treatment. Abbas et al. [19] found that similar BT can enhance N assimilation in onions. Krouk et al. [44] highlighted increased expression of the NRT 1.1 gene in Arabidopsis plants treated with SWE, which encodes a protein responsible for nitrate transport in guard cells and lateral root development, crucial for N uptake and water regulation. The application of T2 significantly increased N uptake and removal from the soil per 10 t of bulb yield compared to the C. In a study with maize (Zea mays L.), humic substances enhanced nitrate assimilation in young plants (seedlings) [45]. Additionally, the application of humic substances increased N use efficiency and yield of green peppers (Capsicum annuum L.) grown under greenhouse conditions [17], which is also supported by Nardi et al. [46], who state that humic acids stimulate N metabolism in plants.
Furthermore, the application of Trichoderma spp. under reduced N supply (under N1 and N2) improved N use efficiency by lowering N removal per unit of yield. These findings align with the research of Harman [47], emphasizing the ability of Trichoderma spp. fungi to improve N nutritional efficiency.
The results revealed that the application of T1 significantly increased P2O5 removal per 10 t of onion yield under N1. Abbas et al. [19] stated that the effect of SWE on P uptake depends on the onion cultivars. Furthermore, according to the study conducted by Battacharyya et al. [48], the presence of alginic acid in seaweed stimulates the growth of fungi, further contributing to enhanced availability of accessible P for plants. In this study, the T1-treated plants showed increased PUtE, which can enhance bulb yields and quality.
The findings indicate that T2 increased P2O5 removal under conditions of insufficient N fertilization. This effect could be the plant’s response to stressful nutritional conditions demonstrating the significance of humic substances in promoting nutrient uptake and helping plants cope with adverse environmental conditions. A previous study noted that humic substances create a favorable environment for bacteria that enhance the availability of P [49]. For example, Denre et al. [18] demonstrated an increase in P content in garlic using humic substances. Similarly, Lv et al. [50] highlighted that negatively charged molecules of fulvic acid can form humates with P, facilitating its uptake by plants. In this study, the application of T2 showed promising results in improving PUtE, which can contribute to reducing the use of P fertilizers. Furthermore, many studies [51,52] emphasize that humic substances enhance fertilizer use efficiency.
The removal of K2O with a 10 t yield was highest in the C plots in both years, indicating that the application of BTs can reduce the depletion of K2O resources. In shallot (Allium cepa L. Aggregatum group) experiments, seaweed treatment reduced the bulb’s K content [53]. Similar results were observed in onions by Gupta et al. [54]. In contrast, studies by Yassen et al. [55] confirmed increased K content in onions grown with the addition of SWE.
In this study, excessive fertilization with N3 significantly increased K2O removal, and the application of T1 played a substantial role in this effect. This could be one of the influences of SWE on the plant’s condition under abiotic stress. One possible reason is that K regulates the synthesis of enzymes, osmotic balance within cells, and stomatal activity, thereby affecting water utilization efficiency from the substrate [56]. Additionally, changes in K content were highlighted in garlic (Allium sativum L.) after applying SWE in studies by Denre et al. [18]. The use of T1 showed a significant increase in KUtE in plots fertilized with N1 and NS. Kossak and Dyki [57] noticed an increase in the number and size of xylem and phloem cells in tomatoes after applying SWE, which Colla et al. [58] consider evidence of enhanced efficiency in transporting mineral elements throughout the plant. Although this study confirmed the positive effects of BTs on nutrient efficiency, the underlying physiological and biochemical mechanisms require further investigation in future studies.
The consistently higher K2O removal observed in the control plots (Fig. 5) may reflect less efficient K uptake and utilization, or greater unregulated K losses in the absence of biostimulant-induced physiological regulation. Applying the T2 and T3 significantly reduced K2O removal by 10 t of bulb yield, suggesting the potential to reduce K fertilizer usage. This reduction in K2O content in bulbs can be beneficial in some instances, for example, in individuals suffering from kidney diseases, where excessive K accumulation in the blood, known as hyperkalemia, may occur [59]. The World Health Organization recommends a daily K intake of 3510 mg for adults [60]. However, for individuals with hyperkalemia, the recommended K intake is limited to 1500 mg per day [59]. Therefore, there is a need for onion bulbs with low K content for patients with kidney conditions [61]. The application of the same BTs that reduced K2O removal in this experiment (T2 and T3) was also used by Vojnović et al. [2], who reported that they altered the content of total soluble sugars and titratable acidity in onion bulbs, which may influence flavor and overall bulb quality.
The T2 treatment significantly increased KUtE in onions fertilized with N1, NS, and N3. This effect may be attributed to the ability of humic substances to stimulate H+-ATPase activity, which activates ion transporters and enhances ion uptake, ultimately improving the overall nutrient efficiency of the plant [62,63].
BTs increased N utilization from fertilizers, as evidenced by the high PFP values. The increase in PFP in onion production resulting from the application of T1 can be attributed, as stated by Vera et al. [64], to the presence of laminarin, a polysaccharide found in SWE. Laminarin stimulates the synthesis of salicylic acid, leading to an acidic environment that activates the proton pump and enhances the uptake of anions and cations, ultimately improving plant nutrient efficiency [65].
The T2 treatment increased PFP under reduced and standard N fertilization conditions. These results are consistent with the report of Canellas et al. [62] and Nardi et al. [66], who suggest that humic substances can improve nutrient use efficiency, thereby potentially reducing the required amount of fertilizers.
In this study, the most significant increase in PFP was observed with T3, especially under reduced N dosage conditions. This could be attributed to the fungi’s inherent ability to optimize nutrient uptake and plant utilization. López-Bucio et al. [67] state that Trichoderma spp. can enhance mineral uptake and distribution in plant organs, particularly under stressful conditions. Although the PFP values in this study did not exceed 0.9 t/kg N—commonly considered the threshold for very high fertilizer use efficiency—the improvement observed with T3 highlights its potential to enhance nutrient utilization even under reduced N input.
This study demonstrates that BTs treatments significantly influence the yield and nutrient efficiency of directly seeded onions. The treatment Trichoderma spp. improved yield under reduced N rates, as it significantly increased onion yield under the N1 rate compared to the control with standard N rate.
The treatment with seaweed extract enhanced nutrient use efficiency under reduced N rates. This is evident in the seaweed extract × N1 treatment, which significantly improved NUtE, PUtE, KUtE, and PFP compared to the control × NS.
Humic and fulvic acids reduced N uptake under excessive N rates, suggesting a potential protective effect against stress caused by high N levels.
The study recommends the use of Trichoderma spp. in combination with reduced N rates to improve yield and demonstrates that all three BTs contribute to enhancing nutrient use efficiency, offering viable alternatives to excessive fertilization. These findings could help inform sustainable fertilizer use strategies and support future policy initiatives aimed at reducing dependency on mineral fertilizers.
Future research should also explore the long-term effects of BTs on soil health, as well as potential cultivar-specific responses, to better understand their broader applicability across diverse agroecological conditions.
Acknowledgement: We extend our sincere gratitude to the Đukić family farm (Gospođinci), the Extension Service Sombor (Sombor), Hoya V.S. (Subotica), and PrincipEco (Belgrade) for their technical and logistical support during the implementation of the experiments. We also thank Ljiljana Nešović and the students from the Faculty of Agriculture, Course Field and Vegetable Crops, for their assistance in the laboratory. The support of the Ministry of Education, Science, and Technological Development of the Republic of Serbia (contract No. 451-03-137/2025-03/200117, and No. 451-03-4551/2024-04/17) is also gratefully acknowledged.
Funding Statement: The authors received no specific funding for this study.
Author Contributions: Đorđe Vojnović: conceptualization; methodology; software; writing—original draft preparation; resources, Robert Pokluda: validation; data curation; writing—review and editing, Ivana Maksimović: methodology; resources; data curation; writing—review and editing, Janko Červenski: formal analysis; investigation; data curation, Sonja Ilin: formal analysis; investigation; resources, Boris Adamović: investigation; visualization, Jelena Popović-Đorđević: writing—review and editing; validation; supervision. All authors reviewed the results and approved the final version of the manuscript.
Availability of Data and Materials: Not applicable.
Ethics Approval: Not applicable.
Conflicts of Interest: The authors declare no conflicts of interest to report regarding the present study.
References
1. Sagar AN, Pareek A, Benkeblia N, Xiao J. Onion (Allium cepa L.) bioactives: chemistry, pharmacotherapeutic functions, and industrial applications. Food Front. 2022;3(3):380–412. doi:10.1002/fft2.135. [Google Scholar] [CrossRef]
2. Vojnović Đ, Maksimović I, Tepić Horecki A, Karadžić Banjac M, Kovačević S, Daničić T, et al. Onion (Allium cepa L.) yield and quality depending on biostimulants and nitrogen fertilization: a chemometric perspective. Processes. 2023;11(3):684. doi:10.3390/pr11030684. [Google Scholar] [CrossRef]
3. FAOSTAT Statistical Database [Internet]. [cited 2024 Sep 1]. Available from: https://www.fao.org/faostat/en/. [Google Scholar]
4. Vojnović Đ, Adamović B, Ilin Ž. Yields of new onion cultivars under two sowing methods. In: Proceedings of the XIV International Scientific Agriculture Symposium ‘Agrosym 2023’; 2023 Oct 5–8; Jahorina, Bosnia and Hercegovina. [Google Scholar]
5. Vuković S, Popović-Djordjević JB, Kostić AŽ, Pantelić ND, Srećković N, Akram M, et al. Allium species in the Balkan region—major metabolites, antioxidant and antimicrobial properties. Horticulturae. 2023;9(3):408. doi:10.3390/horticulturae9030408. [Google Scholar] [CrossRef]
6. Vojnović Đ, Maksimović I, Koprivica G, Tepić Horecki A, Milić A, Adamović B, et al. Optimizing greenhouse cucumber fertigation through grafting: improving yield, bioactive compounds, and antioxidant activity. Horticulturae. 2024;10(11):1135. doi:10.3390/horticulturae10111135. [Google Scholar] [CrossRef]
7. Milić A, Adamović B, Nastić N, Tepić Horecki A, Pezo L, Šumić Z, et al. Cluster and principal component analyses of the bioactive compounds and antioxidant activity of celery (Apium graveolens L.) under different fertilization schemes. Foods. 2024;13(22):3652. doi:10.3390/foods13223652. [Google Scholar] [PubMed] [CrossRef]
8. Schroder JL, Zhang HL, Girma K, Raun WR, Penna CJ, Payton ME. Soil acidification from long-term use of nitrogen fertilizers on winter wheat. Soil Sci Soc Am J. 2011;75(3):957–64. doi:10.2136/sssaj2010.0187. [Google Scholar] [CrossRef]
9. Geisseler D, Ortiz RS, Diaz J. Nitrogen nutrition and fertilization of onions (Allium cepa L.a literature review. Sci Hortic. 2022;291(21):110591. doi:10.1016/j.scienta.2021.110591. [Google Scholar] [CrossRef]
10. World Bank. Fertilizer prices [Internet]. [cited 2025 Apr 23]. Available from: https://blogs.worldbank.org/en/opendata/fertilizer-prices-stabilize-amid-lower-input-costs-and-trade-shi. [Google Scholar]
11. Rouphael Y, Spíchal L, Panzarová K, Casa R, Colla G. High-throughput plant phenotyping for developing novel biostimulants: from lab to field or from field to lab? Front Plant Sci. 2018;9:1–6. doi:10.3389/fpls.2018.01197. [Google Scholar] [PubMed] [CrossRef]
12. Di Mola I, Cozzolino E, Ottaiano L, Giordano M, Rouphael Y, Colla G, et al. Effect of vegetal- and seaweed extract-based biostimulants on agronomical and leaf quality traits of plastic tunnel-grown baby lettuce under four regimes of nitrogen fertilization. Agronomy. 2019;9(10):571. doi:10.3390/agronomy9100571. [Google Scholar] [CrossRef]
13. Regulation (EU) 2019/1009 of the European Parliament and of the Council laying down rules on the making available on the market of EU fertilizing products and amending Regulations (EC) No 1069/2009 and (EC) No 1107/2009 and repealing Regulation (EC) No 2003/2003 [Internet]. [cited 2024 Jun 4]. Available from: https://eur-lex.europa.eu/legal-content/EN/TXT/?uri=celex%3A32019R1009. [Google Scholar]
14. Calvo P, Nelson L, Kloepper W. Agricultural uses of plant biostimulants. Plant Soil. 2014;383(1–2):3–41. doi:10.1007/s11104-014-2131-8. [Google Scholar] [CrossRef]
15. Rouphael Y, Colla G. Biostimulants in agriculture. Front Plant Sci. 2020;11:1–7. doi:10.3389/fpls.2020.00040. [Google Scholar] [PubMed] [CrossRef]
16. Fiorentino N, Ventorino V, Woo LS, Pepe O, De Rosa A, Gioia L, et al. Trichoderma-based biostimulants modulate rhizosphere microbial populations and improve N uptake efficiency, yield, and nutritional quality of leafy vegetables. Front Plant Sci. 2018;9:743. doi:10.3389/fpls.2018.00743. [Google Scholar] [PubMed] [CrossRef]
17. Varga L, Ducsay L. Influence of sodium humate on the yield and quality of green pepper. Hort Sci. 2003;30(3):116–20. doi:10.17221/6003-HORTSCI. [Google Scholar] [CrossRef]
18. Denre M, Ghanti S, Sarkar K. Effect of humic acid application on accumulation of mineral nutrition and pungency in garlic (Allium sativum L.). Int J Biotechnol Mol Biol Res. 2014;5(2):7–12. doi:10.5897/IJBMBR2014.0186. [Google Scholar] [CrossRef]
19. Abbas M, Anwar J, Zafar-ul-Hye M, Khan R, Saleem M, Rahi A, et al. Effect of seaweed extract on productivity and quality attributes of four onion cultivars. Horticulturae. 2020;6(2):28. doi:10.3390/horticulturae6020028. [Google Scholar] [CrossRef]
20. Vukelić I, Prokić LJ, Racić G, Pešić M, Bojović M, Sierka E, et al. Effects of Trichoderma harzianum on photosynthetic characteristics and fruit quality of tomato plants. Int J Mol Sci. 2021;22(13):6961. doi:10.3390/ijms22136961. [Google Scholar] [PubMed] [CrossRef]
21. European Commission. A farm to fork strategy for a fair, healthy and environmentally-friendly food system [Internet]. [cited 2025 Apr 23]. Available from: https://food.ec.europa.eu/system/files/2020-05/f2f_action-plan_2020_strategy-info_en.pdf. [Google Scholar]
22. FAO. International code of conduct for the sustainable use and management of fertilizers. [Internet]. [cited 2025 Apr 23]. Available from: https://www.fao.org/documents/card/en/c/cb7857en. [Google Scholar]
23. Ortega-García J, Montes-Belmont R, Rodríguez-Monroy M, Ramírez-Trujillo J, Suárez-Rodríguez R, Sepúlveda-Jiménez G. Effect of Trichoderma asperellum applications and mineral fertilization on growth promotion and the content of phenolic compounds and flavonoids in onion. Sci Hortic. 2015;195(25):8–16. doi:10.1016/j.scienta.2015.08.027. [Google Scholar] [CrossRef]
24. Gemin L, Mógor Á, De Oliveira Amatussi J, Mógor G. Microalgae associated to humic acid as a novel biostimulant improving onion growth and yield. Sci Hortic. 2019;256:108560. doi:10.1016/j.scienta.2019.108560. [Google Scholar] [CrossRef]
25. Soubeih AA. Effect of fertilizer packages and polymers on onion yield and quality under Bahariya Oasis conditions. Middle East J Agric Res. 2018;7:1769–85. [Google Scholar]
26. Ncayiyana M, Maboko MM, Bertling I. Yield and nutritional quality of different short-day onion cultivars as affected by nitrogen application. S Afr J Plant Soil. 2017;201835(3):215–21. doi:10.1080/02571862.2017.1345016. [Google Scholar] [CrossRef]
27. Bekele Etana BM, Mohammed A, Nebiyu A. Effects of different level of nitrogen fertilizer application on growth, yield, quality and storage life of onion (Allium cepa L.) at Jima, South Western Ethiopia. J Nat Sci. 2019;9:32–40. doi:10.7176/JNSR/9-10-05. [Google Scholar] [CrossRef]
28. Gererufael L, Abraham N, Reda T. Growth and yield of onion (Allium cepa L.) as affected by farmyard manure and nitrogen fertilizer application in Tahtay Koraro District, Northwestern zone of Tigray, Ethiopia. Vegetos. 2020;33(4):617–27. doi:10.1007/s42535-020-00132-7. [Google Scholar] [CrossRef]
29. Dodgson J, Weston AK, Marks DJ. Use of stabilised amine nitrogen (SAN) reduces required nitrogen input and increases yield of onions (Allium cepa L.). Crops. 2023;3(2):148–57. doi:10.3390/crops3020015. [Google Scholar] [CrossRef]
30. Vojnović Đ, Maksimović I, Tepić Horecki A, Milić A, Šumić Z, Žunić D, et al. Biostimulants improve bulb yield, concomitantly affecting the total phenolics, flavonoids, and antioxidant capacity of onion (Allium cepa). Horticulturae. 2024;10(4):391. doi:10.3390/horticulturae10040391. [Google Scholar] [CrossRef]
31. Republic Hydrometeorological Service of Serbia (RHMSS). Official website [Internet]. [cited 2025 Apr 24]. Available from: https://www.hidmet.gov.rs/index_eng.php. [Google Scholar]
32. Vojnović Đ, Maksimović I, Tepić Horecki A, Žunić D, Adamović B, Milić A, et al. Biostimulants affect differently biomass and antioxidant status of onion (Allium cepa) depending on production method. Horticulturae. 2023;9(12):1345. doi:10.3390/horticulturae9121345. [Google Scholar] [CrossRef]
33. Agricultural Extension Service Sombor [Internet]. [cited 2025 Apr 22]. Available from: https://www.psssombor.rs/o-nama.html. [Google Scholar]
34. Nelson DW, Sommers LE. Determination of total nitrogen in plant material. Agron J. 1973;65(1):109–12. doi:10.2134/agronj1973.00021962006500010033x. [Google Scholar] [CrossRef]
35. Cavell J. The colorimetric determination of phosphorus in plant materials. J Sci Food Agric. 1955;6(8):479–80. doi:10.1002/jsfa.2740060814. [Google Scholar] [CrossRef]
36. Johnston RB, Duncan WC, Lawton K, Benne JE. Determination of potassium in plant materials with a flame photometer. J AOAC Int. 1952;35(4):813–6. doi:10.1093/jaoac/35.4.813. [Google Scholar] [CrossRef]
37. Moll HR, Kamprath JE, Jackson AW. Analysis and interpretation of factors which contribute to efficiency of nitrogen utilization. J Agron. 1982;74(3):562–4. doi:10.2134/agronj1982.00021962007400030037x. [Google Scholar] [CrossRef]
38. Dobermann A. Nutrient use efficiency-measurement and management. In: Proceedings of the International Fertilizer Industry Association (IFA) Workshop on Fertilizer Best Management Practices; 2007 Mar 7–9; Brussels, Belgium. [Google Scholar]
39. White JP, Hammond PJ, King JG, Bowen CH, Hayden MR, Meacham CM, et al. Genetic analysis of potassium use efficiency in Brassica oleracea. Ann Bot. 2010;105(7):1199–210. doi:10.1093/aob/mcp253. [Google Scholar] [CrossRef]
40. Meier S, Moore F, Morales A, Jobet C, Lopez-Olivari R, Aponte H, et al. Interactive role between phosphorus utilization efficiency and water use efficiency: a tool to categorize wheats co-adapted to water and phosphorus limiting conditions. Agric Water Manag. 2021;248:106765. doi:10.1016/j.agwat.2021.106765. [Google Scholar] [CrossRef]
41. Liang J, Tang M, Chan SP. A generalized Shapiro-Wilk W statistic for testing high-dimensional normality. Comput Stat Data Anal. 2009;53(11):3883–91. doi:10.1016/j.csda.2009.04.016. [Google Scholar] [CrossRef]
42. Hafez E, Geries L. Effect of nitrogen fertilization and biostimulative compounds on onion productivity. Certec Agron Mold. 2018;1(1):75–90. doi:10.2478/cerce-2018-0007. [Google Scholar] [CrossRef]
43. Hemoslavija DOO. Product information and fertilizer prices [Internet]. [cited 2025 Apr 15]. Available from: https://www.hemoslavija.co.rs. [Google Scholar]
44. Krouk G, Lacombe B, Bielach A, Perrine-Walker F, Malinska K, Mounier E, et al. Nitrate-regulated auxin transport by NRT1.1 defines a mechanism for nutrient sensing in plants. Dev Cell. 2010;18(6):927–37. doi:10.1016/j.devcel.2010.05.008. [Google Scholar] [PubMed] [CrossRef]
45. Nardi S, Pizzeghello D, Gessa C, Ferrarese L. A low molecular weight humic fraction on nitrate uptake and protein synthesis in maize seedlings. Soil Biol Biochem. 2000;32(3):415–9. doi:10.1016/S0038-0717(99)00168-6. [Google Scholar] [CrossRef]
46. Nardi S, Ertani A, Francioso O. Soil-root cross-talking: the role of humic substances. J Plant Nutr Soil Sci. 2017;180(1):5–13. doi:10.1002/jpln.201600348. [Google Scholar] [CrossRef]
47. Harman GE. Myths and dogmas of biocontrol. Changes in perceptions derived from research on Trichoderma harzianum T-22. Plant Dis. 2000;84(4):377–93. doi:10.1094/PDIS.2000.84.4.377. [Google Scholar] [PubMed] [CrossRef]
48. Battacharyya D, Zamani Babgohari M, Rathor P, Prithiviraj B. Seaweed extracts as biostimulants in horticulture. Sci Hortic. 2015;196:39–48. doi:10.1016/j.scienta.2015.09.012. [Google Scholar] [CrossRef]
49. Busato JG, Silva LL, Aguiar NO, Canellas LP, Olivares FL. Changes in labile phosphorus forms during maturation of vermicompost enriched with phosphorus-solubilizing and diazotrophic bacteria. Bioresour Technol. 2012;110:390–5. doi:10.1016/j.biortech.2012.01.126. [Google Scholar] [PubMed] [CrossRef]
50. Lv D, Sun H, Zhang M, Li C. Fulvic acid fertilizer improves garlic yield and soil nutrient status. Gesunde Pflanz. 2022;74(3):685–93. doi:10.1007/s10343-022-00644-z. [Google Scholar] [CrossRef]
51. Nardi S, Pizzeghello D, Muscolo A, Vianello A. Physiological effects of humic substances on higher plants. Soil Biol Biochem. 2002;34(11):1527–36. doi:10.1016/S0038-0717(02)00174-8. [Google Scholar] [CrossRef]
52. Nardi S, Schiavon M, Muscolo A, Pizzeghello D, Ertani A, Canellas PL, et al. Molecular characterization of humic substances and regulatory processes activated in plants. Front Plant Sci. 2022;13:851451. doi:10.3389/fpls.2022.851451. [Google Scholar] [PubMed] [CrossRef]
53. Francke A, Majkowska-Gadomska J, Kaliniewicz Z, Jadwisienczak K. No effect of biostimulants on the growth, yield and nutritional value of shallots grown for bunch harvest. Agronomy. 2022;12:1156. doi:10.3389/fpls.2018.00743. [Google Scholar] [CrossRef]
54. Gupta S, Strik AW, Plačkova L, Kulkarni GM, Doležal K, Van Staden J. Interactive effects of plant growth-promoting rhizobacteria and a seaweed extract on the growth and physiology of Allium cepa L. (onion). J Plant Physiol. 2021;262:153437. doi:10.1016/j.jplph.2021.153437. [Google Scholar] [PubMed] [CrossRef]
55. Yassen AA, Abou-Elnour AAE, Abou Seeda AM, Abdallah SMM, El-Sayed AAS. Effect of potassium fertilization levels and algae extract on growth, bulb yield and quality of onion (Allium cepa L.). Middle East J Agric Res. 2018;7(45):625–38. doi:10.5897/ajar10.1025. [Google Scholar] [CrossRef]
56. Mostofa GA, Rahman M, Ghosh T, Kabir HA, Abdelrahman M, Khan M, et al. Potassium in plant physiological adaptation to abiotic stresses. Plant Physiol Biochem. 2022;186(1):279–89. doi:10.1016/j.plaphy.2022.07.011. [Google Scholar] [PubMed] [CrossRef]
57. Kossak K, Dyki B. Effects of biostimulators on cultivation of Aboney F1 greenhouse tomato. In: Dąbrowski ZT, editor. Biostimulators in modern agriculture. Warsaw, Poland: Editorial House Wieś Jutra; 2008. p. 13–20. [Google Scholar]
58. Colla G, Cardarelli M, Bonini P, Rouphael Y. Foliar applications of protein hydrolysate, plant and seaweed extracts increase yield but differentially modulate fruit quality of greenhouse tomato. HortScience. 2017;52(9):1214–20. doi:10.21273/HORTSCI12200-17. [Google Scholar] [CrossRef]
59. Putcha N, Allon M. Management of hyperkalemia in dialysis patients. Semin Dial. 2007;20(5):431–9. doi:10.1111/j.1525-139X.2007.00312.x. [Google Scholar] [PubMed] [CrossRef]
60. World Health Organisation (WHO) [Internet]. [cited 2025 Aug 2]. Available from: https://www.who.int. [Google Scholar]
61. Okada H, Abedin T, Yamamoto A, Hayashi T, Hosokawa M. Production of low-potassium onions based on mineral absorption patterns during growth and development. Sci Hortic. 2010;267:109252. doi:10.1016/j.scienta.2020.109252. [Google Scholar] [CrossRef]
62. Canellas L, Olivares F, Aguiar N, Jones D, Nebbioso A, Mazzei P, et al. Humic and fulvic acids as biostimulants in horticulture. Sci Hortic. 2015;196(6):15–27. doi:10.1016/j.scienta.2015.09.013. [Google Scholar] [CrossRef]
63. Muscolo A, Pizzeghello D, Francioso O, Sanchez Cortes S, Nardi S. Effectiveness of humic substances and phenolic compounds in regulating plant-biological functionality. Agronomy. 2020;10(10):1553. doi:10.3390/agronomy10101553. [Google Scholar] [CrossRef]
64. Vera J, Castro J, Gonzalez A, Moenne A. Seaweed polysaccharides and derived oligosaccharides stimulate defense responses and protection against pathogens in plants. Mar Drugs. 2011;9(12):2514–25. doi:10.3390/md9122514. [Google Scholar] [PubMed] [CrossRef]
65. Gordon A, Minibayeva F, Rakhmatulina D, Alyabyev A, Ogorodnikova T, Loseva N, et al. Heat production of wheat roots induced by the disruption of proton gradient by salicylic acid. Thermochim Acta. 2004;422(1–2):101–4. doi:10.1016/j.tca.2004.04.032. [Google Scholar] [CrossRef]
66. Nardi S, Schiavon M, Muscolo A, Pizzeghello D, Ertani A, Canellas PL, et al. Editorial: molecular characterization of humic substances and regulatory processes activated in plants, volume II. Front Plant Sci. 2024;15:1413829. doi:10.3389/fpls.2024.1413829. [Google Scholar] [PubMed] [CrossRef]
67. López-Bucio J, Pelagio-Flores R, Herrera-Estrella A. Trichoderma as biostimulant: exploiting the multilevel properties of a plant beneficial fungus. Sci Hortic. 2015;196(1):109–23. doi:10.1016/j.scienta.2015.08.043. [Google Scholar] [CrossRef]
Cite This Article
 Copyright © 2025 The Author(s). Published by Tech Science Press.
This work is licensed under a Creative Commons Attribution 4.0 International License , which permits unrestricted use, distribution, and reproduction in any medium, provided the original work is properly cited.
 Downloads
 Citation Tools