
 Submit a Paper
 Propose a Special lssue
 Open Access
ARTICLE

Leaf Position on the Sunflower Stem Determines Physiological Condition during Flowering
1 Department of Industrial Plants Breeding and Genetics, Agricultural Institute Osijek, Osijek, 31000, Croatia
2 Agrochemical Laboratory, Agricultural Institute Osijek, Osijek, 31000, Croatia
3 Faculty of Agrobiotechnical Sciences Osijek, J.J. Strossmayer University of Osijek, Osijek, 31000, Croatia
* Corresponding Authors: Antonela Markulj Kulundžić. Email: ; Marija Viljevac Vuletić. Email:
(This article belongs to the Special Issue: Influence of Biotic and Abiotic Stresses Signals on Plants and their Performance at Different Environments)
Phyton-International Journal of Experimental Botany 2025, 94(7), 2075-2095. https://doi.org/10.32604/phyton.2025.065961
Received 26 March 2025; Accepted 19 June 2025; Issue published 31 July 2025
 View Full Text
 Download PDF
Abstract
Sunflower leaf photosynthesis strongly depends on the leaf position in the plant stem conditioning, which directly affects other physiological processes. Therefore, a study of the leaf’s physiological status regarding the leaf position in the stem was performed on sunflowers in the flowering stage. Eight differently positioned leaves were investigated, starting with the youngest leaf on the top of the stem to the leaves of the stem bottom, assigned as the oldest senescent leaves. According to chlorophyll fluorescence (ChlF) parameters connected to photosystem II (PSII) processes, significant changes in PSII functioning occurred only in the senescent leaves, while photosystem I (PSI) describing parameters showed a linear decrease with leaf age, i.e., position on the stem. The antioxidative status of the leaves was dynamic, as stress indicators (lipid peroxidation and hydrogen peroxide content) fluctuated regarding leaf position on the stem, but no link was found between the activities of antioxidative enzymes and oxidative stress indicators. Linear decrease trend of secondary metabolites (mainly phenolic compounds) correlated with antioxidant activity, except for some phenolic acids (caffeic and ferulic acid), which increased in senescent leaves. The most changes in the physiological status of the leaves were confirmed in senescent leaves, which stand out the importance of younger leaves in maintaining the plant’s vitality after flowering, which is the most important for sunflower yield.Keywords
Due to the high oil content in the seeds, sunflower (Helianthus annuus L.) is an industrial crop with great economic importance and is primarily grown for edible vegetable oil production. It is an extremely useful plant that is excellent as a crop rotation, leaves the soil free of weeds and in good physical condition, and is also a desirable honey crop [1,2]. Cultivated sunflower has a characteristic morphology that largely depends on the genotype, agrotechnics, and the environment in which it is grown. The morphology of plants and the duration of certain developmental stages are good indicators of climate and weather changes. Morphological changes follow from the cumulative impact of stress resulting from molecular and physiological changes, that is, changes in the composition of the plant proteomics, transcriptomes, and metabolomes based on changes in gene expression [3,4].
The sunflower is distinguished by a characteristic arrangement of leaves on the stem. The first two to six leaves on a sunflower stem are opposite, while the others develop spirally, i.e., alternately. The number of leaves per plant depends on the genotype, type of sunflower, and production technology [2]. In the initial stages of growth, the leaves are tender, soft, and elastic, and at the end of maturing, they become rough and brittle. The number of leaves decreases due to disease or the natural course of vegetation, i.e., senescence. Leaf area depends on the shape, number, and size of leaves, positioning on the plant stem, genotype, development stage, sunflower type, production technology, and its availability depends on assimilation, transpiration, respiration, and photosynthesis. The lower and top leaves on the sunflower stem are narrower, smaller, and more pointed, which is the opposite of the leaves on the central part of the stem, which are less pointed, larger, and more oval. The peak of sunflower leaf mass development is reached during flowering. After flowering, the number of leaves decreases, which is a consequence of the plant’s maturing, so the leaves dry up and fall off. The most significant leaves on sunflowers are in the middle of the stem because their assimilation surface is the largest. The lower and upper leaves have a smaller assimilation surface and are, therefore, less significant. The lower leaves are responsible for forming the above-ground part of the plant and the roots. Before sowing, choosing a hybrid with a favourable assimilation surface is important. Using valid agricultural techniques ensures the leaf surface lasts as long as possible.
In early development, the leaf is a collector that requires nutrients from the rest of the plant, but as soon as it reaches full photosynthetic capacity, it becomes the main original organ of the plant [5]. Some leaf functions are the formation of grain size and fullness, grain yield, and oil content in the seed, but not all leaves have the same influence on them [6]. However, the main function of the leaves is the implementation of photosynthesis, which in sunflowers depends on the leaves’ position and senescent. The difference in the speed of photosynthesis is created concerning the angle of the positioning of the leaf on the stem in relation to the horizontal plane [7]. The photosynthetic process in the sunflower leaves is directly related not only to the size of the leaf surface but also to its activity, duration, and productivity of the leaf mass, and the rate of nutrient transfer to the seed also depends on it [7].
Leaf maturation is the process of leaf growth involving constant cell proliferation and expansion. When the leaf becomes fully competent, it reaches maturity. Leaf chloroplasts retain their activity until the last senescing stage, while degradation of the cytochrome b6f complex, electron flow, and proton conductivity occur earlier than chlorophyll degradation [8]. The last stage of leaf development is senescence, a complex process controlled by multiple genetic and environmental variables that alter leaf metabolism [9,10]. The reduction of photosynthetic activity due to chloroplast degradation is an early senescence signal [9,11]. Chloroplast degradation coincides with the catabolism of macromolecules, namely proteins, nucleic acids, and lipids [10,12]. Photosynthetic protein degradation directly reduces green leaf surface, which may cause significant economic losses, especially in the grain-filling stage [13]. Therefore, delaying senescence influences grain yield, mostly due to photosynthesis during the reproductive stage [9,14]. However, stimulated degradation of macromolecules in senescence is the source of nutrients for new growth and storage organs [11,15], so leaf senescence is an important plant biological strategy for viability in the next generation or season [10].
Homeostasis of cellular energetic and metabolic status is strongly influenced by the production of reactive oxygen species (ROS), whose concentration determines the redox status of cells. ROS are signalling molecules in small concentrations that regulate stress-responsive gene expression [16]. Overall accumulation of ROS strongly influences redox processes in plants, creating localized oxidative environment mainly as a toxic byproduct of metabolism [17], especially in senescence when increased oxidative damage to cellular macromolecules occurs mainly due to hydrogen peroxide and superoxide anion radicals [18]. Since plant ageing increases oxidative stress and ROS levels, the antioxidant protection may weaken. Various enzymatic and non-enzymatic antioxidant defences control the level of ROS. The main enzymatic components are enzymes of the ascorbate-glutathione cycle, i.e., superoxide dismutases, peroxidases, and catalases [19,20]. Moreover, polyphenols, as a significant group of bioactive compounds, are involved in ascorbate-dependent antioxidative mechanisms in the regulation of ROS in plants, while flavonoids, amongst other phenolic compounds, are chelating agents with strong oxidant capacity, participate in lipid peroxidation [21].
To understand the physiological status, i.e., viability of sunflower leaves, we intended to assess the differences between sunflower leaf positions by evaluating the trends of enzymatic and non-enzymatic antioxidative parameters and photosynthetic performance in field environmental conditions during the flowering stage. We are intrigued by the antioxidant status, photosystem I (PSI), and photosystem II (PSII) energy transfer, as well as the structural and functional changes at the acceptor and donor site depending on the positioning of the leaf, i.e., its leaf senescence in the flowering stage of the sunflower.
The experiment was carried out in a field trial of the sunflower hybrid Luka at the Agricultural Institute Osijek. Luka is a self-bread hybrid of the Agricultural Institute Osijek. It is a two-line, mid-early hybrid with a growing season lasting between 115 and 120 days. It is characterized by a strong stem, high genetic potential for grain yield (6 t/ha), and oil content (51%–53% dry mass). Hybrid Luka can be grown in different agroecological conditions. It tolerates drought and the most significant sunflower diseases. Luka is a suitable choice because the optimal height of plants characterizes it with a sufficient number of developed leaves on the stem, allowing good air circulation at typical planting densities. The experiment was arranged in four rows and replicated three times. Two sunflower seeds were manually sown at a depth of 4 cm in sandy clay loam soil. The rows were 5 m long, with a spacing of 70 cm between rows and 23 cm between plants within the rows. During the experiment, all of the agrotechnical measures were performed by following the recommendations and requirements of sunflower cultivation.
The hybrid Luka is characterized by about 16 leaves, of which a total of 8 leaves were analyzed. The labels 1st, 3rd, 5th, 7th, 9th, 11th, 13th and 15th leaves were used to explain the results (Fig. 1). The first three leaf positions (1st, 3rd, and 5th) represent young leaves, the second three (7th, 9th, and 11th) represent mature leaves, and the last two positions (13th and 15th) represent the oldest, i.e., senescent leaves.
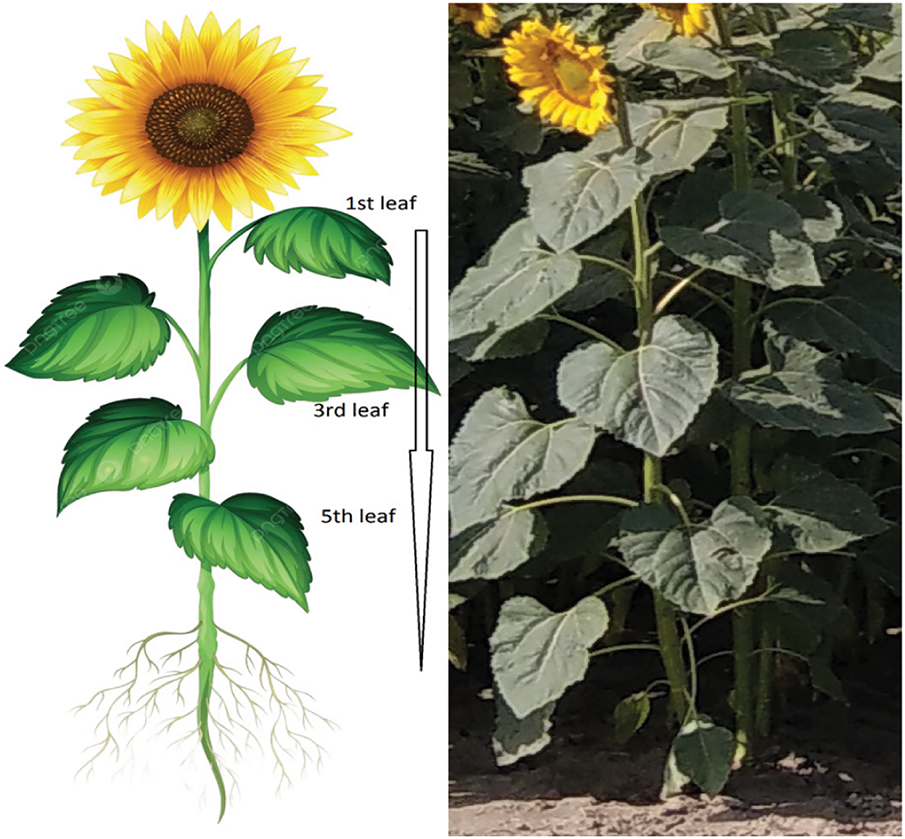
Figure 1: Leaf positions on the stem of hybrid Luka
The measurement and tissue sampling for laboratory analysis were carried out in the generative flowering stage (R3/R4) when all the leaves of the plants had developed [22]. Measurements and sampling were done on the second and third rows of plants in the middle rows from 7:30 to 8:30 a.m. on every second leaf on the stem, starting from the top of the plants and moving towards the root. The first leaf represented the first fully developed leaf under the sunflower’s head. After that, every second leaf going from top to bottom is tested. The leaves on which the measurement was performed were taken for further laboratory analyses. The average temperature of all the sunflower leaves was 22.1°C during the measurement and sampling. No statistically significant difference in leaf temperature was found between the leaves’ positions on the sunflower’s stem (data not shown). The measurement and tissue sampling were done in July 2021.
2.3 Chlorophyll a Fluorescence (ChlF)
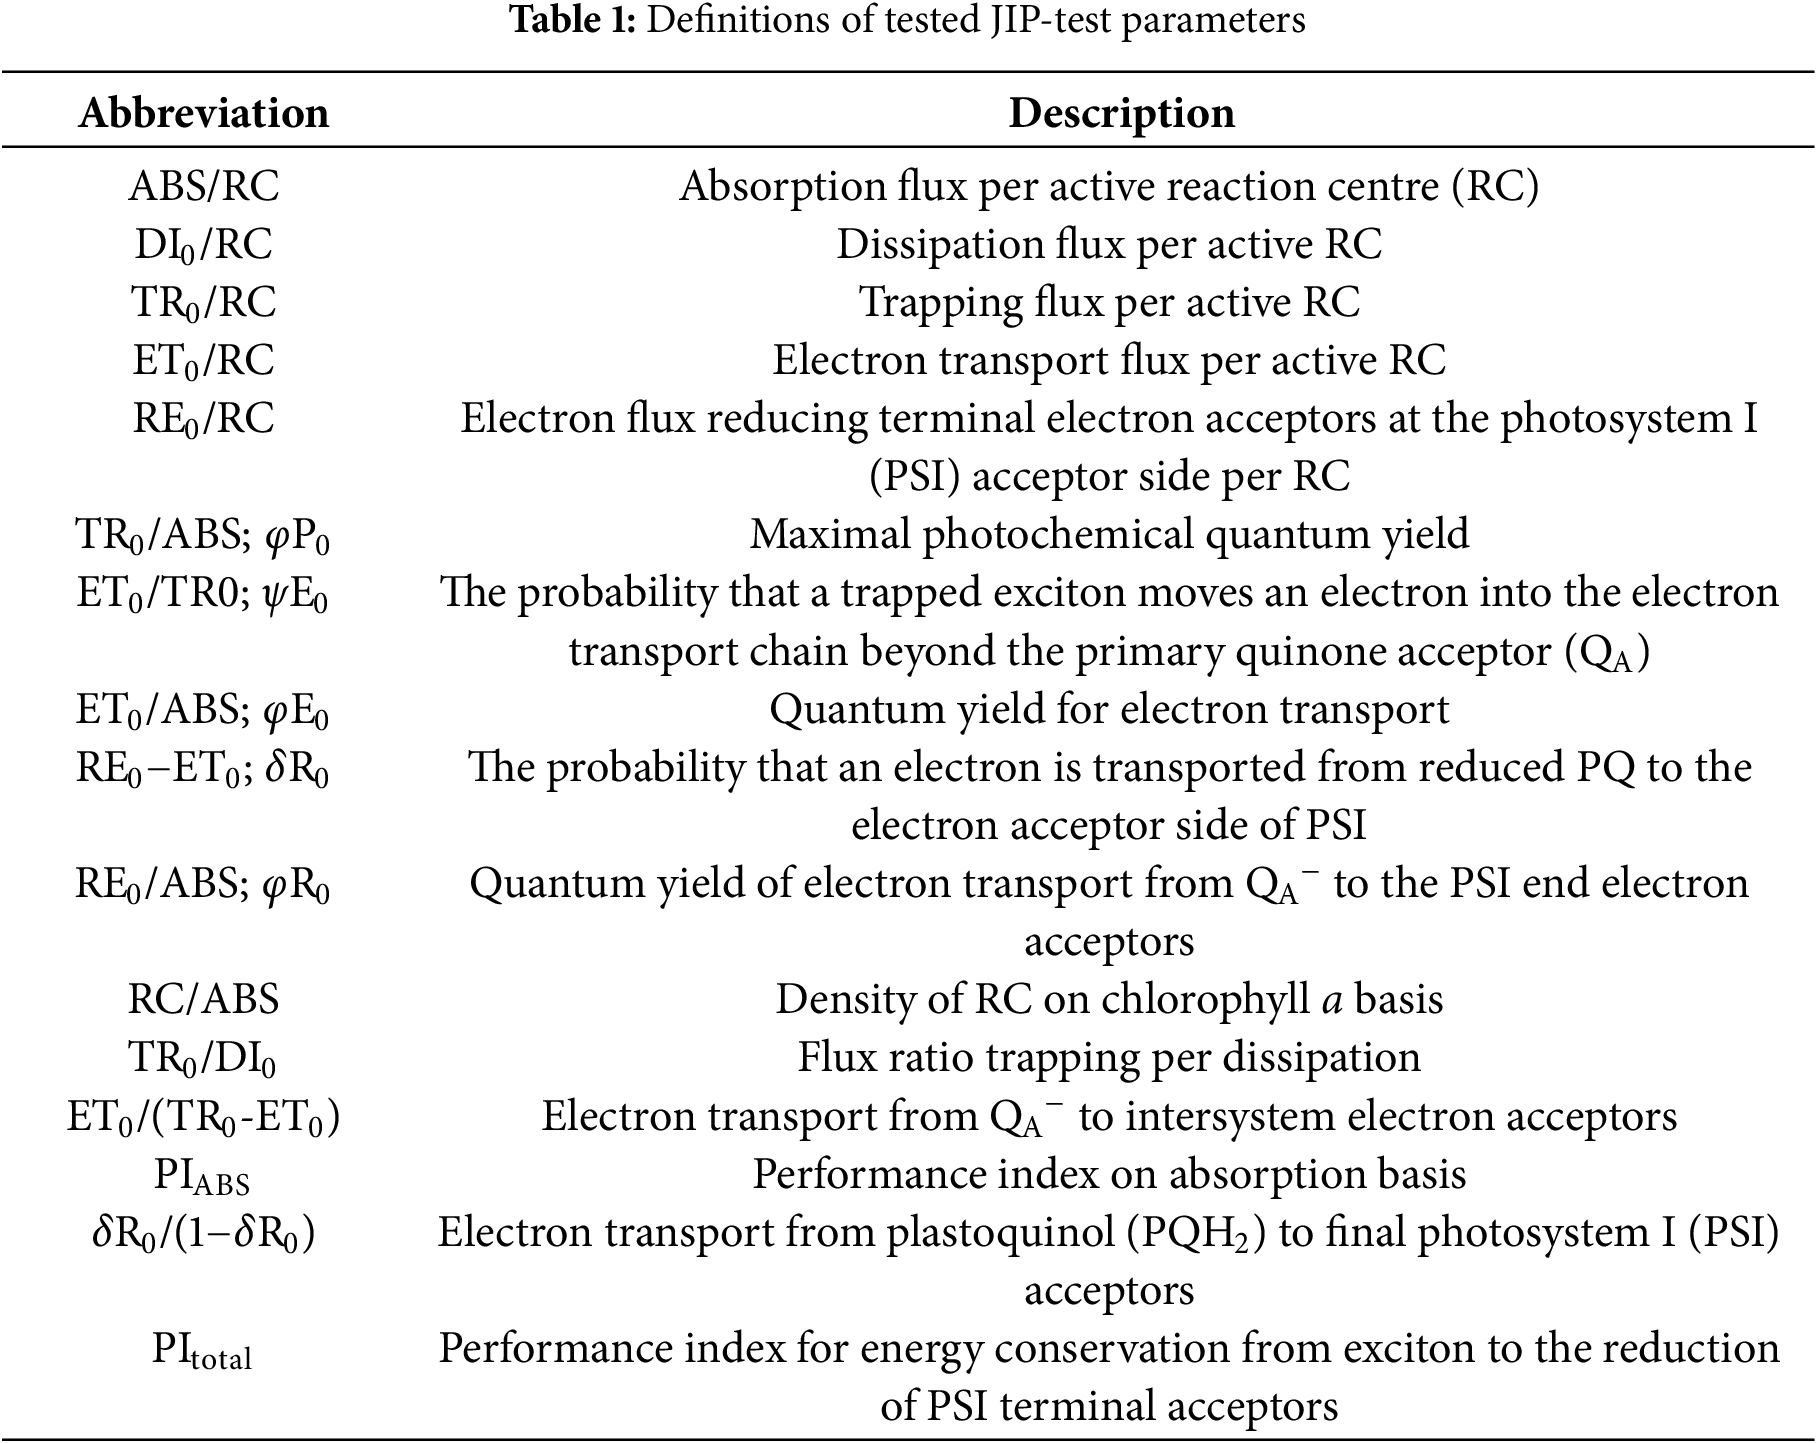
Clips were placed on leaves for 30 min to achieve dark conditions before ChlF measurement. ChlF was measured on each second leaf on six plants per repetition (18 plants in total per leaf position) by a plant efficiency analyzer (Handy PEA, Hansatech Instruments Ltd., Norfolk, UK). The leaves were applied with a saturation pulse of actinic red light (650 nm) at 3500 μmol/m2s maximum intensity. ChlF data of one-second measurements were used to calculate JIP-test parameters (Table 1) for this research, according to Strasser et al. [23], Yusuf et al. [24], and Stirbet and Govindjee [25]. Fast chlorophyll fluorescence rise was visualized as native and relative variable fluorescence (Vt) curves on a logarithmic scale.
2.4 Tissue Homogenization for Laboratory Analyses
Fresh leaf material was sampled for laboratory analyses after ChlF measurements. Half of the collected sample was powdered in liquid nitrogen using Mill A11 (IKA, Königswinter, Germany) and used for analyses of lipid peroxidation (malondialdehyde—MDA content), hydrogen peroxide (H2O2), proline and soluble protein content as well as for enzymatic activities and photosynthetic pigments determination. The remaining part of the sample was freeze-dried and milled by a centrifugal mill ZM1 (Retsch, Haan, Germany) prior to analyses of total phenolics, flavonoids, and antioxidant activity.
Photosynthetic pigments were extracted from fresh, powdered sunflower leaf tissue using absolute acetone. The concentrations of chlorophyll a, chlorophyll b, carotenoids (Car), and the Chl a/b ratio were calculated based on absorbance values at 470 nm, 647 nm, and 663 nm, using the equations provided by Lichtenthaler [26]. Absorbance was measured with a Specord 200 spectrophotometer (Analytik, Jena, Germany), using acetone as the blank. Pigment concentrations were expressed in milligrams per gram of fresh weight (mg/g FW).
2.6 Lipid Peroxidation and Hydrogen Peroxide Content
Lipid peroxidation and hydrogen peroxide (H2O2) content were determined in extracts prepared from homogenized fresh tissue powder (0.1 g) with 0.1% (w/v) trichloroacetic acid (TCA) (1 mL). After 15 min in an ice bath, the homogenate was centrifuged (Universal 320R, Hettich, Germany) for 15 min at 14,000× g at 4°C.
Lipid peroxidation was determined by measuring malondialdehyde (MDA) levels using the thiobarbituric acid (TBA) assay, as described by [27]. For the analysis, 0.5 mL of supernatant was mixed with 1 mL of 0.5% TBA prepared in 20% trichloroacetic acid (TCA), and the mixture was incubated at 95°C for 30 min. After incubation, the samples were cooled and centrifuged at 14,000× g for 15 min at 4°C. The resulting supernatants were used to measure absorbance at 532 nm and 600 nm with a Specord 200 spectrophotometer (Analytik Jena, Jena, Germany), using a reagent blank (0.5% TBA in 20% TCA). MDA content was calculated using an extinction coefficient of 155 mM−1 cm−1 and expressed as nanomoles per gram of fresh weight (nmol/g FW).
The H2O2 content in extracts was quantified by the potassium iodide method [28]. The reaction mixture consisted of 0.25 mL of 10 mM potassium phosphate buffer (pH 7.0), 0.5 mL of 1 M potassium iodide and 0.25 mL of sample extracts. After 20 min of dark incubation, the absorbance of the reaction mixture was read at 390 nm in an Epoch microplate spectrophotometer (Bio-Tek, Bad Friedrichshall, Germany). H2O2 content was expressed as µmol/g FW based on the H2O2 calibration curve.
Free proline content was determined using ultrasound-assisted extraction, according to the method described by [29]. Precisely 0.1 g of fresh powdered tissue was homogenized in 1 mL of 80% (v/v) aqueous ethanol and subjected to sonication for 60 min at 25°C in a thermostat-controlled ultrasound bath (Sonorex RK 510H, Bandelin Electronic, Berlin, Germany). After extraction, the samples were centrifuged at 14,000× g for 10 min at 4°C, and the resulting supernatant was collected for analysis. For the colourimetric reaction, 50 µL of the extract was mixed with 100 µL of a reaction mixture containing 1% (w/v) ninhydrin, 60% (v/v) acetic acid, and 20% (v/v) ethanol. The mixture was then heated at 95°C for 20 min in a heating block. After cooling to room temperature, the samples were briefly centrifuged (1 min at 2500× g), and 100 µL of the reaction mixture was transferred to a polypropylene microplate. Absorbance was measured at 520 nm using an Epoch microplate spectrophotometer. Proline concentration was calculated using a standard curve and expressed as µmol/g fresh weight.
2.8 Soluble Protein Content and Enzyme Activities
Crude proteins were extracted from approximately 0.2 g of fresh powdered tissue using 1 mL of extraction buffer consisting of 100 mM potassium phosphate buffer (pH 7.0), supplemented with 5 mM ascorbic acid, 0.1 mM EDTA, and 3% (w/v) polyvinylpyrrolidone (PVP). The homogenate was kept on ice for 15 min and then centrifuged at 14,000× g for 15 min at 4°C. A second extraction with an additional 1 mL of the same buffer was performed, and the resulting supernatants were pooled. These pooled extracts were used to determine enzyme activities and soluble protein content. Five separate extractions were performed for each sample, and all enzyme activity measurements were conducted in at least duplicate. Enzyme kinetics were monitored and recorded using a Specord 200 spectrophotometer (Analytik Jena, Germany). Enzyme activities were expressed as nkatal/mg protein, representing the catalytic conversion of 1 nanomole of substrate per second per milligram of protein.
Soluble protein content was determined using the Bradford assay [30]. After homogenization of 10 µL of crude protein extract, 40 µL of dH2O, and 1 mL of Coomassie Brilliant Blue reagent, the reaction mixture was kept at room temperature, and after 7 min, an absorbance reading at 595 nm was taken in an Epoch microplate spectrophotometer. The soluble protein content was expressed as mg/g FW and used to calculate and express enzyme activities in the same crude extract based on the BSA calibration curve.
Guaiacol peroxidase (GPOD) activity was measured according to Siegel and Galston [31]. By adding 100 µL of crude protein extract to 900 µL of a reaction mixture containing 5 mM guaiacol and 5 mM H2O2 in 0.2 M phosphate buffer, pH 5.8, the enzymatic reaction was initiated. The absorbance of tetra-guaiacol was monitored at 470 nm for 1 min and used to calculate GPOD activity. The Nakano and Asada method [32] traced ascorbate peroxidase (APX) activity. The enzymatic reaction was initiated by adding 10 µL of 12 mM H2O2 in 990 µL of the reaction mixture (935 µL 50 mM potassium phosphate buffer (pH 7.0) with 0.1 mM EDTA, 5 µL 25 mM ascorbic acid, and 50 µL of crude protein extract).
By measuring the initial rate of H2O2 degradation, catalase (CAT) activity was examined [33]. Enzyme kinetics were initialized by extracting 20 µL of crude protein with 980 µL of a reaction mixture consisting of 50 mM potassium phosphate buffer, pH 7.0, and 20 mM H2O2. Absorbance at 240 nm was measured for one minute.
The activity of polyphenol oxidase (PPO) was determined as a rate of oxidation of pyrogallol to quinones at 40°C measured as an increase in absorbance at 430 nm over two minutes [34]. The enzymatic reaction started with the addition of 10 µL of crude protein extract to the reaction mixture (890 µL of 100 mM potassium phosphate buffer, pH 7.0, and 0.1 mL of 0.1 M pyrogallol).
2.9 Bioactive Compounds and Antioxidant Activity
Lyophilized leaf tissue was used for the extraction of total phenols and total flavonoids (bioactive compounds) by ultrasound-assisted solid-liquid extraction for 60 min at 25°C in a thermostat-controlled ultrasound bath (Sonorex RK 510H, Bandelin Electronic, Germany). In detail, 0.025 g of lyophilized powdered tissue was homogenated 1 mL of methanol. After sonification, the sample was centrifuged at 14,000× g at 4°C for 10 min. The supernatant was used to determine total phenols and flavonoid content, and antioxidant activity.
The modified Folin-Ciocalteu method [35] was used to determine the total phenolic content. In brief, the reaction mixture consisted of 10 µL of the extract, 1.59 mL of dH2O, 0.1 mL of Folin-Ciocalteu reagent (1:1; v/v diluted with water), and finally, 0.3 mL of sodium carbonate solution (20%; w/v diluted with water) which was added 5 min after first three components. The development of the reaction lasted 30 min in a dark place at room temperature. Absorbance readings of reaction products were taken at 765 nm in the Epoch microplate spectrophotometer. The content of total phenolics was expressed as mg of gallic acid equivalents per g FW (mgGAE/g FW) based on a gallic acid calibration curve (0.05–3 mg/mL).
The modified aluminium chloride (AlCl3) colourimetric method [36] was used to assay the sunflower leaf flavonoid content. A 0.1 mL of extract aliquot was mixed with 0.4 mL of dH2O and 0.03 mL of NaNO2 solution (5%; w/v diluted with water), 0.03 mL of AlCl3 solution (10%; w/v diluted with water), 0.2 mL of 1M NaOH and 0.24 mL of dH2O. An Epoch microplate spectrophotometer was used to detect the absorbance of the reaction product at 510 nm. Total flavonoid content was expressed as mg of catechin hydrate equivalents per g FW (mgCE/g FW) based on the catechin hydrate calibration curve (0.002–1 mg/mL).
Antioxidant activity was determined using the free radical 2,2-diphenyl-1-picrylhydrazyl (DPPH) assay [37]. Briefly, 10 μL aliquot of the extract was reacted with 990 μL of the 0.094 mM DPPH methanolic solution. The reaction mixture was shaken and incubated in the dark for 20 min with a control consisting of methanol instead of the sample. In an Epoch microplate spectrophotometer, the absorbance of the reaction mixtures and control mixture was measured at 517 nm. A lower absorbance of the reaction mixture indicates a higher free radical scavenging activity. The antioxidant activity was expressed as mg of Trolox equivalents per g FW (mgTE/g FW) based on the Trolox calibration curve (0.1–2 mM).
The extraction of phenolic acids was performed by mixing 0.1 g of lyophilized leaf tissue with 4 mL of acidified methanol (80% v/v; 0.1% HCl v/v). After 2 min of vortexing, the reaction mixture was sonicated for 10 min, following agitation in a tube rotator for 1 h at room temperature (KS 260 basic, IKA, Staufen, Germany) and centrifugation at 5000× g for 10 min. The supernatant was filtered with a 0.2 µm pore size nylon filter and stored at −20°C until analysis. The high-performance liquid chromatography with diode-array detection (HPLC-DAD) of samples revealed the presence of three hydroxycinnamic acids (caffeic, p-coumaric, and ferulic) on the Kinetex Core-Shell RP-C18 column (150 × 4.6 mm, 100 Å, 5 µm). Peaks were identified by comparing their relative retention times and diode array absorption spectra at 275 nm with those of the standards (Sigma-Aldrich, Saint Louis, MO, USA) and quantified using a five-point external calibration curve (R2 ≥ 0.999). All extraction procedures and phenolic acids composition analysis of each extract were duplicated.
The ChlF parameters and laboratory analyses were calculated and visualized in Microsoft Excel. A one-way ANOVA for ChlF (n = 144), lipid peroxidation (MDA), H2O2, protein, pigments, enzymes (n = 40), and phenol, flavonoid, DPPH, DW (n = 24) was used to determine the statistical differences between leaf positions on plants, which was followed by the Tukey’s post hoc honest significant difference (HSD) test at p < 0.05.
3.1 Chlorophyll a Fluorescence (ChlF)
Chl fluorescence kinetic curves of sunflower leaves showed a typical O-J-I-P phase from the 1st to the 13th leaf. However, from the 13th to the 15th leaf, at the Chl fluorescence kinetic curves appeared K-phase for about 300 ms and showed a typical O-K-J-I-P shape (Fig. 2a,b). Also, the curves for the 13th and 15th leaves deviate from the typical appearance of the curves in both the J and I steps.
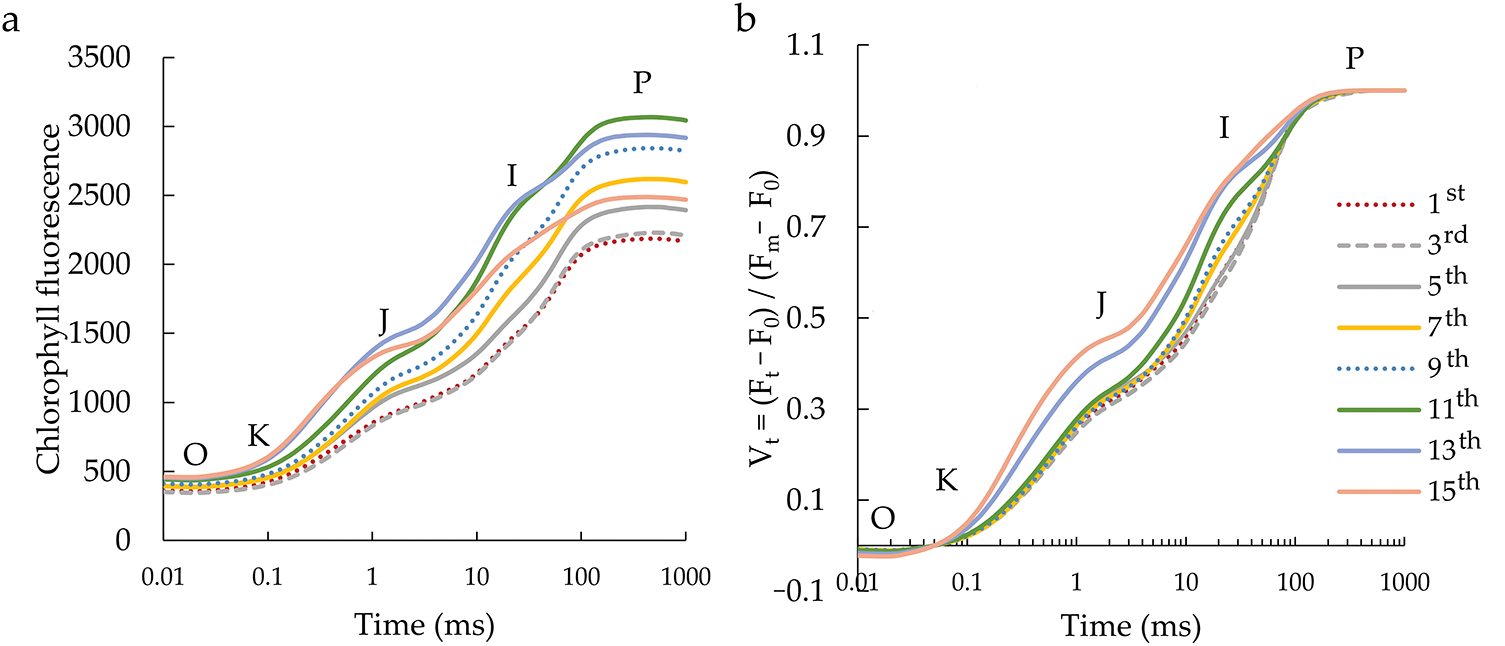
Figure 2: Native (a) and relative variable—Vt (b) chlorophyll a fluorescence transient curves in the differentially positioned sunflower leaves (1st–15th). Each curve represents the average kinetics of 18 biological replicates per leaf position
Analysis of variance confirmed that the position of leaves on a sunflower plant stem significantly influenced all tested ChlF parameters.
ABS/RC and TR0/RC behaved equally (Fig. 3a,c). Their activity was lower in younger leaves compared to the last two positioned leaves (senescent leaves) when their value increased, while DI0/RC increased only in the last (15th) leaf (Fig. 3b). ET0/RC showed a parabolic movement of values from the youngest to the senescent leaf, with the first and last leaf having the highest ET0/RC values (Fig. 3d). Furthermore, RE0/RC showed a linear decrease in value from the top to the bottom of the plant, i.e., from the 1st to the 15th leaf (Fig. 3e). The only parameter that did not show any behavioural trend is TR0/ABS, which remained at equal values regardless of the leaf position on the plant stem (Fig. 3f). ET0/TR0 and ET0/ABS values have the same behaviour trend (Fig. 3g,h), where, more precisely, higher values were from the 1st to 5th leaf, after which they decreased. The RE0–ET0 and RE0/ABS values (Fig. 3i,j) were higher in the leaves in the upper half than in the plant’s lower half. Their values decreased with the leaf’s senescence.
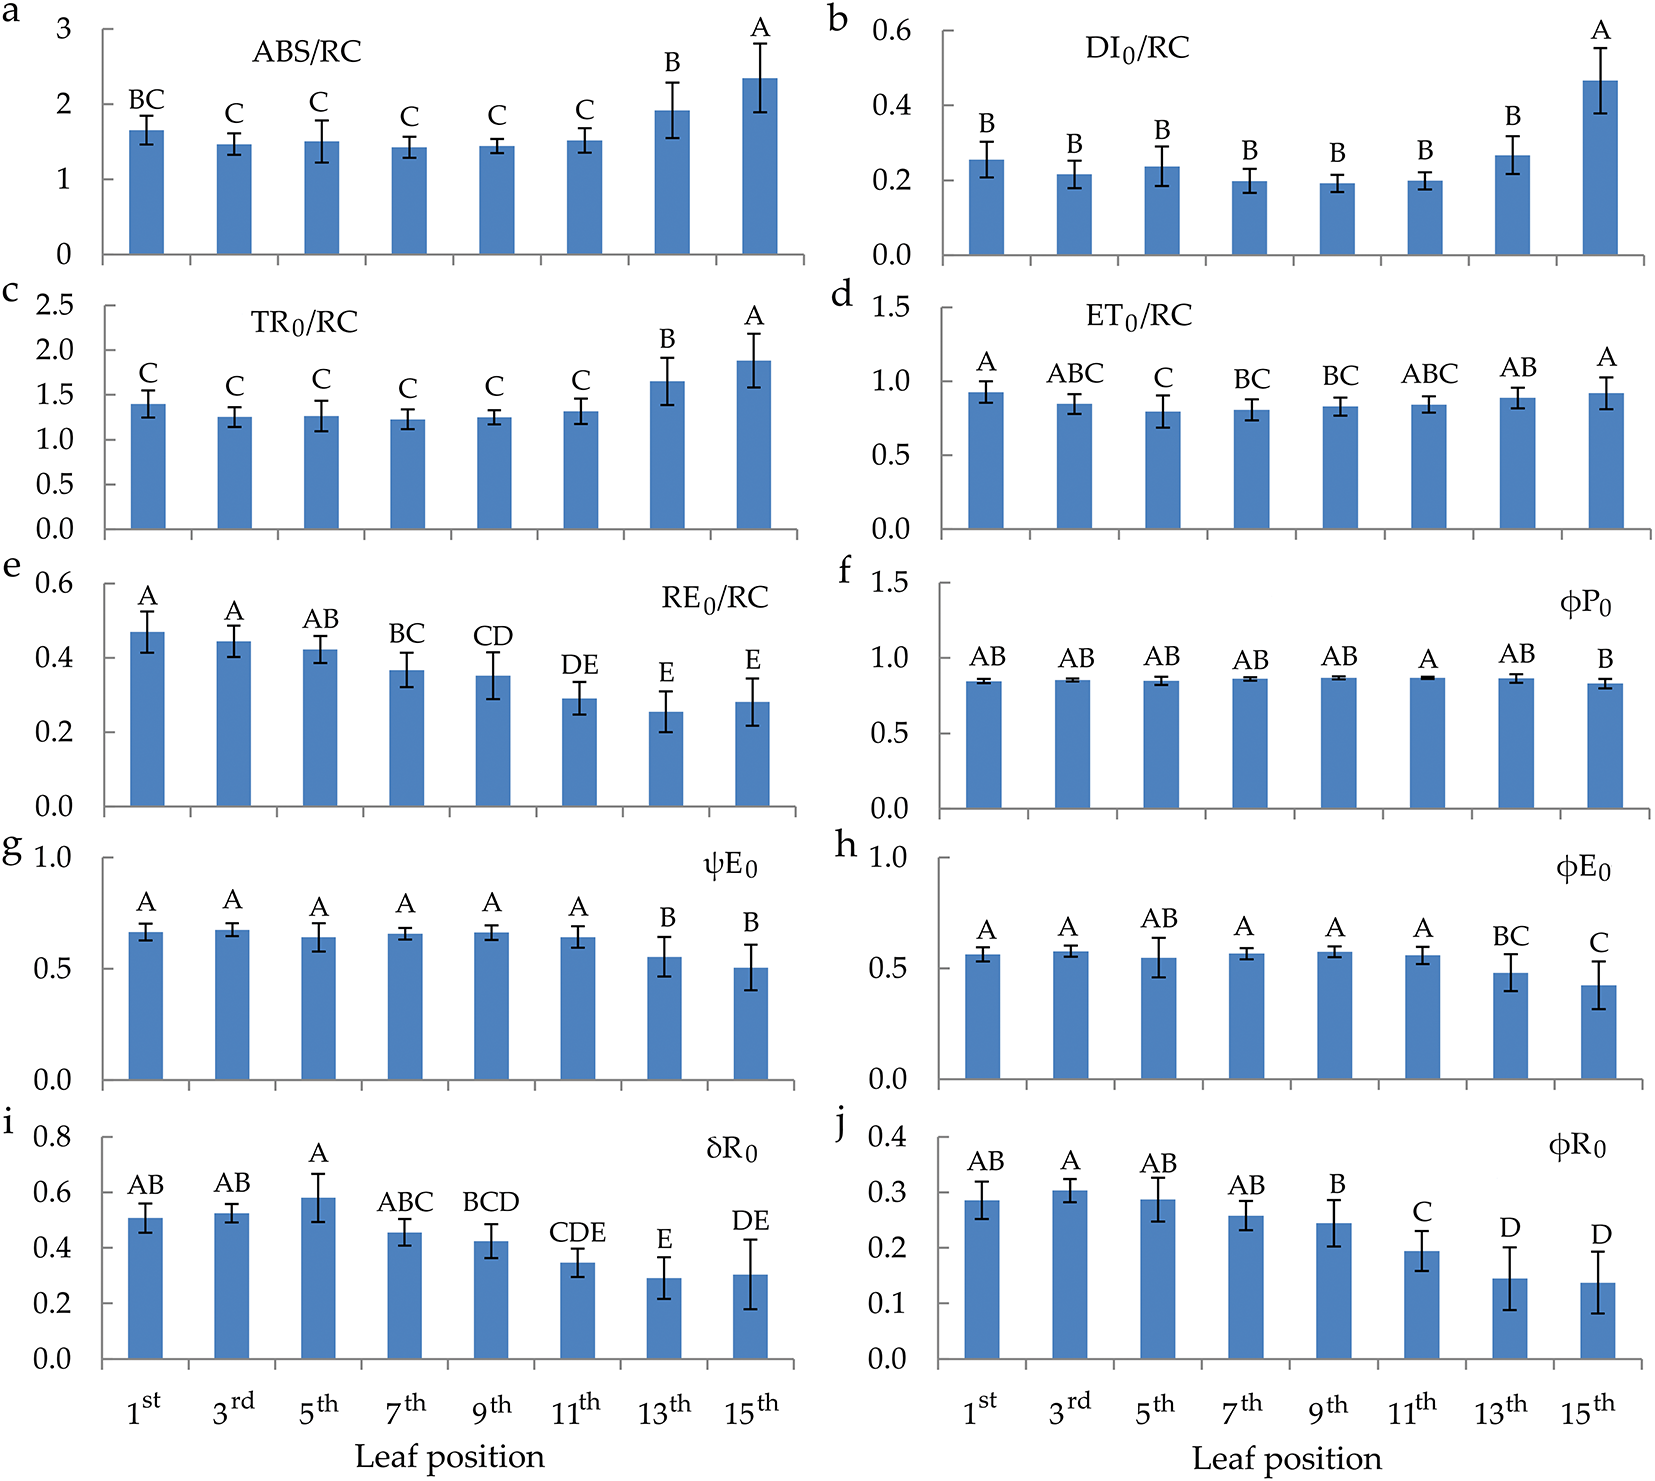
Figure 3: Flux ratios and quantum efficiencies parameters of chlorophyll a fluorescence in the differentially positioned sunflower leaves (1st–15th): absorption flux active per reaction centre (RC)—ABS/RC (a), dissipated energy flux per active RC—DI0/RC (b), trapping flux per active RC—TR0/RC (c), electron transport flux per active RC—ET0/RC (d), electron flux reducing end electron acceptors at the PSI acceptor side per RC—RE0/RC (e), maximal photochemical quantum yield—φP0 (f), the probability that a trapped exciton moves an electron into the electron transport chain beyond redox state of primary quinone acceptor (QA−)—ψE0 (g), quantum yield for electron transport—φE0 (h), the probability that an electron is transported from reduced PQ to the electron acceptor side of PSI—δR0 (i), quantum yield of electron transport from QA− to the PSI end electron acceptors—φR0 (j). Different letters determine significant differences at p < 0.05
The values of RC/ABS move parabolically according to the senescence of the leaves from the top to the bottom of the plant (Fig. 4). TR0/DI0 values are approximately equal regardless of the leaf’s position on the plant (Fig. 4b). ET0/(TR0–ET0) and PIABS have the same behaviour trend of values depending on the maturation of the leaves (Fig. 4c,d). Their values are higher in the young and mature leaves compared to the senescent leaves. Also, the parameters δR0/(1−δR0) and PItotal showed the same behaviour trend starting from the top positioned leaves towards the bottom, decreasing from the 11th leaf, i.e., senescent leaves to the 15th leaf.
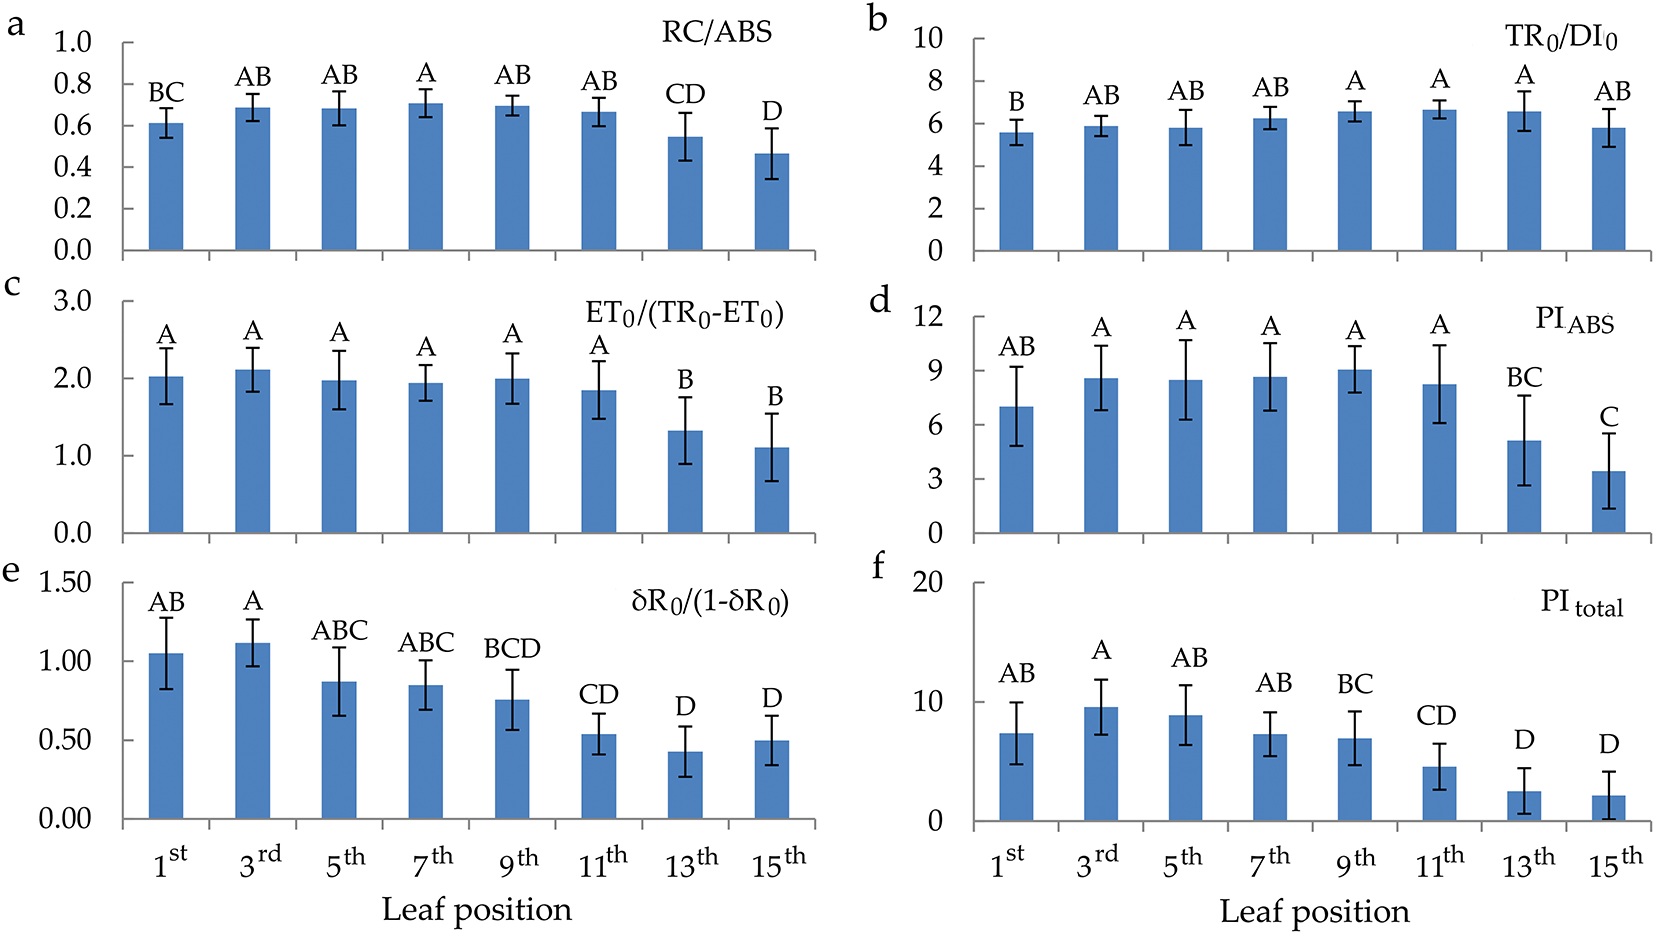
Figure 4: Quantum efficiencies and performance index parameters of chlorophyll a fluorescence in the differentially positioned sunflower leaves (1st–15th): RC/ABS—density of RC on chlorophyll a basis (a), TR0/DI0—flux ratio trapping per dissipation (b), ET0/(TR0–ET0)—electron transport from QA– to intersystem electron acceptors (c), PIABS—performance index on absorption basis (d), δR0/(1–δR0)—electron transport from plastoquinol (PQH2) to final photosystem I (PSI) acceptors (e) and PItotal—performance index for energy conservation from exciton to the reduction of PSI terminal acceptors (f). Different letters determine significant differences at p < 0.05
Photosynthetic pigments, i.e., chlorophyll a (chl a), chlorophyll b (chl b), and carotenoids (car), show the same behaviour pattern (Fig. 5). The photosynthetic pigment content follows a parabolic trend, peaking at mid-height and decreasing towards both the top and base of the plant. The young and senescent leaves have a lower content than the mature leaves. The 7th and 9th leaves have the highest chl a, chl b, and car content. The ratio of chl a and b decreased linearly from the highest to the lowest leaf on the stem, in contrast to car, which did not show the same behaviour pattern.
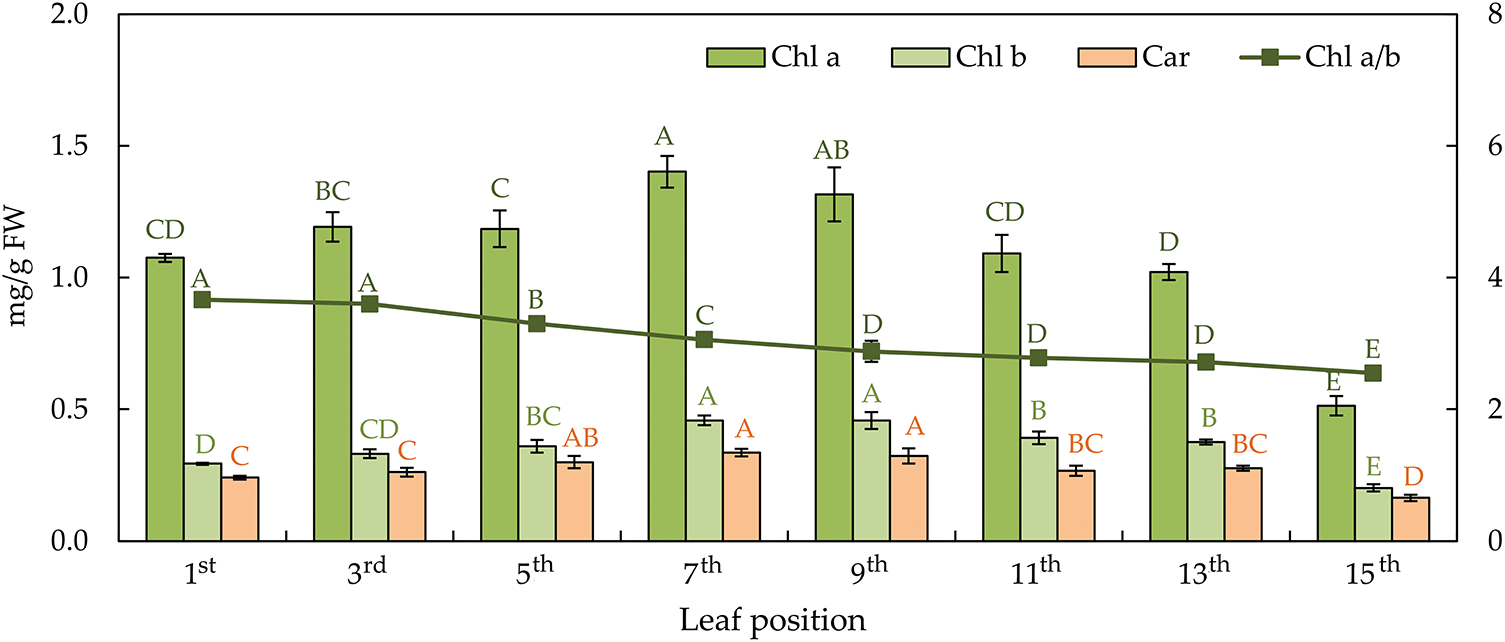
Figure 5: The content of chlorophyll a—chl a, chlorophyll b—chl b, carotenoids—car (on the primary axis), and chlorophyll a/b ratio−chl a/b (on the secondary axis) in the differentially positioned sunflower leaves (1st–15th). Different letters determine significant differences at p < 0.05
3.2 Enzymatic and Non-Enzymatic Antioxidative Compounds
Analysis of variance confirmed that the position of the leaf on a sunflower plant stem has a significant influence on lipid peroxidation (malondialdehyde—MDA), hydrogen peroxide (H2O2), soluble proteins, phenols, flavonoids, antioxidant activity (AOA), and antioxidative enzymes (GPOD, APX, CAT, and PPO). Proline content is the only trait that did not differ per leaf position.
The MDA content, starting from the top of the plant in the first young leaf, was lower and was increased in mature leaves until leaves 9th and 11th, when it decreased with senescent leaves (Fig. 6a). After that, it again reached a high value in the lowest-positioned, i.e., senescent leaves. Opposite MDA content, H2O2 was higher from the youngest to the mature leaves, and after the 9th leaf, H2O2 content was reduced (Fig. 6b). The soluble protein content behaved similarly to the MDA content, as observed from the same behaviour patterns. The protein content was low in the 1st leaf, as well as in the 11th and 13th leaf. It increased from the 3rd to the 11th leaf and again in the last, the 15th leaf.
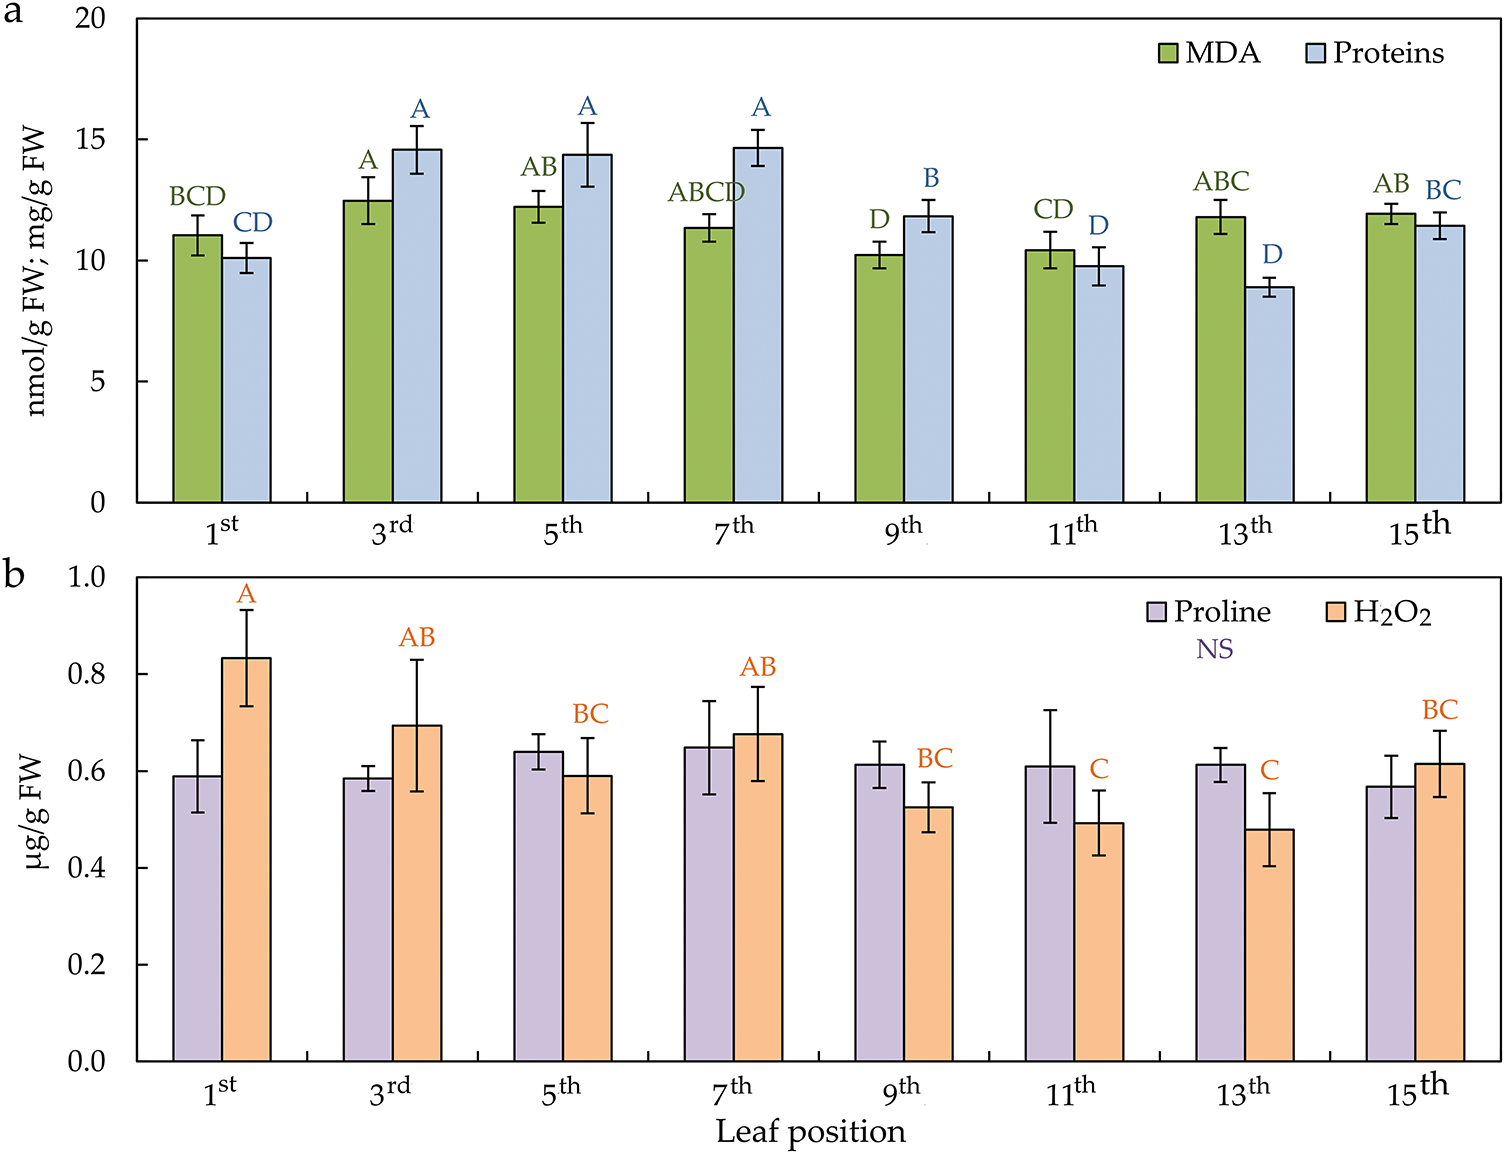
Figure 6: The lipid peroxidation—MDA (malondialdehyde) and soluble proteins content (a); proline and hydrogen peroxide—H2O2 content (b) in the differentially positioned sunflower leaves (1st–15th). Different letters determine significant differences at p < 0.05
Guaiacol peroxidase (GPOD) activity decreased from the youngest to the senescent leaf (Fig. 7a). The enzymes ascorbate peroxidase (APX) and polyphenol oxidase (PPO) had a similar trend according to the leaf position on the plant (Fig. 7b,d). The first young leaf and the leaves at the bottom of the plant, from the 9th to the 15th, had a higher APX and PPO enzyme activity. The lowest enzyme activity values were from the 3rd to the 7th leaves. Contrary to APX and PPO, catalase (CAT) activity was just the highest on the mature leaves of the plant (Fig. 7c).
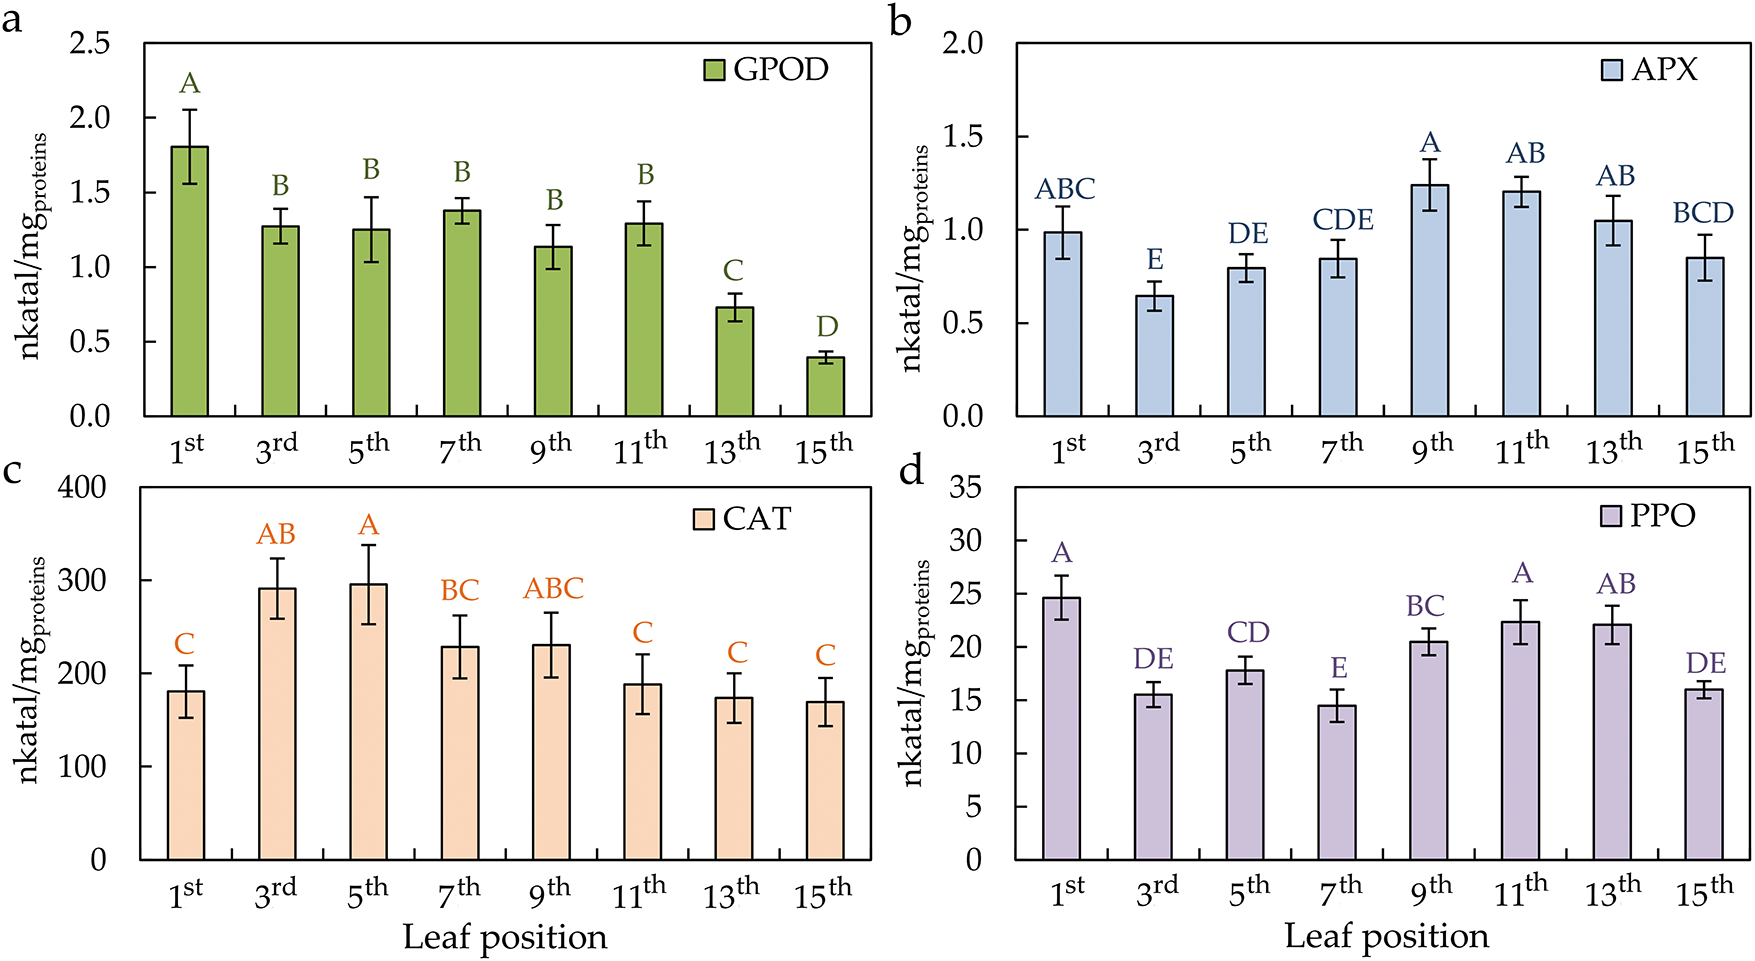
Figure 7: The activity of guaiacol peroxidase—GPOD (a), ascorbate peroxidase—APX (b), catalase—CAT (c), and polyphenol oxidase—PPO (d) in the differentially positioned sunflower leaves (1st–15th). Different letters determine significant differences at p < 0.05
The content of total phenols (TP) and flavonoids (TF), as well as antioxidant activity (AOA) in leaves, decreased linearly from the top to the bottom of the plant (Fig. 8a). The first two leaves from the top of the plant, the youngest leaves, have the highest content of phenols and flavonoids, and antioxidant activity correlated with the mentioned contents of bioactive substances. The highest contents of all quantified phenolic acids are found in the top part of the plant in young leaves (Fig. 8b). In the mature leaves (7th–11th), it falls to the lowest level and rises in senescent leaves (13th–15th).
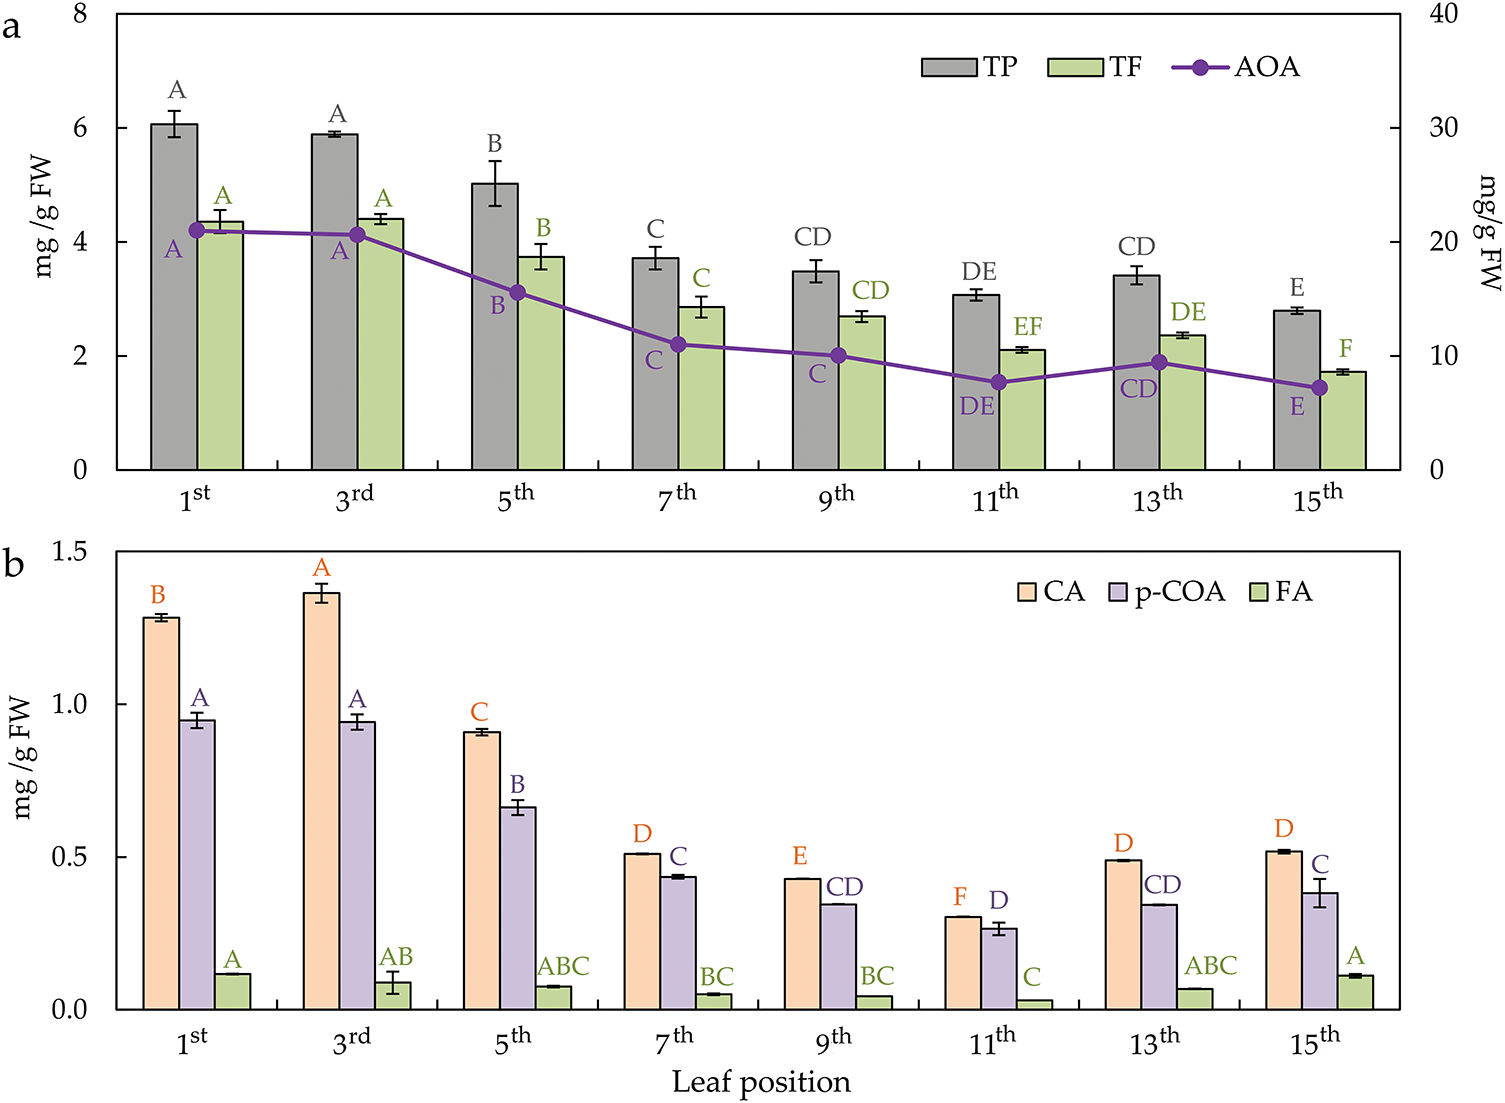
Figure 8: The content of total phenols—TP, total flavonoids—TF (on the primary axis), and antioxidant activity—AOA (on the secondary axis) (a); the content of phenolic acids (b), i.e., caffeic acid—CA, p-coumaric acid—p-COA, ferulic acid—FA, in the differentially positioned sunflower leaves (1st–15th). Different letters determine significant differences at p < 0.05
3.3 Relationship between Parameters
Principal component analysis (PCA) was performed to understand the relationships between traits and their distribution according to leaf position on the stem. Based on the PCA results performed from the correlation matrix, the first two extracted principal components explained 82.59% of the total variance. The PC1 accounted for 52.28%, and PC2 for 30.31% of the variance in the dataset (Fig. 9a,b). According to PC coordinates of the variables, based on correlations, ChlF parameters per RC, with RE0/RC as an exception, were grouped as a strong positive correlation along PC1, while most other ChlF parameters negatively influenced PC1. Only φP0 and TR0/DI0 determined distribution along PC2 as a strong negative correlation. Bioactive compounds determined a high negative position along PC1, with FA as an exception, which highly positively influenced PC2. H2O2 and MDA had high positive and APX negative impacts on PC2, while CAT and GPOD determined PC1. Chl a and Chl a/b were informative variables for PC1, while Chl b negatively correlated with PC2.
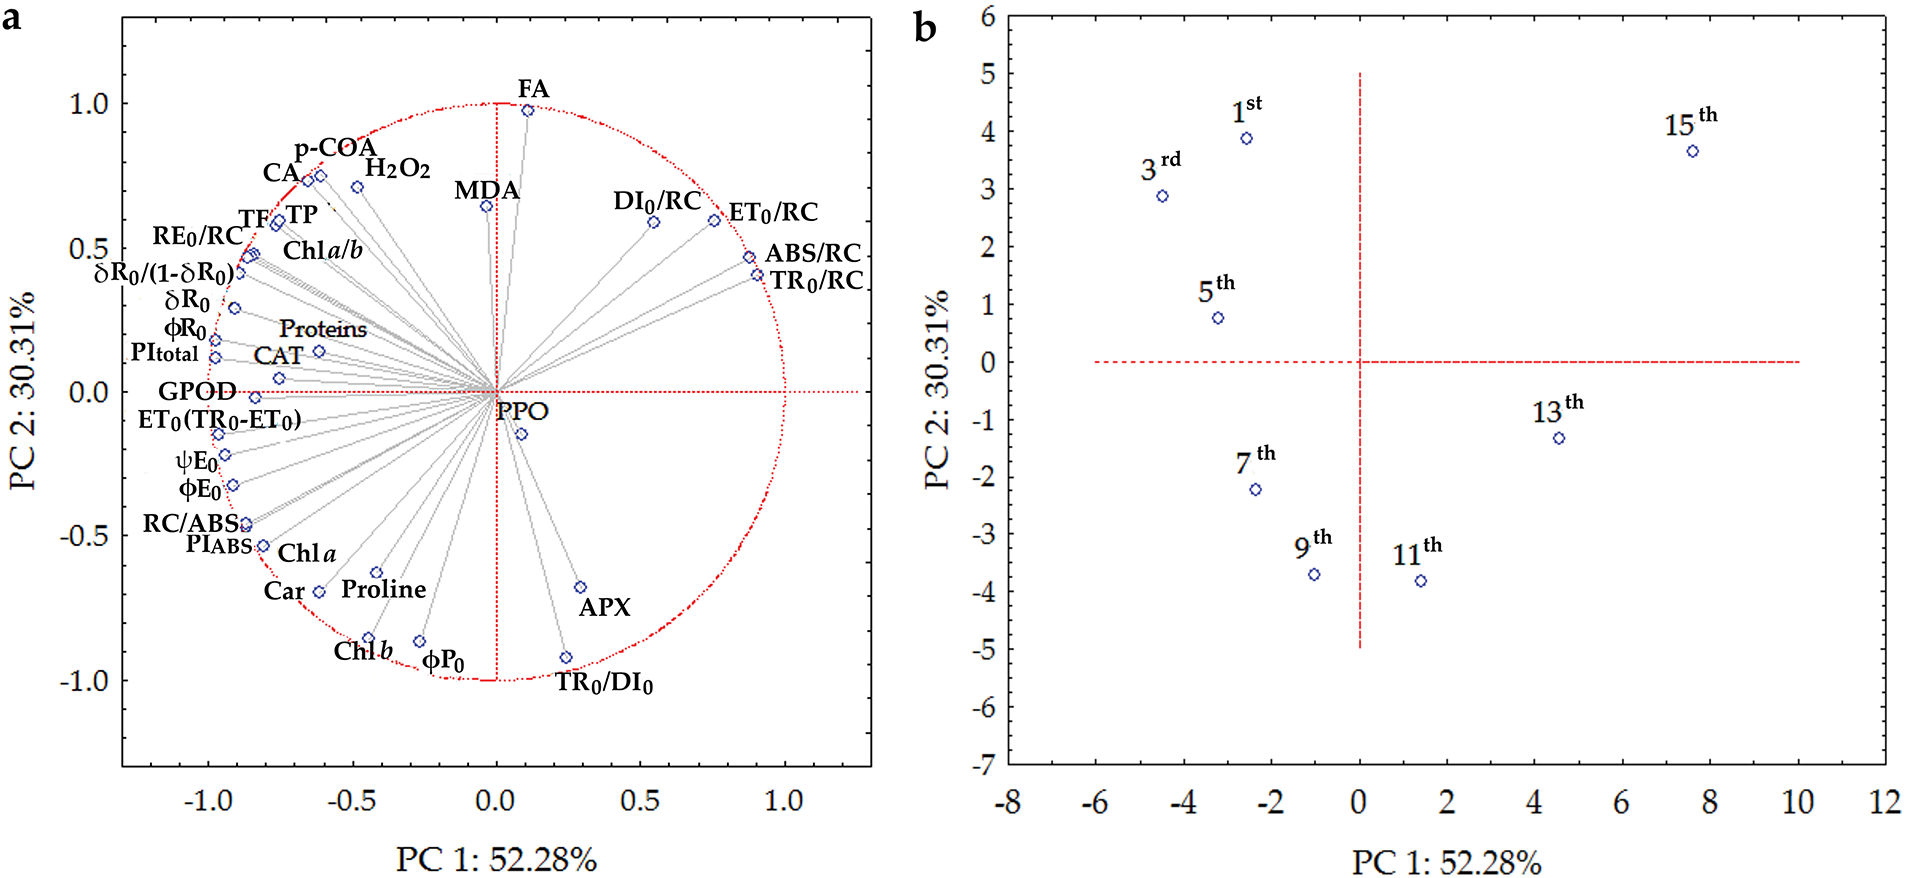
Figure 9: Biplot of principal component analysis of: (a) chlorophyll a fluorescence (see Table 1 for a list of parameters), chlorophyll a—chl a, chlorophyll b—chl b, carotenoids—car, and chlorophyll a/b ratio—chl a/b, lipid peroxidation—MDA, soluble proteins, proline, hydrogen peroxide—H2O2, guaiacol peroxidase—GPOD, ascorbate peroxidase—APX, catalase—CAT, polyphenol oxidase—PPO, total phenols—TP, total flavonoids—TF, antioxidant activity—AOA, caffeic acid—CA, p-coumaric acid—p-COA, ferulic acid—FA (b) in the differentially positioned sunflower leaves (1st–15th)
The leaf is a dynamic organ driven by both internal (genotype) and external (environmental) conditions that form specific phenotypes manifested through the response, adaptability, and self-regulation ability of plants in constantly changing environments [38]. Since the leaves are the main photosynthetic organ, they determine the plant growth rate and health condition. The easiest way to follow this dynamic is through the physiological processes in the leaf.
4.1 Chlorophyll a Fluorescence (ChlF) and Photosynthetic Pigments
Fast ChlF induction kinetic curves were used to study the PSII characteristics of the sunflower leaves at different developmental stages in this research. Curve deviations were observed on the senescent leaves (13th and 15th) compared to young and mature leaves. Given that the appearance of the K step during leaf senescence indicates damage to the oxygen-evolving complex (OEC), previously proven in induced senescence but not in natural leaf senescence [39], it can be said that in this case, the OEC is damaged during the natural senescent leaves (13th and 15th) of sunflower. Namely, during leaf senescence, the intensity of ChlF increases after a very short period (before step J), and the K step appears, indicating damage to the PSII donor site [40,41], which was the case in this study. Also, the deviations in the J and I steps indicate the influence of the natural senescence of the senescent sunflower leaves in this research.
According to the ChlF parameters of energy flow in PSII per reaction centres (ABS/RC, DI0/RC, and TR0/RC), young and mature leaves showed equal activity, which increased in senescent sunflower leaves. ET0/RC was highest in young and senescent leaves, while a slight decrease in electron transport was observed in the mature leaves when higher pigment content was recorded. In addition, RE0/RC descends linearly from the youngest to the senescent leaf, indicating disturbances in the electron transport energy flow to PSI [42]. The increase in ABS/RC and DI0/RC during leaf senescence was in accordance with the results proven by Tang et al. [43] and Tang et al. [39], while the increase in TR0/RC and ET0/RC in this study was contrary to their results indicating a higher rate of RC electron capture, thereby converting more the primary electron acceptor in photosystem II, primary quinone acceptor (QA), to redox state of primary quinone acceptor (QA−) [44]. In other words, the rates for transporting electrons were affected by the senescence. Also, the quantum yield of primary photochemistry (φP0) was slice affected by leaf senescence, which is following the results of Cechin et al. [45], who found no difference in φP0 between young and mature sunflower leaves in both well-watered and water-stressed conditions. The senescent leaf showed the lowest φP0 value, although it was not statistically significantly different from the other leaves, except for the 6th-positioned leaf. Despite the drop in the φP0 value in senescent leaves, the quantum yield was not impaired because the leaves maintained a high φP0 value (0.83). Small changes in φP0 values in this study proved no inhibition of PSII photochemical efficiency, which was also confirmed by Španić et al. [46] in the grain-filling stage of wheat on the senescent flag leaf. According to the literature, φP0 values in plants range from 0.80 to 0.83 [47]. However, sunflowers under stress-free cultivation conditions are characterized by high φP0 values [48], which were also determined in this research on mature leaves (from 7th to 13th leaves), where those values were around 0.86. According to previous research, changes in φP0 during leaf senescence are diverse and species-specific. Some studies during the natural senescence process of leaves indicate small changes in φP0 values [43,49], which was the case here, while others show a decrease in φP0 values with senescence [50]. Besides, leaf senescence decreases the quantum yield of electron transport after QA–(φE0) and the efficiency per trapped excitation (ψE0) in the senescent leaves. These parameters indicate relevant information about the electron transport activity at the PSII acceptor sites [40]. Therefore, those decreased values indicate decreased electron transfer rates between QA and secondary quinone acceptor (QB), which was established earlier by Tang et al. [43] and Sitko et al. [51].
Furthermore, the only tested parameters that showed a decrease from young and mature to senescent leaves are those related to PSI (RE0/RC, δR0, and φR0). δR0 and φR0 refer to electron flow from plastoquinol (PQH2) to the PSI end electron acceptors, which are compromised with the senescence of the sunflower leaves. Also, as expected, TR0/DI0 by leaf senescence was consistent with the behaviour of φP0 values. Likewise, ET0/(TR0 − ET0) values were in accordance with the behaviour of ET0/TR0 depending on young, mature, and senescent sunflower leaves. The above two parameters (TR0/DI0 and ET0/(TR0 − ET0)) and RC/ABS, whose values were similar in young and mature leaves but decreased in senescent leaves, comprise the PIABS parameter. PIABS is a sensitive parameter that detects changes in photosynthetic efficiency, which was also the case in this study. Namely, in young and mature leaves, PIABS values were higher than in senescent leaves. This confirms that PIABS is a more sensitive parameter than φP0 during the natural senescence of leaves. The above was also proven in the research of Viljevac Vuletić and Španić [52] during the natural senescence of wheat leaves. In this research, parameters RE0/RC, δR0, φR0, δR0/(1 − δR0), and PItotal showed to be more sensitive parameters than PIABS.
From the ChlF results, PSI in sunflower leaves seems more sensitive than PSII. According to ChlF parameters connected to PSII processes, young and mature leaves are statistically equal (from 1st to 13th), and significant changes occur only in senescent leaves. In contrast, the PSI describing parameters show a linear decrease according to the senescence of the leaves, with the young leaf having the highest values and the senescent the lowest. According to the literature dealing with the effect of leaf senescence on PSI and PSII, various physiological changes have been determined. Studies during leaf senescence show a preferential loss of either PSI or PSII or both in parallel. The difference between the stability of PSI and PSII was found to be genetically dependent on the species and variety [53].
A dynamic of photosynthetic pigments in the leaf varies through the leaf life cycle, reaching its maximum at full maturity [54], which coincides with maximal φP0 [55]. The onset of leaf senescence is characterized by chlorophyll reduction in sunflower plants and can be used as an indicator of senescence [9,56]. The senescence process is closely linked to chlorophyll degradation and reduced green pigmentation [57]. In this study, the highest content of chlorophylls, individual and total, was found in mature leaves, corroborating with Agüera et al. [5] and Sairam et al. [54]. A significant reduction during senescing in the chl a/b ratio, found here, is also corroborated by results from previous studies [5,43].
This study observed visual leaf senescence on the lower leaf as early as the flowering stage. Senescence is regulated by a combination of genetic and environmental factors that strongly influence crop yield. Numerous studies have shown that delaying leaf senescence can significantly contribute to maintaining photosynthetic activity during grain filling, thereby increasing yield and seed quality in various crops, including sunflowers [58–61]. For this reason, the suitability for breeding sunflower hybrids with higher yields is contributed by breeding stay-green hybrids that allow for later senescence so that plants during the grain-filling stages can achieve higher yields.
From an agronomic point of view, delaying leaf senescence offers a promising way to increase sunflower yield by maximizing photosynthetic efficiency during critical developmental stages. Understanding and implementing strategies to manage the timing and progression of senescence can contribute to sustainable yield improvements under different environmental conditions.
4.2 Enzymatic and Non-Enzymatic Antioxidative Compounds
The leaf life cycle is characterized by dynamic changes in metabolites, especially with the imbalance of ROS production and scavenging, which occurs as a response to external (environmental) conditions. Stress indicators assessed sunflower leaves’ physiological status at different levels along the stem. In this study, higher levels of MDA in the part of young and mature leaves and high values in senescent leaves indicate an oxidative change in sunflower leaves. These results are inconsistent with the statement that MDA, together with Chl content, is used as a valid indicator of leaf senescence, as MDA always increases significantly during the senescence process [39,53]. In the research of differential responses between mature and young leaves of sunflower plants to oxidative stress caused by water deficit, the authors found a higher concentration of MDA in control and water-stressed young leaves of sunflower than in mature leaves [62]. On the other hand, H2O2 values were statistically approximately the same in mature as in senescent sunflower leaves in this study, even though the values of H2O2 normally increase in senescence [63,64], as H2O2 down-regulates chlorophyll synthesis accompanied with inhibition of CAT gene expression [65]. Although H2O2 indicates stress in plants [66], slightly higher values in higher-positioned leaves than in lower leaves did not cause proper changes according to their behaviour in the leaf senescence process.
Accumulating proline as a compatible osmolyte is a basic strategy for protecting and surviving plants under abiotic stress [67]. Osmotic adaptation involves accumulating various species and compounds that depend on the senescence of the leaf. Determining equal proline levels in all sunflower leaves in this study, regardless of their position on the stem, indicates its stability. Cechin et al. [45] examined the proline content of young and mature leaves of sunflower plants under water deficit. A significant increase in proline content was observed in both mature and young stressed leaves. Young stressed sunflower leaves synthesized almost seven times more proline than non-stressed leaves, while mature stressed leaves synthesized only four times more proline. They also found similar proline content in young and mature sunflower leaf control plants.
Proteins soluble in the leaf are the dominant nitrogen source for remobilization [68]. They are rapidly degraded already in the early phase of leaf senescence. The data presented here show that the protein content in mature leaves was high and decreased with senescence, but in the oldest leaf, it increased, probably because of the massive degradation of chloroplast complexes [12,69]. Leaves after the 7th leaf are impaired in the breakdown of soluble proteins and consequently experience reduced nitrogen remobilization, indicating their senescence. Conversely, a linear decrease in protein content from the youngest to the oldest sunflower leaf was already determined on sunflower leaves [54,63,64], suggesting their degradation. Agüera et al. [5], in the study of the effect of N, proved the negative effect of leaf senescing on the protein content of sunflower leaves.
Detoxifying, i.e., antioxidative enzymes, is one of the mechanisms that plants use to obtain metabolic homeostasis and counterbalance ROS [70]. Antioxidative enzymes normally control the levels of MDA and H2O2, but in this study, no link was found between the activities of GPOD, APX, CAT, and PPO enzymes depending on the position and, therefore, maturity of sunflower leaves. Namely, the mentioned enzymes’ insufficient activities for the removal of ROS were found. APX and PPO were highest in the first leaf (the youngest leaf) and from the 9th to 13th leaves. GPOD decreases with the senescence of the leaves. It has been proven before that the APX and CAT activities were higher in young than in senescent leaves, while peroxidase showed lower activity in young than in senescent sunflower leaves [54]. Of the mentioned enzymes, only the behaviour of the CAT depending on the leaves’ ageing was in accordance with the results of previous research [55,64,65], which means that they decreased with the senescence of sunflower leaves.
Fluctuations in the polyphenols content of sunflower plants, and therefore, sunflower leaves, are influenced by different growth stages and environments [71]. The decrease of phenolic compounds (TP and TF) from young to senescent leaves, found in our study, correlates with the literature on common fig and tea tree plants [72,73]. Phenolic compounds have hydrogen-donating potential and act as singlet oxygen quenchers, reducing agents, metal binders, and free radical scavengers, which enables them to quench free radicals. This property is based on their antioxidative activity in the regulation of ROS metabolism during growth or maturation [74]. This study found a similar decreasing trend in antioxidant activity with TP and TF, but according to Nadeem and Zeb [72], this correlation was opposite in common fig leaves, more precisely, negative. Phenolic acids were found to be major phenolic classes in sunflower seeds [75,76]. Therefore, we tracked phenolic acid content in sunflower leaves and found that CA, FA, and p-COA content was highest in young leaves. In mature leaves, they were present in smaller quantities but increased again in senescent leaves, which implies their possible later relocation in seeds at the grain-filling stage as a predominant phenolic compound [75,76] or/and as a scavenger molecule in ROS elimination [74].
4.3 Relationship between Parameters
In this study, PCA revealed that young leaves were better discriminated against based on the data on bioactive compounds, CAT and GPOD activity, and ChlF parameters describing quantum yields and the stability of PSI. Mature leaves were characterized by stabile φP0 and TR0/DI0, as well as a negative correlation with MDA, suggesting successful metabolism and the absence of oxidative stress. PCA proved that photosynthetic pigments corroborate with maximal φP0 in fully mature leaves [54,55]. However, as we previously suggested, senescent leaves were determined by a positive correlation with ABS/RC and DI0/RC. PCA also confirmed our conclusions that PIABS is a more sensitive ChlF parameter than φP0 [52], as well as PItotal and parameters related to PSI (RE0/RC, δR0, φR0, δR0/(1 − δR0) [48].
Leaf maturation is a controlled process. This research determined that sunflower leaves’ natural ageing begins in the flowering stage, depending on their position on the stem. Results suggest that the photosynthetic apparatus remains stable during leaf maturation. The lowest, i.e., the oldest, leaf already in the flowering stage showed photosynthetic pigment degradation and disturbances in PSI and, therefore, impaired photosynthesis. Degradation of soluble proteins, TP, TF, and AOA with the decrease of enzyme activity and increase in MDA indicated metabolic changes characteristic of leaf senescence.
Beyond these mechanistic insights, the findings in this investigation have direct agronomic relevance. Management practices, such as targeted nutrient or antioxidant supplementation, can be tailored to sustain overall canopy photosynthesis and extend the productive lifespan of leaves by pinpointing physiological differences among leaves at different stem positions. Moreover, these data provide a valuable framework for breeding and biotechnological efforts to develop “stay-green” sunflower cultivars with enhanced health, yield stability and stress resilience. Future studies should investigate the genetic regulation of photosystem maintenance and antioxidant pathways, screen for natural or induced variants that delay senescence and validate candidate physiological markers under field conditions. Such integrated approaches will accelerate the translation of leaf ageing biology into sunflower improvement strategies.
Acknowledgement: Not applicable.
Funding Statement: The Agricultural Institute Osijek funded this research as a part of an internal project proposal: Research on sunflower genotypes entitled “The effect of abiotic factors on sunflower hybrids and their parental lines”.
Author Contributions: Conceptualization, Antonela Markulj Kulundžić, Aleksandra Sudarić and Marija Viljevac Vuletić; methodology, Antonela Markulj Kulundžić, Marija Viljevac Vuletić, Aleksandra Sudarić, Anto Mijić and Ivica Liović; software, Antonela Markulj Kulundžić and Ivana Varga; formal analysis, Antonela Markulj Kulundžić, Marija Viljevac Vuletić, Daniela Horvat and Marija Kovačević Babić; investigation, Antonela Markulj Kulundžić, Anto Mijić, Ivica Liović, Maja Matoša Kočar and Tomislav Duvnjak; writing—original draft preparation, Antonela Markulj Kulundžić and Marija Viljevac Vuletić; writing—review and editing, Aleksandra Sudarić, Daniela Horvat, Marija Kovačević Babić, Maja Matoša Kočar, Anto Mijić, Ivana Varga, Ivica Liović and Tomislav Duvnjak. All authors reviewed the results and approved the final version of the manuscript.
Availability of Data and Materials: The original contributions presented in this study are included in the article. Further inquiries can be directed to the corresponding authors.
Ethics Approval: Not applicable.
Conflicts of Interest: The authors declare no conflicts of interest to report regarding the present study.
References
1. Vratarić M. Sunflower Helianthus annuus L. Osijek, Croatia: Agricultural Institute Osijek; 2004. [Google Scholar]
2. Gadžo D, Đikić M, Mijić A. Industrijsko bilje. Sarajevo, Bosnia and Herzegovina: Štamparija Fojnica; 2011. p. 12–32. (In Croatian). [Google Scholar]
3. Saharan BS, Brar B, Duhan JS, Kumar R, Marwaha S, Rajput VD, et al. Molecular and physiological mechanisms to mitigate abiotic stress conditions in plants. Life. 2022;12(10):1634. doi:10.3390/life12101634. [Google Scholar] [PubMed] [CrossRef]
4. Ji X, Jiang Z, Wang J, Dong L, Deng X. Genome-wide identification and expression analysis of the GSK3 gene family in sunflower under various abiotic stresses. Phyton-Int J Exp Bot. 2024;93(8):1839–50. doi:10.32604/phyton.2024.052809. [Google Scholar] [CrossRef]
5. Agüera E, Cabello P, de la Haba P. Induction of leaf senescence by low nitrogen nutrition in sunflower (Helianthus annuus) plants. Physiol Plant. 2010;138:256–67. doi:10.1111/j.1399-3054.2009.01336.x. [Google Scholar] [PubMed] [CrossRef]
6. Vrebalov T. The role of leaves in the process of kendel yield and oil content formation in sunflower. In: Proceedings of the 5th International Conference on Sunflower. Clermont-Ferrand, France; 1972 Jul 25–29. [Google Scholar]
7. Škorić D. Sunflower breeding. In: Škorić D, Sakač Z, editors. Sunflower genetics and breeding (International monography). Novi Sad, Republic of Serbia: Serbian Academy of Science (SASABranch in Novi Sad; 2012. ISBN 978-88-81125-82-3. [Google Scholar]
8. Muñoz P, Munné-Bosch S. Photooxidative stress during leaf, flower and fruit development. Plant Physiol. 2018;176:1004–14. doi:10.1104/pp.17.01127. [Google Scholar] [PubMed] [CrossRef]
9. Moschen S, Marino J, Nicosia S, Higgins J, Alseekh S, Astigueta F, et al. Exploring gene networks in two sunflower lines with contrasting leaf senescence phenotype using a system biology approach. BMC Plant Biol. 2019;19:446. doi:10.1186/s12870-019-2021-6. [Google Scholar] [PubMed] [CrossRef]
10. Guo Y, Ren G, Zhang K, Li Z, Miao Y, Guo H. Leaf senescence: progression, regulation, and application. Mol Horticulture. 2021;1:5. doi:10.1186/s43897-021-00006-9. [Google Scholar] [PubMed] [CrossRef]
11. Lim PO, Kim HJ, Nam HG. Leaf senescence. Annu Rev Plant Biol. 2007;58:115–36. doi:10.1146/annurev.arplant.57.032905.105316. [Google Scholar] [PubMed] [CrossRef]
12. Martínez DE, Costa ML, Gomez FM, Otegui MS, Guiamet JJ. Senescence-associated vacuoles’ are involved in the degradation of chloroplast proteins in tobacco leaves. Plant J. 2008;56:196–206. doi:10.1111/j.1365-313X.2008.03585.x. [Google Scholar] [PubMed] [CrossRef]
13. Moschen S, Higgins J, Di Rienzo JA, Heinz RA, Paniego N, Fernandez P. Network and biosignature analysis for the integration of transcriptomic and metabolomic data to characterize leaf senescence process in sunflower. BMC Bioinform. 2016;17:174. doi:10.1186/s12859-016-1045-2. [Google Scholar] [PubMed] [CrossRef]
14. Zhao W, Zhao H, Wang H, He Y. Research progress on the relationship between leaf senescence and quality, yield and stress resistance in horticultural plants. Front Plant Sci. 2022;13:1044500. doi:10.3389/fpls.2022.1044500. [Google Scholar] [PubMed] [CrossRef]
15. Koyama T. A hidden link between leaf development and senescence. Plant Sci. 2018;276:105–10. doi:10.1016/j.plantsci.2018.08.006. [Google Scholar] [PubMed] [CrossRef]
16. Dvořák P, Krasylenko Y, Zeiner A, Šamaj J, Takáč T. Signaling toward reactive oxygen species-scavenging enzymes in plants. Front Plant Sci. 2021;11:618835. doi:10.3389/fpls.2020.618835. [Google Scholar] [PubMed] [CrossRef]
17. Mittler R, Vanderauwera S, Gollery M, Van Breusegem F. Reactive oxygen gene network of plants. Trends Plant Sci. 2004;9:490–8. doi:10.1016/j.tplants.2004.08.009. [Google Scholar] [PubMed] [CrossRef]
18. Petrov V, Hille J, Mueller-Roeber B, Gechev TS. ROS-mediated abiotic stress-induced programmed cell death in plants. Front Plant Sci. 2015;6:69. doi:10.3389/fpls.2015.00069. [Google Scholar] [PubMed] [CrossRef]
19. Buchanan-Wollaston V, Earl S, Harrison E, Mathas E, Navabpour S, Page T, et al. The molecular analysis of leaf senescence—a genomics approach. Plant Biotechnol J. 2003;1:3–22. doi:10.1046/j.1467-7652.2003.00004.x. [Google Scholar] [PubMed] [CrossRef]
20. Zimmermann P, Zentgraf U. The correlation between oxidative stress and leaf senescence during plant development. Cell Mol Biol Lett. 2005;10:515–34. [Google Scholar] [PubMed]
21. Kumar K, Debnath P, Singh S, Kumar N. An overview of plant phenolics and their involvement in abiotic stress tolerance. Stresses. 2023;3:570–85. doi:10.3390/stresses3030040. [Google Scholar] [CrossRef]
22. Schneiter AA, Miller JF, Berglund DR. Stages of sunflower development. Fargo, ND, USA: North Dakota State University. 2019. [cited 2024 Nov 14]. https://www.ndsu.edu/agriculture/sites/default/files/2022-08/a1145.pdf. [Google Scholar]
23. Strasser RJ, Tsimilli-Michael M, Qiang S, Goltsev V. Simultaneous in vivo recording of prompt and delayed fluorescence and 820-nm reflection changes during drying and after rehydration of the resurrection plant Haberlea rhodopensis. Biochim Biophys Acta. 2010;1797:1313–26. doi:10.1016/j.bbabio.2010.03.008. [Google Scholar] [PubMed] [CrossRef]
24. Yusuf MA, Kumar D, Rajwanshi R, Strasser RJ, Tsimilli-Michael M, Govindjee, et al. Overexpression of g-tocopherol methyl transferase gene in transgenic Brassica juncea plants alleviate abiotic stress: physiological and chlorophyll a fluorescence measurements. Biochim Biophys Acta. 2010;1797:1428–38. doi:10.1016/j.bbabio.2010.02.002. [Google Scholar] [PubMed] [CrossRef]
25. Stirbet A, Govindjee. On the relation between the Kautsky effect (chlorophyll a fluorescence induction) and photosystem II: basics and applications of the OJIP fluorescence transient. J Photochem Photobiol B. 2011;104:236–57. doi:10.1016/j.jphotobiol.2010.12.010. [Google Scholar] [PubMed] [CrossRef]
26. Lichtenthaler HK. Chlorophylls and carotenoids: pigments of photosynthetic biomembranes. Meth Enzymol. 1987;148:350–82. doi:10.1016/0076-6879(87)48036-1. [Google Scholar] [CrossRef]
27. Verma S, Dubey RS. Leads toxicity induces lipid peroxidation and alters the activities of antioxidant enzymes in growing rice plants. Plant Sci. 2003;164:645–55. doi:10.1016/S0168-9452(03)00022-0. [Google Scholar] [CrossRef]
28. Velikova V, Yordanov I, Edreva A. Oxidative stress and some antioxidant systems in acid rain-treated bean plants: protective role of exogenous polyamines. Plant Sci. 2000;151:59–66. doi:10.1016/S0168-9452(99)00197-1. [Google Scholar] [CrossRef]
29. Woodrow P, Ciarmiello LF, Annunziata MG, Pacifico S, Iannuzzi F, Mirto A, et al. Durum wheat seedling responses to simultaneous high light and salinity involve a fine recon-figuration of amino acids and carbohydrate metabolism. Physiol Plant. 2017;159:290–312. doi:10.1111/ppl.12513. [Google Scholar] [PubMed] [CrossRef]
30. Bradford MM. A rapid and sensitive method for quantification of microgram quantities of protein utilizing the principle of protein-dye binding. Anal Biochem. 1976;72:248–54. doi:10.1016/0003-2697(76)90527-3. [Google Scholar] [PubMed] [CrossRef]
31. Siegel BZ, Galston W. The Isoperoxidases of Pisum sativum. Plant Physiol. 1967;42:221–6. doi:10.1104/pp.42.2.221. [Google Scholar] [PubMed] [CrossRef]
32. Nakano Y, Asada K. Hydrogen peroxide is scavenged by ascorbate—specific peroxidase in spinach chloroplasts. Plant Cell Physiol. 1981;22:867–80. doi:10.1093/oxfordjournals.pcp.a076232. [Google Scholar] [CrossRef]
33. Aebi H. Catalase in vitro. Methods Enzymol. 1984;105:121–6. doi:10.1016/S0076-6879(84)05016-3. [Google Scholar] [PubMed] [CrossRef]
34. Raymond J, Rakariyatham N, Azanza J. Purification and some properties of polyphenoloxidase from sunflower seeds. Phytochemistry. 1993;34:927–31. doi:10.1016/S0031-9422(00)90689-7. [Google Scholar] [CrossRef]
35. Singleton VL, Rossi JA. Colorimetry of total phenolics with phosphomolybdic-phosphotungstic acid reagents. Am J Enol Vitic. 1965;16:144–58. doi:10.5344/ajev.1965.16.3.144. [Google Scholar] [CrossRef]
36. Xu BJ, Chang SKC. A comparative study on phenolic profiles and antioxidant activities of legumes as affected by extraction solvents. J Food Sci. 2007;72:S159–66. doi:10.1111/j.1750-3841.2006.00260.x. [Google Scholar] [PubMed] [CrossRef]
37. Brand-Williams W, Cuvelier ME, Berset C. Use of a free radical method to evaluate antioxidant activity. LWT-Food Sci Technol. 1995;28:25–30. doi:10.1016/S0023-6438(95)80008-5. [Google Scholar] [CrossRef]
38. Zhang H, Wang L, Jin X, Bian L, Ge Y. High-throughput phenotyping of plant leaf morphological, physiological, and biochemical traits on multiple scales using optical sensing. Crop J. 2023;11:1303–18. doi:10.1016/j.cj.2023.04.014. [Google Scholar] [CrossRef]
39. Tang GL, Li XY, Lin LS, Gu ZY, Zeng FJ. The chlorophyll a fluorescence characteristic in different types of leaf senescence in Alhagi sparsifolia. J Plant Growth Regul. 2016;35:952–64. doi:10.1007/s00344-016-9593-2. [Google Scholar] [CrossRef]
40. Strasser RJ, Tsimilli-Michael M, Srivastava A. Analysis of the fluorescence transient. In: Papageorgiou GC, Govindjee, editors. Chlorophyll fluorescence: a signature of photosynthesis. Dordrecht, The Netherlands: Springer; 2004. p. 321–62. doi:10.1007/978-1-4020-3218-9_12. [Google Scholar] [CrossRef]
41. Li L, Li XY, Xu XW, Lin LS, Zeng FJ, Chen FL. Assimilative branches and leaves of the desert plant Alhagi sparsifolia Shap. Possesses a different adaptation mechanism to shade. Plant Physiol Biochem. 2014;74:239–45. doi:10.1016/j.plaphy.2013.11.009. [Google Scholar] [PubMed] [CrossRef]
42. Strasser RJ, Srivastava A, Tsimilli-Michael M. The fluorescence transient as a tool to characterize and screen photosynthetic samples. In: Yunus M, Pathre U, Mohanty P, editors. Probing photosynthesis: mechanism, regulation and adaptation. Boca Raton, FL, USA: Taylor and Francis; 2000. p. 445–83. [Google Scholar]
43. Tang G, Li X, Lin L, Guo H, Li L. Combined effects of girdling and leaf removal on fluorescence characteristic of Alhagi sparsifolia leaf senescence. Plant Biol. 2015;17:980–9. doi:10.1111/plb.12309. [Google Scholar] [PubMed] [CrossRef]
44. Zhang B, Zhang H, Lu D, Cheng L, Li J. Effects of biofertilizers on the growth, leaf physiological indices and chlorophyll fluorescence response of spinach seedlings. PLoS One. 2023;18:e0294349. doi:10.1371/journal.pone.0294349. [Google Scholar] [PubMed] [CrossRef]
45. Cechin I, Rossi SC, Oliveira VC, Fumis TF. Photosynthetic responses and proline content of mature and young leaves of sunflower plants under water deficit. Photosynthetica. 2006;44:143–6. doi:10.1007/s11099-005-0171-2. [Google Scholar] [CrossRef]
46. Španić V, Šunić K, Duvnjak J, Hu Y-G, Katanić Z. Chlorophyll a fluorescence during flag leaf senescence of field-grown winter wheat plants under drought conditions. Ann Appl Biol. 2023;183:80–92. doi:10.1111/aab.12836. [Google Scholar] [CrossRef]
47. Maxwell K, Johnson GN. Chlorophyll fluorescence—a practical guide. J Exp Bot. 2000;51:659–68. doi:10.1093/jexbot/51.345.659. [Google Scholar] [CrossRef]
48. Markulj Kulundžić A, Sudarić A, Matoša Kočar M, Duvnjak T, Liović I, Mijić A, et al. Detailed insight into the behaviour of chlorophyll a fluorescence transient curves and parameters during different times of dark adaptation in sunflower leaves. Agronomy. 2024;14:954. doi:10.3390/agronomy14050954. [Google Scholar] [CrossRef]
49. Lu Q, Lu C, Zhang J, Kuang T. Photosynthesis and chlorophyll a fluorescence during flag leaf senescence of field-grown wheat plants. J Plant Physiol. 2002;159:1173–8. doi:10.1078/0176-1617-00727. [Google Scholar] [CrossRef]
50. Mikkelsen TN, Heide-Jørgensen HS. Acceleration of leaf senescence in Fagus sylvatica L. by low levels of tropospheric ozone demonstrated by leaf colour, chlorophyll fluorescence and chloroplast ultrastructure. Trees. 1996;10:145–56. doi:10.1007/BF02340766. [Google Scholar] [CrossRef]
51. Sitko K, Rusinowski S, Pogrzeba M, Daszkowska-Golec A, Kalaji HM, Małkowski E. Development and aging of photosynthetic apparatus of Vitis vinifera L. during growing season. Photosynthetica. 2020;58:186–93. doi:10.32615/ps.2019.107. [Google Scholar] [CrossRef]
52. Viljevac Vuletić M, Španić V. Characterization of photosynthetic performance during natural leaf senescence in winter wheat: multivariate analysis as a tool for phenotypic characterization. Photosynthetica. 2020;58(SI):301–13. doi:10.32615/ps.2019.162. [Google Scholar] [CrossRef]
53. Krieger-Liszkay A, Krupinska K, Shimakawa G. The impact of photosynthesis on initiation of leaf senescence. Physiol Plant. 2019;166:148–64. doi:10.1111/ppl.12921. [Google Scholar] [PubMed] [CrossRef]
54. Sairam R, Singh D, Srivastava G. Changes in activities of antioxidant enzymes in sunflower leaves of different ages. Biol Plant. 2003;47:61–6. doi:10.1023/A:1027328814591. [Google Scholar] [CrossRef]
55. Lepeduš H, Gaća V, Viljevac M, Kovač S, Fulgosi H, Šimić D, et al. Changes in photosynthetic performance and antioxidative strategies during maturation of Norway maple (Acer platanoides L.) leaves. Plant Physiol Biochem. 2011;49:368–76. doi:10.1016/j.plaphy.2010.12.011. [Google Scholar] [PubMed] [CrossRef]
56. Agüera E, Cabello P, de la Mata L, Molina E, de la Haba P. Metabolic regulation of leaf senescence in sunflower (Helianthus annuus L.) plants. In: Nagata T, editor. Senescence. Rijeka, Croatia: Intech Open; 2012. p. 51–68. [cited 2024 Nov 14]. https://www.intechopen.com/chapters/30024. [Google Scholar]
57. Gan S-S, Hörtensteiner S. Frontiers in plant senescence research: from bench to bank. Plant Mol Biol. 2013;82(6):503–4. doi:10.1007/s11103-013-0098-0. [Google Scholar] [PubMed] [CrossRef]
58. Gregersen PL, Holm PB, Krupinska K. Leaf senescence and nutrient remobilization in barley and wheat. Plant Biol. 2008;10:37–49. doi:10.1111/j.1438-8677.2008.00114.x. [Google Scholar] [PubMed] [CrossRef]
59. Gregersen PL, Culetic A, Boschian L, Krupinska K. Plant senescence and crop productivity. Plant Mol Biol. 2013;82:603–22. doi:10.1007/s11103-013-0013-8. [Google Scholar] [PubMed] [CrossRef]
60. Joshi S, Choukimath A, Isenegger D, Panozzo J, Spangenberg G, Kant S. Improved wheat growth and yield by delayed leaf senescence using developmentally regulated expression of a cytokinin biosynthesis gene. Front Plant Sci. 2019;18(10):1285. doi:10.3389/fpls.2019.01285. [Google Scholar] [PubMed] [CrossRef]
61. Chibane N, Caicedo M, Martinez S, Marcet P, Revilla P, Ordás B. Relationship between delayed leaf senescence (Stay-Green) and agronomic and physiological characters in maize (Zea mays L.). Agronomy. 2021;11(2):276. doi:10.3390/agronomy11020276. [Google Scholar] [CrossRef]
62. Cechin I, Corniani N, Fumis TF, Cataneo AC. Differential responses between mature and young leaves of sunflower plants to oxidative stress caused by water deficit. Cienc Rural. 2010;40:1290–4. doi:10.1590/S0103-84782010000600008. [Google Scholar] [CrossRef]
63. de La Mata L, Cabello P, De La Haba P, Agüera E. Study of the senescence process in primary leaves of sunflower (Helianthus annuus L.) plants under two different light intensities. Photosynthetica. 2013;51:85–94. doi:10.1007/s11099-013-0001-x. [Google Scholar] [CrossRef]
64. de la Haba P, la Mata L De, Molina E, Agüera E. High temperature promotes early senescence in primary leaves of sunflower (Helianthus annuus L.) plants. Can J Plant Sci. 2014;94:659–69. doi:10.4141/cjps2013-276. [Google Scholar] [CrossRef]
65. Wang SJ, Zhai S, Xu XT, Lu YT, Yuan TT. Hydrogen peroxide participates in leaf senescence by inhibiting CHLI1 activity. Plant Cell Rep. 2024;43:258. doi:10.1007/s00299-024-03350-4. [Google Scholar] [PubMed] [CrossRef]
66. Umar M, Siddiqui ZS. Physiological performance of sunflower genotypes under combined salt and drought stress environment. Acta Bot Croat. 2018;77:36–44. doi:10.2478/botcro-2018-0002. [Google Scholar] [CrossRef]
67. Alia, Mohanty P, Matysik J. Effect of proline on the production of singlet oxygen. Amino Acids. 2001;21:195–200. doi:10.1007/s007260170026. [Google Scholar] [PubMed] [CrossRef]
68. Wada S, Hayashida Y, Izumi M, Kurusu T, Hanamata S, Kanno K, et al. Autophagy supports biomass production and nitrogen use efficiency at the vegetative stage in rice. Plant Physiol. 2015;168:60–73. doi:10.1104/pp.15.00242. [Google Scholar] [PubMed] [CrossRef]
69. Buet A, Costa ML, Martinez DE, Guiamet JJ. Chloroplast protein degradation in senescing leaves: proteases and lytic compartments. Front Plant Sci. 2019;10:747. doi:10.3389/fpls.2019.00747. [Google Scholar] [PubMed] [CrossRef]
70. Moroldo M, Blanchet N, Duruflé H, Bernillon S, Berton T, Fernandez, et al. Genetic control of abiotic stress-related specialized metabolites in sunflower. BMC Genomics. 2024;25:199. doi:10.1186/s12864-024-10104-9. [Google Scholar] [PubMed] [CrossRef]
71. Gai F, Karamać M, Janiak MA, Amarowicz R, Peiretti PG. Sunflower (Helianthus annuus L.) plants at various growth stages subjected to extraction-comparison of the antioxidant activity and phenolic profile. Antioxidants. 2020;9:535. doi:10.3390/antiox9060535. [Google Scholar] [PubMed] [CrossRef]
72. Nadeem M, Zeb A. Impact of maturity on phenolic composition and antioxidant activity of medicinally important leaves of Ficus carica L. Physiol Mol Biol Plants. 2018;24:881–7. doi:10.1007/s12298-018-0550-3. [Google Scholar] [PubMed] [CrossRef]
73. Liu Z, Bruins ME, de Bruijn WJC, Vincken JP. A comparison of the phenolic composition of old and young tea leaves reveals a decrease in flavonols and phenolic acids and an increase in flavonols upon tea leaf maturation. J Food Compos Anal. 2020;86:103385. doi:10.1016/j.jfca.2019.103385. [Google Scholar] [CrossRef]
74. Zeb A. Ellagic acid in suppressing in vivo and in vitro oxidative stresses. Mol Cell Biochem. 2018;448:27–41. doi:10.1007/s11010-018-3310-3. [Google Scholar] [PubMed] [CrossRef]
75. Fernandez O, Urrutia M, Berton T, Bernillon S, Deborde C, Jacob D, et al. Metabolomic characterization of sunflower leaf allows discriminating genotype groups or stress levels with a minimal set of metabolic markers. Metabolomics. 2019;15:56. doi:10.1007/s11306-019-1515-4. [Google Scholar] [PubMed] [CrossRef]
76. Abdalla AAA, Yagi S, Abdallah AH, Abdalla M, Sinan KI, Zengin G. Phenolic profile, antioxidant and enzyme inhibition properties of seed methanolic extract of seven new Sunflower lines: from fields to industrial applications. Process Biochem. 2021;111:53–61. doi:10.1016/j.procbio.2021.10.014. [Google Scholar] [CrossRef]
Cite This Article
 Copyright © 2025 The Author(s). Published by Tech Science Press.
This work is licensed under a Creative Commons Attribution 4.0 International License , which permits unrestricted use, distribution, and reproduction in any medium, provided the original work is properly cited.
 Downloads
 Citation Tools