
 Submit a Paper
 Propose a Special lssue
 Open Access
ARTICLE

Grain Photosynthesis and Filling Characteristics of Rice Varieties with Different Grain Weights
1 Rice and Product Ecophysiology, Key Laboratory of Ministry of Education for Crop Physiology and Molecular Biology, Hunan Agricultural University, Changsha, 410128, China
2 National Engineering Research Center of Rice, College of Agronomy, Hunan Agricultural University, Changsha, 410128, China
* Corresponding Authors: Min Huang. Email: ; Jiana Chen. Email:
Phyton-International Journal of Experimental Botany 2025, 94(7), 2155-2165. https://doi.org/10.32604/phyton.2025.066940
Received 21 April 2025; Accepted 27 June 2025; Issue published 31 July 2025
 View Full Text
 Download PDF
Abstract
Grain filling is a critical determinant of yield and quality in rice. This study aims to clarify the association between grain photosynthesis and the filling rate of rice varieties with different grain weights, providing a theoretical foundation for optimizing grain-filling processes. Two rice varieties with similar growth duration but different grain weights were selected: a large-grain variety, Lingliangyou 268 (L268), and a small-grain variety, Ruiliangyou 1053 (R1053). Differences in grain filling, grain photosynthetic rate, and grain chlorophyll content were systematically examined during the filling stage. Results showed significant differences in grain-filling, grain photosynthetic rate, and grain chlorophyll content between large-grain and small-grain rice varieties. The grain photosynthetic rate of L268 was a significantly higher than R1053. L268 also exhibited significantly higher initial grain filling rate, maximum grain-filling rate, and mean grain filling rate compared to R1053. Throughout the grain filling period, L268 showed higher grain chlorophyll content (including chlorophyll a, chlorophyll b, and total chlorophyll) than R1053. The increase in chlorophyll content, particularly total chlorophyll, enhanced the grain photosynthetic rate during the early and middle stages of grain filling significantly. These findings suggested that rice varieties with higher grain weights exhibited stronger panicle photosynthetic capacity due to their higher chlorophyll content. The enhanced grain photosynthetic rate contributed to improved grain filling and increased grain weight.Keywords
The formation of rice reproductive organs is a continuous and progressive process, with grains being the last organ to develop. Grain weight is the final yield component to form, representing the culmination of individual plant development, cultivation techniques, environmental conditions, and production objectives. Studies have shown that advancements in breeding technologies and methods have led to a relatively stable increase in the number of panicles and grains per unit area. On this basis, increasing the grain weight is key to further improving yield. The increase in grain weight is closely related to grain-filling characteristics [1].
In cereals, grain-filling and ripening depend on the transport of photosynthetic assimilates, primarily sourced from: (1) the flag leaf, (2) the panicle/spike, and (3) remobilization of reserves stored pre-anthesis in the stem. The relative contribution of different plant organs varies with genotype (species and cultivar) and environmental conditions [2,3]. Most photosynthesis research has focused on leaves, while the carbon assimilation capacity of green non-foliar organs and their contribution to crop yield remain comparatively understudied [4,5]. Research on rice panicles has primarily emphasized their role as a “sink” for photosynthetic assimilates, with limited attention given to their “source” function. In reality, rice panicles inherently possess both “sink” and “source” characteristics, given that they contain chlorophyll and are capable of photosynthesis. Recent chlorophyll fluorescence and gas exchange measurements demonstrate substantial photosynthetic carbon assimilation capacity in panicles of wheat and rice [6–9]. Evidence from various methodological approaches has identified panicles as the primary contributors of photosynthates to grain filling [6,9], as panicle photosynthetic organs are closer to grains than leaves, facilitating the transport and storage of assimilates. During grain filling, panicles are the last photosynthetic organs to senesce [10]. The photosynthetic rate of leaves decreases after heading, whereas other plant organs, including panicles, can maintain photosynthetic activity during the latter stages of grain filling, supplying assimilates to developing grains [11]. Under higher light conditions than leaves, the photosynthetic tissues of panicles (e.g., glumes, lemma, palea, grain-covering palea and lemma, awns, and filamentous extensions of outer membranes) located at the canopy top exhibit stronger photosynthetic capacity. The total photosynthetic rate of panicles can equal or exceed that of flag leaves [3,12]. Moreover, the panicles display greater tolerance to water stress compared to the flag leaves [13]. Therefore, panicles are likely the primary contributors to photosynthesis during the grain-filling period [6,11,14], and panicle photosynthetic carbon assimilation is crucial for yield formation [5]. Studies using carbon isotope labeling techniques have shown that 59% of the dry matter in wheat grains originates from photosynthetic products of wheat panicles, with panicle-derived photosynthates contributing 30%–40% to yield [14,15]. Recent studies have reported variations in photosynthesis among different panicle-grain types. Large-panicle, large-grain varieties exhibit significantly higher leaf photosynthetic rates compared to medium-panicle, medium-grain varieties. Furthermore, the dry matter transported from organs like rachilla and glumes to grains is significantly greater in large-panicle, large-grain varieties [16]. Under elevated CO2 conditions, large-panicle varieties exhibit higher photosynthetic rates compared to multi-panicle varieties, enabling them to assimilate more carbon under drought conditions. The higher photosynthetic performance and sink capacity during grain-filling contribute to yield improvement, thereby mitigating the adverse effects of drought [17]. Based on these findings, some researchers have suggested that improving panicle photosynthesis holds significant promise for enhancing crop yield, quality, and tolerance to abiotic stress [18]. This represents a new avenue for future crop yield improvement [5,9,14].
Previous studies have predominantly focused on the effects of specific varieties or external environmental conditions on grain filling. However, limited research has been conducted on the relationship between grain-filling and grain photosynthesis in rice varieties with contrasting grain weights [19]. Moreover, indica rice varieties in agricultural production exhibit considerable variation in grain weight and distinct grain-filling dynamics. Therefore, this study aims to elucidate differences in panicle photosynthetic capacity among rice varieties with divergent grain weights and to clarify the impact of panicle photosynthesis on grain filling.
2.1 Plant Material and Experimental Conditions
Two rice varieties with similar growth duration but contrasting grain weights were selected: a large-grain variety (Lingliangyou 268, L268) and a small-grain variety (Ruiliangyou 1053, R1053) (Fig. 1A,B) [20,21]. The seeds of Lingliangyou 268 were procured from Hunan Yahua Seed Co., Ltd. (Changsha, China), and the seeds of Ruiliangyou 1053 were procured from Changsha Licheng Seed Co., Ltd. (Changsha, China).
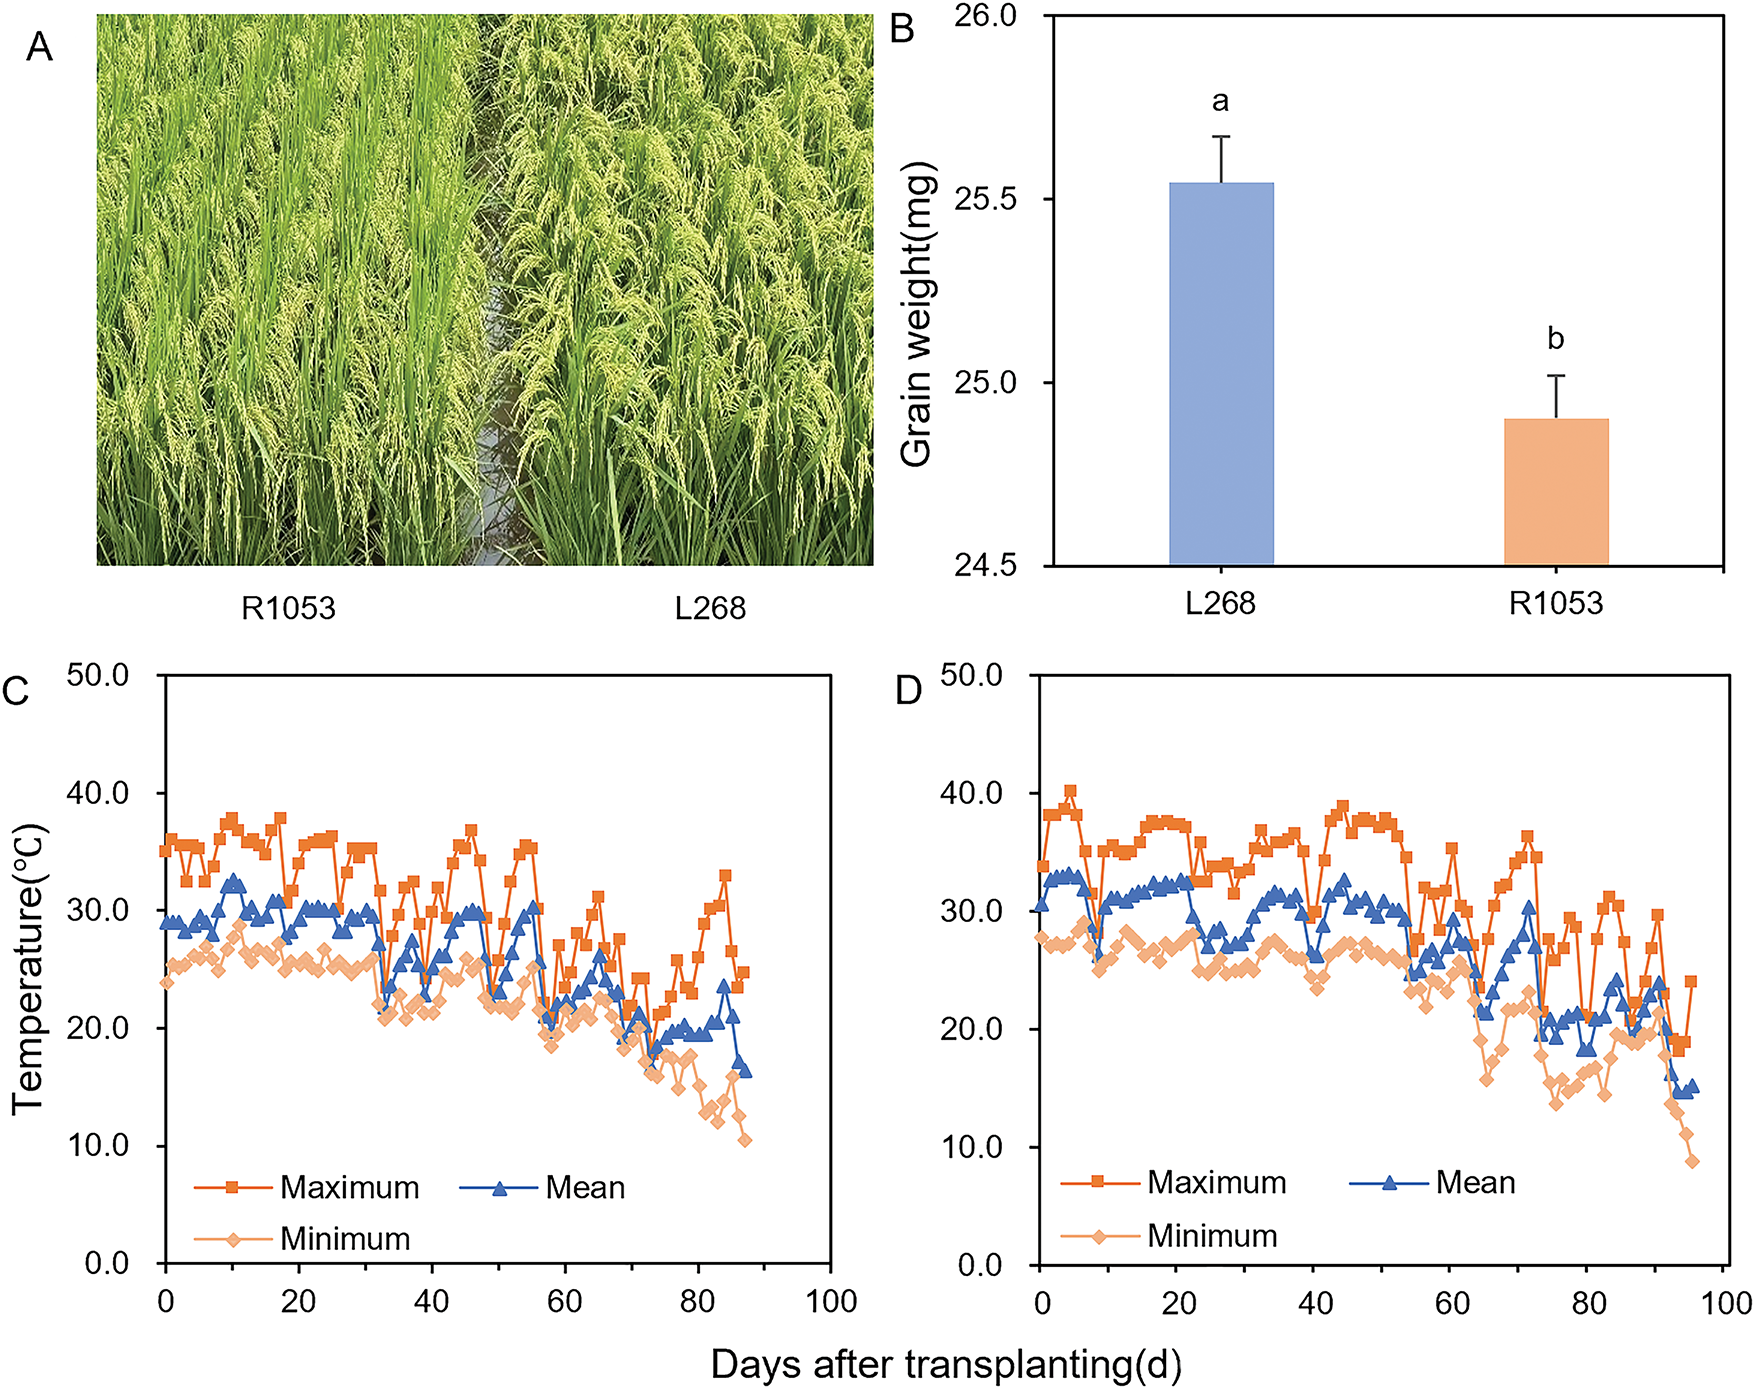
Figure 1: Characteristics of rice varieties, Lingliangyou 268 (L268) and Ruiliangyou 1053 (R1053) (A). Rice grain weight shows the mean value ± SE, n = 3 (B). Different lowercase letters indicate significant differences (p < 0.05) in grain weight between rice varieties L268 and R1053 based on LSD multiple comparisons test. The maximum, mean, and minimum temperatures after transplanting in the experimental field of 2023 (C) and 2024 (D)
The experimental site was located in Pingtou Village, Yongan Town, Liuyang City, Hunan Province (28°15′ N, 113°60′ E, 43 m above sea level). The experimental field soil was classified as clay. Soil samples collected from the top 20 cm layer were analyzed for physical and chemical properties before the experiment. Key soil physicochemical properties were as follows: 15.95 g kg−1 organic carbo; 235.15 mg kg−1 available K; 154.43 mg kg−1 available N; 35.57 mg kg−1 available P; 6.26 pH. Daily temperature variations at the experimental site during 2023–2024 are shown in Fig. 1C,D.
The experiment was conducted from 2023 to 2024. Based on previous research and production survey results, the experiment was carried out in the late growing season using a randomized block design with four replicates and a plot area of 40 m2. Seeds were sown on June 25 using machine-transplanted tray seedlings and transplanted on July 24 with a planting density of 25 cm × 12 cm. The amounts of nitrogen (N), phosphorus (P2O5), and potassium (K2O) fertilizers applied in the experimental field were 150 kg N hm−2, 75 kg P2O5 hm−2, and 150 kg K2O hm−2, respectively. Nitrogen fertilizer was applied at a ratio of basal fertilizer: tillering fertilizer: panicle fertilizer = 5:3:2. Phosphorus fertilizer was applied entirely as a basal fertilizer. Potassium fertilizer was applied at a ratio of basal fertilizer: panicle fertilizer = 5:5. Basal fertilizer was applied 1 day before transplanting, tillering fertilizer was applied 7 days after transplanting, and panicle fertilizer was applied at the initial stage of panicle differentiation. Flood irrigation (3–10 cm) was maintained throughout the growth period, with strict chemical control of pests, diseases, and weeds. Water was withheld 7 days before harvest.
2.2 Grain Photosynthetic Rate of Rice Panicles
At the heading stage, 300 panicles that opened on the same day with uniform morphology and synchronized anthesis were selected and labeled for measurements.
A portable photosynthetic system (LI-6400XT; Li-Cor, Lincoln, NE, USA) was used to measure the middle part of the grain photosynthetic rate on sunny, windless days at 0, 3, 6, 9, 12, 15, 18, 21, 24, and 27 days after flowering (DAF). Due to weather conditions, actual measurements in 2023 were taken on 6, 12, and 18 DAF and in 2024 on 6, 9, 15, and 20 DAF from 9:00 a.m. to 12:00 p.m. with three replicates per treatment. A custom cylindrical leaf chamber (Li-Cor Model 6400-05) was used to count the number of grains on three marked panicles, and the single-grain photosynthetic rate was calculated. Measurements were conducted under controlled environmental conditions with light intensity set at 1200–1500 μmol m−2s−1, reference carbon dioxide (CO2) concentration at 390 μmol mol−1, air temperature at 32.5°C, and relative humidity at 65%.
At the same time as measuring the photosynthetic rate, the panicles used for the photosynthetic measurements were collected, and 20 grains were selected to determine chlorophyll content. The 20 grains were evenly placed into a 50 mL volumetric flask and chlorophyll was extracted using 95% ethanol [22].
Five marked panicles per plot were sampled at 3, 6, 9, 12, 15, 18, 21, 24, 27, and 30 days after flowering (DAF). Extracted the middle section of the panicle, diseased and empty grains were removed from these panicles, which were then manually threshed and counted. The grains were dried to a constant weight at 70°C, and the grain weight dynamics were determined. The grain-filling process was fitted using the logistic equation [23]. The initial grain filling rate (GR0), the maximum grain filling rate (GRmax), the mean grain filling rate (GRmean). And the time to reach the maximum grain filling rate (Tmax) were calculated according to Huang et al. [24].
Statistical analyses for single-factor experiments were conducted using SPSS 21.0, employing the LSD method to test the significance of differences at the 0.05 level. Data organization and processing were performed using Microsoft Excel 2021, while graphical representations were created using Origin 2021 and GraphPad Prism 9.5. The grain-filling process, defined as the change in grain weight over time after heading, was fitted with the logistic equation.
3.1 Grain Filling of Rice Varieties with Different Grain Weights
Significant differences were observed in the grain-filling process among different rice varieties. The grain-filling processes of both varieties were fitted by the logistic equation. In 2023 (Fig. 2A) and 2024 (Fig. 2B), the coefficients of determination (R2) for the grain-filling processes of L268 and R1053 were highly significant, at 0.9958, 0.9941, 0.9982, and 0.9964, respectively. In 2023, GR0, GRmax, and GRmean of L268 were significantly higher than those of R1053, with increases of 12.90%, 12.70%, and 10%, respectively. Tmax showed no significant difference between the two varieties. In 2024, GR0, GRmax, and GRmean of L268 were also significantly higher than those of R1053, with increases of 12.90%, 2.81%, and 6.9%, respectively. Similarly, there was no significant difference in the time to reach Tmax (Table 1).
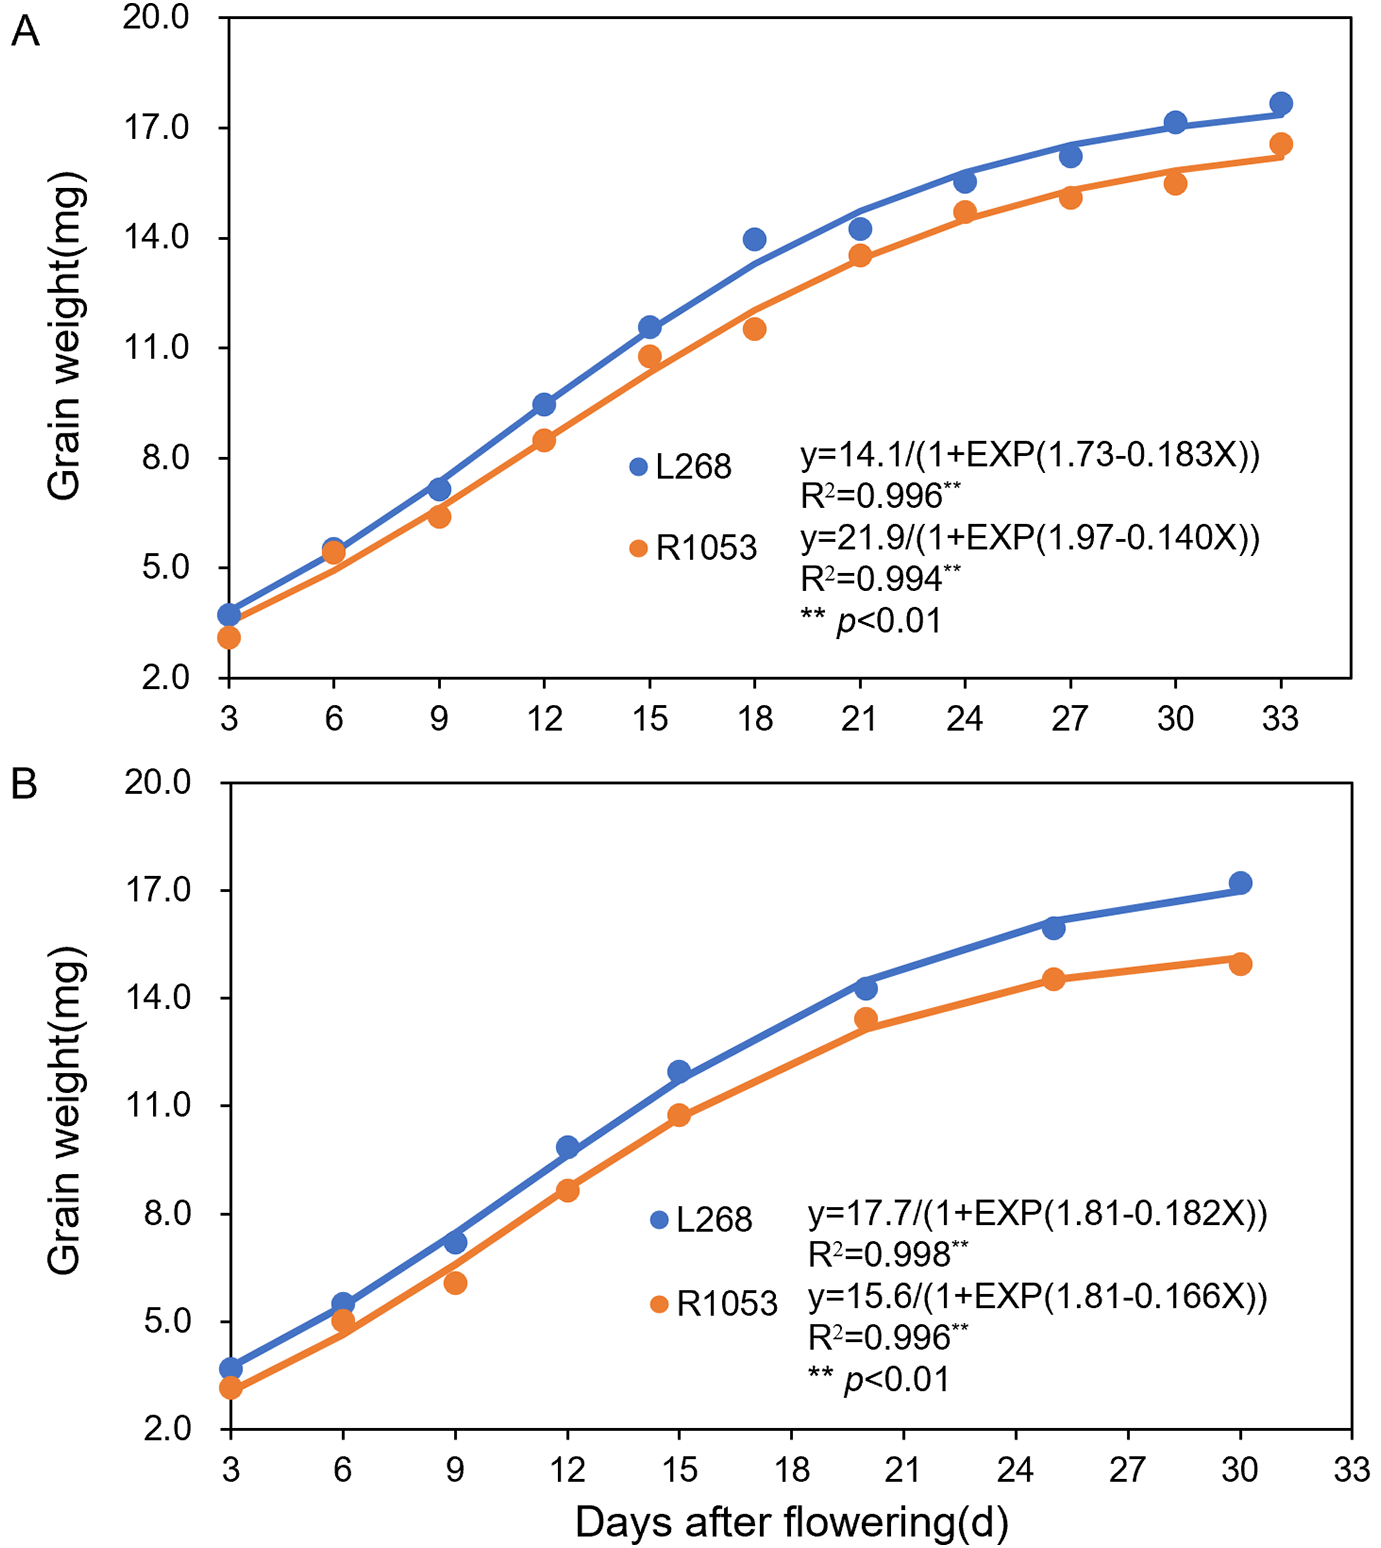
Figure 2: Linear regression fitting based on the logistic equation was applied to model the grain filling dynamics of rice varieties Lingliangyou 268 (L268) and Ruiliangyou 1053 (R1053) in 2023 (A) and 2024 (B). Each data point represents the mean of three measurements
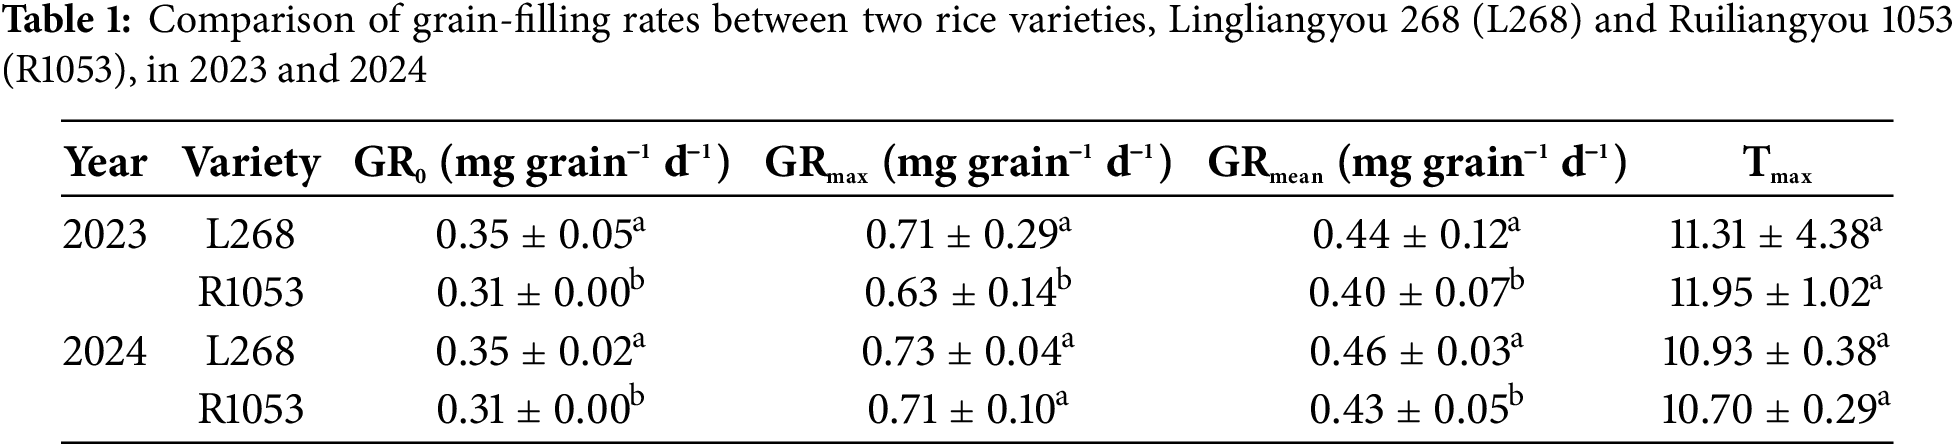
Different lowercase letters within the same column denote significant differences (p < 0.05) in grain-filling rates between rice varieties Lingliangyou 268 (L268) and Ruiliangyou 1053 (R1053), as determined by LSD multiple comparisons tests conducted for each year. Grain-filling rates show the mean value ± SE, n = 3. GR0: The initial grain filling rate, GRmax: The maximum grain filling rate, GRmean: The mean grain filling rate, and Tmax: The time to reach the maximum grain filling rate.
3.2 Grain Photosynthetic Rate of Grains from Rice Varieties with Different Grain Weights
Based on the grain-filling dynamics observed over two years, further experiments compared the grain photosynthetic rate and chlorophyll content of L268 and R1053. In both 2023 and 2024, the grain photosynthetic rate of L268 was significantly higher than that of R1053 (Fig. 3). As the grains matured, the photosynthetic rate decreased, and the difference between the two varieties became non-significant. As the growth period progressed, the grain photosynthetic rate of R1053 declined more slowly than that of L268. At 15 and 20 days after flowering, the differences in photosynthetic rate between the two varieties were not significant.
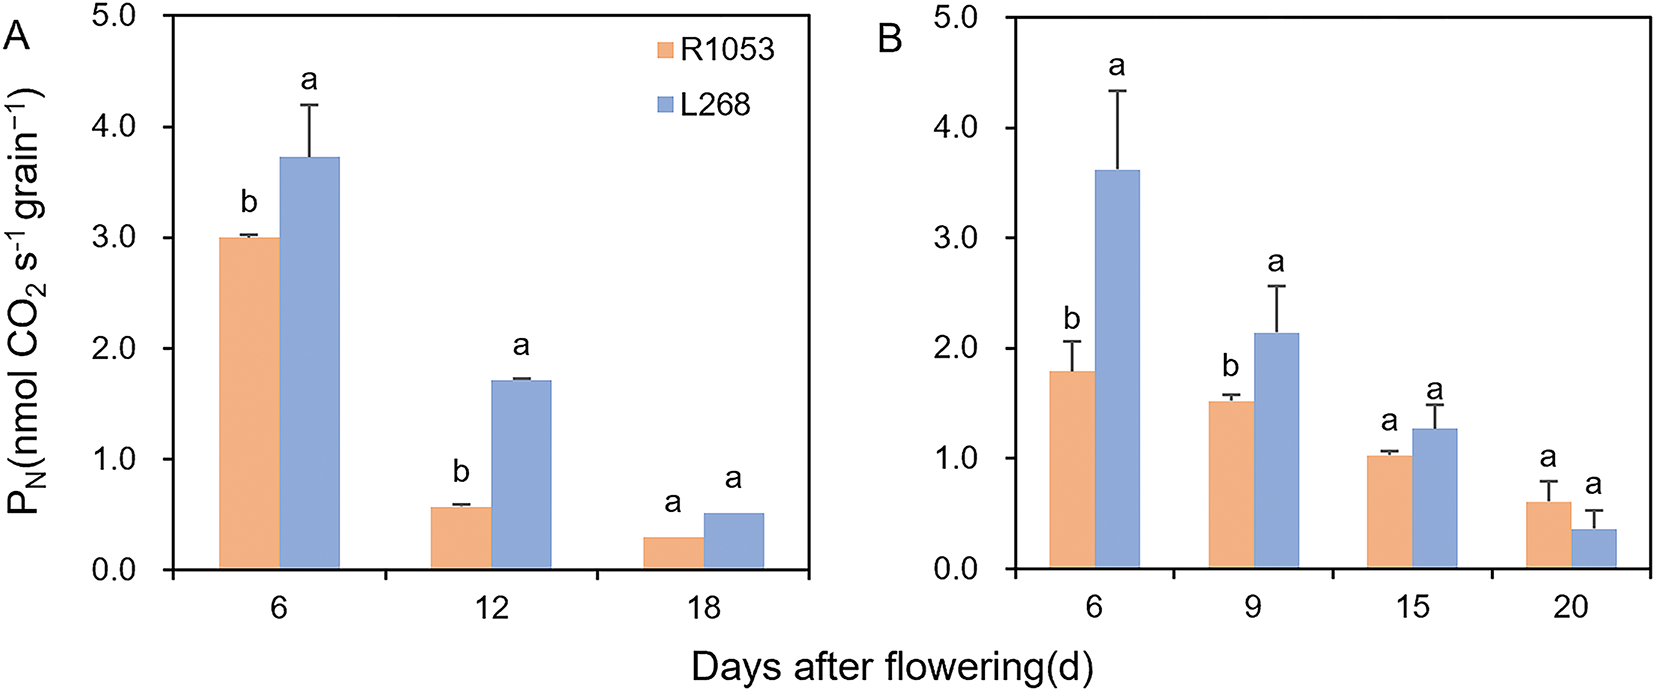
Figure 3: Grain photosynthetic rate (PN) for Lingliangyou 268 (L268) and Ruiliangyou 1053 (R1053) in 2023 (A) and 2024 (B). Different letters indicate significant differences (p < 0.05) in grain photosynthetic rate between L268 and R1053. Grain photosynthetic rate was shown as the mean value ± SE, n = 3
3.3 Chlorophyll Content of Grains from Rice Varieties with Different Grain Weights
In 2023 and 2024, significant differences were observed in the chlorophyll a, chlorophyll b, and total chlorophyll content of grains between the two rice varieties. However, no significant differences were found at the late heading and flowering stages, and the chlorophyll content exhibited a declining trend as the grains matured (Fig. 4). In 2023, the chlorophyll a content of grains at 6, 12, and 18 days after flowering (DAF) in L268 was 28.30%, 13.79%, and 40.48% higher than that of R1053, respectively. The chlorophyll b content at 6 and 12 DAF in L268 was 45.32% and 50.06% higher than that of R1053, respectively (Fig. 4A,C). In 2024, the chlorophyll a content of grains at 6, 9, and 15 DAF in L268 was 32.08%, 17.80%, and 19.00% higher than that of R1053, respectively. The chlorophyll b content at 6, 9, and 15 DAF in L268 was 51.23%, 13.98%, and 36.49% higher than that of R1053, respectively (Fig. 4B,D). The variation trends in total chlorophyll content of grains in 2023 and 2024 were similar to those of chlorophyll a content (Fig. 4E,F). However, no significant differences were observed in the chlorophyll a:b ratio of grains (Fig. 4G,H).
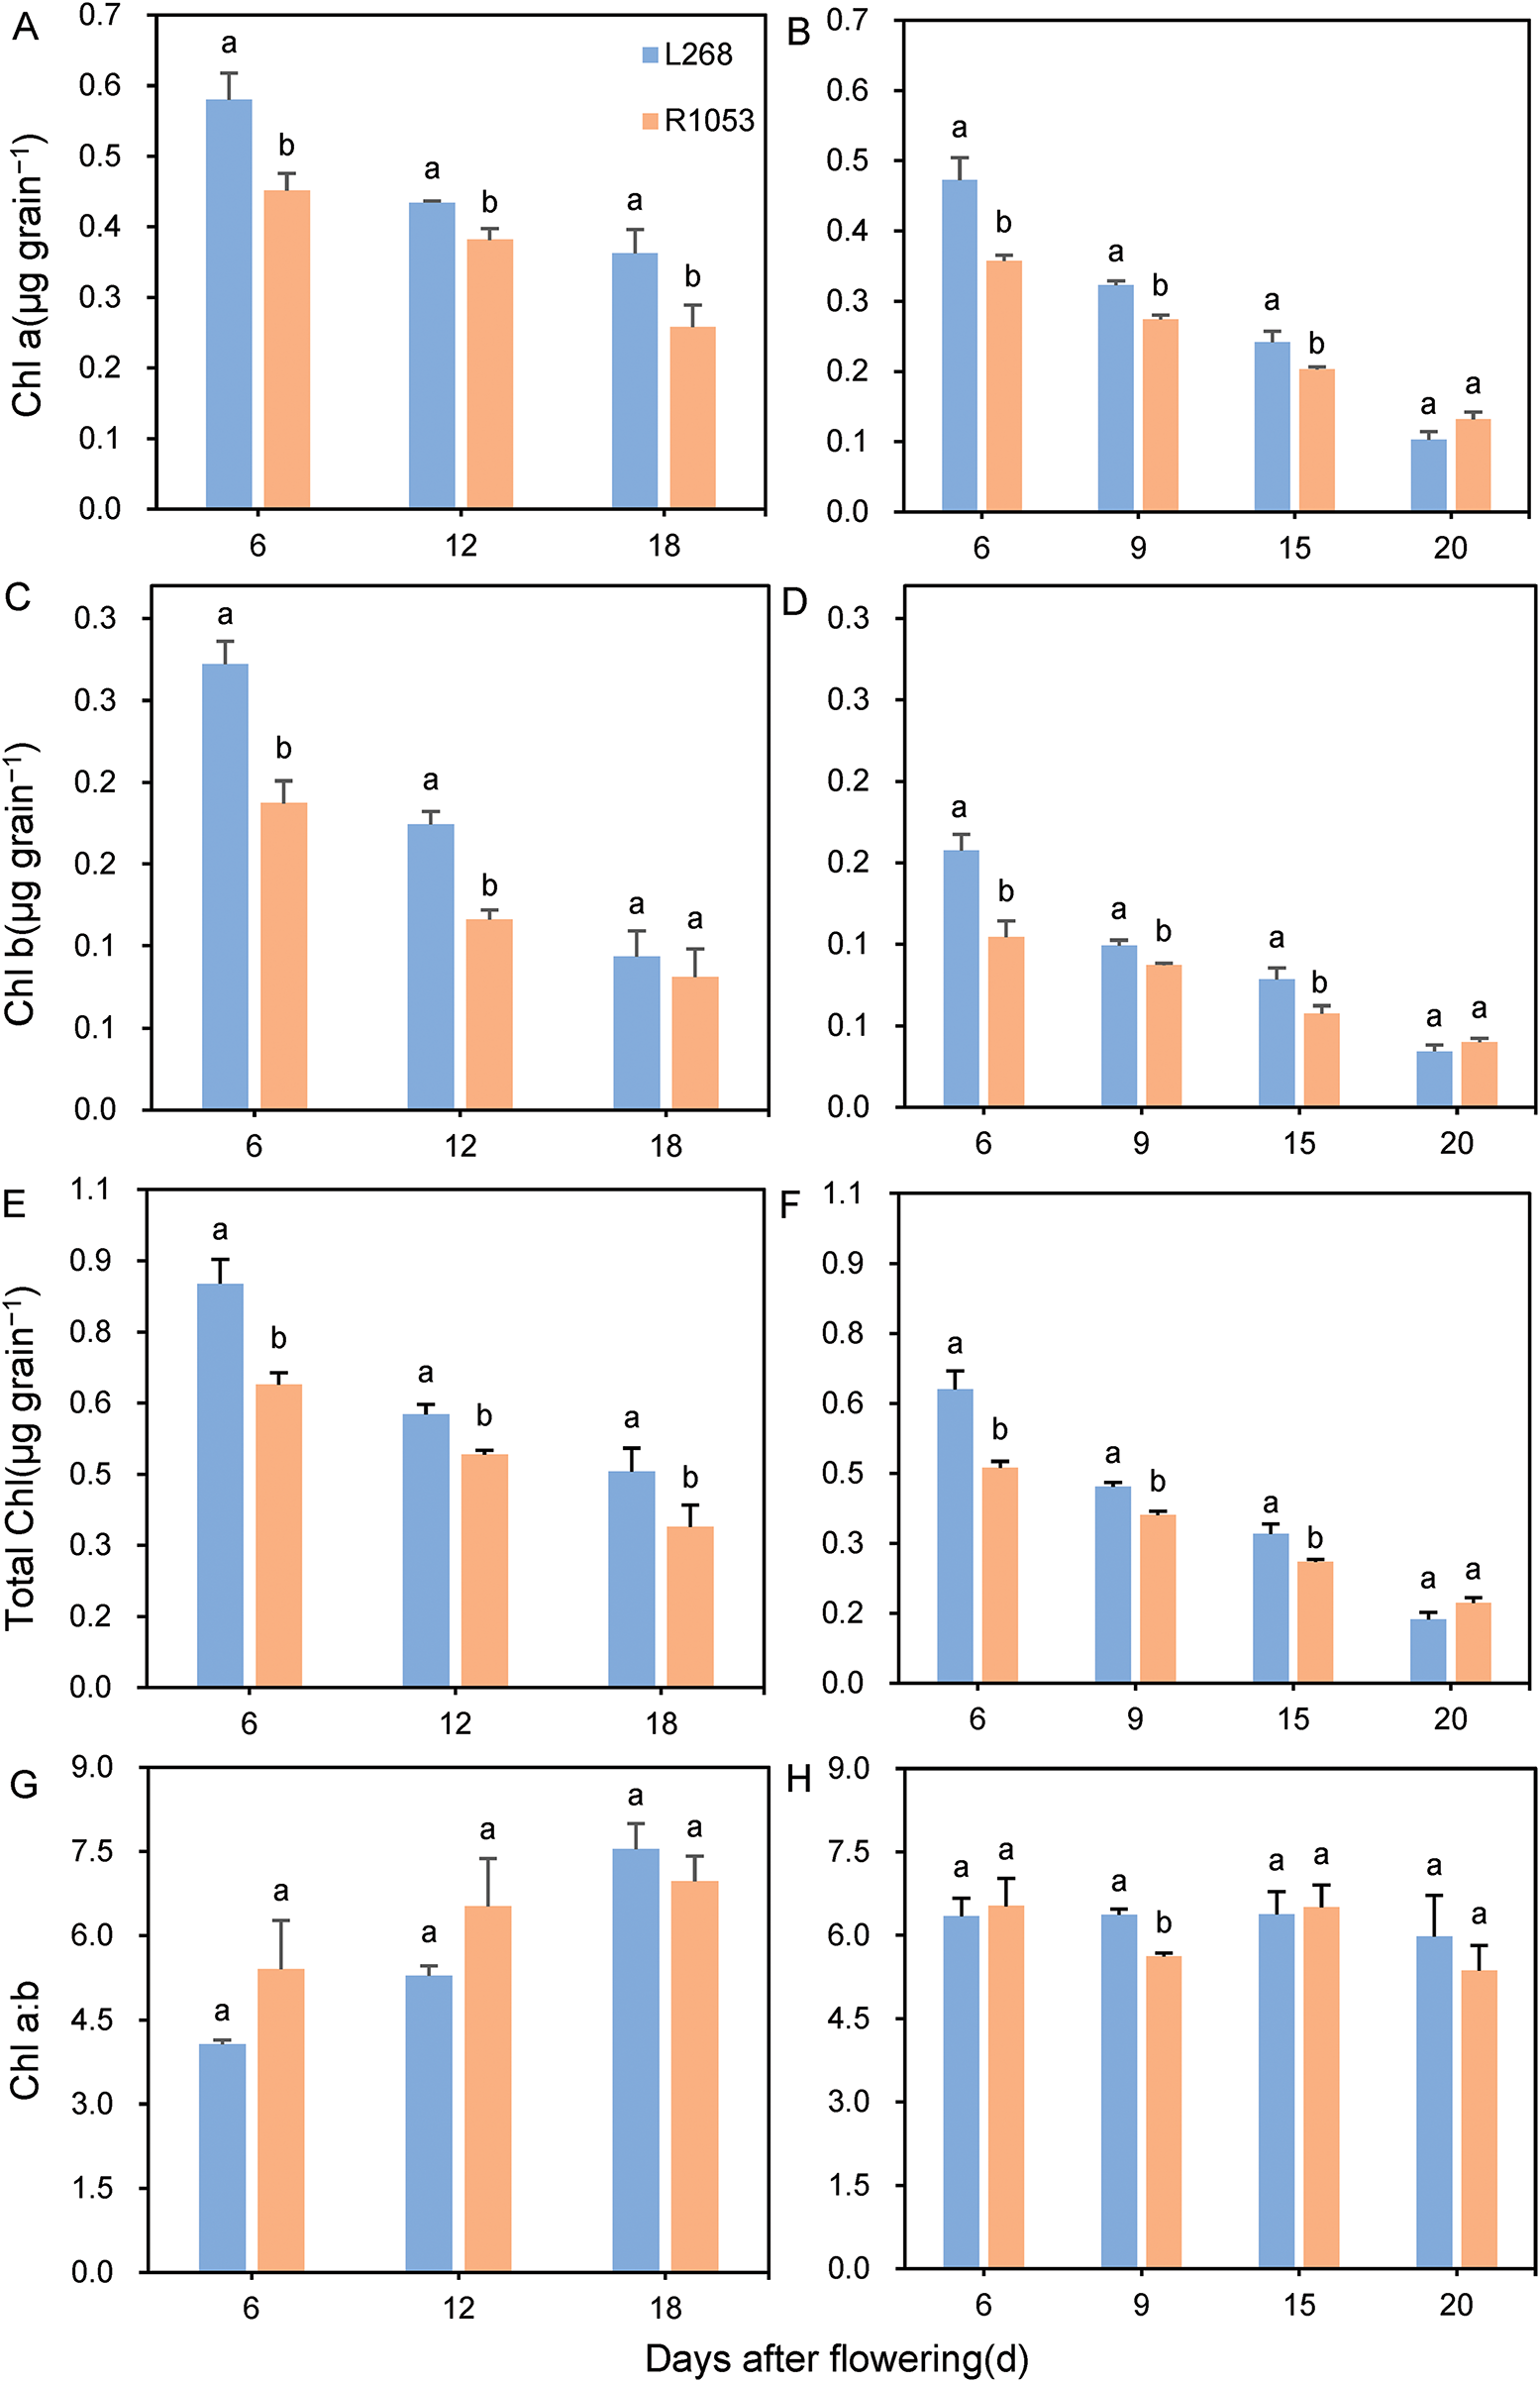
Figure 4: Comparison of chlorophyll a (A,B), chlorophyll b (C,D), total chlorophyll (E,F) contents, and chlorophyll a:b ratio (G,H) in grains of two rice varieties, Lingliangyou 268 (L268) and Ruiliangyou 1053 (R1053), in 2023 and 2024. Different letters in the table indicate significant differences (p < 0.05) in chlorophyll contents of grains between L268 and R1053. Each data point represents the mean of three measurements
3.4 Relationship between Grain Photosynthetic Rate and Chlorophyll Content
In 2023 and 2024, grain photosynthetic rate was significantly positively correlated with grain chlorophyll a, chlorophyll b, total chlorophyll contents (r = 0.78–0.82, p < 0.01) and significantly negatively correlated with the chlorophyll a:b ratio (r = −0.55, p < 0.05), indicating that higher chlorophyll content can influence grain photosynthetic rate (Fig. 5).
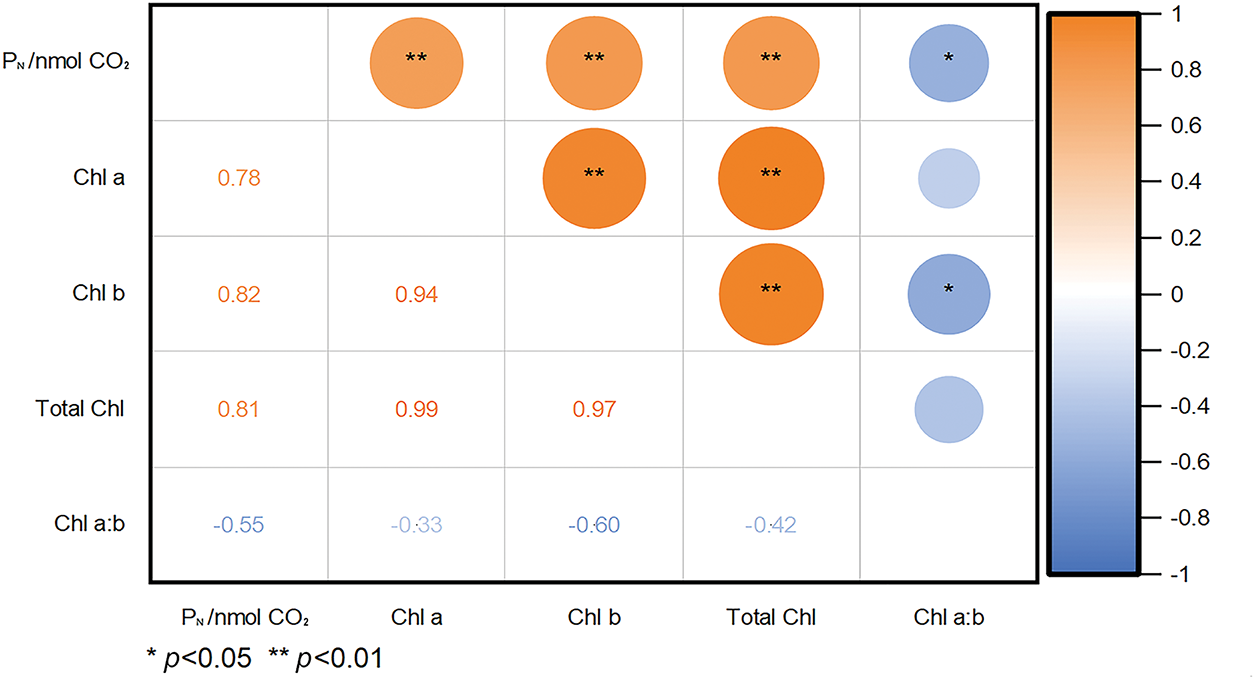
Figure 5: Correlation analysis of grain photosynthetic rate (PN) with chlorophyll a, chlorophyll b, total chlorophyll content, and chlorophyll a:b in grains of two rice varieties after flowering in 2023 and 2024
Rice grain weight depends on the grain-filling rate and filling duration. Significant differences exist in the grain-filling rate and degree of filling between varieties and among grains at different positions within the same variety. Large-grain varieties exhibit higher initial growth vigor, faster grain-filling rates, and earlier achievement of maximum-filling rates compared to medium-grain varieties [25]. In this study, GR0, GRmax, and GRmean of L268 in 2023 and 2024 were significantly higher than those of R1053, while the Tmax showed no significant differences between the tested varieties (Table 1). These findings demonstrated that the grain-filling rate predominantly governs grain weight in varieties. Higher filling rates facilitated the formation of larger grains and increased the grain weight.
Numerous studies have demonstrated that carbohydrates and plant hormones play critical roles in regulating grain filling. A strong positive correlation exists between the grain-filling rate and the photosynthesis of grains [1]. In this study, the grain-filling rate of L268 was higher than that of R1053 (Fig. 2), which may be attributed to genetic differences between the varieties. The increase in grain photosynthetic rate promoted the grain-filling process (Fig. 3). These findings supported our hypothesis that during the grain-filling process, significant differences existed in panicle photosynthesis patterns among rice varieties with different grain weights. High-efficiency rice varieties sustained higher and prolonged photosynthetic assimilation capacity, ensuring sufficient source supply for grains during filling. This aligns with a previous study that highlighted the substantial contribution of high-efficiency wheat spikes to grain yield [26]. A carbon-14 (14C) isotope tracing study by Zheng et al. [19] partially supports this hypothesis, showing that in hybrid rice, panicle-assimilated photosynthates contribute over 30% to grain yield, particularly during early grain-filling. The results presented here are consistent with the view that yield improvement is associated with increased photosynthetic capacity [27,28].
The chlorophyll content of specific plant tissues varies significantly among different varieties at various developmental stages. In this study, the chlorophyll content of grains in both varieties decreased as the grains matured. Between the two varieties, L268 consistently exhibited higher chlorophyll content than R1053, with significant differences observed in the early and middle developmental stages but no significant differences detected in the later stages (Fig. 4). This is consistent with previous findings: Setter et al. [29] reported that rice panicles exhibit a certain photosynthetic rate (5.3–8.3 μmol m−2 s−1), which varies among varieties, influencing yield accordingly. At present, few studies are reporting whether panicle chlorophyll content differs among rice varieties with different grain weights. However, extensive research has been conducted on the relationship between leaf chlorophyll content and grain weight. It is generally believed that higher chlorophyll content in the flag leaves of larger-grain varieties, with the chlorophyll content of flag leaves during the early filling stage exerting a greater influence on grain weight [30]. Chlorophyll content directly influences plant senescence and photosynthetic efficiency. Delayed senescence and improved photosynthetic efficiency facilitate the differentiation and filling of endosperm cells, thereby increasing grain weight [31,32]. Moreover, a strong positive correlation exists between the grain-filling rate, chlorophyll content, and photosynthetic rate of rice grains, indicating high photosynthetic capacity during the early grain-filling stage [33]. In this study, measurements of the relationship between chlorophyll a, chlorophyll b, total chlorophyll, and photosynthetic rate in grains of two rice varieties showed that with increasing chlorophyll content in rice grains, chloroplast absorption and conversion of light energy were enhanced, thereby increasing photosynthetic intensity (Fig. 5). There was a close relationship between chlorophyll content and photosynthetic rate in plants. Increased chlorophyll content can enhance photosynthesis and improve photosynthetic rate [34], thereby promoting grain filling and increasing grain weight. However, chlorophyll is controlled by multiple genes, and its regulation is complex [35]. In summary, the grain photosynthetic rate of grains with different weights increases with higher chlorophyll content. Larger-grain varieties enable plants to achieve greater photosynthesis.
The findings of this study demonstrated that rice varieties with higher grain weight possessed stronger panicle photosynthetic capacity, which was associated with the chlorophyll content of grains. Higher grain photosynthetic rate facilitated grain-filling and increased grain weight. Grain chlorophyll content could serve as a molecular marker to provide a foundation for marker-assisted breeding of rice varieties with high photosynthetic capacity during early grain filling.
Acknowledgement: Not applicable.
Funding Statement: This work was supported by the Hunan Provincial Natural Science Foundation of China (Grant No. 2023JJ40309) and the Changsha Outstanding Innovative Youth Training Program (kq2306015).
Author Contributions: Conducted the experiments, Jinge Li, Fangbo Cao and Chuyao Wang; contributed to data collection, Jinge Li, Fangbo Cao and Chuyao Wang; analyzed the data, Jinge Li; contributed to manuscript preparation, Jinge Li; participated in manuscript writing, Jinge Li; conceptualized and designed the study, Min Huang and Jiana Chen. All authors reviewed the results and approved the final version of the manuscript.
Availability of Data and Materials: All data generated or analyzed during this study are included in this published article.
Ethics Approval: Not applicable.
Conflicts of Interest: The authors declare no conflicts of interest to report regarding the present study.
References
1. You C, Zhu H, Xu B, Huang W, Wang S, Ding Y, et al. Effect of removing superior spikelets on grain filling of inferior spikelets in rice. Front Plant Sci. 2016;7(3):1161–228. doi:10.1007/s10725-011-9644-4. [Google Scholar] [CrossRef]
2. Inoue T, Inanaga S, Sugimoto Y, An P, Eneji A. Effect of drought on ear and flag leaf photosynthesis of two wheat cultivars differing in drought resistance. Photosynthetica. 2004;42(4):559–65. doi:10.1007/s11099-005-0013-2. [Google Scholar] [CrossRef]
3. Tambussi EA, Bort J, Guiamet JJ, Nogués S, Araus JL. The photosynthetic role of ears in C3 cereals: metabolism, water use efficiency and contribution to grain yield. Crit Rev Plant Sci. 2007;26(1):1–16. doi:10.1080/07352680601147901. [Google Scholar] [CrossRef]
4. Aschan G, Pfanz H. Non-foliar photosynthesis—a strategy of additional carbon acquisition. Flora. 2003;198(2):81–97. doi:10.1078/0367-2530-00080. [Google Scholar] [CrossRef]
5. Simkin AJ, Faralli M, Ramamoorthy S, Lawson T. Photosynthesis in non-foliar tissues: implications for yield. Plant J. 2020;101(4):1001–15. doi:10.1111/tpj.14633. [Google Scholar] [PubMed] [CrossRef]
6. Maydup ML, Antonietta M, Guiamet JJ, Tambussi EA. The contribution of green parts of the ear to grain filling in old and modern cultivars of bread wheat (Triticum aestivum Levidence for genetic gains over the past century. Field Crops Res. 2012;134:208–15. doi:10.1016/j.fcr.2012.06.008. [Google Scholar] [CrossRef]
7. Maydup ML, Antonietta M, Graciano C, Guiamet JJ, Tambussi EA. The contribution of the awns of bread wheat (Triticum aestivum L.) to grain filling: responses to water deficit and the effects of awns on ear temperature and hydraulic conductance. Field Crops Res. 2014;167:102–11. doi:10.1016/j.fcr.2014.07.012. [Google Scholar] [CrossRef]
8. Vicente R, Vergara-Díaz O, Medina S, Chairi F, Kefauver SC, Bort J, et al. Durum wheat ears perform better than the flag leaves under water stress: gene expression and physiological evidence. Environ Exp Bot. 2018;153:271–85. doi:10.1016/j.envexpbot.2018.06.004. [Google Scholar] [CrossRef]
9. Sanchez-Bragado R, Vicente R, Molero G, Serret MD, Maydup ML, Araus JL. New avenues for increasing yield and stability in C3 cereals: exploring ear photosynthesis. Curr Opin Plant Biol. 2020;56:223–34. doi:10.1016/j.pbi.2020.01.001. [Google Scholar] [PubMed] [CrossRef]
10. Li Q, Zhong S, Sun S, Fatima SA, Zhang M, Chen W, et al. Differential effect of whole-ear shading after heading on the physiology, biochemistry and yield index of stay-green and non-stay-green wheat genotypes. PLoS One. 2014;12(2):e0171589. doi:10.1371/journal.pone.0171589. [Google Scholar] [PubMed] [CrossRef]
11. Jia S, Lv J, Jiang S, Liang T, Liu C, Jing Z. Response of wheat ear photosynthesis and photosynthate carbon distribution to water deficit. Photosynthetica. 2015;53(1):95–109. doi:10.1007/s11099-015-0087-4. [Google Scholar] [CrossRef]
12. Hoseini SM, Poustini K, Siddique KHM, Palta JA. Photosynthesis of barley awns does not play a significant role in grain yield under terminal drought. Crop Pasture Sci. 2012;63(5):489–99. doi:10.1071/cp11256. [Google Scholar] [CrossRef]
13. Tian H, Zhou Q, Liu W, Zhang J, Chen Y, Jia Z, et al. Responses of photosynthetic characteristics of oat flag leaf and spike to drought stress. Front Plant Sci. 2022;28(13):917528. doi:10.3389/fpls.2022.917528. [Google Scholar] [PubMed] [CrossRef]
14. Maydup ML, Antonietta M, Guiamet JJ, Graciano C, López JR, Tambussi EA. The contribution of ear photosynthesis to grain filling in bread wheat (Triticum aestivum L.). Field Crops Res. 2010;119(1):48–58. doi:10.1016/j.fcr.2010.06.014. [Google Scholar] [CrossRef]
15. Sanchez-Bragado R, Molero G, Reynolds M, Araus JL. Photosynthetic contribution of the ear to grain filling in wheat: a comparison of different methodologies for evaluation. J Exp Bot. 2016;67(9):2787–98. [Google Scholar] [PubMed]
16. Wang XY, Yu ZW. Differences in photosynthetic characteristics of wheat varieties with large spike type and medium spike type and their relationship with grain weight and yield. J Northwest Bot. 2005;25:1976–82. (In Chinese). [Google Scholar]
17. Yang Q, Li P, Zhang D, Lin W, Hao X, Zong Y. Effects of elevated CO2 on the photosynthesis, chlorophyll fluorescence and yield of two wheat cultivars (Triticum aestivum L.) under persistent drought stress. Sustainability. 2023;15(2):1593. doi:10.3390/su15021593. [Google Scholar] [CrossRef]
18. Chang SQ, Lin S, Xiang OY. The relationship between the enhancement of rice grain yield and photosynthesis. Chin Bulletin Life Sci. 2024;36:1305–10. (In Chinese). [Google Scholar]
19. Zheng H, Wang X, Li Y, Huang G. Contributions of photosynthetic organs to the seed yield of hybrid rice: the effects of gibberellin application examined by carbon isotope technology. Seed Sci Technol. 2018;46(3):14. doi:10.15258/sst.2018.46.3.10. [Google Scholar] [CrossRef]
20. Bi YG. Differences in canopy temperature depression among different early-season indica rice varieties and its relationship with yield and physiological characteristics [dissertation]. Nanchang, China: Jiangxi Agricultural University; 2015. (In Chinese). [Google Scholar]
21. Zou D, Tang QY, Huang YG, Liu LS, Kuang N, Fang SL, et al. Selection of ratooning rice varieties in Hunan Province. Hunan Agric Sci. 2023;8:6–11. (In Chinese). [Google Scholar]
22. Hartmut KL, Alan RW. Determinations of total carotenoids and chlorophylls a and b in leaf extracts in different solvents. Biochem Soc Trans. 1983;11(5):591–2. doi:10.1042/bst0110591. [Google Scholar] [CrossRef]
23. Wei FT, Tao HB, Lin S, Bas B. Rate and duration of grain filling of aerobic rice HD297 and their influence on grain yield under different growing conditions. Sci Asia. 2011;37:98–104. [Google Scholar]
24. Huang M, Zou Y. Comparison of grain-filling characteristics between two super rice cultivars with remarkable difference in grain weight. World Appl Sci J. 2009;6:674–9. [Google Scholar]
25. Liu XH, Qiu XK, Xu MZ, Li GS, Li YH, Liu GY, et al. Grain filling characteristics in rice cultivars differing in grain weight. Jiangsu Agric Sci. 2011;39:75–8. (In Chinese). [Google Scholar]
26. Jin LQ. Photosynthetic characteristics of ear and contribution of ear photosynthesis to grain filling in winter wheat [dissertation]. Taishan, China: Shandong Agricultural University; 2017. (In Chinese). [Google Scholar]
27. Roche D. Stomatal conductance is essential for higher yield potential of C3 crops. Crit Rev Plant Sci. 2015;34(4):429–53. doi:10.1080/07352689.2015.1023677. [Google Scholar] [CrossRef]
28. Carmo-Silva E, Andralojc PJ, Scales JC, Driever SM, Mead A, Lawson T, et al. Phenotyping of field-grown wheat in the UK highlights contribution of light response of photosynthesis and flag leaf longevity to grain yield. J Exp Bot. 2017;68(13):3473–86. doi:10.1093/jxb/erx169. [Google Scholar] [PubMed] [CrossRef]
29. Setter TL, Conocono EA, Egdane JA, Kropff M. Possibility of increasing yield potential of rice by reducing panicle height in the canopy. I. Effects of panicles on light interception and canopy photosynthesis. Funct Plant Biol. 1995;22(3):441–51. doi:10.1071/pp9950441c. [Google Scholar] [CrossRef]
30. Chang C, Lu J, Zhang HP, Ma CX, Sun G. Copy number variation of cytokinin oxidase gene tackx4 associated with grain weight and chlorophyll content of flag leaf in common wheat. PLoS One. 2015;10(12):e0145970. doi:10.1371/journal.pone.0145970. [Google Scholar] [PubMed] [CrossRef]
31. Thornburg TE, Liu J, Li Q, Xue HY. Potassium deficiency significantly affected plant growth and development as well as microRNA-mediated mechanism in wheat (Triticum aestivum L.). Front Plant Sci. 2020;11:1219. doi:10.3389/fpls.2020.01219. [Google Scholar] [PubMed] [CrossRef]
32. Sun J, Yang L, Yang X, Wei J, Li L, Guo E, et al. Using spectral reflectance to estimate the leaf chlorophyll content of maize inoculated with arbuscular mycorrhizal fungi under water stress. Front Plant Sci. 2021;12:646173. doi:10.3389/fpls.2021.646173. [Google Scholar] [PubMed] [CrossRef]
33. Chen J, Cao F, Li H, Shan SL, Tao Z, Lei T, et al. Genotypic variation in the grain photosynthetic contribution to grain filling in rice. J Plant Physiol. 2020;253(1):153269. doi:10.1016/j.jplph.2020.153269. [Google Scholar] [PubMed] [CrossRef]
34. Liu P, Xiang C, Liu K, Yu H, Liao Z, Shen Y, et al. Genome-wide association study reveals genetic basis and candidate genes for chlorophyll content of leaves in maize (Zea mays L.). PeerJ. 2024;7(12):e18278. doi:10.7717/peerj.18278. [Google Scholar] [PubMed] [CrossRef]
35. Jin Y, Li D, Liu M, Cui Z. Genome-wide association study identified novel SNPs associated with chlorophyll content in maize. Genes. 2023;14(5):1010. doi:10.3390/genes14051010. [Google Scholar] [PubMed] [CrossRef]
Cite This Article
 Copyright © 2025 The Author(s). Published by Tech Science Press.
This work is licensed under a Creative Commons Attribution 4.0 International License , which permits unrestricted use, distribution, and reproduction in any medium, provided the original work is properly cited.
 Downloads
 Citation Tools