
 Submit a Paper
 Propose a Special lssue
 Open Access
ARTICLE

Tolerance of Sweet Sorghum (Sorghum bicolor) to Water Deficit and Irrigation Water Salinity: Water Relations and Production
1 Department of Agronomic and Forestry Sciences, Federal Rural University of the Semi-arid Region—UFERSA, Mossoró, 59625-900, RN, Brazil
2 Maranhão State Institute of Education, Science and Technology, IP Amarante, Amarante do Maranhão, 65923-000, MA, Brazil
3 Agricultural Sciences Center, State University of Paraiba, Catolé do Rocha, 58884-000, PB, Brazil
* Corresponding Authors: Rodrigo Rafael da Silva. Email: ; José Francismar de Medeiros. Email:
(This article belongs to the Special Issue: Abiotic Stress in Agricultural Crops)
Phyton-International Journal of Experimental Botany 2025, 94(9), 2797-2814. https://doi.org/10.32604/phyton.2025.068089
Received 20 May 2025; Accepted 01 September 2025; Issue published 30 September 2025
 View Full Text
 Download PDF
Abstract
Due to its tolerance to water deficit and salinity, sorghum is considered a suitable crop for cultivation in regions affected by these stress conditions, enabling the efficient use of limited water resources. This study evaluated the resilience of the sweet sorghum cultivar BRS 506 under water deficit and salinity stress, focusing on water relations and yield performance in semiarid conditions. A randomized complete block design was employed in a 3 × 3 factorial arrangement with four replicates. Treatments consisted of three levels of irrigation water salinity (1.50, 3.75, and 6.00 dS m−1) and three irrigation levels (50%, 75%, and 100% of the estimated maximum crop evapotranspiration, ETc), corresponding to water deficits of 50%, 25%, and 0% of ETc. Salinity stress resulted in similar electrolyte leakage in both years. In 2022, relative water content decreased with increasing salinity, whereas saturation deficit and water absorption capacity increased. The highest electrolyte leakage occurred under a 25% water deficit. In contrast, water-related physiological parameters in 2021 remained stable despite water deficits. Juice yield declined by 13.38% under the highest salinity level (6.00 dS m−1) compared with the lowest (1.50 dS m−1). Under water deficit conditions, total yield, dry matter, stalk biomass, and juice yield were comparable between 0% and 25% water deficit, with significant reductions only at 50%. Overall, BRS 506 demonstrated resilience to salinity, maintaining cellular integrity. Despite adverse effects on plant water status at high salinity, total yield was unaffected. A 25% irrigation reduction resulted in only a 6.64% yield loss, indicating improved water use efficiency and highlighting the potential for sustainable cultivation of sweet sorghum in water-limited environments.Keywords
Sorghum (Sorghum bicolor) is a staple food crop in many countries, particularly in Africa and Asia, and plays a significant role in the biofuel industry and as animal feed [1,2]. In Brazil’s semiarid region, sorghum is primarily cultivated for forage production during both the rainy and dry seasons, often with supplemental irrigation. Its high water use efficiency contributes to elevated productivity per unit of water applied, which is a key factor underpinning its agricultural importance in this region [3]. The crop’s resilience and adaptability to diverse soil and climatic conditions further enhance its relevance in challenging environments.
Sweet sorghum has been studied in the Brazilian semi-arid region, under irrigation, as an alternative to sugarcane for ethanol production [4–8], and it can also be used as animal fodder, mainly in the form of silage [9]. Due to the high content of soluble sugars accumulated in its stalk, its tolerance to water and salt stress may differ from other types of sorghum.
Globally, abiotic stresses, particularly salinity and water deficit, are major limiting factors for crop productivity [10,11]. In regions where water availability is limited and irrigation water is often of low quality (i.e., brackish or saline), plants that can tolerate such conditions are especially valuable [12,13]. Sorghum is classified as moderately tolerant to salinity, with critical thresholds of 4.5 dS m−1 for irrigation water and 6.8 dS m−1 for soil salinity [14]. Salinity levels exceeding these thresholds are associated with yield reductions of approximately 16% per unit increase in soil salinity [15]. These characteristics underscore the strategic importance of sorghum cultivation in areas affected by water scarcity and salinization.
Salinity and water deficit induce osmotic stress in plant cells, triggering adaptive mechanisms that contribute to stress tolerance [16]. Key physiological responses include cellular compartmentalization, the synthesis and accumulation of organic solutes and osmolytes, ionic transport regulation, and osmotic adjustment, all of which play crucial roles in plant adaptation and survival under adverse environmental conditions [11,17]. When salinity and water deficit occur simultaneously, their combined effects can intensify the physiological stress experienced by plants. This is primarily due to the reduction in soil water potential, which impairs water uptake. The decrease in water potential results from both the osmotic effect of high salt concentrations and the matric effect associated with limited water availability. Consequently, the interaction between these abiotic stresses further hinders water absorption [18,19], exacerbating the plant’s physiological constraints and diminishing its ability to maintain homeostasis [20].
Plant water status is a critical indicator of tolerance to abiotic stresses [21]. Physiological parameters such as electrolyte leakage (EL), relative water content (RWC), water saturation deficit (WSD), water retention capacity (WRC), and water uptake capacity (WUC) are essential for maintaining cell turgor, membrane integrity, protein stability, and overall metabolic functionality under water-limited conditions [22]. Effective regulation of water absorption, retention, and utilization enhances plant resilience to drought, salinity, and other environmental stressors [23].
Under water deficit conditions, plant growth is commonly suppressed, leading to reduced productivity. In response, sorghum activates adaptive quiescence mechanisms that confer high drought tolerance [24]. This strategy allows the crop to enter a temporary dormant state during periods of water scarcity and to resume growth once environmental conditions improve [25]. Such physiological plasticity is a key adaptive trait, enabling sorghum to maintain survival and productivity under transient stress [26], often ensuring yields in conditions where other crops would fail.
Based on its known physiological adaptability, we hypothesize that the BRS 506 cultivar can maintain physiological integrity and stable productivity under moderate stress conditions, exhibiting high water-use efficiency and salinity tolerance. This hypothesis prompts two central research questions: (1) How do water deficit and salinity affect water relations and yield components in BRS 506? and (2) Under which conditions is the cultivar most susceptible to these stresses? Accordingly, this study aimed to assess the resilience of BRS 506 under varying levels of water and salinity stress in semiarid conditions, with a focus on their effects on plant water status and yield-related parameters.
The experiment was conducted at the Cumaru experimental site, located in the municipality of Upanema, Rio Grande do Norte, Brazil (5°33′30″ S, 37°11′56″ W; altitude: 110 m). Cultivation was carried out during two crop seasons, September to December of 2021 and 2022, which correspond to the driest period of the year in the region. The soil in the experimental area is classified as a Haplic Cambisol, with an effective depth of approximately 0.6 m. Soil physical and chemical properties for the evaluated layers are presented in Table 1.
According to the Köppen climate classification, the region presents a BSh climate, hot and semi-arid [27], characterized by an average annual precipitation of 633 mm over the past 30 years, predominantly concentrated between February and May, and an average annual temperature of 26°C [28]. During the experimental period, climatic data were continuously monitored using a weather station installed adjacent to the experimental area (Fig. 1).
Figure 1: Average air temperature (A), relative humidity (B), global radiation (C), and reference evapotranspiration (ETo) (D) were recorded during the two planting cycles (2021 and 2022) at the experimental site
The sorghum cultivar used in this study was BRS 506, developed by Embrapa Milho e Sorgo to serve as an alternative feedstock complementing sugarcane for ethanol production. This cultivar has an annual growth cycle of 120 to 130 days, reaches an average height of 280 cm, and produces an average stalk yield ranging from 40 to 60 Mg ha1, with dry matter yields between 15 and 20 Mg ha−1 [29].
Before experiment installation, the area was prepared through plowing and harrowing, followed by the opening of planting furrows and foundation fertilization with 150 kg ha−1 of monoammonium phosphate (MAP; 11-52-0), supplying nitrogen, phosphorus, and potassium according to soil analysis and crop nutritional requirements [30]. Sowing was performed manually, placing 20 seeds per linear meter. Thinning occurred 15 days after planting to maintain a density of 10 plants per linear meter, arranged in a double-row spacing of 1.35 m × 0.25 m × 0.10 m. Two manual weedings were conducted during the crop cycle for weed control. During the growing period, fertigation was applied to supply additional nutrients. Nitrogen was provided as urea at a rate of 70 kg ha−1, and potassium as KCl at 30 kg ha−1 of K2O. Fertilizers were applied in three equal splits at 21, 28, and 35 days after planting.
The experiment was conducted using a randomized complete block design in a 3 × 3 factorial arrangement with four replicates. The factors consisted of three irrigation water salinity levels (1.50, 3.75, and 6.00 dS m−1) and three irrigation levels (50%, 75%, and 100% of estimated maximum crop evapotranspiration ETc), corresponding to irrigation deficits of 50%, 25%, and 0% of ETc, respectively. With an irrigation efficiency of 95%. This resulted in nine treatment combinations and a total of 36 experimental plots. Each experimental unit comprised two double rows measuring 7.0 m in length. The useful plot area was defined by the two inner rows, excluding 1.5 m at each end to minimize edge effects.
The irrigation water with the lowest salinity level (1.5 dS m−1) was sourced from a tubular well. The highest salinity level (6.0 dS m−1) was selected based on the salinity threshold associated with a 60% reduction in sorghum yield potential [31]. To achieve the intermediate and highest salinity treatments, stock solutions were prepared at concentrations of 200 g L−1 for NaCl (3.42 mol L−1), CaCl.2H2O (1.36 mol L−1), and MgSO4.7H2O (0.81 mol L−1). These solutions were combined in proportions to achieve a final ionic ratio of Na:Ca:Mg of 6.3:2.7:1, reflecting the average ionic composition of water from the Jandaíra Limestone Aquifer, a principal water source in the region [32]. Salinity levels in the irrigation water were monitored daily using a portable conductivity meter.
A drip irrigation system was employed, operating at a flow rate of 1.65 L h−1 per emitter under a working pressure of 100 kPa, with a distribution uniformity coefficient of 95%. Emitters were spaced at 0.20 and 0.30 m intervals along drip lines installed at 1.6 m row spacing, allowing for the application of irrigation depths proportional to the required treatments. Irrigation scheduling was based on percentages of crop evapotranspiration (ETc), estimated from daily reference evapotranspiration (ETo) using the Penman–Monteith method [33]. Daily crop coefficients (Kc) were determined using the dual Kc approach. ETo values were calculated using meteorological data collected from a weather station located adjacent to the experimental area (Fig. 1D). The total irrigation depths applied over the crop cycle were 279, 393, and 498 mm in 2021, and 299, 409, and 520 mm in 2022, corresponding to 50%, 75%, and 100% of ETc, respectively. During the initial establishment phase, a uniform depth of 44.2 mm was applied across all treatments in the first 9 days of the 2021 cycle, and 77.2 mm during the first 12 days in the 2022 cycle. Weekly averages of irrigation depths for the full irrigation treatment, along with the total pre-irrigation amounts applied in both years, are presented in Fig. 2.
Figure 2: Daily irrigation depths applied to the sorghum cultivar BRS 506 for the two planting cycles, 2021 and 2022, in the municipality of Upanema, RN
Physiological variables related to plant water status were evaluated during the fruiting stage, at 61 days after planting (DAP). For electrolyte leakage (EL), diagnostic leaves were collected from five plants per plot. From these, ten leaf discs (total area: 0.79 cm2) were excised and immersed in deionized water. After a 1-h rest period at 25°C, the initial electrical conductivity (ECi) of the solution was measured. The samples were then placed in a water bath at 85°C for 4 h, cooled to 25°C, and the final electrical conductivity (ECf) was recorded. Electrolyte leakage was calculated as the ratio of the two conductivity values, according to Eq. (1) [34]:
Relative water content (RWC) and other water-related physiological variables were measured using the same diagnostic leaves previously sampled for electrolyte leakage. From each plot, fifteen leaf discs (total area: 0.79 cm2 per disc) were excised and immediately weighed on a precision balance to obtain the fresh weight (FW). The discs were then immersed in deionized water for 24 h. After this period, surface moisture was gently removed using absorbent paper, and the discs were weighed again to determine the turgid weight (TW). Subsequently, the samples were dried in paper bags in a forced-air oven at 65°C until a constant weight was reached, providing the dry weight (DW). The fresh, turgid, and dry weights were used to calculate the following parameters: relative water content (RWC) [35], water saturation deficit (WSD) [36], water retention capacity (WRC) [37], and water uptake capacity (WUC) [38]. The respective formulas are provided below:
Harvest was conducted 92 days after planting, corresponding to the optimal stage for silage production and sucrose extraction, in both experimental cycles. Plants were collected from a 3-m-long section of the useful plot area for evaluation of yield, stalk percentage, and juice extraction. Only plants with stalk diameters greater than 1.0 cm were considered; those with smaller diameters were discarded. The harvested biomass (leaves, stalks, and inflorescences) was weighed in the field using a portable digital hook scale (50 kg capacity, 10 g resolution). To determine dry matter content, six representative plants per plot were sampled. Fresh subsamples were placed in a forced-air oven at 65°C until constant weight was achieved. The total dry matter yield (Mg ha−1) was calculated by multiplying the fresh biomass yield by the dry matter content.
To estimate stalk yield, four plants per plot were harvested, and their leaves and inflorescences were removed. The stems were weighed separately to determine the proportion of the stalk of the total aerial biomass. Stalk yield was then calculated accordingly. Juice extraction was performed using mechanical mills. The extracted juice was weighed, and its proportion relative to the total stalk mass was expressed as a percentage. Following juice extraction, a sample of the residual bagasse, the fibrous material remaining after juice removal, was collected and dried in an oven at 105°C until constant weight to determine its dry matter content and estimate the moisture content. Based on the moisture of the bagasse, the potential residual juice content was calculated, considering a juice recovery efficiency of 90.5%, as typically adopted in the industry [39].
The data were first tested for normality using the Shapiro Wilk test at a 5% significance level. Subsequently, data from the 2021 and 2022 experiments were subjected to analysis of variance (ANOVA). A joint analysis across the two years was conducted when the ratio between the largest and smallest mean square of the residuals was ≤7, using the easyanova package [40]. When ANOVA indicated significant effects, treatment means were compared using Tukey’s test at p ≤ 0.05, implemented with the ExpDes.pt package [41]. All statistical analyses were conducted using R software, version 4.4 [42].
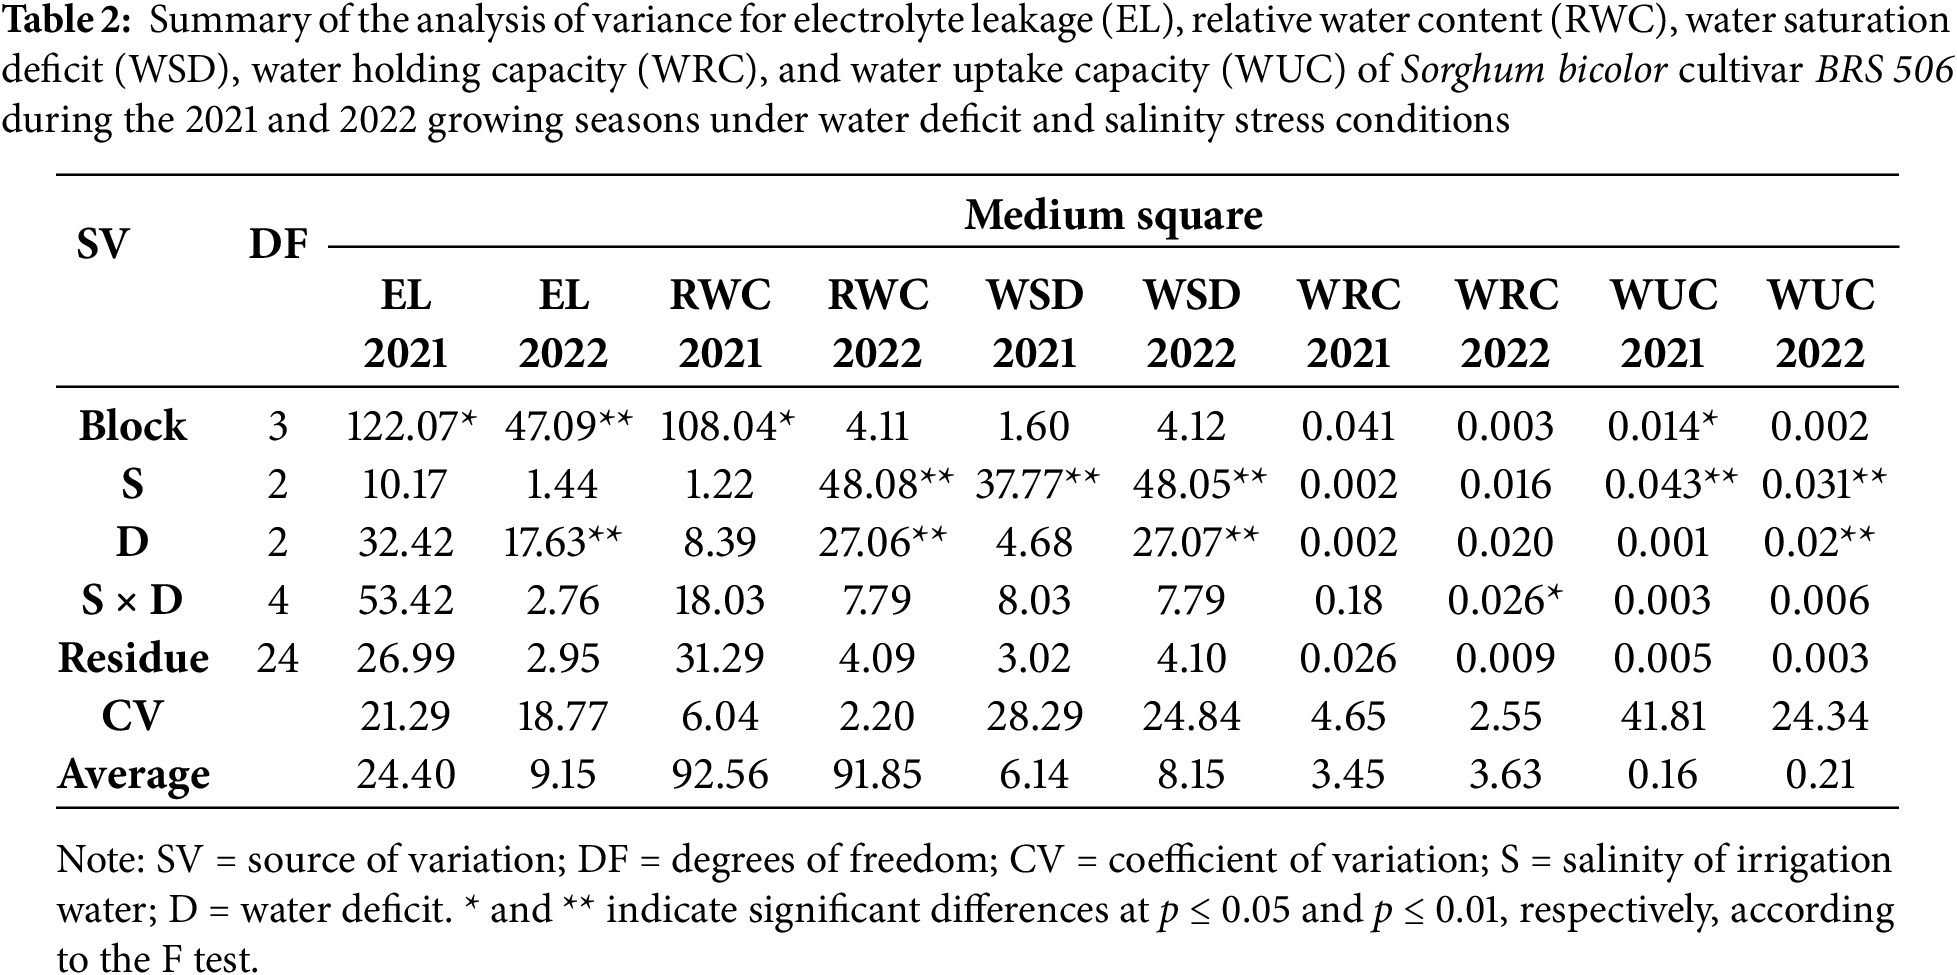
According to the analysis of variance (Table 2), electrolyte leakage, water holding capacity, and relative water content in both 2021 and 2022 were not significantly affected by irrigation water salinity. However, a significant effect of salinity was observed for relative water content in 2022, as well as for water saturation deficit and water absorption capacity in both years (p ≤ 0.01). Regarding the irrigation water deficit, a significant effect was detected in 2022 for electrolyte leakage, relative water content, water saturation deficit, and water absorption capacity (p ≤ 0.01), while no significant effects were observed in 2021. For the interaction between salinity and water deficit, a significant effect was found only for water holding capacity in 2022 (p ≤ 0.01).
3.1 Effects of Saline Stress on Plant Water Relations
The water relations parameters, electrolyte leakage, relative water content, water saturation deficit, and water absorption capacity were evaluated under varying irrigation water salinity conditions. Electrolyte leakage (Fig. 3A) exhibited similar patterns across both evaluation periods, with no significant differences between salinity levels. In contrast, relative water content (RWC) in leaves showed no significant variation in 2021; however, in 2022, RWC was significantly affected by irrigation water electrical conductivity (ECa) levels (Fig. 3B). Specifically, RWC decreased under salinities of 3.8 and 6.0 dS m−1, with values around 90.07%, which were significantly lower than the RWC observed at 1.5 dS m−1, where it reached 94.15%.
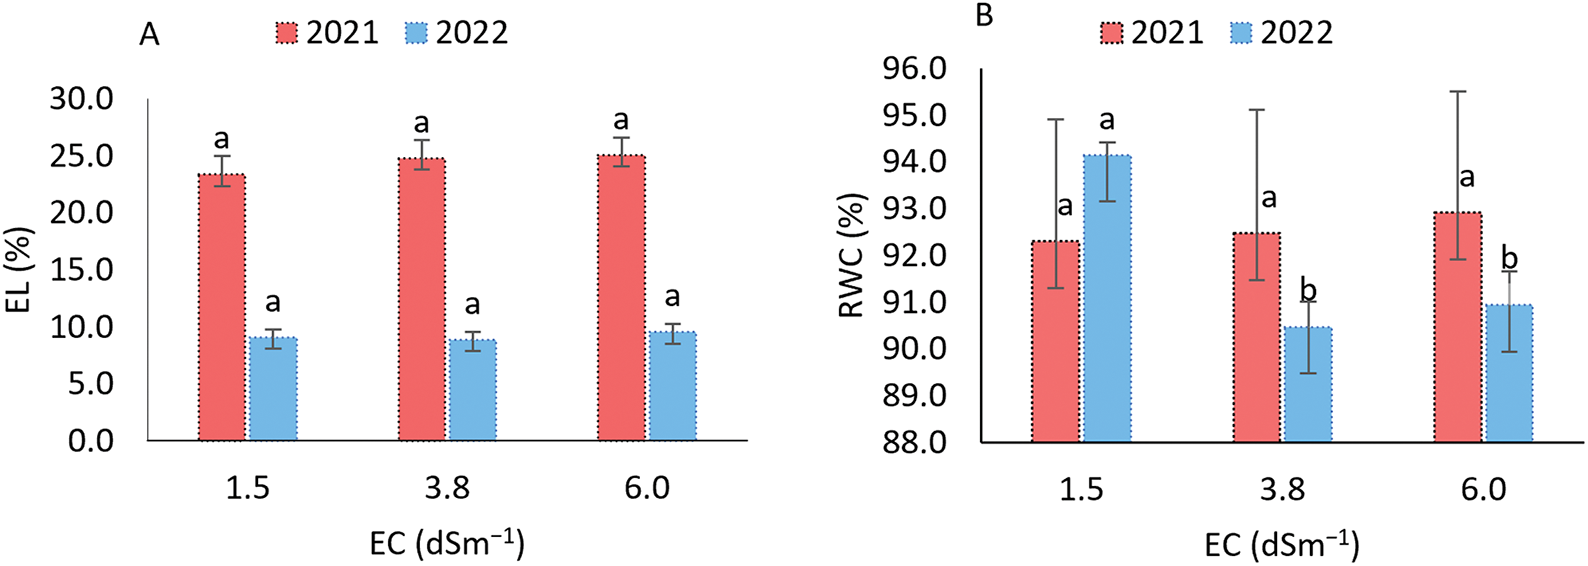
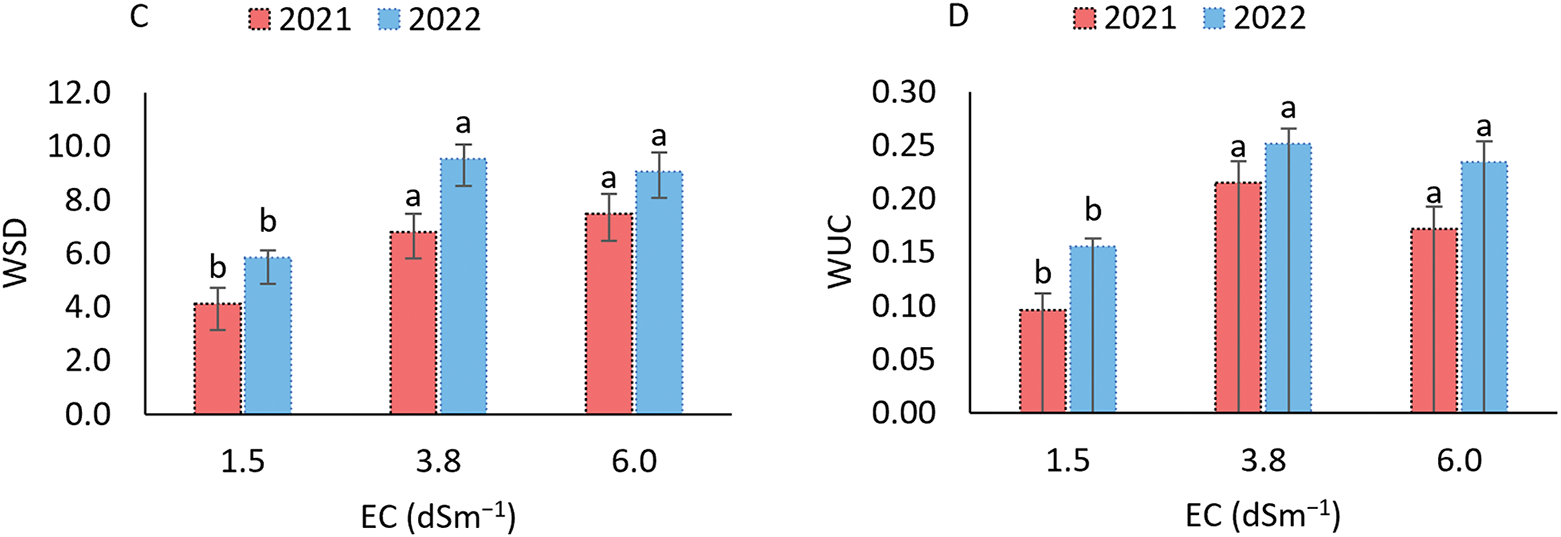
Figure 3: Electrolyte leakage (A), relative water content (B), water saturation deficit (C), and water absorption capacity (D) in the sorghum cultivar BRS 506 during the 2021 and 2022 growing seasons under salt stress conditions. Means followed by the same letter ‘a-b’, within each year, do not differ significantly according to Tukey’s test (p ≤ 0.05). Vertical bars represent the standard error of the mean (n = 12)
For water saturation deficit (WSD), which is inversely related to relative water content (RWC), the parameter reflects the degree of water stress experienced by plants. In both growing seasons, WSD followed a similar pattern, with significant differences observed under higher salinity conditions (Fig. 3C). At the lowest salinity level (1.5 dS m−1), WSD values were 4.128 and 5.851 in 2021 and 2022, respectively, significantly lower compared to the higher salinity treatments, indicating reduced water stress in the plants. The highest WSD values were recorded at 3.8 dS m−1 in 2022 and 6.0 dS m−1 in 2021, corresponding to increases of 9.53% and 9.06%, respectively, compared to the lowest salinity treatment. For water uptake capacity (WUC), a similar trend was observed in both years (Fig. 3D), with the highest values recorded under saline stress at 3.8 dS m−1. This treatment resulted in increases of 0.22% in 2021 and 0.25% in 2022, which do not differ from the values observed at the highest EC (6.0), but are higher than those recorded at the lowest salinity level.
3.2 Effects of Water Stress on Plant Water Relations
Regarding the isolated effects of water stress, electrolyte leakage (EL) in 2021 showed no significant differences among the water deficit levels (Fig. 4A), indicating a uniform response across treatments. In contrast, in 2022, significant differences were observed among the deficit levels, with higher leakage (10.52%) under the 25% water restriction, compared to 8.31% and 8.6% under the 0% and 50% restriction levels, respectively. For the plant water status, evaluated through relative water content (RWC), significant differences were also observed in 2022 (Fig. 4B). The 50% water restriction led to the lowest RWC (90.15%), indicating a more pronounced reduction in leaf hydration under severe water stress. In comparison, the 0% and 25% water deficit treatments presented higher RWC values of 92.99% and 92.42%, respectively.
Figure 4: Electrolyte leakage (A), relative water content (B), water saturation deficit (C), and water absorption capacity (D) in the sorghum cultivar BRS 506 during the 2021 and 2022 growing seasons under water deficit conditions. Means followed by the same letter ‘a-b’ within each year do not differ significantly according to Tukey’s test (p ≤ 0.05). Vertical bars represent the standard error of the mean (n = 12)
The WSD and WUC variables exhibited similar behavior in 2021 (Figs. 4C,D), with no significant effects from the applied water deficit levels, remaining stable across treatments. In contrast, in 2022, significant differences were observed. A 50% water deficit led to increased WSD and reduced WUC, indicating greater difficulty in water absorption by the plants under more severe water stress conditions.
3.3 Interactive Effect of Water Deficit and Saline Stress on Plant Water Relations
The interactive effect of water deficit and salinity on water retention capacity (Fig. 5) revealed that, under the combination of a 25% water deficit and irrigation water electrical conductivities (ECa) of 3.8 and 6.0 dS m−1, there was a significant reduction of 0.23 in WRC compared to the ECa of 1.5 dS m−1. This result indicates a greater impact of more severe saline conditions. Under the other treatment combinations, plants showed resilience, maintaining stable water retention capacity in the leaves.
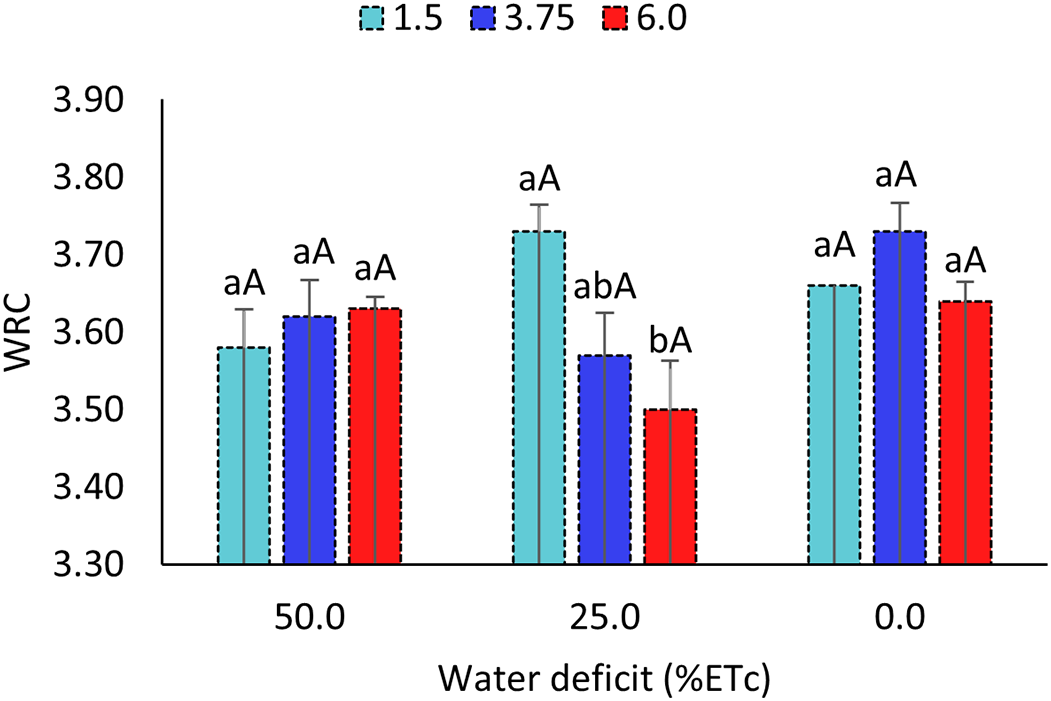
Figure 5: Water holding capacity (WRC) of sorghum cultivar BRS 506 in the 2022 growing season under combined water deficit and salinity stress conditions. Means followed by the same lowercase letter ‘a-b’ (comparison of salinity levels within each water deficit) and uppercase letter ‘A’ (comparison of water deficits within each salinity level) do not differ significantly according to Tukey’s test (p ≤ 0.05). Vertical bars represent the standard error of the mean (n = 4)
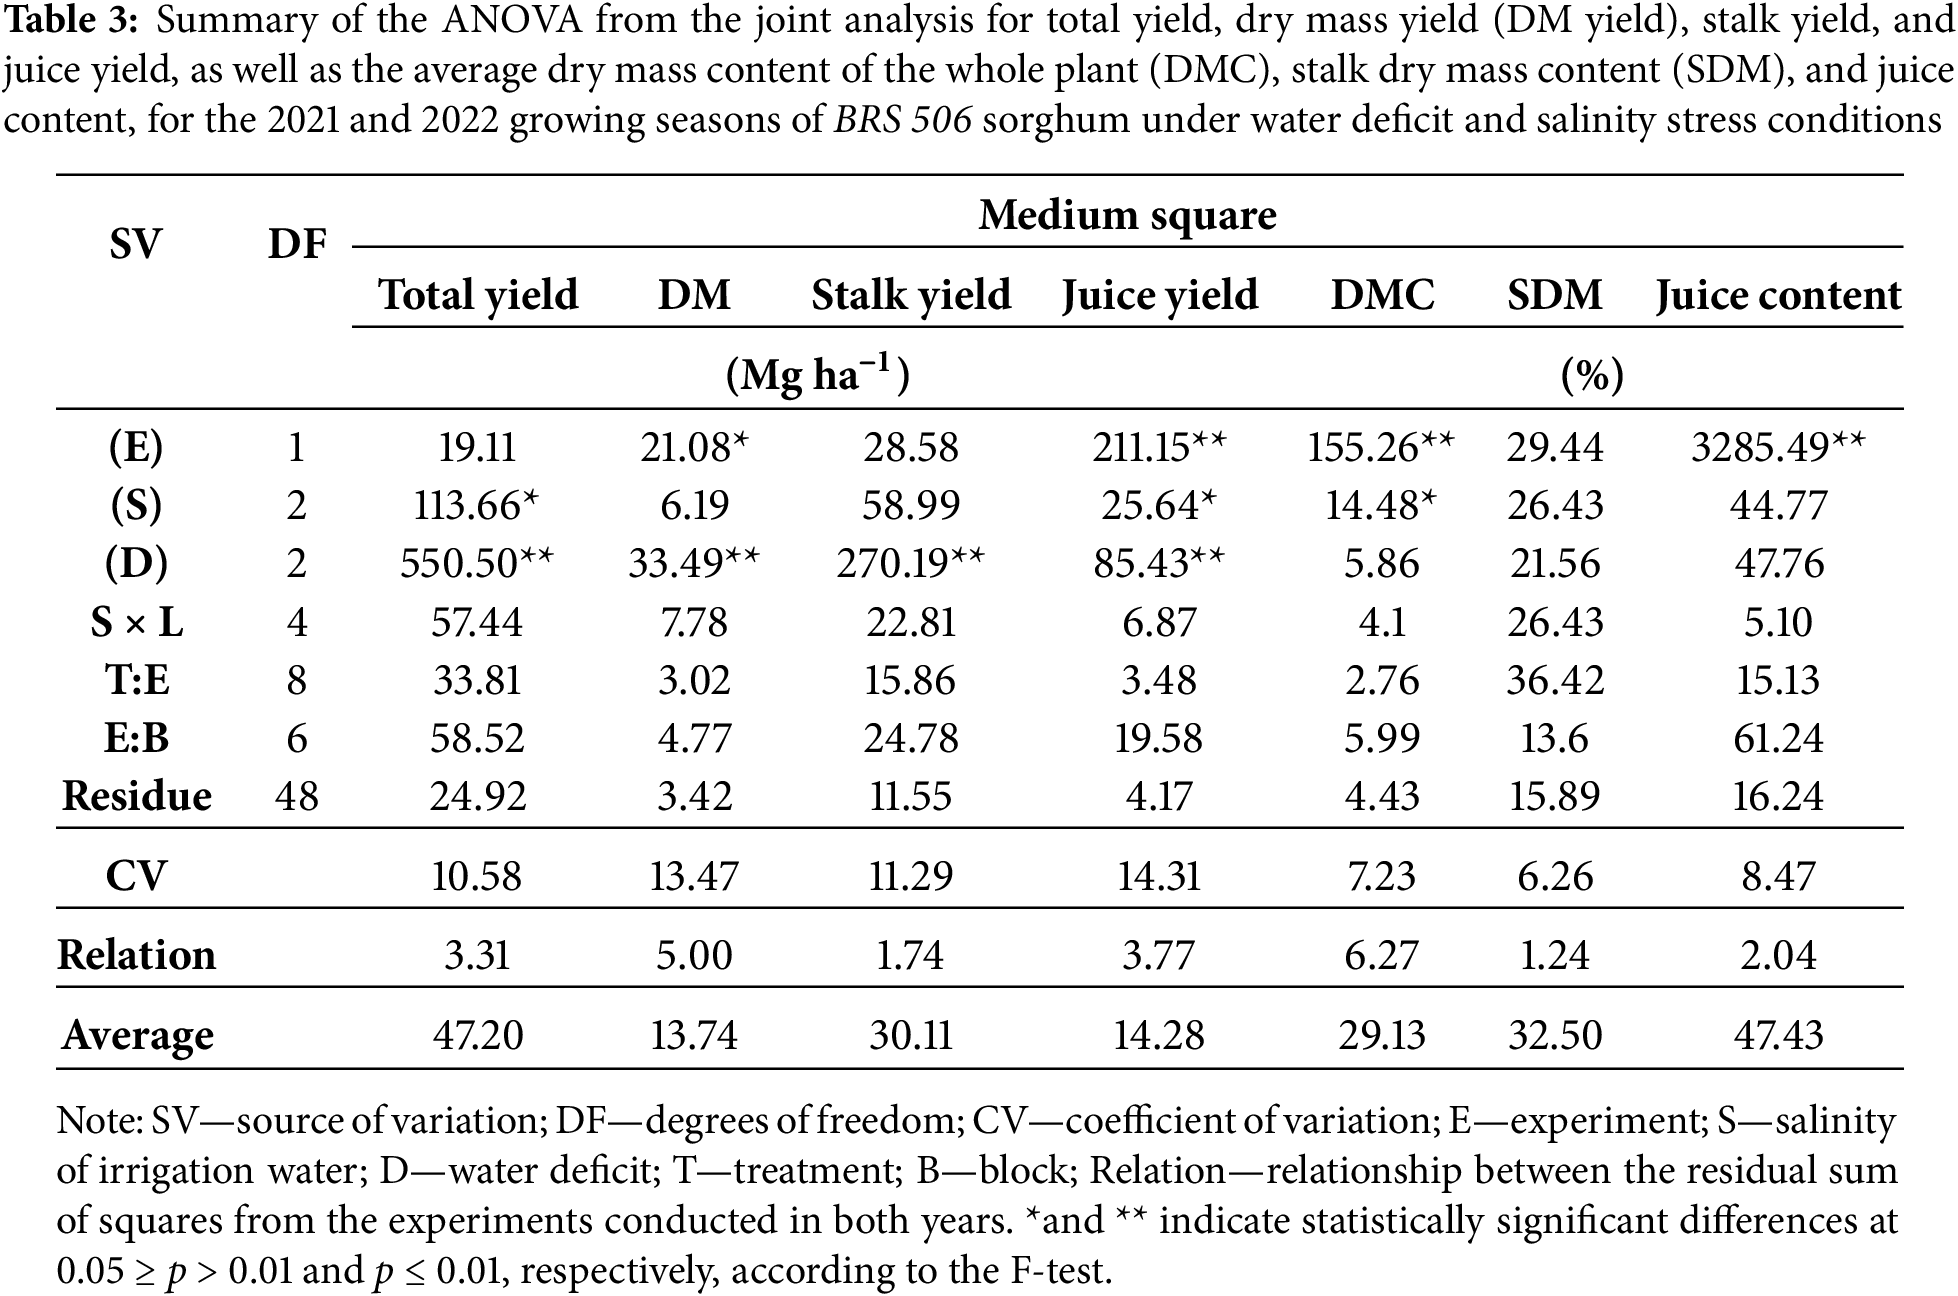
The joint analysis of production variables (Table 3) revealed no significant interaction between treatments (T) and experiments (E), nor between salinity (S) and water deficit (D). For total yield, percentage of stalk mass in the plant, and stalk yield, no significant differences were detected between experimental periods. However, dry mass yield (p ≤ 0.05), as well as dry mass, juice content, and juice mass (p ≤ 0.01), differed significantly between the two growing cycles. Regarding salinity, significant effects (p ≤ 0.05) were observed for total yield, dry mass, and juice mass, while the remaining variables were unaffected. In contrast, water deficit significantly influenced total yield, dry mass, stalk mass, and juice mass (p ≤ 0.01), with no significant effects on the other variables. Although the analysis of variance indicated a significant effect of salinity on total yield (p ≤ 0.05), the mean comparison test did not reveal significant differences among the salinity levels.
3.5 Effect of Salinity on Yield
The dry mass content of sweet sorghum (Fig. 6A) differed significantly only between irrigation water electrical conductivities (ECw) of 3.75 and 1.50 dS m−1. An increase in irrigation water salinity led to a higher accumulation of plant dry mass, with values reaching 29.93% and 29.10% at the highest salinity levels. In contrast, at the lowest ECw (1.50 dS m−1), the dry mass content was 28.38%, representing a 5.47% reduction compared to the highest salinity treatments.
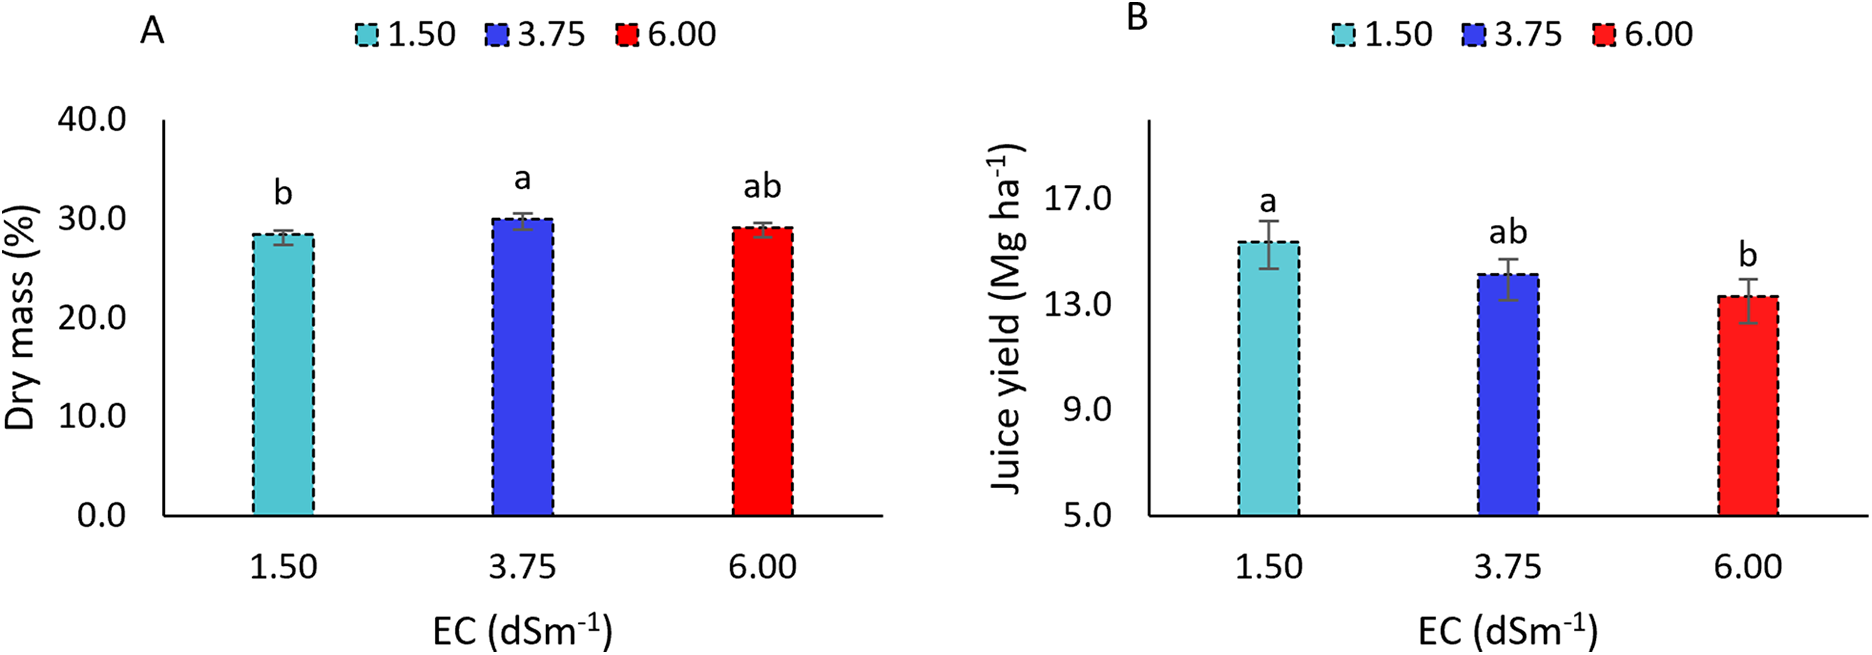
Figure 6: Dry mass content (A) and juice yield (B) of the sorghum cultivar BRS 506 during the 2021 and 2022 growing seasons under saline stress conditions. Means followed by the same letter ‘a-b’ do not differ significantly according to Tukey’s test (p ≤ 0.05). Vertical bars represent the standard error of the mean (n = 24)
Juice yield (Fig. 6B), corresponding to the amount extracted from sweet sorghum stalks, also showed a statistically significant difference under salinity stress. At the lowest ECw (1.50 dS m−1), juice yield was 15.37 Mg ha−1, whereas at the highest salinity (6.0 dS m−1), it decreased to 13.31 Mg ha−1. This reduction corresponds to a decrease of only 13.38% in juice volume, despite the elevated salinity.
3.6 Effect of Water Stress on Yield
Total yield (Fig. 7A) and dry matter production (Fig. 7B) of sweet sorghum decreased with increasing water deficit. When water deficit reached 50%, total yield declined from 51.79 to 42.03 Mg ha−1, and dry matter production dropped from 14.79 to 12.46 Mg ha−1, corresponding to reductions of 18.37% and 15.75%, respectively. Under moderate water deficit (25%), total yield decreased by 3.42 Mg ha−1, representing a 6.64% reduction.
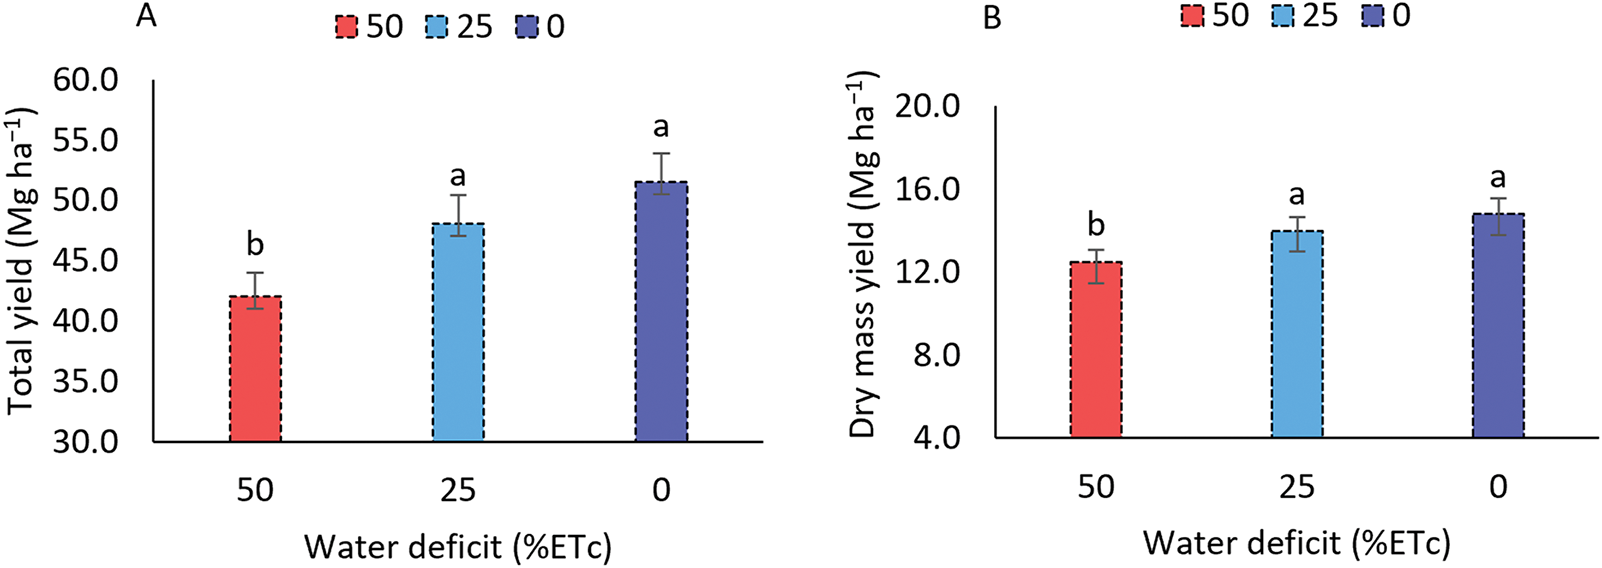
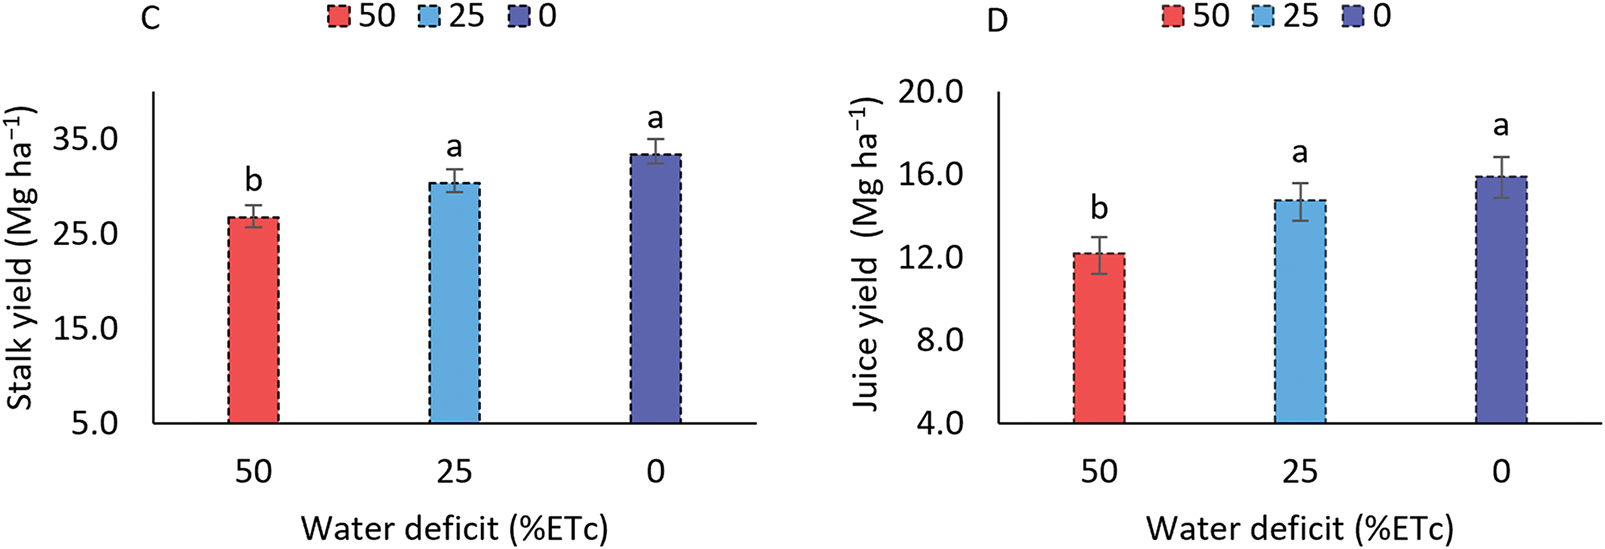
Figure 7: Total yield (A), dry mass yield (B), stalk yield (C), and juice yield (D) of the sorghum cultivar BRS 506 during the 2021 and 2022 growing seasons under water deficit conditions. Means followed by the same letter ‘a-b’ do not differ significantly according to Tukey’s test (p ≤ 0.05). Vertical bars represent the standard error of the mean (n = 14)
The application of a 50% water deficit relative to the sorghum crop’s water requirement resulted in reductions of 5.76% and 15.75% in dry matter yield (Fig. 7B), compared to the 25% deficit treatment and the no-stress condition, respectively. However, no statistically significant differences were observed between the 25% deficit and the no-stress treatments. To assess the impact of water deficit on the sweet sorghum cultivar BRS 506, stalk and juice yields were also evaluated (Fig. 7C,D), showing reductions of 20.09% and 23.18%, respectively, under the 50% deficit. In contrast, yields under the 25% deficit remained stable.
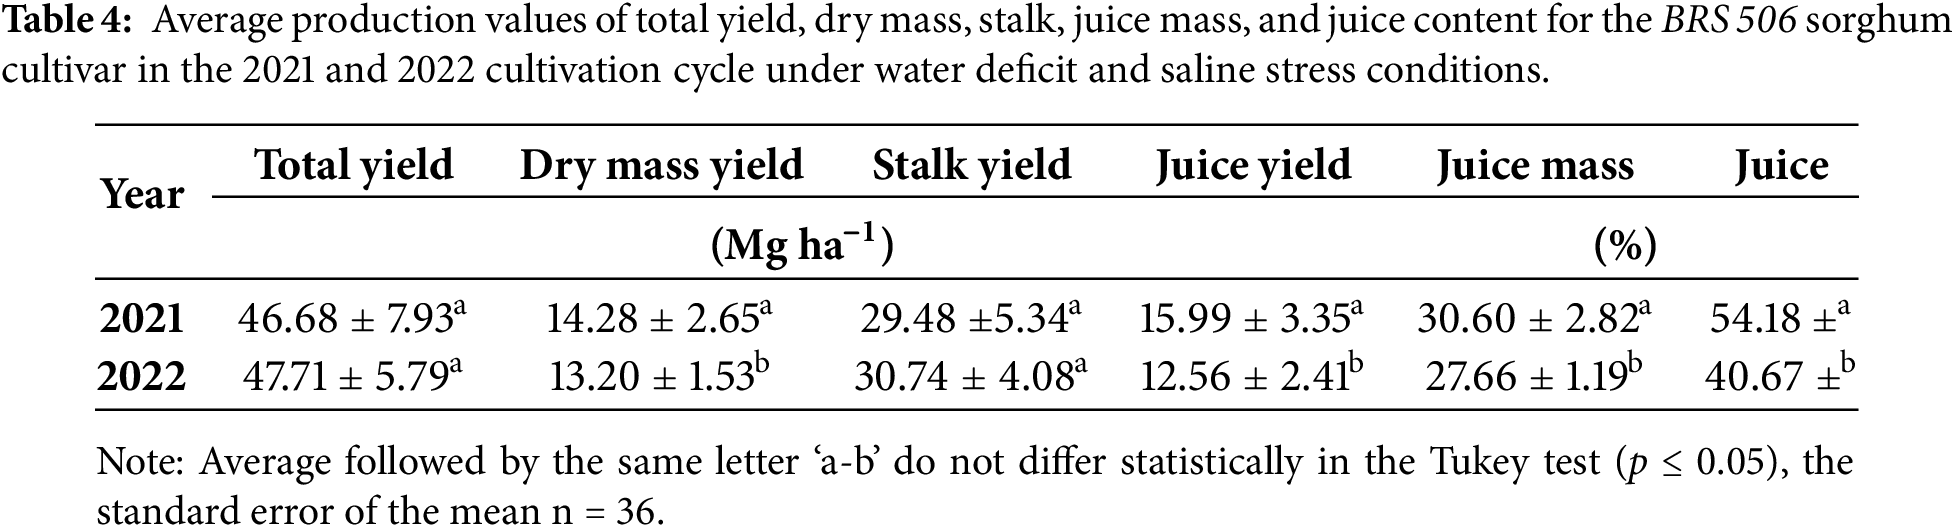
When comparing the mean values between the 2021 and 2022 experiments, a significant effect (p ≤ 0.05) was observed for dry matter yield, juice yield, dry matter content, and juice content (Table 4). In contrast, no significant differences were found between years for total fresh mass yield and stalk yield. In 2021, higher values were recorded for dry mass yield, juice yield, and both dry mass and juice percentages.
Abiotic stresses such as salinity and water deficit affect several physiological processes in plants, ultimately reducing growth, development, and productivity. Electrolyte leakage from the plasma membrane is a key indicator of plant tolerance to salt stress, as the membrane is the primary site of damage caused by toxic ions [43–45]. Sorghum, classified as a moderately salt-tolerant species [46], maintained membrane integrity under saline conditions, even when irrigation water electrical conductivity (ECw) reached 6.0 dS m−1. This response reinforces the species’ inherent tolerance to salinity.
Electrolyte leakage is an important trait closely associated with plant stress tolerance and yield performance [44]. Increased salt concentrations in irrigation water reduce soil water potential, leading to a loss of turgor pressure in plant cells and, consequently, a decrease in water uptake [46]. As a result, relative water content (RWC) in leaves declines, as observed in the 2022 season. However, sorghum demonstrates the ability to perform osmotic adjustment by maintaining turgor pressure and RWC, as well as regulating stomatal conductance, as previously reported [11,12,46–48]. The reduction in RWC under higher salinity conditions did not result in a corresponding decrease in yield (Table 3), further confirming the crop’s tolerance to salt stress [12,46,49]. In most crops, RWC is maintained above 85% during active growth [50], whereas values between 60% and 30% often indicate the onset of tissue damage.
The highest values of WSD were recorded in 2022 (9.53%) and 2021 (9.06%) under irrigation water salinity levels of 3.8 and 6.0 dS m−1, respectively. Lower WSD values indicate better plant water status, which favors growth and leads to significantly higher yields, as reported by [13]. Water uptake capacity (WUC) reflects the plant’s efficiency in absorbing water per unit of dry weight at a given developmental stage (13). Under saline stress, plants exert greater physiological effort to absorb water due to increased metabolic demand. This finding is consistent with the results of [10,51], who studied mungbean and reported that more salt-tolerant genotypes exhibited lower WUC values.
Water retention capacity (WRC) reflects the amount of water a leaf can retain under specific physiological and environmental conditions. The results indicate that significant differences in WRC were observed only under a 25% water deficit combined with ECw levels of 3.8 and 6.0 dS m−1. Under higher salinity stress, WRC values were lower, suggesting a reduction in cell size as a result of stress [52]. Under optimal water conditions, plants are better able to repair damaged cells and maintain higher WRC values [10]. Sorghum exhibits strong adaptability to adverse conditions of salinity and water deficit, enabling it to sustain acceptable yield levels with minimal losses, as evidenced in Table 3.
The primary effect of water deficit on plant water relations is the reduction of water content in cellular tissues [53]. Despite this impact, the observed values remained within a range considered physiologically acceptable, as levels below 20% indicate limited cell membrane damage and preservation of cellular integrity. Relative water content (RWC) is a reliable indicator of leaf water status and is directly influenced by water availability, typically decreasing under water deficit conditions [54]. Even under a 50% reduction in water supply, sorghum maintained RWC values above 85%, which are sufficient to prevent damage during active growth [50]. This reinforces the crop’s ability to tolerate both water deficit and salinity, supported by multiple physiological mechanisms [46]. In contrast, crops that lack such tolerance, as reported by [55–57], experience significant reductions in RWC, increased electrolyte leakage (EL), and disruption of morphophysiological processes, ultimately leading to yield loss.
At the lowest salinity level, the dry mass content was 28.38%, while an increase in ECw to 6.0 dS m−1 resulted in a 5.47% increase in dry mass accumulation. Although many plant species exhibit reduced dry mass under saline stress, sorghum possesses physiological and biochemical mechanisms that enable it to tolerate salinity [46]. This behavior was also reported by [1], who observed that dry mass remained stable across different salinity levels. However, under more severe saline conditions, dry mass may decrease due to alterations in biometric parameters of the plant [58]. Sweet sorghum shares similarities with sugarcane, particularly in its succulent stalks that are rich in water and sugars [5]. In this study, sorghum demonstrated resilience to salinity, maintaining physiological processes and exhibiting traits associated with salt stress tolerance.
The reduction in total yield under a 25% water deficit condition corresponded to 3.42 Mg ha−1, representing a 6.64% decrease. Despite this loss, the result is considered positive given the limited availability of water for irrigation. The crop responded efficiently to the imposed deficit, as a 50% reduction in irrigation depth resulted in yield losses of only 18.37% for fresh biomass and 15.75% for dry biomass, approximately three times greater than the losses observed under moderate deficit. These results surpass those reported by [59] for forage sorghum, millet, and maize grown under similar water deficit conditions. However, they were lower than the total yields ranging from 75.93 to 71.66 Mg ha−1 reported for the forage sorghum cultivar IPA SF-15 under 24% and 50% water deficit levels in semi-arid conditions [1].
The dry mass values observed in this study were lower than those reported by [1], who obtained yields ranging from 28.62 to 27.71 Mg ha−1 under 24% and 50% water deficit conditions, respectively, for the forage sorghum cultivar IPA SF-15 in semi-arid environments, a cultivar specifically developed for biomass production. Similarly, Ref. [3] reported a dry mass yield of 27.02 Mg ha−1 under a 25% water deficit relative to reference evapotranspiration. The lower values recorded in the present study can be attributed to the genetic characteristics of the BRS 506 cultivar, which is primarily intended for sugar and ethanol production rather than forage, as well as to external factors such as mite infestations late in the crop cycle, particularly in the second growing season. These factors likely contributed to the reduction in yield. Therefore, the development and implementation of water-efficient management strategies that minimize yield losses are essential for sustaining production under water-limited conditions.
The average dry mass yields under conditions of 50%, 25%, and 0% water deficit were 12.46, 13.97, and 14.79 Mg ha−1, respectively. These values are comparable to those reported by [60], who observed total dry mass yields ranging from 7.7 to 21.0 Mg ha−1 across 25 sorghum hybrids. Similarly, Ref. [61] reported dry mass values ranging from 13.32 to 27.90 Mg ha−1 when evaluating different sorghum cultivars irrigated with domestic sewage effluent. The higher yields in that study were attributed to the nutrient-rich composition of the effluent, which enhanced plant growth and biomass accumulation.
Exposure to a 50% water deficit resulted in reductions of 20.09% and 23.18% in stalk and juice yields, respectively. In contrast, no significant differences were observed between the moderate 25% deficit and the no-deficit condition, which is particularly relevant, as it demonstrates the cultivar’s ability to maintain yield under moderate water stress. Stalk yields reported by [62] for genotype-by-year interactions ranged from 9.65 to 20.10 Mg ha−1, which are lower than the values observed in the present study. These indicators, especially relevant to bioenergy production, suggest that while the crop exhibits resilience to moderate deficits, water restriction still has a measurable impact on yield components directly related to energy output, highlighting sorghum’s partial sensitivity to more severe water stress.
The differences between the experiments may be attributed to germination failures observed in 2022, which compromised the entire plant development cycle. Additionally, pest infestation at the end of the cycle may have contributed to the reduced agronomic performance in 2022, along with the specific climatic conditions of that year.
The sorghum cultivar BRS 506 demonstrated physiological tolerance to salinity, maintaining cell membrane stability even under elevated salinity levels. Although higher salinity affected plant water status, it did not compromise overall yield. The findings confirm that BRS 506 is tolerant to irrigation water salinity levels up to 6.0 dS m−1 and moderately sensitive to a 50% water deficit in terms of yield-related variables. However, the yield losses observed were proportionally lower than the intensity of the imposed water restriction, emphasizing the importance of targeted management strategies to mitigate adverse effects.
A 25% reduction in water availability led to a yield reduction of only 6.64%, demonstrating efficient water use and the potential for sustainable sorghum cultivation in regions with limited water resources.
The cultivar exhibited resilience under moderate water deficit and salinity stress, with no significant interaction between the two factors, indicating that their combined application can enhance the efficient use of available water and land resources.
Acknowledgement: The authors would like to thank the National Council for Scientific and Technological Development (CNPq), Research Support Foundation of Rio Grande do Norte, Coordination for the Improvement of Higher Education Personnel (CAPES), and the Federal Rural University of the Semi-Arid (UFERSA).
Funding Statement: This research was funded by the National Council for Scientific and Technological Development, CNPq. Notice 01/2016 process (432.570/2016-0) and Research Support Foundation of Rio Grande do Norte-FAPERN, Process No.: 10910019.000263/2021-43 .
Author Contributions: Conceptualization, Rodrigo Rafael da Silva, Gabriela Carvalho Maia de Queiroz, José Francismar de Medeiros; methodology, Rodrigo Rafael da Silva, Gabriela Carvalho Maia de Queiroz, Amanda Cibele da Paz Sousa, Antônio Gustavo de Luna Souto, Francisco Hélio Alves de Andrade, Francimar Maik da Silva Morais, Rita Magally Oliveira da Silva Marcelino, Fagner Nogueira Ferreira, Alex Alvares da Silva, Maria Isabela Batista Clemente, Baltazar Cirino Junior, Wedson Aleff Oliveira da Silva, Mateus de Freitas Almeida dos Santos, José Francismar de Medeiros; formal analysis, Rodrigo Rafael da Silva, Gabriela Carvalho Maia de Queiroz, José Francismar de Medeiros; investigation, Rodrigo Rafael da Silva, Gabriela Carvalho Maia de Queiroz, José Francismar de Medeiros, Amanda Cibele da Paz Sousa, Antônio Gustavo de Luna Souto; resources, José Francismar de Medeiros; data curation, Rodrigo Rafael da Silva, José Francismar de Medeiros; writing—original draft preparation, Rodrigo Rafael da Silva, Gabriela Carvalho Maia de Queiroz; writing—review and editing, Rodrigo Rafael da Silva, Gabriela Carvalho Maia de Queiroz, José Francismar de Medeiros; supervision, José Francismar de Medeiros; project administration, José Francismar de Medeiros; funding acquisition, José Francismar de Medeiros. All authors reviewed the results and approved the final version of the manuscript.
Availability of Data and Materials: The authors confirm that the data supporting the findings of this study are available within the article.
Ethics Approval: Not applicable.
Conflicts of Interest: The authors declare no conflicts of interest to report regarding the present study.
References
1. Da Silva RR, De Medeiros JF, De Queiroz GC, De Sousa LV, De Souza MVP, De Almeida Bastos Do Nascimento M, et al. Ionic response and sorghum production under water and saline stress in a semi-arid environment. Agriculture. 2023;13(6):1127. doi:10.3390/agriculture13061127. [Google Scholar] [CrossRef]
2. Impa SM, Perumal R, Bean SR, John Sunoj VS, Krishna Jagadish SV. Water deficit and heat stress induced alterations in grain physico-chemical characteristics and micronutrient composition in field grown grain sorghum. J Cereal Sci. 2019;86:124–31. doi:10.1016/j.jcs.2019.01.013. [Google Scholar] [CrossRef]
3. Kirchner JH, Robaina AD, Peiter MX, Torres RR, Mezzomo W, Ben LHB, et al. Funções de produção e eficiência no uso da água em sorgo forrageiro irrigado. Agraria. 2019;14(2):1–9. doi:10.5039/agraria.v14i2a5646. [Google Scholar] [CrossRef]
4. De Queiroz GCM, De Medeiros JF, Da Silva RR, Da Silva Morais FM, De Sousa LV, De Souza MVP, et al. Growth, solute accumulation, and ion distribution in sweet sorghum under salt and drought stresses in a Brazilian potiguar semiarid area. Agriculture. 2023;13(4):803. doi:10.3390/agriculture13040803. [Google Scholar] [CrossRef]
5. De Sousa LV, Da Silva RR, Pires De Souza MV, Carvalho Maia De Queiroz G, Batista Clemente MI, De Medeiros JF. Effects of saline and water stress on sweet sorghum. DYNA. 2024;91(231):69–75. doi:10.15446/dyna.v91n231.110842. [Google Scholar] [CrossRef]
6. Ahmad Dar R, Ahmad Dar E, Kaur A, Gupta Phutela U. Sweet sorghum—a promising alternative feedstock for biofuel production. Renew Sustain Energy Rev. 2018;82(7):4070–90. doi:10.1016/j.rser.2017.10.066. [Google Scholar] [CrossRef]
7. De Matos Martins A, De Figueiredo-Júnior JMM, Do Carmo Lemos R, Guerra WD, De Freitas FS, Da Costa Parrella RA, et al. Characterization of sweet sorghum genotypes regarding adaptability and stability for biofuel production. Ciênc Agrotec. 2025;49(1):e020524. doi:10.1590/1413-7054202549020524. [Google Scholar] [CrossRef]
8. Nazli RI, Aslankaciran C, Yang D, Liaqat W, Polat M, Cavdar AS, et al. Assessment of sweet sorghum genotypes for bioethanol production potential and bagasse combustion characteristics in a semi-arid Mediterranean climate. Agronomy. 2024;14(11):2626. doi:10.3390/agronomy14112626. [Google Scholar] [CrossRef]
9. Da Silva Macêdo AJ, De Farias Ramos JP, Santos EM, De Sousa WH, De Oliveira FG, Souza JTA, et al. Morphometric and productive characteristics of sorghum genotypes for forage production in the Brazilian semi-arid. Rev Bras Saúde Prod Anim. 2018;19(3):256–67. doi:10.1590/s1519-99402018000300003. [Google Scholar] [CrossRef]
10. Rafiqul Islam M, Mostofa Kamal M, Faruk Hossain M, Hossain J, Golam Azam M, Masuma Akhter M, et al. Drought tolerance in mung bean is associated with the genotypic divergence, regulation of proline, photosynthetic pigment and water relation. Phyton-Int J Exp Bot. 2023;92(3):955–81. doi:10.32604/phyton.2023.025138. [Google Scholar] [CrossRef]
11. Punia H, Tokas J, Bhadu S, Mohanty AK, Rawat P, Malik A, et al. Proteome dynamics and transcriptome profiling in sorghum [Sorghum bicolor (L.) Moench] under salt stress. 3 Biotech. 2020;10(9):412. doi:10.1007/s13205-020-02392-1. [Google Scholar] [PubMed] [CrossRef]
12. Calone R, Sanoubar R, Lambertini C, Speranza M, Antisari LV, Vianello G, et al. Salt tolerance and Na allocation in Sorghum bicolor under variable soil and water salinity. Plants. 2020;9(5):561. doi:10.3390/plants9050561. [Google Scholar] [PubMed] [CrossRef]
13. Islam MS, Hasan MK, Islam MR, Chowdhury MK, Pramanik MH, Iqbal MA, et al. Water relations and yield characteristics of mungbean as influenced by foliar application of gibberellic acid (GA3). Front Ecol Evol. 2023;11:1048768. doi:10.3389/fevo.2023.1048768. [Google Scholar] [CrossRef]
14. Francois LE, Donovan T, Maas EV. Salinity effects on seed yield, growth, and germination of grain sorghum. Agron J. 1984;76(5):741–4. doi:10.2134/agronj1984.00021962007600050008x. [Google Scholar] [CrossRef]
15. Tanji KK, Kielen NC. Agricultural drainage water management in arid and semi-arid areas. Rome, Italy: Food and Agriculture Organization of the United Nations; 2002. 188 p. [Google Scholar]
16. Shalaby OA. Moringa leaf extract increases tolerance to salt stress, promotes growth, increases yield, and reduces nitrate concentration in lettuce plants. Sci Hortic. 2024;325(12):112654. doi:10.1016/j.scienta.2023.112654. [Google Scholar] [CrossRef]
17. Yang Y, Guo Y. Unraveling salt stress signaling in plants. J Integr Plant Biol. 2018;60(9):796–804. doi:10.1111/jipb.12689. [Google Scholar] [PubMed] [CrossRef]
18. Wang X, Yang J, Liu G, Yao R, Yu S. Impact of irrigation volume and water salinity on winter wheat productivity and soil salinity distribution. Agric Water Manag. 2015;149(5):44–54. doi:10.1016/j.agwat.2014.10.027. [Google Scholar] [CrossRef]
19. Yuan C, Feng S, Huo Z, Ji Q. Effects of deficit irrigation with saline water on soil water-salt distribution and water use efficiency of maize for seed production in arid Northwest China. Agric Water Manag. 2019;212(8):424–32. doi:10.1016/j.agwat.2018.09.019. [Google Scholar] [CrossRef]
20. Shalaby OA, Ramadan ME. Mycorrhizal colonization and calcium spraying modulate physiological and antioxidant responses to improve pepper growth and yield under salinity stress. Rhizosphere. 2024;29(3):100852. doi:10.1016/j.rhisph.2024.100852. [Google Scholar] [CrossRef]
21. Seleiman MF, Al-Suhaibani N, Ali N, Akmal M, Alotaibi M, Refay Y, et al. Drought stress impacts on plants and different approaches to alleviate its adverse effects. Plants. 2021;10(2):259. doi:10.3390/plants10020259. [Google Scholar] [PubMed] [CrossRef]
22. Taiz L, Zeiger E, Møller IM, Murphy A. Fisiologia e desenvolvimento vegetal. 6th ed. Poznan, Poland: Artmed Editora; 2017. 888 p. [Google Scholar]
23. Muhammad M, Waheed A, Wahab A, Majeed M, Nazim M, Liu YH, et al. Soil salinity and drought tolerance: an evaluation of plant growth, productivity, microbial diversity, and amelioration strategies. Plant Stress. 2024;11(10):100319. doi:10.1016/j.stress.2023.100319. [Google Scholar] [CrossRef]
24. Dugas DV, Monaco MK, Olsen A, Klein RR, Kumari S, Ware D, et al. Functional annotation of the transcriptome of Sorghum bicolor in response to osmotic stress and abscisic acid. BMC Genomics. 2011;12(1):514. doi:10.1186/1471-2164-12-514. [Google Scholar] [PubMed] [CrossRef]
25. Assefa Y, Staggenborg SA, Prasad VPV. Grain sorghum water requirement and responses to drought stress: a review. Crop Manag. 2010;9(1):1–11. doi:10.1094/CM-2010-1109-01-RV. [Google Scholar] [CrossRef]
26. Hadebe ST, Mabhaudhi T, Modi AT. Water productivity of selected sorghum genotypes under rainfed conditions. Int J Plant Prod. 2020;14(2):259–72. doi:10.1007/s42106-019-00082-4. [Google Scholar] [CrossRef]
27. Alvares CA, Stape JL, Sentelhas PC, De Moraes Gonçalves JL, Sparovek G. Köppen’s climate classification map for Brazil. Metz. 2014;22(6):711–28. doi:10.1127/0941-2948/2013/0507. [Google Scholar] [CrossRef]
28. Emparn. Empresa de pesquisa agropecuária do rio grande do norte-relatório pluviométrico. [cited 2025 Apr 1]. Available from: https://meteorologia.emparn.rn.gov.br/relatórios/relatórios-pluviometricos. [Google Scholar]
29. Embrapa. BRS 506 o sorgo sacarino mais testado e plantado no Brasil. Sete Lagoas, Brazil: Embrapa Milho e Sorgo; 2012. [Google Scholar]
30. Rosolem CA, Malavolta E. Exigências nutricionais do sorgo sacarino. An Esc Super Agric Luiz De Queiroz. 1981;38(1):257–68. doi:10.1590/s0071-12761981000100020. [Google Scholar] [CrossRef]
31. Ayers RS, Westcot DW. A qualidade de água na agricultura [dissertation]. João Pessoa, Brazil: Federal University of Paraíba; 1999. [Google Scholar]
32. De Albuquerque Silva LGJr, Gheyi HR, De Medeiros JF. Composição química de águas do cristalino do nordeste brasileiro. Rev Bras Eng Agríc Ambient. 1999;3(1):11–7. doi:10.1590/1807-1929/agriambi.v3n1p11-17. [Google Scholar] [CrossRef]
33. Allen RG, Pereira LS, Raes D, Smith M. Evapotranspiración del cultivo: guías para la determinación de los re-querimientos de agua de los cultivos. Roma, Italy: FAO; 2006. [Google Scholar]
34. ScottiCampos P, PhamThi A, Semedo J, Pais I, Ramalho J, Matos M. Physiological responses and membrane integrity in three Vigna genotypes with contrasting drought tolerance. Emir J Food Agric. 2013;25(12):1002. doi:10.9755/ejfa.v25i12.16733. [Google Scholar] [CrossRef]
35. Barrs HD, Weatherley PE. A re-examination of the relative turgidity technique for estimating water deficits in leaves. Aust Jnl Bio Sci. 1962;15(3):413. doi:10.1071/bi9620413. [Google Scholar] [CrossRef]
36. Saneoka H, Hamid A, Hashem A. Soil and plant water relations. Gazipur, Bangladesh: IPSA-JICA Project Reports; 1995. [Google Scholar]
37. Brag H. The influence of potassium on the transpiration rate and stomatal opening in Triticum aestivum and Pisum sativum. Physiol Plant. 1972;26(2):250–7. doi:10.1111/j.1399-3054.1972.tb03577.x. [Google Scholar] [CrossRef]
38. Hasan MK, Islam MS, Islam MR, Ismaan HN, Sabagh AE, Barutçular C, et al. Water relations and dry matter accumulation of black gram and mungbean as affected by salinity. Thai J Agric Sci. 2019;52(1):54–67. [Google Scholar]
39. CONSECANA. Conselho dos Produtores de Cana-de-Açúcar, Açúcar e Álcool do Estado de São Paulo. 5th ed. Piracicaba, Brazil: Consecana; 2006. 112 p. (In Portuguese). [Google Scholar]
40. Arnhold E. easyanova: analysis of variance and other important complementary analyses [Internet]; 2024 [cited 2025 Apr 7]. Available from: 10.32614/CRAN.package.easyanova. [Google Scholar] [CrossRef]
41. Ferreira EB, Cavalcanti PP, Nogueira DA. ExpDes: an R package for ANOVA and experimental designs. Appl Math. 2014;5(19):2952–8. doi:10.4236/am.2014.519280. [Google Scholar] [CrossRef]
42. Team RC. R: a language and environment for statistical computing. Vienna, Austria: R Foundation for Statistical Computing; 2024. [Google Scholar]
43. Ashraf M, Ali Q. Relative membrane permeability and activities of some antioxidant enzymes as the key determinants of salt tolerance in canola (Brassica napus L.). Environ Exp Bot. 2008;63(1–3):266–73. doi:10.1016/j.envexpbot.2007.11.008. [Google Scholar] [CrossRef]
44. Hniličková H, Hnilička F, Orsák M, Hejnák V. Effect of salt stress on growth, electrolyte leakage, Na+ and K+ content in selected plant species. Plant Soil Environ. 2019;65(2):90–6. doi:10.17221/620/2018-pse. [Google Scholar] [CrossRef]
45. Mansour MMF, Salama KHA. Cellular basis of salinity tolerance in plants. Environ Exp Bot. 2004;52(2):113–22. doi:10.1016/j.envexpbot.2004.01.009. [Google Scholar] [CrossRef]
46. Mansour MMF, Emam MM, Ali Salama KH, Morsy AA. Sorghum under saline conditions: responses, tolerance mechanisms, and management strategies. Planta. 2021;254(2):24. doi:10.1007/s00425-021-03671-8. [Google Scholar] [PubMed] [CrossRef]
47. Huang RD. Research progress on plant tolerance to soil salinity and alkalinity in sorghum. J Integr Agric. 2018;17(4):739–46. doi:10.1016/S2095-3119(17)61728-3. [Google Scholar] [CrossRef]
48. Rastogi A, Kovar M, He X, Zivcak M, Kataria S, Kalaji HM, et al. Special issue in honour of Prof, Strasser—JIP-test as a tool to identify salinity tolerance in sweet sorghum genotypes. Photosynthetica. 2020;58:518–28. doi:10.32615/ps.2019.169. [Google Scholar] [CrossRef]
49. Ayers RS, Westcot DW. Water quality for agriculture. Rome, Italy: Food and Agriculture Organization of the United Nations; 1985. 174 p. [Google Scholar]
50. Gaff DF, Oliver M. The evolution of desiccation tolerance in angiosperm plants: a rare yet common phenomenon. Funct Plant Biol. 2013;40(4):315. doi:10.1071/fp12321. [Google Scholar] [PubMed] [CrossRef]
51. Islam MR, Kamal MM, Alam MA, Hossain J, Soufan W, Skalicky M, et al. Physiochemical changes of mung bean [Vigna radiata (L.) R. Wilczek] in responses to varying irrigation regimes. Horticulturae. 2021;7(12):565. doi:10.3390/horticulturae7120565. [Google Scholar] [CrossRef]
52. Martínez JP, Silva H, Ledent JF, Pinto M. Effect of drought stress on the osmotic adjustment, cell wall elasticity and cell volume of six cultivars of common beans (Phaseolus vulgaris L.). Eur J Agron. 2007;26(1):30–8. doi:10.1016/j.eja.2006.08.003. [Google Scholar] [CrossRef]
53. Djanaguiraman M, Vara Prasad PV, Ciampitti IA, Talwar HS. Impacts of abiotic stresses on sorghum physiology. In: Sorghum in the 21st century: food—fodder—feed—fuel for a rapidly changing world. Singapore: Springer; 2020. p. 157–88. doi:10.1007/978-981-15-8249-3_7. [Google Scholar] [CrossRef]
54. Mohammadi Alagoz S, Hadi H, Toorchi M, Pawłowski TA, Asgari Lajayer B, Price GW, et al. Morpho-physiological responses and growth indices of triticale to drought and salt stresses. Sci Rep. 2023;13(1):8896. doi:10.1038/s41598-023-36119-y. [Google Scholar] [PubMed] [CrossRef]
55. Abdelaal KAA, Hafez YM, El-Afry MM, Tantawy DS, Alshaal T. Effect of some osmoregulators on photosynthesis, lipid peroxidation, antioxidative capacity, and productivity of barley (Hordeum vulgare L.) under water deficit stress. Environ Sci Pollut Res Int. 2018;25(30):30199–211. doi:10.1007/s11356-018-3023-x. [Google Scholar] [PubMed] [CrossRef]
56. El-Tayeb MA. Response of barley grains to the interactive e.ect of salinity and salicylic acid. Plant Growth Regul. 2005;45(3):215–24. doi:10.1007/s10725-005-4928-1. [Google Scholar] [CrossRef]
57. Mahlooji M, Seyed Sharifi R, Razmjoo J, Sabzalian MR, Sedghi M. Effect of salt stress on photosynthesis and physiological parameters of three contrasting barley genotypes. Photosynthetica. 2018;56(2):549–56. doi:10.1007/s11099-017-0699-y. [Google Scholar] [CrossRef]
58. Roy RC, Sagar A, Tajkia JE, Razzak MA, Hossain AZ. Effect of salt stress on growth of sorghum germplasms at vegetative stage. J Bangladesh Agric Univ. 2018;16(1):67–72. doi:10.3329/jbau.v16i1.36483. [Google Scholar] [CrossRef]
59. Bhattarai B, Singh S, West CP, Ritchie GL, Trostle CL. Water depletion pattern and water use efficiency of forage sorghum, pearl millet, and corn under water limiting condition. Agric Water Manag. 2020;238:106206. doi:10.1016/j.agwat.2020.106206. [Google Scholar] [CrossRef]
60. Da Silva TC, Santos EM, Azevedo JAG, Edvan RL, Perazzo AF, Pinho RMA, et al. Agronomic divergence of sorghum hybrids for silage yield in the semiarid region of Paraiba. R Bras Zootec. 2011;40(9):1886–93. doi:10.1590/s1516-35982011000900007. [Google Scholar] [CrossRef]
61. De Lira RB, Ferreira-Neto M, Da Silva Dias N, De Medeiros JF, De Brito RF, De Lemos M, et al. Biomass, grain yield, ethanol production, and energy cogeneration of sweet sorghum irrigated with domestic sewage effluent. Biomass Conv Bioref. 2023;13(10):9131–40. doi:10.1007/s13399-021-01894-z. [Google Scholar] [CrossRef]
62. Oktem A, Oktem AG. Bioethanol obtained from soluble sugars in sweet sorghum, influencing properties and their interrelationships. Ind Crops Prod. 2024;221(17):119351. doi:10.1016/j.indcrop.2024.119351. [Google Scholar] [CrossRef]
Cite This Article
 Copyright © 2025 The Author(s). Published by Tech Science Press.
This work is licensed under a Creative Commons Attribution 4.0 International License , which permits unrestricted use, distribution, and reproduction in any medium, provided the original work is properly cited.
 Downloads
 Citation Tools