
 Submit a Paper
 Propose a Special lssue
 Open Access
REVIEW

Recent Advances and Emerging Trends in Chlorophyll Fluorescence Parameter Fv/Fm
College of Bioscience and Biotechnology, Yangzhou University, Yangzhou, 225009, China
* Corresponding Author: Xueyun Hu. Email:
Phyton-International Journal of Experimental Botany 2025, 94(9), 2615-2630. https://doi.org/10.32604/phyton.2025.069246
Received 18 June 2025; Accepted 07 August 2025; Issue published 30 September 2025
 View Full Text
 Download PDF
Abstract
Chlorophyll fluorescence, particularly the parameter Fv/Fm, has emerged as a reliable, non-invasive indicator of the maximum quantum efficiency of Photosystem II (PSII) in plants. Over the past decade, significant research has leveraged Fv/Fm to evaluate plant responses to a wide range of biotic and abiotic stresses, as well as to support crop improvement and ecological monitoring. This review synthesizes recent progress in understanding the physiological basis, measurement techniques, and applied significance of Fv/Fm across diverse plant systems. We highlight methodological advancements in fluorescence imaging and remote sensing, identify consistent patterns and contrasting findings in stress-response studies, and explore how Fv/Fm correlates with other physiological and molecular indicators. Despite its widespread use, challenges remain regarding data interpretation, environmental variability, and integration with multi-parameter models. This review also addresses critical knowledge gaps and proposes future research directions, including AI-driven analysis, a least-squares support vector machine (LSSVM) model, and high-resolution phenotyping. By consolidating findings from recent literature, this work provides a comprehensive reference for researchers aiming to harness Fv/Fm in both basic and applied plant sciences.Keywords
Chlorophyll fluorescence has become an indispensable tool in plant physiology for evaluating the status and performance of the photosynthetic apparatus, particularly Photosystem II (PSII). When a plant is exposed to light, part of the absorbed energy is utilized in photochemistry, part is dissipated as heat, and the remainder is re-emitted as fluorescence. This re-emitted fluorescence, primarily arising from chlorophyll a in PSII, provides critical insight into the functioning and integrity of the photosynthetic machinery under both optimal and stress conditions [1]. Among the various fluorescence parameters, Fv/Fm—the maximum quantum efficiency of PSII—is one of the most widely utilized indicators. It is calculated from the difference between the maximum fluorescence (Fm) and the minimal fluorescence (Fo) of a dark-adapted leaf, expressed as Fv/Fm = (Fm − Fo)/Fm. Under optimal physiological conditions, Fv/Fm typically ranges from 0.74 to 0.85, and deviations from this range are indicative of stress-induced photoinhibition or damage to PSII reaction centers [2].
The significance of Fv/Fm lies in its simplicity and non-invasiveness, allowing researchers to assess the physiological status of plants quickly and accurately under a range of environmental conditions. Over the past decade, advancements in instrumentation such as Pulse-Amplitude Modulated (PAM) fluorometers and chlorophyll fluorescence imaging systems have enabled researchers to evaluate Fv/Fm at high spatial and temporal resolutions, both in controlled environments and in the field. These technological innovations have facilitated its application in diverse domains, including crop breeding, ecosystem monitoring, and stress physiology [3]. From a mechanistic standpoint, Fv/Fm is tightly linked to the efficiency of photochemical processes in PSII. A decline in this parameter reflects a disturbance in the energy transfer chain or damage to the PSII reaction center, often caused by abiotic stressors such as high light intensity, drought, salinity, heat, and cold. For example, a study by Faseela [4] emphasized that Fv/Fm is among the earliest detectable indicators of stress before morphological symptoms become visible and thus offers a valuable early-warning system for plant health monitoring.
The application of Fv/Fm in recent research has not been limited to stress detection alone. It has been used to evaluate genetic variability in stress tolerance across cultivars, making it a crucial parameter in plant breeding programs. Moreover, it is increasingly integrated with remote sensing technologies, particularly Unmanned Aerial Vehicles (UAVs) equipped with fluorescence sensors, to monitor crop performance across large spatial scales [5]. Despite its widespread utility, the interpretation of Fv/Fm data is not without challenges. Variability in measurement protocols, diurnal fluctuations, and environmental interactions can all influence its accuracy and reproducibility. Additionally, while a decline in Fv/Fm is generally indicative of stress, the precise cause and nature of the stress often require complementary measurements, such as Non-Photochemical Quenching (NPQ), gas exchange parameters, or molecular markers [1]. The foundational theory behind chlorophyll fluorescence has been well-established for decades [6]. Early work by Krause & Weis [7] and Bolhar-Nordenkampf et al. [8] laid the groundwork for understanding fluorescence dynamics, distinguishing between photochemical and non-photochemical pathways, and interpreting various fluorescence transients. Recent research has expanded upon this by integrating Fv/Fm with systems biology approaches, including transcriptomics and metabolomics, to provide a more comprehensive view of stress responses.
By reviewing the progress made over the last decade, this paper aims to provide a comprehensive and critical overview of the role of Fv/Fm in plant science. We highlight both the strengths and limitations of current approaches, underscore the parameter’s versatility, and suggest ways in which future research can enhance its utility. Ultimately, this review seeks to serve as a reference point for researchers aiming to employ chlorophyll fluorescence and specifically Fv/Fm as a diagnostic, predictive, and integrative tool in plant biology.
2 Fundamental Concepts and Theoretical Background
2.1 Basic Principles of Chlorophyll Fluorescence and PSII Photochemistry
Chlorophyll fluorescence arises when chlorophyll molecules in plants absorb light energy, and a portion of this energy is re-emitted as fluorescence, rather than being used in photochemical reactions or dissipated as heat. This process is particularly informative when observing PSII, which is the core component of the photosynthetic apparatus responsible for the initial steps of light energy conversion.
PSII photochemistry involves the absorption of photons by the light-harvesting complexes, followed by energy transfer to the reaction center, where water is split to generate electrons, protons, and oxygen. The efficiency of this process can be modulated under environmental stresses, which in turn influences the intensity and dynamics of chlorophyll fluorescence [9]. Under stress conditions, impaired electron transport or photodamage to PSII leads to a redistribution of absorbed energy, increasing the fraction of energy emitted as fluorescence or lost as heat (Fig. 1).
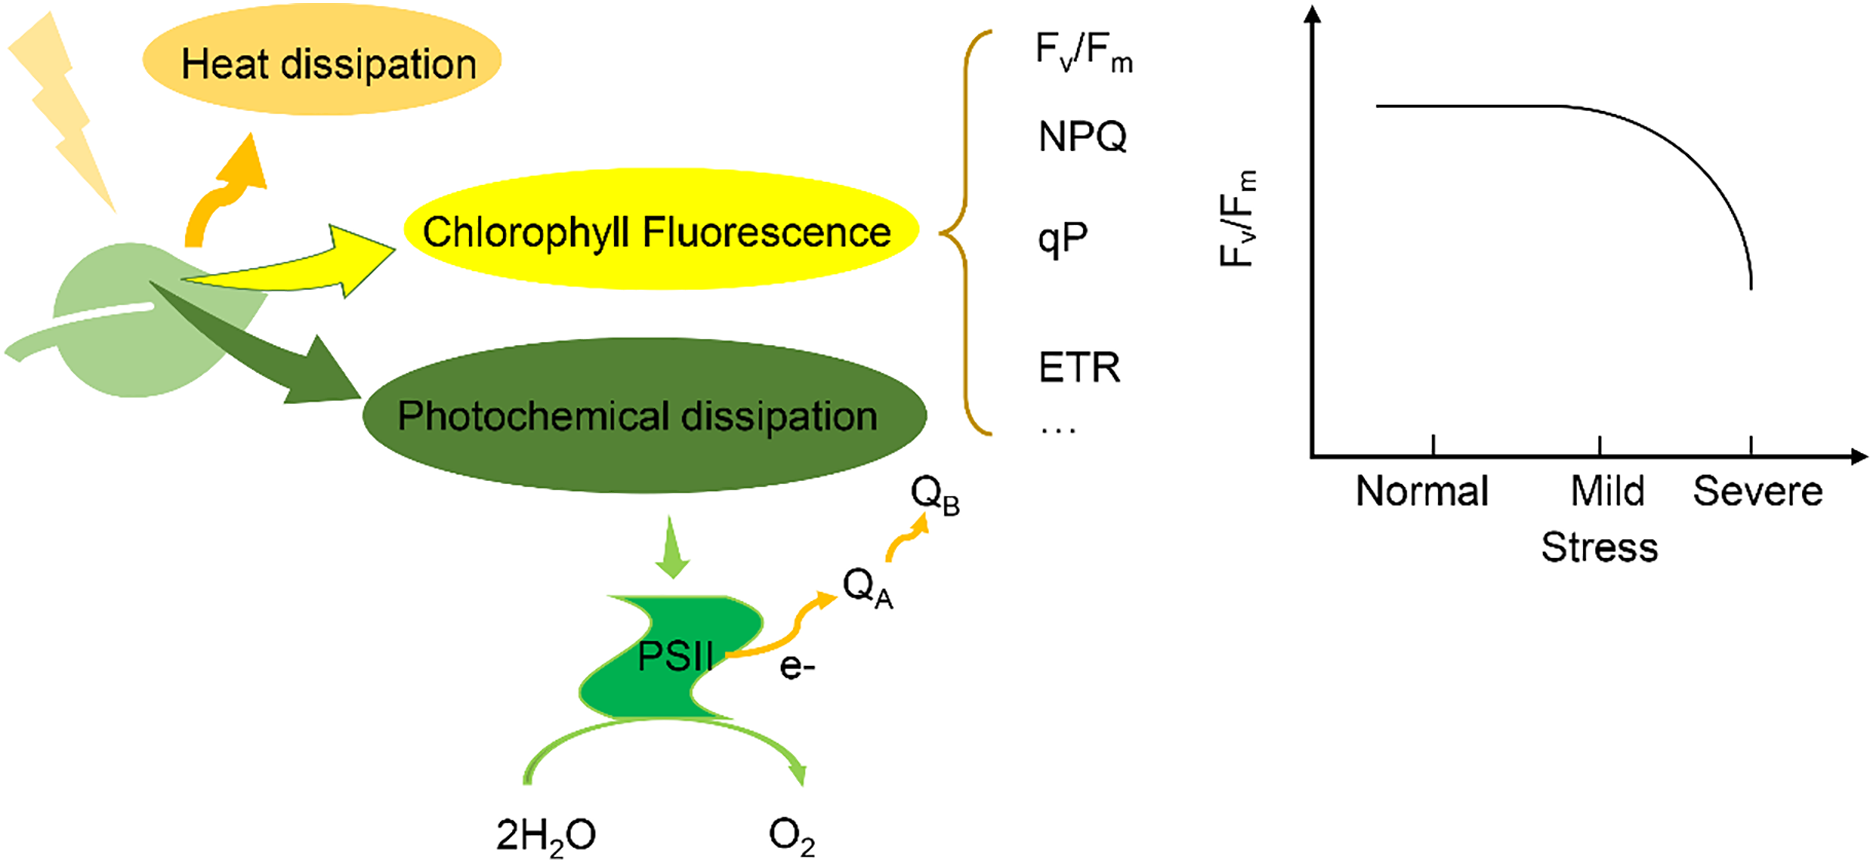
Figure 1: The generation principle and characteristics of chlorophyll fluorescence
When light is absorbed by chlorophyll pigments in plant leaves, the excitation energy is distributed among three main pathways: (1) dissipation as heat via non-photochemical quenching, (2) re-emission as chlorophyll fluorescence, and (3) utilization in photochemical reactions through PSII to drive photosynthesis. Within PSII, light energy excites the reaction center chlorophyll (P680), forming an excited state (P680*), which initiates charge separation and electron transfer through the electron transport chain, beginning with the primary electron acceptor QA and continuing toward plastoquinone (PQ). Electrons lost from P680 are replenished by the oxygen-evolving complex (OEC), which splits water and releases oxygen. These photochemical processes are closely associated with chlorophyll fluorescence parameters—minimum fluorescence (Fo), maximum fluorescence (Fm), and variable fluorescence (Fv = Fm – Fo). Under environmental stress, the distribution of absorbed light energy shifts, altering fluorescence dynamics. Notably, the Fv/Fm ratio remains relatively stable under mild stress but shows a marked decline under severe stress, making it a sensitive indicator of PSII photoinhibition and overall plant physiological status.
Chlorophyll fluorescence parameters, such Fv/Fm and the effective quantum yield (ΦPSII), reflect the efficiency of photosystem II photochemistry and are commonly used to assess the physiological status of plants. These parameters can be obtained using Pulse-Amplitude Modulation (PAM) fluorometers, PAM fluorometers do not directly quantify fluorescence parameters but instead measure the changes in chlorophyll fluorescence intensity under controlled light pulses, which are then used to calculate photosynthetic parameters by separating photochemical and non-photochemical energy dissipation processes [10]. These instruments facilitate the real-time monitoring of PSII function, offering a dynamic view of how plants respond to their environment.
2.2 Definition and Interpretation of Fv, Fm, and the Fv/Fm Ratio
The maximum quantum yield of PSII, represented as Fv/Fm, is calculated from two core fluorescence parameters (Fig. 2):
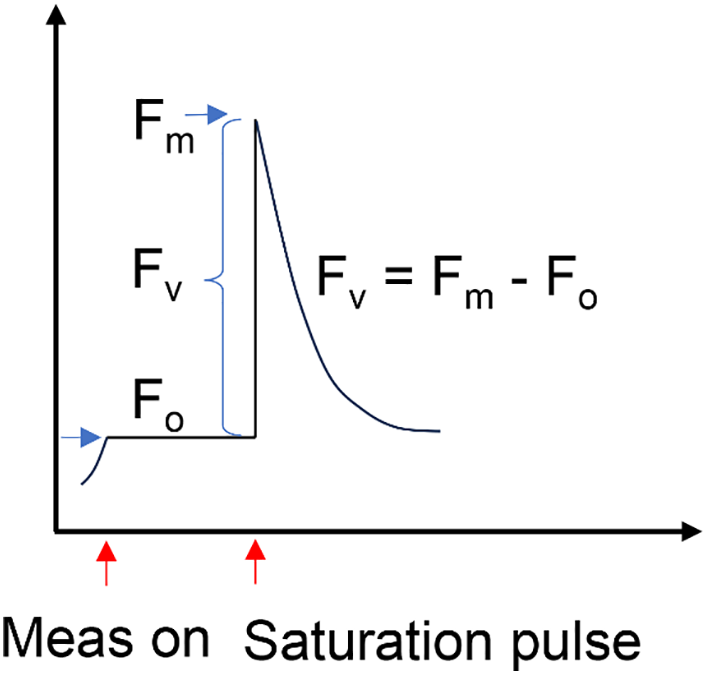
Figure 2: Simple illustration of Fv/Fm
• Fo (minimum fluorescence): The basal level of fluorescence when all PSII reaction centers are open (in the dark-adapted state).
• Fm (maximum fluorescence): The maximal fluorescence emission when all PSII reaction centers are closed following a saturating light pulse.
The variable fluorescence (Fv) is defined as the difference between Fm and Fo:
Thus,
Under dark adaptation conditions, the leaf samples were placed for 20–30 min to ensure that the reaction centers of PSII were fully open. The leaf discs were then positioned securely under the measuring probe to ensure firm contact with the sensor. The MINI-PAM first recorded the Fo, which is the fluorescence emitted under a weak measuring light. Subsequently, a strong saturating pulse was applied to fully close the PSII reaction centers, and Fm was recorded.
This ratio is a widely accepted indicator of the intrinsic efficiency of PSII photochemistry in dark-adapted leaves. Under optimal conditions, most plant species exhibit an Fv/Fm ratio of approximately 0.83. Deviations from this value are typically associated with stress or photoinhibition [3]. An Fv/Fm value significantly lower than 0.80 may indicate that PSII reaction centers are either damaged or less efficient, which may result from excessive excitation energy, photodamage, or oxidative stress [11].
2.3 Factors Affecting Fv/Fm Values in Plants
A wide range of factors can influence Fv/Fm values, making their interpretation context-dependent. Drought, salinity, heat, cold, and nutrient deficiencies are all known to reduce Fv/Fm values. For instance, water stress impairs PSII activity by causing thylakoid membrane disorganization and an increase in energy dissipation as heat [12]. Pathogenic infections can also impair electron transport and energy conversion in PSII, leading to altered chlorophyll fluorescence dynamics [13,14]. However, specific effects depend on pathogen type and host defense mechanisms. Inter-specific and intra-specific differences exist in baseline Fv/Fm values and in their stress responses. Some species have naturally higher resilience and efficient repair mechanisms for photodamaged PSII centers [15]. Young leaves often have higher Fv/Fm ratios compared to senescing tissues [16]. Chloroplast development, pigment composition, and structural integrity of thylakoid membranes all evolve with plant age, affecting fluorescence parameters [17].
2.4 Integrated Models of PSII Energy Partitioning and Fv/Fm Prediction
Although conceptually distinct, the components of PSII energy partitioning interact dynamically in response to environmental cues. Under high light or stress, NPQ mechanisms (particularly xanthophyll cycling and proton gradient formation) increase, reducing Fv/Fm to protect the PSII complex from over-excitation [10]. One commonly used conceptual framework is the “energy flux model,” which partitions the energy budget in PSII across specific fluxes—such as energy absorption (ABS), trapping (TR), electron transport (ET), and dissipation (DI). Each can be measured per reaction center or per cross-section, facilitating a detailed energy balance under different physiological states [18]. Another evolving model involves machine learning-based prediction of Fv/Fm under fluctuating field conditions, where factors such as light, temperature, and humidity rapidly change. For example, Xia et al. [9] developed a Least-Squares Support Vector Machine (LSSVM) model that estimates Fv/Fm without the need for dark adaptation, opening avenues for high-throughput phenotyping (Fig. 3). They selected environmental variables such as light intensity, temperature and humidity, as well as the spectral characteristics of leaf reflection as input variables. During the data collection process, multi-parameter synchronous measurements were conducted on various plants at different time periods and growth stages to obtain a large amount of sample data for model training and validation. In addition, the specific steps for model training and validation were described. Then, the validation set data was used to evaluate the prediction accuracy and generalization ability of the model. The computation time for each test sample was less than 4 ms. Furthermore, the model demonstrated strong predictive performance on the test dataset, with a high correlation coefficient ranging from 0.762 to 0.974, a low Root Mean Squared Error (RMSE) between 0.005 and 0.021, and a Residual Prediction Deviation (RPD) ranging from 1.254 to 4.933.
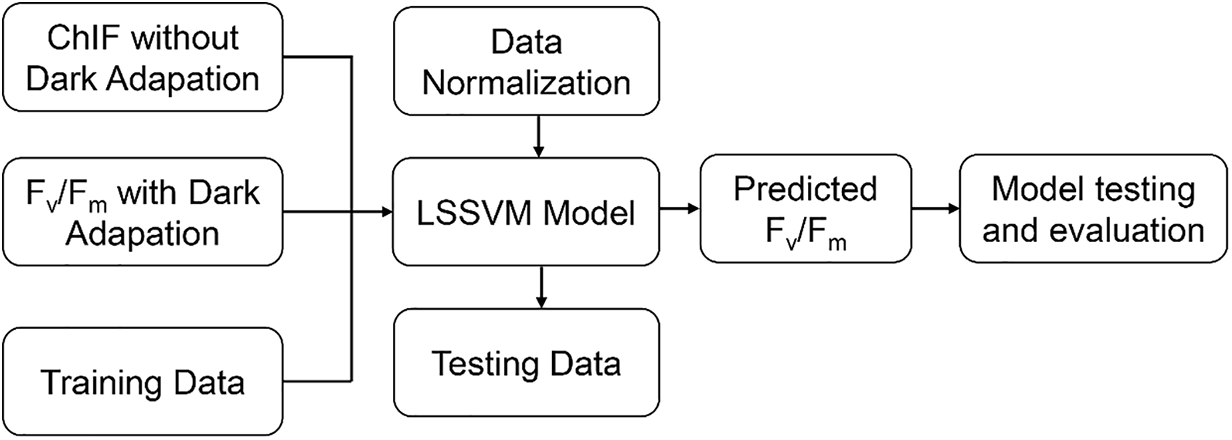
Figure 3: The development process of an LSSVM model
The development process of an LSSVM model used to predict Fv/Fm values from chlorophyll fluorescence data collected without dark adaptation. The input and target data are first normalized, then split into training and testing sets. After training, the LSSVM model predicts Fv/Fm values for test samples, and its performance is evaluated using RMSE, Correlation Coefficient (CC), and Residual Predictive Deviation (RPD) to assess accuracy and robustness.
3 Methodological Approaches for Measuring Fv/Fm
3.1 Overview of Standard Protocols and Equipment (e.g., PAM Fluorometry)
The most widely adopted method for quantifying Fv/Fm is PAM fluorometry, which allows high-sensitivity, non-invasive monitoring of chlorophyll fluorescence parameters in both laboratory and field conditions. The PAM technique employs a series of actinic and saturating light pulses to distinguish between the minimum fluorescence (Fo), maximum fluorescence (Fm), and hence the variable fluorescence (Fv), which forms the basis of the Fv/Fm calculation. A simplified JIP-test, used in commercial systems, focuses specifically on the Fv/Fm ratio to monitor PSII photochemical efficiency under different physiological states. This approach has been integrated into portable platforms and high-throughput imaging systems, such as the MINI-PAM and Imaging-PAM devices, which enable detailed spatial and temporal fluorescence mapping [19,20].
3.2 Advances in Imaging Techniques and High-Throughput Phenotyping
In recent years, chlorophyll fluorescence imaging has revolutionized the phenotyping landscape. Unlike point-based PAM measurements, fluorescence imaging allows spatially resolved data collection from entire leaves or plant canopies. This is particularly useful for visualizing heterogeneities in PSII efficiency and detecting localized stress responses. High-throughput platforms such as GROWSCREEN-FLUORO and automated phenotyping chambers combine RGB imaging with chlorophyll fluorescence analysis to screen large populations of plants efficiently. These systems can evaluate Fv/Fm alongside morphological traits such as leaf area or shape, enabling integrative phenotyping of stress resilience or genetic variability [21,22]. Fluorescence imaging has also been successfully applied in biotic stress studies (Fig. 4). For example, Hupp et al. used high-resolution fluorescence imaging to detect PSII damage caused by Pseudomonas syringae in Arabidopsis, revealing localized reductions in Fv/Fm even before visible symptoms appeared [23]. Moreover, cutting-edge studies are integrating machine learning and spectral modeling to estimate Fv/Fm without the need for traditional dark adaptation protocols. These computational methods enhance real-time monitoring and have promising applications in remote sensing and field-based decision support systems [24].
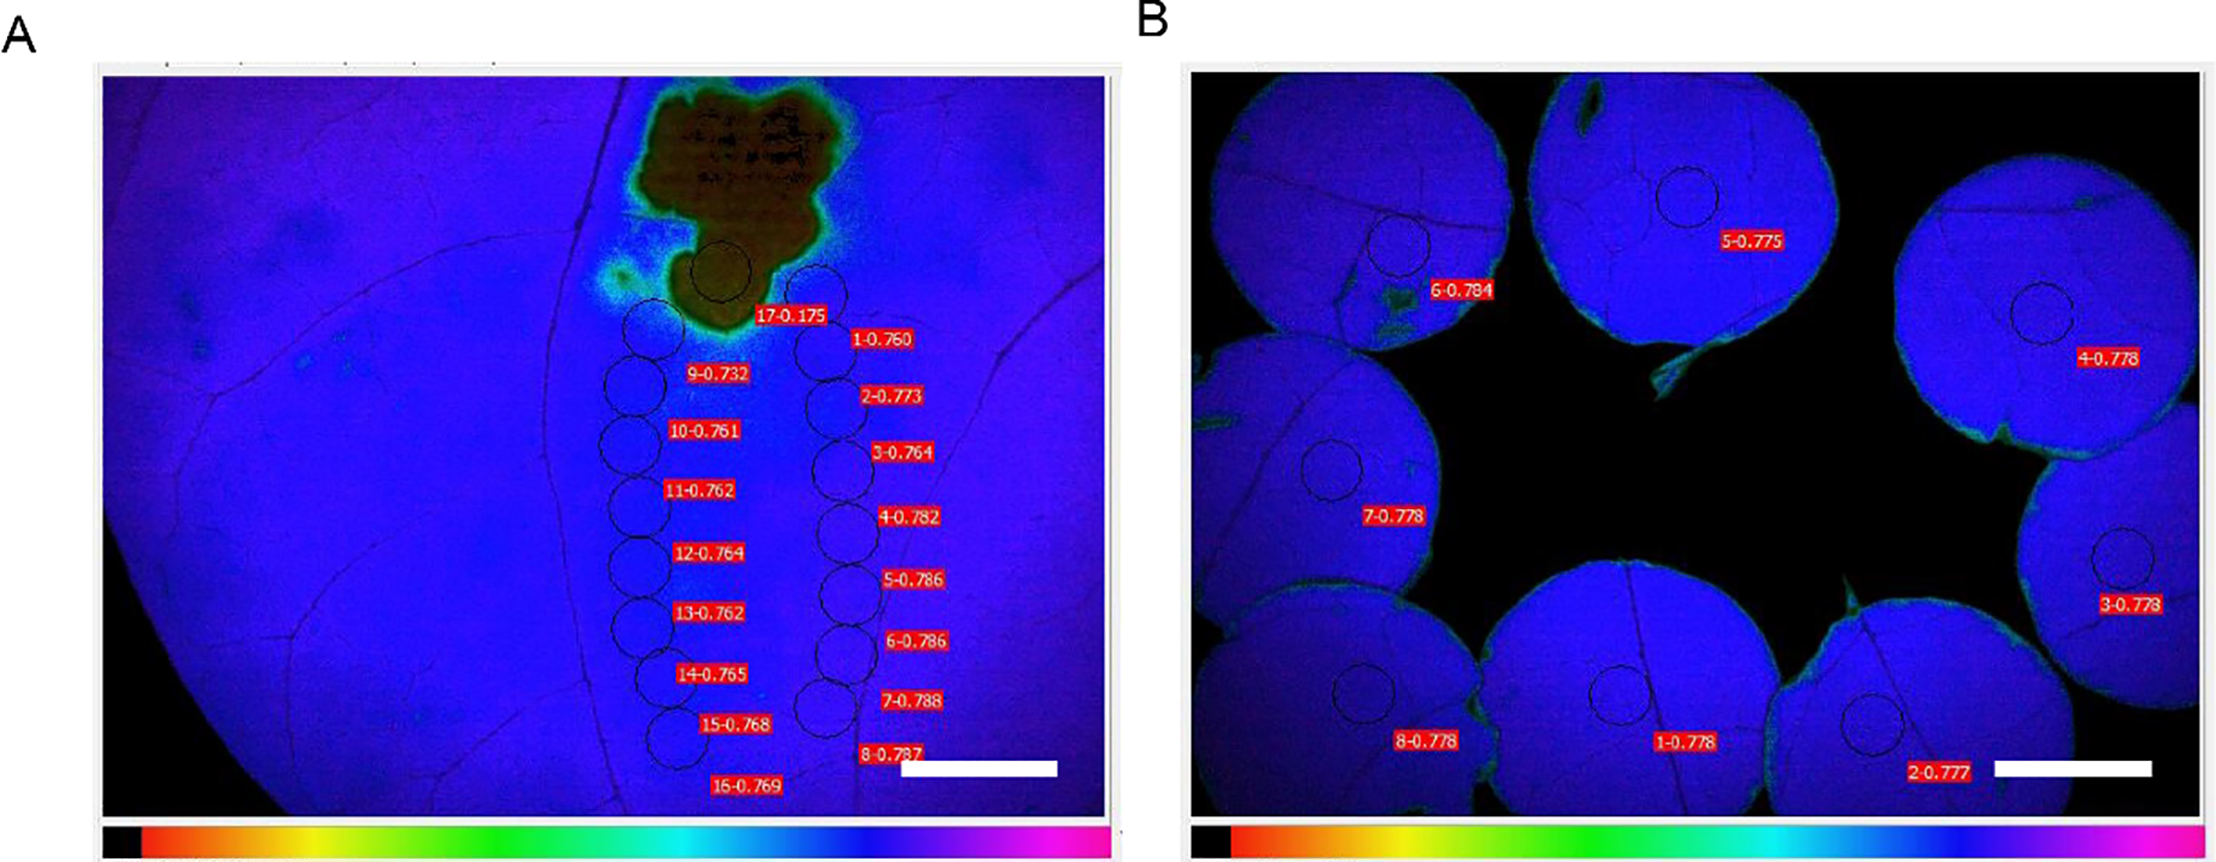
Figure 4: Fluorescence imaging of Fv/Fm. (A), Fluorescence imaging of Fv/Fm was performed using the Imaging-PAM MINI system. The resulting images show the spatial distribution of Fv/Fm values across leaf surfaces following pathogen infection. A reduced Fv/Fm value was observed near the infection site, indicating severe PSII damage. It gradually increases with the increase of distance. indicating that the PSII function is affected to a certain extent or relatively normal. (B), Chlorophyll fluorescence measurements were conducted on multiple leaves simultaneously using a chlorophyll fluorescence meter. To ensure uniform sample size, leaf discs were collected using a hole puncher. Measurement points were then selected consistently on each disc to maintain accuracy and comparability across samples. Scale bar = 0.5 cm
3.3 Methodological Limitations and Considerations in Field vs. Lab Measurements
While lab-based Fv/Fm measurements provide precise environmental control and repeatability, field measurements introduce several challenges, including fluctuating light conditions, variable ambient temperatures, and wind-induced leaf movement—all of which can affect fluorescence signals. To mitigate these issues, researchers often use leaf clips for dark adaptation and shielding devices to stabilize measurements. Another complication arises from diurnal variation; Fv/Fm values can fluctuate significantly over the course of a day due to reversible photoinhibition [25,26]. Therefore, standardizing the time of day for measurements is essential for field studies. Additionally, stress imposition (e.g., drought) may manifest at different spatial scales, leading to potential underestimation or overestimation of photoinhibition when only specific leaf regions are measured [27].
3.4 Evaluation of Data Quality and Reproducibility in Recent Studies
The reliability and reproducibility of Fv/Fm data have been central concerns in phenotyping research. A study by Baker et al. demonstrated that fluorescence-based indicators, including Fv/Fm, exhibit high repeatability and correlate well with biomass and yield components in crops [28]. However, reproducibility can vary depending on the instrumentation, operator handling, environmental conditions, and calibration routines. To address these challenges, Bates (2020) emphasized the importance of integrating automated control systems and Standard Operating Procedures (SOPs) to minimize measurement artifacts and inter-experimental variability [29]. Furthermore, Kovář et al. validated the consistency of fluorescence-based imaging in drought-stressed tomato plants, confirming that well-calibrated digital imaging systems can produce reliable, non-destructive phenotypic data over multiple time points [30]. Advancements in PAM fluorometry, imaging technologies, and automation have substantially improved the sensitivity, scalability, and utility of Fv/Fm measurements. Tschiersch et al. (2017) integrated kinetic PAM fluorometry into automated phenotyping platforms, enabling reproducible Fv/Fm measurements on up to ~180 large plants per hour [31]. Integration with other imaging modalities has further improved data fidelity. A Plant Methods (2024) study fused RGB, hyperspectral, and chlorophyll fluorescence imaging, achieving over 98% pixel-level alignment that reduces measurement noise and enhances spatial resolution for stress detection [32]. Controlled-environment throughput is enhanced by custom fluorescence chambers capable of dynamic gas–light protocols, enabling simultaneous measurement of over 500 samples daily—enhancing both experimental control and data quality in kinetic Fv/Fm assays [33]. Nevertheless, ensuring data quality—particularly under variable field conditions—requires rigorous standardization and attention to methodological nuance. The increasing integration of AI tools and modeling approaches holds promise for overcoming many existing limitations and extend the applicability of Fv/Fm as a robust phenotyping metric [5].
4 Recent Advances in Fv/Fm Research
4.1 Abiotic Stress Responses and Applications
The Fv/Fm parameter has been extensively applied in evaluating plant responses to a variety of abiotic stresses, including drought, heat, cold, salinity, and nutrient deficiencies. In these contexts, Fv/Fm acts as a sensitive indicator of photoinhibition and the decline in PSII efficiency under adverse conditions. For instance, recent studies have demonstrated that drought conditions significantly lower Fv/Fm values due to impaired electron transport and increased oxidative stress. A study on soybean demonstrated that moderate to severe drought led to significant reductions in both Fv/Fm (up to 63.9%) and ΦPSII, along with increased NPQ and reactive oxygen species accumulation, reflecting photoinhibition and oxidative damage to the photosynthetic apparatus [34]. In wheat and chickpea, drought-induced decreases in Fv/Fm correlated with reduced biomass and yield, making this parameter valuable for early stress detection and crop selection [35]. Fv/Fm holds particular promise for drought mapping, especially when integrated into remote sensing frameworks. Under water-limited conditions, declines in Fv/Fm often precede visible wilting, making it a physiologically grounded warning signal of drought stress. Although traditional vegetation indices such as NDVI and PRI have been widely used in drought monitoring, they suffer from limitations, including saturation under high biomass, sensitivity to soil background, and reduced reliability in heterogeneous canopies. Moreover, NDVI often reaches a plateau under dense vegetation, limiting its sensitivity to physiological stress, while PRI is highly sensitive to canopy structure and illumination conditions. In contrast, Fv/Fm reflects intrinsic photochemical efficiency and is less affected by structural and background noise, making it more robust in diverse environments. For practical drought assessment, integrating Fv/Fm with other parameters—such as leaf water content, thermal imagery, and soil moisture data—can improve both spatial and temporal sensitivity. As demonstrated by Zielinska et al. (2021), multi-source data fusion—combining optical, thermal, and microwave remote sensing—enables more reliable, near-real-time assessment of drought impacts on vegetation [36]. Incorporating Fv/Fm into such models could overcome spectral limitations and enhance physiological relevance. However, for Fv/Fm to be incorporated into operational drought monitoring systems, it is essential to determine whether it can be autonomously measured and scaled using remote sensing or proximal sensing platforms. High temperatures also cause irreversible damage to the D1 protein in PSII, reflected by sustained declines in Fv/Fm. A study by Bhardwaj et al. [37] employed Fv/Fm phenotyping alongside heat injury indices to screen for thermotolerant crop genotypes, highlighting its utility in breeding programs targeting heat stress resilience. Salinity stress has similarly been associated with photodamage in crops like chickpea and rice. Recent research showed that genotypic tolerance to salt could be rapidly assessed using imaging systems that quantify Fv/Fm, aiding in high-throughput climate-smart breeding efforts [38,39]. Notably, spatial heterogeneity in Fv/Fm under these stresses has been visualized using false-color fluorescence imaging, facilitating detection of localized stress zones and enabling site-specific interventions [40].
4.2 Biotic Stress and Pathogen Interactions and Applications
Fv/Fm also plays a critical role in detecting plant responses to biotic stress, including infections caused by fungi, bacteria, and viruses. Pathogen attacks disrupt PSII electron transport, resulting in decreased Fv/Fm in infected tissues—often before visible symptoms emerge. For example, Cséfalvay et al. demonstrated that grapevine leaves infected by Plasmopara viticola exhibited a sharp decline in Fv/Fm, allowing early detection via chlorophyll fluorescence imaging [41]. This precision makes Fv/Fm a valuable non-invasive marker for plant immunity screening and disease resistance mapping. Additionally, high-resolution fluorescence phenotyping has been used to differentiate between resistant and susceptible genotypes by analyzing their recovery of Fv/Fm following pathogen exposure. Such applications are gaining traction in integrated disease management and smart agriculture.
4.3 Fv/Fm in Ecosystem Productivity and Carbon Balance Modeling
Fv/Fm is increasingly recognized not only as a diagnostic indicator of stress but also as a critical proxy for quantifying photosynthetic efficiency in carbon cycle studies. As a measure of the maximum quantum efficiency of Photosystem II (PSII), Fv/Fm is directly linked to the capacity of vegetation to convert absorbed light into chemical energy [42], making it highly relevant to estimates of carbon assimilation such as Gross Primary Production (GPP) and Net Ecosystem Exchange (NEE). Carbon fluxes such as GPP and NEE are typically measured using eddy covariance towers or gas exchange chambers. When modeled alongside Fv/Fm, studies have shown that declines in Fv/Fm correspond closely with reductions in net carbon uptake, particularly in drought- and heat-stressed ecosystems. For instance, in Mediterranean oak woodlands, reduced Fv/Fm values under summer drought conditions aligned temporally with decreased flux-tower GPP readings. Integrating Fv/Fm into Light Use Efficiency (LUE) models enhances the ability to simulate GPP under varying environmental conditions, particularly in ecosystems experiencing stress from drought, temperature extremes, or nutrient limitations. Reductions in Fv/Fm typically precede or coincide with declines in carbon uptake, making it a useful early-warning signal. Remote sensing platforms equipped with solar-induced chlorophyll fluorescence (SIF) instruments have increasingly leveraged Fv/Fm -related signals to improve large-scale estimates of GPP and NEE [43–45]. For example, Nichol et al. demonstrated that canopy-level chlorophyll fluorescence, including Fv/Fm, is strongly correlated with ecosystem GPP across various landscapes [46]. Similarly, Zarco-Tejada et al. support this coupling in diverse climatic zones, offering compelling evidence that Fv/Fm variations can serve as warning indicators of photosynthetic downregulation prior to measurable changes in carbon fluxes [47]. These relationships are particularly critical in climate-sensitive ecosystems such as boreal forests, savannas, and peatlands, where early stress detection can guide adaptive land management. Modeling Fv/Fm provides not only a mechanistic understanding of plant stress responses but also a scalable tool for interpreting and predicting ecosystem carbon dynamics. This integration bridges physiological measurements with ecosystem-scale carbon monitoring, offering valuable insights for climate-resilient land management and predictive Earth system modeling.
4.4 Genotype and Species-Level Variability and Applications
In recent years, Fv/Fm has become a cornerstone trait for quantifying intraspecific and interspecific variability in PSII efficiency under environmental stress. Differences in Fv/Fm among genotypes offer insight into their relative tolerance and adaptability. In studies on heat-tolerant wheat and rice, genotypes with higher Fv/Fm values under stress maintained higher biomass and yield, confirming the value of Fv/Fm in selective breeding pipelines [48,49] used genotype-by-yield × trait biplot analysis to demonstrate that Fv/Fm can effectively rank genotypic responses to salinity stress when coupled with physiological and spectral traits [50]. This genotype-level application has expanded to wild species and perennial crops as well, offering a scalable tool for screening genetic resources for climate resilience across plant biodiversity.
4.5 Remote Sensing and Precision Agriculture Applications
Technological advances have enabled the integration of Fv/Fm into remote sensing platforms, particularly unmanned aerial vehicles (UAVs) and satellite equipped with multispectral and fluorescence imaging sensors. These systems now facilitate rapid, non-invasive, and large-scale crop monitoring [51]. UAV-based imaging enables quantification of Fv/Fm across entire fields, identifying spatial heterogeneity in photosynthetic performance and detecting zones of abiotic or biotic stress. Wu et al. demonstrated the integration of UAV-derived Fv/Fm with environmental variables to track wheat genotypes in heterogeneous landscapes [5]. Furthermore, Anshori et al. [52] highlighted UAV imaging as part of the “Agri 4.0” toolbox for real-time phenotyping, with Fv/Fm included as a key metric for precision stress diagnostics and crop decision-making. Notably, strong correlations have been observed between UAV-derived Fv/Fm data and physiological stress indices, validating its use in real-time agronomic management and early stress alert systems [53].
Beyond UAVs, satellite remote sensing has emerged as a powerful platform for estimating Fv/Fm at broader spatial and temporal scales. Recent work by Bartold et al. (2024) modeled satellite-derived Fv/Fm using machine learning algorithms trained on satellite imagery and in-situ reference data, achieving accurate estimates of plant stress in inaccessible wetland areas [54]. These advances suggest that satellite-based monitoring of PSII efficiency can complement ground measurements and UAV data in large-scale plant health assessments. Importantly, feature importance analysis in these models reveals that spectral bands in the red (~680–690 nm) and far-red (~730–740 nm) regions—closely associated with solar-induced chlorophyll fluorescence (SIF)—are among the most predictive variables for Fv/Fm estimation. Techniques such as permutation feature importance in random forest models and SHAP (SHapley Additive exPlanations) have been used to confirm that these spectral regions consistently rank among the top predictors. Their high sensitivity to changes in chlorophyll content, energy dissipation, and photoinhibition makes them superior to broadband indices in detecting early physiological stress. Red and far-red bands contribute complementary physiological information: while the red fluorescence peak (~683 nm) reflects photosystem II activity and often saturates under high stress, the far-red peak (~736 nm) remains responsive, enabling more reliable stress detection across a wider range of conditions [55]. The red/far-red fluorescence ratio, derived from these peaks, is a sensitive indicator of chlorophyll degradation and can distinguish between different stress types, including drought, nutrient deficiency, and disease [56].
4.6 Classical Statistical Methods for Fv/Fm Estimation
Prior to the widespread adoption of machine learning, classical regression models played a foundational role in estimating Fv/Fm from remotely sensed and in-situ data. A foundational reference highlights the use of linear regression to model Fv/Fm before the widespread adoption of machine learning. In this study, photon yields were calculated by linear regression from chlorophyll fluorescence data, including Fv/Fm, indicating early statistical modeling of this parameter in plant stress research [57]. Additionally, modern works continue to support the relevance of Fv/Fm as a stress indicator in crops like sugar beet and maize. For example, recent research has identified Fv/Fm as a drought stress marker in maize and sugar beet [11,57,58], and has analyzed photosynthetic responses under heat stress conditions [59]. This underscores that the application of linear regression to Fv/Fm analysis has a well-established precedent in stress physiology, particularly in the era preceding modern machine learning tools.
In summary, the past decade has seen Fv/Fm evolve from a lab-based physiological marker to a field-deployable, high-resolution trait central to modern phenotyping and precision agriculture. Its applications span stress physiology, disease detection, genetic selection, and remote monitoring—positioning it as a pivotal tool for climate-resilient and sustainable plant science.
5 Relationships Between Fv/Fm and Other Physiological or Biochemical Parameters
5.1 Correlation with Photosynthetic Activity and Gas Exchange
The chlorophyll fluorescence parameter Fv/Fm does not operate in isolation. Instead, it is closely linked to a suite of physiological processes and biochemical responses in plants. Fv/Fm exhibits a strong and often linear relationship with net photosynthetic rate (Pn) and stomatal conductance (Gs) under stress conditions. These parameters co-decline under environmental pressures such as heat, drought, and salinity, reflecting reduced carbon assimilation efficiency due to compromised PSII activity. For example, in drought-stressed wheat, declines in Fv/Fm were accompanied by reduced Pn and Gs, underscoring the integral role of PSII efficiency in whole-plant gas exchange [60]. Similarly, studies in tomato have shown that Fv/Fm tightly correlated with changes in electron transport rate and stomatal behavior, particularly under exogenous melatonin treatment [61]. This intervention improved Fv/Fm and simultaneously enhanced stomatal aperture and photosynthetic electron flux, suggesting that PSII recovery under stress can restore gas exchange performance. In Robinia pseudoacacia, elevated CO2 concentrations caused a decrease in Fv/Fm, which was associated with altered stomatal regulation and leaf proteome profiles. This highlights how external carbon flux can also affect photochemical efficiency through stomatal and metabolic interactions [62].
ROS such as hydrogen peroxide (H2O2), superoxide (O2−), and hydroxyl radicals (•OH) are natural metabolic byproducts of photosynthesis and respiration. While low levels serve as signaling molecules in plant growth and development, high ROS concentrations induce oxidative stress and cellular toxicity, damaging lipids, proteins, and DNA. Abiotic stress frequently triggers ROS accumulation such H2O2, which can damage thylakoid membranes and impair PSII function [63]. This oxidative burden results in reduced Fv/Fm values due to photoinhibition and decreased electron transport. In rice under drought stress, data revealed elevated antioxidant enzyme activity and ROS scavenging pathways in genotypes that maintained higher Fv/Fm values—demonstrating a physiological link between ROS detoxification and photoprotection [64]. Furthermore, studies on Stylosanthes exposed to manganese toxicity confirmed that ROS accumulation was negatively associated with Fv/Fm. Plants with impaired ROS defense mechanisms exhibited greater photoinhibition, reinforcing the role of oxidative stress in modulating fluorescence responses [65]. According to Akhter et al. (2021). and Lee et al. (2013), a notable reduction in Fv/Fm was observed in rice and barley under salt stress, concurrent with increased ROS accumulation [66,67]. The study highlighted how PSII damage, due to ionic toxicity and osmotic stress, reduced photosynthetic efficiency, resulting in excessive excitation energy and ROS generation as a byproduct of impaired electron transport chains.
5.3 Integration with Transcriptomics and Proteomics
Omics approaches have greatly enriched our understanding of Fv/Fm as a systems-level marker. Transcriptomic studies indicate that genes involved in photosynthesis, photoprotection, and redox regulation are closely co-expressed with Fv/Fm responses. On the proteomics front, declines in Fv/Fm are associated with reductions in Rubisco content, PSII core proteins, and ATP synthase complexes. A comprehensive study in Robinia revealed that reductions in Fv/Fm under high CO2 were accompanied by changes in proteins involved in energy metabolism and photosynthetic repair [62]. In another case, iTRAQ-based proteomic analysis in arsenic-stressed Brassica napus showed strong correlations between reduced Fv/Fm and downregulation of chloroplast proteins associated with electron transport and photoprotection [68]. Additionally, Rafiq & Fatima highlighted how transcriptomics and proteomics converge to reveal ROS-related gene networks that regulate both photosynthetic capacity and Fv/Fm dynamics under oxidative stress [69].
6 Research Gaps and Controversies
Despite its broad application as a key indicator of PSII efficiency, the Fv/Fm parameter has several limitations and interpretational ambiguities. Its sensitivity is influenced by the type and severity of stress, plant species, and environmental conditions. For example, under moderate drought stress, Fv/Fm may remain unchanged, whereas other parameters like ΦPSII or NPQ might show significant variations [70]. Moreover, factors such as measurement timing and methodology can influence Fv/Fm readings, necessitating standardized protocols for accurate comparisons. Significant declines in Fv/Fm typically occur only under severe stress, such as prolonged drought or heat, resulting from photoinhibition or PSII damage [60,71]. Additionally, considerable interspecific variability exists in baseline Fv/Fm values, influenced by leaf anatomy, chloroplast distribution, and PSII stoichiometry. This variability, compounded by differences in measurement protocols—such as actinic light intensity, dark adaptation duration, and sampling geometry—complicates the application of Fv/Fm as a universal stress diagnostic and calls for species-specific calibration. In terms of spatial and temporal resolution, standard PAM fluorometry captures only point-based data, potentially overlooking spatial heterogeneity in stress responses across leaves or canopies. While chlorophyll fluorescence imaging (CFI) improves spatial resolution, its field application is limited by equipment limitations and ambient light interference. UAV-based remote sensing holds promise for large-scale assessment, although limited spatial resolution can mask localized stress zones. Furthermore, Fv/Fm is subject to diurnal fluctuations and environmental noise, requiring strict measurement standardization to ensure repeatability.
To address these limitations, future research should prioritize the development of standardized, species-adaptive protocols, the integration of Fv/Fm with complementary indicators such as NPQ, as well as electron transport rate (ETR), and antioxidant enzyme activity, and the advancement of imaging technologies capable of high-resolution, real-time diagnostics. In addition, incorporating parameters such as QA reoxidation kinetics, fluorescence lifetime, gas exchange rates, and net photosynthetic assimilation can provide a more comprehensive and quantitative assessment of plant stress responses. Such approaches will be critical for improving the interpretability and predictive power of Fv/Fm in ecological monitoring and stress physiology.
7 Connection to Current and Future Research
As a robust indicator of PSII efficiency, Fv/Fm has been increasingly integrated into high-throughput phenotyping and breeding platforms, aiding in early stress detection and trait selection under abiotic challenges such as drought and salinity. When combined with omics data, Fv/Fm enhances genotype-to-phenotype resolution. Recent advancements in UAV and satellite-based imaging have enabled spatial monitoring of crop health and vegetation performance [54]. The multispectral and RGB images of unmanned aerial vehicles based on the LSSVM model are expected to promote widespread adoption of chlorophyll fluorescence detection in agriculture, ecological monitoring of algae in lakes and oceans. Concurrently, AI and machine learning approaches have enabled real-time stress prediction without dark adaptation, offering scalable solutions for precision agriculture. Beyond crops, Fv/Fm is now applied in ecosystem research across aquatic, arid, and high-altitude environments to assess resilience and productivity under climate stress. However, challenges remain, including inconsistent protocols, species-specific variability, and limited temporal resolution. Addressing these through standardization and sensor innovation will further enhance Fv/Fm’s reliability. Moving forward, dynamic modeling and sensor fusion will transform Fv/Fm from a diagnostic to a predictive tool. In sum, Fv/Fm now serves as a cornerstone of climate-smart plant science, uniting digital agriculture, ecological forecasting, and stress physiology in the face of global environmental change.
Acknowledgement: The authors acknowledge the use of an AI-based text editing tool (ChatGPT) to refine the grammar of this manuscript. All AI-suggested modifications were subsequently reviewed and confirmed by the authors.
Funding Statement: This work was supported by the National Natural Science Foundation of China (32000197, 32200429).
Author Contributions: Qingsong Jiao: Writing—review & editing, Writing—original draft, Project administration, Methodology, Investigation, Data curation, Conceptualization. Xueyun Hu: Writing—review & editing. All authors reviewed the results and approved the final version of the manuscript.
Availability of Data and Materials: All data discussed are derived from previously published sources, which are properly cited in the reference list. No new data were generated for this study.
Ethics Approval: Not applicable.
Conflicts of Interest: The authors declare no conflicts of interest to report regarding the present study.
References
1. Murchie EH, Lawson T. Chlorophyll fluorescence analysis: a guide to good practice and understanding some new applications. J Exp Bot. 2013;64(13):3983–98. doi:10.1093/jxb/ert208. [Google Scholar] [PubMed] [CrossRef]
2. Lichtenthaler HK, Buschmann C, Knapp M. How to correctly determine the different chlorophyll fluorescence parameters and the chlorophyll fluorescence decrease ratio RFd of leaves with the PAM fluorometer. Photosynthetica. 2005;43(3):379–93. doi:10.1007/s11099-005-0062-6. [Google Scholar] [CrossRef]
3. Guidi L, Landi M, Penella C, Calatayud A. Application of modulated chlorophyll fluorescence and modulated chlorophyll fluorescence imaging to study the environmental stress effect. Annali di Botanica. 2016;6:39–56. doi:10.3389/fpls.2021.658500. [Google Scholar] [PubMed] [CrossRef]
4. Faseela P, Sinisha AK, Brestič M, Puthur JT. Chlorophyll a fluorescence parameters as indicators of a particular abiotic stress in rice. Photosynthetica. 2020;58(SI):293–300. doi:10.32615/ps.2019.147. [Google Scholar] [CrossRef]
5. Wu Q, Zhang Y, Xie M, Zhao Z, Yang L, Liu J, et al. Estimation of Fv/Fm in spring wheat using UAV-based multispectral and RGB imagery with multiple machine learning methods. Agronomy. 2023;13(4):1003. doi:10.3390/agronomy13041003. [Google Scholar] [CrossRef]
6. Henriques FS. Leaf chlorophyll fluorescence: background and fundamentals for plant biologists. Bot Rev. 2009;75(3):249–70. doi:10.1007/s12229-009-9035-y. [Google Scholar] [CrossRef]
7. Krause GH, Weis E. Chlorophyll fluorescence as a tool in plant physiology. Photosynth Res. 1984;5(2):139–57. doi:10.1007/BF00028527. [Google Scholar] [PubMed] [CrossRef]
8. Bolhar-Nordenkampf HR, Long SP, Baker NR, Oquist G, Schreiber U, Lechner EG. Chlorophyll fluorescence as a probe of the photosynthetic competence of leaves in the field: a review of current instrumentation. Funct Ecol. 1989;3(4):497. doi:10.2307/2389624. [Google Scholar] [CrossRef]
9. Xia Q, Tang H, Fu L, Tan J, Govindjee G, Guo Y. Determination of Fv/Fm from chlorophyll a fluorescence without dark adaptation by an LSSVM model. Plant Phenomics. 2023;5(4):0034. doi:10.34133/plantphenomics.0034. [Google Scholar] [PubMed] [CrossRef]
10. Ansari HH, Siddiqui A, Wajid D, Tabassum S, Umar M, Siddiqui ZS. Profiling of energy compartmentalization in photosystem II (PSIIlight harvesting complexes and specific energy fluxes of primed maize cultivar (P1429) under salt stress environment. Plant Physiol Biochem. 2022;170(1):296–306. doi:10.1016/j.plaphy.2021.12.015. [Google Scholar] [PubMed] [CrossRef]
11. Jan MF, Li M, Liaqat W, Altaf MT, Liu C, Ahmad H, et al. Chlorophyll fluorescence: a smart tool for maize improvement. Cereal Res Commun. 2025;53(2):617–48. doi:10.1007/s42976-024-00573-9. [Google Scholar] [CrossRef]
12. Abbas A, Yu H, Cui H, Yu H, Li X. Effect of drought stress on chlorophyll fluorescence, and biomass portioning of Aegilops tauschii L. Appl Ecol Env Res. 2019;17(1):1071–82. doi:10.15666/aeer/1701_10711082. [Google Scholar] [CrossRef]
13. Zhori A, Meco M, Brandl H, Bachofen R. In situ chlorophyll fluorescence kinetics as a tool to quantify effects on photosynthesis in Euphorbia cyparissias by a parasitic infection of the rust fungus Uromyces pisi. BMC Res Notes. 2015;8(1):698. doi:10.1186/s13104-015-1681-z. [Google Scholar] [CrossRef]
14. Suárez JC, Vanegas JI, Contreras AT, Anzola JA, Urban MO, Beebe SE, et al. Chlorophyll fluorescence imaging as a tool for evaluating disease resistance of common bean lines in the western Amazon Region of Colombia. Plants. 2022;11(10):1371. doi:10.3390/plants11101371. [Google Scholar] [PubMed] [CrossRef]
15. Cavender-Bares J, Bazzaz FA. From leaves to ecosystems: using chlorophyll fluorescence to assess photosynthesis and plant function in ecological studies. In: Chlorophyll a fluorescence. Dordrecht, The Netherland: Springer; 2004. p. 737–55. doi:10.1007/978-1-4020-3218-9_29. [Google Scholar] [CrossRef]
16. Wingler A, Marès M, Pourtau N. Spatial patterns and metabolic regulation of photosynthetic parameters during leaf senescence. New Phytol. 2004;161(3):781–9. doi:10.1111/j.1469-8137.2004.00996.x. [Google Scholar] [PubMed] [CrossRef]
17. Hussain MI, Reigosa MJ. Allelochemical stress inhibits growth, leaf water relations, PSII photochemistry, non-photochemical fluorescence quenching, and heat energy dissipation in three C3 perennial species. J Exp Bot. 2011;62(13):4533–45. doi:10.1093/jxb/err161. [Google Scholar] [PubMed] [CrossRef]
18. Strasser RJ, Tsimilli-Michael M, Srivastava A. Analysis of the chlorophyll a fluorescence transient. In: Chlorophyll a fluorescence. Dordrecht, The Netherlands: Springer; 2004. p. 321–62. doi:10.1007/978-1-4020-3218-9_12. [Google Scholar] [CrossRef]
19. Ovečka M, von Wangenheim D, Tomančák P, Šamajová O, Komis G, Šamaj J. Multiscale imaging of plant development by light-sheet fluorescence microscopy. Nat Plants. 2018;4(9):639–50. doi:10.1038/s41477-018-0238-2. [Google Scholar] [PubMed] [CrossRef]
20. Cho SM, Lee H, Hong SG, Lee J. Study of ecophysiological responses of the Antarctic fruticose lichen Cladonia borealis using the PAM fluorescence system under natural and laboratory conditions. Plants. 2020;9(1):85. doi:10.3390/plants9010085. [Google Scholar] [PubMed] [CrossRef]
21. Yao J, Sun D, Cen H, Xu H, Weng H, Yuan F, et al. Phenotyping of Arabidopsis drought stress response using kinetic chlorophyll fluorescence and multicolor fluorescence imaging. Front Plant Sci. 2018;9:603. doi:10.3389/fpls.2018.00603. [Google Scholar] [PubMed] [CrossRef]
22. Awlia M, Nigro A, Fajkus J, Schmoeckel SM, Negrão S, Santelia D, et al. High-throughput non-destructive phenotyping of traits that contribute to salinity tolerance in Arabidopsis thaliana. Front Plant Sci. 2016;7(72):1414. doi:10.3389/fpls.2016.01414. [Google Scholar] [CrossRef]
23. Hupp S, Rosenkranz M, Bonfig K, Pandey C, Roitsch T. Noninvasive phenotyping of plant-pathogen interaction: consecutive in situ imaging of fluorescing Pseudomonas syringae, plant phenolic fluorescence, and chlorophyll fluorescence in Arabidopsis leaves. Front Plant Sci. 2019;10:1239. doi:10.3389/fpls.2019.01239. [Google Scholar] [PubMed] [CrossRef]
24. Lauterberg M, Tschiersch H, Zhao Y, Kuhlmann M, Mücke I, Papa R, et al. Implementation of theoretical non-photochemical quenching (NPQ(T)) to investigate NPQ of chickpea under drought stress with High-throughput Phenotyping. Sci Rep. 2024;14(1):13970. doi:10.1038/s41598-024-63372-6. [Google Scholar] [PubMed] [CrossRef]
25. Gopichand. Species specific changes in chlorophyll fluorescence in deciduous and evergreen tree species growing under short rotation high density energy plantation in north-western Himalaya. J Med Plants Stud. 2013;1:41–50. [Google Scholar]
26. Chotikarn P, Pramneechote P, Sinutok S. Photosynthetic responses of freshwater macrophytes to the daily light cycle in songkhla lagoon. Plants. 2022;11(21):2806. doi:10.3390/plants11212806. [Google Scholar] [PubMed] [CrossRef]
27. Zhang Y, Zhang N. Imaging technologies for plant high-throughput phenotyping: a review. Front Agr Sci Eng. 2018. doi:10.15302/j-fase-2018242. [Google Scholar] [CrossRef]
28. Baker NR, Rosenqvist E. Applications of chlorophyll fluorescence can improve crop production strategies: an examination of future possibilities. J Exp Bot. 2004;55(403):1607–21. doi:10.1093/jxb/erh196. [Google Scholar] [PubMed] [CrossRef]
29. Bates H. Development and implementation of high-throughput phenotyping tools for microalgae [Ph.D. thesis]. Sydney, NSW, Australia: University of Technology Sydney; 2020. [Google Scholar]
30. Kovár M, Živčák M, Filaček A, Jasenovská L, Vukelić I, Panković D, et al. High-throughput digital imaging and detection of morpho-physiological traits in tomato plants under drought. Open Agric. 2024;9(1):20220331. doi:10.1515/opag-2022-0331. [Google Scholar] [CrossRef]
31. Tschiersch H, Junker A, Meyer RC, Altmann T. Establishment of integrated protocols for automated high throughput kinetic chlorophyll fluorescence analyses. Plant Methods. 2017;13(1):54. doi:10.1186/s13007-017-0204-4. [Google Scholar] [PubMed] [CrossRef]
32. Bethge HL, Weisheit I, Dortmund MS, Landes T, Zabic M, Linde M, et al. Automated image registration of RGB, hyperspectral and chlorophyll fluorescence imaging data. Plant Methods. 2024;20(1):175. doi:10.1186/s13007-024-01296-y. [Google Scholar] [PubMed] [CrossRef]
33. McAusland L, Atkinson JA, Lawson T, Murchie EH. High throughput procedure utilising chlorophyll fluorescence imaging to phenotype dynamic photosynthesis and photoprotection in leaves under controlled gaseous conditions. Plant Methods. 2019;15(1):109. doi:10.1186/s13007-019-0485-x. [Google Scholar] [PubMed] [CrossRef]
34. Wang L, He P, Hui M, Li H, Sun A, Yin H, et al. Metabolomics combined with transcriptomics and physiology reveals the regulatory responses of soybean plants to drought stress. Front Genet. 2024;15:1458656. doi:10.3389/fgene.2024.1458656. [Google Scholar] [PubMed] [CrossRef]
35. Zolin Y, Popova A, Yudina L, Grebneva K, Abasheva K, Sukhov V, et al. RGB indices can be used to estimate NDVI, PRI, and Fv/Fm in wheat and pea plants under soil drought and salinization. Plants. 2025;14(9):1284. doi:10.3390/plants14091284. [Google Scholar] [PubMed] [CrossRef]
36. Dabrowska-Zielinska K, Bochenek Z, Malinska A, Bartold M, Gurdak R, Lagiewska M, et al. Drought assessment applying joined meteorological and satellite data. In: 2021 IEEE International Geoscience and Remote Sensing Symposium (IGARSS); 2021 Jul 11–16; Brussels, Belgium. p. 6591–4. doi:10.1109/igarss47720.2021.9553739. [Google Scholar] [CrossRef]
37. Bhardwaj A, Kaur S, Padhiar D, Nayyar H. Phenotyping for heat tolerance in food crops. Plant Physiol Rep. 2024;29(4):736–48. doi:10.1007/s40502-024-00833-0. [Google Scholar] [CrossRef]
38. Amombo E, Gbibar M, Ashilenje DS, Hirich A, Kouisni L, Oukarroum A, et al. Screening for genetic variability in photosynthetic regulation provides insights into salt performance traits in forage sorghum under salt stress. BMC Plant Biol. 2024;24(1):690. doi:10.1186/s12870-024-05406-9. [Google Scholar] [PubMed] [CrossRef]
39. Arya S, Sahoo RN, Sehgal VK, Bandyopadhyay K, Rejith RG, Chinnusamy V, et al. High-throughput chlorophyll fluorescence image-based phenotyping for water deficit stress tolerance in wheat. Plant Physiol Rep. 2024;29(2):278–93. doi:10.1007/s40502-024-00783-7. [Google Scholar] [CrossRef]
40. Salopek Sondi B. Chlorophyll a fluorescence measurements in Croatia • the first twenty years. Acta Bot Croat. 2024;83(2):179–80. [Google Scholar]
41. Cséfalvay L, Di Gaspero G, Matouš K, Bellin D, Ruperti B, Olejníčková J. Pre-symptomatic detection of Plasmopara viticola infection in grapevine leaves using chlorophyll fluorescence imaging. Eur J Plant Pathol. 2009;125(2):291–302. doi:10.1007/s10658-009-9482-7. [Google Scholar] [CrossRef]
42. Sun D, Wang Q. Linear relationships between photosynthetic rate and photochemical energy expressed by PAR × Fv/Fm. Am J Plant Sci. 2018;9(2):125–38. doi:10.4236/ajps.2018.92011. [Google Scholar] [CrossRef]
43. Perez-Priego O, Guan J, Rossini M, Fava F, Wutzler T, Moreno G, et al. Sun-induced chlorophyll fluorescence and photochemical reflectance index improve remote-sensing gross primary production estimates under varying nutrient availability in a typical Mediterranean savanna ecosystem. Biogeosciences. 2015;12(21):6351–67. doi:10.5194/bg-12-6351-2015. [Google Scholar] [CrossRef]
44. Zait Y, Shemer OE, Cochavi A. Dynamic responses of chlorophyll fluorescence parameters to drought across diverse plant families. Physiol Plant. 2024;176(5):e14527. doi:10.1111/ppl.14527. [Google Scholar] [PubMed] [CrossRef]
45. Yang X, Tang J, Mustard JF, Lee JE, Rossini M, Joiner J, et al. Solar-induced chlorophyll fluorescence that correlates with canopy photosynthesis on diurnal and seasonal scales in a temperate deciduous forest. Geophys Res Lett. 2015;42(8):2977–87. doi:10.1002/2015gl063201. [Google Scholar] [CrossRef]
46. Nichol CJ, Drolet G, Porcar-Castell A, Wade T, Sabater N, Middleton EM, et al. Diurnal and seasonal solar induced chlorophyll fluorescence and photosynthesis in a boreal scots pine canopy. Remote Sens. 2019;11(3):273. doi:10.3390/rs11030273. [Google Scholar] [CrossRef]
47. Zarco-Tejada PJ, Catalina A, González MR, Martín P. Relationships between net photosynthesis and steady-state chlorophyll fluorescence retrieved from airborne hyperspectral imagery. Remote Sens Environ. 2013;136(3):247–58. doi:10.1016/j.rse.2013.05.011. [Google Scholar] [CrossRef]
48. Kim M, Lee C, Hong S, Kim SL, Baek JH, Kim KH. High-throughput phenotyping methods for breeding drought-tolerant crops. Int J Mol Sci. 2021;22(15):8266. doi:10.3390/ijms22158266. [Google Scholar] [PubMed] [CrossRef]
49. Mansoor S, Chung YS. Functional phenotyping: understanding the dynamic response of plants to drought stress. Curr Plant Biol. 2024;38(1):100331. doi:10.1016/j.cpb.2024.100331. [Google Scholar] [CrossRef]
50. Elfanah AMS, Darwish MA, Selim AI, Elmoselhy OMA, Ali AM, El-Maghraby MA, et al. Hyperspectral reflectance and agro-physiological traits for field identification of salt-tolerant wheat genotypes using the genotype by yield*trait biplot technique. Front Plant Sci. 2023;14:1165113. doi:10.3389/fpls.2023.1165113. [Google Scholar] [PubMed] [CrossRef]
51. Feng W, Lan Y, Zhao H, Tang Z, Peng W, Che H, et al. Identification of high-photosynthetic-efficiency wheat varieties based on multi-source remote sensing from UAVs. Agronomy. 2024;14(10):2389. doi:10.3390/agronomy14102389. [Google Scholar] [CrossRef]
52. Anshori MF, Dirpan A, Sitaresmi T, Rossi R, Farid M, Hairmansis A, et al. An overview of image-based phenotyping as an adaptive 4.0 technology for studying plant abiotic stress: a bibliometric and literature review. Heliyon. 2023;9(11):e21650. doi:10.1016/j.heliyon.2023.e21650. [Google Scholar] [PubMed] [CrossRef]
53. Al-Tamimi N, Langan P, Bernád V, Walsh J, Mangina E, Negrão S. Capturing crop adaptation to abiotic stress using image-based technologies. Open Biol. 2022;12(6):210353. doi:10.1098/rsob.210353. [Google Scholar] [PubMed] [CrossRef]
54. Bartold M, Kluczek M. Estimating of chlorophyll fluorescence parameter Fv/Fm for plant stress detection at peatlands under Ramsar Convention with Sentinel-2 satellite imagery. Ecol Inform. 2024;81:102603. doi:10.1016/j.ecoinf.2024.102603. [Google Scholar] [CrossRef]
55. Joiner J, Yoshida Y, Guanter L, Middleton EM. New methods for the retrieval of chlorophyll red fluorescence from hyperspectral satellite instruments: simulations andapplication to GOME-2 and SCIAMACHY. Atmos Meas Tech. 2016;9(8):3939–67. doi:10.5194/amt-9-3939-2016. [Google Scholar] [CrossRef]
56. Buschmann C. Variability and application of the chlorophyll fluorescence emission ratio red/far-red of leaves. Photosynth Res. 2007;92(2):261–71. doi:10.1007/s11120-007-9187-8. [Google Scholar] [PubMed] [CrossRef]
57. Morales F, Abadía A, Abadía J. Chlorophyll fluorescence and photon yield of oxygen evolution in iron-deficient sugar beet (Beta vulgaris L.) leaves. Plant Physiol. 1991;97(3):886–93. doi:10.1104/pp.97.3.886. [Google Scholar] [PubMed] [CrossRef]
58. Chiango H, Figueiredo A, Sousa L, Sinclair T, da Silva JM. Assessing drought tolerance of traditional maize genotypes of Mozambique using chlorophyll fluorescence parameters. S Afr N J Bot. 2021;138(3):311–7. doi:10.1016/j.sajb.2021.01.005. [Google Scholar] [CrossRef]
59. Prysiazhniuk O, Kononiuk N, Zatserkovna N, Chynchyk O, Hryhoriev V, Zhemoyda V, et al. The study of drought stress in sugar beet and the ways of its minimization. Ecol Eng Environ Technol. 2023;24(1):256–63. doi:10.12912/27197050/154924. [Google Scholar] [CrossRef]
60. Sommer SG, Han E, Li X, Rosenqvist E, Liu F. The chlorophyll fluorescence parameter Fv/Fm correlates with loss of grain yield after severe drought in three wheat genotypes grown at two CO2 concentrations. Plants. 2023;12(3):436. doi:10.3390/plants12030436. [Google Scholar] [PubMed] [CrossRef]
61. Jensen NB, Ottosen CO, Zhou R. Exogenous melatonin alters stomatal regulation in Toma to seedlings subjected to combined heat and drought stress through mechanisms distinct from ABA signaling. Plants. 2023;12(5):1156. doi:10.3390/plants12051156. [Google Scholar] [PubMed] [CrossRef]
62. Li J, Zhang S, Lei P, Guo L, Zhao X, Meng F. Physiological and proteomic responses of the tetraploid Robinia pseudoacacia L. to high CO2 levels. Int J Mol Sci. 2024;25(10):5262. doi:10.3390/ijms25105262. [Google Scholar] [PubMed] [CrossRef]
63. Nishiyama Y, Yamamoto H, Allakhverdiev SI, Inaba M, Yokota A, Murata N. Oxidative stress inhibits the repair of photodamage to the photosynthetic machinery. EMBO J. 2001;20(20):5587–94. doi:10.1093/emboj/20.20.5587. [Google Scholar] [PubMed] [CrossRef]
64. Yang PM, Huang QC, Qin GY, Zhao SP, Zhou JG. Different drought-stress responses in photosynthesis and reactive oxygen metabolism between autotetraploid and diploid rice. Photosynthetica. 2014;52(2):193–202. doi:10.1007/s11099-014-0020-2. [Google Scholar] [CrossRef]
65. Liu P, Huang R, Hu X, Jia Y, Li J, Luo J, et al. Physiological responses and proteomic changes reveal insights into Stylosanthes response to manganese toxicity. BMC Plant Biol. 2019;19(1):212. doi:10.1186/s12870-019-1822-y. [Google Scholar] [PubMed] [CrossRef]
66. Salim Akhter M, Noreen S, Mahmood S, Athar HUR, Ashraf M, Abdullah Alsahli A, et al. Influence of salinity stress on PSII in barley (Hordeum vulgare L.) genotypes, probed by chlorophyll-a fluorescence. J King Saud Univ Sci. 2021;33(1):101239. doi:10.1016/j.jksus.2020.101239. [Google Scholar] [CrossRef]
67. Lee MH, Cho EJ, Wi SG, Bae H, Kim JE, Cho JY, et al. Divergences in morphological changes and antioxidant responses in salt-tolerant and salt-sensitive rice seedlings after salt stress. Plant Physiol Biochem. 2013;70:325–35. doi:10.1016/j.plaphy.2013.05.047. [Google Scholar] [PubMed] [CrossRef]
68. Farooq MA, Hong Z, Islam F, Noor Y, Hannan F, Zhang Y, et al. Comprehensive proteomic analysis of arsenic induced toxicity reveals the mechanism of multilevel coordination of efficient defense and energy metabolism in two Brassica napus cultivars. Ecotoxicol Environ Saf. 2021;208(1):111744. doi:10.1016/j.ecoenv.2020.111744. [Google Scholar] [PubMed] [CrossRef]
69. Rafiq H, Fatima J. Plant transcriptomics and proteomics study in relation to hydrogen peroxide. In: Hydrogen peroxide. Boca Raton, FL, USA: CRC Press; 2025. p. 159–75. doi:10.1201/9781032647692-11. [Google Scholar] [CrossRef]
70. Wang Q, Bai H, Zada A, Jiao Q. DORN1 is involved in drought stress tolerance through a Ca2+-dependent pathway. Int J Mol Sci. 2022;23(22):14213. doi:10.3390/ijms232214213. [Google Scholar] [PubMed] [CrossRef]
71. Zhou R, Yu X, Kjær KH, Rosenqvist E, Ottosen CO, Wu Z. Screening and validation of tomato genotypes under heat stress using Fv/Fm to reveal the physiological mechanism of heat tolerance. Environ Exp Bot. 2015;118:1–11. doi:10.1016/j.envexpbot.2015.05.006. [Google Scholar] [CrossRef]
Cite This Article
 Copyright © 2025 The Author(s). Published by Tech Science Press.
This work is licensed under a Creative Commons Attribution 4.0 International License , which permits unrestricted use, distribution, and reproduction in any medium, provided the original work is properly cited.
 Downloads
 Citation Tools