
 Submit a Paper
 Propose a Special lssue
 Open Access
ARTICLE

Physiological and Metabolic Responses of Red Leaf Lettuce (Lactuca sativa L.) under Low Pressure Conditions
Graduate Student, Department of Horticulture Science, Chungnam National University, Daejeon, 34134, Republic of Korea
* Corresponding Author: Jongseok Park. Email:
(This article belongs to the Special Issue: Metabolic Mechanisms of Plant Responses to Stress)
Phyton-International Journal of Experimental Botany 2026, 95(1), 5 https://doi.org/10.32604/phyton.2026.073450
Received 18 September 2025; Accepted 04 January 2026; Issue published 30 January 2026
 View Full Text
 Download PDF
Abstract
Understanding plant responses under low-pressure conditions is important for developing closed cultivation systems that simulate space environments. This study aimed to assess the effects of different pressure levels on growth, photosynthesis, and secondary metabolite accumulation in red leaf lettuce (Lactuca sativa L. var. ‘Super Caesar’s Red’). Plants were cultivated for three weeks in sealed chambers under 101 kPa (atmospheric pressure), 66 kPa (moderate low pressure), and 33 kPa (severe low pressure). Growth analysis showed that leaf length and leaf area decreased significantly with reduced pressure, while chlorophyll content and SPAD values increased gradually. Photosynthetic measurements indicated lower transpiration and stomatal conductance under low pressure relative to atmospheric conditions, consistent with reduced stomatal size and density observed by SEM. Secondary metabolite analysis showed strong induction of anthocyanins (41.3% at 66 kPa and 190.8% at 33 kPa), with significant increases in phenolic and flavonoid contents. Thus, low-pressure conditions may suppress morphological growth but promote secondary metabolite contents, offering potential advantages for quality-oriented cultivation strategies. This study provides fundamental insights into physiological adaptation under low pressure and practical implications for crop selection and management in space agriculture and other controlled environments.Keywords
With the expansion of human space exploration, research on Controlled Ecological Life Support Systems (CELSS) has been actively conducted by major space agencies including NASA and the European Space Agency (ESA) since the 1980s [1,2]. These systems serve as fundamental technology for long-term human survival during space missions or in extraterrestrial habitats, enabling self-sufficiency in food production and life support elements through resource recycling. To achieve food self-sufficiency on the International Space Station (ISS), the lunar surface, and eventually Mars and other extraterrestrial locations, systems capable of resource recycling are required [3,4]. Plants can perform various functions including food production, oxygen generation, carbon dioxide removal, water purification, and waste recycling, making them essential biological components for sustainable life support in space environments [5,6]. However, closed growth systems generally must operate under constraints of limited space and energy resources, making lightweight construction and minimized energy consumption important design considerations [7]. The atmospheric pressure on the lunar surface is approximately 10−12 times that of Earth’s atmospheric pressure, while Mars has an atmospheric pressure of about 0.6 kPa, only 0.6% of Earth’s atmospheric pressure (101 kPa). Although direct crop cultivation in such extremely low-pressure environments is practically infeasible, closed plant production systems within space habitats can operate at moderately reduced pressure conditions (30–54 kPa) lower than Earth’s atmospheric pressure, thereby offering engineering advantages such as reduced structural mass, improved energy efficiency, and decreased risk of gas leakage [8]. Therefore, strategies utilizing low-pressure environments (hypobaria) have been proposed as useful alternatives in terms of energy conservation and gas composition control [9]. Low-pressure environments induce complex physiological stress that differs from typical Earth conditions. Specifically, decreased air density promotes stomatal opening, leading to increased water loss through transpiration, while simultaneously reduced oxygen partial pressure triggers hypoxic responses [8]. Although low pressure enhances gas diffusion coefficients, it proportionally reduces absolute CO2 concentration while altering boundary layer resistance, thereby affecting CO2 diffusion from atmosphere to chloroplasts [10]. Such stress responses go beyond simple growth modifications, causing complex effects on diverse physiological, metabolic, and developmental processes such as photosynthesis, gas exchange, and secondary metabolite synthesis [11,12,13]. Some studies have reported that while biomass partially decreased under various low-pressure conditions, the biosynthesis of functional metabolites such as phenolic compounds and anthocyanins was induced, and plant antioxidant capacity was enhanced [10]. Additionally, experiments with wheat and lettuce demonstrated that crop growth was enhanced under low-pressure conditions [14], suggesting that growth responses may vary according to cultivar and cultivation practices. Given these complex physiological responses under low-pressure conditions, selecting appropriate crop species and understanding their adaptive mechanisms are critical for successful implementation of low-pressure cultivation systems in space agriculture.
For practical application of such systems, crop selection must consider both physiological adaptability and nutritional value. Packaged foods currently consumed by astronauts show reduced levels of essential nutrients including vitamins B1 and C below recommended intakes during extended storage, while nutrients such as vitamins D, K, potassium, and calcium are insufficient even before storage [15]. Furthermore, prolonged intake results in issues such as menu fatigue, muscle atrophy, immune suppression, and increased cardiovascular disease risk, requiring fresh food supply systems to meet nutritional supplementation and dietary diversity needs [16,17]. Lettuce is considered a suitable crop for plant experiments in space environments as a functional leafy vegetable rich in vitamins A, C, and K, major minerals such as potassium, iron, and magnesium, and antioxidants including phenolic compounds [18,19]. Moreover, lettuce can be quickly harvested within 30–60 days due to its short growth cycle and provides cultivation convenience through high space efficiency [19]. According to comprehensive evaluation studies for space crop selection, lettuce has been proven suitable as a space crop, scoring highly in palatability, cultivability, and productivity [20]. Lettuce also achieved the highest Crop Readiness Level (CRL) ratings of 8–9 in NASA’s space crop evaluation system, reflecting successful completion of full cultivation cycles from planting to consumption in the ISS Veggie program [21]. Among the lettuce cultivars, red-leaf lettuce is particularly notable for its high levels of functional compounds such as anthocyanins, which possess strong antioxidant activity [22,23]. In this study, we specifically selected the red-leaf lettuce cultivar ‘Super Caesar’s Red’, which has higher anthocyanin and phenolic contents compared with green cultivars. These functional compounds not only contribute to human health benefits but also serve as metabolic indicators of plant responses to various environmental stresses such as light conditions, drought, and low pressure [23]. Despite its proven suitability for space cultivation [21], comprehensive understanding of lettuce responses under low-pressure conditions remains limited. Most previous research on low-pressure plant cultivation [8,10,11] has provided valuable insights but typically employed short-term treatments or the evaluation of specific physiological parameters. Therefore, to address this knowledge gap, we conducted a three-week cultivation experiment in sealed low-pressure chambers to investigate the effects of low pressure conditions on lettuce development during the vegetative stage. We performed integrated analyses of growth parameters, photosynthetic performance, and secondary metabolite accumulation, while employing scanning electron microscopy (SEM) to examine stomatal microstructure. This approach enabled us to clarify not only morphological changes but also the physiological adaptation mechanisms related to gas exchange patterns. Such a comprehensive analysis provides a scientific basis for evaluating crop growth stability and quality enhancement potential in closed space cultivation systems, thereby contributing fundamental data for future space agriculture and extreme environment farming applications.
2.1 Plant Material and Environmental Conditions
Red-leaf lettuce (Lactuca sativa L. var. ‘Super Caesar’s Red’) was used as the experimental plant material, and seeds were purchased from Asia Seed Co., Ltd. (Seoul, Korea). Seeds were sown in rockwool plugs (AO plug, Grodan, Roermond, The Netherlands) and seedlings were cultivated in 105-cell trays. The seedling cultivation environment was maintained using LED lighting (H22P, APACK Inc., Korea) with a PPFD of 200 μmol·m−2·s−1 and a photoperiod of 16/8 h (light/dark). Temperature was maintained at 24 ± 1°C and relative humidity at 60% for 3 weeks of growth. After this period, 12 seedlings with uniform growth were selected and transplanted to rockwool cubes (Rockwool cube, Grodan, Roermond, The Netherlands) in the experimental chambers. Yamazaki nutrient solution was used for irrigation, adjusted to pH 6.5 and EC 1.5 dS·m−1. Rockwool cubes were fully saturated by immersion in the nutrient solution prior to transplanting. To prevent rapid humidity increase from substrate evaporation, rockwool cubes were wrapped with plastic film.
The low-pressure chamber was a sealed acrylic structure (30 mm thickness) with dimensions of 400 mm (L) × 400 mm (W) × 450 mm (H), equipped with three side valves for gas exchange and a detachable top cover (Fig. 1). Plants were cultivated for 3 weeks with planting distance of 100 mm and LED-to-canopy distance of 550 mm. Light intensity was set at 160 μmol·m−2·s−1 with 12/12 h photoperiod, and temperature was controlled at 25°C (day) and 20°C (night). Relative humidity was passively managed by replacing calcium chloride desiccants to maintain levels below 80%. Ethylene absorbers (WiseSorbent Technology, LLC, Marlton, NJ) were placed to prevent premature senescence. Environmental data (CO2, pressure, temperature, humidity) were collected at 1-min intervals using sensors (IBS-TH3 and IAM-T1, Inkbird Tech Co., Ltd., Shenzhen, China) (Fig. 2a–d).
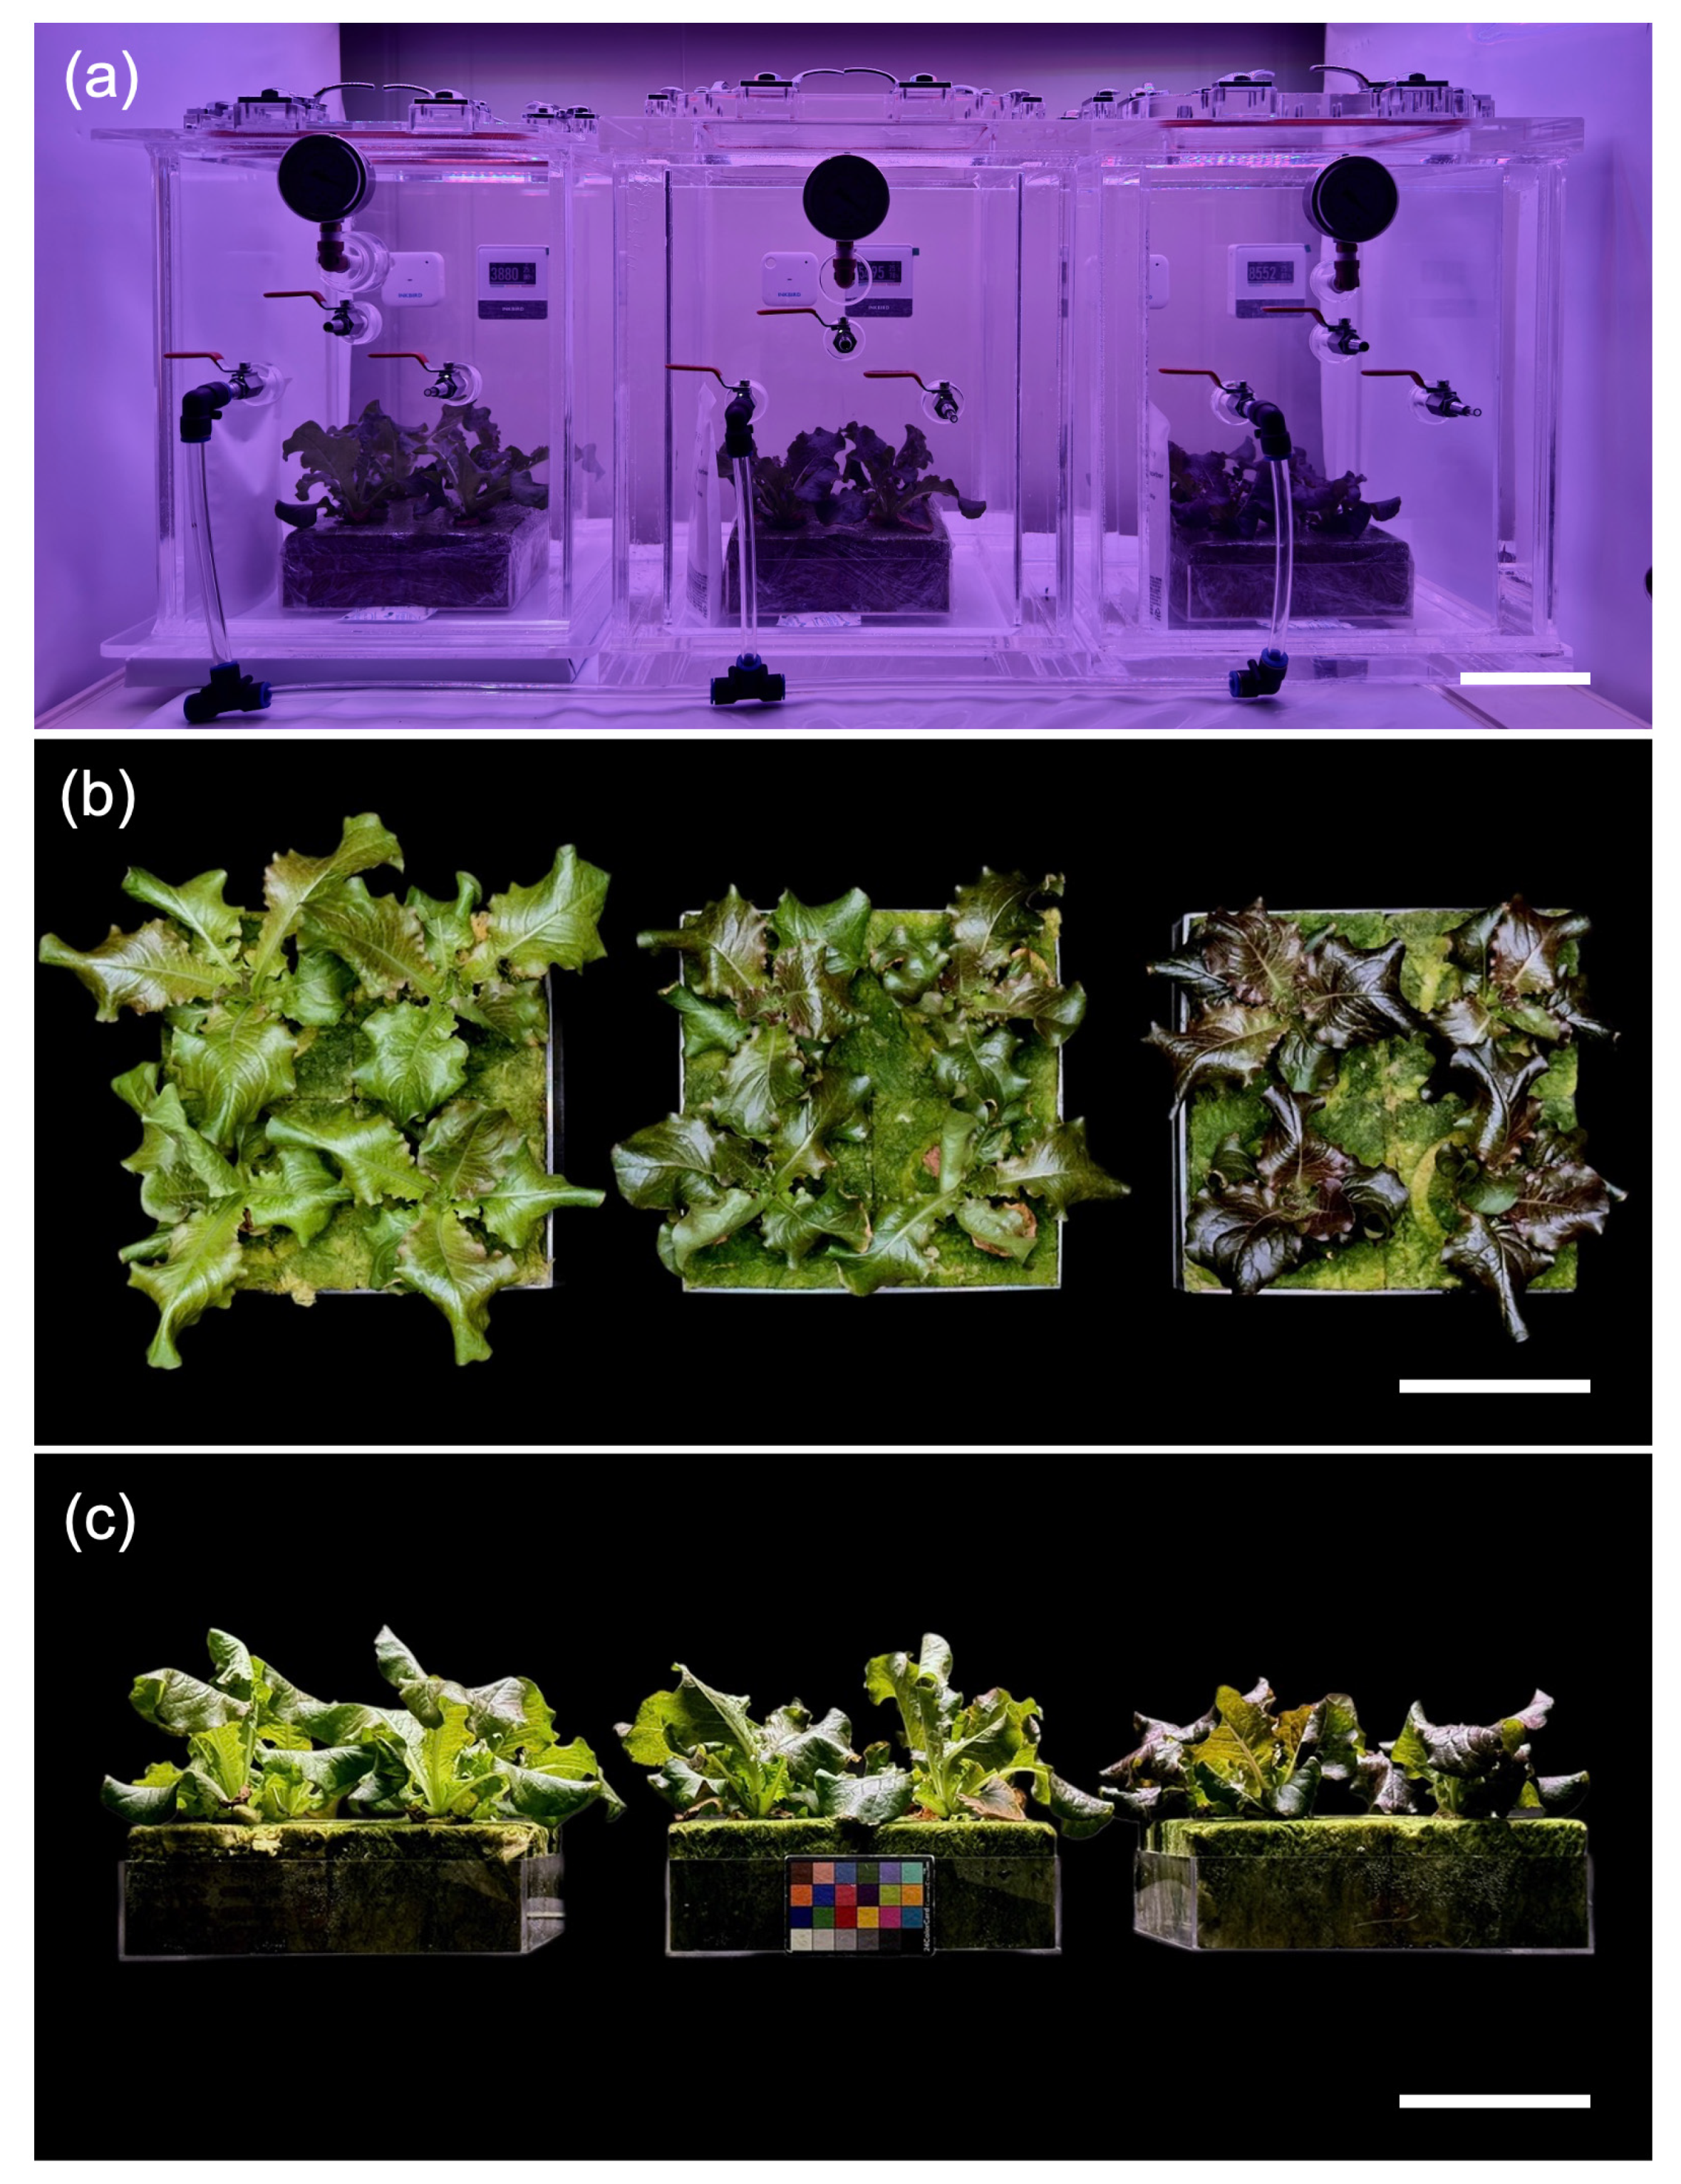
Figure 1: Growth images of red leaf lettuce under three different pressure conditions for 3 weeks: atmospheric pressure (101 kPa), moderate low pressure (66 kPa), and severe low pressure (33 kPa) from left to right in each panel. (a). Overview of plants growing inside the low-pressure chamber. (b). Top-view photographs showing the overall morphology and canopy size after 3 weeks of growth. (c). Side-view photographs illustrating plant height and leaf orientation. Scale bar = 10 cm.
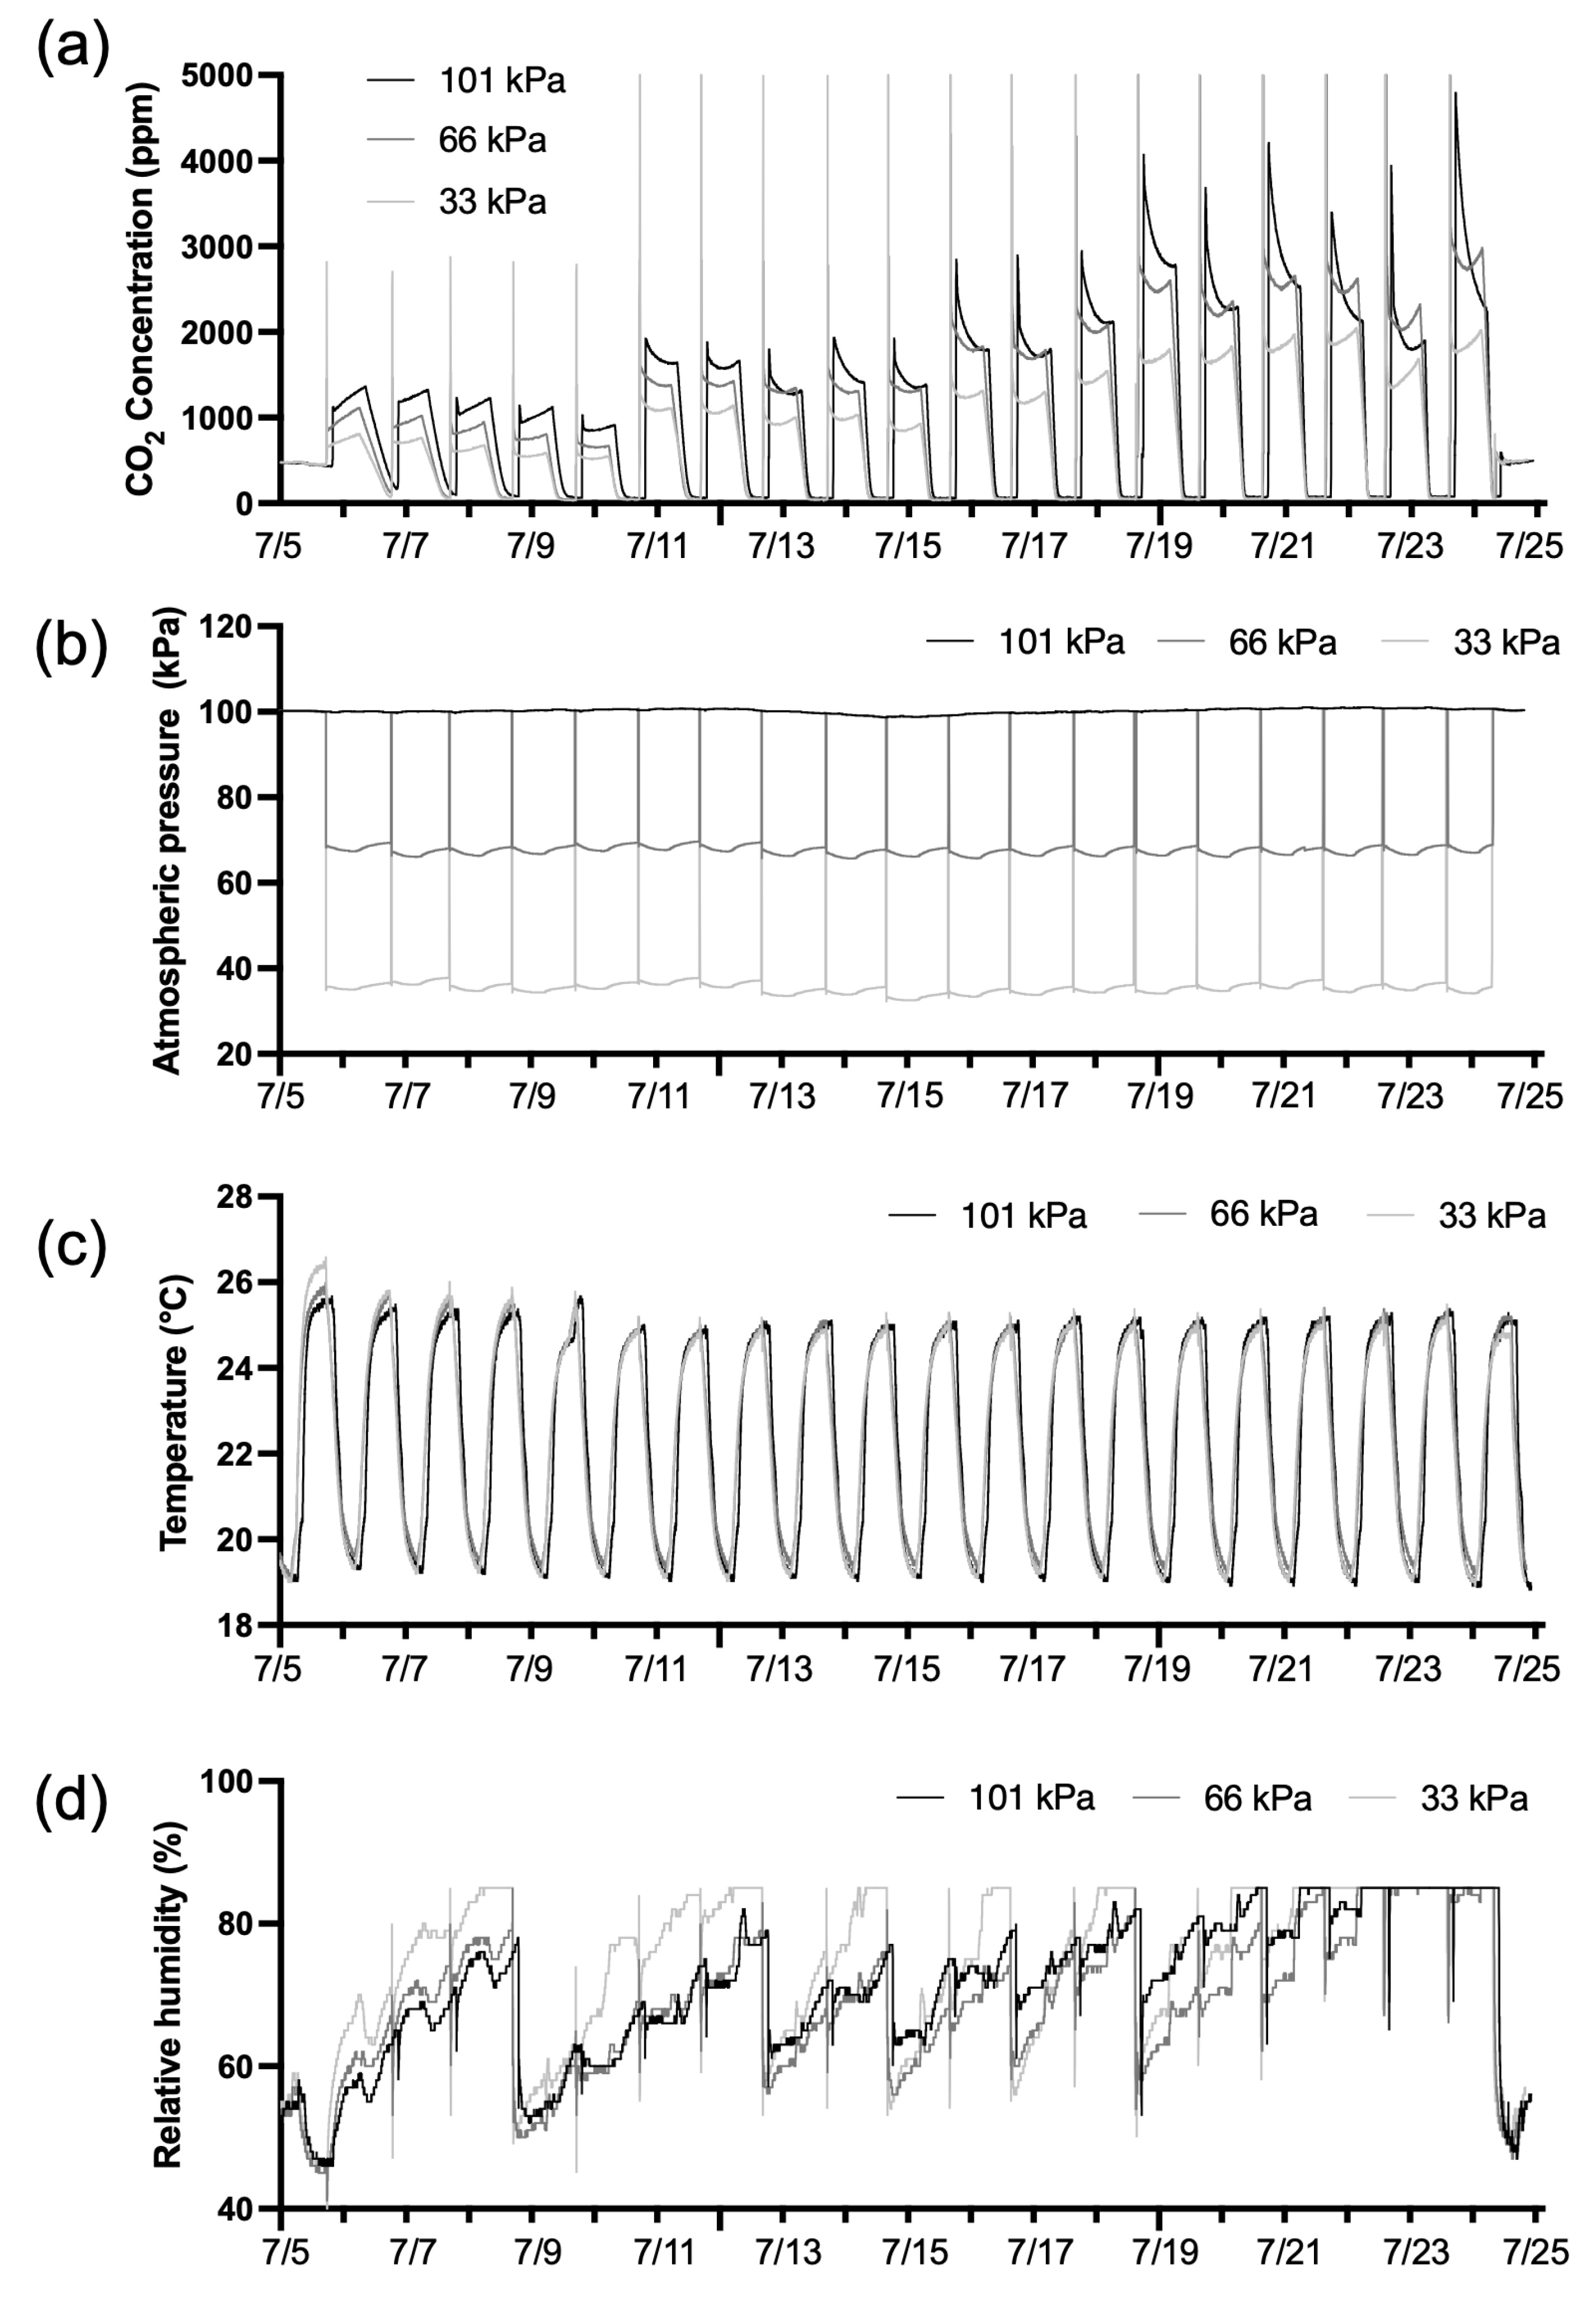
Figure 2: Environmental conditions in the low-pressure chamber under different pressure treatments for 3 weeks. (a). CO2 concentration. (b). Chamber pressure. (c). Air temperature. (d). Relative humidity, which was measured up to 85% due to the sensor’s measurement limit.
Lettuce was cultivated under three pressure conditions: 101 kPa (atmospheric control), 66 kPa (moderate low pressure), and 33 kPa (severe low pressure). CO2 concentration was progressively increased according to plant growth stage: 1000 ppm (days 1–5), 2000 ppm (days 6–10), 3000 ppm (days 11–20), supplied daily via syringe injection after complete ventilation. For low-pressure treatments, CO2 injection volumes were adjusted according to Eq. (1) to ensure equivalent CO2 mass across all treatments despite reduced partial pressure:
2.3 Photosynthetic Parameter Measurements
Gas exchange parameters related to photosynthesis were measured with a portable photosynthesis analyzer (Li-6800; Li-Cor Corporation, Lincoln, NE, USA). Three weeks after transplanting, fully expanded mature leaves from each treatment group (n = 4 per treatment) were secured in 3 × 3 cm chambers and measured before harvest. Since the LI-6800 system cannot operate under reduced pressure conditions, all measurements were completed within approximately 20 min after removing the plants from the low-pressure chamber. To minimize diurnal variation associated with circadian rhythms, all samples were measured between 1:00 PM and 2:00 PM. During measurements, photosynthetic photon flux density (PPFD) was set at 200 μmol m−2 s−1, light quality at R:B = 7:3, and reference CO2 concentration at 500 μmol mol−1, while leaf temperature was maintained at 24.5°C and relative humidity at 60%. The main physiological parameters measured included net photosynthetic rate (A), stomatal conductance (gsw), transpiration rate (E), and intercellular CO2 concentration (Ci). Finally, water use efficiency (WUE) at the moment of measurement was determined based on the net photosynthetic rate and transpiration rate measurements.
3 weeks after transplanting, 4 plants from each treatment group were harvested for growth measurements (n = 4). The growth parameters measured included leaf length, leaf width, leaf number, leaf area, root diameter, fresh weight, and dry weight. Leaf length and width were measured using a ruler, while root diameter was measured with vernier calipers. Shoot fresh weight and dry weight were measured using an electronic balance (MW-2N, CAS Co., Ltd., Korea), while leaf number and leaf area were measured using a leaf area meter (Li-3100C, Li-Cor Corporation, Lincoln, NE, USA).
To analyze the distribution, morphology, and size of stomata, 3 leaf samples from each treatment group were observed using field emission scanning electron microscopy (FE-SEM; S-8230, Hitachi High-Tech Corp., Tokyo, Japan). Fully mature leaves were selected from freeze-dried lettuce leaves of each treatment group, and 10 mm × 10 mm sized samples were obtained from consistent locations excluding leaf veins. The samples were attached to aluminum stubs with carbon tape and then sputter-coated with metal under high vacuum. Stomatal distribution and density were observed using low magnification (×200, FOV = 640 × 480 μm), while detailed structure and morphology of individual stomata were analyzed in selected samples using high magnification (×2000, FOV = 64.0 × 48.0 μm). All imaging was performed under consistent conditions with accelerating voltage (Vacc) = 10.00 kV and working distance (WD) = 10.7 mm. Stomatal parameters including density, size, and abnormal morphology distribution were analyzed using ImageJ software (National Institutes of Health, Bethesda, MD, USA) on the captured images. For stomatal density quantification, all visible stomata in each low magnification image (×200) were manually counted, and density was calculated as the number of stomata per unit area (stomata·mm−2) based on the known field of view area. A total of ten images per treatment were analyzed for statistical reliability. Stomatal length was measured based on the major axis of guard cells.
Chlorophyll contents analysis was performed using both non-destructive SPAD measurement and destructive spectrophotometric analysis with 6 replicates per treatment. For non-destructive measurement of chlorophyll contents, leaves were measured before harvest using a SPAD meter (SPAD 502, Minolta, Japan). Spectrophotometric analysis was conducted using a modified version of the method described in [24]. Samples were first rapidly frozen in liquid nitrogen, followed by complete drying using a freeze dryer (TFD5503, ILshin Biobase Co., Ltd., Korea), and then ground into fine powder for analytical use. 20 mg of powdered sample was extracted with 2 mL of 90% methanol using ultrasonic treatment for 20 min, then centrifuged at 2000 rpm for 10 min. The supernatant was dispensed into 96-well plates (SPL30096, SPL., Korea) in 200 μL aliquots, and absorbance of chlorophyll a, chlorophyll b, and carotenoids was measured at 652.4, 665.2, and 470 nm using a microplate spectrophotometer (Epoch Microplate Spectrophotometer, Sulimscience, Korea). The contents of chlorophyll and carotenoids was determined according to the equations below:
2.7 Total Anthocyanin Contents Analysis
Among secondary metabolites, total anthocyanin contents (TAC) were measured using a modified version of the method described in [25] with 6 replicates per treatment. In 2 mL tubes, 20 mg of sample was mixed with 2 mL of 90% MeOH and extracted by sonication at 40°C with medium intensity for 60 min. The samples were then centrifuged at 15,000 rpm and 4°C for 10 min to collect the supernatant. Finally, absorbance was measured at 530 and 600 nm and calculated using the following equation.
2.8 Total Phenolic Contents Analysis
Among secondary metabolites, total phenolic contents (TPC) were measured using a modified version of the method described in [26] with 6 replicates per treatment. The content of samples was calculated through standard calibration curve method using gallic acid (G7384-100G, Sigma-Aldrich, St. Louis, MO, USA) as the standard material. 100 μL of supernatant was mixed with 100 μL of Folin-Ciocalteu reagent (F9252-100ML, Sigma-Aldrich, St. Louis, MO, USA) and 1500 μL of distilled water in a 2 mL tube and reacted for 5 min. Subsequently, 300 μL of 7.5% Na2CO3 solution was added and reacted at room temperature for 40 min. Finally, absorbance was measured at 765 nm, and the content values were calculated by substituting into a standard curve (y = ax + b) using gallic acid.
2.9 Total Flavonoid Contents Analysis
Among secondary metabolites, Total flavonoid contents (TFC) were measured using a modified Aluminum Chloride Colorimetric Method in [27] with 6 replicates per treatment. The contents of samples was calculated through standard calibration curve method using quercetin (Q4951-10G, Sigma-Aldrich, St. Louis, MO, USA) as the standard material. 20 mg of sample and 2 mL of 90% MeOH were placed in a 2 mL tube and extracted for 20 min using medium-intensity sonication at 20°C. The supernatant was extracted by centrifugation under conditions of 15,000 rpm, 4°C, for 10 min, then 100 μL supernatant, 300 μL of 95% EtOH, 20 μL of 10% AlCl3, 20 μL of 1 M potassium acetate, and 600 μL of distilled water were combined in a 2 mL tube and allowed to react for 40 min at room temperature. Finally, absorbance was measured at 415 nm and content values were calculated by substituting into a standard curve (y = ax + b) using quercetin.
Statistical analysis of the measured data was conducted using GraphPad Prism (version 9, GraphPad Software, San Diego, CA, USA). Analysis of variance (ANOVA) followed by Tukey’s honestly significant difference (HSD) test was used to assess the significance of the differences among treatment means at a significance level of p < 0.05. The number of biological replicates varied according to the measurement type and practical constraints: growth and photosynthetic parameters were analyzed with four replicates (n = 4) due to the limited size of the low pressure chambers; chlorophyll content and secondary metabolite analyses used six replicates (n = 6) to account for the inherent biochemical variability in plant tissues; and stomatal traits were assessed with ten replicates (n = 10) due to the high microscale variation in stomatal characteristics and the relative ease of collecting multiple measurements from different leaf areas.
3.1 Environmental Conditions in Growth Chambers
Environmental parameters were successfully maintained near target values throughout the 3-week cultivation period (Fig. 2a–d). Average measured chamber pressures were 100.2 kPa, 67.9 kPa, and 36.1 kPa (targets: 101, 66, 33 kPa), with deviations of ±1–3 kPa attributed to daily ventilation for CO2 injection (Fig. 2b). CO2 concentration followed the programmed schedule, increasing from 1000 to 3000 ppm at 5-day intervals (Fig. 2a). Temperature remained stable across treatments, averaging 22.4°C (101 kPa), 22.5°C (66 kPa), and 22.3°C (33 kPa), with no significant differences among pressure levels (Fig. 2c). Average relative humidity was 71.0%, 68.8%, and 74.1% for the three treatments, respectively, maintained within acceptable ranges through desiccant management (Fig. 2d). These stable environmental conditions allowed isolation of pressure effects on plant responses.
Growth parameters of red leaf lettuce cultivated for three weeks in a sealed low-pressure chamber under three pressure conditions: 101, 66, and 33 kPa (Fig. 1a–c). Leaf length decreased significantly with decreasing pressure, showing a 21.92% reduction at 33 kPa compared with atmospheric pressure (Fig. 3a). In contrast, leaf width and leaf number showed no significant differences despite the reduction in leaf length (Fig. 3b,c). Leaf area gradually decreased as leaf length declined (Fig. 3d). Root diameter tended to increase under low-pressure conditions (Fig. 3e). Fresh weight decreased with reduced atmospheric pressure, whereas dry weight showed an increasing trend (Fig. 3f,g). Notably, under 33 kPa, the dry matter ratio averaged 7.86%, which was approximately 23.8% higher than that under atmospheric pressure (6.34%) (Fig. 3h,i).
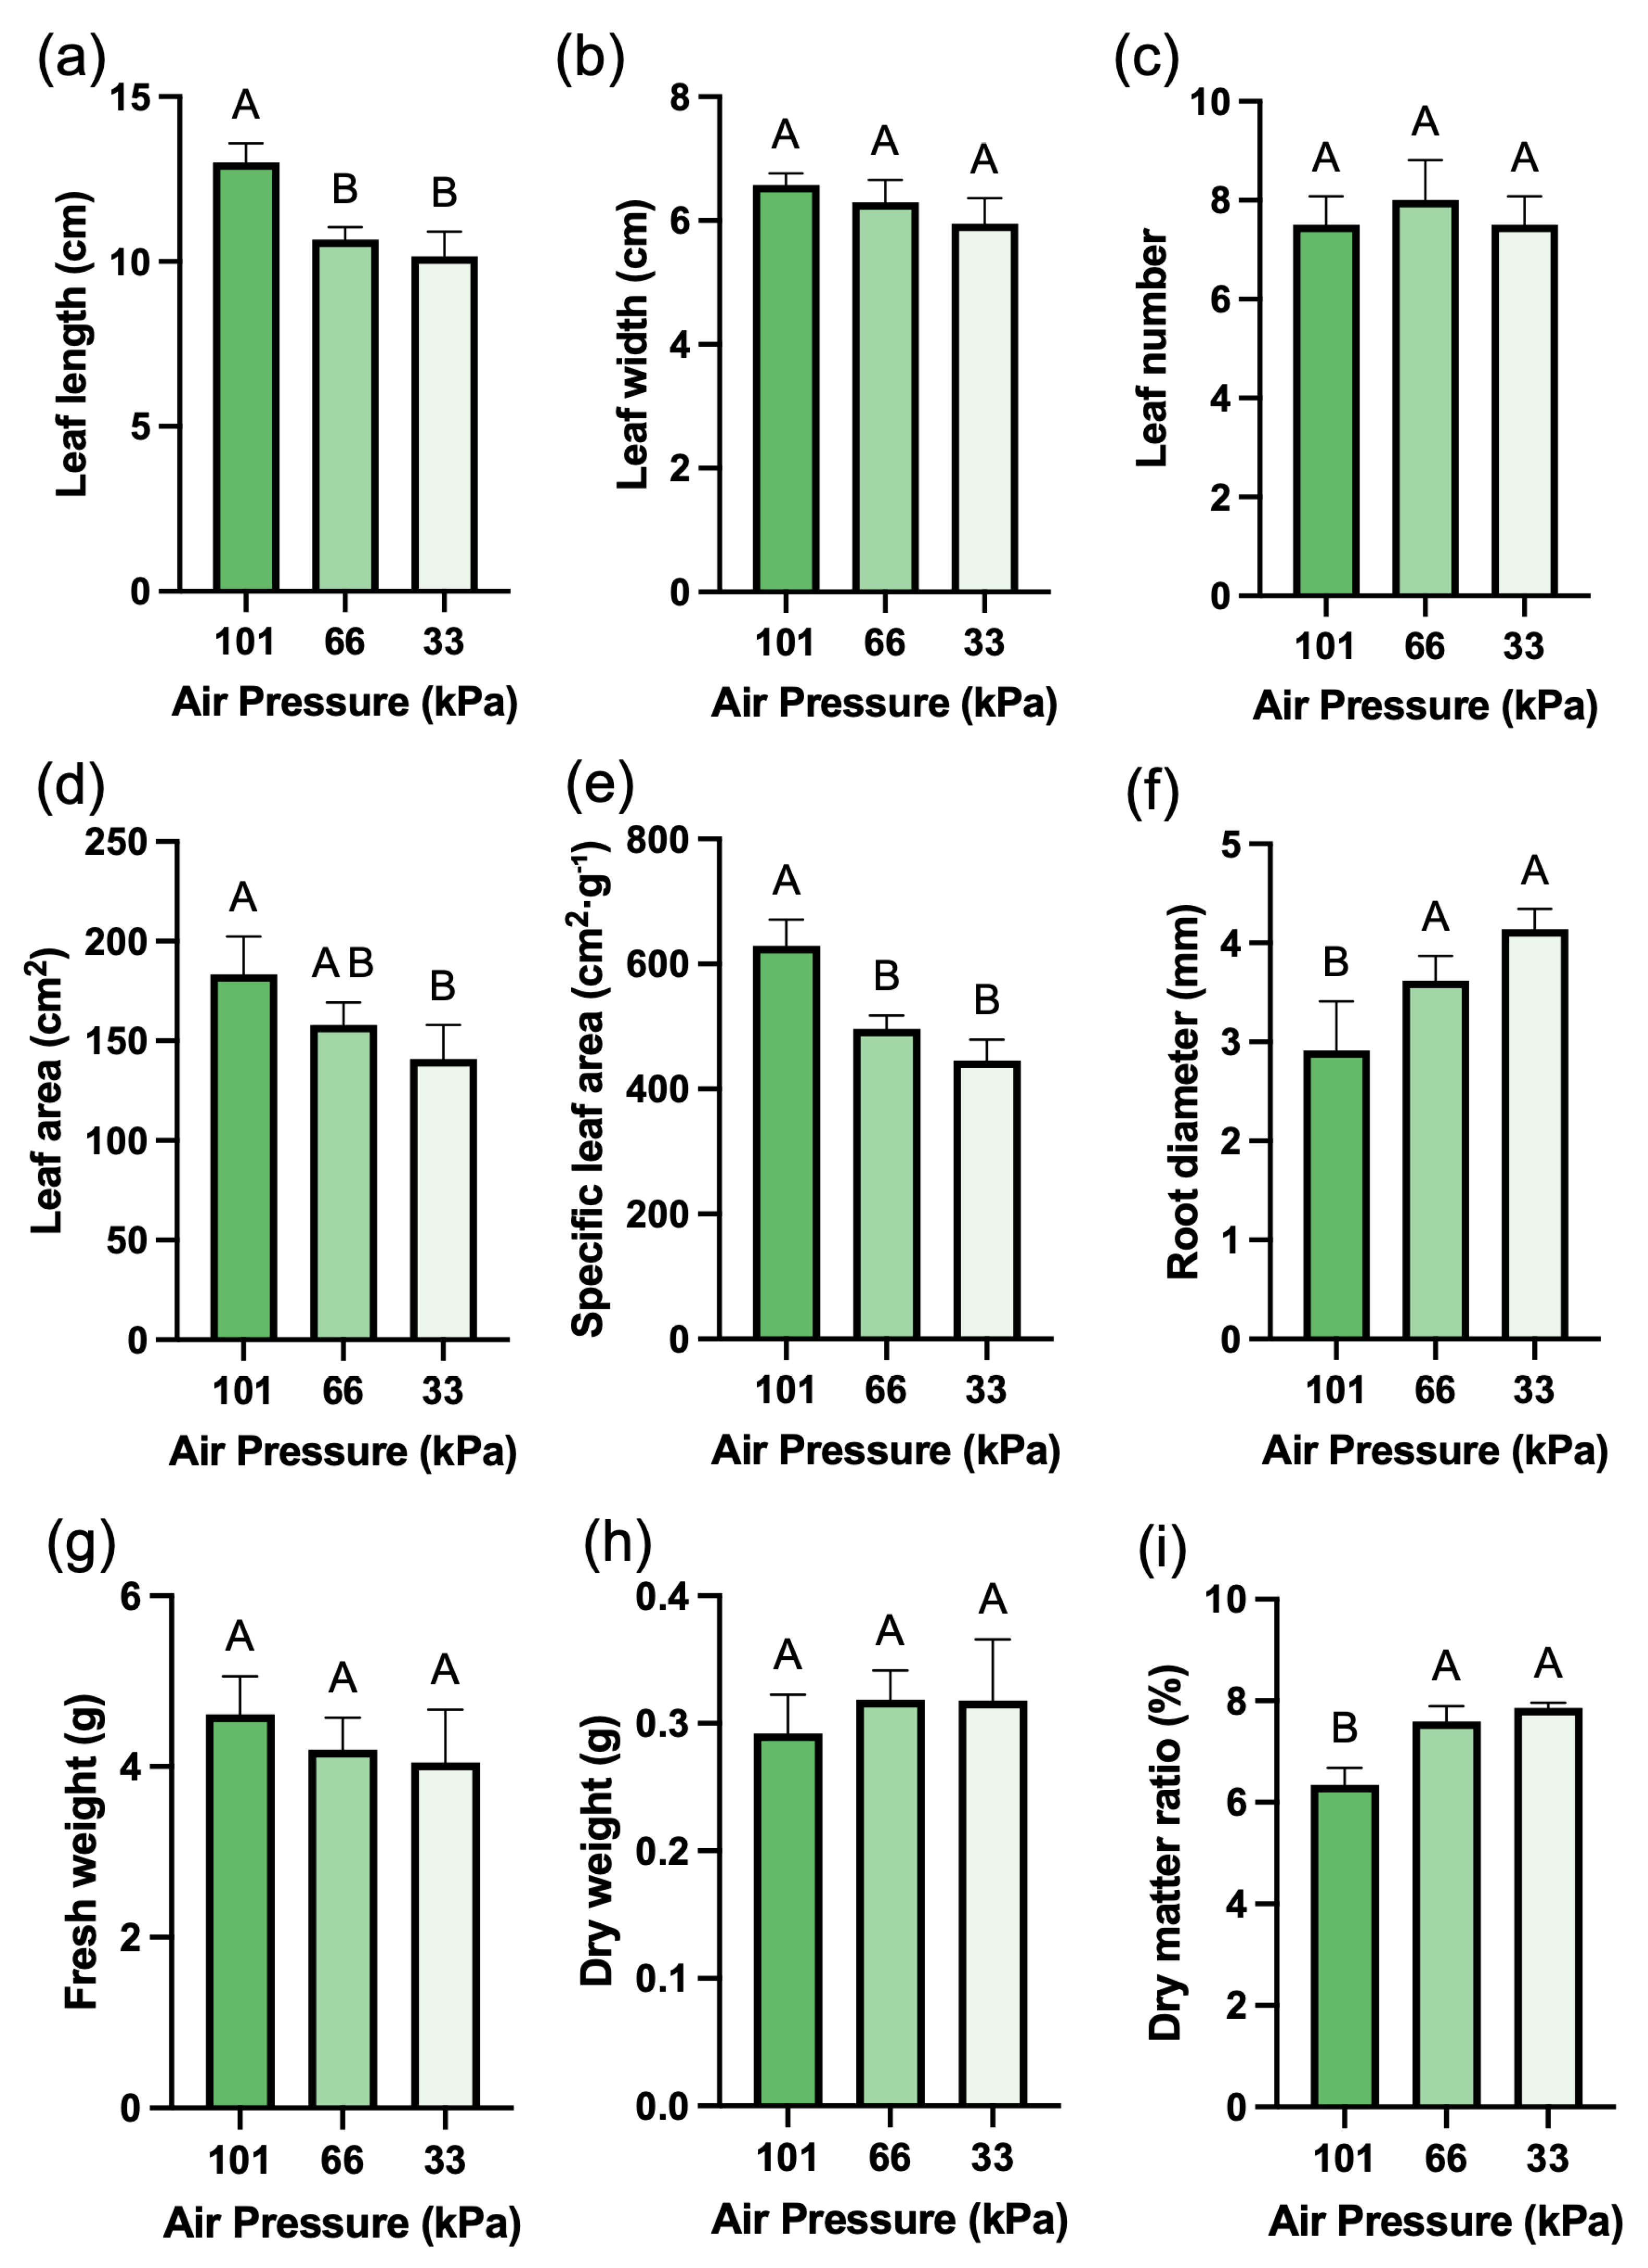
Figure 3: Growth parameters of red leaf lettuce grown under different pressure conditions for 3 weeks. (a). Leaf length. (b). Leaf width. (c). Leaf number. (d). Leaf area. (e). Specific leaf area. (f). Root diameter. (g). Fresh weight. (h). Dry weight. (i). Dry matter ratio. Values represent mean ± SD (n = 4). Different letters indicate significant differences among treatments (Tukey’s test, p < 0.05).
3.3 Chlorophyll and Secondary Metabolite Contents
While the content of chlorophyll a showed no significant difference under low pressure conditions, the content of chlorophyll b significantly increased by 24.6% at low pressure of 33 kPa (Fig. 4a,b). For total carotenoid contents, there was a slight decrease at low pressure of 66 kPa, and the content rebounded and increased at low pressure of 33 kPa (Fig. 4c). The chlorophyll a/b ratio showed a gradual decreasing trend under low pressure conditions (Fig. 4d). SPAD values gradually increased under low pressure, showing the same trend as chlorophyll b (Fig. 4e). However, when SPAD values normalized using SLA to account for leaf thickness, no significant differences were observed among treatments (Fig. 4f). TAC was the secondary metabolite that increased most significantly under low pressure conditions, showing a 41.3% increase at 66 kPa and a 190.8% increase at 33 kPa compared to atmospheric pressure (Fig. 5a). TPC and TFC also increased significantly as pressure decreased (Fig. 5b,c). TPC increased by 18.3% at 66 kPa and 53.8% at 33 kPa, while TFC increased by 5.3% at 66 kPa and 22.3% at 33 kPa.
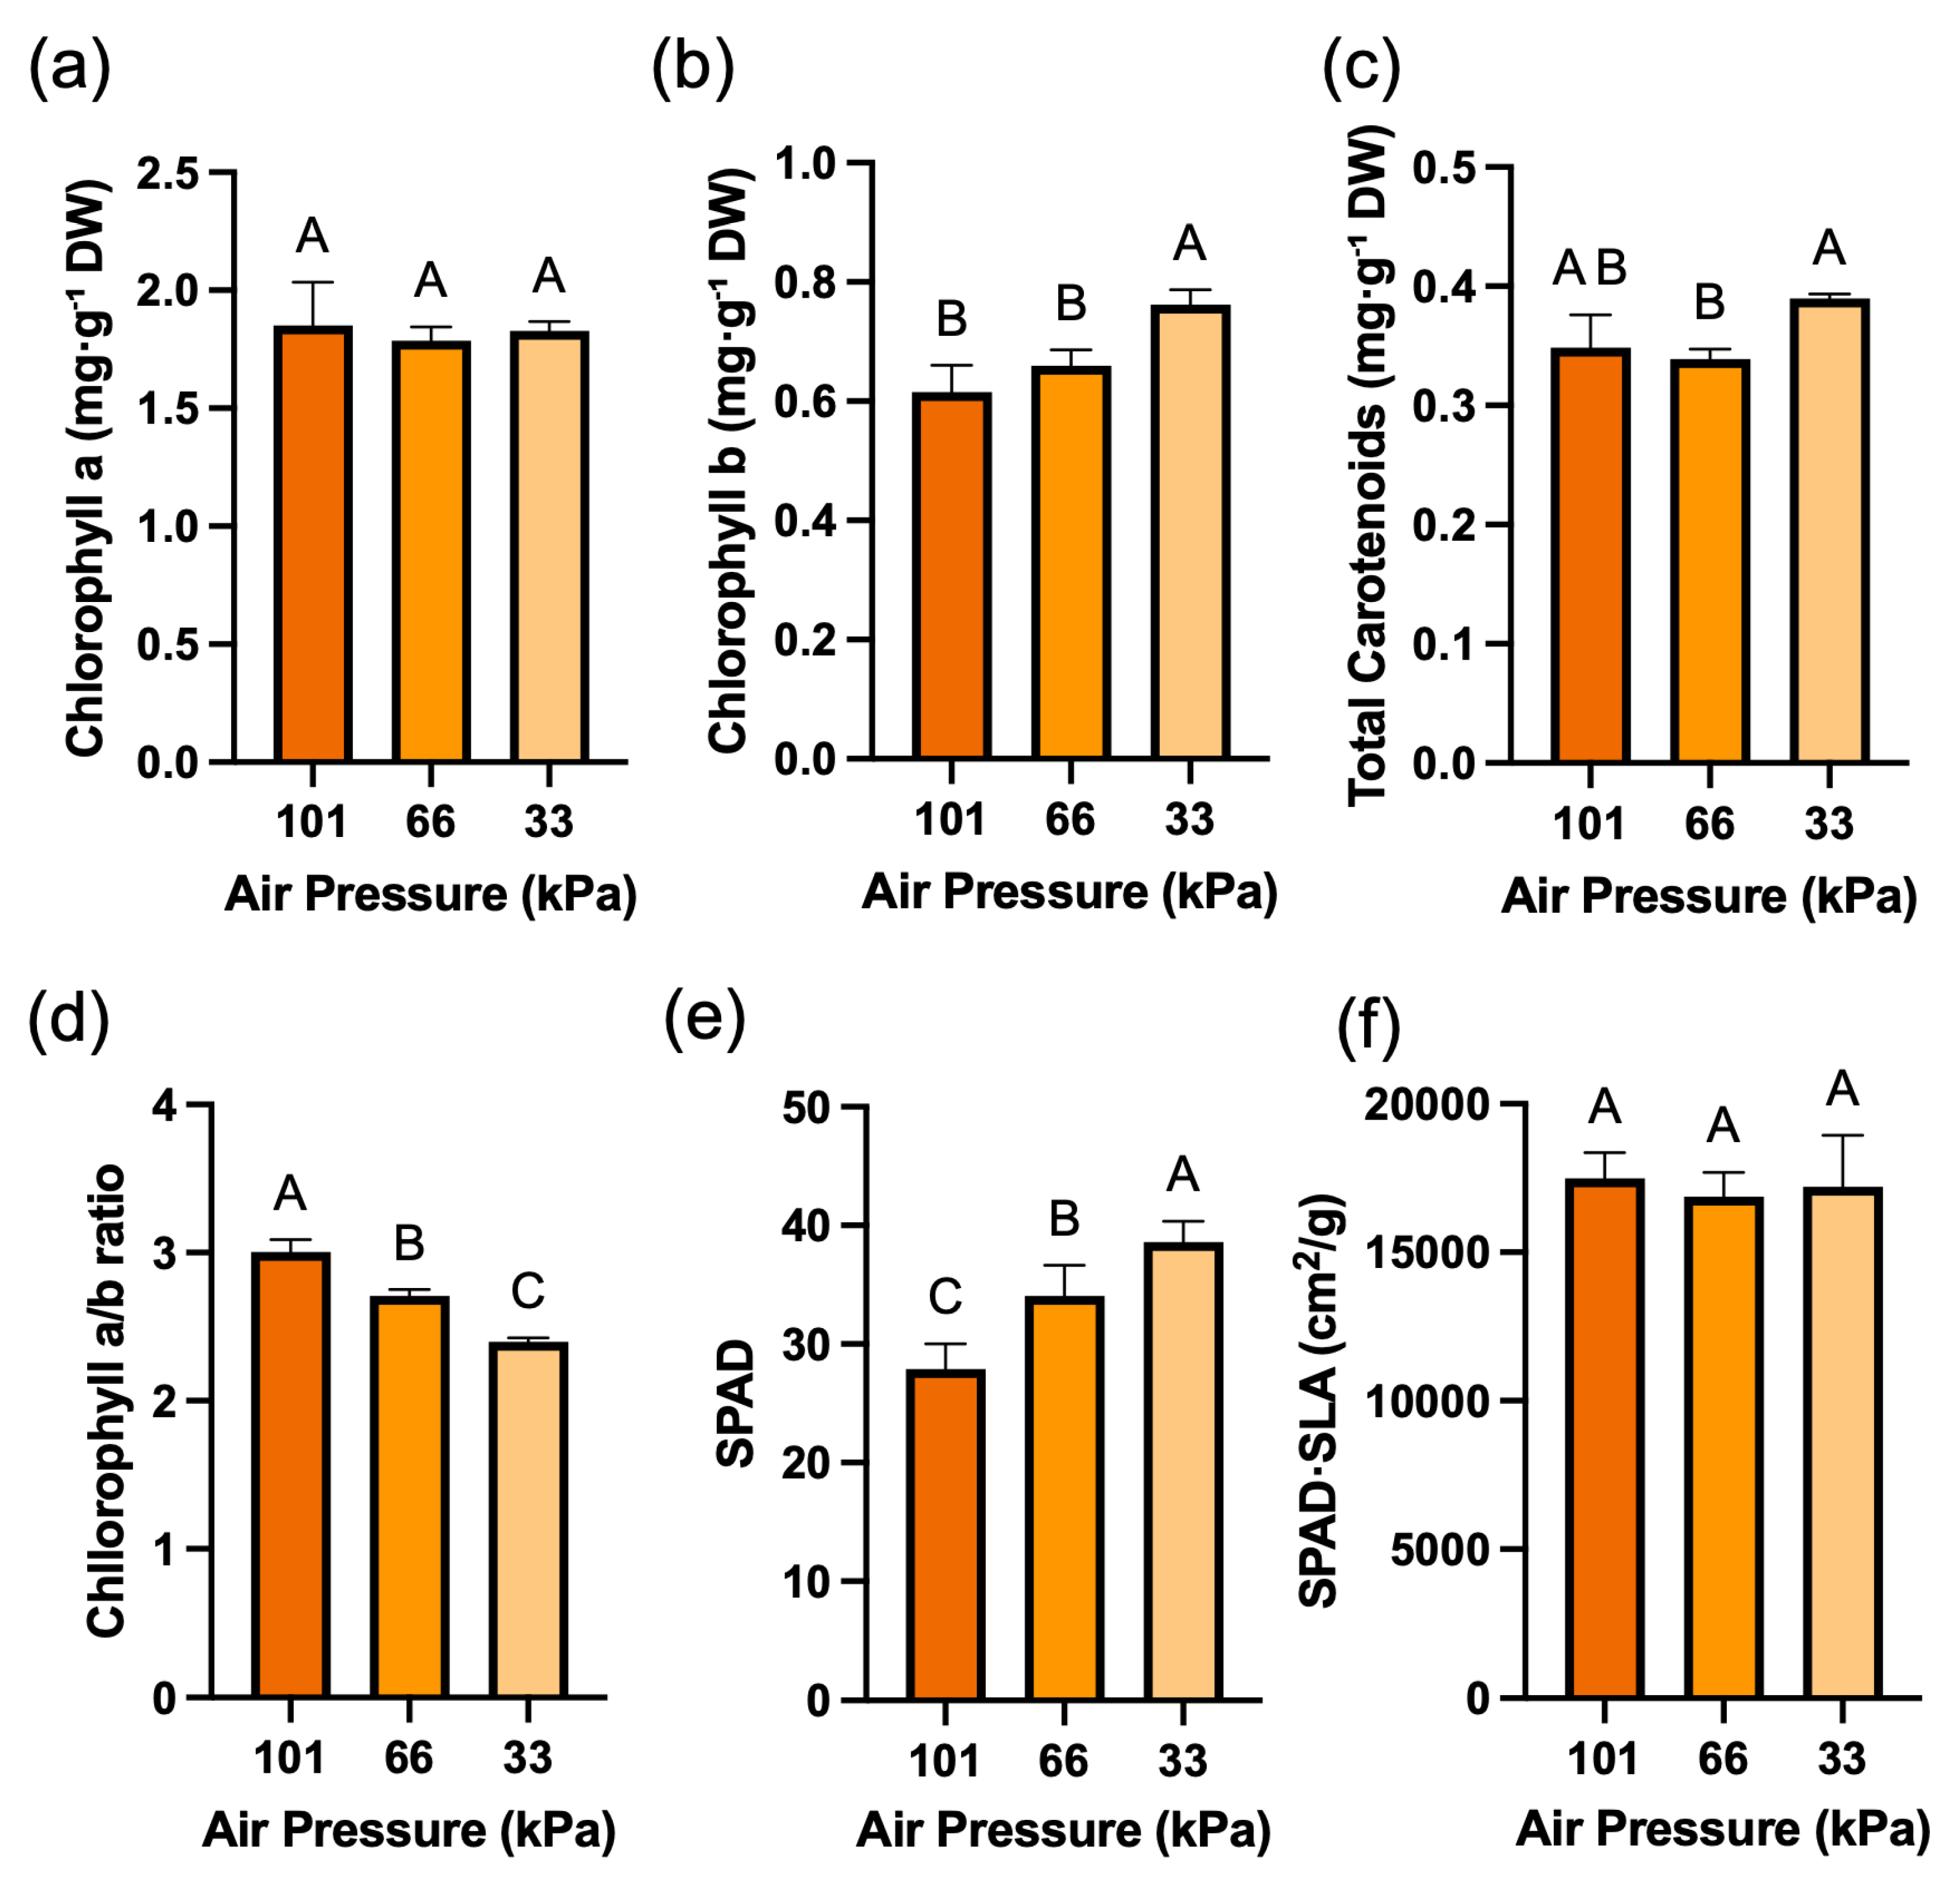
Figure 4: Chlorophyll-related parameters of red leaf lettuce grown under different pressure conditions for 3 weeks. (a). Chlorophyll a (mg·g−1 DW). (b). Chlorophyll b (mg·g−1 DW). (c). Carotenoid content (mg·g−1 DW). (d). Chlorophyll a/b ratio. (e). SPAD value. (f). SPAD value normalized by SLA. Values represent mean ± SD (n = 4). Different letters indicate significant differences among treatments (Tukey’s test, p < 0.05).
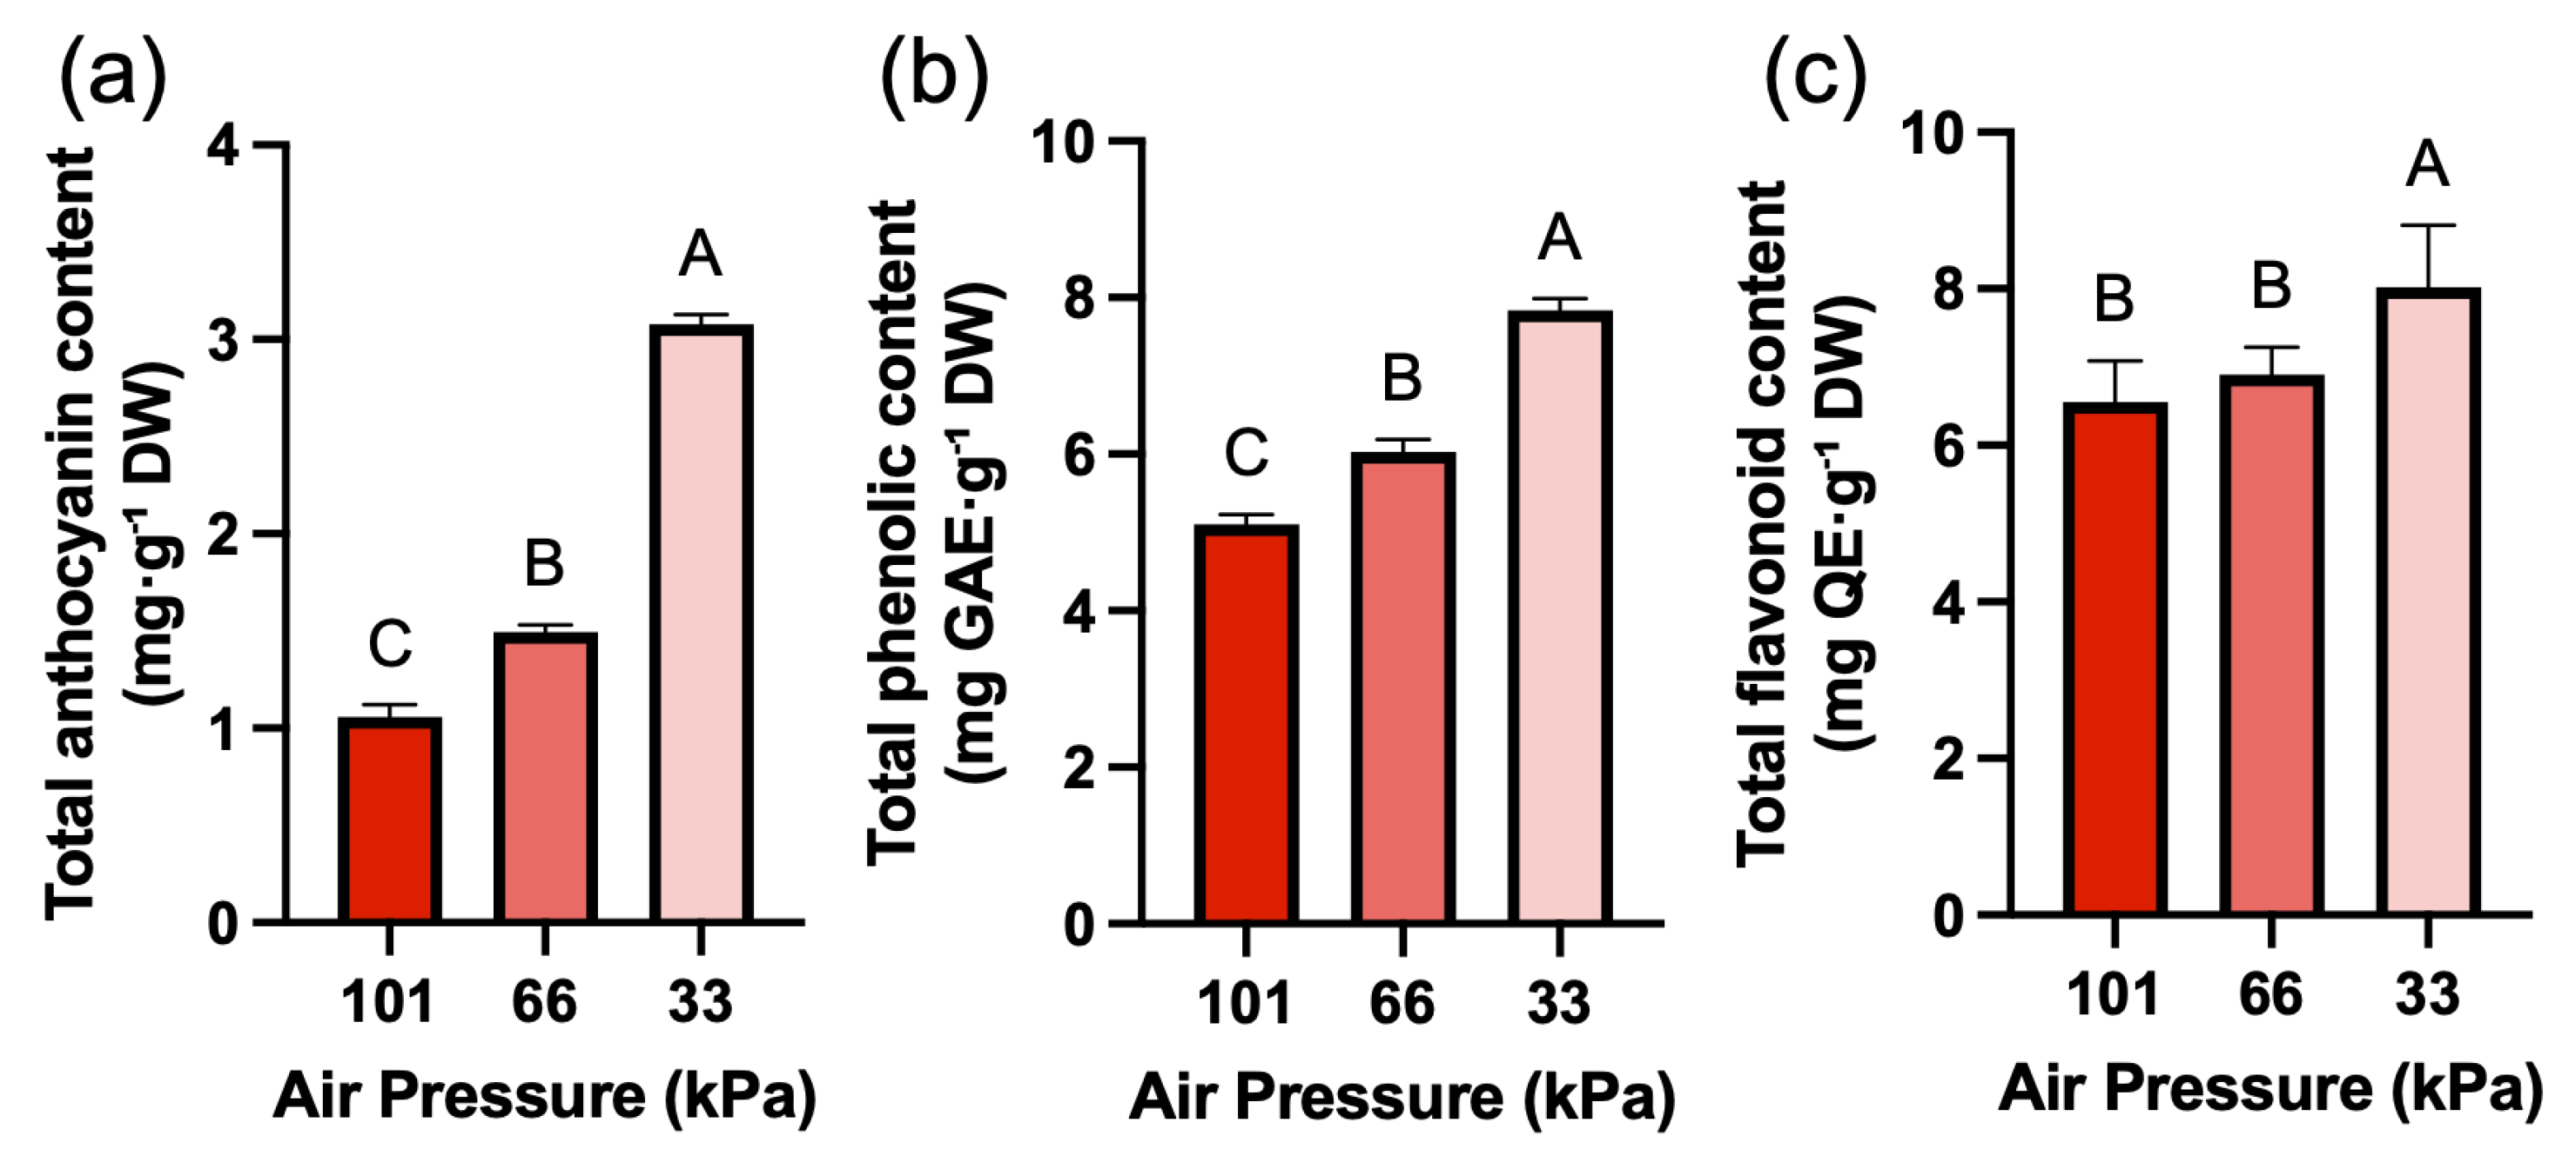
Figure 5: Secondary metabolite contents of red leaf lettuce grown under different pressure conditions for 3 weeks. (a). Total anthocyanin content (mg·g−1 DW). (b). Total phenolic content (mg GAE g−1 DW). (c). Total flavonoid content (mg QE g−1 DW). Values represent mean ± SD (n = 4). Different letters indicate significant differences among treatments (Tukey’s test, p < 0.05).
Results from scanning electron microscopy (SEM) observation of stomatal structure and density showed that clear morphological changes in stomata occurred with decreasing air pressure. In particular, the frequency of malformed stomata that were wrinkled or asymmetrical showed a significant increase of nearly 3 times at 33 kPa (Fig. 6a,e). Additionally, stomatal density measurements showed that the number of stomata per unit area significantly decreased significantly by 15.8% at low pressure of 33 kPa compared to atmospheric pressure (Fig. 6b,c). The size of stomata was significantly reduced under low pressure conditions of 66 kPa (Fig. 6d).
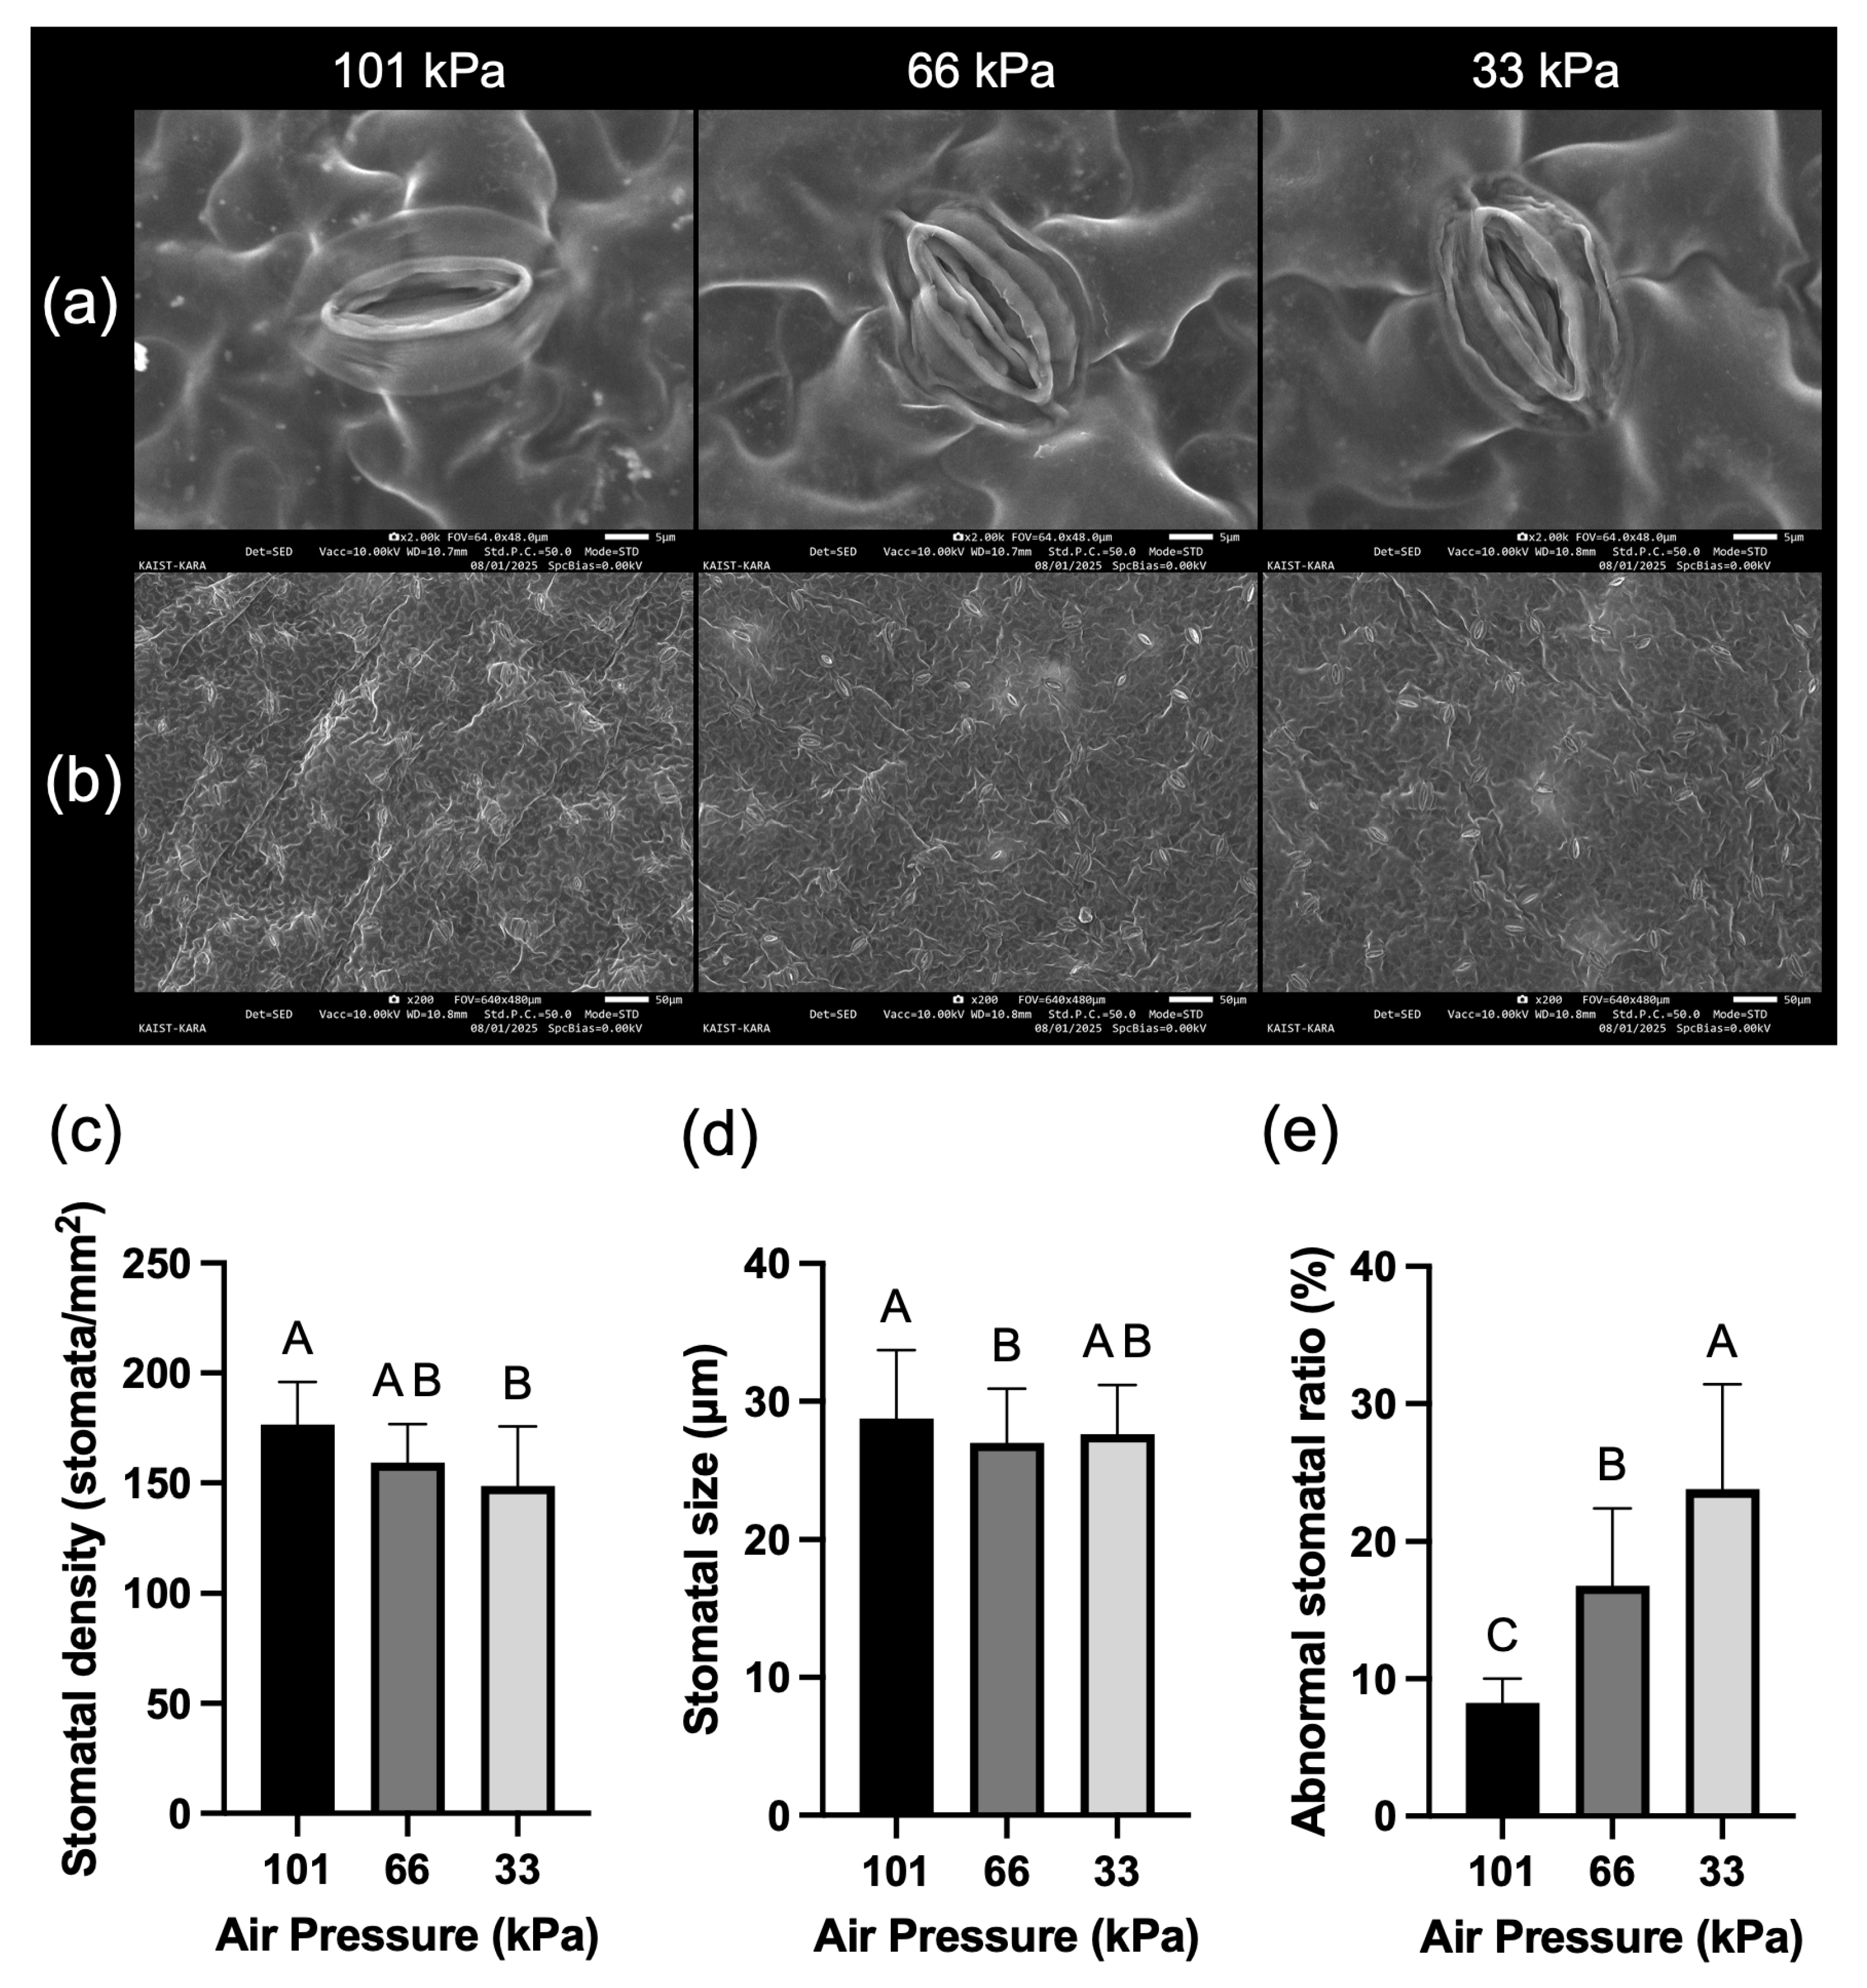
Figure 6: SEM images of stomata and their characteristic analysis results. (a). Representative stomatal images for each treatment. (b). Stomatal distribution for each treatment. (c). Stomatal density per unit area (1 mm2). (d). Stomatal size. (e). Percentage of abnormal stomata. Values represent mean ± SD (n = 10). Different letters indicate significant differences among treatments (Tukey’s test, p < 0.05).
3.5 Photosynthetic Gas Exchange
Net photosynthetic rate (A) showed no significant difference under low pressure conditions (Fig. 7a). In contrast, transpiration rate (E) decreased by 42.3% and 34.6% at low pressures of 66 and 33 kPa, respectively, compared to atmospheric pressure (101 kPa) (Fig. 7b). Stomatal conductance (gsw) also decreased by 53.1% and 46.2% at low pressures of 66 and 33 kPa, respectively, compared to atmospheric pressure (Fig. 7c). The intercellular CO2 concentration (Ci) was significantly reduced at both low pressure levels (Fig. 7d). Results of calculating water use efficiency (WUE) from net photosynthetic rate (A) and transpiration rate (E) showed that water use efficiency increased by 82% and 55.6% at low pressure compared to atmospheric pressure (Fig. 7e).
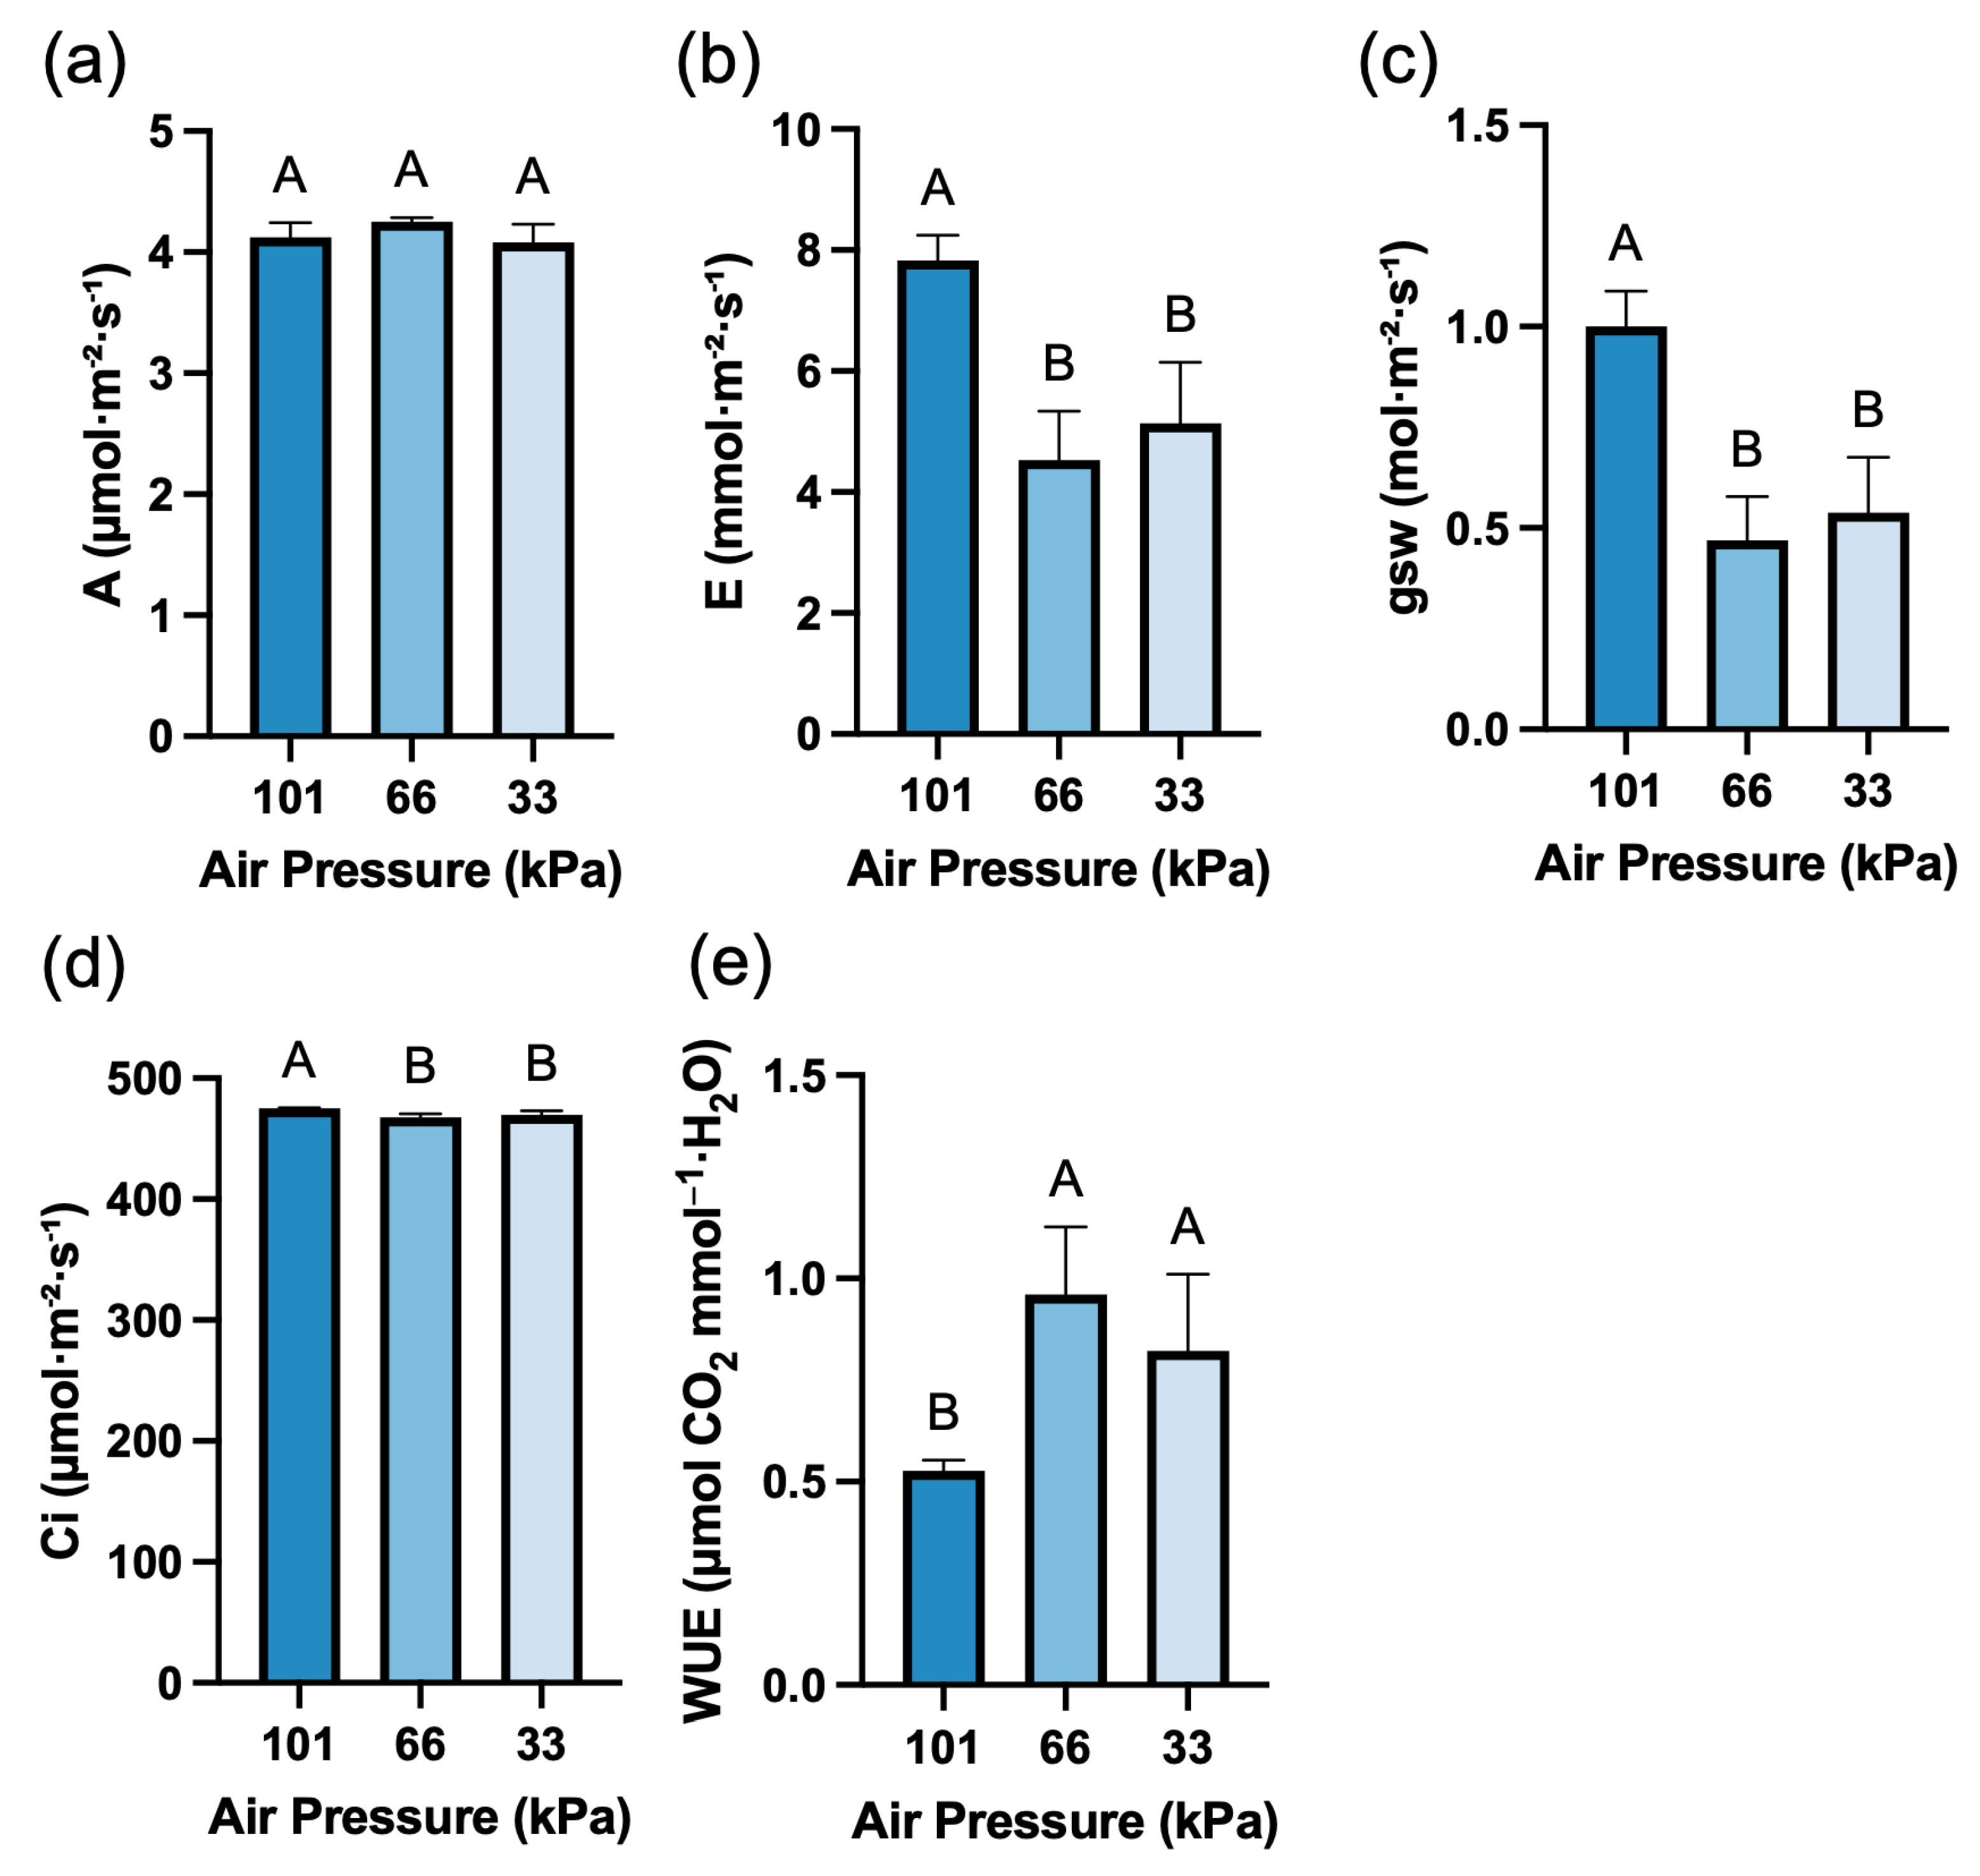
Figure 7: Photosynthesis-related parameters. (a). Net photosynthetic rate (A). (b). Transpiration rate (E). (c). Intercellular CO2 concentration (Ci). (d). Stomatal conductance (gsw). (e). Water use efficiency (WUE). Values represent mean ± SD (n = 4). Different letters indicate significant differences among treatments (Tukey’s test, p < 0.05).
In this study, lettuce was cultivated under three pressure conditions (101, 66, and 33 kPa) using sealed low-pressure chambers, and growth and physiological responses were compared. In terms of growth, unlike the study by [14], where biomass increased under low-pressure conditions, this study showed an overall decrease in growth, consistent with the results of [10]. The low-pressure environment reduced leaf length, leaf area, and cellular water content in lettuce (Fig. 3), which is attributed to decreased cell turgor pressure resulting from reduced water content [28,29]. In contrast, root diameter showed an increasing trend under low-pressure conditions (Fig. 3f), which can be interpreted as a morphological adaptation strategy to enhance the stability and efficiency of water and nutrient uptake under stress conditions [30]. Moreover, reduced oxygen partial pressure under low-pressure may have triggered adaptive responses similar to those observed under hypoxic conditions, including altered carbohydrate redistribution and structural modifications to enhance oxygen uptake efficiency [31,32]. Generally, the root-to-shoot (R:S) ratio tends to increase under abiotic stress conditions such as water and salt stress [33,34], and prolonged low-pressure exposure has been reported to reduce leaf growth and increase carbohydrate accumulation due to low oxygen availability [35], supporting the growth reduction trend observed in this study. The combination of water stress and hypoxic responses may explain the contrasting growth patterns between shoot (reduced) and root (increased diameter) tissues, as plants prioritize resource allocation to maintain root function under low oxygen conditions [31].
Under low-pressure conditions, lettuce transpiration rate (E) and stomatal conductance (gsw) decreased significantly to approximately 34–53% of atmospheric pressure levels (Fig. 7b,c), which showed a consistent trend with the reduction in stomatal size and density observed through SEM analysis (Fig. 6c,d). The pattern of higher relative humidity in low-pressure chambers during the initial two weeks, followed by a reversal in late growth stages (Fig. 2d), along with decreased biomass and water content (Fig. 1b and Fig. 3h), can be interpreted as a compensatory response to reduce stomatal aperture against transpiration promotion and accumulated water stress caused by low-pressure conditions. Indeed, the activation of stomatal-related genes to suppress water loss under low-pressure environments has been reported [13,36], and the important influence of stomatal morphology on transpiration regulation and water use efficiency has been well established in several studies [37,38,39]. However, a case where stomatal conductance actually increased under short-term low-pressure treatment in Trifolium pratense [30], suggests that responses may vary depending on species, treatment intensity, and treatment duration.
According to the study by [10], as air density decreases under low-pressure conditions, boundary layer resistance decreases, which may increase CO2 diffusion rate and water vapor evapotranspiration. Similarly in this study, transpiration was higher under low-pressure conditions for more than two weeks (Fig. 2d), but the transpiration rate at the measurement point after three weeks was significantly reduced (Fig. 7b). This is considered to be the result of plants gradually regulating stomata to prevent water loss due to high transpiration under low-pressure conditions (Fig. 6a–e). Despite reduced transpiration rate, net photosynthetic rate was maintained due to sufficient CO2 supply through enhanced gas diffusion (Fig. 7a–c). This suggests that water use efficiency (WUE) was improved as calculated (Fig. 7e), since plants used less water for the same level of carbon assimilation. The intercellular CO2 concentration (Ci) was significantly but only slightly reduced at both low-pressure levels compared to atmospheric pressure (Fig. 7d), suggesting that enhanced gas diffusion under low-pressure conditions partially compensated for the reduced stomatal conductance, allowing sufficient CO2 availability for photosynthesis [10]. However, in this study, photosynthetic parameters of lettuce cultivated under low-pressure were measured using the LI-6800, but technical limitations of the measurements must be acknowledged. Stomatal conductance, transpiration rate, and CO2 diffusion are known to respond to atmospheric pressure changes within seconds [40], and in our study, measurements were conducted under atmospheric pressure after removing plants from the low-pressure chambers. Although measurements were completed within 20 min, the measured values reflect the physiological responses of low-pressure-acclimated plants operating under atmospheric pressure conditions. Therefore, the reported values should be interpreted as indicators of low-pressure acclimation effects, with limitations in providing absolute assessments of real-time photosynthetic activity under low-pressure conditions. Future research should establish systems capable of measuring gas exchange directly within low-pressure chambers.
The increased chlorophyll b and carotenoid content under low-pressure conditions (Fig. 4b,c) is consistent with previous studies [41] reporting that low-pressure conditions promote chlorophyll biosynthesis. While chlorophyll a is the primary photochemical pigment in photosystem reaction centers that is strictly regulated, chlorophyll b functions as an accessory pigment located in light-harvesting complexes (LHC) that flexibly regulates light-harvesting efficiency [42,43]. The decreased a/b ratio under low-pressure conditions (Fig. 4d) is a typical characteristic of low-light adapted plants, suggesting that the low-pressure environment was recognized as a photosynthetic constraint. This can be interpreted as an adaptive strategy consistent with reports [44] that environmental stress increases chlorophyll b biosynthesis and improves light capture efficiency through LHCII expansion to maintain photosynthesis even under reduced stomatal conductance conditions.
Low-pressure conditions also significantly increased the content of secondary metabolites such as phenolics, flavonoids, and anthocyanins, consistent with the results of [10,45]. Although ROS levels were not directly measured in this study, plants generally activate antioxidant defense mechanisms in response to physical stresses such as low-pressure, drought, and ultraviolet radiation, which trigger oxidative stress and upregulate secondary metabolite biosynthesis [11,46,47]. Therefore, water stress, changes in boundary layer resistance, and fluctuations in gas exchange patterns caused by low-pressure conditions can be interpreted as likely acting as physical stresses that induce reactive oxygen species (ROS) accumulation in plants. ROS act as signaling molecules to activate the phenylpropanoid pathway, thereby increasing the synthesis of anthocyanins, flavonoids, and phenolic compounds [13,48]. Anthocyanins are powerful antioxidants that protect cell membranes and photosystems from oxidative damage, while phenolic compounds and flavonoids contribute to maintaining cellular homeostasis through ROS scavenging and metal chelation [49]. The pressure-dependent secondary metabolite accumulation pattern observed in this study suggests that oxidative stress increased proportionally to low-pressure intensity, and the antioxidant defense system was strengthened in response. These results support low-pressure cultivation as a promising technology for producing high-value functional vegetables, particularly in closed plant factories where environmental control enables customized production strategies.
This study provides fundamental insights into physiological adaptation under low-pressure environments and practical implications for crop selection and management in resource-limited systems such as space agriculture, high-altitude areas, and terrestrial closed plant factories. Although low-pressure conditions may negatively affect plant growth depending on variety and treatment intensity, they promoted water use efficiency and functional compound accumulation. Future research should focus on optimizing pressure ranges, treatment duration, and growth stage-specific effects across different crop species and varieties, while investigating interactions with other environmental factors (light, temperature, humidity, nutrition). To elucidate the mechanisms underlying anthocyanin accumulation under low-pressure conditions, subsequent studies should measure ROS levels, examine related gene expression changes, and investigate signaling pathways responding to reduced oxygen partial pressure. Furthermore, quantitative analysis of time-course photosynthetic parameters and water diffusion rates is required to clarify how stomatal characteristics and water use alterations are linked to growth and metabolite accumulation. Additionally, breeding low-pressure-tolerant varieties and validating long-term system practicality remain critical priorities.
Acknowledgement:
Funding Statement: This research was supported by the National Research Foundation (NRF) funded by the Korean government (MSIT) (No. RS-2024-00459463).
Author Contributions: Study conception and design: Wonkyu Yi and Jongseok Park; data collection: Wonkyu Yi; analysis and interpretation of results: Wonkyu Yi and Jongseok Park; draft manuscript preparation: Wonkyu Yi and Jongseok Park. All authors reviewed and approved the final version of the manuscript.
Availability of Data and Materials: The authors confirm that the data supporting the findings of this study are available within the article.
Ethics Approval: Not applicable.
Conflicts of Interest: The authors declare no conflicts of interest.
Abbreviations
| NASA | national aeronautics and space administration |
| ISS | international space station |
| CELSS | controlled ecological life support system |
| CRL | crop readiness level |
| SEM | scanning electron microscopy |
| TAC | total anthocyanin contents |
| TPC | total phenolic contents |
| TFC | total flavonoid contents |
References
1. MacElroy RD , Smernoff DT , Klein HP . Controlled ecological life support system. Life support systems in space travel. In: Proceedings of the COSPAR Meeting; 1984 Jun 25–Jul 7; Graz, Austria. [Google Scholar]
2. Averner MM . The NASA CELSS program. In: Biological life support technologies: commercial opportunities. Washington, DC, USA: NASA; 1990. [Google Scholar]
3. Santomartino R , Averesch NJH , Bhuiyan M , Cockell CS , Colangelo J , Gumulya Y , et al. Toward sustainable space exploration: a roadmap for harnessing the power of microorganisms. Nat Commun. 2023; 14: 1391. doi:10.1038/s41467-023-37070-2. [Google Scholar] [CrossRef]
4. Bryant Z , Choate A , Howard D . Environmental control and life support (ECLS) system options for Mars transit and Mars surface missions. In: Proceedings of the 2023 International Conference on Environmental Systems; 2023 Jul 16–20; Calgary, AB, Canada. [Google Scholar]
5. Ortega-Hernandez JM , Qiu D , Pla-García J , Zhang Y , Martinez-Frias J , Long X , et al. Key factors in developing controlled closed ecosystems for lunar missions. Resour Environ Sustain. 2024; 16: 100160. doi:10.1016/j.resenv.2024.100160. [Google Scholar] [CrossRef]
6. Wheeler RM . Plants for human life support in space: from Myers to Mars. Gravitational Space Biol. 2010; 23( 2): 25– 36. [Google Scholar]
7. Drysdale AE . Life support trade studies involving plants. Warrendale, PA, USA: SAE; 2001. Report No.: 2001-01-2362. doi:10.4271/2001-01-2362. [Google Scholar] [CrossRef]
8. Jia L , Tang Y , Tian K , Ai W , Shang W , Wu H . Effects of hypobaria, hyperoxia, and nitrogen form on the growth and nutritional quality of lettuce. Life Sci Space Res. 2024; 40: 44– 50. doi:10.1016/j.lssr.2023.12.001. [Google Scholar] [CrossRef]
9. Nangalia V , Habershon J . System benefit of a hypobaric hypoxic spacecraft environment. Warrendale, PA, USA: SAE; 2004. Report No.: 2004-01-2483. doi:10.4271/2004-01-2483. [Google Scholar] [CrossRef]
10. Stutte GW , Yorio NC , Edney SL , Richards JT , Hummerick MP , Stasiak M , et al. Effect of reduced atmospheric pressure on growth and quality of two lettuce cultivars. Life Sci Space Res. 2022; 34: 37– 44. doi:10.1016/j.lssr.2022.06.001. [Google Scholar] [CrossRef]
11. He C , Jacobo-Velázquez DA , Cisneros-Zevallos L , Davies FT . Hypobaria and hypoxia affects phytochemical production, gas exchange, and growth of lettuce. Photosynthetica. 2013; 51( 3): 465– 73. doi:10.1007/s11099-013-0047-9. [Google Scholar] [CrossRef]
12. Tang Y , Gao F , Guo S , Li F . The morphology, physiology and nutritional quality of lettuce grown under hypobaria and hypoxia. Acta Astronaut. 2015; 112: 29– 36. doi:10.1016/j.actaastro.2015.03.005. [Google Scholar] [CrossRef]
13. Paul AL , Zhou M , Callaham JB , Reyes M , Stasiak M , Riva A , et al. Patterns of Arabidopsis gene expression in the face of hypobaric stress. AoB Plants. 2017; 9( 4): plx030. doi:10.1093/aobpla/plx030. [Google Scholar] [CrossRef]
14. He C , Davies FT Jr , Lacey RE , Drew MC , Brown DL . Effect of hypobaric conditions on ethylene evolution and growth of lettuce and wheat. J Plant Physiol. 2003; 160( 11): 1341– 50. doi:10.1078/0176-1617-01106. [Google Scholar] [CrossRef]
15. Cooper M , Perchonok M , Douglas GL . Initial assessment of the nutritional quality of the space food system over three years of ambient storage. npj Microgravity. 2017; 3: 17. doi:10.1038/s41526-017-0022-z. [Google Scholar] [CrossRef]
16. Tang H , Rising HH , Majji M , Brown RD . Long-term space nutrition: a scoping review. Nutrients. 2021; 14( 1): 194. doi:10.3390/nu14010194. [Google Scholar] [CrossRef]
17. Salisbury FB , Clark MA . Suggestions for crops grown in controlled ecological life-support systems, based on attractive vegetarian diets. Adv Space Res. 1996; 18( 4–5): 33– 9. doi:10.1016/0273-1177(95)00859-D. [Google Scholar] [CrossRef]
18. Khodadad CLM , Hummerick ME , Spencer LE , Dixit AR , Richards JT , Romeyn MW , et al. Microbiological and nutritional analysis of lettuce crops grown on the international space station. Front Plant Sci. 2020; 11: 199. doi:10.3389/fpls.2020.00199. [Google Scholar] [CrossRef]
19. Burgess AJ , Pranggono R , Escribà-Gelonch M , Hessel V . Biofortification for space farming: maximising nutrients using lettuce as a model plant. Future Foods. 2024; 9: 100317. doi:10.1016/j.fufo.2024.100317. [Google Scholar] [CrossRef]
20. Dueck T , Kempkes F , Cecilia S . Choosing crops for cultivation in space. In: Proceedings of the 46th International Conference on Environmental Systems; 2016 Jul 10–14; Vienna, Austria. [Google Scholar]
21. Romeyn M , Spencer L , Massa G , Wheeler R . Crop readiness level (CRL): a scale to track progression of crop testing for space. In: Proceedings of the 49th International Conference on Environmental Systems; 2019 Jul 7–11; Boston, MA, USA. [Google Scholar]
22. Assefa AD , Hur OS , Hahn BS , Kim B , Ro NY , Rhee JH , et al. Nutritional metabolites of red pigmented lettuce (Lactuca sativa) germplasm and correlations with selected phenotypic characters. Foods. 2021; 10( 10): 2504. doi:10.3390/foods10102504. [Google Scholar] [CrossRef]
23. Anum H , Li K , Tabusam J , Saleh SAA , Cheng RF , Tong YX . Regulation of anthocyanin synthesis in red lettuce in plant factory conditions: a review. Food Chem. 2024; 458: 140111. doi:10.1016/j.foodchem.2024.140111. [Google Scholar] [CrossRef]
24. Lichtenthaler HK , Buschmann C . Chlorophylls and carotenoids: measurement and characterization by UV-VIS spectroscopy. Curr Protoc Food Anal Chem. 2001; 1( 1): F4.3.1– 8. doi:10.1002/0471142913.faf0403s01. [Google Scholar] [CrossRef]
25. Yang YC , Sun DW , Pu H , Wang NN , Zhu Z . Rapid detection of anthocyanin content in lychee pericarp during storage using hyperspectral imaging coupled with model fusion. Postharvest Biol Technol. 2015; 103: 55– 65. doi:10.1016/j.postharvbio.2015.02.008. [Google Scholar] [CrossRef]
26. Severo J , Tiecher A , Chaves FC , Silva JA , Rombaldi CV . Gene transcript accumulation associated with physiological and chemical changes during developmental stages of strawberry cv. Camarosa. Food Chem. 2011; 126( 3): 995– 1000. doi:10.1016/j.foodchem.2010.11.107. [Google Scholar] [CrossRef]
27. Chang CC , Yang MH , Wen HM , Chern JC . Estimation of total flavonoid content in Propolis by two complementary colometric methods. J Food Drug Anal. 2002; 10( 3): 3. doi:10.38212/2224-6614.2748. [Google Scholar] [CrossRef]
28. Schönbeck LC , Rasmussen C , Santiago LS . Leaf turgor loss does not coincide with cell plasmolysis in drought-tolerant chaparral species. Plant Cell Environ. 2025; 48( 7): 5019– 29. doi:10.1111/pce.15505. [Google Scholar] [CrossRef]
29. Chamberlain CP , Stasiak MA , Dixon MA . Response of plant water status to reduced atmospheric pressure. Warrendale, PA, USA: SAE; 2003. Report No.: 2003-01-2677. doi:10.4271/2003-01-2677. [Google Scholar] [CrossRef]
30. Lembo S , Niedrist G , El Omari B , Illmer P , Praeg N , Meul A , et al. Short-term impact of low air pressure on plants’ functional traits. PLoS One. 2025; 20( 1): e0317590. doi:10.1371/journal.pone.0317590. [Google Scholar] [CrossRef]
31. Wang LN , Wang WC , Liao K , Xu LJ , Xie DX , Xie RH , et al. Survival mechanisms of plants under hypoxic stress: physiological acclimation and molecular regulation. J Integr Plant Biol. 2025; 67( 3): 440– 54. doi:10.1111/jipb.13880. [Google Scholar] [CrossRef]
32. Zahra N , Hafeez MB , Shaukat K , Wahid A , Hussain S , Naseer R , et al. Hypoxia and anoxia stress: plant responses and tolerance mechanisms. J Agron Crop Sci. 2021; 207( 2): 249– 84. doi:10.1111/jac.12471. [Google Scholar] [CrossRef]
33. Rasheed F , Bakhsh R , Qadir I . Trade-off between shoot and root dry weight along with a steady CO2 assimilation rate ensures the survival of Eucalyptus camaldulensis under salt stress. J For Sci. 2020; 66( 11): 452– 60. doi:10.17221/44/2020-JFS. [Google Scholar] [CrossRef]
34. Gonulal E . Effects of different water stress levels on biomass, root yield, and some physiological parameters of sorghum. J Agric Sci Technol. 2022; 24( 6): 1487– 500. doi:10.52547/jast.24.6.1487. [Google Scholar] [CrossRef]
35. Ramonell KM , Kuang A , Porterfield DM , Crispi ML , Xiao Y , McClure G , et al. Influence of atmospheric oxygen on leaf structure and starch deposition in Arabidopsis thaliana. Plant Cell Environ. 2001; 24( 4): 419– 28. doi:10.1046/j.1365-3040.2001.00691.x. [Google Scholar] [CrossRef]
36. Paul AL , Schuerger AC , Popp MP , Richards JT , Manak MS , Ferl RJ . Hypobaric biology: Arabidopsis gene expression at low atmospheric pressure. Plant Physiol. 2004; 134( 1): 215– 23. doi:10.1104/pp.103.032607. [Google Scholar] [CrossRef]
37. Haworth M , Marino G , Materassi A , Raschi A , Scutt CP , Centritto M . The functional significance of the stomatal size to density relationship: interaction with atmospheric [CO2] and role in plant physiological behaviour. Sci Total Environ. 2023; 863: 160908. doi:10.1016/j.scitotenv.2022.160908. [Google Scholar] [CrossRef]
38. Lawson T , Blatt MR . Stomatal size, speed, and responsiveness impact on photosynthesis and water use efficiency. Plant Physiol. 2014; 164( 4): 1556– 70. doi:10.1104/pp.114.237107. [Google Scholar] [CrossRef]
39. Hasanuzzaman M , Zhou M , Shabala S . How does stomatal density and residual transpiration contribute to osmotic stress tolerance? Plants. 2023; 12( 3): 494. doi:10.3390/plants12030494. [Google Scholar] [CrossRef]
40. Márquez DA , Stuart-Williams H , Wong SC , Farquhar GD . An improved system to measure leaf gas exchange on adaxial and abaxial surfaces. Bio-protocol. 2023; 13( 11): e4687. doi:10.21769/BioProtoc.4687. [Google Scholar] [CrossRef]
41. Burg SP . Postharvest physiology and hypobaric storage of fresh produce. Oxfordshire, UK: CABI Publishing; 2004. doi:10.1079/9780851998015.0000. [Google Scholar] [CrossRef]
42. Kume A , Akitsu T , Nasahara KN . Why is chlorophyll b only used in light-harvesting systems? J Plant Res. 2018; 131( 6): 961– 72. doi:10.1007/s10265-018-1052-7. [Google Scholar] [CrossRef]
43. Biswal AK , Pattanayak GK , Pandey SS , Leelavathi S , Reddy VS , Govindjee , et al. Light intensity-dependent modulation of chlorophyll b biosynthesis and photosynthesis by overexpression of chlorophyllide a oxygenase in tobacco. Plant Physiol. 2012; 159( 1): 433– 49. doi:10.1104/pp.112.195859. [Google Scholar] [CrossRef]
44. Chazaux M , Schiphorst C , Lazzari G , Caffarri S . Precise estimation of chlorophyll a, b and carotenoid content by deconvolution of the absorption spectrum and new simultaneous equations for Chl determination. Plant J. 2022; 109( 6): 1630– 48. doi:10.1111/tpj.15643. [Google Scholar] [CrossRef]
45. Rajapakse NC , He C , Cisneros-Zevallos L , Davies FT . Hypobaria and hypoxia affects growth and phytochemical contents of lettuce. Sci Hortic. 2009; 122( 2): 171– 8. doi:10.1016/j.scienta.2009.05.002. [Google Scholar] [CrossRef]
46. Jan R , Khan MA , Asaf S , Lubna , Waqas M , Park JR , et al. Drought and UV radiation stress tolerance in rice is improved by overaccumulation of non-enzymatic antioxidant flavonoids. Antioxidants. 2022; 11( 5): 917. doi:10.3390/antiox11050917. [Google Scholar] [CrossRef]
47. Mátai A , Nagy D , Hideg É . UV-B strengthens antioxidant responses to drought in Nicotiana benthamiana leaves not only as supplementary irradiation but also as pre-treatment. Plant Physiol Biochem. 2019; 134: 9– 19. doi:10.1016/j.plaphy.2018.09.014. [Google Scholar] [CrossRef]
48. Sharma A , Shahzad B , Rehman A , Bhardwaj R , Landi M , Zheng B . Response of phenylpropanoid pathway and the role of polyphenols in plants under abiotic stress. Molecules. 2019; 24( 13): 2452. doi:10.3390/molecules24132452. [Google Scholar] [CrossRef]
49. Xu Y , Fu X . Reprogramming of plant central metabolism in response to abiotic stresses: a metabolomics view. Int J Mol Sci. 2022; 23( 10): 5716. doi:10.3390/ijms23105716. [Google Scholar] [CrossRef]
Cite This Article
 Copyright © 2026 The Author(s). Published by Tech Science Press.
This work is licensed under a Creative Commons Attribution 4.0 International License , which permits unrestricted use, distribution, and reproduction in any medium, provided the original work is properly cited.
 Downloads
 Citation Tools